Article

Meridiani Planum Mineralogy Along Part of the Opportunity Rover Track Based on the Mini-TES Spectrum

by
Zalewska Natalia
* and
Leszek Czechowski
Space Research Center PAS, ul. Bartycka 18 A, 00-716 Warszawa, Poland
*
Author to whom correspondence should be addressed.
Remote Sens. 2025, 17(12), 1981; https://doi.org/10.3390/rs17121981
Submission received: 30 January 2025 / Revised: 29 April 2025 / Accepted: 14 May 2025 / Published: 7 June 2025

Abstract

The research uses data from the Mini-TES infrared spectrometer of an Opportunity rover taken at selected locations along its route in Meridiani Planum on Mars. Using emissivity data, the corresponding mineralogical compositions were calculated. Generally, the results are consistent with previous works, in particular they indicate the widespread occurrence of clay minerals and minerals from basaltic rocks. However, several interesting facts were also noted. Among other things, clear changes in the hematite content were found, suggesting that certain area spherical concretions (known as blueberries) may be devoid of hematite. A similar phenomenon is known from studies of terrestrial concretions. Moreover, the possibility of pyrite existence was found on a certain section of the route. On Earth, pyrite often occurs with economically valuable minerals.

1. Introduction

1.1. Research Objectives

The Opportunity rover landed in Meridiani Planum in 2004. It was active on Mars for 5111 sols and traveled a distance of 45.16 km [1]. Although the data from Opportunity have been the subject of a number of studies, we still see the potential to obtain scientifically valuable results from them. These possibilities are due to various factors (e.g., focusing on locations with more data by some scientists, considering the features of larger scale, different spectral ranges, data processing problems, etc.). We refer to these problems in a few places in the text (e.g., Section 2). Our present main topics are as follows:
(1)
The general goal is to use the spectral data from the Mini-TES to investigate the local mineralogy, petrology, and other features of the regolith (or outcrops) along a selected part of the rover’s path.
(2)
The important objects of research are the commonly occurring spherules (known as blueberries) on the route. They are related, among other things, to our research on the origin of terrestrial and Martian spherical concretions [2].
(3)
To take into account the part of the spectrum in the range of the small wavenumber values, which allowed for obtaining data on minerals with characteristic spectral features in this range (including pyrite).

1.2. Opportunity Rover Mission

The Opportunity rover landed in Meridiani Planum on 25 January 2004, three weeks after its twin, Spirit. Due to the landing time, Opportunity was designated Mars Exploration Rover-B (MER-B). However, Opportunity was produced before Spirit, so the designation MER-1 is also used. The Spirit rover was designated MER-A or MER-2, respectively. Opportunity was active on Mars from 2004 to 2018 for 5111 sols (14 years, 138 days on Earth). During this time, the rover traveled a distance of 45.16 km [1].
The mission included finding meteorites (e.g., Heat Shield Rock [3]) and an exploration of the Victoria crater [4]. In 2011, it reached the Endeavour crater [5]. Eventually the mission was considered one of NASA’s great successes.
Three instruments on the Opportunity rover are the most important for our analysis. They are the following: the Miniature Thermal Emission Spectrometer (Mini-TES, e.g., [6,7]), The Mini-TES was developed by Arizona State University and Raytheon Santa Barbara Remote Sensing (USA). The Alpha Particle X-Ray Spectrometer (APXS). It was developed by the Max Planck Institute for Chemistry in Mainz, Germany. The Mossbauer spectrometer was developed by Dr. Göstar Klingelhöfer at the Johannes Gutenberg University in Mainz, Germany. (MB)—Figure 1.
The Mini-TES provides the mineralogy and thermophysical properties of the regolith. It is a Fourier transform spectrometer (see the next subsection).
APXS determines the elemental composition of the regolith. Alpha particles and X-rays (generated by radioactive sources) excite the X-rays in the sample. The X-ray spectrum shows elements from sodium to yttrium. In addition, back-scattered alpha particles provide data on oxygen and carbon. Finally, the concentrations of the elements are obtained [8].
Mossbauer spectroscopy (MB) is a method for a quantitative analysis of iron-bearing minerals. During the Opportunity mission, the goal was to identify minerals containing iron (e.g., silicates, oxides, sulfates, carbonates, and sulfides). MB can also determine the distribution of iron in different oxidation states (e.g., Fe3+, Fe2+) and measure the proportion of iron in some basaltic minerals (e.g., pyroxene, magnetite, olivine, ilmenite) [9].
The microscopic camera, rock abrasion tool, MB, and APXS are mounted on a moving arm known as the Instrument Deployment Device (IDD). To measure, MB and APXS sensors must be placed close to the surface of the selected sample (by the IDD).

1.2.1. Mini-TES Overview

The Mini-TES is a Fourier Transform Spectrometer. It works in infrared in the range of the vibrational spectroscopy. Vibrational motions occur within a crystal lattice at frequencies that are directly related to the crystal structure and its chemical composition [10,11]. The frequencies of geologic materials typically correspond to wavelengths > ∼5 μm, and are characteristic for the given minerals. Therefore, vibrational spectroscopy could be used to identify virtually all the minerals.
The Miniature Thermal Emission Spectrometer (Mini-TES) provides remote measurements of the mineralogy and thermophysical properties of the scene surrounding the Mars Exploration Rovers. It covers the wavelength range of 5–29 µm (corresponding to the wave number range from 339.50 to 1997.06 cm−1) with the sample interval 9.99 cm−1. The Mini-TES has a Cassegrain telescope of 6.35 cm in diameter that provides a resolution of 20 mrad (it could be reduced to 8 mrad). The Mini-TES and two cameras (a pan camera and navigation camera) are mounted on the Pancam Mast Assembly (PMA) and are located ~1.5 m above the ground—see Figure 1. The PMA provides a possibility of a 360° azimuthal rotation and a view from 30° upwards to −50° downwards.
The radiation concentrated in the telescope feeds a flat-plate Michelson moving mirror. It is an uncooled pyroelectric detector based on deuterated triglycine sulfate. An interferogram is collected every two seconds. After transmission to the computer, the Fast Fourier Transform (FFT) and other processes are performed before transmission to Earth.
Radiometric calibration is based on V-groove blackbody targets with platinum temperature sensors with accuracy +/−0.1 K. The Mini-TES temperature is expected to vary diurnally from 263 to 303 K. For temperatures > 270 K, the radiometric precision is +/−1.8 × 10−8 W cm−2 sr−1/cm−1 between 450 and 1500 cm−1.
The absolute radiance error is less than 5 × 10⁻⁸ Watt cm−2 sr−1/cm−1, decreasing to ~1 × 10⁻⁸ Watt cm−2 sr−1/cm−1 over the wavenumber range where the scene temperature will be determined (1200–1600 cm−1).
The Mini-TES’s main scientific objectives are follows:
  • Determine the mineralogy of regolith;
  • Determine the thermophysical properties of the soil;
  • Determine the temperature, dust, and water vapor abundance in the lower atmosphere.
Mineralogic mapping requires the following: radiometric accuracy, spectral resolution, and the precision necessary to uniquely determine the mineral abundances in mixtures within 5% absolute abundance and with a spatial resolution less than 25 cm at a 10 m distance (25 mrad).

1.2.2. Tests and Calibrations

The Mini-TES and its parts were the subjects of several calibrations and tests. Some of them were performed before delivery to JPL. Their objectives were to determine the following: the field-of-view (definition and alignment), the out-of-field response, the spectrometer spectral line shape, the spectrometer radiometric calibration, etc. Some of the tests were performed in special conditions (vacuum and low pressure, low temperature, after several hours of vibrations etc.) [6].
Eventually these tests determined satisfactorily several properties of the apparatus. They include the following:
  • The emissivity and effective temperature of the internal reference surface;
  • The instrument response function and its variation with the instrument temperature;
  • The absolute radiometric accuracy;
  • The spectrometer noise characteristics;
  • The spectrometer gain values.
To test mineral detection, a target containing 14 samples of minerals was constructed e.g., [12], Table 1.

1.3. Meridiani Planum—General Data

Meridiani Planum is a plain lying within the boundaries of Arabia Terra to the north, Noachis Terra to the south, Terra Sabaea to the east, and Ares Vallis to the west. The plain covers an area of almost 175,000 km2. On the surface of Meridiani Planum, there are extensive sandy areas of various fractions. There are also spherical concretions with a diameter of several mm to 1 cm, known as blueberries (Figure 2A).
On Mars, there are three basic geological eras of the formation of the surface of Mars: Noachian, Hesperian, and Amazonian. On Meridiani Planum, the geological history was shaped in the following way [13,14]:
On Noachian, the rivers brought large amounts of basaltic mud;
On Hesperian, the volcanism on Tharsis delivered large amounts of volcanic ash and sulfur acidifying the Meridiani reservoir;
On Amazonian, the water gradually began to dry out, leaving sedimentary minerals on the surface, wind erosion began to dominate. It was during this period that the concretions called blueberries were formed.
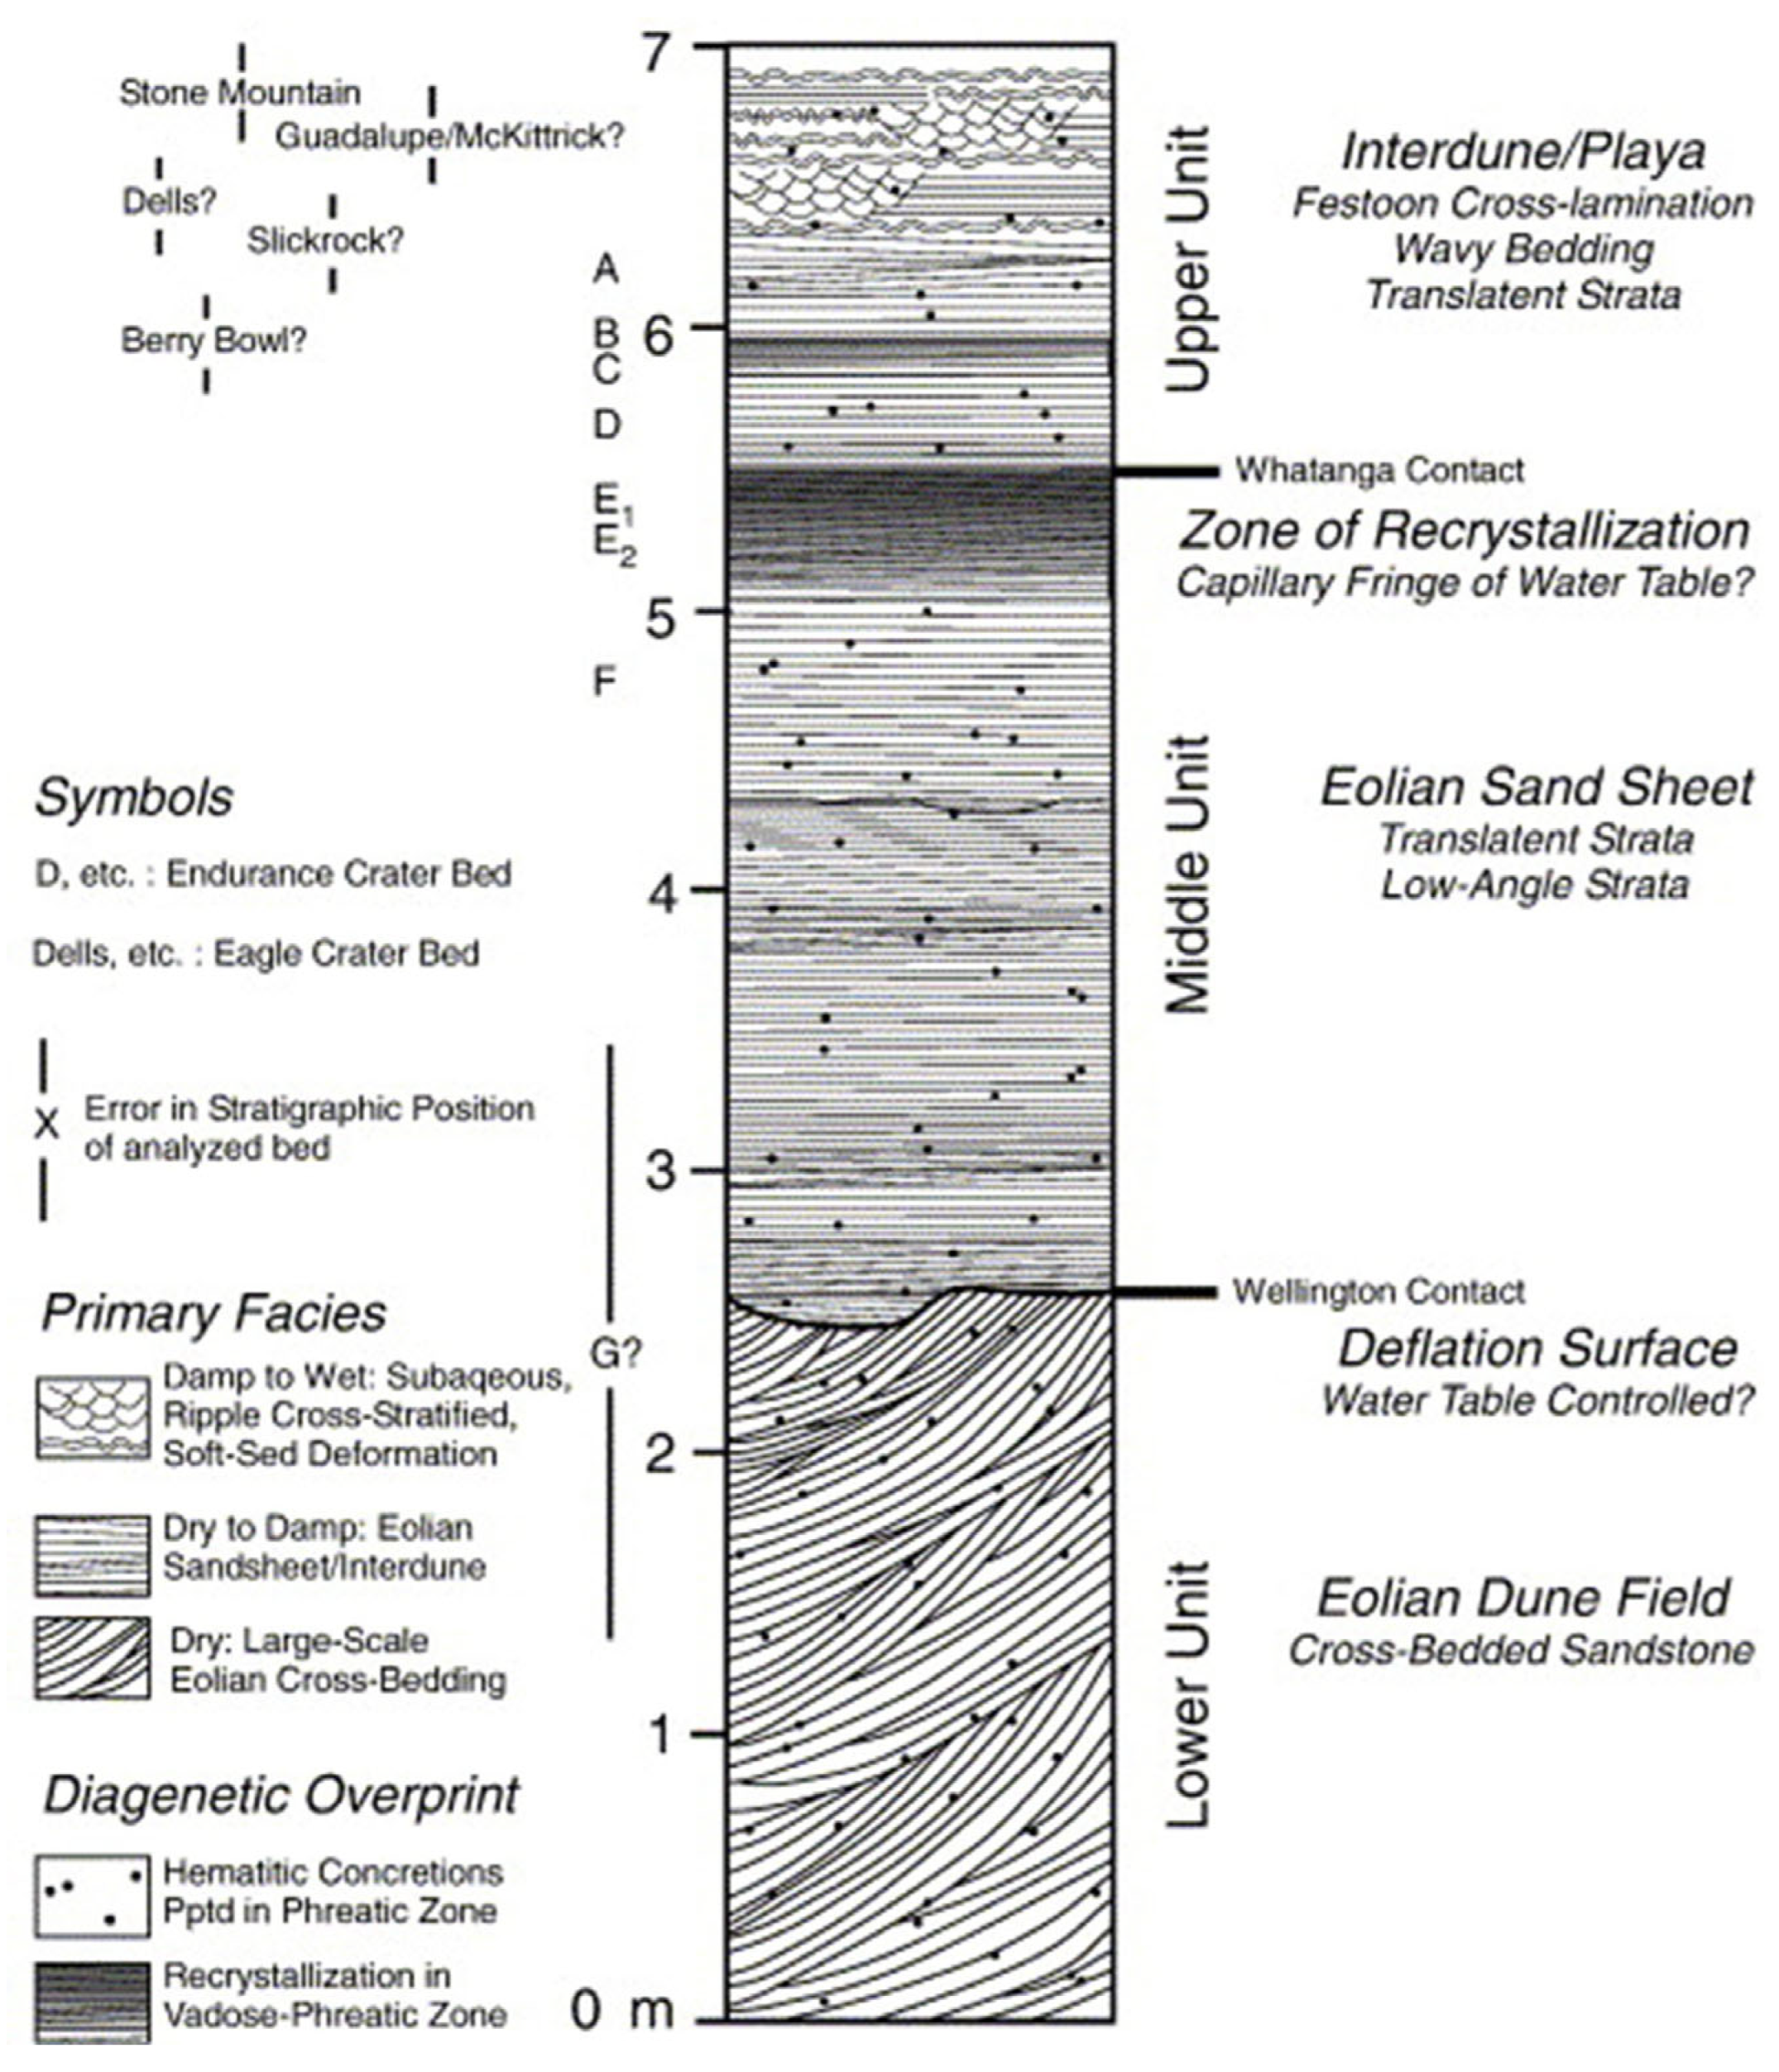
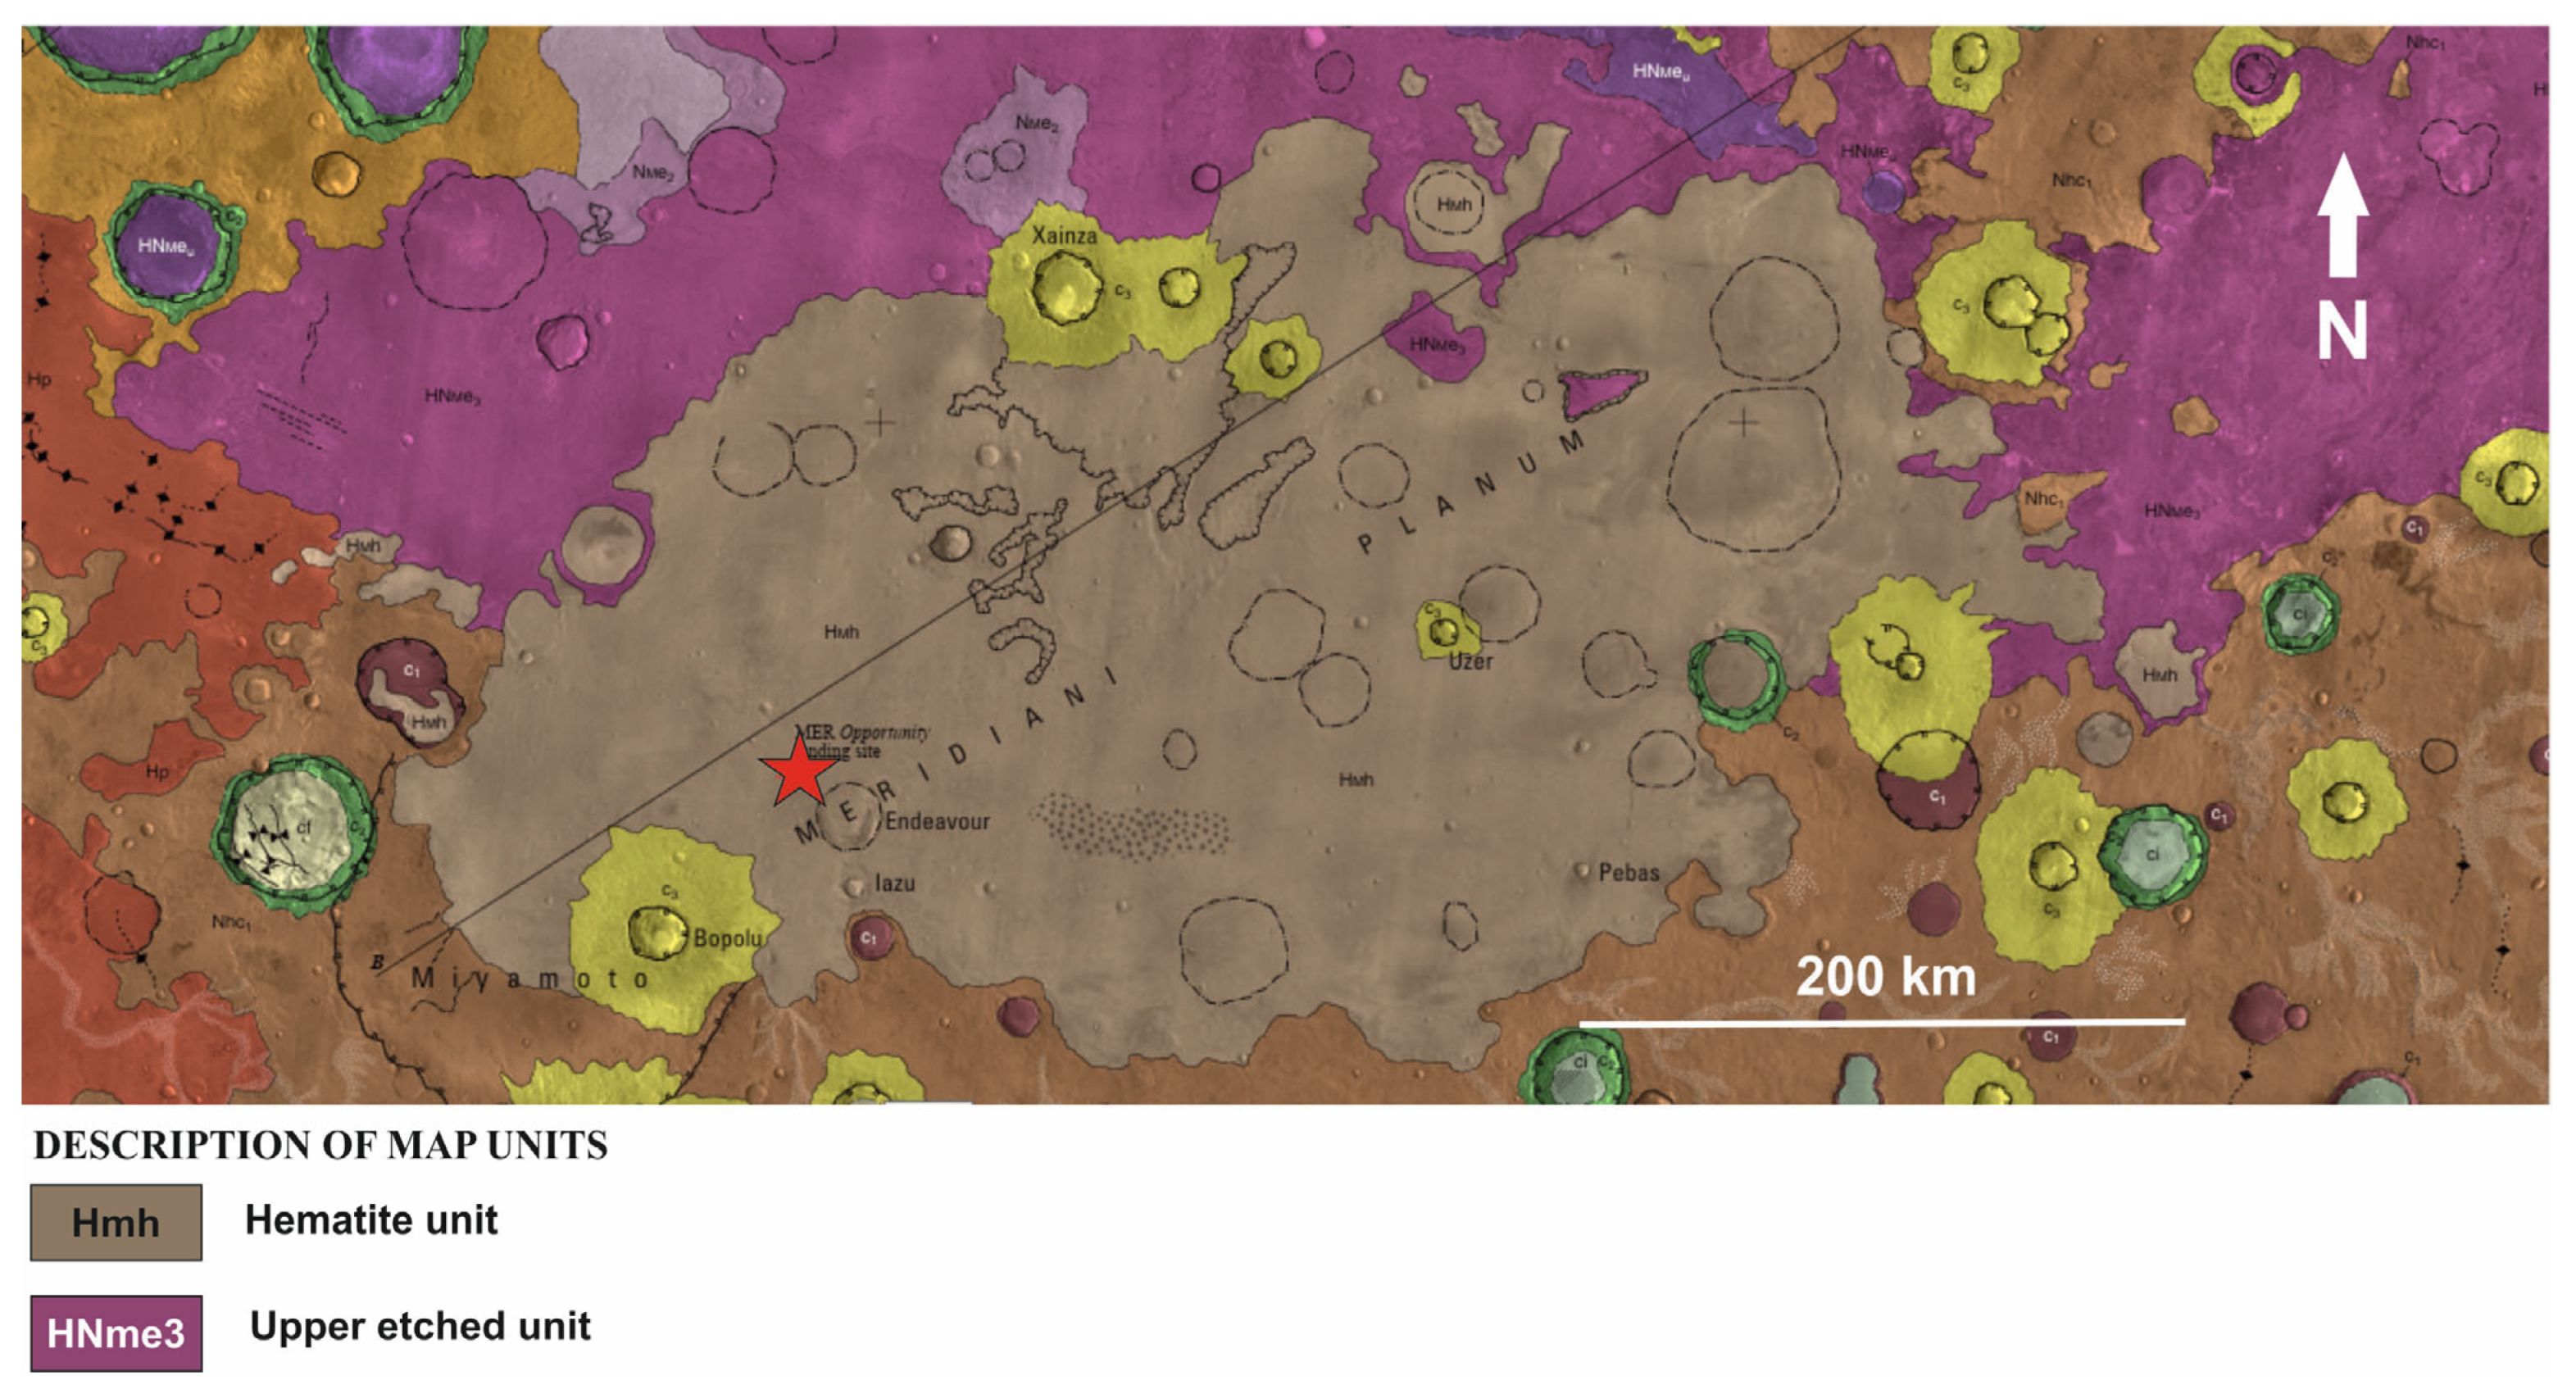
Meridiani Planum is a plateau covered with a variety of sediments—Figure 3 and Figure 4. The area is characterized by the presence of rock layers that are formed by long-term sedimentary processes. An analysis of orbital images and data from the Opportunity rover reveal the presence of sedimentary rocks, e.g., sandstones and mudstones. The region may have been subject to hydrothermal processes and extensive volcanism during the Hesperian. Some structures and minerals, such as jarosite, may have been formed by the circulation of hot water beneath the surface, which could have influenced the deposition of sulfate minerals and the formation of sedimentary layers.
Today, dunes and aeolian ripples are common on Meridiani. The surface is covered with partially buried or filled impact craters (up to 50 km in diameter). The Hmh, the Hematite unit (early Hesperian), unconformably overlies the heavily eroded HNMe3, the Upper etched unit (middle to late Noachian), characterized by local knobs, mesas, and outliers. The spherules were most likely formed by chemical precipitation from iron-bearing groundwater or by volcanic processes. This suggests that the spherules formed in the upper etched (leached) unit (HNMe3), forming extensive surface deposits. The isolated, smaller exposures around the central, larger exposures suggest that the unit had a larger former magnitude [15].
Many scientists believe that there were thermal springs or water reservoirs in the Meridiani Planum region. This is indicated by data from the Mars Global Surveyor (MGS) probe’s Thermal Emission Spectrometer (TES), which identified elevated amounts of hematite on Meridiani.
Based on data from the Gamma Ray Spectrometer (GRS), a high hydrogen content was discovered. The GRS, installed on board NASA’s Mars Odyssey, allowed for a mapping of the chemical composition of Mars at a depth of 10 cm to 1 m below the surface by measuring gamma rays from space and their interactions with various surface materials. The GRS consists of a Gamma Sensor (GS), a Neutron Spectrometer (NS), and a High-Energy Neutron Detector (HEND). Neutron detection equipment, such as NS and HEND, measures the neutrons of different energies released from the near surface of Mars by cosmic rays.
According to the interpretation of scientists [16], (Mars Advanced Radar for Subsurface and Ionosphere Sounding) MARSIS radar (Mars Express probe) data indicate that the relatively low derived dielectric constant of Meridiani Planum sediments (~3.6 ± 0.6) is consistent with a sequence of thick, low-density porous basaltic sand. As can be seen, pore-filling water ice is therefore not necessary to explain the low dielectric constant of Meridiani Planum sediments [16].
Figure 4. Geologic cross-section of the Endurance Crater cliff, Burns Formation by [17]. Figure adapted from Grotzinger et al. [17] Copyright © 2005 Elsevier B.V. All rights reserved.
Remotesensing 17 01981 g004

1.4. Basic Information About the Regolith Along the Rover’s Route

The studied part of the rover’s route is located in a smooth area with small ripples [18]. In the studied area, one can distinguish dunes with light ridges, dunes made of dark material, outcrops of light, cracked rocks forming deflation pavement, and rock breccia made of light rocks. The entire area is covered with small spherules which are cemented in some places and in others they lie loosely on the ground, which indicates probably different ages of erosion of the substrate and rocks. This is known from the close-ups obtained by the microscopic camera. The size of the spherules is about 0.5–1 cm, which also agrees with the results from, among others, the thermal inertia data, which oscillate around 255 [18]. There are also small impact craters in the area. The large areas of wrinkles and fields of ejecta blocks show some of the lowest values of thermal inertia. These features were previously identified by [19] as regions of low thermal inertia, which was later confirmed by in situ observations. Thermal inertia was also determined from rover wheel tracks. They suggest limited cementation or lower cohesion in much of the regolith. This indicates that the regions of lower thermal inertia are dominated by fine-grained sand and dust, which exhibit slower cooling rates at night. The thermal inertia values, in units of J m−2 K−1 s−1/2, from the THEMIS infrared data were derived using the method of Fergason et al. [20,21].

2. Methods

The Mini-TES is designed for the remote determination of the mineral composition of the regoliths of planetary bodies. In addition, it can be used to determine the surface temperature and/or properties of the atmosphere—Figure 1. The Mini-TES is a miniaturized version of TES, installed on the orbiter Mars Global Surveyor (MGS). A Mini-TES was placed on two rovers exploring Mars (Spirit and Opportunity).
The Mini-TES provides high resolution infrared spectra over some range of wavelengths. By making measurements in the thermal infrared part of the electromagnetic spectrum, it has some ability to penetrate layers of dust. Such layers are common on the surface of Mars and pose a problem for remote observations. The range of a Mini-TES spectrum corresponds to some characteristic bands of vibration spectra. They allow us to identify certain crystal structures of minerals. This often makes it possible to determine mineralogy and various properties. In particular, the detection of the following groups of minerals is possible: hydroxides, sulfates, phosphates, silicates, carbonates, and oxides [6].
The Mini-TES covers the spectral range from 1997.06 cm−1 to 339.50 cm−1 with a spectral sampling of 9.99 cm−1 (at 167 points). The extreme ends of each spectrum were excluded from deconvolution due to the lower signal-to-noise ratio (SNR) in these spectral regions.
The mission of the Opportunity rover lasted 5111 sols. However, the number and quality of the later measurements were lower. We focused on the data from the Mini-TES spectrometer taken from sol 313 to sol 395. We chose the less discussed parts of the route of the rover. In these parts, there are fewer other data (e.g., from APXS and MB).
Let us note that 20 years ago the availability and requirements for appropriate processing might have created some problems. The data available today are better processed (e.g., calibrated) and easier to use (see the Planetary Data System website for details).
In our study, we used methods similar to those in [21,22]. We focused on the typical areas of Meridiani Planum, not the rather untypical areas of the outcrops within the Eagle crater. Note that the mineralogy of the outcrops may be significantly different from that of the loose regolith.

2.1. Procedures and Methods

The general procedure used in our research could be presented using the following points:
(1)
A determination of the measured object.
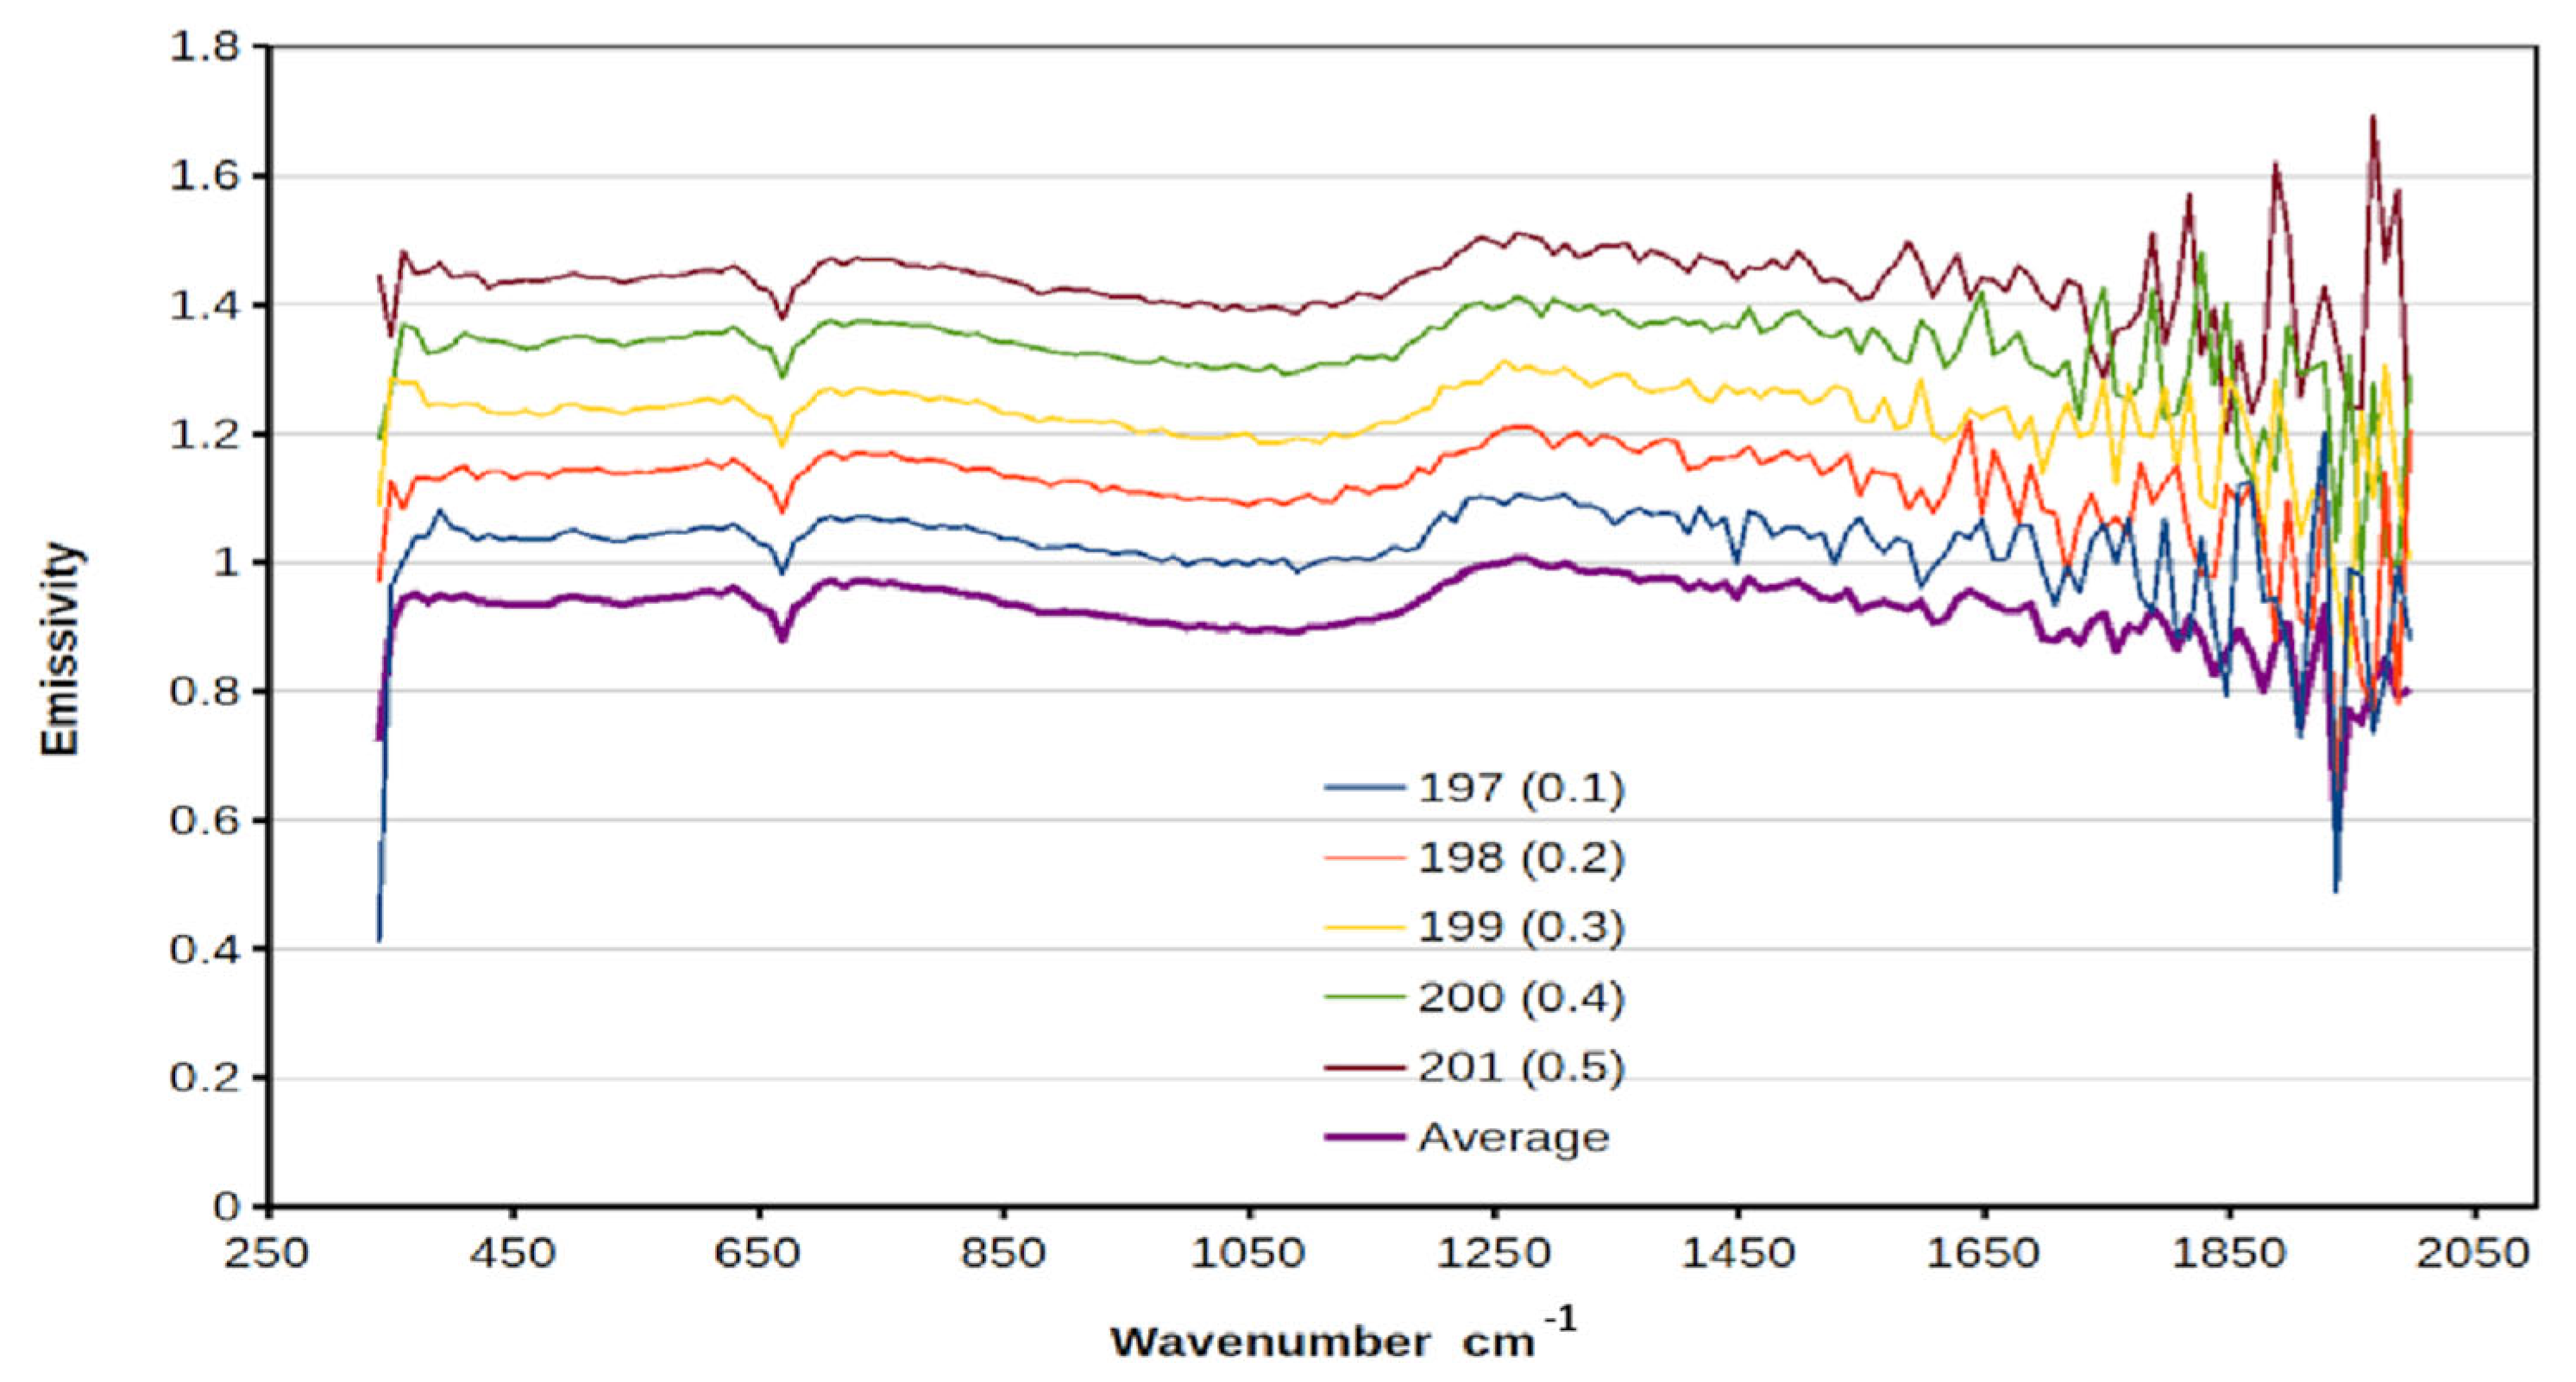
The position of the object being measured by Mini-TES is determined by the direction in which the instrument is facing. This direction is given by the elevation and azimuth. Elevation is an angle counted from the horizontal level (downwards it has negative values). Since we are interested in the spectrum of the planet’s surface, we used the data with negative elevation (Figure 5). In general, the elevation values ranged from approx. −50° to approx. +30°. For the height of PMA ~1.5 m, the distance to the measured object was ~86 m for an elevation angle −1° and ~1.25 m for an elevation angle −50°. Of course, the exact distance depends on the inclination of the rover itself and the topography of the terrain.
We often also used photos from some cameras taken in the same direction (Figure 6), which allowed us to determine the general characteristics of the terrain. In some places along the rover’s route, tests were also carried out with other instruments (such as the APXS and the Mossbauer spectrometer). Moreover, there are also results from the Mars orbiter available (TES). The orbital TES data have a much lower resolution, but allow for the determination of large-scale changes (e.g., gradients).
Figure 5. Five emissivity profiles for the measurement series 1t163157489emr4705p3575n0a1 made during sol 394. Elevation was −0.349100, rad = −20o, and azimuth = 3.136937, rad = 179.7°. For readability of the graphs, individual profiles are shifted vertically. The lowest profile (thick line) is the average of the others and is not vertically shifted. Note the large fluctuations at the ends of the profiles, which make an interpretation of these parts virtually impossible. Averaging reduces some of these fluctuations—see the lowest profile. The peak around 660 cm−1 is associated with atmospheric carbon dioxide and this part of the spectrum is removed before interpreting the spectrum of the planet’s surface (see Figure 7). The legend gives the consecutive measurement numbers (ICK) in the series and vertical shift (in parentheses).
Remotesensing 17 01981 g005
(2)
The selection of measurements.
The measurements were performed in a series (packages) containing anywhere from several to several hundred measurements—Table 2. Mostly, the measurements in a given series were made for the same values of elevation and azimuth.
In a few cases only, the elevation and/or azimuth were changed systematically. We eliminated such cases. We also eliminated the measurements taken in very dusty conditions.
(3)
The selection of the spectral range.
Figure 5 and Figure 7 show examples of some of the problems when selecting data for interpretation. In Figure 5, there are 5 profiles of emissivity taken during sol 394. As one can see, for the short wavelength (i.e., large wavenumber), the measurements show large fluctuations in values. Therefore, these profiles are averaged. Averaging reduces these fluctuations.
Even then, the choice of the spectral range is difficult. Taking into account the full Mini-TES spectrum would seemingly allow for full use of the information contained in these spectra. However, in reality, the strong oscillations of the spectrum for large wavenumber values (even after averaging many results) cause large errors and the instability of the results. Therefore, each choice for the range will be a compromise. In our case, significant oscillations are often visible even below 1500 cm−1. Therefore, we limited ourselves to the range below 1350 cm−1. Fortunately, the spectra of the considered minerals in the range above 1350 contain fewer features important for recognition (see Figure 8). This means that abandoning the spectrum for large wavenumbers leads to a somewhat smaller loss of information.
The behavior of the Mini-TES spectrum for small wavenumber values is much more stable, so we decided to get much closer to the lower limit of the spectrum. This allowed for obtaining better data on the content of the minerals with important features in their spectrum for low wavenumber values.
One such mineral is pyrite (see the discussion in Section 3.1.1). Although its expected content is low, it is important as an indicator of other minerals; therefore, we extended this study to include low wavenumber values.
Eventually, we considered spectra in the range of 345–1350 cm−1. This is a lower limit less than in some papers, e.g., [23]. This is an important choice enabling the determination of other minerals. After averaging, we also performed normalization of the spectra.
(4)
The selection of minerals and library spectra (See Section 3.1.1 for this problem).
(5)
The performance of numerical calculations.
Similar to [22], we were using the least squares method or other efficient method (e.g., MNN). These include the following:
  • 5.1. The generation of an initial random solution;
  • 5.2. The least squares method is used for improving the solutions;
  • 5.3. A selection of the best solution;
  • 5.4. If a solution is not acceptable, go back to 5.1; otherwise, start a discussion and interpretation of the solution.
To remove the effect of the CO2 peak, a method of cutting out part of the spectrum is generally used, e.g., [21]. This is also the main method used in our study. We used a notch from 600 to 740 cm−1. We determined mineralogical composition using the least squares method, using a linear spectral approximation from a selected library of mineral spectra. All software use, data import, and calculations in the research were performed by L. Czechowski.
Another possible method of treating the CO2 peak is to approximate the spectrum in this range using an appropriate function. Of course, it would be best to use a function similar to the emissivity of the same minerals (without CO2 in the atmosphere). Using the least squares method, one could come closer to reproducing the mineralogy. Unfortunately, until we have relatively accurate information about the surface composition, it is difficult to choose such an interpolation. In practice, we only examined the linear or second-degree interpolations and compared them with the results of the excision method, Figure 8.

2.2. Solution Stability

One of the properties for a reliable solution is stability towards small disturbances of data and/or methods. To determine the stability of our solutions, we examined stability in respect to the following:
(i)
Relative to the initial solution approximation;
(ii)
In terms of the required accuracy of the solution approximation;
(iii)
Relative to the methods of data averaging (number or selection of averaged data);
(iv)
Stability against the excluded regions with the largest fluctuations (see above);
(v)
Stability towards different spectral libraries;
(vi)
Controls for removing unrealistic minerals from the solution.
The result of solution instability may be artifacts, i.e., the appearance of minerals (in the numerical solution) that were not present in the studied location. Therefore, to obtain an acceptable solution we use more minerals than necessary, including some whose probability of occurrence is low. The percentage value of the artifact may reach a few percent. A single occurrence of such minerals should be treated with caution as an artifact. However, if it appears systematically, then there is a high probability that this mineral was indeed present in the studied location, i.e., we are not dealing with an artifact. See also the problems of pyrite and quartz discussed below (See Section 3.1.2).

3. Results

3.1. Data Emissivity

Data from the Opportunity rover’s Mini-TES (Mini-TES Science Emissivity Records (EMRs)) are available in the Planetary Data System at https://pds-geosciences.wustl.edu (accessed on 29 April 2025). We finally selected 61 series of measurements made between sol 313 and sol 395. We chose good quality data from typical sectors of the route. Therefore, we did not deal with unusual objects such as meteorites lying on the surface or the interior of craters. Example photos of the studied sites are shown in Figure 6. A short description of the surface of the subsequent sectors of the route is included in Section 3 Note that along practically the entire selected route (Figure 9, Figure 10, Figure 11 and Figure 12) there is a large number of spherical concretions on the surface (Figure 2A and Figure 6B,C). The measurement series that we selected in our study are marked with a sol number (and additionally with a letter (a, b, c, d, e, f, g), if several measurement series were made on the same Martian day). Table 2 shows our measurement notations, and the corresponding notations used in the Planetary Data System database.
We have focused on the area from sols 313 to 325, 329 to 331, and 382 to 395 due to the small number of studies on these sectors of the rover’s route in the literature. There is quite a rich interpretation of the data from the craters explored by the rover, but some typical parts of the route were not investigated using Mini-TES. The break between sols 331 and 382 resulted from the route of the rover, which examined the Heat Shield meteorite then. Since we are focusing on the properties of Mars itself, we omitted the data concerning the meteorite. We have also given up on some parts of the route. From sol 382, however, the terrain begins with a more morphologically diverse topography. For sols 392 and 393, we have used APXS and Mossbauer measurements, which provide additional information on mineralogy.

3.1.1. Selected Minerals

For modeling, we selected common minerals, basalt components that form the surface of Mars, and the minerals that are mentioned in the literature and are evidence of the occurrence of water in the past of Mars [21]. The components of basalt are plagioclase, pyroxenes, amphiboles, phyllosilicates, and olivines originating from the planet’s mantle. Additionally, there may be such phosphate minerals as apatite, which has so far been detected in shergottites, [24] hence our choice. As components of basalt, we selected the following representative minerals: for plagioclase, labradorite and andesine; for pyroxenes, bronzite and enstatite; for amphiboles, hornblende; for phyllosilicates, biotite; and for olivines, forsterite.
The olivines on Mars were discovered using the TES spectrometer (Mars Global Surveyor) on Nili Fossae [25]. In addition, the Spirit rover identified olivine in the Gusev crater using the Mini-TES, APXS, and Mossbauer spectrometers [26]. In addition, serpentinization occurs during the weathering of olivine, which is a source of methane, hence the choice of serpentine.
Clay minerals smectites, including montmorillonite, are formed as a result of the weathering of volcanic rocks, when volcanic ash comes into contact with water, and in hydrothermal processes, e.g., in the creation of volcanic glass. They can be products of geysers [14]. For the purpose of modeling from clay minerals, chlorite, a very common mineral on Earth, was additionally selected.
The selected main iron oxides were hematite and ilmenite. Hematite is a common mineral on Mars, which is why it was selected for modeling. First of all, it was detected by the Mossbauer apparatus on the Opportunity rover. We wanted to check what amounts of hematite would be confirmed by the interpretation of the spectra by the Mini-TES [27]. Hematite forms in water reservoirs during the process of precipitation, creating layers at the bottom of lakes, where there are hot springs. It can also be formed with the participation of volcanism in hydrothermal processes. It also forms red soils during the process of weathering in tropical conditions. The large amounts of hematite discovered on Meridiani Planum suggest that the area was once covered with water. On the other hand, ilmenite is also a source of titanium. It was recently identified on the Moon. It has a large industrial application. Mentions of the occurrence of ilmenite appeared in the study of Martian meteorites, especially NWA 7034 [28]. Additionally, goethite and magnetite were selected from iron oxides, but no amount was confirmed by Mini-TES in the area we selected for study. The evidence of water on Mars are minerals such as sulphates, including gypsum and jarosite, and carbonates, such as calcite, magnesite, and siderite. We wanted to check what share of these minerals, which may confirm the existence of water in the past of Meridiani, have been found [14]. In addition, jarosite was discovered on Meridiani Planum by the Mossbauer spectrometer [29]. Carbonates were discovered in the Gusev crater by the Spirit rover and in the Jezero crater by orbital spectrometers. Like sulfates, they crystallize during the evaporation of water reservoirs, and in geysers. They also crystallize from groundwater in rock cracks.
Gypsum is evidence of the presence of water in the past on Meridiani. It could have been formed during the evaporation of water reservoirs during volcanic exhalations in geysers. It can also crystallize from groundwater in rock cracks. Such fractured gypsum was found by the Opportunity rover on its route (See Section 4.1), [14]. Jarosite—hydrated iron sulfate—is a sulphate mineral formed in ore deposits as a result of the oxidation of iron sulfides, e.g., pyrite. The occurrence of jarosite and pyrite together is therefore justified. In the distant past, this region may have had contact with acidic waters. Jarosite is formed as a result of the action of water, which indicates ancient processes related to the presence of liquid watercourses or water reservoirs, although the water may have been strongly acidic, which limited the potential development of life [29]. Sulfides are very useful minerals because they co-occur with ore deposits and are indicators of the occurrence of gold and silver. Therefore, for the purposes of modelling, we used pyrite. Pyrite, a common mineral from the sulfide family, crystallizes in a hydrothermal environment. It often contains admixtures of nickel, cobalt, zinc, silver, gold, and copper. On Mars, pyrite is difficult to find due to the possibility of other bands overlapping the characteristic pyrite bands [30], which is why the mentions of finding pyrite come only from the studies of Martian meteorites [31].
In addition, the Curiosity rover detected sulfides in the Gale Crater, which may indicate the presence of pyrite. According to McAdam et al. [32], laboratory-obtained sulfur phases compared with Curiosity’s SAM (Sample Analysis at Mars), ChemMin (Chemistry and Mineralogy), APXS (Alpha Particle X-ray Spectrometer), and XRD (X-Ray Diffraction) analyses indicate the presence of pyrite. Additionally, the interpretation of the data from the John Klein and Cumberland boreholes indicated pyrite-bearing mudstones [33]. These results were confirmed by new laboratory studies in the Glen Torridon Martian region, where pyrite was detected [34].
Additionally, we used quartz as the mineral component. Quartz is a common mineral occurring in crystalline and amorphous forms. It is most common in granites and granitoids and also forms veins in rock cracks. It is deposited as amorphous silica in geysers. The only area on Mars where crystalline quartz has been identified from orbit is the area around the Antoniadi crater, on the northern edge of the Syrtis Major shield volcano [35]. Recent studies by the Curiosity rover indicate finding a variety of quartz–tridymite in the Gale Crater [36]. This scenario assumes that explosive volcanism on Mars occurred during the Hesperian. It may not have been limited to basaltic eruptions, and this shows the complexity of magmatism on Mars. Such a scenario may have also occurred in the vicinity of Meridiani Planum.

3.1.2. Library Spectra

For the interpretation of the Mini-TES spectra, we used 23 spectra of selected minerals—Table 3 (the justification for this choice is given in Section 3.1.1). Most of these spectra come from the ASU Spectral Library (https://speclib.asu.edu/) (accessed on 29 April 2025) (Figure 13). They are located in the files with names given in Table 3. The latest spectrum of pyrite was taken from [30]. In selecting the spectra, we tried to use the existing interpretations of spectra from Meridiani Planum. At the same time, we extended this study to the spectra that were often not considered (to our knowledge) in some previous studies. Some spectra were introduced to check the stability of the method (see discussion in Section 2). The same library spectra, and the same calculation process were used for all measurements in Table 2. The calculations were repeated under several random initial conditions. The stability of the solution can be used as an indication of the reliability of the results. The results indicate several confidence thresholds: ~2%, ~6%, and ~19%. If the results show a content below 2%, it is very possible that we are dealing with an artifact. For values above 19%, it is difficult to find reasons for the artifact, and it should be assumed that the given mineral occurs in significant amounts.

3.2. Presentation of Results

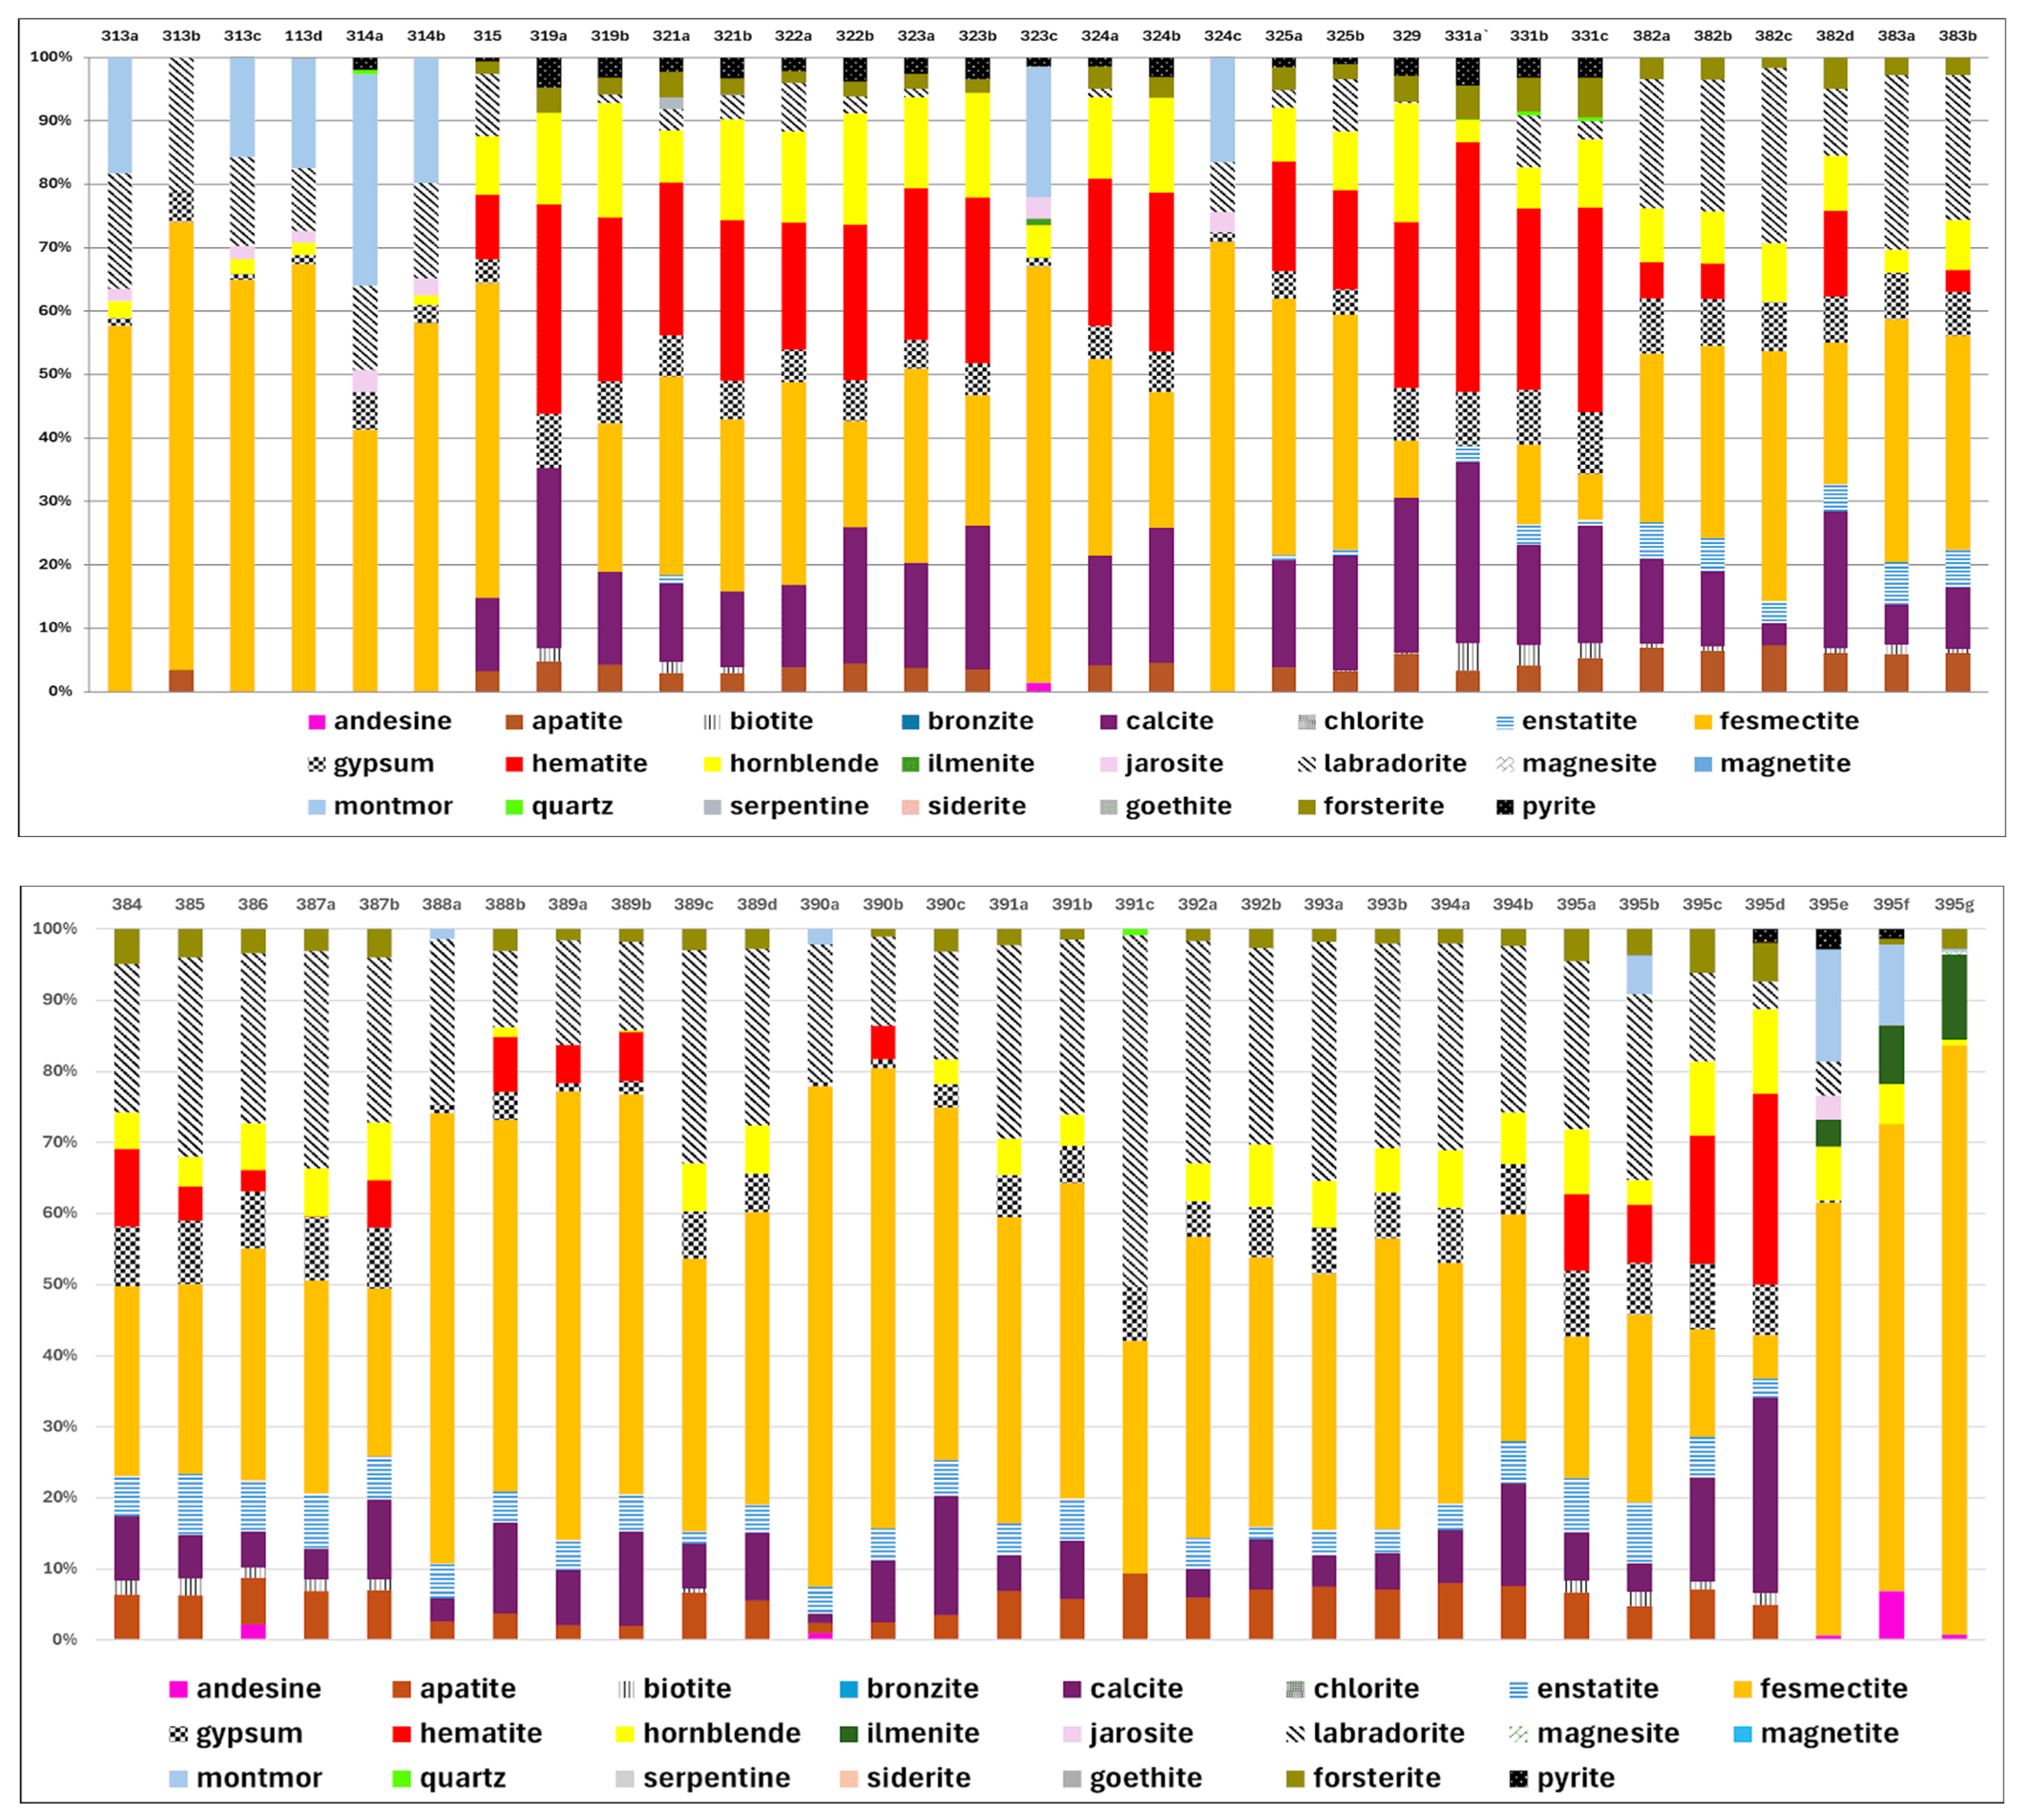
The results for all measurements are presented in the form of bars—see the upper and lower parts of Figure 14. This form allows easy orientation in the content of the main minerals identified at the measurement site. The legend shows the colors corresponding to a given mineral. The height of the bar with this color is proportional to the mineral content. A discussion of the results is presented in the next section.

4. Discussion

4.1. Mineralogy Along Rover’s Route (Figure 15)

The calculations described in Section 3 give the relative content of the minerals whose library spectra were used in the calculations. Based on the mineralogy shown in Figure 14 (61 bars), we distinguished six sectors on the rover’s route. Table 4 shows the average content of the considered minerals in each of the six sectors. Below, we describe the individual sectors of the route (Figure 15).

4.1.1. Sector 1 (Containing Measurements from Sol 313a to Sol 314b, with Six Measurements in Total)

The measurements in sector 1 were performed on the surface of bright, fractured rocks (with visible layering). Spherules are visible on the surface. They are usually stuck to the rock. In this sector, the geomorphology has changed only slightly.
The main minerals found in sector 1 are minerals from the smectite group: fe-smectite (smectite containing Fe) and montmorillonite—together comprising over 77%. These are phyllosilicates (sheet silicates). Smectites are usually formed from the weathering of basalt (or its chemically equivalent gabbro or some volcanic glasses). Many smectites are formed in volcanic hydrothermal systems (e.g., geyser). Hot water may percolate the volcanic ash through fissures or pores. This leads to the replacement of silica by phyllosilicates.
Labradorite is also present in significant amounts (~15%). Labradorite ((Ca, Na)(Al, Si)4O8) is a calcium-enriched feldspar mineral. It is an intermediate to calcic member of the plagioclase series. Labradorite occurs in mafic igneous rocks and is common in basalt and gabbro. The same rocks may also be responsible for hornblende.
Gypsum (3%) and jarosite (2%) are present in small amounts. They are sulfate minerals. Gypsum is evidence of water in the past on Meridiani Planum. It may have been created during the evaporation of water reservoirs during volcanic exhalations in geysers. It can also crystallize from groundwater in rock crevices. This is the type of fissure gypsum that the rover found on its way. Jarosite is an indicator of strongly oxidizing conditions prevailing on the surface of Mars.
From the above description, it can be seen that the minerals in this sector are the result of the interaction of basalt rocks in the aquatic environment and hydrothermal processes. The minerals that testify to the participation of water in the history of Meridiani Planum are minerals from the smectite group and gypsum. The other minerals present are mainly components of basalt (labradorite, hornblende).
Despite the presence of spherules, no hematite was found in this sector (see the discussion below).

4.1.2. Sector 2 (Sols 315–331c, 19 Measurements in Total)

Here, the rover crossed the crater boundary (and mineralogical boundary, from sols 314 to 315) and entered the ejecta cover. The rover’s route seems monotonous in this region, but there are differences in the morphology and appearance of the surface. Measurements were first performed on light-colored fractured rocks with visible layering (sol 315). Spherical concretions were visible over the entire surface. Then, the rover entered a flat area covered with weathered coarse material. Bright weathered rocks were visible in the distance (sol 321a). The terrain changes into a more dune surface with ripples (sol 322a). Bright material was visible on the dune ridges. From the side, a small crater with bright, ejected material was visible (in the photo from the rear camera) (sol 329). The dune area, covered with spherical concretions, extends further. There are ripple ridges with light surface material (sol 331a).
We observed large mineralogical differences between sectors 1 and 2. In sector 2, the content of clay minerals is much lower, falling from 77% to approximately 33%. The content of labradorite is also lower (from 15% to 4%). Hematite (21%) and calcite (15%) appear. The content of gypsum (up to 5%) and hornblende (up to 11%) is increasing. The higher contents of gypsum and calcite probably indicate a greater importance of the evaporite/sedimentation processes. The minerals labradorite, hornblende, forsterite (olivine), biotite, and enstatite are the components of basalt rocks. Apatite also appears (3%).
Note that our results also indicate the presence of pyrite at almost all measurement sites in sector 2. The average pyrite content is 2%. Similar content appeared in sol 314a, but there it could be an artifact. In the case of sector 2, however, it is not an artifact, because pyrite appears systematically. The presence of pyrite is known from Martian meteorites (e.g., [37]). However, there are problems with identifying pyrite from Martian artificial satellites. This is discussed, among other things, in [30].

4.1.3. Sector 3 (Sols 382a–389b, 15 Measurements in Total)

In the beginning of the sector, there is a dune area (sols 384–388a) covered with spherical concretions. There are wrinkled ridges with bright material on the surface. Larger dunes and a dune-covered crater are visible (sol 382a). Later, outcrops of light rocks are seen (sol 384). Then, rock rubble is visible. Later, there is a dune area. Spherules are visible on the surface (sol 388a).
The composition of the mineralogy of this sector is similar to that of the previous sector but there is a radical reduction in the amount of hematite (below ~3%, on average). However, the contents of fe–smectite (~41%) and labradorite (up to 23%) increase. Enstatite appears in significant amounts (6%).

4.1.4. Sector 4, (Sols 389c–394a, 14 Measurements)

The rover drove onto the slope of a small crater (sol 389c) covered with dark material. A breccia of light-colored cracked rocks is visible around the crater. Next, the rover enters a dune area with visible rock debris and outcrops of light rocks (sol 390a–393a). Spherules are visible everywhere on the surface. Among the sulfates, there is jarosite, which is confirmed by the Mossbauer spectrometer. The main minerals here are clay minerals (fe–smectite, average 46%) and labradorite (~29%). Apart from one point (sol 390b), there is no hematite. However, we found the following: apatite, calcite, gypsum (total average ~16%), as well as minerals related to basalt rocks, including enstatite, hornblende, and forsterite (total average ~9%). We also found trace amounts of quartz (0.1%), possibly indicative of an artifact.

4.1.5. Sector 5 (Sols 395a–395d, Four Measurements)

Measurements were made on the surface with spherules. The amount of clay minerals decreases dramatically (in total, they constitute only ~25%). Hematite appears again (13%). Basalt rock minerals dominate (labradorite, enstatite, hornblende, forsterite, and biotite, totaling ~39%). They are accompanied by gypsum, calcite, and apatite (together ~37%). Pyrite appears in the 395d measurement (below 1.3%, only).

4.1.6. Sector 6 (Sols 395e–395g, Three Measurements)

Measurements are taken on a surface with spherules. Stripes of light material are visible. In the last sector of the route, there is a radical change in mineralogy. The mineralogy resembles that from sector 1. The share of clay minerals is very high (approximately 75%). There is no gypsum, calcite, or hematite. The difference from other sectors is the significant content of ilmenite (9%). Ilmenite, as a product of the weathering of igneous rocks, often occurs in sands and gravels. Therefore, it is not strange that it appears in the dune area (where the rover was moving). Andesine at a concentration of 6%, hornblende at a concentration of 4%, and jarosite at a concentration of 1% were also found in smaller quantities. Pyrite was observed in sol 395e and 395f (3% and 1%).

4.2. General Processes Along the Route

In the five sectors of rover’s route considered, several groups of minerals were found: minerals that may be related to processes in a water reservoir (gypsum and calcite), phyllosilicates (fe–smectite and montmorillonite), and minerals occurring in rocks of basaltic composition (andesite, enstatite, labradorite, etc.). In sector 6, neither gypsum nor calcite were observed. In the remaining sectors, the processes probably included hydrothermal processes, including the interaction of water and basaltic rocks leading to the formation of phyllosilicates and the processes of evaporation and/or precipitation of calcite and gypsum from an aqueous solution. Similar processes occurred in other areas of Meridiani Planum. The absence of gypsum and calcite in sector 6 indicates the lesser importance of evaporation and/or precipitation processes in this sector. Some other processes are discussed below.

Correlations

An inspection of Table 4 indicates a few correlations between some minerals. There are positive correlations between the contents of the following minerals: calcite and gypsum, fe–smectite and montmorillonite, and enstatite and forsterite. The corresponding values of the sample Pearson correlation coefficient are as follows: 0.45, 0.44, and 0.35. These correlations may reflect similar conditions of formation due to sedimentation/evaporation, weathering processes leading to phyllosilicates, or the content of basaltic minerals. Note also the strong negative correlation between the contents of fe–smectite and hematite:—0.73. This may indicate some transfer of Fe.

4.3. Problems of Hematite and Spherical Concretions

One problem in our results that needs to be explained is the lack of hematite in some places (e.g., sector 1) and the significant amount of hematite (e.g., 21%) in sector 2. We can observe a similar situation in some areas on Earth. The spherical concretions from Utah are similar in shape and size to the Martian concretions (known as blueberries). However, the Utah concretions in the Dakota Formation do not have hematite. They probably once had a coating of iron oxides that were dissolved by flowing meteoric solutions [38]. The iron oxides were probably washed out of the concretions and recrystallized elsewhere. Indeed, in Utah, layers of red rocks with iron oxides are observed, alternating with white layers (from which the hematite was washed out). The solutions must have been acidic to dissolve the iron oxides. On the other hand, concretions from the Navajo Formation in Utah, called Moqui, preserve a layer of iron oxides. A similar explanation can be given for the absence of hematite in some places (and in concretions) in Meridiani Planum, despite the presence of hematite in concretions elsewhere. Such processes are investigated in our studies of the Utah concretions and other formations [39], (Figure 2B,C).
In many publications, scientists emphasize that these concretions were formed by water [38,40]. Their chemical mineralization is quite complex because the water that migrates through the porous sandstones is responsible for the crystallization of these formations thanks to the dissolved chemical compounds. There is a repeated process of mineralization and demineralization, and therefore, the chemical composition of the concretions in different regions of the world may differ despite the identical origin of their formation. It is suspected that the Martian concretions formed in a similar way [39,41].
Note also that the observations of hematite made by the Thermal Emission Spectrometer on board the Mars Global Surveyor have shown that the region with hematite is not continuous and there are significant areas where the TES data do not show hematite. This is an analogy here to the situation we observed in some parts of Opportunity’s route, although the MGS data are on another scale.

4.4. Problems of Pyrite and Quartz

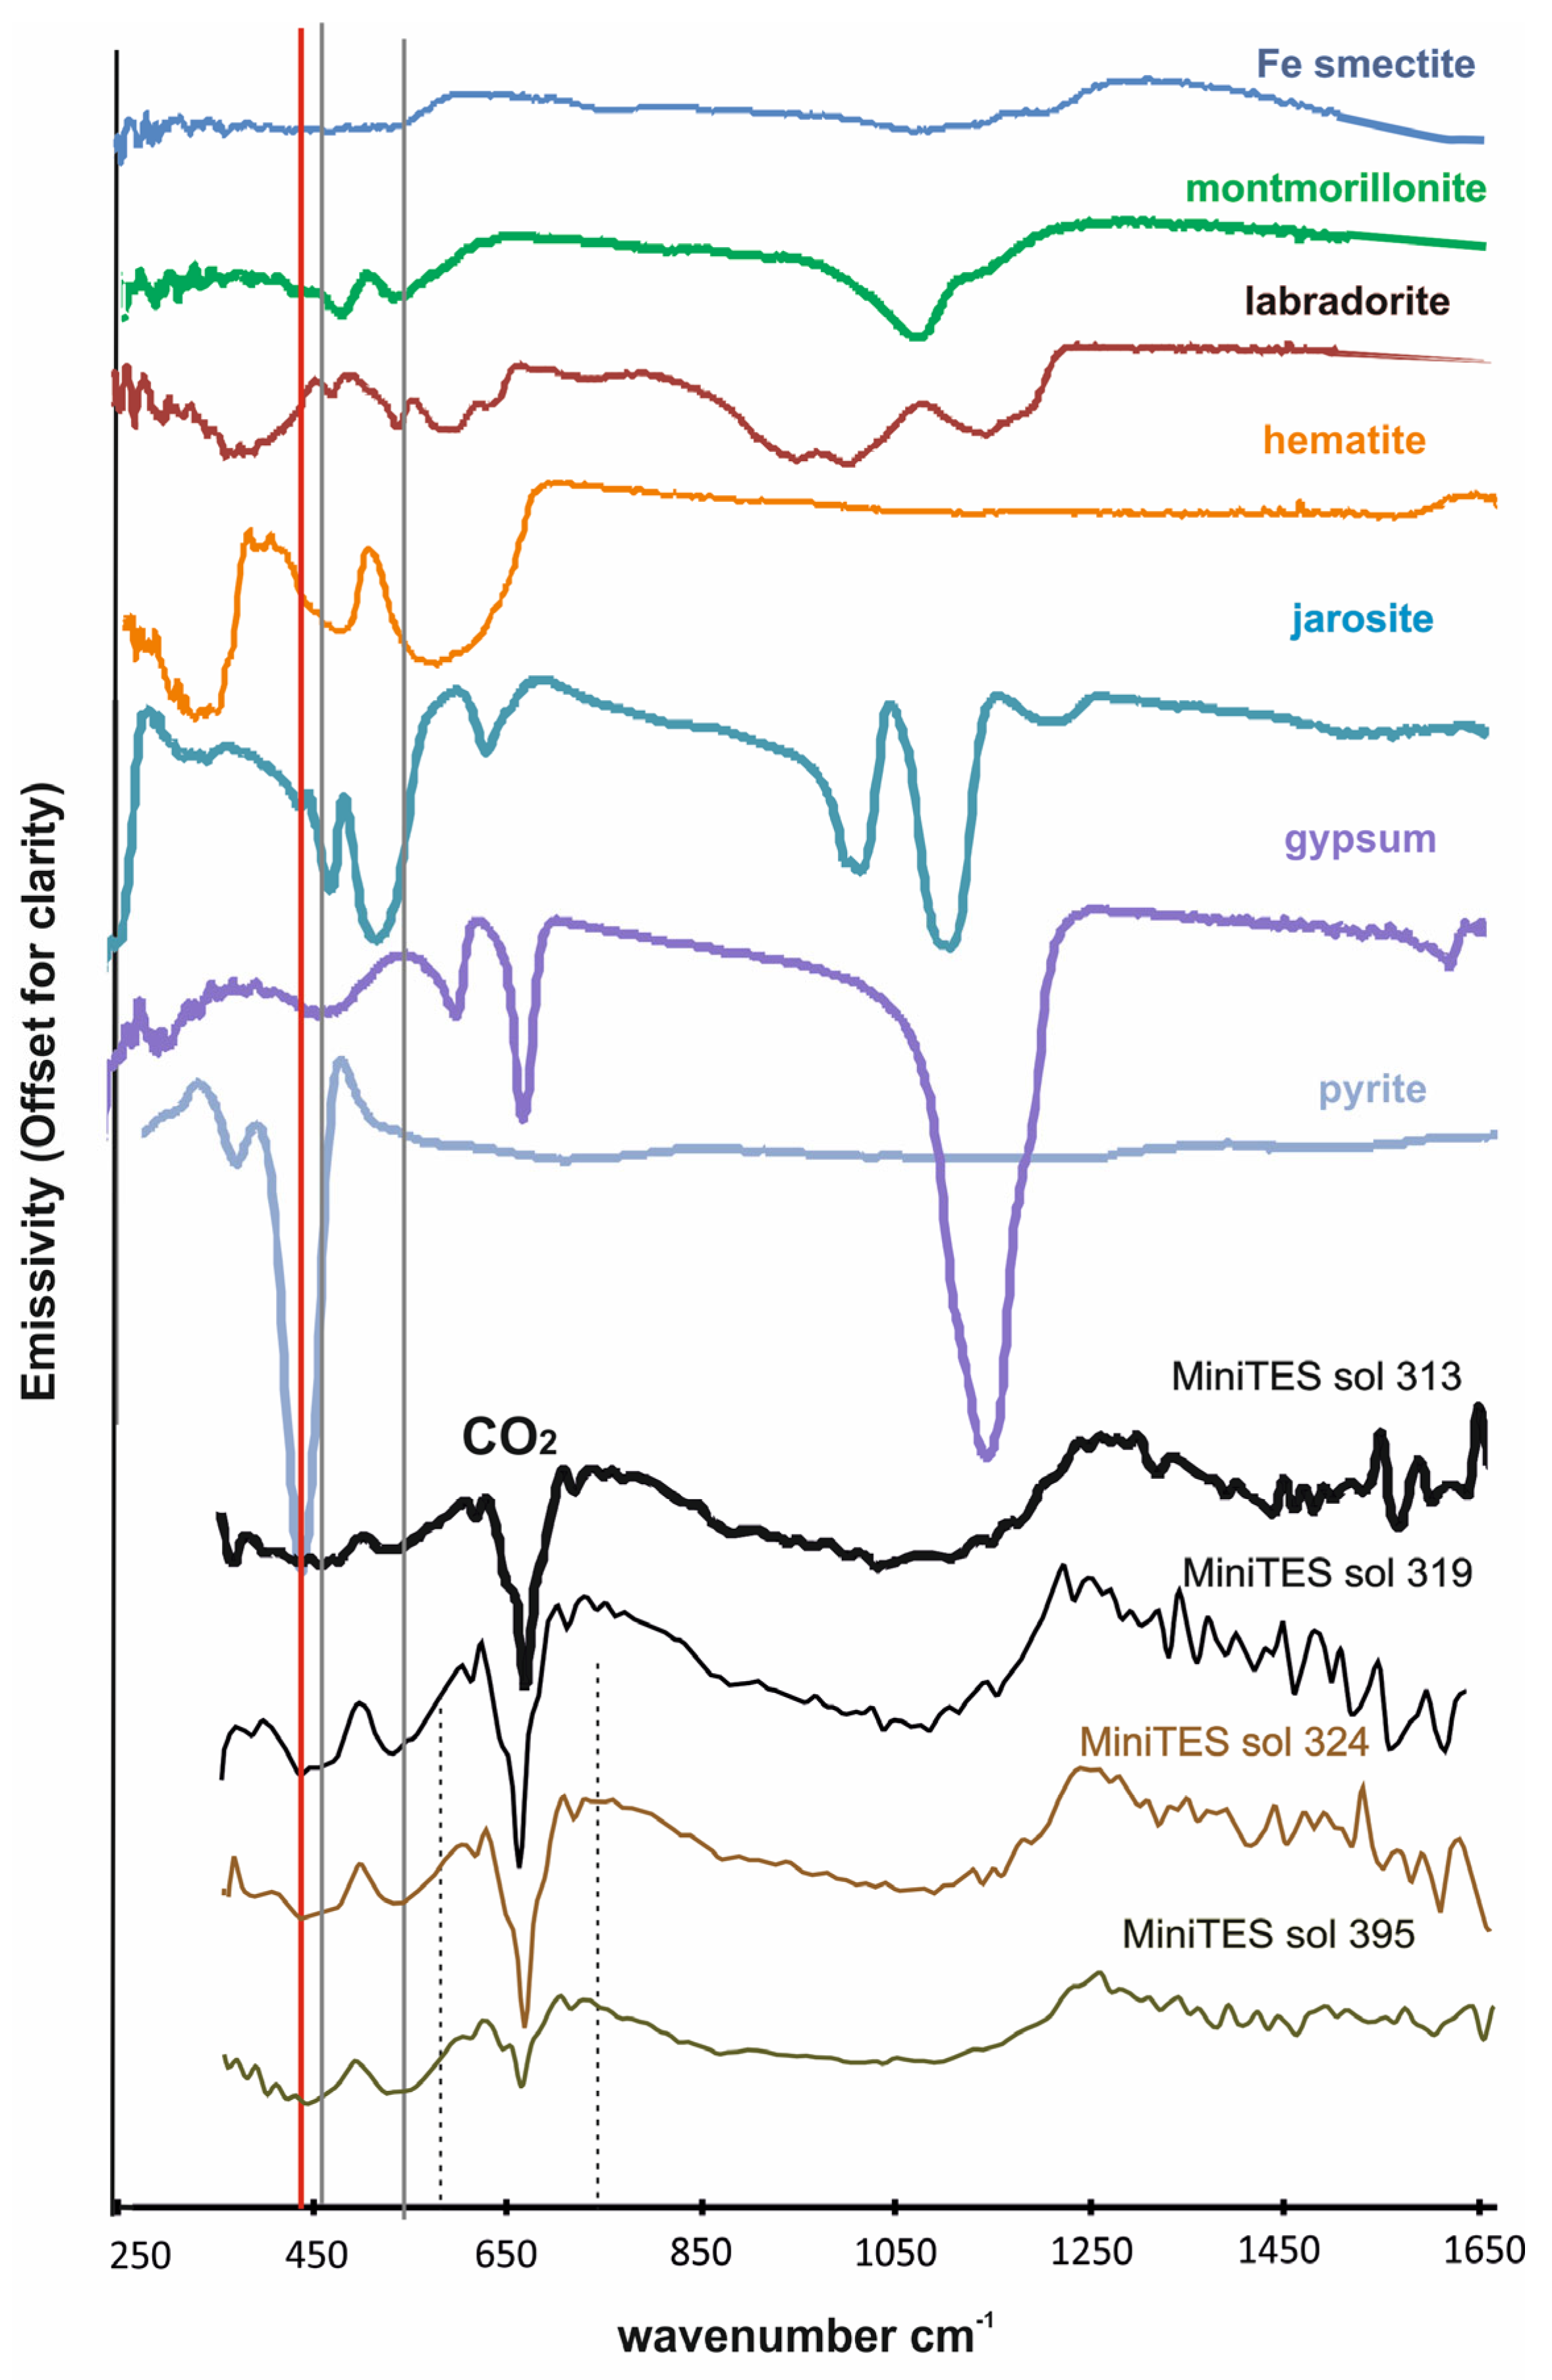
Pyrite is a very interesting mineral, among others, because of its occurrence with various important minerals, including Au, Pt, Cu, and Ni [42]. These metals may be crucial for the future Mars colonies. However, for some reasons pyrite detection by Mini-TES is difficult. This is mainly related to the spectrum in the IR range. An important characteristic peak in the pyrite spectrum is located close to 400 cm−1 (Figure 13). This is close to the border of the range of spectra considered in the current study. This cut-off is forced by the unstable behavior of the measurements outside some range. In addition, the spectra of several minerals also have their peaks in this range [30]. Despite these reservations, the presence of pyrite is very likely. In sector 2, it stays at the level of ~2% (except for one measurement). This does not resemble the behavior of a random error.
It should be noted that the accuracy of the results of the method based on the data from the Mini-TES is 5–10%. This is more than the measured value for pyrite. A single result might therefore be interpreted as the result of an error. For a simple estimate, we can assume the probability of 0.8 that our single result does not indicate the presence of pyrite. However, we obtained similar results systematically for eight independent measurements (in sector 2). In such a situation, the estimated probability of the absence of pyrite (in all of the eight examined locations) will be (0.8)8 = 0.17, i.e., the presence of pyrite in at least one of the locations will be highly probable.
Note also that detecting pyrite from orbit is difficult in the case of a small size of the region with pyrite. Dust in the atmosphere of Mars can also distort the details of the spectrum.
Quartz also appears several times in our numerical solution. However, its amount is too low to consider this result reliable. It appears in a minimal amount (average 0.05%) in quite random sols, so it may be an artifact.

4.5. Comparison with Mossbauer and APXS Results

The Opportunity rover was also equipped with a Mossbauer spectrometer (MB) and Alpha Particle X-ray Spectrometer (APXS). The MB was to perform the mineralogical identification of iron-bearing phases (e.g., oxides, silicates, sulfides, sulfates, and carbonates). The APXS was to determine the elemental composition of Martian soils or rocks. We found two sols during which Mini-TES as well as MB and APXS measurements were taken. These are sols 392 and 393. We used data from [43].
Comparing the data from the Opportunity Mini-TES and APXS instruments, we can see a high SiO2 content (39.4% using the APXS). This is due to the fact that there is a large amount of clay minerals on the surface—aluminosilicates, plagioclase, pyroxene, amphiboles, and olivines. According to our interpretations based on the Mini-TES, the sols 392 and 393 contain about 40% fe–smectites, 30% plagioclase, 3% pyroxene, 7% amphibole, and 2% olivine.
Similarly, the MB detected olivine in the amount of 1%. The APXS detected (in sol 393) phosphorus and calcium indicating apatite, carbonates, and silicates, which are components of basalt. Magnesium indicates olivine, plagioclase, and pyroxene. Aluminum indicates aluminosilicates plagioclase and amphiboles. Our results from the Mini-TES confirm the occurrence of these minerals (see Table 5).
However, comparisons of the sulfur and iron content give a more complicated picture. We must note here that the APXS and MB results are difficult to directly compare with the Mini-TES data. APXS and MB measurements are performed on a small fragment of a selected object (often a rock). The rocks are usually cleaned beforehand. It is common to remove the weathered surface using an abrasive tool. In the discussed case, Omaha (defined as RU, i.e., a rock undisturbed) was examined. By its nature, such an object does not participate in the movements that loose material may undergo. Note that the loose material is also an important object of our considerations. Therefore, direct comparisons of Mini-TES and APXS are not always appropriate.
The object examined by APXS and MB could have been the source of the material eroded and transported to neighboring locations. So, for comparisons, it is worth using our results from the neighboring sites where the Omaha material may be transported.
The sulfur detected by MB is indirectly interpreted as jarosite. The sulfur in our area (sols 392 and 393) indicates gypsum (see Table 5), but in the neighboring sols the Mini-TES spectrum indicates jarosite (sol 395e—~3%).
The potassium identified by APXS may also indicate the presence of jarosite. The same is true for hematite, which occurs in significant quantities. In sector 5 of the rover’s route (in measurements 395a–395d), the Mini-TES indicates hematite occurring at a concentration of 13% (on average).
The titanium detected by APXS indicates ilmenite, which according to the Mini-TES occurs in sol 395 in an amount of about 4%. In sols 392 and 393, according to the Mini-TES analysis, there is no ilmenite.

4.6. The Importance of Research—Discussion

Our study of the surface of a selected part of Meridiani Planum, which contains spherules called blueberries, is also a consequence of the study of terrestrial spherules. Their counterparts on Earth provide valuable information on the conditions favorable to their formation and the geochemical processes that may have taken place on Mars in the past. From the perspective of future exploration and the colonization of Mars, blueberries may constitute potential mineral deposits, including iron ore and other metals necessary for applications in the space industry. Studying analogous structures on Earth helps us better understand their origin and chemical composition, which may facilitate the identification and exploitation of the natural resources on Mars. Remarkably, we identified the presence of pyrite, a geologically important mineral that is often associated with gold and silver deposits on Earth. Previous studies did not detect the presence of pyrite in spectral analyses of the Mars Mini-TES data and mainly relied on averaging Mini-TES spectra over large areas of the rover’s path, which limited the ability to detect local mineralogical anomalies [2].
This discovery opens up new possibilities for the interpretation of the geochemical processes on Mars, including potential hydrothermal mechanisms or reducing environments that could have facilitated sulfide formation. Because the pyrite on Earth is often associated with ore mineralization, its discovery on Mars could have far-reaching implications for future studies of the planet’s potential mineral resources.

5. Conclusions

In this study, we used some of the data from the Mini-TES of the Opportunity rover, which to our knowledge have been less interpreted so far—see Table 2. In general, the results show a similarity in the mineralogy of the neighboring parts of the rover route. This indicates a general similarity of the processes in the Meridiani Planum area. However, along the part of the route we studied, we also encountered clear differences in mineralogy.
One of the significant differences is the variable content of hematite. Despite the occurrence of spherules practically along the entire part of the route we considered, we did not observe hematite in some sectors. We interpret this as the effect of hematite leaching from the concretions present there. We observe a similar phenomenon on terrestrial spherules. This indicates that terrestrial and Martian concretions may have an analogous origin.
Another interesting result is the finding of a small but systematic content of pyrite in sector 2. Pyrite often accompanies economically important minerals. Unfortunately, current data are not sufficient to determine whether minerals associated with pyrite are actually present along the rover’s path.
We will continue to study the remaining parts of the Opportunity and Spirit rover routes.
We also are planning an extension of this study to other areas (e.g., Chryse Planitia, [44]). Our current results on the interpretation of infrared spectra (e.g., TES and also Martian meteorites) may help explain some of the structures observed there [45].

Author Contributions

Conceptualization, Z.N. and L.C.; methodology, L.C. and Z.N.; software, L.C.; calculations, L.C.; validation, L.C. and Z.N.; investigation, L.C. and Z.N.; writing—original draft preparation, L.C. and Z.N.; writing—review and editing, L.C. and Z.N.; project administration, Z.N.; funding acquisition, Z.N. All authors have read and agreed to the published version of the manuscript.

Funding

This study was partly supported by grant no: 852-3-17-12 FBW N. Zalewska TT/407 through the statutory project of the Space Research Center PAS. The authors would like to thank the Space Research Centre PAS for their support during research.

Data Availability Statement

The original contributions presented in the study are included in the article, further inquiries can be directed to the corresponding author.

Acknowledgments

In this research, we used data obtained by the Opportunity mission rover, from the Planetary Data System https://pds-geosciences.wustl.edu/missions/mer/geo_mer_datasets.htm (accessed on 29 April 2025).

Conflicts of Interest

The authors declare no conflict of interest.

References

  1. MER Mission. Available online: https://an.rsl.wustl.edu/help/Content/About%20the%20mission/MER/MER%20mission.htm (accessed on 21 December 2024).
  2. Calvin, W.M.; Shoffner, J.D.; Johnson, J.R.; Knoll, A.H.; Pocock, J.M.; Squyres, S.W.; Weitz, C.M.; Arvidson, R.E.; Bell, J.F., III; Christensen, P.R.; et al. Hematite spherules at Meridiani: Results from MI, Mini-TES, and Pancam. J. Geophys. Res. Planets 2008, 113, E12S37. [Google Scholar] [CrossRef]
  3. Fairén, A.G.; Dohm, J.M.; Baker, V.R.; Thompson, S.D.; Mahaney, W.C.; Herkenhoff, K.E.; Rodríguez, J.A.P.; Davila, A.F.; Schulze-Makuch, D.; El Maarry, M.R.; et al. Meteorites at Meridiani Planum provide evidence for significant amounts of surface and near-surface water on early Mars. Meteorit. Planet. Sci. 2011, 46, 1832–1841. [Google Scholar] [CrossRef]
  4. Squyres, S.W.; Knoll, A.H.; Arvidson, R.E.; Ashley, J.W.; Bell, J.F., III; Calvin, W.M.; Christensen, P.R.; Clark, B.C.; Cohen, B.A.; Yingst, R.A.; et al. Exploration of Victoria Crater by the Mars Rover Opportunity. Science 2009, 324, 1058–1061. [Google Scholar] [CrossRef]
  5. Hughes, M.N.; Arvidson, R.E.; Grant, J.A.; Wilson, S.A.; Howard, A.D.; Golombek, M.P. Degradation of Endeavour Crater Based on Orbital and Rover-Based Observations in Combination with Landscape Evolution Modeling. J. Geophys. Res. Planets 2019, 124, 1472–1494. [Google Scholar] [CrossRef]
  6. Christensen, P.R.; Mehall, G.L.; Silverman, S.H.; Anwar, S.; Cannon, G.; Gorelick, N.; Kheen, R.; Tourville, T.; Bates, D.; Ferry, S.; et al. Miniature Thermal Emission Spectrometer for the Mars Exploration Rovers. J. Geophys. Res. Planets 2003, 108, 8064. [Google Scholar] [CrossRef]
  7. Miniature Thermal Emission Spectrometer (Mini-TES). Available online: https://an.rsl.wustl.edu/help/Content/About%20the%20mission/MER/Instruments/MTES.htm?tocpath=About%20the%20missions%7CMER%20(Opportunity%20and%20Spirit)%7CInstruments%7C_____10 (accessed on 29 April 2025).
  8. Alpha Particle X-Ray Spectrometer (APXS). Available online: https://an.rsl.wustl.edu/help/Content/About%20the%20mission/MER/Instruments/MER%20APXS.htm?tocpath=About%20the%20missions%7CMER%20(Opportunity%20and%20Spirit)%7CInstruments%7C_____2 (accessed on 29 April 2025).
  9. Mössbauer Spectrometer (MB). Available online: https://an.rsl.wustl.edu/help/Content/About%20the%20mission/MER/Instruments/Moessbauer%20Spectrometer.htm?tocpath=About%20the%20missions%7CMER%20(Opportunity%20and%20Spirit)%7CInstruments%7C_____9 (accessed on 29 April 2025).
  10. Farmer, V.C. The Infrared Spectra of Minerals; Mineralogical Society: London, UK, 1974; 539p. [Google Scholar]
  11. Christensen, P.R.; Bandfield, J.L.; Hamilton, V.E.; Ruff, S.W.; Kieffer, H.H.; Titus, T.N.; Malin, M.C.; Morris, R.V.; Lane, M.D.; Clark, R.L.; et al. Mars Global Surveyor Thermal Emission Spectrometer experiment: Investigation description and surface science results. J. Geophys. Res. Planets 2001, 106, 23823–23871. [Google Scholar] [CrossRef]
  12. Morris, R.V.; Graff, T.G. Athena instrument validation and data library development for the Mars Exploration Rover (MER) Mission. Eos Trans. AGU 2002, 83, P21C-03. [Google Scholar]
  13. Wray, J.J.; Dobrea, E.Z.N.; Arvidson, R.E.; Wiseman, S.M.; Squyres, S.W.; McEwen, A.S.; Mustard, J.F.; Murchie, S.L. Phyllosilicates and sulfates at Endeavour Crater, Meridiani Planum, Mars. Geophys. Res. Lett. 2009, 36, L21201. [Google Scholar] [CrossRef]
  14. Bibring, J.-P.; Langevin, Y.; Mustard, J.F.; Poulet, F.; Arvidson, R.; Gendrin, A.; Gondet, B.; Mangold, N.; Pinet, P.; Forget, F.; et al. Global Mineralogical and Aqueous Mars History Derived from OMEGA/Mars Express Data. Science 2006, 312, 400–404. [Google Scholar] [CrossRef]
  15. Hynek, B.M.; Di Achille, G. Geologic Map of Meridiani Planum, Mars (Ver. 1.1, April 2017); Scientific Investigations Map 3356; U.S. Geological Survey: Reston, VA, USA, 2017. [Google Scholar] [CrossRef]
  16. Watters, T.R.; Leuschen, C.J.; Campbell, B.A.; Morgan, G.A.; Cicchetti, A.; Grant, J.A.; Phillips, R.J.; Plaut, J.J. Radar sounder evidence of thick, porous sediments in Meridiani Planum and implications for ice-filled depos-its on Mars. Geophys. Res. Lett. 2017, 44, 9208–9215. [Google Scholar] [CrossRef]
  17. Grotzinger, J.P.; Arvidson, R.E.; Bell, J.F., III; Calvin, W.; Clark, B.C.; Fike, D.A.; Golombek, M.; Greeley, R.; Halde-mann, A.; Herkenhoff, K.E.; et al. Stratigraphy and sedimentology of a dry to wet eolian depositional system, Burns formation, Meridiani Planum. Mars Earth Planet. Sci. Lett. 2005, 240, 11–72. [Google Scholar] [CrossRef]
  18. Golombek, M.P.; Warner, N.H.; Ganti, V.; Lamb, M.P.; Parker, T.J.; Fergason, R.L.; Sullivan, R. Small crater modification on Meridiani Planum and implications for erosion rates and climate change on Mars. JGR Planets 2014, 119, 2522–2547. [Google Scholar] [CrossRef]
  19. Golombek, M.P.; Grant, J.A.; Parker, T.J.; Kass, D.M.; Crisp, J.A.; Squyres, S.W.; Haldemann, A.F.C.; Adler, M.; Lee, W.J.; Bridges, N.T.; et al. Selection of the Mars Exploration Rover landing sites. JGR Planets 2003, 108, E12. [Google Scholar] [CrossRef]
  20. Fergason, R.L.; Christensen, P.R.; Kieffer, H.H. High-resolution thermal inertia derived from the Thermal Emission Imaging System (THEMIS): Thermal model and applications. JGR Planets 2006, 111, E12. [Google Scholar] [CrossRef]
  21. Christensen, P.R.; Wyatt, M.B.; Glotch, T.D.; Rogers, A.D.; Anwar, S.; Arvidson, R.E.; Bandfield, J.L.; Blaney, D.L.; Budney, C.; Calvin, W.M.; et al. Mineralogy at Meridiani Planum from the Mini-TES Experiment on the Opportunity Rover. Science 2004, 306, 1733–1739. [Google Scholar] [CrossRef] [PubMed]
  22. Rogers, A.D.; Aharonson, O. Mineralogical composition of sands in Meridiani Planum determined from Mars Exploration Rover data and comparison to orbital measurements. J. Geophys. Res. Planets 2008, 113, E06S14. [Google Scholar] [CrossRef]
  23. Weitz, C.M.; Anderson, R.C.; Bell, J.F., III; Farrand, W.H.; Herkenhoff, K.E.; Johnson, J.R.; Jolliff, B.L.; Morris, R.V.; Squyres, S.W.; Sullivan, R.J. Soil grain analyses at Meridiani Planum, Mars. J. Geophys. Res. Planets 2006, 111, E12S04. [Google Scholar] [CrossRef]
  24. Available online: http://www.psrd.hawaii.edu/July12/water-inside-Mars.html (accessed on 29 April 2025).
  25. Hoefen, T.M.; Clark, R.N.; Bandfield, J.L.; Smith, M.D.; Pearl, J.C.; Christensen, P.R. Discovery of Olivine in the Nili Fossae Region of Mars. Science 2003, 302, 627–630. [Google Scholar] [CrossRef]
  26. McSween, H.Y.; Wyatt, M.B.; Gellert, R.; Bell, J.F., III; Morris, R.V.; Herkenhoff, K.E.; Crumpler, L.S.; Milam, K.A.; Stockstill, K.R.; Tornabene, L.L.; et al. Characterization and petrologic interpretation of olivine-rich basalts at Gusev Crater, Mars. J. Geophys. Res. Planets 2006, 111, E02S10. [Google Scholar] [CrossRef]
  27. Christensen, P.R.; Ruff, S.W. Formation of the hematite-bearing unit in Meridiani Planum: Evidence for deposition in standing water. J. Geophys. Res. Planets 2004, 109, E08003. [Google Scholar] [CrossRef]
  28. Liu, Y.; Ma, C. Monazite in Martian breccia meteorite NWA 7034. In Proceedings of the Eighth International Conference on Mars Polar Science and Exploration, Whitehorse, YT, Canada, 8–12 July 2014; Available online: https://www.hou.usra.edu/meetings/8thmars2014/ (accessed on 29 April 2025).
  29. Klingelhofer, G.; Morris, R.V.; Bernhardt, B.; Schroder, C.; Rodionov, D.S.; de Souza, P.A., Jr.; Yen, A.; Gellert, R.; Evlanov, E.N.; Zubkov, B.; et al. Jarosite and Hematite at Meridiani Planumfrom Opportunity’s Mossbauer Spectrometer. Science 2004, 306, 1740–1745. [Google Scholar] [CrossRef] [PubMed]
  30. Ciążela, J.; Bakala, J.; Kowalinski, M.; Plocieniak, S.; Zalewska, N.; Pieterek, B.; Mrozek, T.; Ciazela, M.; Paslawski, G.; Steslicki, M.; et al. Concept and Design of Martian Far-IR ORE Spectrometer (MIRORES). Remote Sens. 2022, 14, 2799. [Google Scholar] [CrossRef]
  31. Lorand, J.-P.; Hewins, R.H.; Remusat, L.; Zanda, B.; Pont, S.; Leroux, H.; Marinova, M.; Jacob, D.; Humayun, M.; Nemchin, A.; et al. Nickeliferous pyrite tracks pervasive hydrothermal alteration in Martian regolith breccia: A study in NWA 7533. Meteorit. Planet. Sci. 2015, 50, 2099–2120. Available online: https://onlinelibrary.wiley.com/doi/10.1111/maps.12565 (accessed on 29 April 2025). [CrossRef]
  32. McAdam, A.C.; Franz, H.B.; Sutter, B.; Archer, P.D., Jr.; Freissinet, C.; Eigenbrode, J.L.; Ming, D.W.; Atreya, S.K.; Bish, D.L.; Blake, D.F.; et al. Sulfur-bearing phases detected by evolved gas analysis of the Rocknest aeolian deposit, Gale Crater, Mars. J. Geophys. Res. Planets 2014, 119, 373–393. [Google Scholar] [CrossRef]
  33. Vaniman, D.T.; Bish, D.L.; Ming, D.W.; Bristow, T.F.; Morris, R.V.; Blake, D.F.; Chipera, S.J.; Morrison, S.M.; Treiman, A.H.; Rampe, E.B.; et al. Mineralogy of a Mudstone at Yellowknife Bay, Gale Crater, Mars. Science 2014, 343, 1243480. [Google Scholar] [CrossRef]
  34. Wong, G.M.; Franz, H.B.; Clark, J.V.; McAdam, A.C.; Lewis, J.M.T.; Millan, M.; Ming, D.W.; Gomez, F.; Eigenbrode, J.L.; Navarro-González, R. Oxidized and Reduced Sulfur Observed by the Sample Analysis at Mars (SAM) Instrument Suite on the Curiosity Rover Within the Glen Torridon Region at Gale Crater, Mars. JGR Planets 2021, 127, e2021JE007084. [Google Scholar] [CrossRef]
  35. Smith, M.R.; Bandfield, J.L. Geology of quartz and hydrated silica-bearing depositsnear Antoniadi Crater, Mars. J. Geophys. Res. Planets 2012, 117, E06007. [Google Scholar] [CrossRef]
  36. Payré, V.; Siebach, K.L.; Thorpe, M.T.; Antoshechkina, P.; Rampe, E.B. Tridymite in a lacustrine mudstone in Gale Crater, Mars: Evidence for an explosive silicic eruption during the Hesperian. Earth Planet. Sci. Lett. 2022, 594, 117694. [Google Scholar] [CrossRef]
  37. Tomkins, A.G.; Johnson, T.E.; Mitchell, J.T. A review of the chondrite–achondrite transition, and a meta-morphic facies series for equilibrated primitive stony meteorites. Meteorit. Planet. Sci. 2020, 55, 857–885. [Google Scholar] [CrossRef]
  38. Chan, M.A.; Beitler, B.; Parry, W.T.; Ormö, J.; Komatsu, G. Red rock and red planet diagenesis: Comparisons of Earth and Mars concretions. GSA Today 2005, 15, 4–10. Available online: https://scispace.com/pdf/red-rock-and-red-planet-diagenesis-comparisons-of-earth-and-weim3y3oou.pdf (accessed on 29 April 2025). [CrossRef]
  39. Zalewska, N.; Czechowski, L.; Borowska, E. X-ray measurements of terrestrial concretions as analogues of Martian concretions “blueberries” from Meridiani Planum. In Proceedings of the 54th Lunar and Planetary Science Conference, Houston, TX, USA, 13–17 March 2023; Available online: https://www.hou.usra.edu/meetings/lpsc2023/pdf/2932.pdf (accessed on 29 April 2025).
  40. Parry, W. Composition, nucleation, and growth of iron oxide concretions. Sediment. Geol. 2011, 233, 53–68. [Google Scholar] [CrossRef]
  41. Eberl, D.D. On the formation of Martian blueberries. Am. Mineral. 2022, 107, 153–155. [Google Scholar] [CrossRef]
  42. Ciążela, J.; Bakala, J.; Kowalinski, M.; Pieterek, B.; Steslicki, M.; Ciążela, M.; Paslawski, G.; Zalewska, N.; Sterczewski, L.; Szaforz, Z.; et al. Lunar ore geology and feasibility of ore mineral detection using a far-IR spectrometer. Front. Earth Sci. 2023, 11, 1190825. [Google Scholar] [CrossRef]
  43. Morris, R.V.; Klingelhöfer, G.; Schröder, C.; Rodionov, D.S.; Yen, A.; Ming, D.W.; de Souza, P.A., Jr.; Wdowiak, T.; Fleischer, I.; Gellert, R.; et al. Mössbauer mineralogy of rock, soil, and dust at Meridiani Planum, Mars: Opportunity’s journey across sulfate-rich outcrop, basaltic sand and dust, and hematite lag deposits. J. Geophys. Res. Planets 2006, 111, E12S15. [Google Scholar] [CrossRef]
  44. Czechowski, L.; Zalewska, N.; Zambrowska, A.; Ciazela, M.; Witek, P.; Kotlarz, J. The formation of cone chains in the Chryse Planitia region on Mars and the thermodynamic aspects of this process. Icarus 2023, 396, 115473. [Google Scholar] [CrossRef]
  45. Wittmann, A.; Korotev, R.L.; Jolliff, B.L.; Irving, A.J.; Moser, D.E.; Barker, I.; Rumble, D., III. Petrography and composition of Martian regolith breccia meteorite Northwest Africa 7475. Meteorit. Planet. Sci. 2015, 50, 326–352. [Google Scholar] [CrossRef]
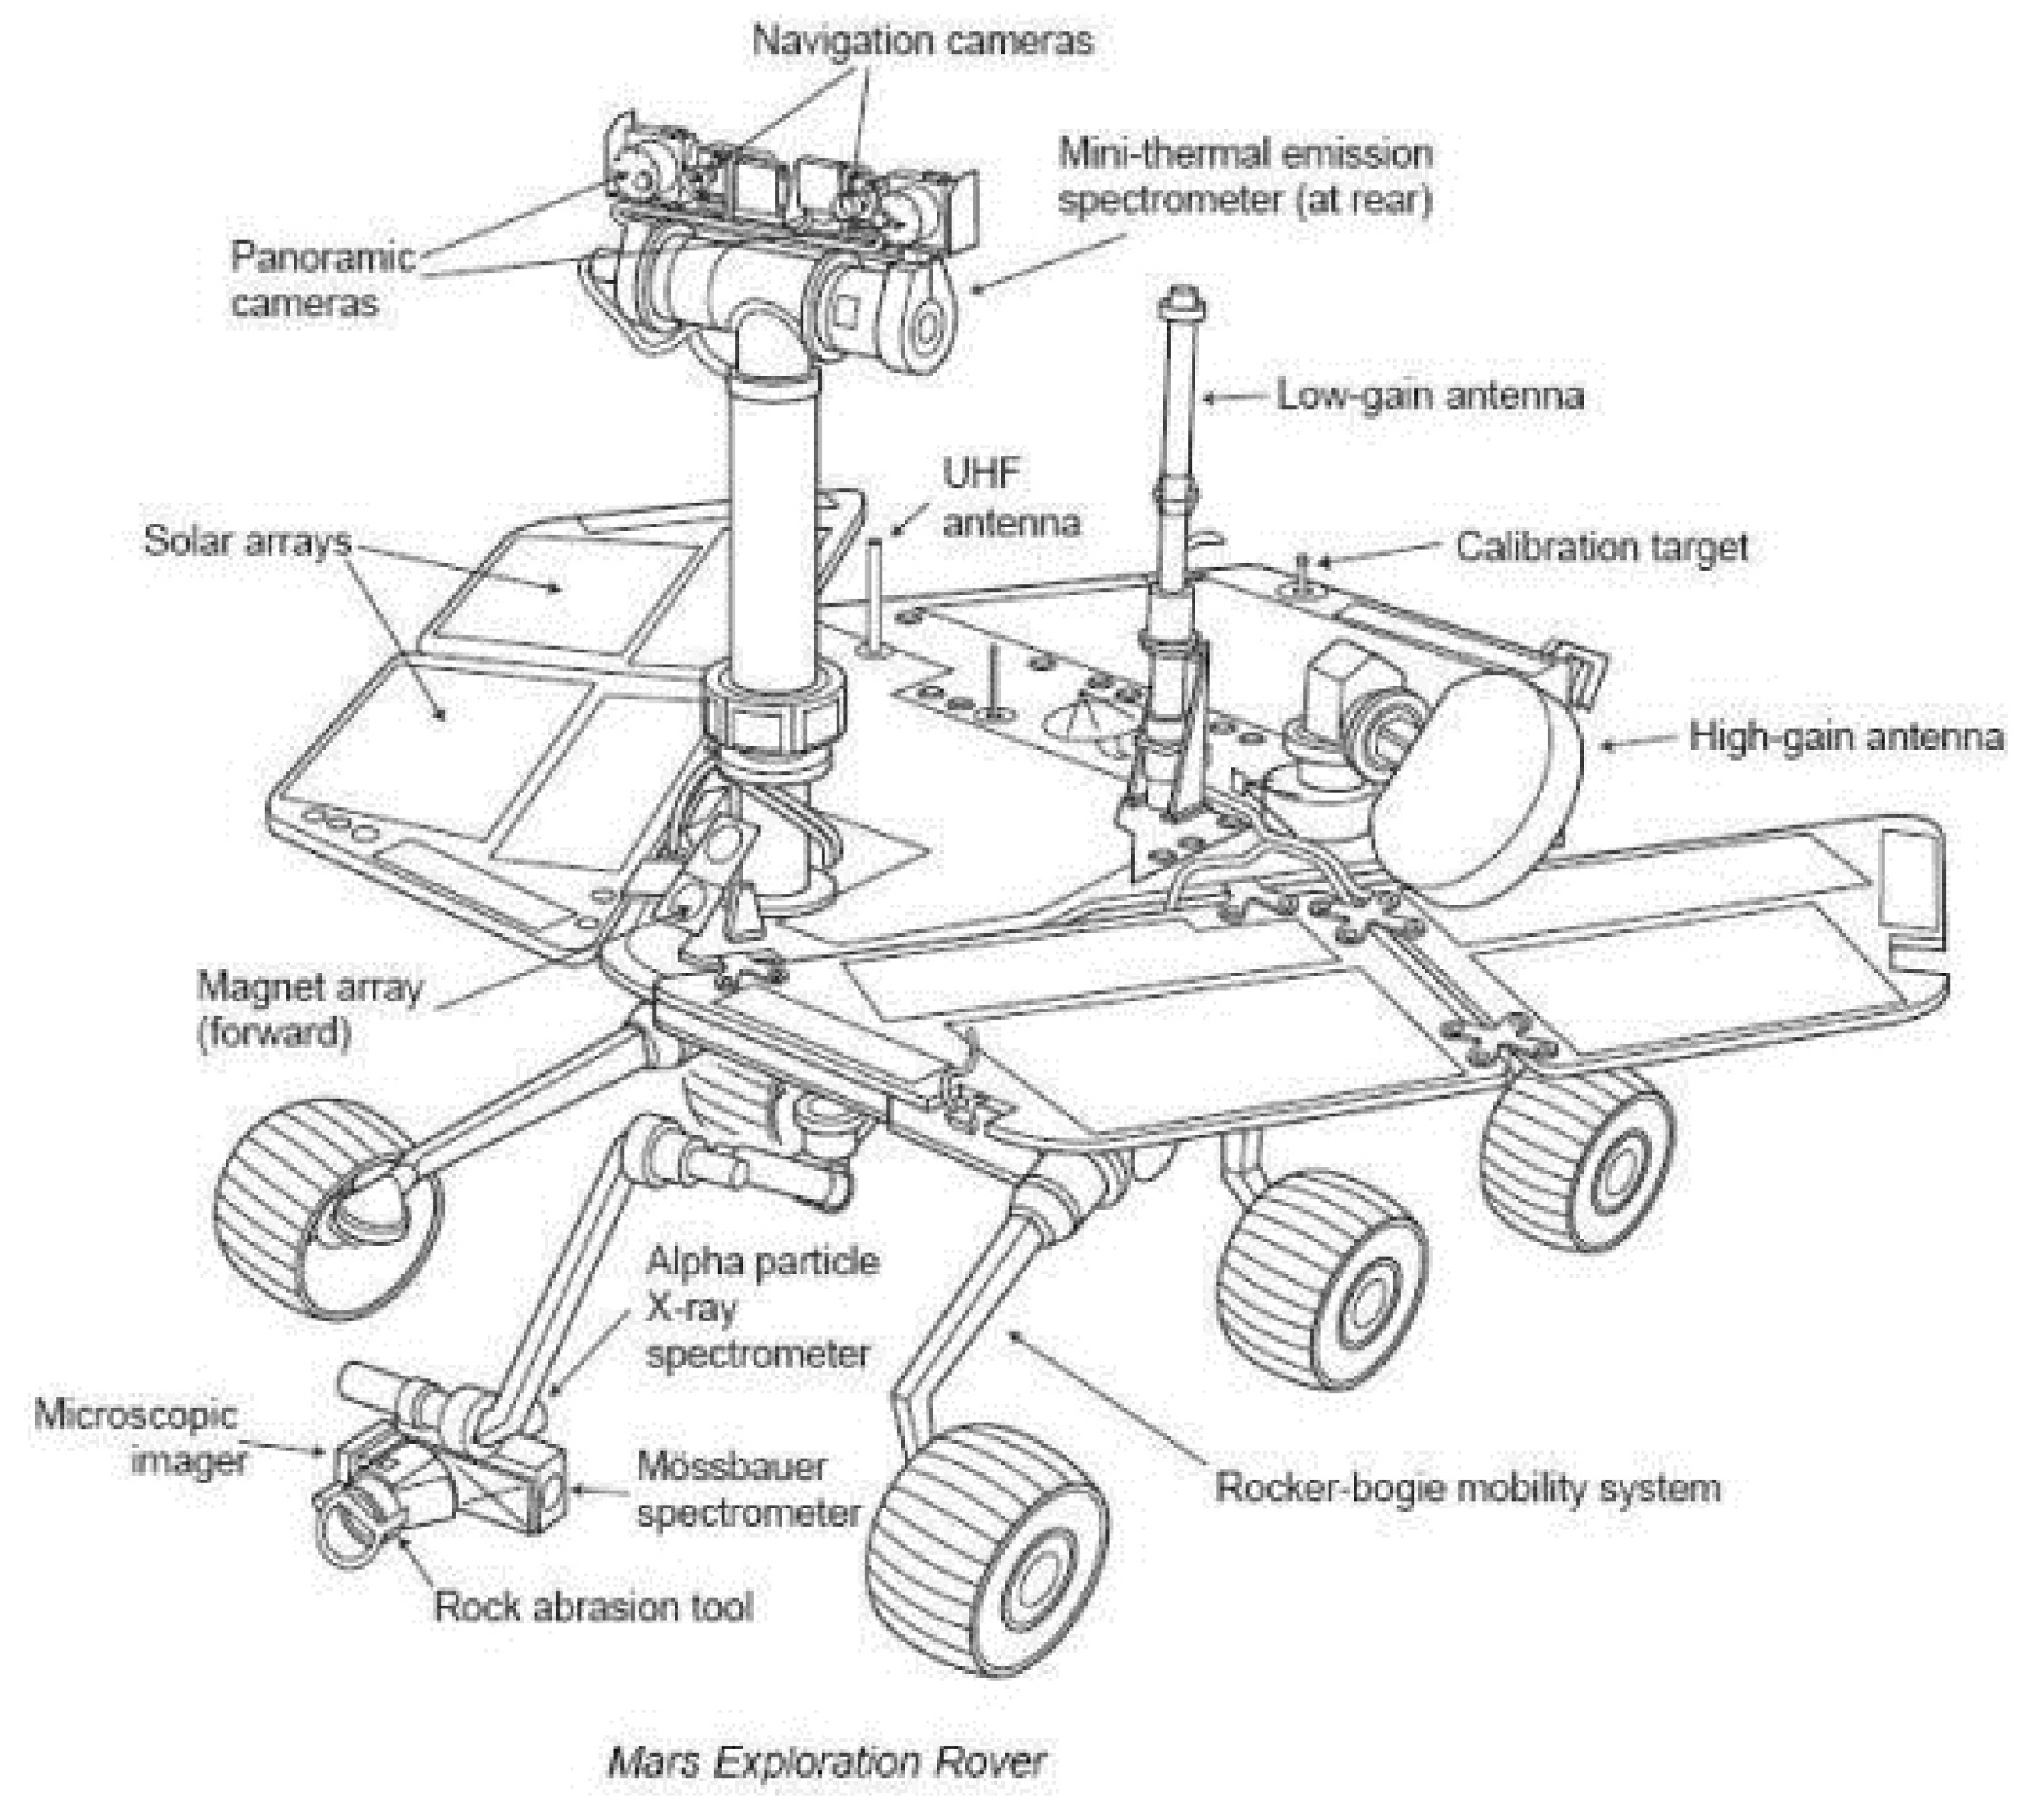
Figure 1. Schematic drawing of Mars Exploration Rover. Image by NASA. Source: https://en.wikipedia.org/wiki/Mars_Exploration_Rover#/media/File:Mars_Exploration_Rover.svg (accessed on 17 May 2025). Note positions of Mini-TES mounted on the Pancam Mast Assembly (PMA, on the upper part of the rover). The microscopic camera, rock abrasion tool, MB, and APXS are mounted on a moving arm known as the Instrument Deployment Device (IDD, just above the ground).
Remotesensing 17 01981 g001
Figure 2. Examples of spherules: (A). Martian spherules taken with a microscopic camera, with visible spherules on the surface in sol 319. (B). Utah spherules from the Dakota Formation (Lower Cretaceous), with leached iron oxides. Visible spherules fused due to mineralization and single ones. Spherule diameter is about 1 cm. (C). Moqui marbles spherules from the Navajo Formation (Upper Jurassic) covered with iron oxides. Spherule diameter is about 4–5 cm. Photos (B,C) taken by Natalia Zalewska.
Remotesensing 17 01981 g002
Figure 3. Geological map of Meridiani Planum, Mars, created by Brian Hynek and Gaetano Di Achille (2017) [15]. The red star marks the landing site of the Opportunity rover. Credit to USGS. Remotesensing 17 01981 i001 The red star marks the landing site of the Opportunity rover.
Remotesensing 17 01981 g003
Figure 6. Sample images from the Opportunity rover’s cameras. They show several types of geomorphologic context of the sites where Mini-TES measurements were made. The purple spot (later added to the camera image) indicates very approximate locations of Mini-TES measurements. Sectors and measurements numbers are as follows: (A) is from sector 1, 1T156144440EMR38H7P3575N0A1, (BD) are from sector 2, 1T156500733EMR3940P3575N0A1, 1T156677094EMR3981P3575N0A1, 1T157403816RDR40A3P3924N0A1, (E) is from sector 3, 1t162093577EMR4336P3575N0A1, and (F) is from sector 4, 1T162716469EMR4700P3972N0A.
Remotesensing 17 01981 g006
Figure 7. Range of emissivity obtained from Mini-TES around the CO2 peak. In practice, we eliminated the range between 600 and 740 cm−1 from the interpretation. We also considered other methods of treating this peak (see text). The horizontal scale (wave number) is in cm−1, and the vertical scale (emissivity) is dimensionless. The legend gives the consecutive measurement numbers (ICK) in the series.
Remotesensing 17 01981 g007
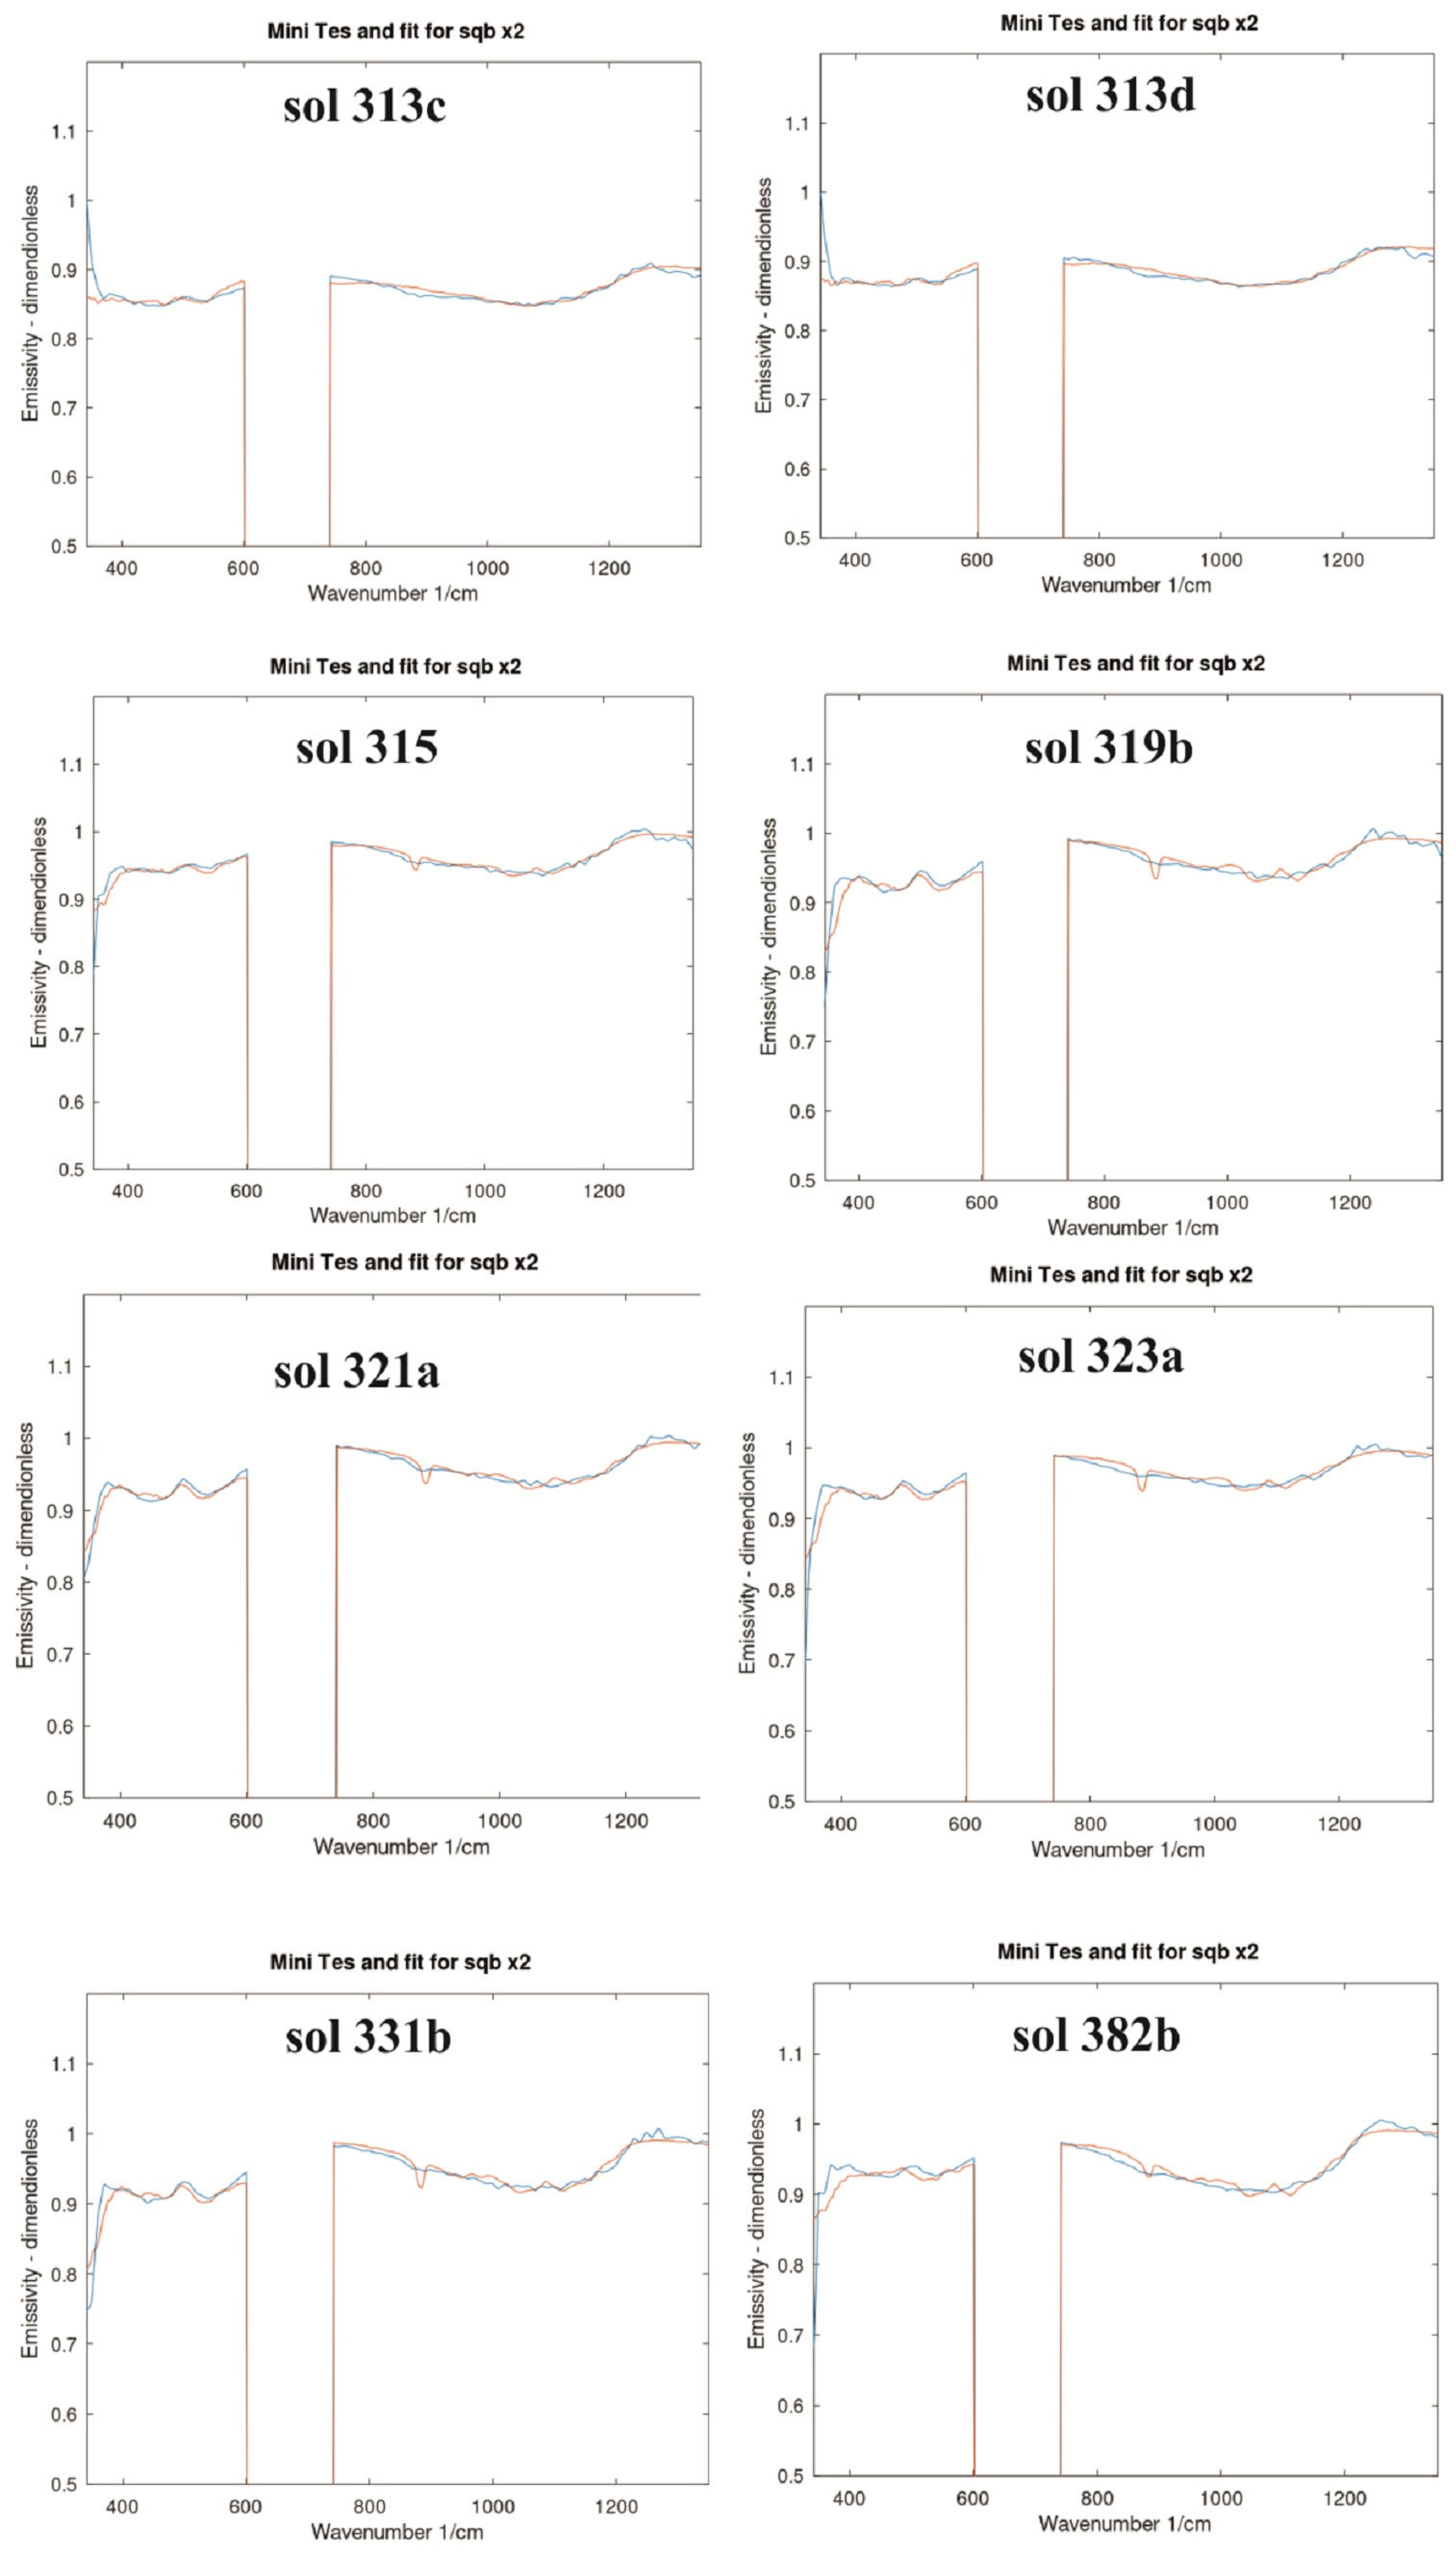
Figure 8. Examples of fitting a 23-mineral mixture to a Mini-TES spectrum, with cut CO2, and matching mainly pyrite and hematite (319b, 321a, 323a, 331b). Hematite and pyrite do not occur in sol fit 313c. Hematite without pyrite occurs in fit 382b. Blue line- spectrum MiniTES, red line- spectrum of 23-mineral mixture.
Remotesensing 17 01981 g008
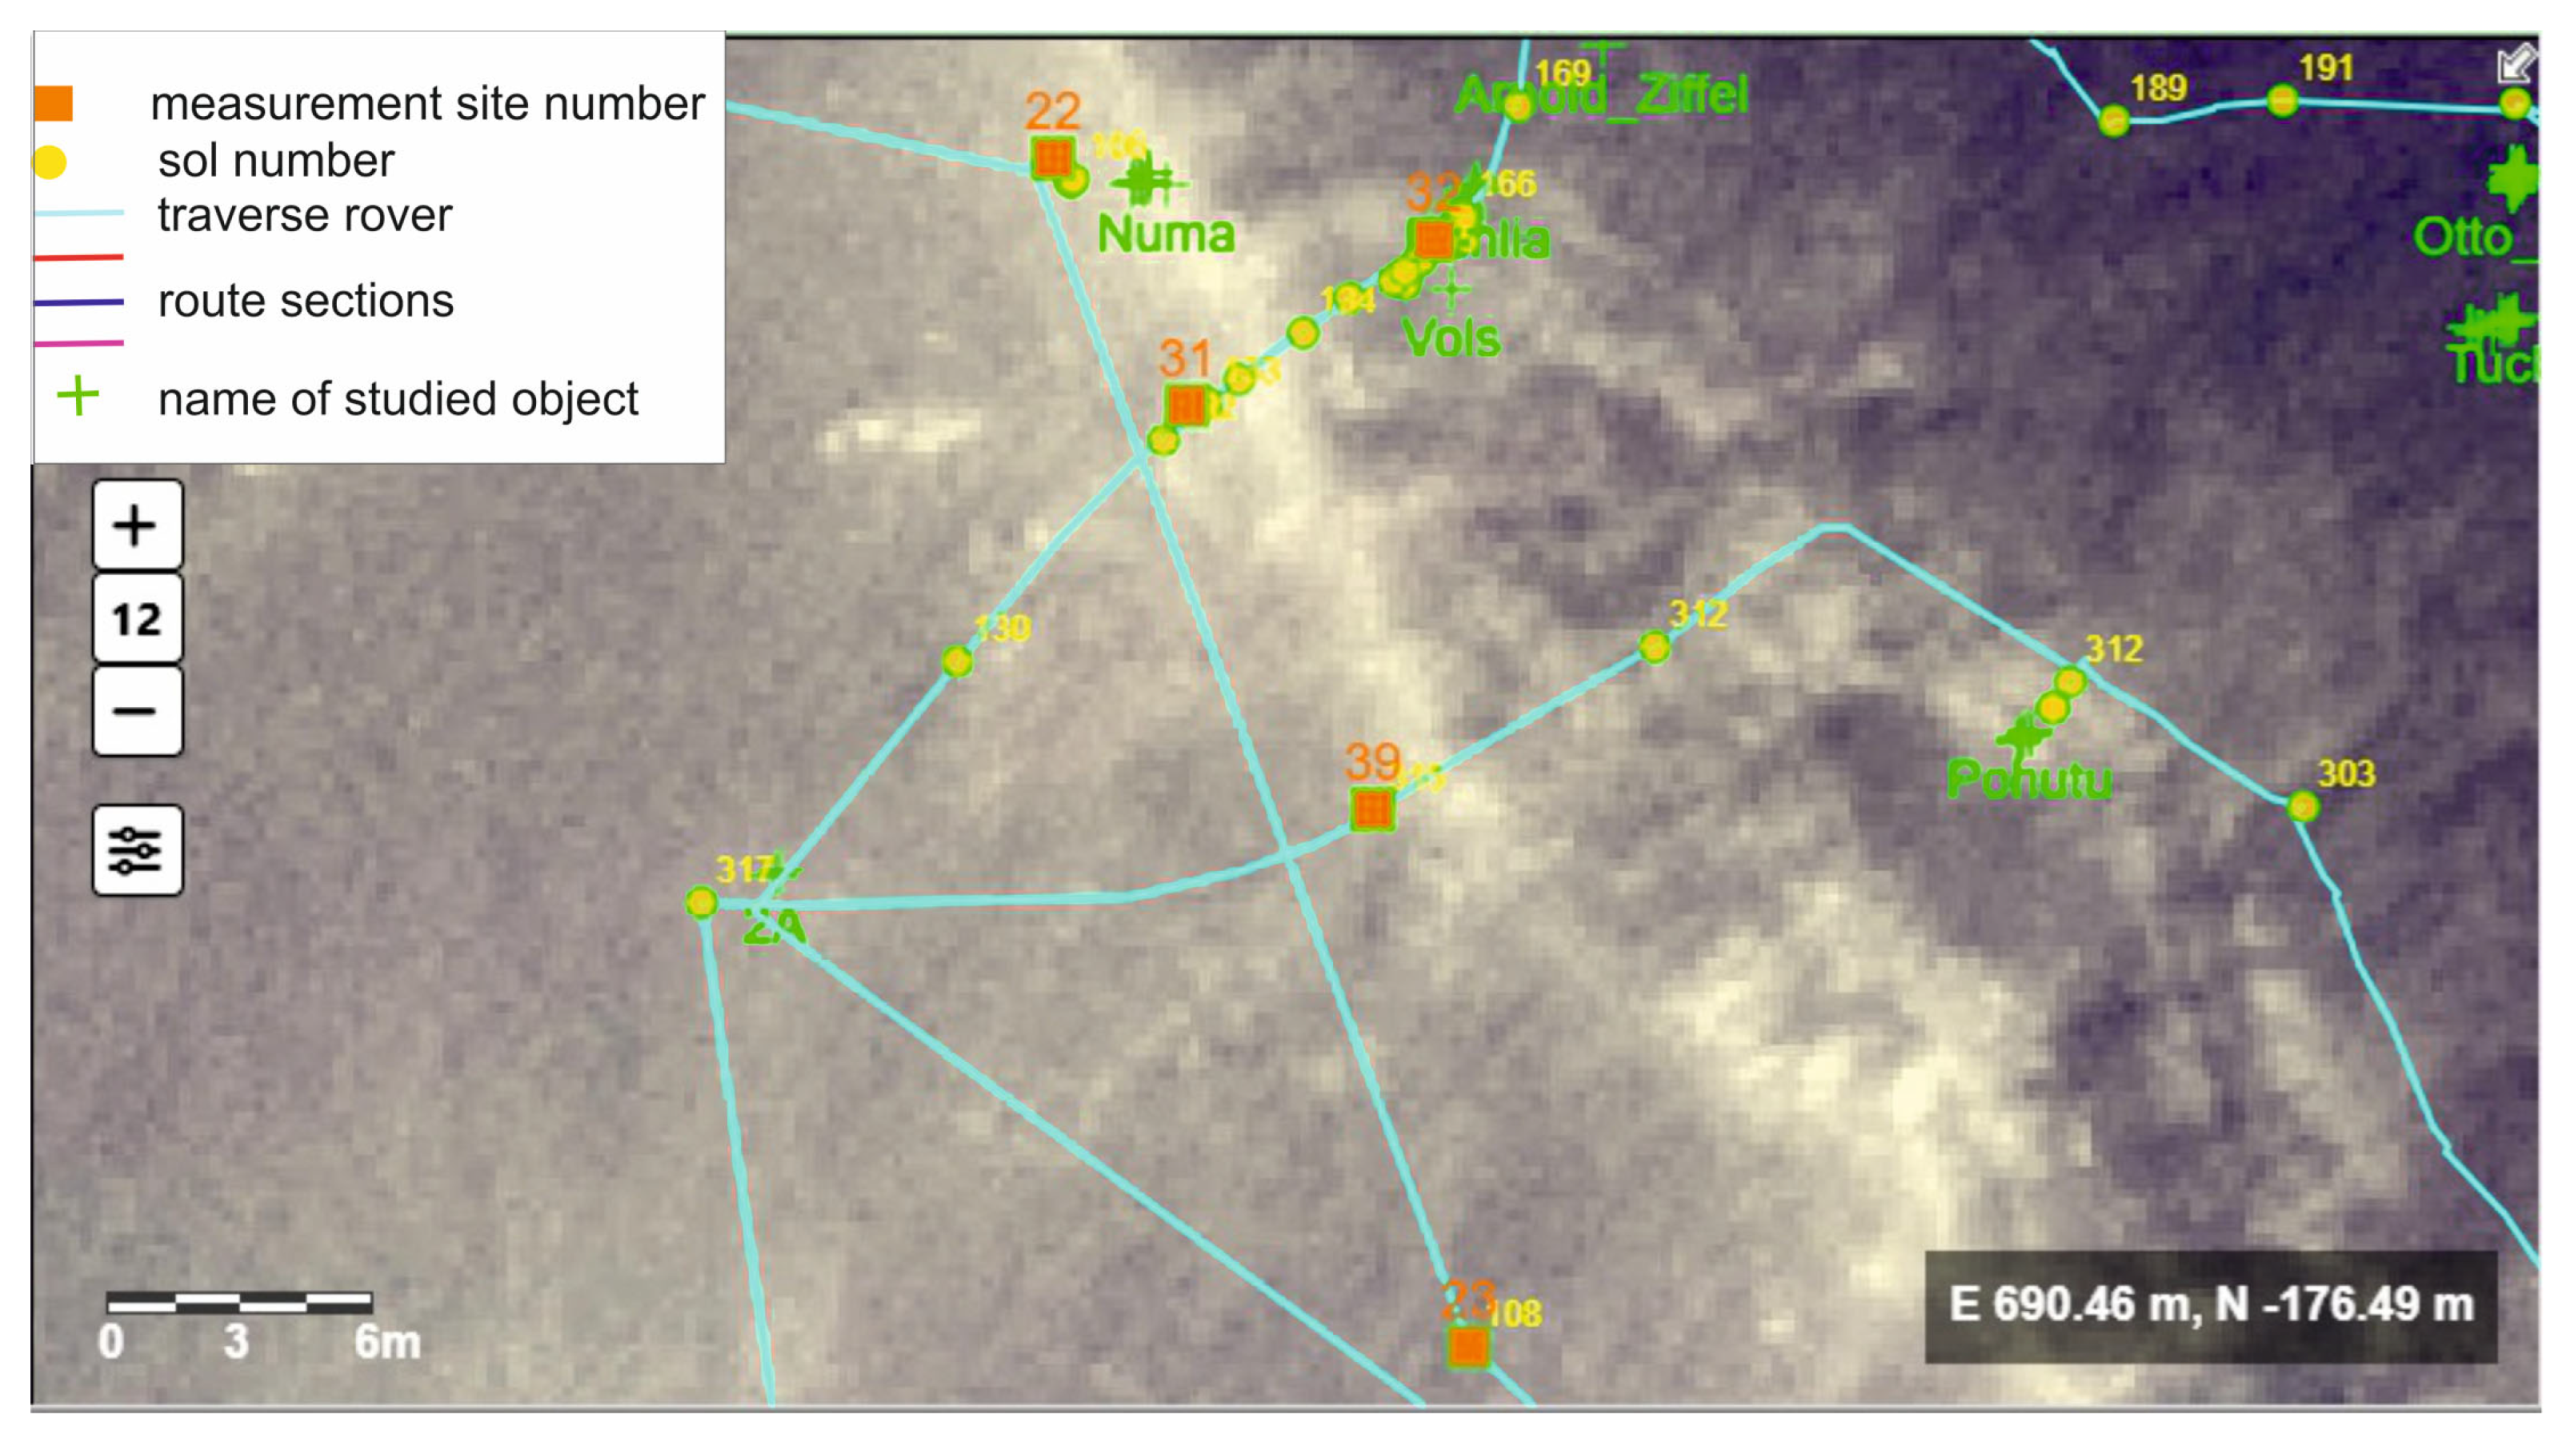
Figure 9. Part of the route of the Opportunity rover. We consider measurements performed from sol 313, when the rover was approximately in the center of the above map (orange square indicating site 39). There is a substantial difference in mineralogy between sol 314 and sol 315. This is the boundary of the 130 m Endurance crater. On the outer slope of the crater there is a lot of dust, consisting of fe–smectite and montmorillonite, with small amounts of jarosite and plagioclase in sector 1 of the route—See Section 4.1. Out of the crater slope, the amount of hematite starts to increase. Gypsum and carbonates appear, as well as hornblende and forsterite. The amount of pyrite oscillates around a few percent. See Section 3 for more descriptions of mineralogy. The black rectangle is the distance in meters from the rover’s location -313 sol to its landing. The minus sign indicates the distance in meters to the south of the rover’s landing. The traverse map id from https://an.rsl.wustl.edu/merb/AN/an3.aspx (accessed on 29 April 2025).
Remotesensing 17 01981 g009
Figure 10. Fragment of sector 2 of the rover route. See Section 4.1. From sol 323, the mineralogy is similar to the previous one. From sol 329, the hematite and gypsum contents increase. The rover is located on the ejecta cover of the Endurance crater. We do not take into account sols 332–381 (see text). More descriptions of mineralogy are in Section 3. The black rectangle is the distance in meters from the rover’s location—325 sol to its landing. The minus sign indicates the distance in meters to the south of the rover’s landing. The traverse map is from https://an.rsl.wustl.edu/merb/AN/an3.aspx (accessed on 29 April 2025).
Remotesensing 17 01981 g010
Figure 11. Parts of sectors 2 and 4 of the rover’s route-See Section 4.1. From sol 382, there is a large proportion of fe–smectite, gypsum, and plagioclase. Some biotite and apatite also are found. From sol 388, the hematite virtually disappears, while the amount of fe–smectite increases. The biotite and apatite and gypsum disappear. The rover is located outside the area of the ejecta cover of the Endurance crater. More descriptions of mineralogy are in Section 3. The black rectangle is the distance in meters from the rover’s location – 392 sol to its landing. The minus sign indicates the distance in meters to the south of the rover’s landing The traverse map is from https://an.rsl.wustl.edu/merb/AN/an3.aspx (accessed on 29 April 2025).
Remotesensing 17 01981 g011
Figure 12. Fragments of sectors 4, 5, and 6 of the rover’s route—See Section 4.1. Note the Omaha region, where the APXS and MB measurements are made—see text. From 395a, the hematite reappeared but it started disappearing from 395e on. Some ilmenite appears and the amount of fe–smectite increases. More descriptions of mineralogy can be found in Section 3. The black rectangle is the distance in meters from the rover’s location—384 sol to its landing. The minus sign indicates the distance in meters to the south of the rover’s landing The traverse map is from https://an.rsl.wustl.edu/merb/AN/an3.aspx (accessed on 29 April 2025).
Remotesensing 17 01981 g012
Figure 13. Spectra of selected minerals from the 23 minerals (ASU spectra library) used for modeling. These minerals are the most significant (DLR pyrite) [30], Table 3, or have the largest contribution (e.g., labradorite, smectite). At the bottom, there are four Mini-TES sample spectra (313, 319, 324 and 395 sols) to which the mineral mix was compared. CO2 was cut from the Mini-TES spectra for modeling purposes (two dashed lines). The two continuous vertical lines at 465 cm−1 and ~550 cm−1 indicate bands that are particularly consistent with hematite and clay mineral bands (smectite and montmorillonite). The vertical red line indicates the pyrite band at 412 cm−1.
Remotesensing 17 01981 g013
Figure 14. Our main results. Bar charts show the percentage of a given mineral. Each measurement is represented as a bar and labeled according to Table 2. The color and/or pattern indicates the mineral, and the size of the bar indicates the percentage.
Remotesensing 17 01981 g014
Figure 15. Map of the initial section of the Opportunity rover’s route, with 6 highlighted sectors. White squares indicate the route under investigation, which are magnified in 3 separate sections. Sectors are color-coded. Sector 1 includes 313–314b sols—red line, sector 2 includes 315–331c sols—red line, sector 3 includes 382a–389b sols—red line, sector 4 includes 389c–394a sols—red line, sector 5 includes 395a–395d sols—navy blue line, and sector 6 includes 395e–395g sols—purple line. The traverse map is from https://an.rsl.wustl.edu/merb/AN/an3.aspx. (accessed on 29 April 2025).
Remotesensing 17 01981 g015
Table 1. Basic information about Mini-TES. Information was taken from the Miniature Thermal Emission Spectrometer for the Mars Exploration Rovers paper [6].
PropertyValue/Remarks
Mass2.40 kg
Size23.5 cm × 16.3 cm × 15.5 cm
Power consumption5.6 W (average)
Wavelength range5–29 µm (in infrared)
Wavenumber range339.50 to 1997.06 cm−1
Sample interval9.99 cm−1.
Resolution (angular)20 mrad (it could be reduced to 8 mrad)
Radiometric precision or range between 450
and 1500 cm−1 for >270 K
+/−1.8 × 10−8 W cm−2 sr−1/cm−1
Radiometric precision for shorter (300 cm−1)
and longer (1800 cm−1) waves
~4.2 × 10⁻⁸ W cm−2 sr−1/cm−1
Absolute radiance error less than 5 × 10⁻⁸ Watt cm−2 sr−1/cm−1
Developed by Arizona State University and Raytheon Santa Barbara Remote Sensing (SBRS)
Table 2. Data from Mini-TES used in our research. This is a table with two columns. It is divided into two parts, and the parts are placed parallel to each other.
Our NotationNotation in PDS
Planetary Data System
https://pds-geosciences.wustl.edu/mer/mer1-m-mtes-4-emr-v1/mer1mt_3xxx/data/ (accessed on 29 April 2025)
Our NotationContinuation of the Left Column
Notation in PDS
Planetary Data System
https://pds-geosciences.wustl.edu/mer/mer1-m-mtes-4-emr-v1/mer1mt_3xxx/data/ (accessed on 29 April 2025)
0313a1t155968073emr38h7p3576n0a103841t162271126emr4403p3575n0a1
0313b1t155970233emr38h7p3290n0a103851t162359900emr4503p3575n0a1
0313c1t155971234emr38h7p3575n0a1.03861t162448685emr4603p3575n0a1
0313d1t155971951emr38h7p3575n0a10387a1t162535829emr4603p3575n0a1
0314a1t156055646emr38h7p3575n0a10387b1t162537464emr4603p3575n0a1
0314b1t156056856emr38h7p3575n0a10388a1t162624808emr4700p3575n0a1
03151t156144440emr38h7p3575n0a10388b1t162626234emr4700p3575n0a1
0319a1t156500733emr3940p3575n0a10389a1t162713380emr4700p3575n0a1
0319b1t156499520emr3940p3575n0a10389b1t162715024emr4700p3575n0a1
0321a1t156677094emr3981p3575n0a10389c1t162716469emr4700p3972n0a1
0321b1t156678275emr3981p3575n0a10389d1t162716917emr4700p3973n0a1
0322a1t156765845emr4000p3575n0a10390a1t162802322emr4700p3575n0a1
0322b1t156767047emr4000p3575n0a10390b1t162803779emr4700p3575n0a1
0323a1t156859422emr4000p3575n0a10390c1t162808419emr4700p3976n0a1
0323b1t156860754emr4000p3575n0a10391a1t162891150emr4705p3575n0a1
0323c1t156862377emr4000p3575n0a10391b1t162892555emr4705p3575n0a1
0324a1t156943733emr4000p3575n0a10391c1t162893249emr4705p3290n0a1
0324b1t156944602emr4000p3575n0a10392a1t162979928emr4705p3575n0a1
0324c1t156950645emr4075p3715n0a10392b1t162984295emr4705p3977n0a1
0325a1t157032170emr4075p3575n0a10393a1t163068603emr4705p3575n0a1
0325b1t157033393emr4075p3575n0a10393b1t163070132emr4705p3575n0a1
03291t157388477emr40a3p3575n0a10394a1t163157489emr4705p3575n0a1
0331a1t157570782emr40ajp3575n0a10394b1t163158927emr4705p3575n0a1
0331b1t157565012emr40ajp3575n0a10395a1t163245881emr4786p3575n0a1
0331c1t157566061emr40ajp3575n0a10395b1t163246388emr4786p3575n0a1
0382a1t162093577emr4336p3575n0a10395c1t163247648emr4786p3575n0a1
0382b1t162094557emr4336p3575n0a10395d1t163252492emr4786p3575n0a1
0382c1t162095419emr4336p3715n0a10395e1t163254368emr4786p3575n0a1
0382d1t162098649emr4336p3575n0a10395f1t163255320emr4786p3575n0a1
0383a1t162181197emr4336p3575n0a10395g1t163256838emr4786p3575n0a1
0383b1t162182367emr4336p3575n0a1
Table 3. Names of mineral components in our paper and names of corresponding files in the library. Spectrum of pyrite was measured in the laboratory of the Institut für Planetenforschung, Deutsches Zentrum für Luft- und Raumfahrt (DLR). The rest are from the ASU Spectral Library.
Name of File in Librabry
ASU Spectral Library https://speclib.asu.edu/ (accessed on 29 April 2025)
Name in Our Paper and Remarks
Andesine BUR-240 1andesine
Apatite ML-P1 86apatite
Biotite BUR-840 25biotite
Bronzite BUR-1920 6bronzite
Calcite ML-C9 98calcite
Chlorite WAR-1924 40chlorite
Enstatite HS-9.4B 30enstatite
Fe–smectite SWa-1 powder 205fe–smectite
Gypsum (Selenite) ML-S8 83gypsum
Hematite BUR-2600 50hematite
Hornblende NMNH-R7208 173hornblende
Ilmenite WAR-4119 35ilmenite
Jarosite S51jarosite
Labradorite WAR-4524 63labradorite
Magnesite C55 132magnesite
Magnetite WAR-0384 64magnetite
Montmorillonite SCa-3 powder 198montmorillonite
Quartz BUR-4120 55quartz
Serpentine HS-8.4B 14serpentine
Siderite130 Siderite C50 130siderite
Goethite ASUgoethite
Forsterite038forsterite
Emiss_pyrite_waven DLR pyrite (see table caption)
Table 4. Our results after averaging the individual sectors of the rover’s route. Values have been rounded to full percentages. The accuracy of determining the mineral content is in the order of a few percent.
Range of Sectors

Numbers of
Measurements
Sector No.
313-314b

6

1
315-331c

19

2
382a-389b

15

3
389c-394a

14

4
395a-395d

4

5
395e-395g

3

6
andesine1%0%0%0%0%6%
apatite1%3%5%6%5%0%
biotite0%1%1%0%2%0%
bronzite0%0%0%0%0%0%
calcite0%15%7%5%11%0%
chlorite0%0%0%0%0%0%
enstatite0%1%6%3%7%0%
fe–smectite60%31%41%46%21%68%
gypsum3%5%6%5%8%0%
hematite0%21%3%0%13%0%
hornblende2%11%4%4%5%4%
ilmenite0%0%0%0%0%9%
jarosite2%0%0%0%0%1%
labradorite15%4%23%29%19%0%
magnesite0%0%0%0%0%0%
magnetite0%0%0%0%0%0%
montmorillonite17%2%0%0%4%9%
quartz0%0%0%0%0%0%
serpentine0%0%0%0%0%0%
siderite0%0%0%0%0%0%
goethite0%0%0%0%0%0%
forsterite0%3%3%2%4%1%
pyrite0%2%0%0%0%1%
SUM100%100%100%100%100%100%
Table 5. Data for chosen sols for the discussion in Section 4.5. Data are from sols 392 and 393 (sector 4). Some data from sector 6 are also presented.
392a392b393a393b394a394b395e
andesine0%0%0%0%0%0%9%
apatite6%7%7%7%8%7%0%
biotite0%0%0%0%0%0%0%
bronzite0%0%0%0%0%0%0%
calcite3%5%3%3%5%11%0%
chlorite0%0%0%0%0%0%0%
enstatite4%1%3%3%3%5%0%
fe–smectite44%41%38%44%37%36%59%
gypsum5%7%6%6%7%6%0%
hematite0%0%0%0%0%0%0%
hornblende5%8%6%6%7%6%7%
ilmenite0%0%0%0%0%0%5%
jarosite0%0%0%0%0%0%3%
labradorite32%30%35%31%32%27%0%
magnesite0%0%0%0%0%0%0%
magnetite0%0%0%0%0%0%0%
montmor0%0%0%0%0%0%15%
quartz0%0%0%0%0%0%0%
serpentine0%0%0%0%0%0%0%
siderite0%0%0%0%0%0%0%
goethite0%0%0%0%0%0%0%
forsterite2%3%2%2%2%2%1%
pyrite0%0%0%0%0%0%2%
Sector4444446
Disclaimer/Publisher’s Note: The statements, opinions and data contained in all publications are solely those of the individual author(s) and contributor(s) and not of MDPI and/or the editor(s). MDPI and/or the editor(s) disclaim responsibility for any injury to people or property resulting from any ideas, methods, instructions or products referred to in the content.