Article

DEMNet: A Small Object Detection Method for Tea Leaf Blight in Slightly Blurry UAV Remote Sensing Images

College of Information Science and Technology, Nanjing Forestry University, Najing 210037, China
*
Author to whom correspondence should be addressed.
Remote Sens. 2025, 17(12), 1967; https://doi.org/10.3390/rs17121967
Submission received: 28 April 2025 / Revised: 30 May 2025 / Accepted: 5 June 2025 / Published: 6 June 2025

Abstract

:
Unmanned aerial vehicles are widely used in agricultural disease detection. Still, slight image blurring caused by lighting, wind, and flight instability often hampers the detection of dense small targets like tea leaf blight spots. In response to this problem, this paper proposes DEMNet, a model based on the YOLOv8n architecture. The goal is to enhance small, blurry object detection performance in UAV-based scenarios. DEMNet introduces a dynamic convolution mechanism into the HGNetV2 backbone to form DynamicHGNetV2, enabling adaptive convolutional weight generation and improving feature extraction for blurry objects. An efficient EMAFPN neck structure further facilitates deep–shallow feature interaction while reducing the computational cost. Additionally, a novel CMLAB module replaces the traditional C2f structure, employing multi-scale convolutions and local attention mechanisms to recover semantic information in blurry regions and better detect densely distributed small targets. Experimental results on a slightly blurry tea leaf blight dataset demonstrate that DEMNet surpasses the baseline by 5.7% in recall and 4.9% in mAP@0.5. Moreover, the model reduces parameters to 1.7 M, computation to 6.1 GFLOPs, and model size to 4.2 MB, demonstrating high accuracy and strong deployment potential.

1. Introduction

Tea, one of the world’s oldest and most widely consumed beverages, holds significant economic, medicinal, and cultural value [1]. China leads global tea production, boasting the largest plantation area and highest output. Since 2010, both metrics have steadily increased. By 2023, the area of tea plantations in China reached 3.42 million hectares, accounting for over 70% of the global total. Its annual output rose to 3.54 million tons, with an average increase of 158,000 tons per year [2]. However, tea trees are susceptible to a range of diseases, notably leaf blight. It causes premature leaf fall and branch tip withering, ultimately weakening the plants and reducing yields [3]. Early identification and intervention are crucial to maintaining tea production, improving quality, and supporting industry development.
Traditionally, tea disease diagnosis relies on expert observations. Yet with over 50 million mu of tea plantations in China, manual inspection is inefficient and insufficient for large-scale, precise monitoring, restricting the industry’s development.
In recent years, deep learning has become a powerful tool for agricultural disease detection. Image-based object detection helps address the limitations of manual inspection. Several studies have demonstrated its effectiveness in identifying tea leaf diseases. Gayathri et al. [4] used LeNet to classify four tea diseases with 98.32% accuracy. Ramdan et al. [5] used transfer learning and fine-tuning to address the issue of limited tea disease data. Hu et al. [6] improved image clarity with the Retinex algorithm and integrated it with a modified Faster R-CNN and VGG16 to detect tea leaf blight and evaluate its severity. Xue et al. [7] integrated ACmix, CBAM, RFB, and GCNet modules into YOLOv5, improving small-object detection and reducing model complexity. Chen et al. [8] introduced TeaViTNet, a multi-scale attention fusion framework that integrates MobileViT, EMA-PANet, RFBNet, and ODCSPLayer to achieve accurate detection. Ye et al. [9] enhanced YOLOv8 with RFCBAM, MixSPPF, DynamicHead, and an IoU-based loss function, achieving 93.04% average accuracy for early-stage small-target detection. Overall, existing studies show the potential of deep learning in tea disease detection, especially for small targets. However, most methods focus on accuracy and often overlook model complexity and real-world deployment constraints.
Moreover, deep learning is often combined with UAV remote sensing in practical applications. Drones provide an efficient, low-cost, and flexible method for collecting agricultural data. They are widely used in crop monitoring, disease tracking, and field management. Liu et al. [10] introduced BiFPN and SimAM into an improved YOLOv5-tassel algorithm for maize cob detection in UAV imagery. Ye et al. [11] enhanced small-target detection and pest area segmentation by modifying UNet with multi-scale convolution, attention mechanisms, and adaptive pooling, using high-resolution UAV and satellite imagery. Tetila et al. [12] conducted a comparative study of five deep learning models—Inception-v3, ResNet-50, VGG-16, VGG-19, and Xception—to classify 13 types of soybean pests from UAV imagery. Bao et al. [13] applied super-resolution enhancement and the DDMA-YOLO algorithm for accurate tea bud blight detection using UAV images.
Most of these studies rely on high-resolution images. However, UAV imagery often suffers from motion blur, misfocus, and complex backgrounds, which reduce detection accuracy. Recently, more attention has been paid to the detection of blurry and low-quality images. Sayed & Brostow [14] proposed five strategies to enhance blurry image detection: deblurring preprocessing, texture adjustment, out-of-distribution testing, custom labeling, and multitask learning for blur types. Subsequent research has primarily focused on image deblurring and multitask learning. DeblurGANv2 [15] employs relativistic conditional GANs with a dual-scale discriminator and FPN, improving deblurring quality. Chen et al. [16] introduced NAFNet, a non-activation function network architecture that achieves efficient deblurring by simplifying channel attention and incorporating the SimpleGate mechanism, making it suitable for resource-constrained environments. Genze et al. [17] developed the DeBlurWeedSeg model, combining the deblurring model NAFNet with the segmentation model WeedSeg, improving weed segmentation in blurry sorghum field images. However, its performance on small, blurry targets remains limited. Hu et al. [18] proposed a two-stage approach using RFBDB-GAN for super-resolution and LWDNet for detection, achieving 92.3% mAP in tea leaf blight spot identification. Jobaer et al. [19] introduced the SOD-Dataset with synthetic blurry images and proposed DBSnet, a lightweight distillation model with an attention-based deblurring module. Though computational costs may increase. While this approach enhances detection performance, it may incur higher computational costs.
In summary, current approaches for blurry image detection mainly fall into two categories: deblurring preprocessing and multitask learning. Deblurring methods typically employ a two-stage framework, consisting of a dedicated deblurring model and a detection model. While these approaches can improve detection accuracy, they inevitably increase system complexity and computational overhead. In contrast, lightweight models designed specifically for blurry targets provide a practical solution, but require efficient architectural optimization. To this end, this paper proposes DEMNet, a lightweight model for detecting small leaf blight spots in slightly blurry UAV images. The model builds upon the architecture of YOLOv8, which offers three key advantages for this application: (1) Technical maturity: YOLOv8 demonstrates reliable performance across diverse agricultural disease detection scenarios. (2) Ecosystem support: its extensive adoption provides robust community resources and implementation tools. (3) Balanced performance: the architecture balances accuracy and speed well, working effectively for small leaf blight spot detection in crops. DEMNet adopts DynamicHGNetV2 as the backbone and replaces the traditional PAN-FPN structure with the EMAFPN network. Additionally, a CMLAB module is designed to replace the conventional C2f module, enhancing feature extraction. Through multi-scale convolution and a local window mechanism, DEMNet significantly improves the precision and recall of leaf blight spot detection.
The main contributions of this study can be summarized as follows:
(1)
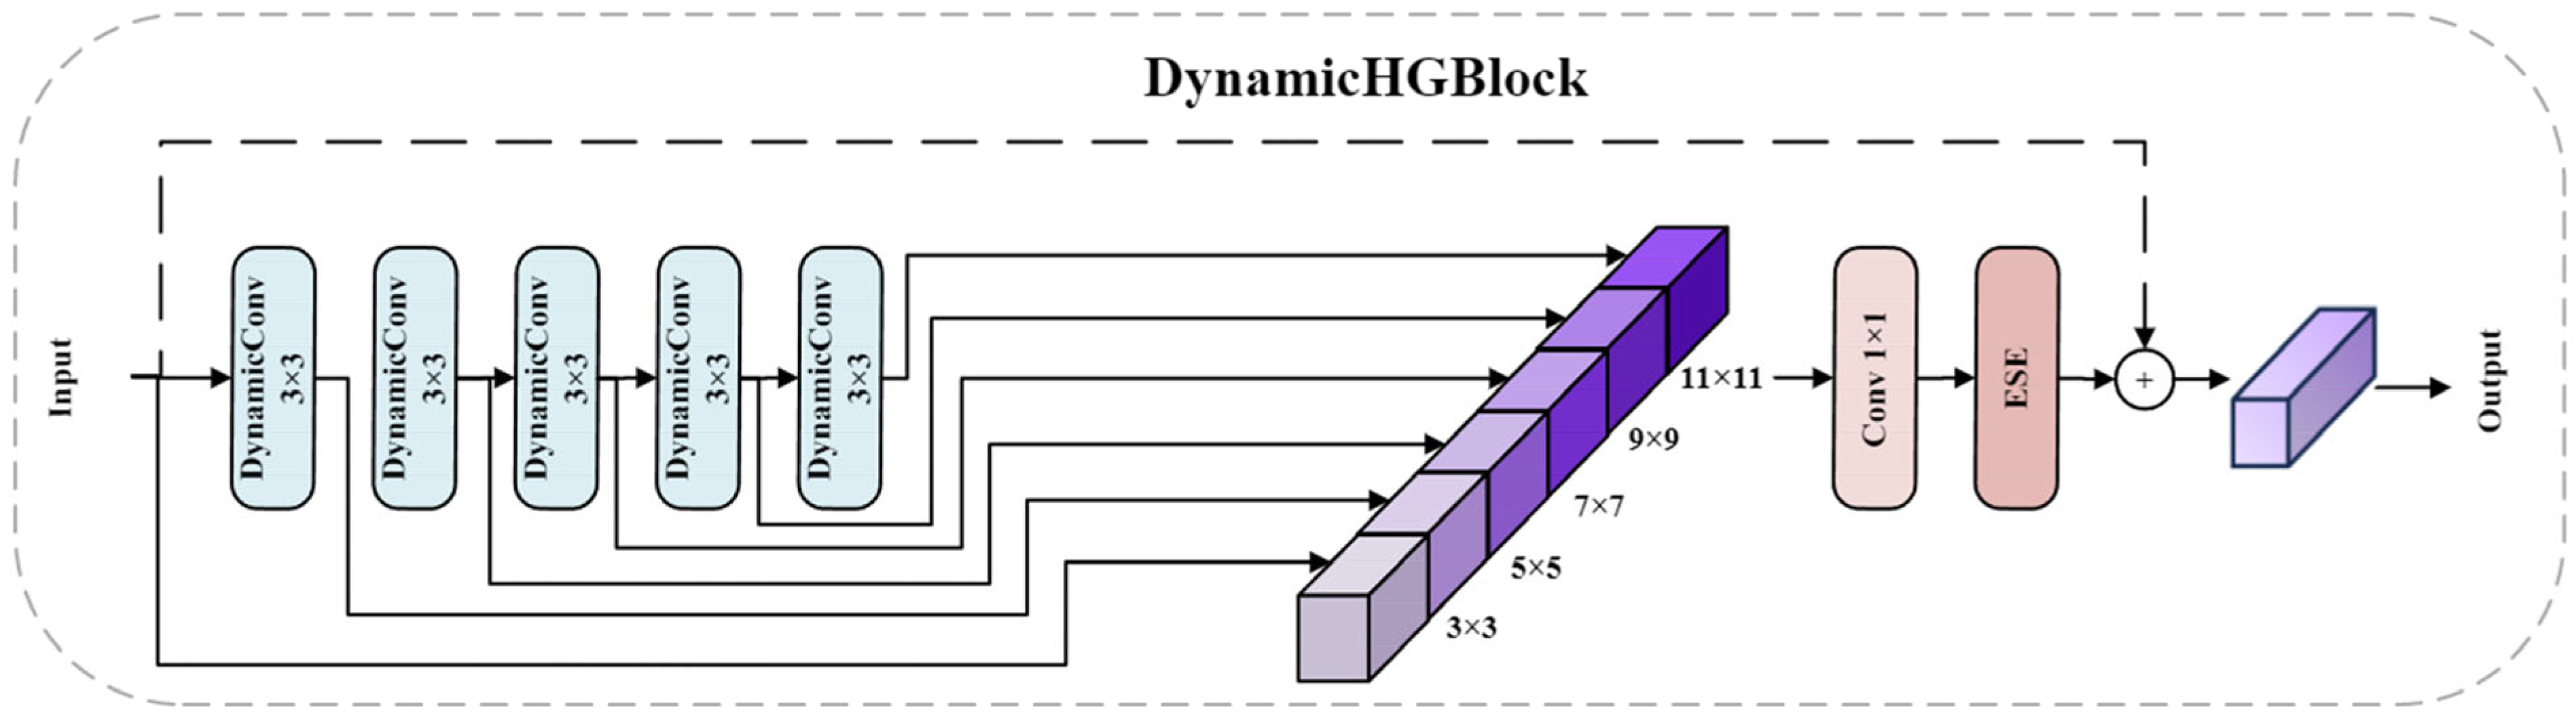
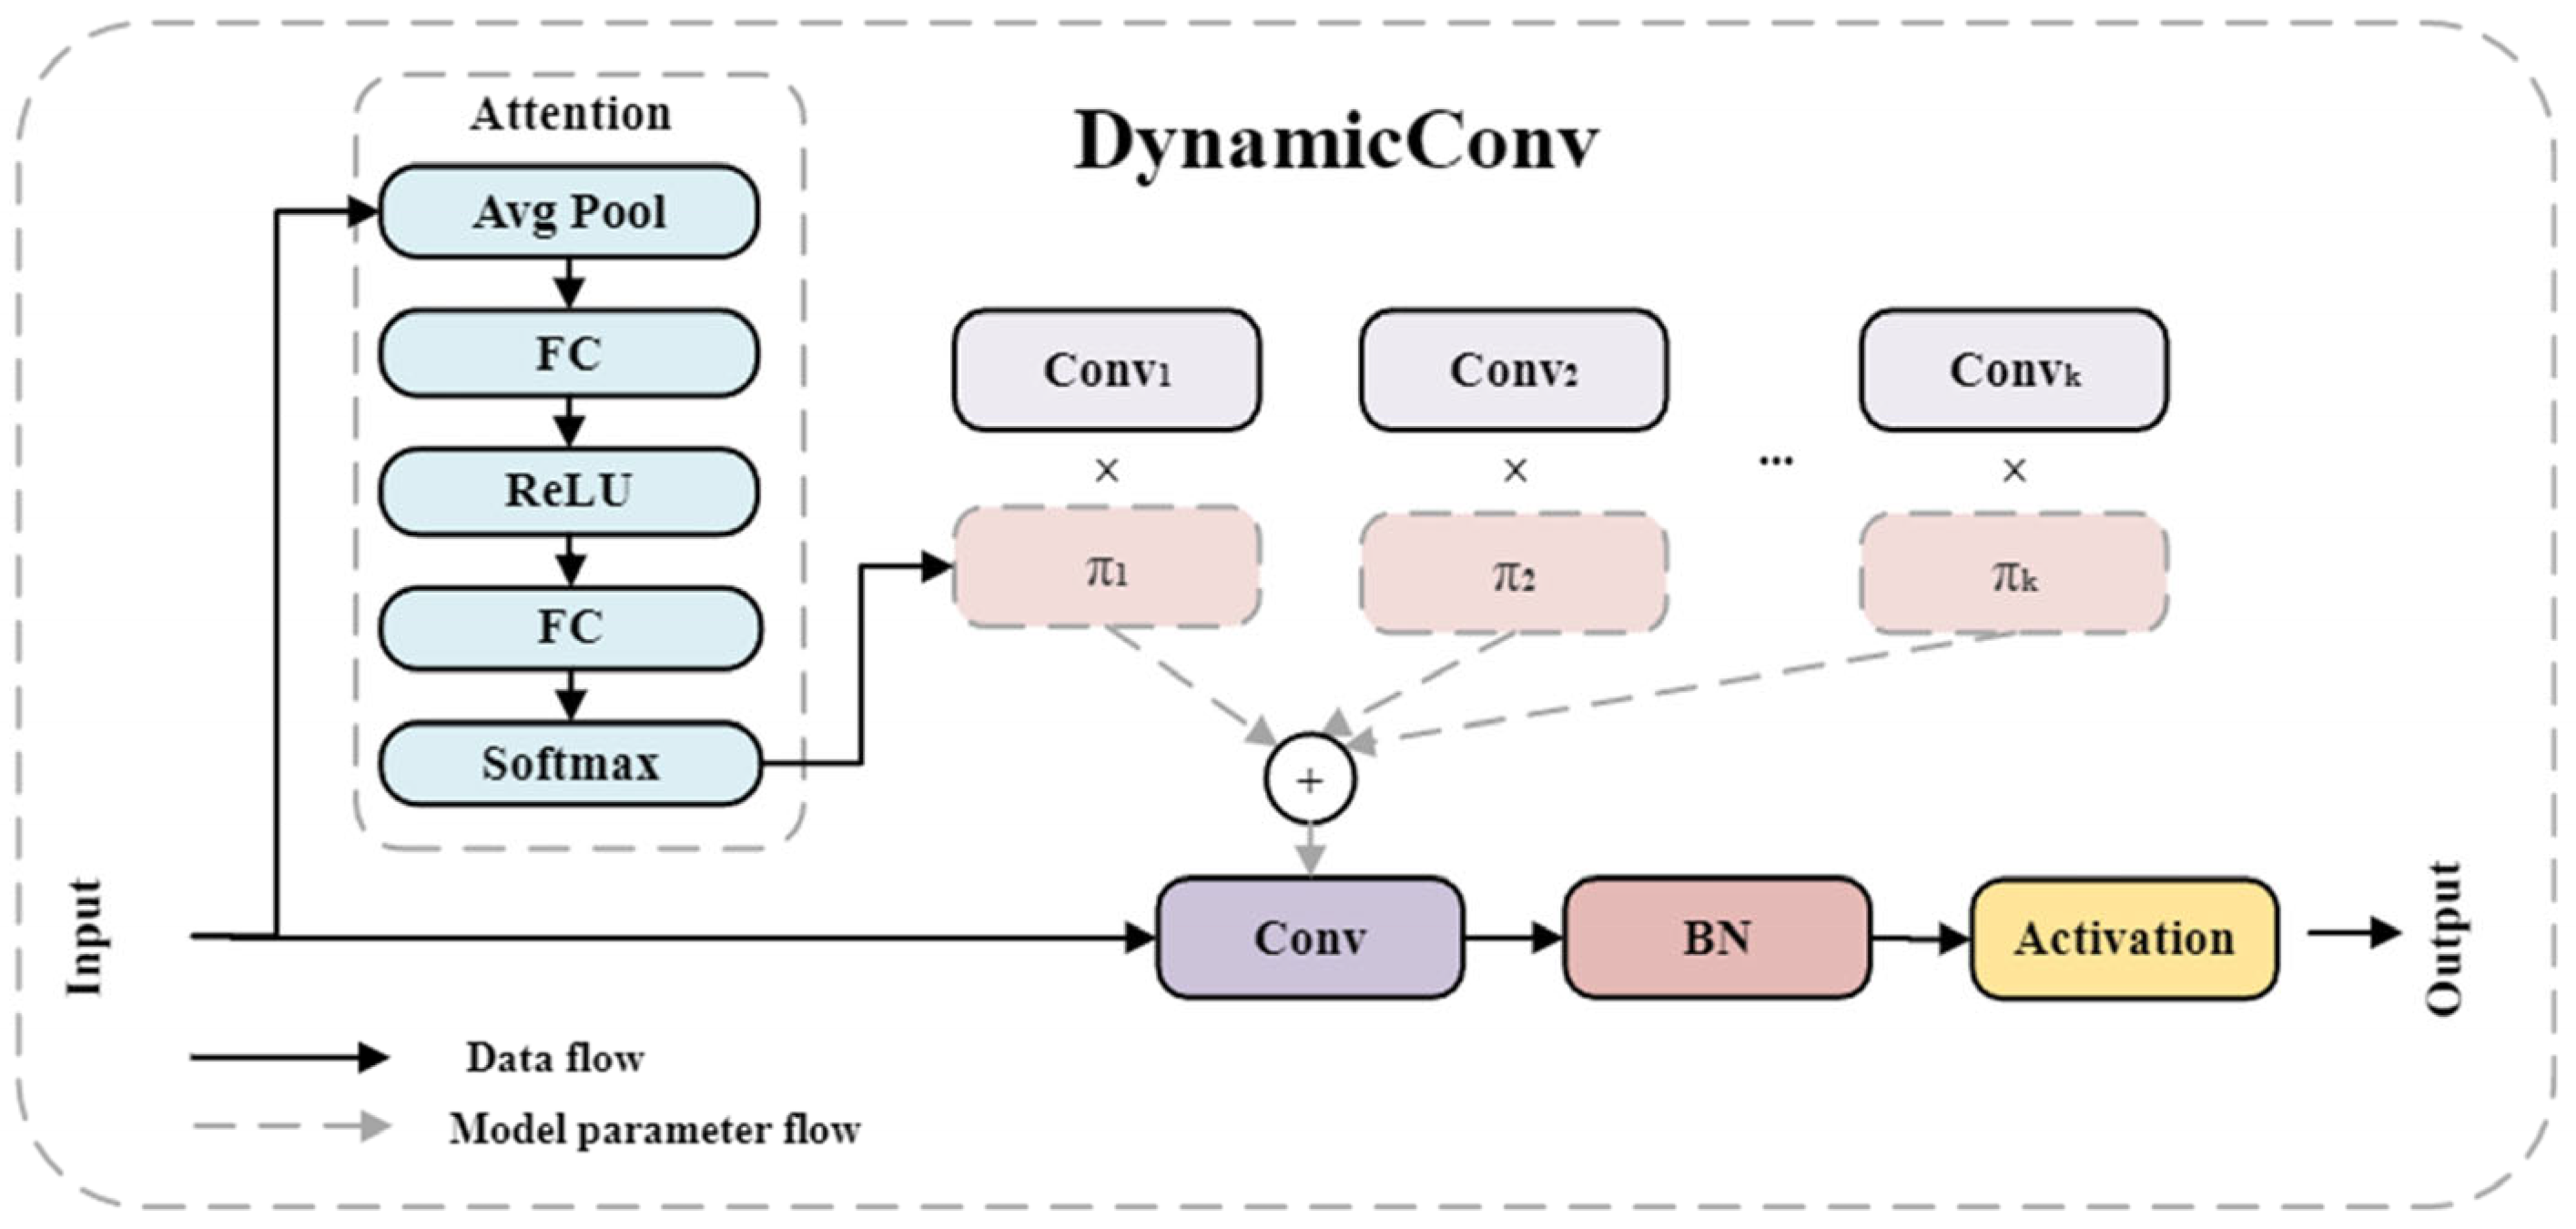
The lightweight HGNetV2 is used as the backbone extraction network, and the dynamic convolution mechanism is introduced to construct the DynamicHGNet network. The dynamic convolution is effectively utilized to adaptively generate convolution kernel weights for input features, which strengthens the feature extraction ability for blurry targets.
(2)
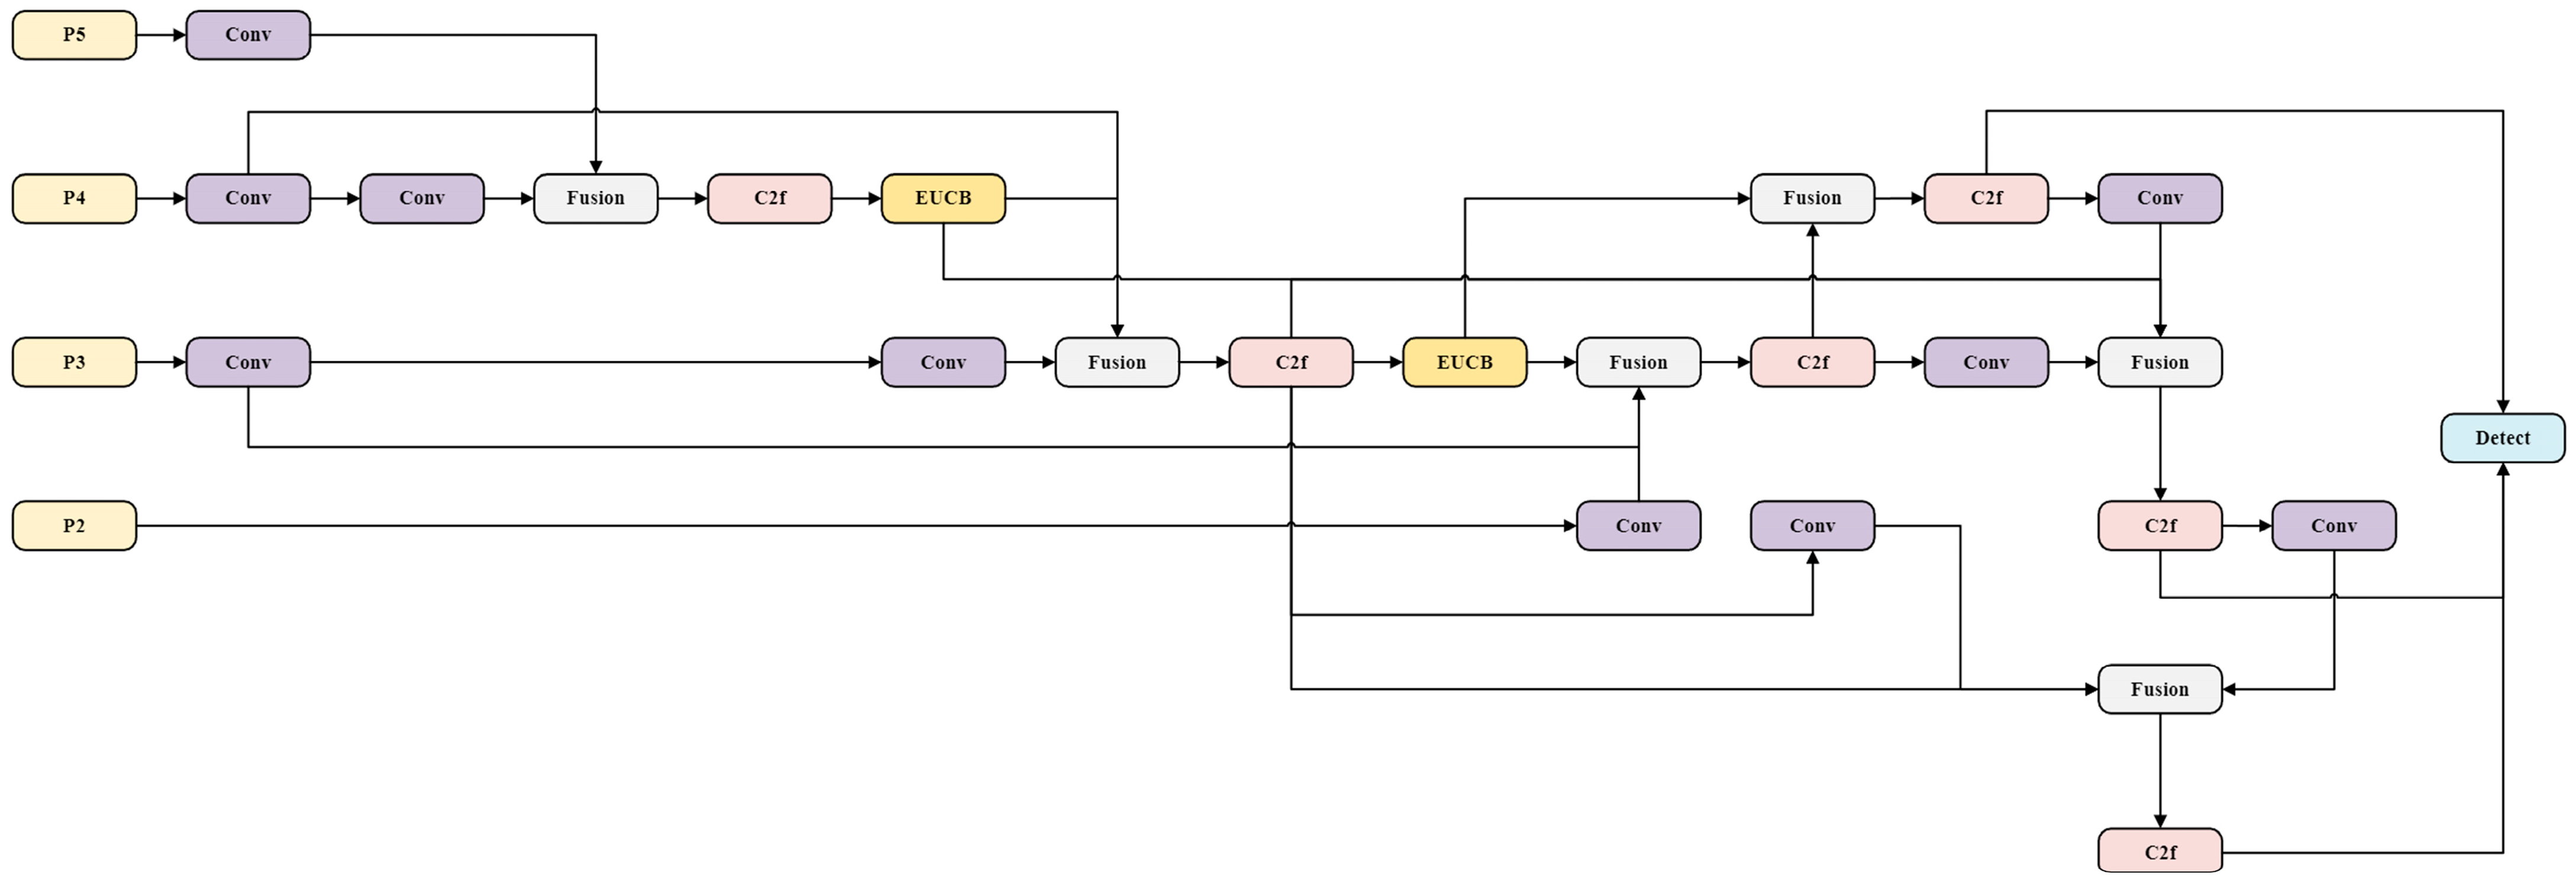
A lightweight EMAFPN feature fusion module is utilized to completely use the fusion of low-level and high-level features in order to better collect the detail information of small targets and increase their detection capability.
(3)
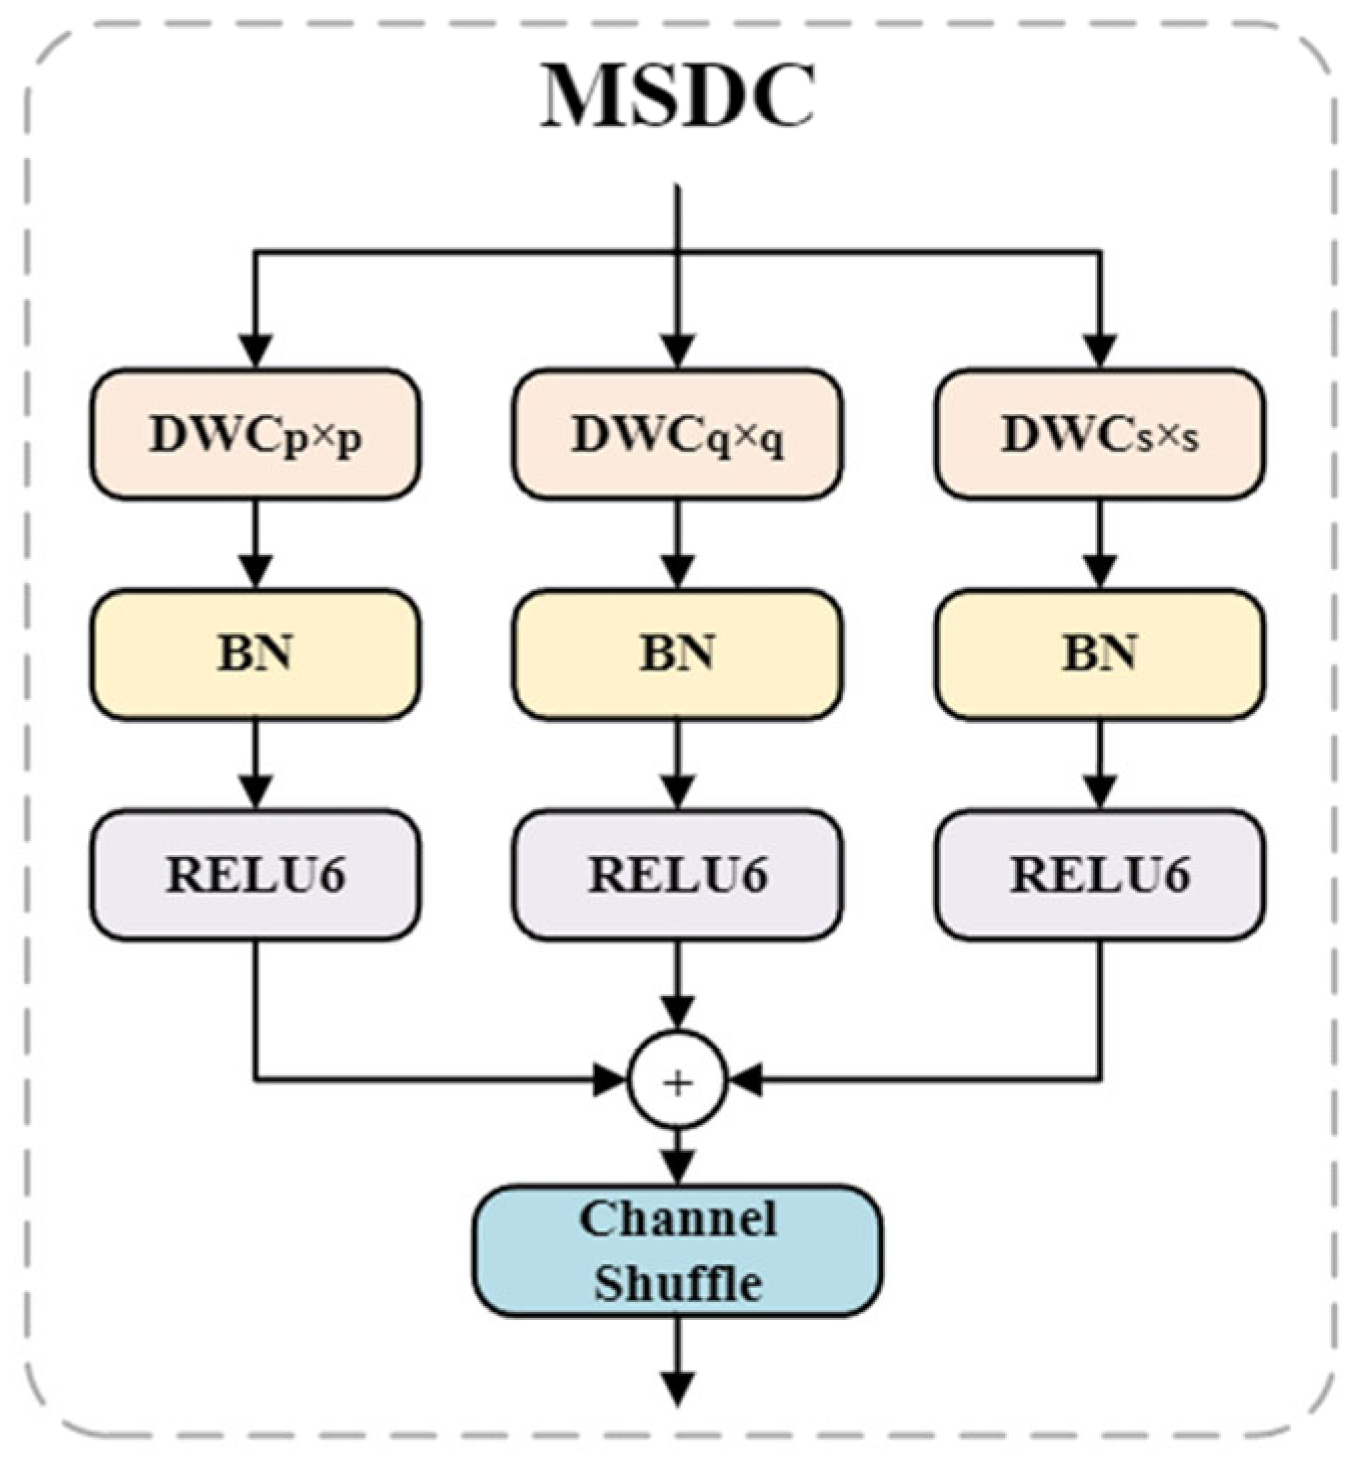
Construct a CMLAB module that incorporates multi-scale convolution and local window attention mechanism. Aiming at the unclear edges of blurry small targets, the CMLAB module makes up for the semantic lack of blurry edges by fusing contextual features of different scales. The local attention mechanism divides the image into different windows to enhance features, which significantly boosts the recall of leaf blight spot detection.

2. Materials and Methods

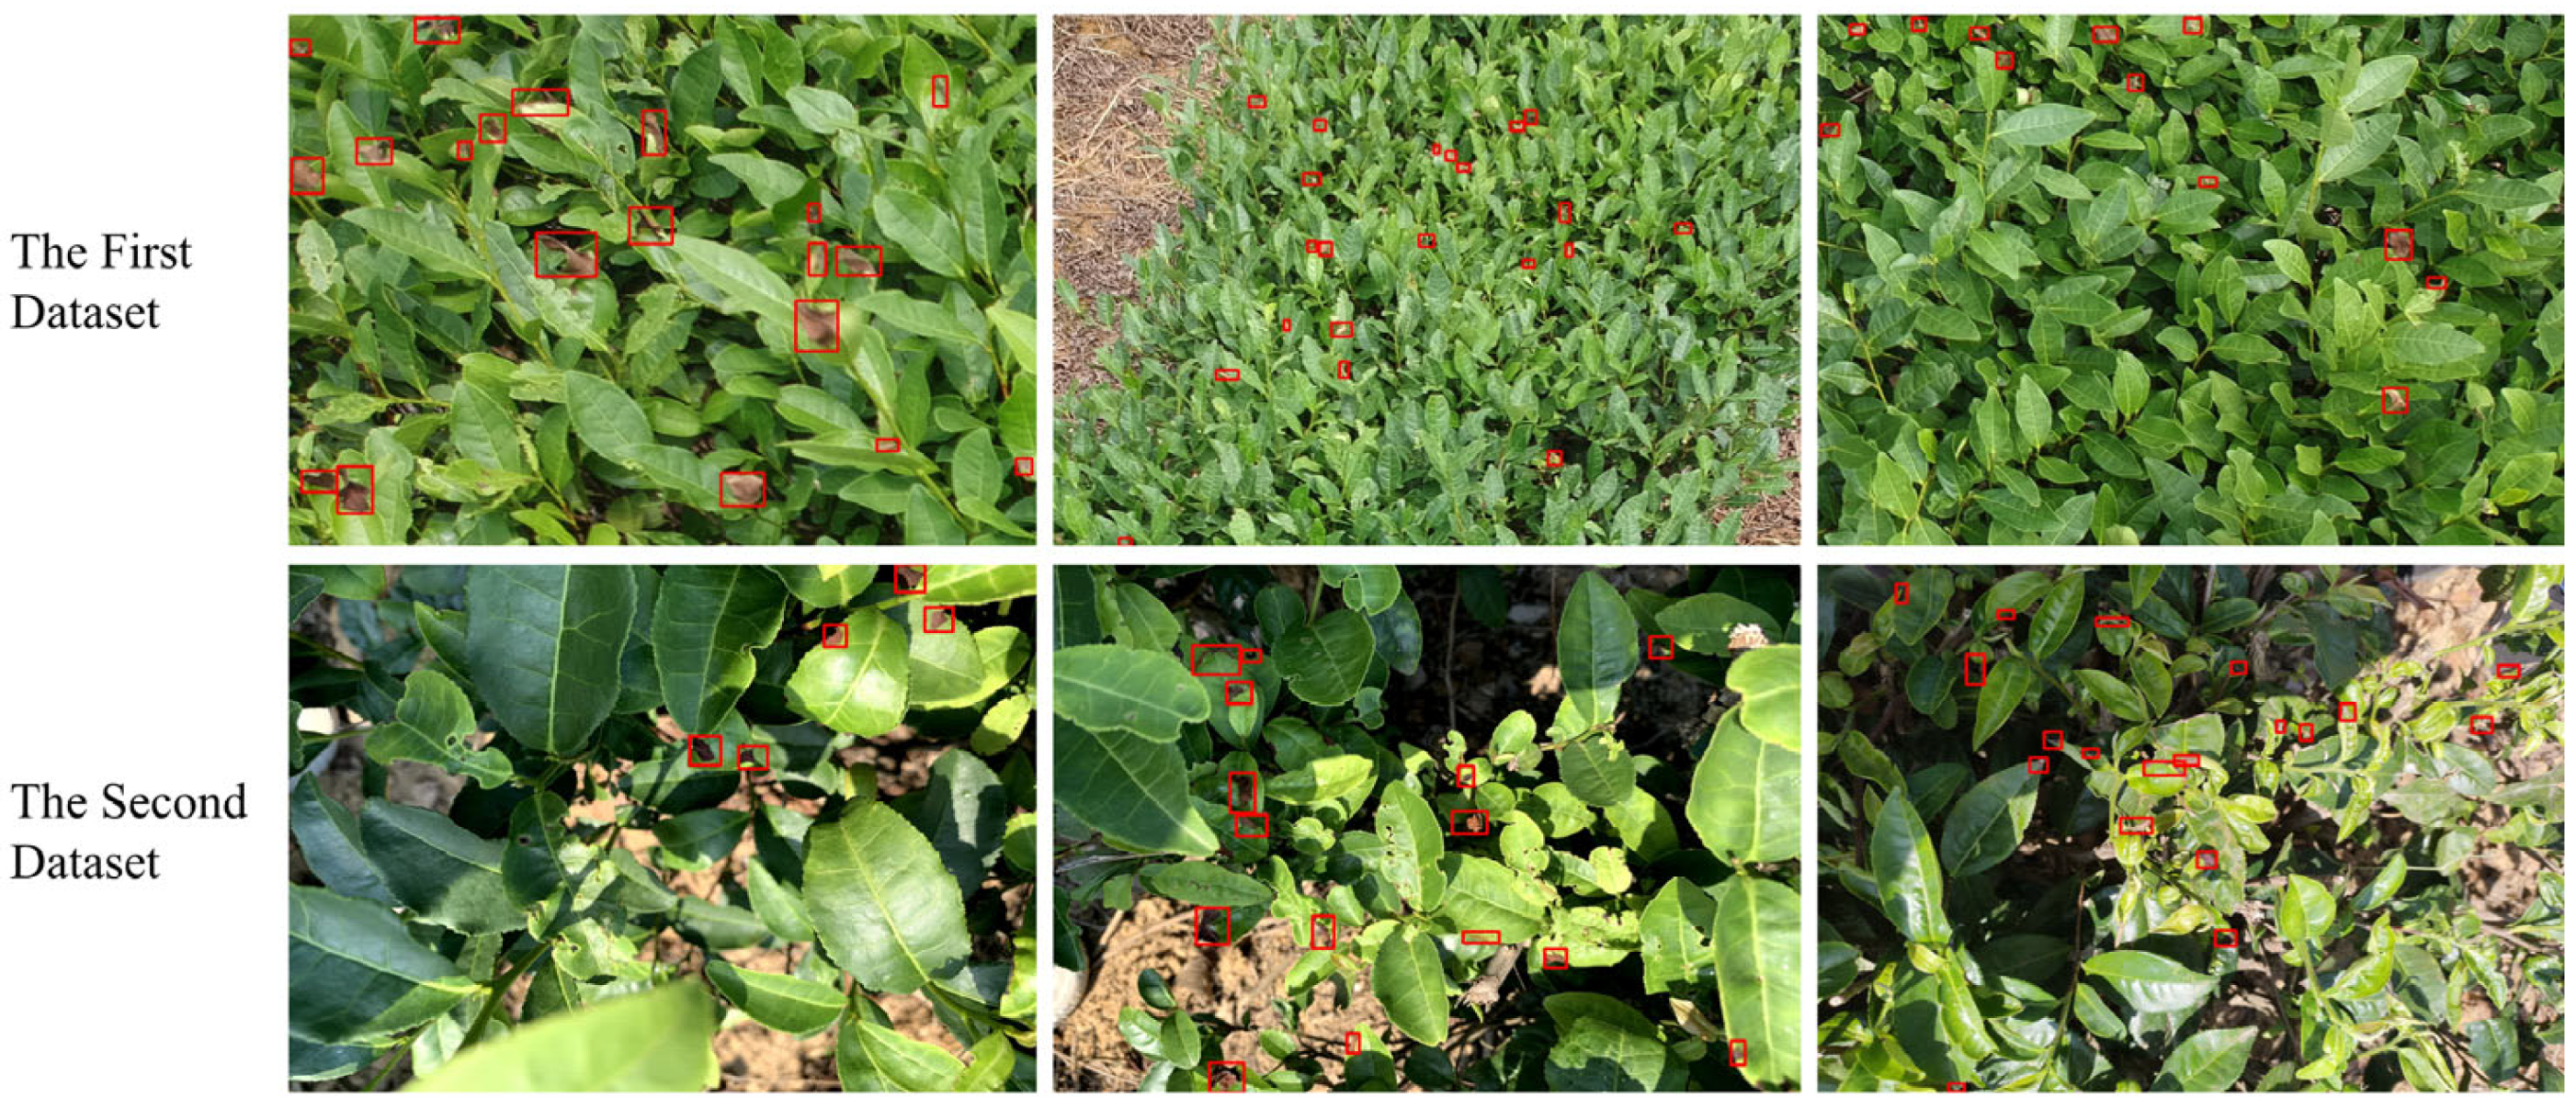
2.1. Datasets Preparation

2.1.1. Acquisition of Datasets

Two datasets were used in this study to comprehensively evaluate the performance of the DEMNet model. The first dataset is the primary dataset for conducting the experiments. The tea image data used was gathered from the Maoshan Tea Farm in Jurong City, Jiangsu Province, China (32°12′N, 119°28′E). Image acquisition took place in April 2023, between 1:00 p.m. and 3:00 p.m., under sunny skies with favorable lighting and a gentle breeze. The equipment used was a DJI Avata UAV, which flew at an altitude of 2–3 m above the ground, at a speed of 4 km/h, and captured an image every 1 s. After capturing the images, we first divided them into nine sections. Then, we removed the extremely blurry ones caused by shooting issues and those without tea leaf blight. Finally, the first dataset contains 181 valid images, each with a resolution of 1322 × 992 pixels. To verify the generalization ability of the model, a second validation dataset was additionally constructed. Unlike the first dataset, these images were captured using a smartphone camera on 1 July 2022, also under good lighting conditions. After removing low-quality images and those without tea leaf blight, the second dataset contains 169 images, each with a resolution of 3024 × 4032 or 3024 × 3024 pixels. This dataset enables evaluation of the DEMNet model’s generalization ability across different devices and environments. The typical images of the two datasets are shown in Figure 1.
From the images in the first dataset, it can be seen that in real experiments, images often exhibit motion blur or bokeh blur. This is mainly caused by factors such as unstable UAV flight, long camera exposure, and strong winds. To assess the degree of blurring of the images in the first dataset, this paper uses the total variance method based on the Laplace operator for image blur detection [20]. The method simply extracts the single-channel information of the image and convolves it with the 3 × 3 Laplace operator shown in Figure 2. The variance of the resulting response map is then calculated.
With the help of the OpenCV-based image blur detection project implemented by Brennan [21], the first original dataset is detected. When the variance of the image response is lower than the preset threshold, the image can be considered to have blurring. On the contrary, it is regarded as a clear image. Combining the image observation and experimental data analysis, this paper sets the judgment threshold of slight blurring to 100, and the detection results show that 40% of the images in the first original dataset have variance values lower than this threshold, indicating that the original UAV image data have a more common slight blurring phenomenon. As shown in Figure 3.
In addition, the colors of withered leaves, tea tree branches, and soil in the image background are similar to those of leaf blight spots. This can easily cause false detection of leaf blight. At the same time, the blight spots are also small and sometimes densely distributed, making them easy to ignore in a complex background. Therefore, this paper proposes a new detection approach that considers lightly blurry conditions in UAV remote sensing images. The goal is to overcome these challenges and improve the accuracy of leaf blight detection.

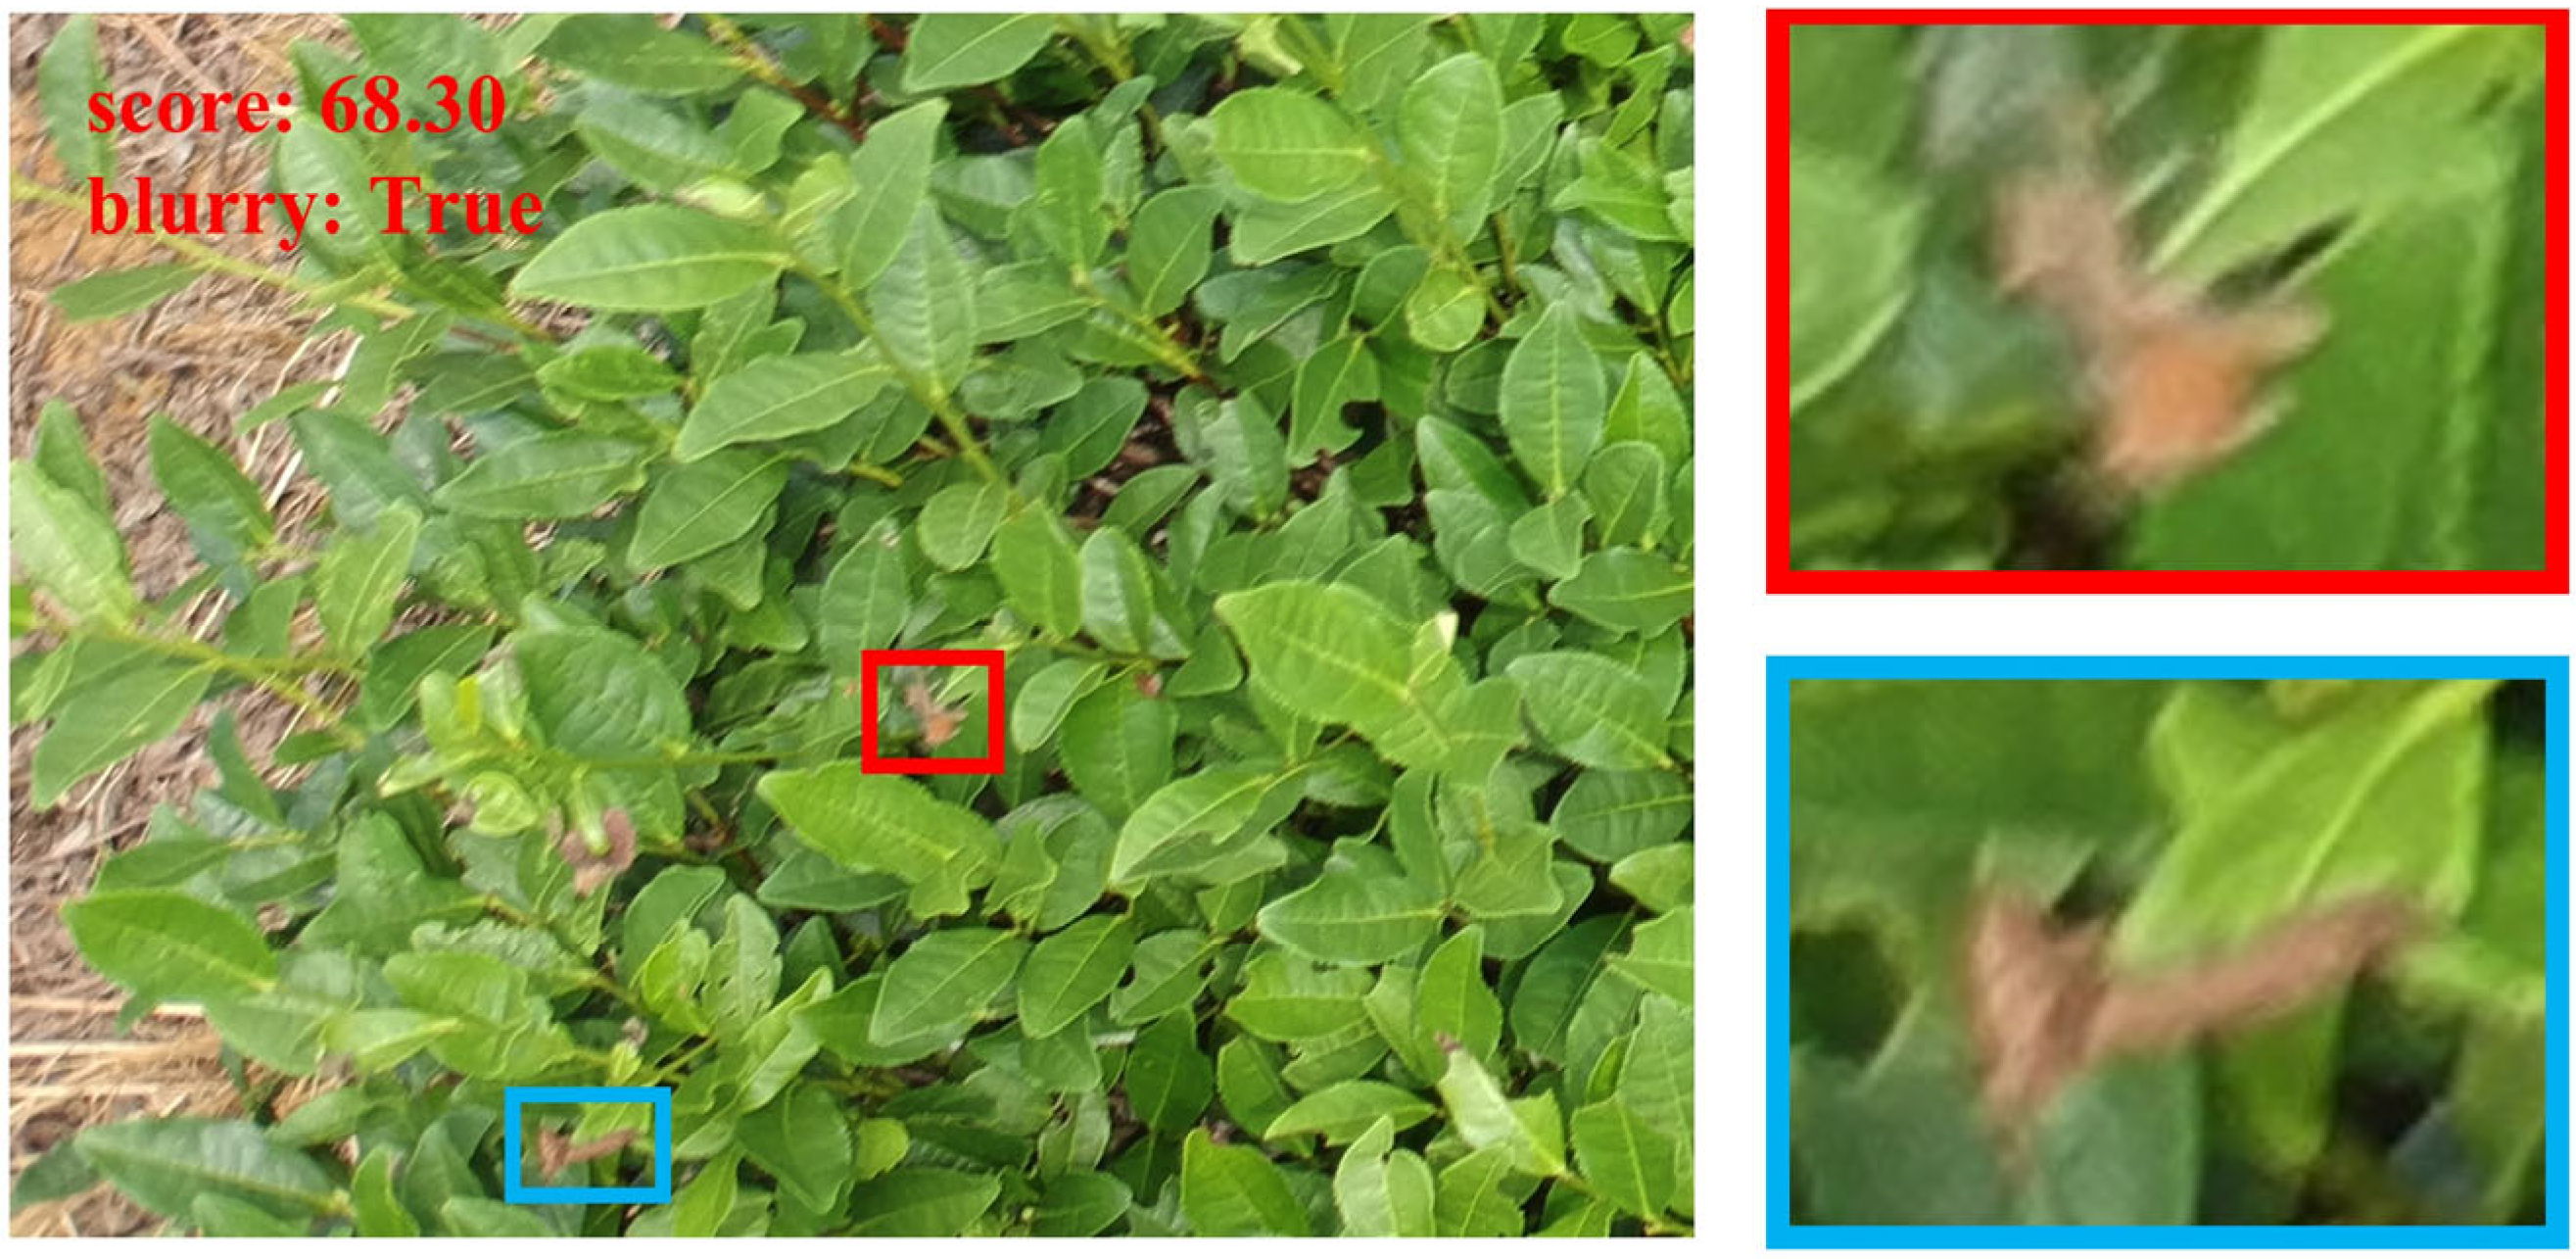
2.1.2. Data Preprocessing

Labeling [22] was employed to manually annotate the tea leaf blight lesions. The labeling information was saved in extensible markup language (XML) files. Because some blight spots are small and densely distributed, annotation was performed with the help of tea disease experts. Several rounds of review were conducted to ensure accuracy. Both datasets were split into training, validation, and test sets using an 8:1:1 ratio. The first dataset (Tea-First-Original) contains 145 training images, 18 validation images, and 18 test images. The second dataset (Tea-Second-Original) includes 135 training images, 16 validation images, and 18 test images.

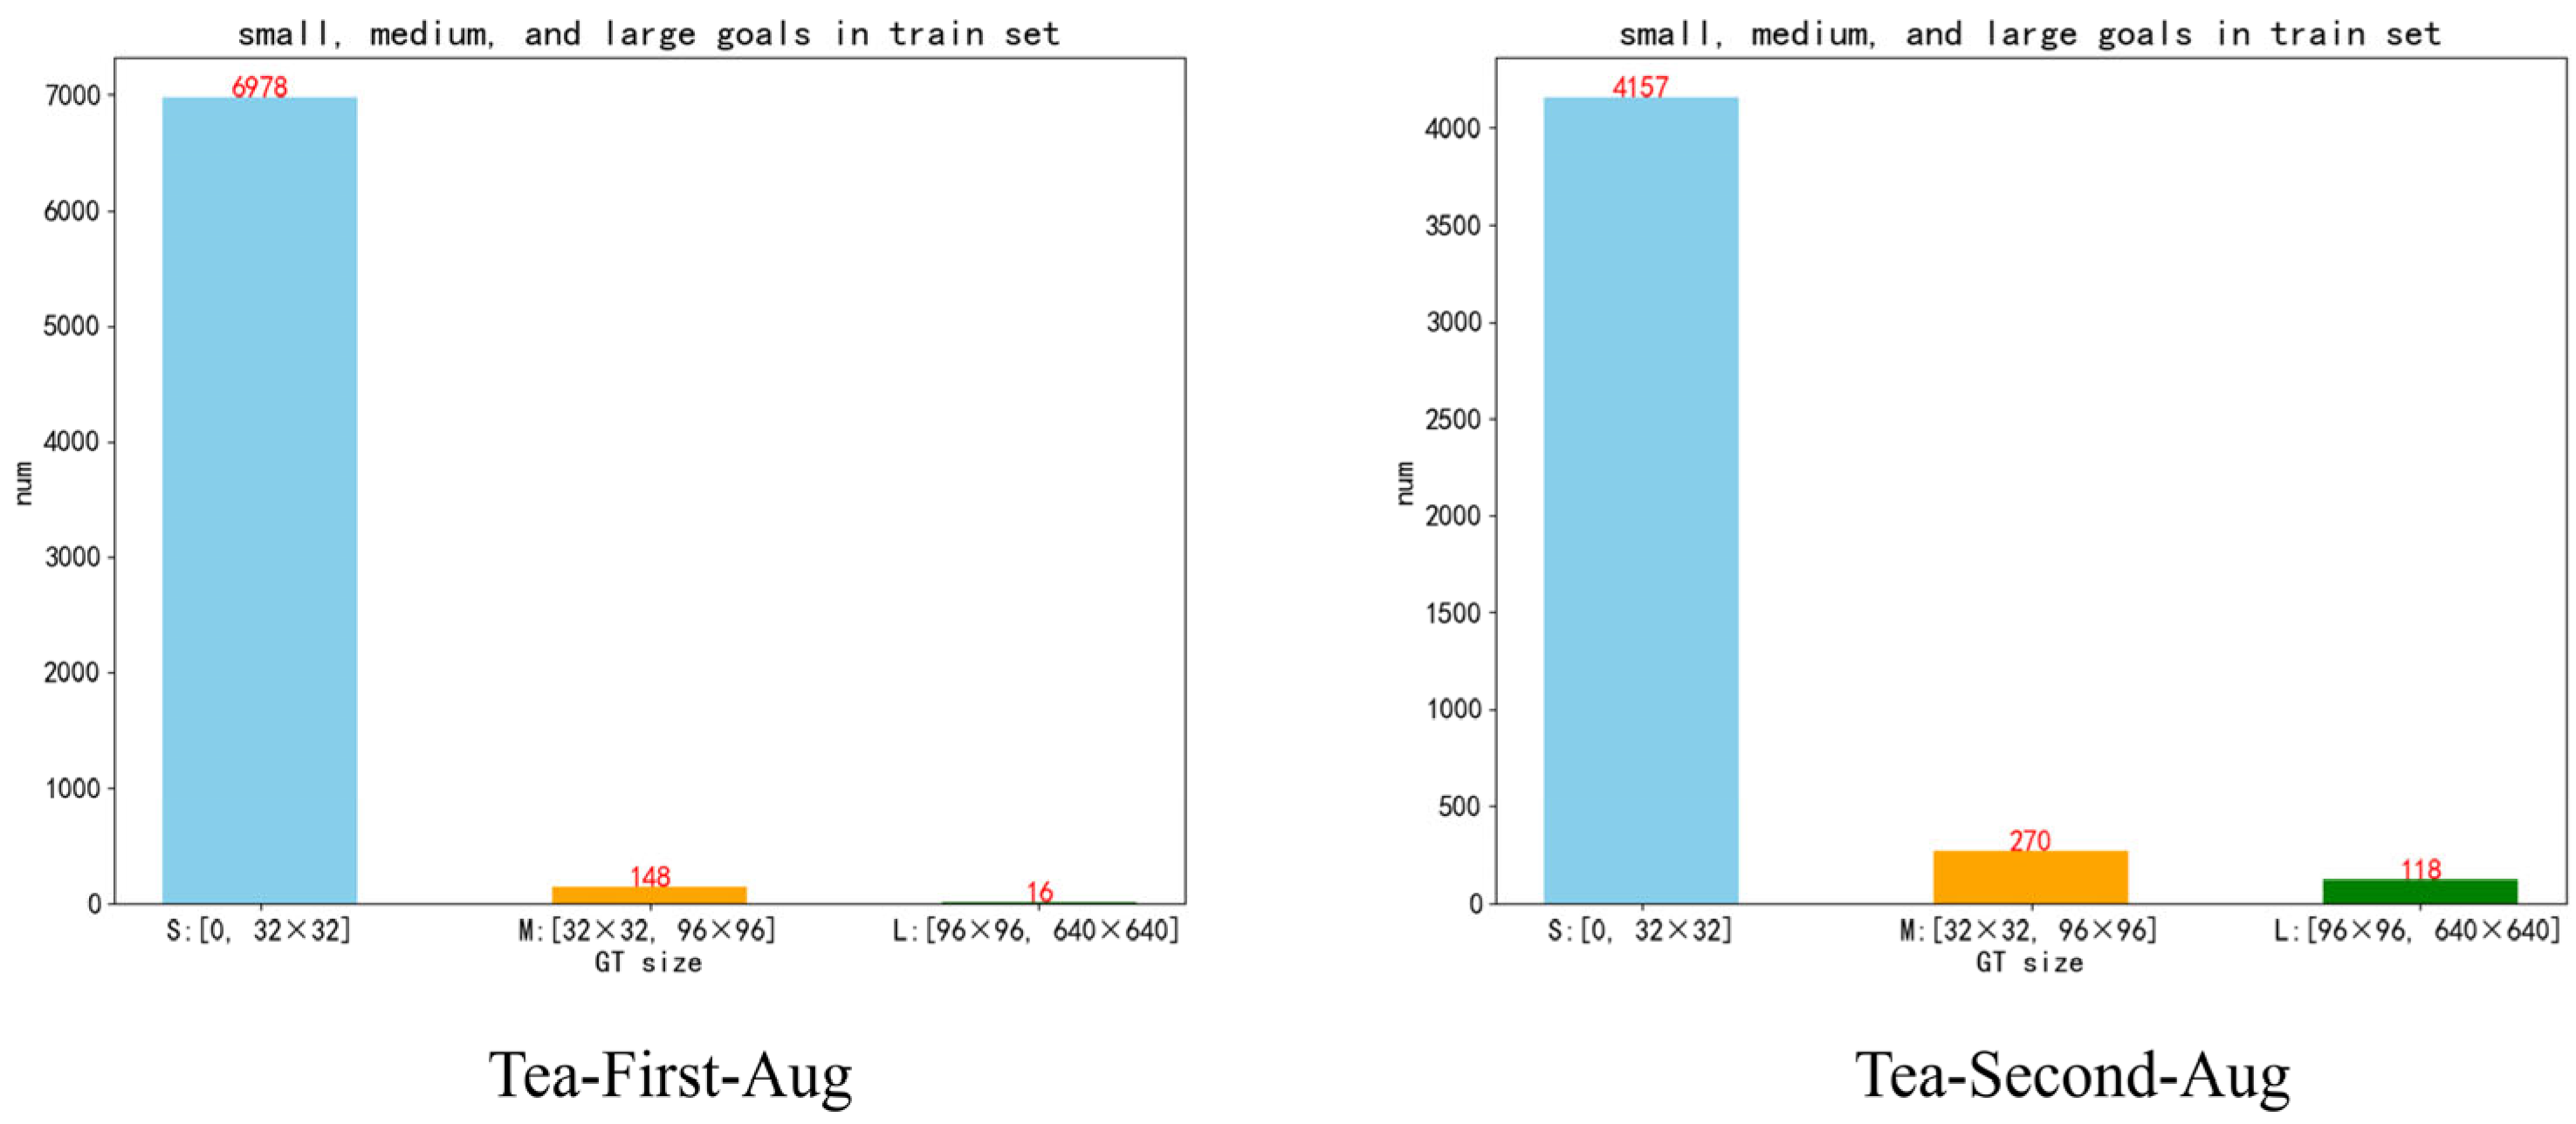
2.1.3. Augmentation of Datasets

Tea trees are generally planted in areas with high altitudes, warm and humid climates, and high rainfall. To simulate the various complex situations that could occur in the real-world environment of tea farms and improve the model’s generalization, various data augmentation techniques were used. These include (1) geometric deformation: “rotate”, “flip”, “scale”, “adjust size”; (2) color change: “simulate the change of the weather (rain and fog)”, “adjust brightness”, “adjust saturation”, “adjust hue”. The specific effects are shown in Figure 4. By randomly applying geometric and color transformations, the Tea-First-Original dataset was augmented to create Tea-First-Aug. The training set of Tea-First-Aug contains 800 images with 8316 leaf blight spot targets. The validation set contains 96 images with 1110 targets. Tea-Second-Original applies the same data augmentation methods as above. In addition, Gaussian blur and Gaussian noise are used to simulate image blur. The final Tea-Second-Aug dataset includes 1120 training images, 146 validation images, and 18 test images. Both datasets include a large number of small target instances, as shown in Figure 5.

2.2. Methodologies

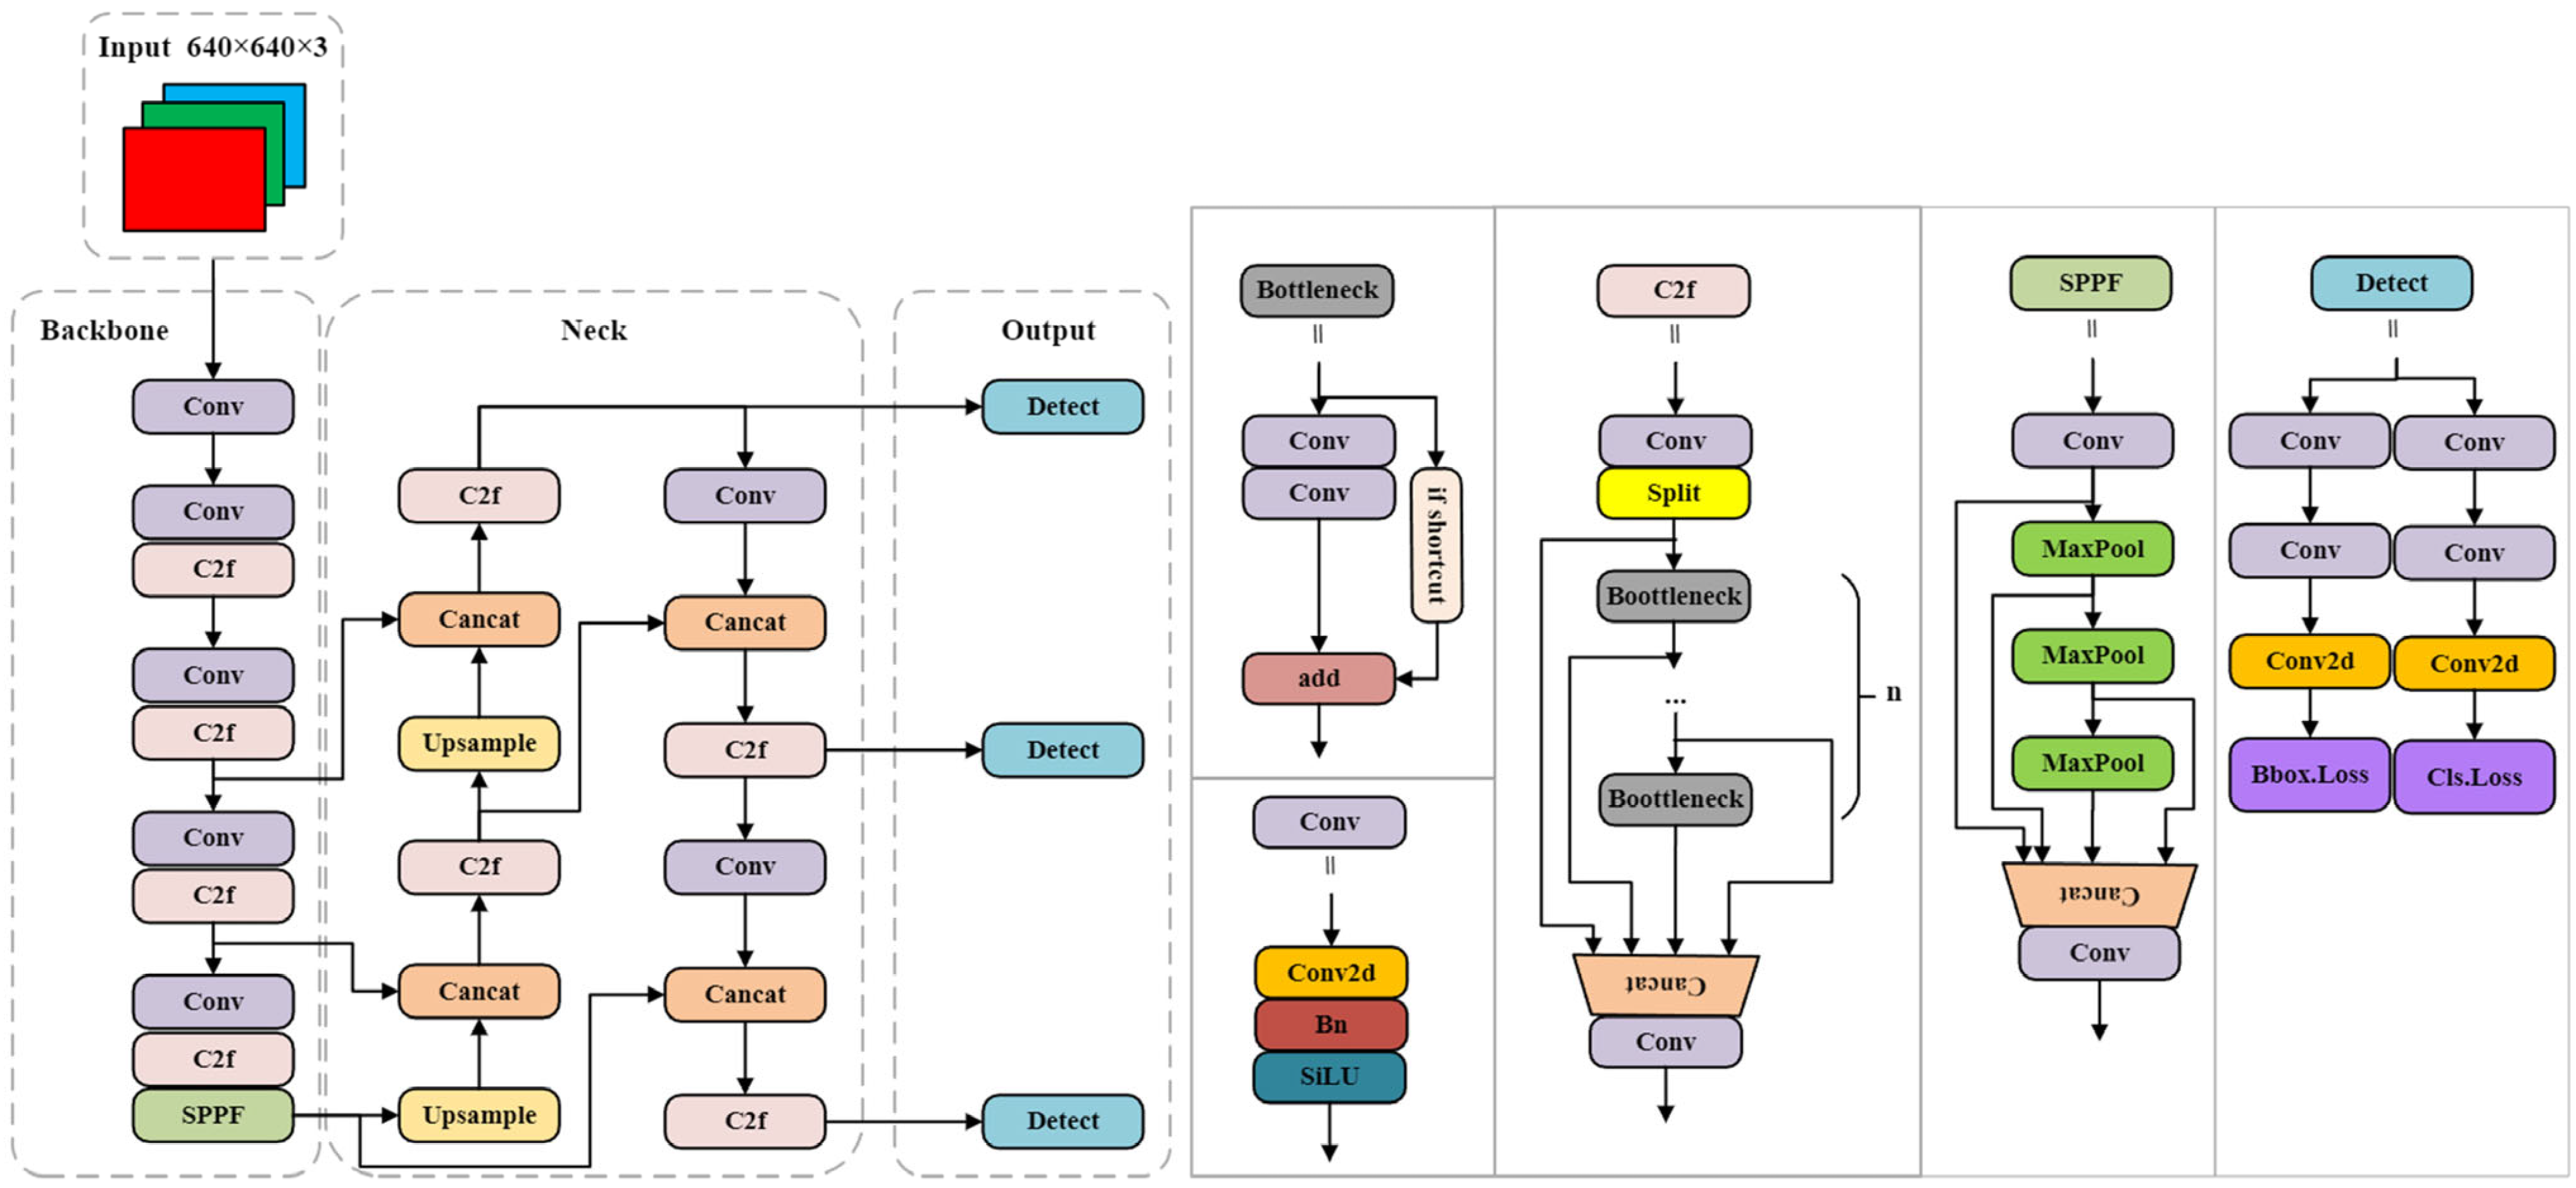
2.2.1. Baseline Model
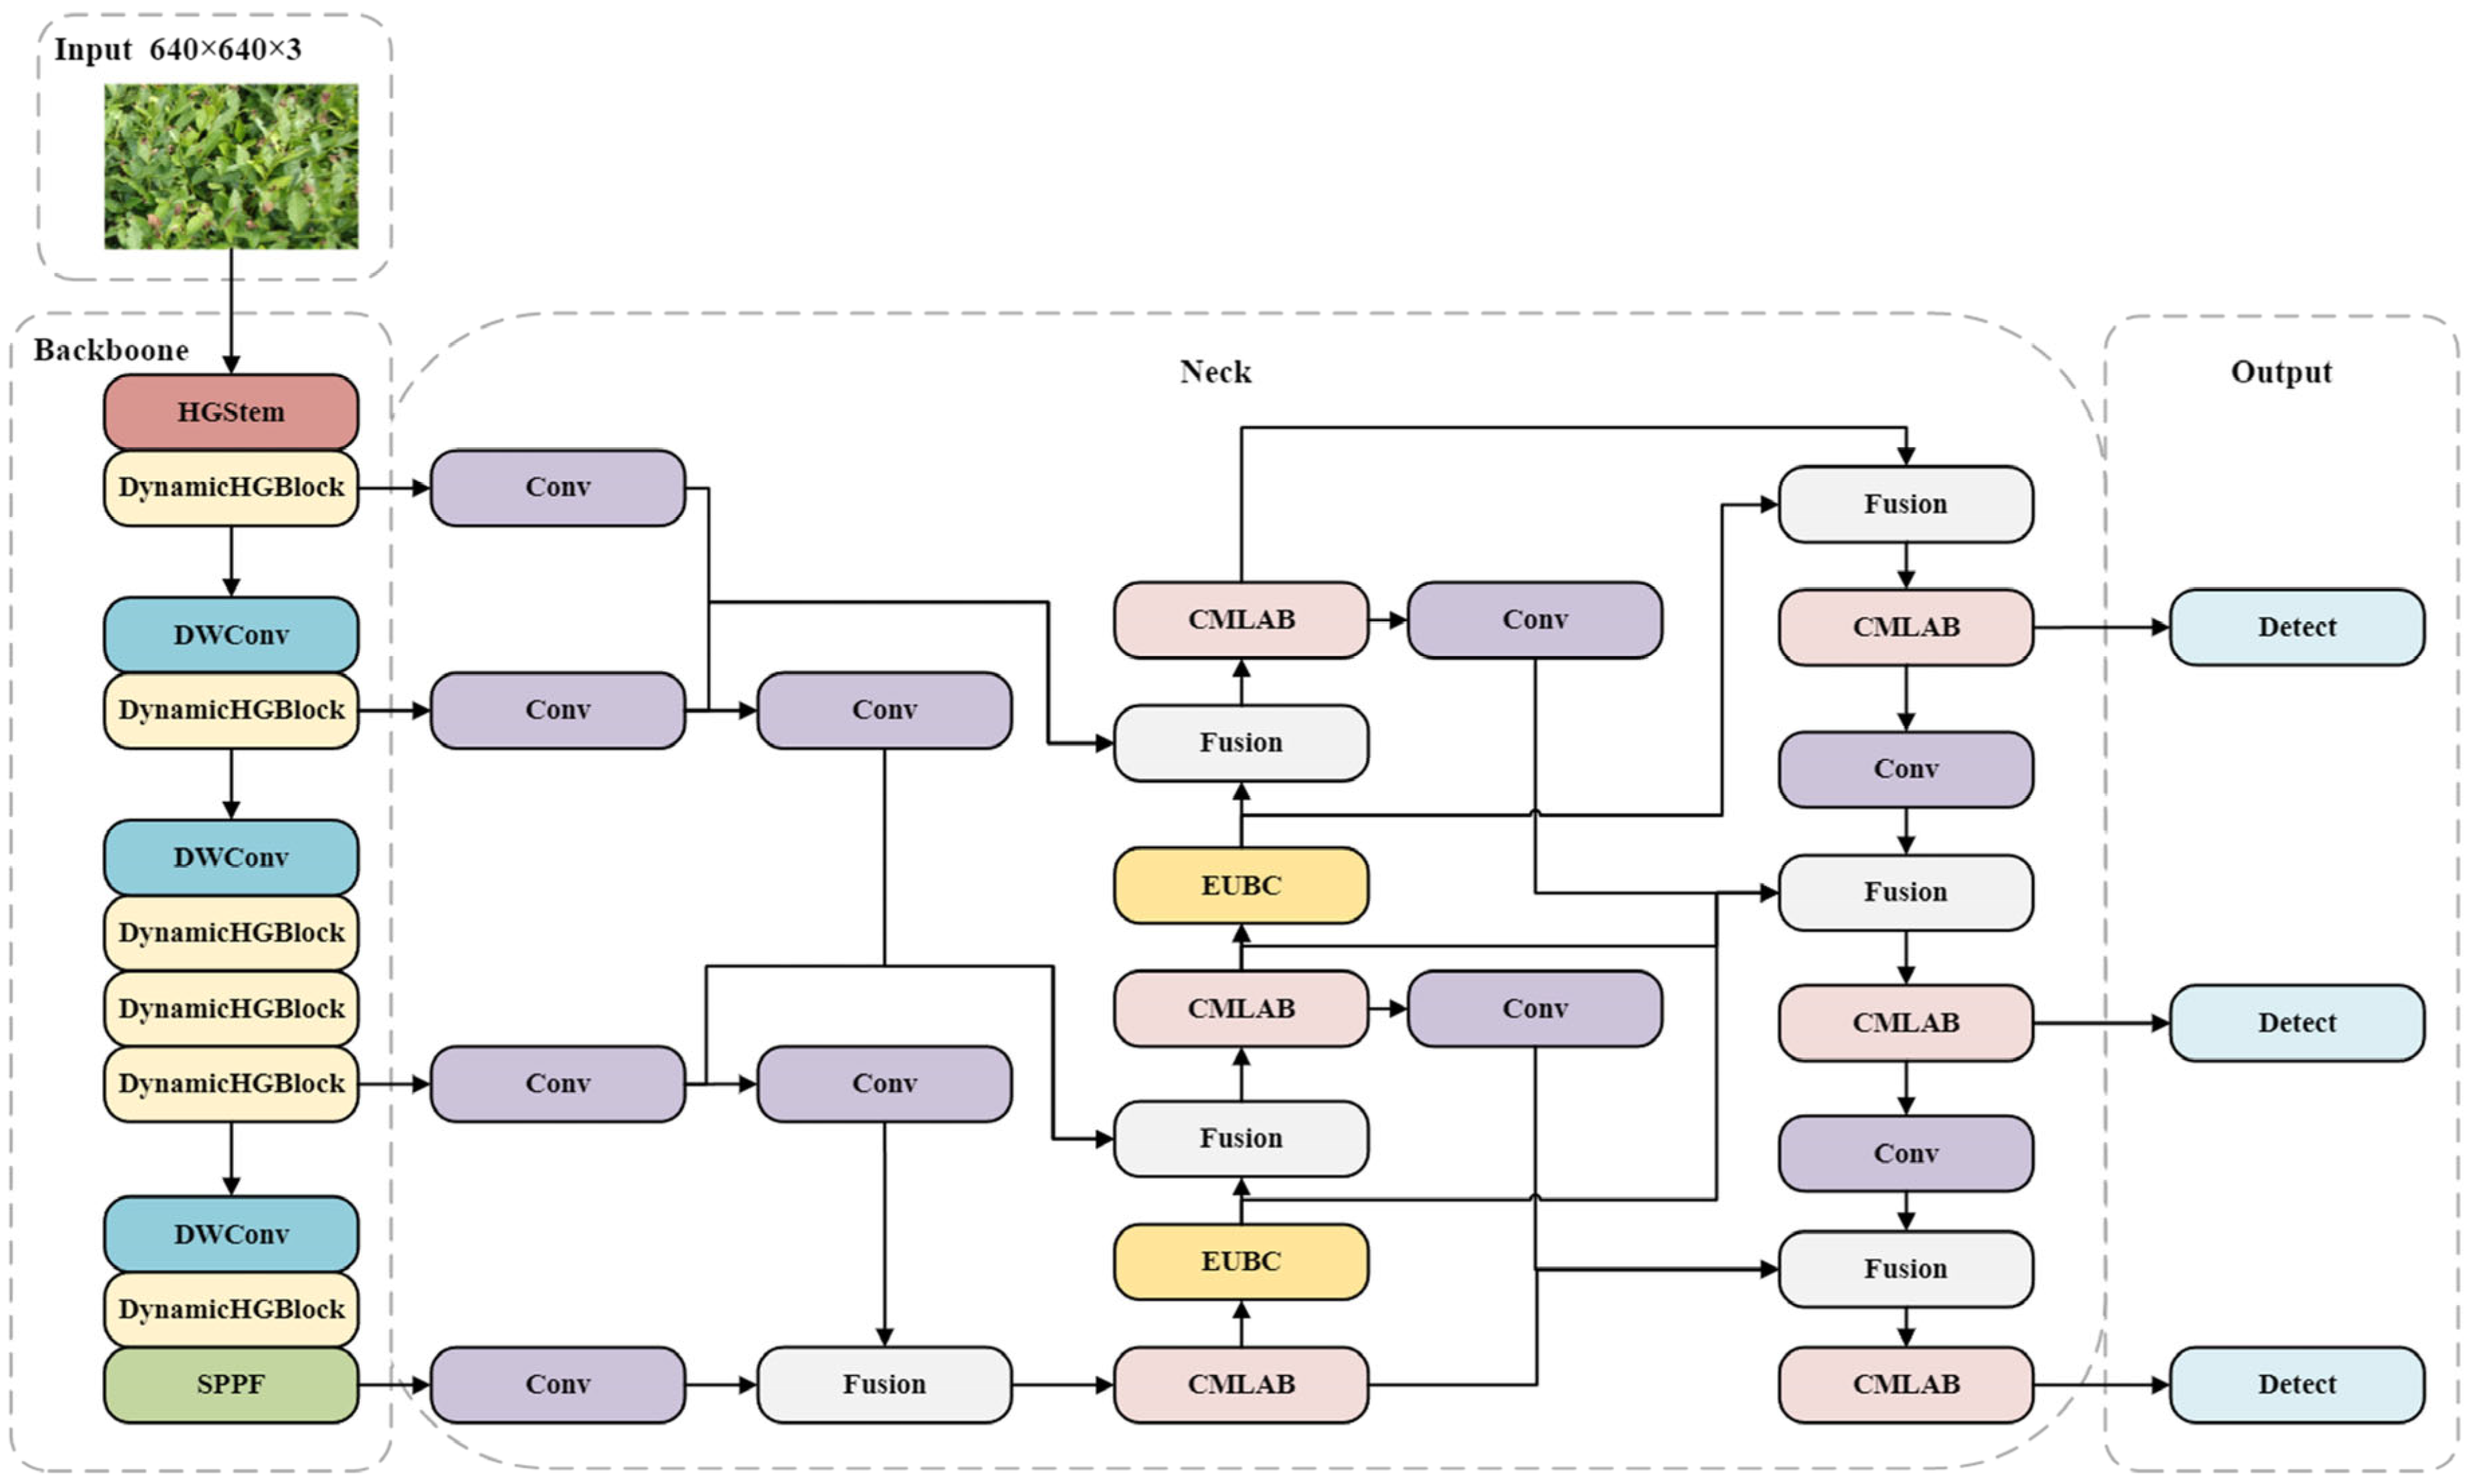
YOLOv8, released by Ultralytics in 2023, is a highly efficient single-stage object detection algorithm known for its accuracy, speed, and versatility. Its architecture comprises four key components: the input module, backbone, neck, and detection head.
The backbone, inspired by CSPDarknet53, replaces the traditional C3 [23] module with the lighter and more efficient C2f module. This change enhances gradient flow and reduces computation. The SPPF module further improves feature extraction. The neck follows the PAN-FPN design from YOLOv5 but removes convolution layers in the upsampling path and adopts the C2f module to enhance multi-scale feature fusion. The anchor-free detection head directly predicts object centers and dimensions, simplifying the pipeline by removing anchor boxes. It uses a decoupled head to separate classification and regression, and applies CIoU loss to optimize overlap, center distance, and aspect ratio. This boosts accuracy and lowers computational cost.
The overall YOLOv8 architecture is illustrated in Figure 6. To balance detection performance and deployment efficiency on resource-constrained edge devices such as UAVs, YOLOv8n is selected as the baseline model for tea tree leaf blight detection. However, due to limited computational resources in agricultural scenarios, further optimization is needed to fully exploit the model’s advantages.

2.2.2. DEMNet Model

To tackle the common issue of slight blurring in UAV remote sensing images and the challenges of detecting tea leaf blight lesions, such as small target size, scale variation, and complex backgrounds. This paper proposes a novel lightweight detection model, DEMNet. Its network architecture is shown in Figure 7. By optimizing the network structure and feature fusion mechanism, DEMNet greatly improves the detection accuracy of small and blurry targets. It also reduces the parameter complexity found in existing algorithms, making practical deployment more feasible.
The technical improvement strategy in this paper includes three core modules. First, DynamicHGNetV2 is used as the backbone to replace the original YOLOv8n structure. By combining the HGBlock module with the Dynamic convolution [24], the network can adaptively adjust convolutional kernel parameters based on the degree of target blurring. This improves the perception of blurry regions. Next, the EMAFPN structure is introduced to replace the traditional PAN-FPN in the neck. The EMAFPN realizes the fusion of high-level features with low-level features through an efficient multi-branch fusion structure, thus making full use of the low-level features to enhance the detection ability of edge targets and small targets [25]. The model complexity is reduced without affecting the detection accuracy of the model. Finally, the CMLAB (C2f-Multi-scale-LocalAttentionBlock) module is innovatively constructed to replace the standard C2f structure. This module introduces an improved MSLA module to replace the original bottleneck module while retaining the C2f multilevel fusion and cross-layer connectivity. The MSLA module integrates multi-scale convolution (MSCB) [26] and a local attention mechanism (LWA). MSCB utilizes different receptive fields to fuse multi-scale contextual features to effectively compensate for semantic deficiencies in ambiguous regions. Meanwhile, LWA enhances the feature extraction of blurry small targets through the local window mechanism. Experimental results show that this three-part optimization strategy significantly improves both detection accuracy and inference speed. It offers an innovative solution for intelligent disease detection in complex agricultural environments.

2.2.3. DynamicHGNetV2 Backbone Network

YOLOv8, as a general-purpose detection framework, has excellent feature extraction capability in its backbone network. However, the complex hierarchical structure results in high computational demands, making it difficult to deploy on edge devices such as UAVs. For this reason, this paper conducts performance comparison experiments on a variety of mainstream lightweight networks, and the results are shown in Table 1.
The experimental data show that MobileNetV4 [27] achieves the highest detection accuracy (mAP@0.5 of 82.2%). However, its parameter count, computational load, and model size are much larger than those of the benchmark model, which limits its use on resource-constrained devices. In contrast, HGNetV2 [28] surpasses MobileNetV4 in terms of parameters (2.3 M), computation (7.0 GFLOPs), and model size (5.0 MB), with only a slight 0.3% reduction in accuracy. It also outperforms most other models in overall performance. Therefore, HGNetV2 is selected to replace the basic YOLOv8n backbone for the target detection task.
The HGNetV2 network is derived from RT-DETR [29] and consists of three core components: HGStem, HGBlock, and DWConv. HGStem serves as the initial module of the backbone network, which realizes efficient spatial information encoding through the dual-path fusion mechanism. As shown in Figure 8. The module adopts a composite structure of five-layer convolution and one-layer maximum pooling, and innovatively designs parallel processing paths. The pooling path performs feature compression on the feature map and retains significant semantic information. The convolution path extracts local detail features by two sets of 2 × 2 convolutions. The outputs of the two are fused by channel splicing to form a composite feature with both detailed and global information. The design enhances the feature expression capability while reducing the computational effort.
HGBlock is a key module in HGNetV2. It adopts a multi-level convolutional cascade structure with cross-layer feature transmission at each level. Multi-scale features are fused via channel concatenation, followed by a 1 × 1 convolution for channel compression. If the input and output channels are the same, a residual connection is added to preserve shallow features, reduce the vanishing gradient problem, and improve network stability.
Although HGNetV2 balances lightweight design and accuracy, challenges such as image blurring and target degradation remain in UAV remote sensing scenarios. To further improve the generalization ability of the model in such environments, this paper introduces the DynamicConv mechanism into HGBlock and proposes the improved Dynamic_HGBlock module, as shown in Figure 9. The new backbone network, DynamicHGNetV2, is finally constructed.
Specifically, DynamicConv employs a set of predefined convolutional kernels W ~ k ,   b ~ k , where k denotes the number of kernels. For each input x, attention weights π k are computed via an attention mechanism. These weights are then used to perform a weighted aggregation over all kernels, resulting in the dynamic convolutional parameters { W ~ , b ~ } . The effective formulation is given by the following:
W ~   = k π k x W ~ k
b ~   = k π k x b ~ k
The weights π k are obtained through a softmax operation, satisfying the constraints k = 1 k π k x = 1 and 0     π k x     1 . In the attention mechanism, DynamicConv adopts the squeeze-and-excitation (SE) [30] module to generate attention weights. Unlike the conventional SE mechanism that operates on output channels, this approach acts across convolutional kernels. It dynamically adjusts its contributions based on receptive field size and directional sensitivity. This method maintains low computational overhead while providing strong modeling capacity.
The input x is then processed by the aggregated convolutional kernel to produce the final output:
y = g ( W ~ T x x + b ~ x )
where g denotes the activation function. The whole implementation of DynamicConv is shown in Figure 10.
When dealing with blurry and small-scale targets, DynamicConv leverages its multi-kernel fusion and input-adaptive perception to overcome the limitations of static kernels in capturing fine details and boundaries. It dynamically adapts to each input and combines kernels with different receptive fields and directions. This approach enhances the representation of subtle textures and object edges, greatly improving robustness in degraded target scenarios. As presented in Table 2, integrating dynamic convolution boosts detection accuracy to 83.1%, marking a 1.2% improvement over the original HGBlock. Although the number of parameters rises slightly, the overall computation (GFLOPs) decreases, indicating more efficient parameter utilization.
DWConv (depthwise separable convolution) [31], a core component of lightweight networks, is composed of depthwise and pointwise convolutions. Separating spatial filtering from channel transformation substantially reduces computational complexity compared to standard convolution. In HGNetV2, it serves both as a feature extractor and a key mechanism for enhancing computational efficiency.

2.2.4. EMAFPN Structure
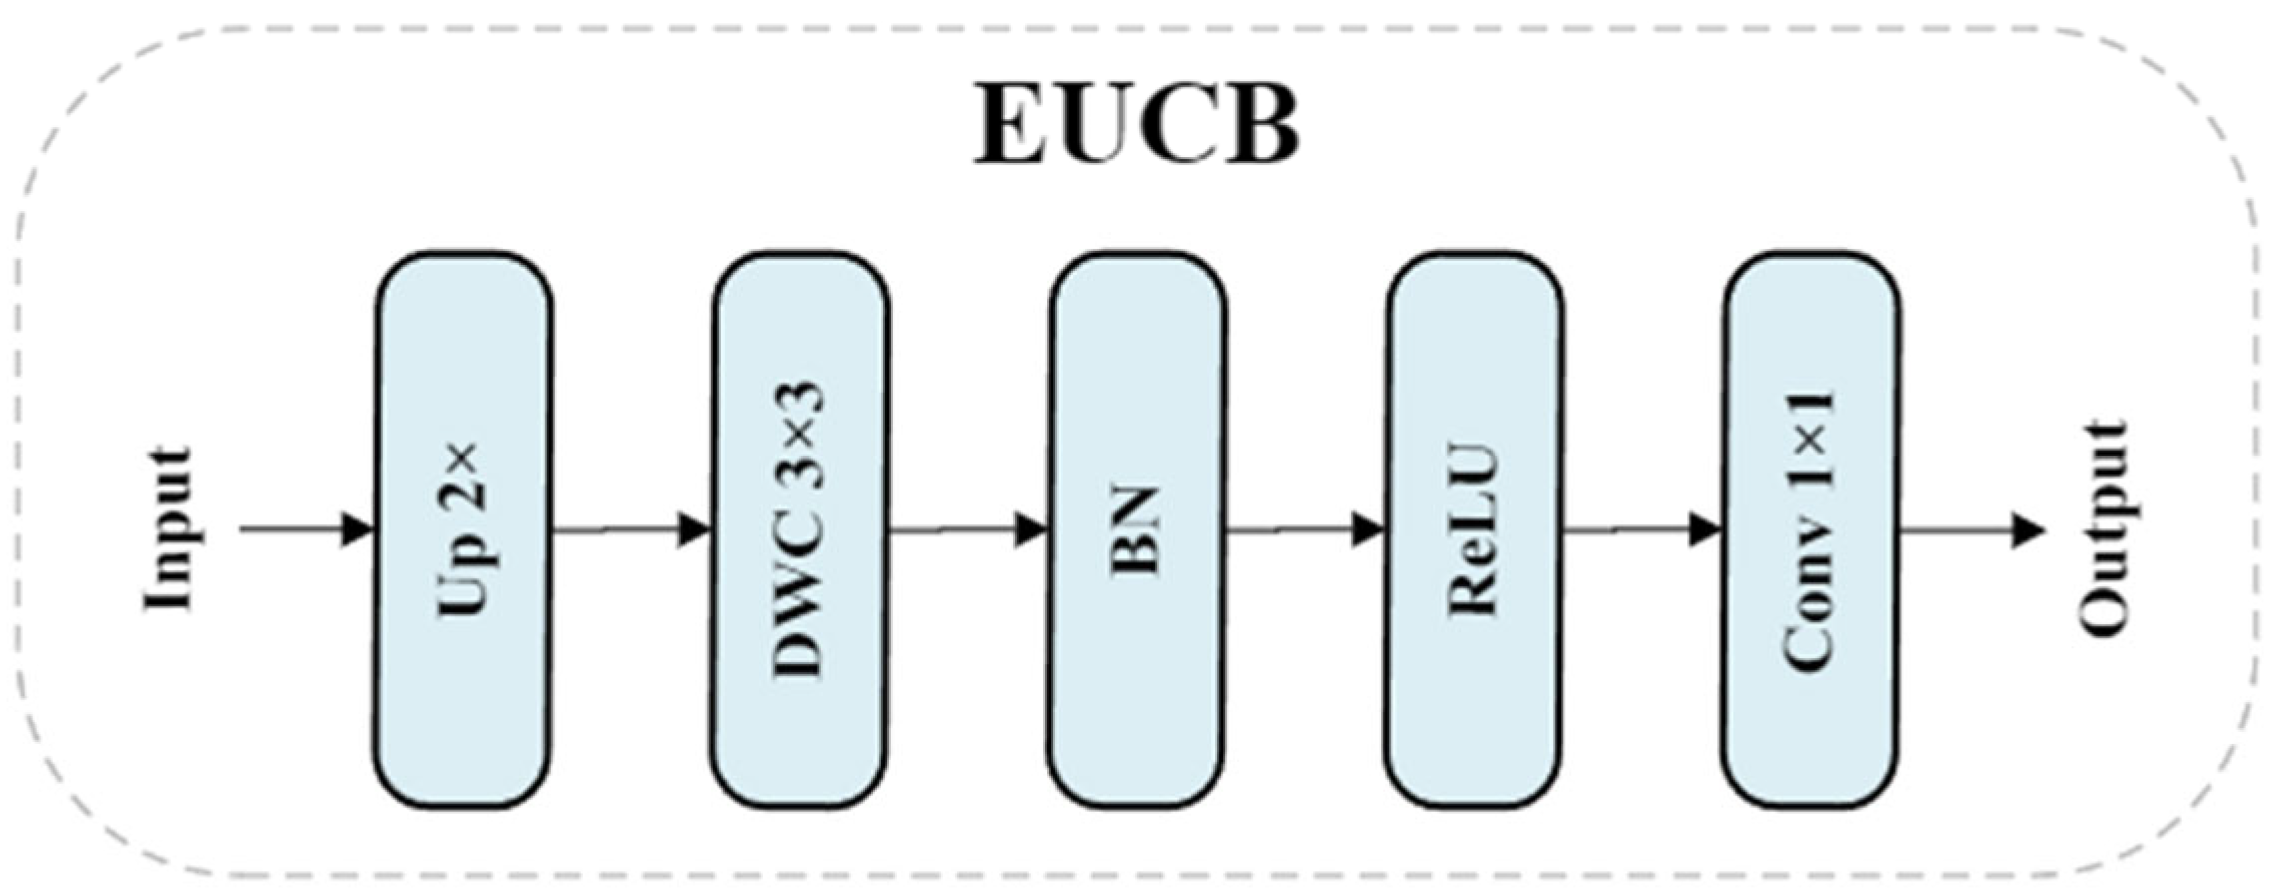
The original YOLOv8 adopts PAN-FPN (path aggregation network-feature pyramid network) to enhance multi-scale target detection through bidirectional feature fusion. In this structure, FPN aggregates high-level semantic features via a top-down pathway, combining them with low-level spatial features to achieve semantic and spatial complementarity. PAN introduces a bottom-up pathway that passes detailed low-level features upward, forming a bidirectional, cross-scale interaction mechanism. This dual-path design enables multi-level feature integration and strengthens the network’s ability to detect targets at different scales.
However, PAN-FPN has limitations for small and blurry targets. On the one hand, its feature fusion method lacks adaptivity and is difficult to be flexibly adjusted according to the task requirements. On the other hand, low-level detail features are underutilized, making it difficult to extract key information for small target detection and limiting the model’s expressive power.
To address these limitations, EMAFPN replaces the traditional PAN-FPN. EMAFPN improves the detection of small and blurry objects and reduces the computational cost. As illustrated in Figure 11, unlike PAN-FPN, which focuses on same-scale feature fusion, EMAFPN emphasizes cross-level interactions between deep and shallow features. The fusion is not limited to features of the same resolution but also incorporates high-resolution layers, thereby preserving richer semantic and detailed information more effectively.
To reduce the computational cost, EMAFPN adopts a uniform 256-channel configuration across all scales, as opposed to the traditional approach where different scales use different numbers of channels (e.g., P3: 128, P4: 256, P5: 512). This uniform approach prevents the exponential growth of parameters and computation in high-level feature maps, easing the overall computational burden. Furthermore, EMAFPN replaces the conventional concatenation (Concat) [32] strategy with an addition-based (Add) fusion mechanism. As shown in Table 3, the Add fusion strategy integrates multi-scale feature maps through simple element-wise addition. This method efficiently highlights key information and keeps computational overhead low. Compared with Concat fusion, the Add approach improves the mAP@0.5 by 0.5%. From the perspective of model complexity and resource consumption, the Add fusion strategy consistently outperforms Concat in terms of parameter count, FLOPs, and model size. This demonstrates its superior lightweight characteristics. Meanwhile, EMAFPN upgrades the original upsampling method to an efficient upsampling and convolution module (EUCB) [26]. The EUCB module improves feature map resolution while maintaining computational efficiency.

2.2.5. EUCB Module

To improve feature map resolution and enhance multi-scale feature fusion, EMAFPN introduces the EUCB module, as shown in Figure 12. This module progressively upsamples feature maps at each stage, aligning spatial dimensions and channel numbers with the next connection point. This enables efficient cross-layer feature fusion.
The core idea of EUCB is to improve upsampling quality while maintaining computational efficiency. First, the module upsamples the input feature map, doubling its spatial resolution to capture more details. Next, a 3 × 3 depthwise convolution (DWConv) extracts contextual features and reduces the computational cost. Then, batch normalization and ReLU activation functions are applied to introduce nonlinear mappings, enhancing feature representation and accelerating network convergence. Finally, a 1 × 1 convolution adjusts the channel number to match the subsequent network structure, ensuring a smooth feature transition. The overall computational flow of this module can be represented by the following equation:
EUCB x   = C 1 × 1 ReLU BN DWC UP x
Compared to traditional upsampling modules, the EUCB structure is simpler and more efficient, effectively fusing features across scales and enhancing resolution.

2.2.6. CMLAB Module

CMLAB (C2f-Multi-scale-LocalAttentionBlock) is an efficient module for multi-scale convolution and local feature enhancement. Its architecture is illustrated in Figure 13. It is designed to further extract key target information from the Add-fused feature maps in EMAFPN. Building on the lightweight design of the original CSP (cross stage partial) structure and the information flow splitting-fusion strategy, the module introduces an improved MSLA module to replace the original bottleneck module. By embedding multi-scale convolution and a local attention enhancement mechanism into the MSLA module, the model’s perception of features at different scales and spatial positions is significantly strengthened. The specific structure is outlined in the equation.
X 0 ,   X 1 = Split ( Conv 1 x )
M i Z = LWA i ( MSCB i Z )
X i + 1 = M i ( X i )
Y concat = Concat ( X 0 , X 1 ,   , X n )
Y   = Conv 2 ( Y concat )
or simplified representation:
Y = Conv 1 ( Concat X 0 , X 1 , M 1 X 1 ,   , M n X n )
where x denotes the input feature map. A 1 × 1 convolution layer, denoted as Conv 1 , is first applied to expand the channel dimension. The resulting feature is then split along the channel axis into two branches: X 0 and X 1 . X 0 retains the original feature information and is directly forwarded for later concatenation, while X 1 is passed through a series of MSLA modules for deep feature extraction. Each MSLA module includes a multi-scale convolution block (MSCB) and a local window attention (LWA). MSCB expands the receptive field with multi-scale convolution, while LWA enhances local feature representation through spatial window partitioning.
The outputs from the original and evolved branches, including X 0 , X 1 , M 1 X 1 , …, M n X n , are concatenated along the channel dimension. A final 1 × 1 convolution is then applied to fuse cross-level features, producing the output feature map Y . This design uses multi-scale convolution to accommodate different object sizes and integrates local attention to enhance spatial awareness. As a result, it achieves efficient multi-level feature extraction and fusion while maintaining a lightweight architecture. The following sections provide a detailed explanation of the two core components in the MSLA module: MSCB and LWA.
(1) MSCB (multi-scale convolution block): MSCB is an efficient multi-scale convolution module. It aims to improve the model’s adaptability to objects of different scales and to enhance context awareness in ambiguous regions. Its structure is shown in Figure 14. MSCB first expands the input feature channels by 1 × 1 point-by-point convolution PWC 1 with batch normalization and ReLU6 activation function. This step increases the model’s nonlinear modeling capability.
Subsequently, MSDC [26] extracts semantic information from multiple receptive field levels by using deep convolution operations with different kernel sizes in parallel. The architecture of MSDC is shown in Figure 15. The design can fully model the spatial features of the target in a multi-scale context, improving the discriminative power of the model. In remote sensing images with slight blurring, object boundaries are often unclear, and traditional single-scale convolution struggles to capture complete features. MSCB addresses this issue by fusing contextual features from different scales, effectively compensating for semantic gaps in blurry regions. As a result, blurry targets remain well distinguished in the feature space.
In addition, considering the independence problem of DWConv in the channel dimension, MSCB breaks the barrier of channel grouping through the Channel Shuffle operation. This improves information flow and feature fusion between channels, allowing detailed features and global semantics to be fully fused. Finally, the module compresses the channels with PWC2 and applies batch normalization to stabilize feature distribution and model training. The forward propagation of the MSCB module is formally defined as:
MSCB x = BN PWC 2 CS MSDC R 6 BN PWC 1 x
where x is the input feature map. As a key component of the MSLA module, the MSCB strengthens the multi-scale sensing and channel interaction ability without greatly increasing computational complexity. It effectively enhances the model’s capability to detect objects at different scales in complex scenes, while also providing rich foundational features for subsequent detection tasks.
(2) LWA (local window attention): The MSCB module performs initial feature extraction on the add-fused feature maps through multi-scale DWConv and Channel Shuffle operations. However, integrating information from multiple receptive fields can introduce redundancy and reduce focus on key regions. This is especially limiting for blurry targets with strong local features.
To enhance the model’s ability to capture local structural features, this paper proposes the LWA module, inspired by the window-based self-attention mechanism in the Swin Transformer [33]. LWA divides the input image into multiple non-overlapping local windows and performs self-attention computation independently within each window. This greatly reduces the computational cost of traditional global self-attention. By focusing on fine-grained feature interactions within each window, this mechanism improves the model’s ability to represent and perceive local patterns. It is especially effective for capturing edges and textures of densely distributed small objects.
Unlike the linear projection shared by multiple heads in the Swin Transformer, LWA introduces cascaded group attention (CGA) [34] to design independent convolutional feature transformation paths for each attention head. This mechanism optimizes both feature enhancement and computational efficiency through the group cascading mechanism. The structure of the CGA module is shown in Figure 16.
The CGA module leverages the concept of group convolution by dividing the input features into subsets along the channel dimension. Each attention head processes one subset independently. The specific formula can be expressed as follows:
X i = X i 1 , X i 2 , , X ih
X ~ ij =   Attn X ij W ij Q , X ij W ij K ,   X ij W ij V
X ~ i + 1 =   Concat [ X ~ ij ] j = 1 : h W i P
where X i denotes the input features of the i -th layer. X ij is the j -th subset of the input feature X i with 1     j     h , and h is the total number of attention heads. W ij Q , W ij K , and W ij V are the linear projection matrices for the Q, K, and V of the j-th head, respectively, used to transform the corresponding feature subset. After the Q projection, a token interaction layer is introduced to help self-attention capture both local and global dependencies, enhancing feature representation. W i P is a linear projection layer that maps the concatenated outputs of all attention heads back to the original feature dimension. This grouping strategy effectively reduces the computational complexity of the Q, K, and V projections and avoids information interference and redundant computation caused by global channel-wise modeling.
Building on this, CGA introduces a cascaded structure that establishes sequential dependencies among attention branches. The input to each attention head consists not only of its assigned feature subset but also incorporates the output from the preceding head. The formulation is as follows:
X ij = X ij + X ~ i ( j 1 )
where X ij denotes the sum of the j -th input subset X ij and the output X ~ i ( j 1 ) from the ( j 1 ) -th attention head. This approach helps progressively enhance the response of important regions, improving the model’s ability to capture local details and focus on target areas.
Moreover, CGA integrates multi-scale depthwise convolution into each attention head to capture spatial context with varying receptive fields, enhancing multi-scale modeling capability. It also adopts a relative position-based attention bias strategy by encoding the relative spatial offsets between pixel pairs within each window, explicitly injecting positional information. This improves the model’s awareness of spatial structure and addresses the limitations of traditional attention mechanisms in position modeling.

2.3. Experimental Setup and Metrics

2.3.1. Experimental Setup

Table 4 details the configuration information of the hardware and software environments during the experiment to ensure consistency and fairness throughout the experimental evaluation process.
Table 5 presents the core training parameters, manually optimized to ensure experimental controllability and result reproducibility.

2.3.2. Evaluation Metrics

To evaluate the impact of each component in DEMNet, we assess detection performance using precision (P), recall (R), average precision (AP), mean average precision (mAP), number of parameters (M), GFLOPs, and memory usage. The calculation methods for some of these metrics are as follows:
P   = TP TP + FP
R   = TP TP + FN
AP   = 0 1 PdR
mAP   = i = 1 n A P i n
True positive (TP) refers to diseased spots correctly detected by the model. False positive (FP) indicates healthy leaf areas or backgrounds mistakenly classified as diseased. True negative (TN) is the non-diseased areas correctly excluded, while false negative (FN) refers to diseased spots that were missed. Precision (P) measures the proportion of predicted diseased areas that are truly diseased, reflecting the model’s ability to avoid false detections. Recall (R) represents the proportion of actual diseased areas successfully detected, reflecting the model’s detection coverage. Together, precision and recall evaluate the model’s performance in localizing and classifying diseased areas under complex tea garden conditions. Average precision (AP) is calculated as the area under the precision-recall (P-R) curve for each category. The mean average precision (mAP) is the average AP across all categories and is used to evaluate overall detection performance. This study adopts mAP@0.5, mAP@0.75, and mAP@0.5:0.95 as the main evaluation metrics. These are based on IoU (Intersection over Union), which measures the overlap between predicted and ground-truth regions. mAP@0.5 allows loose matching, mAP@0.75 requires stricter localization, and mAP@0.5:0.95 averages results over IoU thresholds from 0.5 to 0.95, offering a comprehensive performance measure.

3. Result

3.1. Ablation Experiment

To evaluate the effectiveness of each improvement in DEMNet, we conducted ablation experiments, as shown in Table 6. YOLOv8n serves as the baseline (Model 1), providing a reference for evaluating other variants (Models 2–8), each integrating different module combinations.
Individually introducing the lightweight backbone DynamicHGNetv2 (Model 2), the efficient multi-branch fusion structure EMAFPN (Model 3), and the multi-scale convolutional enhancement module CMLAB (Model 4), all led to improvements in detection accuracy while maintaining the model’s compactness.
Models 5, 6, and 7 explore pairwise combinations of the three modules. Although Model 5 (DynamicHGNetv2 + EMAFPN) achieved the smallest model size (3.8 MB), its accuracy was only on par with the baseline, revealing limitations of the C2f module in multi-branch fusion. In contrast, Model 6 (DynamicHGNetv2 + CMLAB) showed strong complementarity, achieving an mAP@0.5 of 82.9% with just 5.2 MB of memory usage.
Model 8, integrating all three modules, delivered the best overall performance. Recall increased by 5.7 percentage points to 77.8%, mAP@0.5 improved by 4.9 points to 85.2%, and both parameter count and FLOPs were reduced by 43.3% and 24.7%, respectively. Although its size (4.2 MB) is 10% larger than Model 5, it still meets lightweight model standards.

3.2. Comparative Experiment

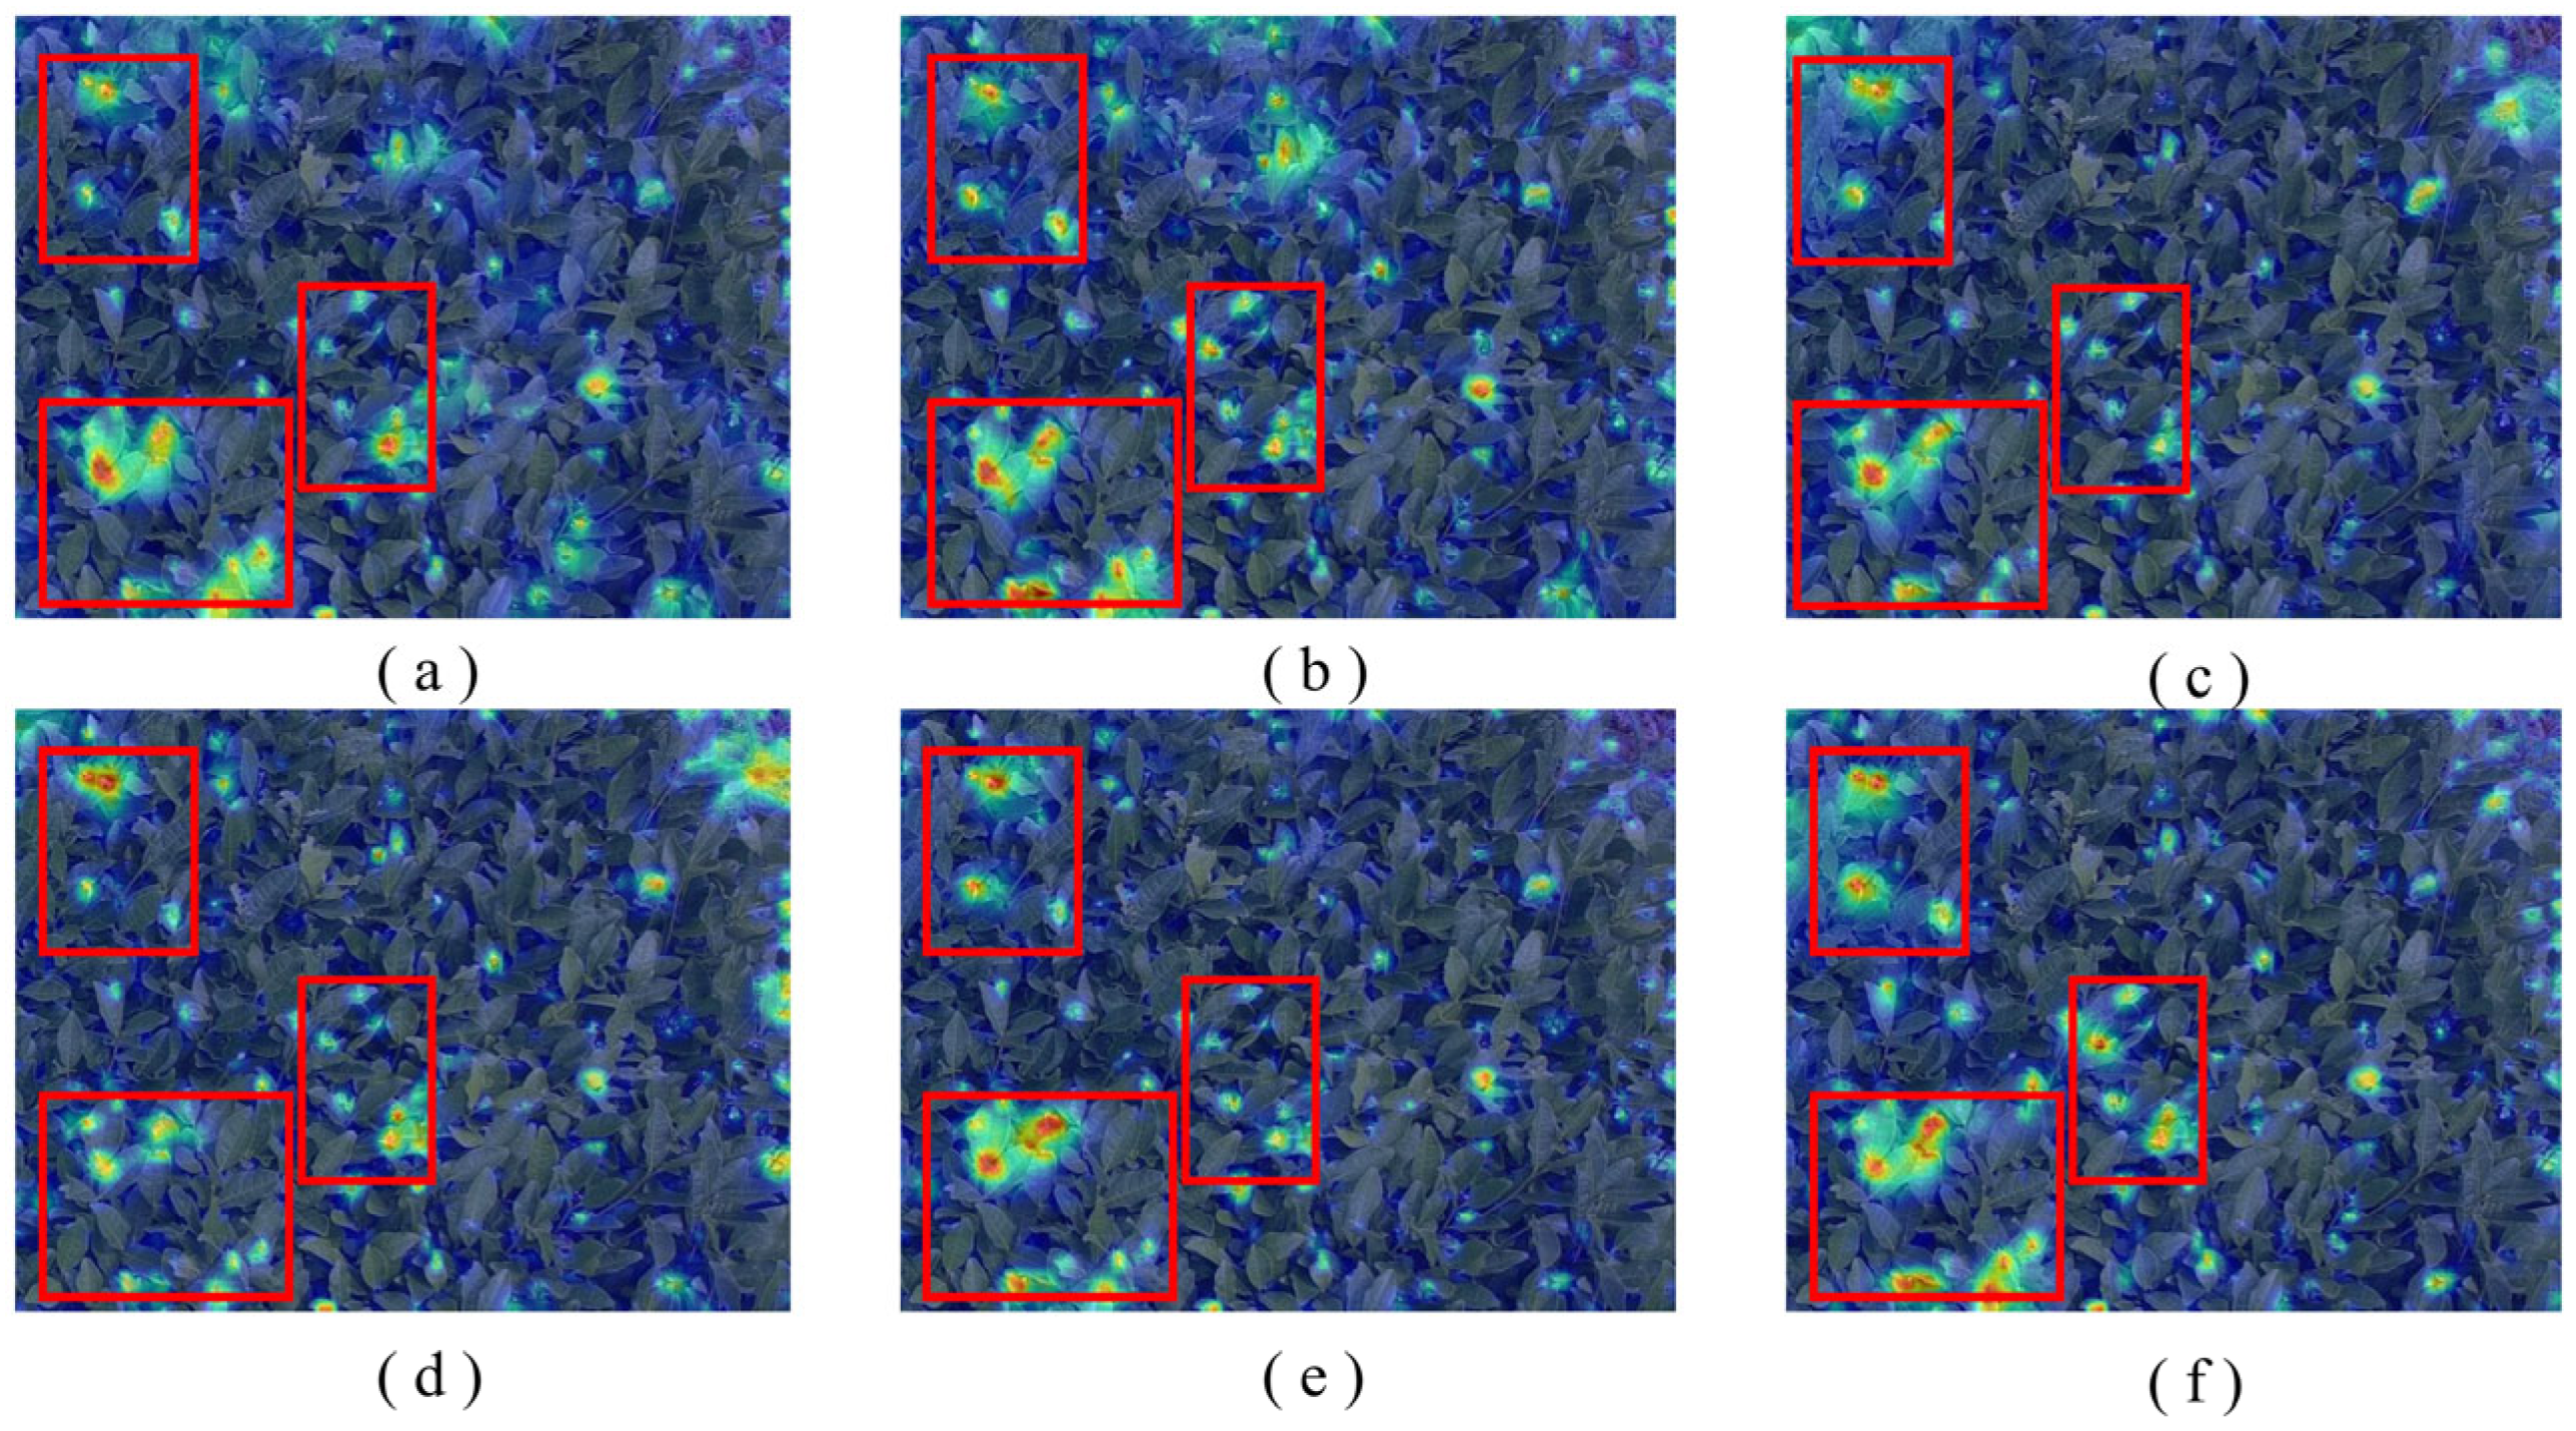
3.2.1. Comparative Study on Attention Mechanism

To evaluate the effectiveness of the LWA module in DEMNet, we integrated several mainstream attention mechanisms (CBAM [35], TripletAttention [36], SimAM [37], and CoordAtt [38]) into the MSCB module to construct various CMLAB variants for systematic comparison, as shown in Table 7.
Results show that without any attention mechanism, the model achieves a recall of 75.8% and mAP@0.5 of 82.9%. After introducing LWA, recall increases to 77.8% and mAP@0.5 to 85.2%, achieving the best performance. The notable improvement in recall indicates that the local window strategy and cascade group attention mechanism help the model better focus on small and edge objects, significantly enhancing lesion coverage. Although the model’s parameters and GFLOPs slightly increase, the model remains lightweight (4.2 MB).
In contrast, other attention mechanisms lead to degraded detection performance, despite their low computational and parameter costs. CBAM and CoordAtt rely on global pooling to generate attention weights, which may overlook local details and be insensitive to small or boundary lesions. TripletAttention, although involving multi-dimensional interactions, produces coarse attention maps and fails to capture fine-grained features. SimAM, being parameter-free and based on energy difference modeling, lacks explicit contextual modeling, making it ineffective for identifying complex textures and non-uniform lesions.
GradCAM-based visualizations (Figure 17) further confirm that LWA generates more precise spatial attention. The red boxes in Figure 17 highlight small or boundary lesions that the attention mechanism effectively focuses on. Compared to global pooling-based methods (CBAM and CoordAtt), LWA provides stronger attention in these critical regions. In contrast, global attention mechanisms show a more diffused focus, often overlooking critical local features.
However, we must also note the decrease in detection accuracy with the LWA module. The accuracy was 85.1% before introducing any attention mechanism, but after incorporating LWA, the accuracy dropped to 82.7%. This is due to LWA’s approach of first dividing the image into local windows, and then further partitioning each window into subsets with independent attention heads. While this dual local feature enhancement method, facilitated by the CGA mechanism, improves recall; it also increases the risk of false positives.

3.2.2. Comparison of Deblurring Methods and DEMNet for Small Object Detection

To compare the performance differences between DEMNet and the two-stage approach of deblurring followed by object detection. This paper conducted comparative experiments using three classical image deblurring models: NAFNet [16], DeblurGANv2 [15], and HINet [39]. Specifically, the Tea-First-Aug dataset was first preprocessed using these deblurring models. The baseline detection model, YOLOv8n, was then trained and evaluated on the deblurred dataset to assess the impact of deblurring strategies on small object detection performance.
The experimental results are summarized in Table 8. When processed with DeblurGANv2, the model achieved a mAP@0.5 of 82.2%, representing a 1.9% improvement over the original YOLOv8n (80.3%). This indicates that moderate deblurring can enhance detection performance. However, this improvement was not consistent. When NAFNet and HINet were applied, the mAP@0.5 decreased compared to the baseline. Further analysis revealed that the detection scenario of tea leaf blight involves highly complex backgrounds and extremely small targets. Deblurring improves overall image clarity but can disrupt the continuity of small object edges and fine details. This reduces the contrast between targets and background, leading to more false positives and missed detections. Inference visualizations further validate this observation. As illustrated in four comparative sets of images (Figure 18), NAFNet achieved the best overall deblurring quality, producing clearer images. However, it also resulted in the highest number of missed and false detections. This suggests that conventional deblurring models improve global image quality but fail to preserve key features of small targets, which degrades detection performance.
In contrast, DEMNet consistently outperformed all other methods across evaluation metrics. On the one hand, DEMNet enhances the discriminability of small objects by deeply modeling blurred regions during feature extraction while preserving structural integrity. On the other hand, its end-to-end optimization, designed for small objects, enables adaptive and robust feature representation. This provides a strong foundation for accurate small object detection.

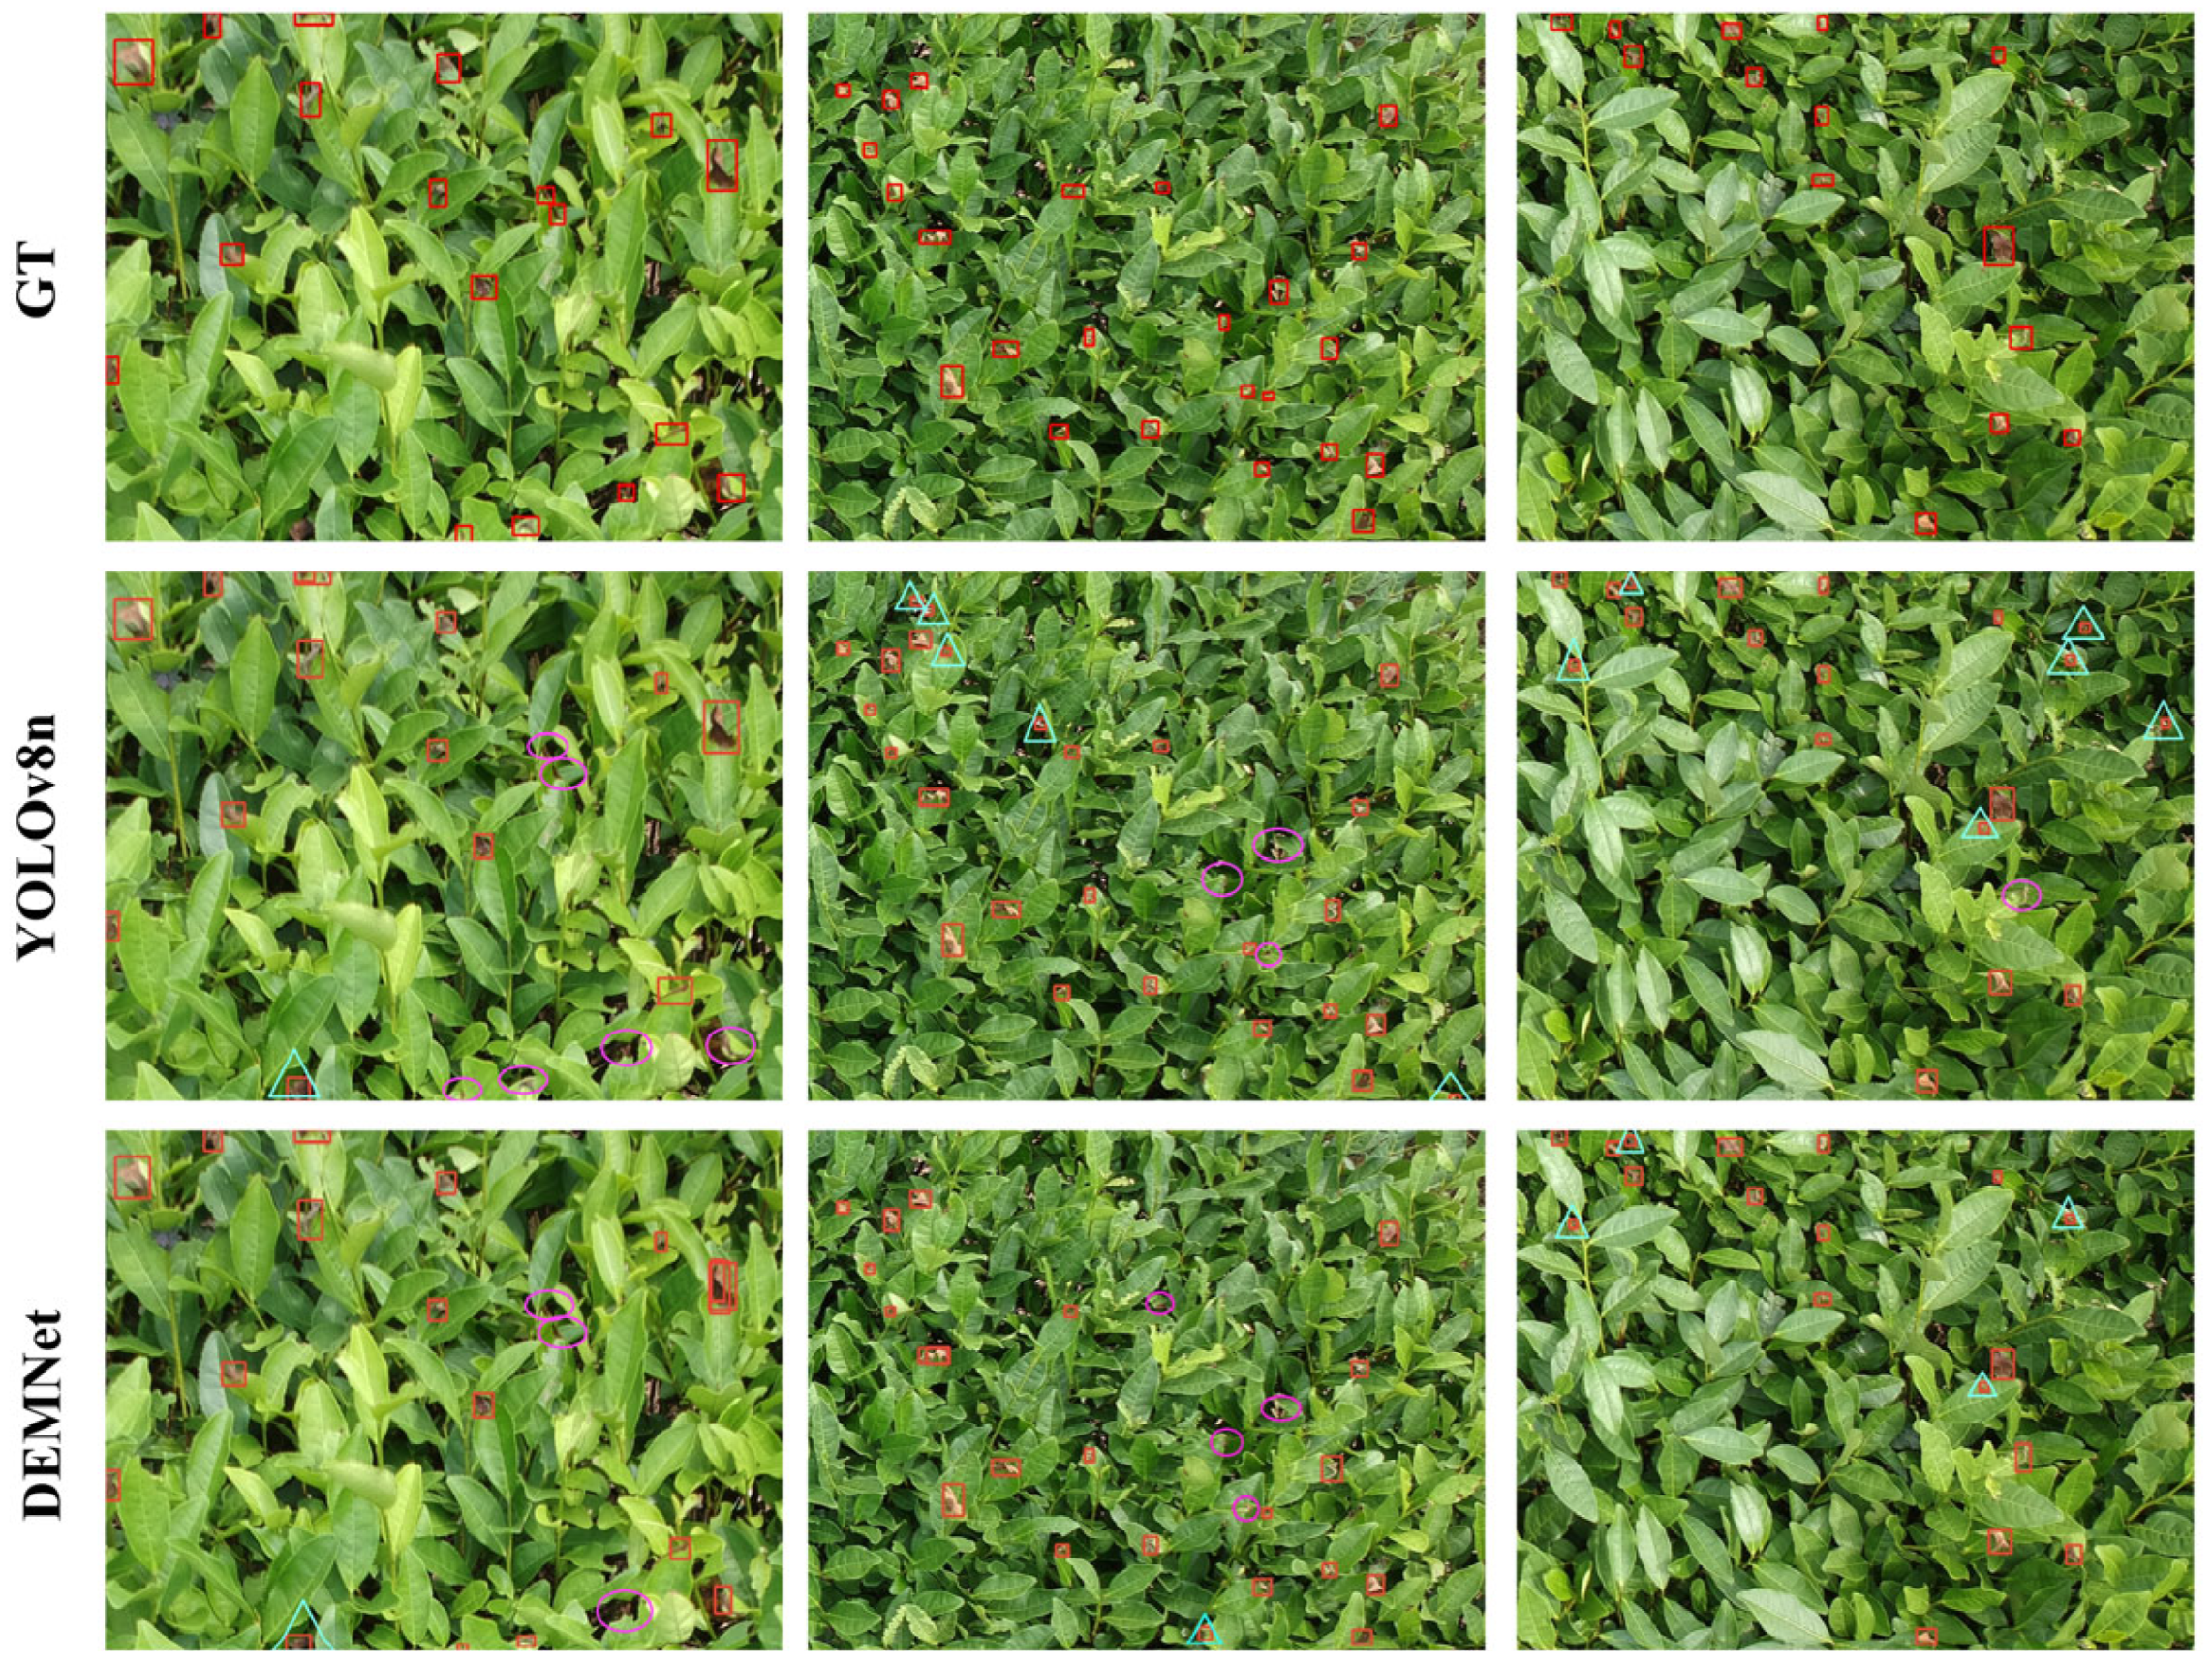
3.2.3. Comparison of Different Object Detection Models

To evaluate the effectiveness of the proposed DEMNet model for object detection, we conducted a comprehensive performance comparison with several mainstream detectors. These include two-stage detectors (Faster R-CNN [40], RetinaNet [41]), single-stage YOLO variants (YOLOv5n/s, YOLOv8n, YOLOv10n [42], YOLOv11n/s), and the Transformer-based RT-DETR. Evaluation metrics include mAP@0.5, mAP@0.75, and mAP@0.5:0.95, along with parameter count and GFLOPs. The detailed results are shown in Table 9.
DEMNet achieved a mAP@0.5 of 85.2%, outperforming all baseline models and demonstrating strong detection capability. Although YOLOv11s obtained the highest scores in mAP@0.75 (23.4%) and mAP@0.5:0.95 (34.1%), its mAP@0.5 was only 81.4%. This indicates a bias toward high-precision detection under strict confidence thresholds, but limited overall coverage. Since leaf blight lesions are small and densely distributed, models that prioritize high-confidence predictions may not perform well in real-world scenarios. In contrast, DEMNet shows better robustness and coverage under multi-scale and complex background conditions.
In terms of efficiency, DEMNet is notably lightweight, with only 1.7 M parameters and 6.1 GFLOPs. This is significantly lower than Faster R-CNN (41.3 M/167.0 GFLOPs) and RetinaNet (36.3 M/162.0 GFLOPs). While the YOLO series is generally resource-efficient, most variants fail to exceed 81.0% mAP@0.5. For example, YOLOv5n is the lightest (5.1 GFLOPs) but only achieves 79.8% accuracy. RT-DETR, despite its expressive power, performs poorly on small-sample datasets and requires substantial resources (31.9 M parameters, 103.4 GFLOPs).
In conclusion, DEMNet strikes an optimal balance between accuracy and computational efficiency, outperforming existing detectors in both detection performance and deployment feasibility, especially in resource-constrained environments.

3.2.4. Comparison Study of Data Augmentation

To quantitatively assess the impact of data augmentation, this paper conducted comparison experiments using both the original and augmented datasets. As shown in Table 10, models trained with data augmentation (Tea-First-Aug and Tea-Second-Aug) achieved higher precision, recall, mAP@0.5, mAP@0.75, and mAP@0.5:0.95 scores than those trained on the original datasets (Tea-First-Original and Tea-Second-Original).
For the Tea-First dataset, data augmentation increased mAP@0.5 from 76.6% to 85.2% and recall from 73.7% to 77.8%. For the Tea-Second dataset, mAP@0.5 rose from 48.3% to 51.0%, and recall improved from 46.7% to 58.7%.
These results show that data augmentation improves model performance by adding diverse training samples and reducing overfitting. It helps the model learn more robust features that generalize across different scales, lighting, and backgrounds. As a result, the model becomes more accurate and resilient to unseen or noisy inputs, which is crucial for real-world applications.

3.2.5. Generalization Evaluation on Two Datasets

To assess the generalization capability of DEMNet, this paper conducted cross-dataset evaluations on Tea-First-Aug and Tea-Second-Aug. As shown in Table 11, DEMNet consistently outperformed YOLOv8 across most metrics. On Tea-First-Aug, DEMNet achieved a mAP@0.5 of 85.2%, 4.9% higher than YOLOv8. Its recall also increased from 72.1% to 77.8%, indicating better lesion coverage. On the more challenging Tea-Second-Aug dataset, DEMNet achieved a recall of 58.7% and an mAP@0.5 of 51.0%, both notably higher than those of YOLOv8.
These results show that DEMNet maintains great performance across datasets with different image distributions, suggesting better feature generalization. Although both datasets were collected from the same region, they were taken at different times. Tea-Second-Aug includes more complex and noisy samples, making it a valuable benchmark for robustness testing.
Figure 19 and Figure 20 show the detection results on both datasets. On Tea-First-Aug, DEMNet produced fewer false positives and missed detections compared to YOLOv8n. Most missed detections were due to small lesion areas, which are harder to recognize. False positives were caused by complex backgrounds and various visual distractions. On Tea-Second-Aug, missed detections increased. This was mainly due to strong sunlight and shadow occlusion, which made detection more difficult. Additionally, some lesions appeared dark or black. In shadowed or defocused areas, they became harder to identify, leading to more detection errors.
Despite data augmentation increasing the total number of images, the dataset still lacks diversity in time and location. In future work, we plan to validate DEMNet on datasets from different regions, seasons, and tea varieties to better evaluate its generalization and real-world applicability.

4. Discussion

Integrating deep learning with UAV-based remote sensing offers a promising approach for large-scale tea disease detection. However, real-world challenges such as weather changes, shadow occlusion, motion blur, and camera defocus often reduce image quality and hinder the detection of small, blurry objects. To address these issues, this paper introduces DEMNet, a model designed to detect blurry small-object tea leaf blight in UAV remote sensing images. DEMNet integrates dynamic convolution into the HGNetV2 backbone, allowing the weight of convolution kernels to adjust according to blur levels and scene complexity. Combined with the EMAFPN fusion strategy, the network significantly enhances small-object detection by leveraging low-level features more effectively across multiple scales. Tea leaf blight lesions are often densely packed, making it hard for standard C2f modules to achieve high recall. To address this, we designed the CMLAB module, which keeps the CSP split-and-merge structure and adds multi-scale convolution with local window attention. This helps extract clearer features in blurry regions and improves the detection of dense, small targets. However, in areas with dense canopy or overlapping spots, dual local enhancement may also increase background noise or highlight similar textures, resulting in more false positives. This suggests the need for better feature filtering or post-processing in complex field conditions. Experimental results show that DEMNet performs well on slightly blurry tea leaf blight datasets (Tea-First-Aug), outperforming several mainstream deep learning models. Inference visualizations (Figure 21) use purple circles for missed detections and blue triangles for false detections. YOLOv11s achieves the highest mAP@0.75 and produces fewer false detections, but has many missed ones. In contrast, Faster RCNN has more false detections but almost no missed ones. DEMNet offers a better balance between the two. Although a few missed detections appear in the third image with dense small targets, the number is much lower than in other models. We also compare DEMNet with several recent tea leaf blight detection methods. Jiang et al. [43] used the Retinex algorithm to enhance image contrast and reduce light interference. In another study, Jiang et al. [44] used simulated infrared (SIR) images to restore overexposed areas. A multimodal fusion module and a super-resolution branch were also combined to improve the detection of small targets. These methods perform well under strong light conditions. Strong lighting is also a key issue in our more challenging Tea-Second-Aug dataset. Future improvements may consider introducing appropriate image preprocessing techniques to improve detection results. However, such methods rely heavily on the quality of preprocessing and increase the computational burden. In contrast, DEMNet does not require extra preprocessing. Its simpler detection process is well-suited for large-scale applications in complex field environments. Hu et al. [18] proposed a two-stage framework using RFBDB-GAN for image enhancement and LWDNet for detection. LWDNet is accurate and lightweight (716 kB), making it suitable for resource-limited devices. However, the two-stage design may limit real-time use. In contrast, DEMNet offers a better trade-off between accuracy, complexity, and deployment.
Although DEMNet achieves good results in tea leaf blight detection, it still has some limitations. First, the dataset used covers a limited range of times and locations, which restricts the model’s generalization ability. Second, this study mainly addresses mild blur and does not effectively handle small target detection under moderate or severe blur conditions. Third, while the CMLAB module improves recall, its dual local feature enhancement may increase the false alarm rate in areas with dense targets.
Future work can focus on several directions. First, collecting tea leaf blight images across diverse times and locations can improve the model’s adaptability to various scenarios. Second, constructing datasets with varying degrees of blur may enhance small target detection under more complex conditions. Third, refining the CMLAB module or developing a new feature extraction structure could help reduce false positives while preserving recall. In addition, integrating image preprocessing or multimodal fusion techniques may further improve detection performance for blurred small targets.

5. Conclusions

To tackle the challenges of blurry small targets and low detection accuracy of tea leaf blight in UAV remote sensing images, this paper proposes DEMNet—an efficient and lightweight disease spot detection model. It achieves precise and efficient recognition through the following key modules:
(1)
The introduction of the Dynamic Convolution Network, DynamicHGNetV2, significantly enhances the model’s ability to extract features in blurry and degraded target scenarios.
(2)
The EMAFPN feature fusion structure improves small target detection, enhances multi-scale detection performance, and reduces computational complexity and parameters.
(3)
The traditional C2f module is innovatively modified to form the CMLAB module, improving detection accuracy for edge details and densely distributed small targets while suppressing redundant information.
Through the synergy of these technological modules, DEMNet achieves high-precision detection of tea leaf blight in remote sensing images with slight blur. Compared to the baseline model YOLOv8n, DEMNet improves recall by 5.7 percentage points, reaching 77.8%. Its mAP@0.5 increases by 4.9 percentage points to 85.2%. Meanwhile, the model reduces parameter count by 43.3% and computational complexity by 24.7%. The model size also shrinks to 4.2 MB, a reduction of 33.3%. These results show that DEMNet maintains high detection accuracy while significantly reducing computational cost and storage needs. This makes it more suitable for deployment and real-time use on resource-constrained edge devices. Future research can focus on the following directions: (1) Expanding datasets across different times and locations to improve generalization. (2) Enhancing robustness to small targets under varying levels of blur. (3) Optimizing the CMLAB module or designing new feature extractors to balance precision and recall. (4) Introducing preprocessing or multimodal techniques to boost the detection of blurred targets.

Author Contributions

Conceptualization, Y.G.; methodology, Y.G.; validation, Y.J., H.-D.L. and J.S.; formal analysis, Y.J.; data curation, H.-D.L.; writing—original draft preparation, Y.G.; writing—review and editing, H.L., Y.G., Y.J., H.-D.L. and J.S.; visualization, Y.G. All authors have read and agreed to the published version of the manuscript.

Funding

This work was funded by the Qinglan Project 2024 and the key core technology industrialization project of the whole industrial chain of agricultural characteristic industries in Nanjing (2025NJCXGG(09)).

Data Availability Statement

Data is contained within the article.

Acknowledgments

The authors would like to thank H.L. for providing the data.

Conflicts of Interest

The authors declare no conflicts of interest.

References

  1. Xia, E.H.; Zhang, H.B.; Sheng, J.; Li, K.; Zhang, Q.J.; Kim, C.; Zhang, Y.; Liu, Y.; Zhu, T.; Li, W.; et al. The tea tree genome provides insights into tea flavor and independent evolution of caffeine biosynthesis. Mol. Plant 2017, 10, 866–877. [Google Scholar] [CrossRef] [PubMed]
  2. NBS. Tea Production. Available online: https://data.stats.gov.cn/easyquery.htm?cn=C01&zb=A0D0K&sj=2023 (accessed on 21 April 2025).
  3. Nath, M.; Mitra, P.; Kumar, D. A novel residual learning-based deep learning model integrated with attention mechanism and SVM for identifying tea plant diseases. Int. J. Comput. Appl. 2023, 45, 471–484. [Google Scholar] [CrossRef]
  4. Gayathri, S.; Wise, D.J.W.; Shamini, P.B.; Muthukumaran, N. Image analysis and detection of tea leaf disease using deep learning. In Proceedings of the 2020 International Conference on Electronics and Sustainable Communication Systems (ICESC), Coimbatore, India, 2–4 July 2020; pp. 398–403. [Google Scholar]
  5. Ramdan, A.; Heryana, A.; Arisal, A.; Kusumo, R.B.S.; Pardede, H.F. Transfer learning and fine-tuning for deep learning-based tea diseases detection on small datasets. In Proceedings of the International Conference on Radar, Antenna, Microwave, Electronics, Telecommunication (ICRAMET), Tangerang, Indonesia, 18–20 November 2020; pp. 206–211. [Google Scholar]
  6. Hu, G.; Wang, H.; Zhang, Y.; Wan, M. Detection and severity analysis of tea leaf blight based on deep learning. Comput. Electr. Eng. 2021, 90, 107023. [Google Scholar] [CrossRef]
  7. Xue, Z.; Xu, R.; Bai, D.; Lin, H. YOLO-tea: A tea disease detection model improved by YOLOv5. Forests 2023, 14, 415. [Google Scholar] [CrossRef]
  8. Chen, Z.; Zhou, H.; Lin, H.; Bai, D. TeaViTNet: Tea disease and pest detection model based on fused multiscale attention. Agronomy 2024, 14, 633. [Google Scholar] [CrossRef]
  9. Ye, R.; Shao, G.; He, Y.; Gao, Q.; Li, T. YOLOv8-RMDA: Lightweight YOLOv8 network for early detection of small target diseases in tea. Sensors 2024, 24, 2896. [Google Scholar] [CrossRef] [PubMed]
  10. Liu, W.; Quijano, K.; Crawford, M.M. YOLOv5-Tassel: Detecting Tassels in RGB UAV Imagery with Improved YOLOv5 Based on Transfer Learning. IEEE J. Sel. Top. Appl. Earth Obs. Remote Sens. 2022, 15, 8085–8094. [Google Scholar] [CrossRef]
  11. Ye, W.; Lao, J.; Liu, Y.; Chang, C.-C.; Zhang, Z.; Li, H.; Zhou, H. Pine Pest Detection Using Remote Sensing Satellite Images Combined with a Multi-Scale Attention-UNet Model. Ecol. Inform. 2022, 72, 101906. [Google Scholar] [CrossRef]
  12. Tetila, E.C.; Machado, B.B.; Astolfi, G.; Belete, N.A.D.; Amorim, W.P.; Roel, A.R.; Pistori, H. Detection and classification of soybean pests using deep learning with UAV images. Comput. Electron. Agric. 2020, 179, 105836. [Google Scholar] [CrossRef]
  13. Bao, W.; Zhu, Z.; Hu, G.; Zhou, X.; Zhang, D.; Yang, X. UAV remote sensing detection of tea leaf blight based on DDMA-YOLO. Comput. Electron. Agric. 2023, 205, 107637. [Google Scholar] [CrossRef]
  14. Sayed, M.; Brostow, G. Improved Handling of Motion Blur in Online Object Detection. In Proceedings of the IEEE/CVF Conference on Computer Vision and Pattern Recognition, Nashville, TN, USA, 19–25 June 2021; pp. 1706–1716. [Google Scholar]
  15. Kupyn, O.; Martyniuk, T.; Wu, J.; Wang, Z. Deblurgan-v2: Deblurring (orders-of-magnitude) faster and better. In Proceedings of the IEEE/CVF International Conference on Computer Vision, Seoul, Republic of Korea, 27 October–2 November 2019; pp. 8878–8887. [Google Scholar]
  16. Chen, L.; Chu, X.; Zhang, X.; Sun, J. Simple Baselines for Image Restoration. In Proceedings of the ECCV, Tel Aviv, Israel, 23–27 October 2022; pp. 17–33. [Google Scholar]
  17. Genze, N.; Wirth, M.; Schreiner, C.; Ajekwe, R.; Grieb, M.; Grimm, D.G. Improved weed segmentation in UAV imagery of sorghum fields with a combined deblurring segmentation model. Plant Methods 2023, 19, 87. [Google Scholar] [CrossRef] [PubMed]
  18. Hu, G.; Ye, R.; Wan, M.; Bao, W.; Zhang, Y.; Zeng, W. Detection of Tea Leaf Blight in Low-Resolution UAV Remote Sensing Images. IEEE Trans. Geosci. Remote Sens. 2023, 62, 1–18. [Google Scholar] [CrossRef]
  19. Jobaer, S.; Tang, X.s.; Zhang, Y.; Li, G.; Ahmed, F. A novel knowledge distillation framework for enhancing small object detection in blurry environments with unmanned aerial vehicle-assisted images. Complex Intell. Syst. 2025, 11, 63. [Google Scholar] [CrossRef]
  20. Bansal, R.; Raj, G.; Choudhury, T. Blur Image Detection Using Laplacian Operator and Open-CV. In Proceedings of the 2016 International Conference System Modeling & Advancement in Research Trends (SMART), Moradabad, India, 25–27 November 2016; pp. 63–67. [Google Scholar]
  21. Brennan, W. BlurDetection2. Available online: https://github.com/WillBrennan/BlurDetection2 (accessed on 21 April 2025).
  22. Tzutalin. Labelimg. Available online: https://github.com/HumanSignal/labelImg (accessed on 21 April 2025).
  23. Jocher, G. Ultralytics YOLOv5. Available online: https://github.com/ultralytics/yolov5 (accessed on 21 April 2025).
  24. Chen, Y.; Dai, X.; Liu, M.; Chen, D.; Yuan, L.; Liu, Z. Dynamic convolution: Attention over convolution kernels. In Proceedings of the IEEE/CVF Conference on Computer Vision and Pattern Recognition, Seattle, WA, USA, 13–19 June 2020; pp. 11030–11039. [Google Scholar]
  25. Xue, Y.; Ju, Z.; Li, Y.; Zhang, W. MAF-YOLO: Multi-modal attention fusion based YOLO for pedestrian detection. Infrared Phys. Technol. 2021, 118, 103906. [Google Scholar] [CrossRef]
  26. Rahman, M.M.; Munir, M.; Marculescu, R. EMCAD: Efficient Multi-Scale Convolutional Attention Decoding for Medical Image Segmentation. In Proceedings of the 2024 IEEE/CVF Conference on Computer Vision and Pattern Recognition (CVPR), Seattle, WA, USA, 16–22 June 2024. [Google Scholar]
  27. Qin, D.; Leichner, C.; Delakis, M.; Fornoni, M.; Luo, S.; Yang, F.; Wang, W.; Banbury, C.; Ye, C.; Akin, B. MobileNetV4-Universal Models for the Mobile Ecosystem. arXiv 2024, arXiv:2404.10518. [Google Scholar]
  28. Lee, Y.; Hwang, J.W.; Lee, S.; Bae, Y.; Park, J. An Energy and GPU-Computation Efficient Backbone Network for Real-Time Object Detection. In Proceedings of the IEEE/CVF Conference on Computer Vision and Pattern Recognition (CVPR) Workshops, Long Beach, CA, USA, 16–17 June 2019. [Google Scholar]
  29. Zhao, Y.; Lv, W.; Xu, S.; Wei, J.; Wang, G.; Dang, Q.; Liu, Y.; Chen, J. Detrs beat yolos on real-time object detection. In Proceedings of the IEEE/CVF Conference on Computer Vision and Pattern Recognition, Seattle, WA, USA, 17–21 June 2024; pp. 16965–16974. [Google Scholar]
  30. Hu, J.; Shen, L.; Sun, G. Squeeze-and-excitation networks. In Proceedings of the IEEE Conference on Computer Vision and Pattern Recognition, Salt Lake City, UT, USA, 18–23 June 2018; pp. 7132–7141. [Google Scholar]
  31. Chollet, F. Xception: Deep Learning with Depthwise Separable Convolutions. In Proceedings of the 2017 IEEE Conference on Computer Vision and Pattern Recognition (CVPR), Honolulu, HI, USA, 21–26 July 2017; pp. 1800–1807. [Google Scholar]
  32. Huang, G.; Liu, Z.; Van Der Maaten, L.; Weinberger, K.Q. Densely connected convolutional networks. In Proceedings of the IEEE Conference on Computer Vision and Pattern Recognition (CVPR), Honolulu, HI, USA, 21–26 July 2017; pp. 4700–4708. [Google Scholar]
  33. Liu, Z.; Lin, Y.; Cao, Y.; Hu, H.; Wei, Y.; Zhang, Z.; Lin, S.; Guo, B. Swin Transformer: Hierarchical Vision Transformer using Shifted Windows. arXiv 2021, arXiv:2103.14030. [Google Scholar]
  34. Liu, X.; Peng, H.; Zheng, N.; Yang, Y.; Hu, H.; Yuan, Y. EfficientViT: Memory Efficient Vision Transformer with Cascaded Group Attention. In Proceedings of the IEEE/CVF Conference on Computer Vision and Pattern Recognition, Vancouver, BC, Canada, 18–22 June 2023; pp. 14420–14430. [Google Scholar]
  35. Woo, S.; Park, J.; Lee, J.Y.; Kweon, I.S. Cbam: Convolutional block attention module. In Proceedings of the European Conference on Computer Vision (ECCV), Munich, Germany, 8–14 September 2018; pp. 3–19. [Google Scholar]
  36. Misra, D.; Nalamada, T.; Arasanipalai, A.U.; Hou, Q. Rotate to attend: Convolutional triplet attention module. In Proceedings of the IEEE/CVF Winter Conference on Applications of Computer Vision, Waikoloa, HI, USA, 3–8 January 2021; pp. 3139–3148. [Google Scholar]
  37. Yang, L.; Zhang, R.Y.; Li, L.; Xie, X. Simam: A simple, parameter-free attention module for convolutional neural networks. In Proceedings of the International Conference on Machine Learning, PMLR, Virtual, 18–24 July 2021; pp. 11863–11874. [Google Scholar]
  38. Hou, Q.; Zhou, D.; Feng, J. Coordinate attention for efficient mobile network design. In Proceedings of the IEEE/CVF Conference on Computer Vision and Pattern Recognition, Nashville, TN, USA, 20–25 June 2021; pp. 13713–13722. [Google Scholar]
  39. Chen, L.; Lu, X.; Zhang, J.; Chu, X.; Chen, C. Hinet: Half instance normalization network for image restoration. In Proceedings of the IEEE/CVF Conference on Computer Vision and Pattern Recognition, Virtual, 19–25 June 2021; pp. 182–192. [Google Scholar]
  40. Ren, S.; He, K.; Girshick, R.; Sun, J. Faster r-cnn: Towards real-time object detection with region proposal networks. IEEE Trans. Pattern Anal. Mach. Intell. 2016, 39, 1137–1149. [Google Scholar] [CrossRef] [PubMed]
  41. Lin, T.Y.; Goyal, P.; Girshick, R.; He, K.; Dollár, P. Focal loss for dense object detection. In Proceedings of the IEEE International Conference on Computer Vision, Venice, Italy, 22–29 October 2017; pp. 2980–2988. [Google Scholar]
  42. Wang, A.; Chen, H.; Liu, L.; Chen, K.; Lin, Z.; Han, J.; Ding, G. Yolov10: Real-time end-to-end object detection. arXiv 2024, arXiv:2405.14458. [Google Scholar]
  43. Jiang, Y.; Lu, L.; Wan, M.; Hu, G.; Zhang, Y. Detection method for tea leaf blight in natural scene images based on lightweight and efficient LC3Net model. J. Plant Dis. Prot. 2024, 131, 209–225. [Google Scholar] [CrossRef]
  44. Jiang, Y.; Wei, Z.; Hu, G. An efficient detection method for tea leaf blight in UAV remote sensing images under intense lighting conditions based on MLDNet. Comput. Electron. Agric. 2025, 229, 109825. [Google Scholar] [CrossRef]
Figure 1. The images of two datasets (The top and bottom rows are typical images of leaf blight spots in each of the two datasets. Leaf blight spots are labeled with red boxes in the images).
Remotesensing 17 01967 g001
Figure 2. Laplace operator.
Remotesensing 17 01967 g002
Figure 3. The response variance fraction of tea leaf image and blurry leaf blight spots (red and blue boxes zoom in to show blurry leaf blight spot targets).
Remotesensing 17 01967 g003
Figure 4. Effects of various data augmentations. (a) Original picture, (b) rotation, (c) zoom, (d) flip, (e) adjust brightness, (f) adjust saturation and hue, (g) rain, (h) fog.
Remotesensing 17 01967 g004
Figure 5. The number of large, medium, and small targets in both datasets (Red numbers above the bars represent the number of ground truth annotations for each size category.).
Remotesensing 17 01967 g005
Figure 6. YOLOv8 network architecture (The input to the model is a 640 × 640 × 3 image. The three colored blocks represent the red, green, and blue channels of the input image.).
Remotesensing 17 01967 g006
Figure 7. DEMNet network.
Remotesensing 17 01967 g007
Figure 8. Structure of the HGStem module.
Remotesensing 17 01967 g008
Figure 9. Structure of DynamicHGBlock module (Solid arrows indicate standard operation, and dashed arrows indicate residual connections used when the input and output channels are the same.).
Remotesensing 17 01967 g009
Figure 10. Structure of DynamicConv module.
Remotesensing 17 01967 g010
Figure 11. EMAFPN structure diagram.
Remotesensing 17 01967 g011
Figure 12. Structure of EUCB module.
Remotesensing 17 01967 g012
Figure 13. Structure of CMLAB module (each MSLA module includes a MSCB and a LWA).
Remotesensing 17 01967 g013
Figure 14. Structure of MSCB module.
Remotesensing 17 01967 g014
Figure 15. Structure of MSDC module.
Remotesensing 17 01967 g015
Figure 16. Structure of CGA module (The yellow blocks of different shades show that each attention head’s input combines its feature subset with the previous head’s output, making the color progressively darker.).
Remotesensing 17 01967 g016
Figure 17. Heat maps based on different attention mechanisms (a) no attention, (b) CBAM, (c) TripletAttention, (d) CoordAtt, (e) SimAM, (f) LWA (the red boxes highlight small or boundary lesions that the attention mechanism focuses on).
Remotesensing 17 01967 g017
Figure 18. Visualization of detection results after deblurring and DEMNet processing (red boxes represent detection results, purple circles represent missed detections, and blue triangles represent false detections).
Remotesensing 17 01967 g018
Figure 19. Visualization of detection results for the first dataset (red boxes represent detection results, purple circles represent missed detections, and blue triangles represent false detections).
Remotesensing 17 01967 g019
Figure 20. Visualization of detection results for the second dataset (red boxes represent detection results, purple circles represent missed detections, and blue triangles represent false detections).
Remotesensing 17 01967 g020
Figure 21. Detection result images of different object detection methods (red boxes represent detection results, purple circles represent missed detections, and blue triangles represent false detections).
Remotesensing 17 01967 g021
Table 1. Comparison of different backbone networks.
MethodsP/%R/%mAP@0.5/%Parameters/MGFLOPsModel Size/MB
Baseline84.272.180.33.08.16.3
GhostNet82.172.580.13.36.07.1
ShuffleNetV283.066.277.01.75.03.7
MobileNetV379.568.377.62.35.75.0
MobileNetV486.667.682.25.722.611.7
MobileVit378.875.881.03.310.17.0
EfficientNet74.671.377.92.05.84.3
EfficientVit78.773.378.84.09.58.8
HGNetV284.672.981.92.37.05.0
Table 2. Comparison before and after adding DynamicConv.
MethodsP/%R/%mAP@0.5/%Parameters/MGFLOPsModel Size/MB
HGBlock84.672.981.92.37.05.0
DynamicHGBlock83.573.983.12.56.75.4
Table 3. Comparison of Concat and Add fusion.
MethodsP/%R/%mAP@0.5/%Parameters/MGFLOPsModel Size/MB
Add83.574.282.02.17.64.6
Concat80.376.781.52.27.84.9
Table 4. Computer parameters.
ParameterConfiguration
CPU modelIntel Xeon Platinum 8481C v (Intel Corporation, Santa Clara, CA, USA)
GPU modelNVIDIA GeForce RTX 4090 D (NVIDIA, Santa Clara, CA, USA)
Operating systemUbuntu 11.4
Deep learning framePyTorch 2.0
GPU acceleratorCUDA 11.8
Scripting languagePython 3.8.10
Table 5. Training parameters.
ParameterConfiguration
Batch Size4
Epochs250
OptimizerSGD
momentum0.937
Image size640 × 640
Initial learning rate0.005
Table 6. Ablation experiment results in Tea-Aug.
ModelModulesEvaluation Metrics
BaselineDynamic
HGNetV2
EMAFPNCMLABRmAP@0.5ParametersGFLOPsModel Size/MB
1 72.180.33.08.16.3
2 73.983.12.56.75.4
3 72.282.92.17.64.6
4 74.281.32.77.76.0
5 70.480.31.76.33.8
6 75.382.92.36.45.2
7 74.881.22.17.45.0
877.8
(+5.7%)
85.2
(+4.9%)
1.7
(−43.3%)
6.1
(−24.7%)
4.2
(−33.3%)
Table 7. Comparison of different attention mechanisms integrated into DEMNet.
MethodsP/%R/%mAP@0.5/%Parameters/MGFLOPsModel Size/MB
No Attention85.175.882.91.65.93.7
CBAM76.27680.01.65.93.8
TripletAttention81.575.481.21.65.93.8
SimAM80.672.881.21.65.93.7
CoordAtt79.273.379.81.65.93.8
LWA82.777.885.21.76.14.2
Table 8. Detection performance of deblurring methods and DEMNet.
MethodP/%R/%mAP@0.5/%mAP@0.75/%mAP@0.5:0.95/%GFLOPs
NAFNet74.973.378.719.231.8130.0
DeblurGANv280.475.382.217.032.043.75
HINet82.974.679.518.732.1341.4
YOLOv884.272.180.316.533.38.1
DEMNet82.777.885.219.634.16.1
Table 9. Comparison of object detection models on leaf blight detection.
MethodsmAP@0.75/%mAP@0.5:0.95/%mAP@0.5/%Parameters/MGFLOPs
Yolov8n (baseline)16.533.380.33.08.1
Yolov5n17.930.479.81.74.1
Yolov5s20.231.979.77.015.8
Yolov10n20.132.176.12.26.6
Yolov11n20.032.580.52.56.3
Yolov11s23.434.181.49.021.3
RTDETR18.730.377.531.9103.4
Faster R-CNN16.630.782.441.3167.0
RetinaNet17.631.381.436.3162.0
DEMNet19.634.185.21.76.1
Table 10. Performance comparison of models trained with and without data augmentation on the Tea-First and Tea-Second datasets.
DatasetP/%R/%mAP@0.5/%mAP@0.75mAP@0.5:0.95
Tea-First-Original73.973.776.615.628.9
Tea-First-Aug82.777.885.219.634.1
Tea-Second-Original48.446.748.36.117.6
Tea-Second-Aug53.458.751.05.119.0
Table 11. Generalization evaluation on two tea leaf disease datasets.
DatasetMethodP/%R/%mAP@0.5/%mAP@0.75mAP@0.5:0.95
Tea-First-AugYolov884.272.180.316.533.3
Tea-First-AugDEMNet82.777.885.219.634.1
Tea-SecondAugYOLOv847.049.346.95.716.2
Tea-Second-AugDEMNet53.458.751.05.119.0
Disclaimer/Publisher’s Note: The statements, opinions and data contained in all publications are solely those of the individual author(s) and contributor(s) and not of MDPI and/or the editor(s). MDPI and/or the editor(s) disclaim responsibility for any injury to people or property resulting from any ideas, methods, instructions or products referred to in the content.

