Article

Landslide Identification in UAV Images Through Recognition of Landslide Boundaries and Ground Surface Cracks

by
Zhan Cheng
1,2,
Wenping Gong
1,*,
Michel Jaboyedoff
2,
Jun Chen
3,4,
Marc-Henri Derron
2 and
Fumeng Zhao
1
1
Faculty of Engineering, China University of Geosciences, Wuhan 430074, China
2
Institute of Earth Sciences, University of Lausanne, CH 1015 Lausanne, Switzerland
3
School of Automation, China University of Geosciences, Wuhan 430074, China
4
Hubei Key Laboratory of Advanced Control and Intelligent Automation for Complex Systems, Wuhan 430074, China
*
Author to whom correspondence should be addressed.
Remote Sens. 2025, 17(11), 1900; https://doi.org/10.3390/rs17111900
Submission received: 14 March 2025 / Revised: 26 May 2025 / Accepted: 28 May 2025 / Published: 30 May 2025
(This article belongs to the Special Issue Artificial Intelligence and Remote Sensing for Geohazards)

Abstract

Landslide is one of the most frequent and destructive geohazards around the world. The accurate identification of potential landslides plays a vital role in the management of landslide risk. The use of unmanned aerial vehicle (UAV) techniques has recently gained much popularity in landslide assessment; however, most of the current UAV-image-based landslide identifications rely upon visual inspections. In this paper, an image-analysis-based landslide identification framework is developed to detect the landslides in UAV images by recognizing the landslide boundaries and ground surface cracks. In this framework, object-oriented image analysis is undertaken to identify the potential landslide boundaries in the input UAV images and the ground surface cracks in the UAV images are recognized by an automatic ground surface crack recognition model, which is trained through a deep transfer learning strategy. With the aid of this transfer learning strategy, the crack recognition model trained can take advantage of the feature of local ground surface cracks in the concerned area and the crack recognition model that has well been developed based on the samples of ground surface cracks collected from different landslide sites. Then, the landslide boundaries and the ground surface cracks obtained are fused based on Boolean operations; the fusion results can allow for informed landslide identification in UAV Images. To illustrate the effectiveness of the proposed image-analysis-based landslide identification framework, the Heifangtai Terrace of Gansu, China, was selected as a study area, and the identification results are further validated through comparisons with the field survey results.

Graphical Abstract

1. Introduction

Landslide is one of the most frequent and destructive geohazards around the world and causes huge economic losses and casualties every year. Between 2004 and 2016, non-seismic landslide events resulted in nearly 56,000 fatalities globally, with an estimated annual economic loss of 20 billion USD [1,2]. The data from the World Bank indicate that nearly 3.7 million square kilometers of the earth’s land area are highly prone to landslides, which threatens over 300 million people [3]. A typical landslide example comes from Shuicheng County, China, where a landslide took place on 23 July 2019, resulting in forty-three deaths and nine missing, with a direct economic loss of 1.9 billion RMB [4]. Another catastrophic cascade occurred in the Indian Himalayas on 7 February 2021 when a 26-million-cubic-meter rock–ice detachment with satellite-detected precursory fracture propagation triggered a high-velocity debris flow that destroyed two Rishiganga River hydropower installations and caused 204 fatalities [5]. Indeed, most of the landslide disasters reported can be prevented or controlled if these landslides could be identified and forecasted accurately and timely [6,7]. Thus, the accurate identification of landslides plays a vital role in the reducing and mitigation of landslide risk.
The conventional approaches that are widely adopted for landslide identification might be categorized into two groups in terms of the field-survey-based approach and remote-sensing-based approach. Within the context of the field-survey-based approach, a potential landslide is often detected based upon field investigations of the landslide attributes (e.g., the development of ground surface cracks and landslide scarps) [8,9] and the identification results are supplemented with the monitoring of the deformations within the ground and on the ground surface [10]. The field-survey-based approach, though accurate, might only be applicable to landslide identification in a small area and is often time-consuming and inefficient. On the other hand, with the remote-sensing-based approach, the potential landslides in a large area could be detected through an interpretation of satellite or unmanned aerial vehicle (UAV) images. For example, landslide attributes can be recognized based on visual or machine-based interpretations of spectral characteristics in remote sensing images [11] while the ground surface deformations can be derived with the technique of interferometric synthetic aperture radar (InSAR) [12], light detection and ranging (LiDAR) [13], or global positioning system (GPS) technology [14]. It could be expected that the landslide identification results, obtained from the remote-sensing-based approach, are strongly affected by the experience of engineers and the visibility of remote sensing images.
Benefiting from the advances of unmanned aerial vehicles and digital photogrammetry, UAV photogrammetry has achieved rapid development over the past few decades. Due to its operational flexibility, cost-effectiveness, and high spatial resolution, UAV photogrammetry has been increasingly adopted as a supplementary strategy to the aforementioned field-survey- and remote-sensing-based approaches [15]. Within the context of the UAV-photogrammetry-based landslide identification, three types of image processing technologies are often adopted. The first image processing technology adopted is mainly based upon visual interpretations of terrain features and deformation phenomena in the three-dimensional (3D) topographic model generated with the structure-from-motion (SfM) algorithm [16,17]. The second image processing technology is a pixel-analysis-based approach in which the landslide is identified through a classification of the spectral, texture, and other features of each pixel of the digital orthophoto map (DOM) [18]. One obvious shortcoming of this approach is that misclassification usually occurs when the neighboring objects in the image have similar spectral information [19]. And, the third image processing technology is based on object-oriented image analyses, in which the spectral, texture, shape, and terrain features of ground objects in the DOM can be explicitly incorporated in the landslide identification [20,21]. As expected, the object-oriented image-analysis-based approach tends to achieve higher accuracy than the pixel-analysis-based approach.
Note that although huge progress has been made, the existing UAV-photogrammetry-based landslide identification is not perfect in every aspect and there is space for improvement. For example, visual interpretation is subjective and the identification results rely upon the experience of engineers; meanwhile, in the context of pixel analysis or object-oriented image analysis, the landslide mechanism is not included and the landslide attributes reflected in the UAV images are underutilized; thus, the effectiveness of the identification results is degraded. In addition, existing landslide identification methods often exhibit limitations in complex terrains and variable environments, such as in the inadequate capture of terrain details and heavy reliance on manual annotation. To address these challenges, this paper proposes an innovative system integrating UAV image analysis, deep learning techniques, and Boolean operations, fundamentally enhancing the automation, accuracy, and adaptability of landslide identification in complex scenarios. Specifically, high-resolution imaging equipment mounted on UAVs captures detailed terrain features and micro-cracks, offering a data quality far superior to traditional remote sensing imagery—often with spatial resolution improved by several orders of magnitude—thus providing a robust foundation for precise landslide boundary delineation and early warning. Furthermore, this paper employs a deep learning framework based on RetinaNet, leveraging convolutional neural networks to automate landslide feature extraction, significantly reducing the need for manual intervention. Compared to traditional machine learning approaches, RetinaNet achieves higher precision and speed in single-stage detection, excelling particularly in detecting small-scale cracks. To tackle the challenge of limited local sample data, a deep transfer learning strategy is introduced, fine-tuning pre-trained models with minimal local data to substantially improve the model’s generalizability across diverse geological settings. Finally, Boolean operations facilitate the logical fusion of multi-source data, enhancing the reliability of identification and offering a multidimensional perspective for analyzing landslide causation.
The rest of this article is organized as follows. In Section 2, the methodology of the proposed image-analysis-based landslide identification framework is introduced. In Section 3, the proposed framework is applied to the landslide identification in the Heifangtai Terrace of Gansu, China; through this case study, the effectiveness of the proposed landslide identification framework is demonstrated. Finally, the concluding remarks are drawn based on the results presented.

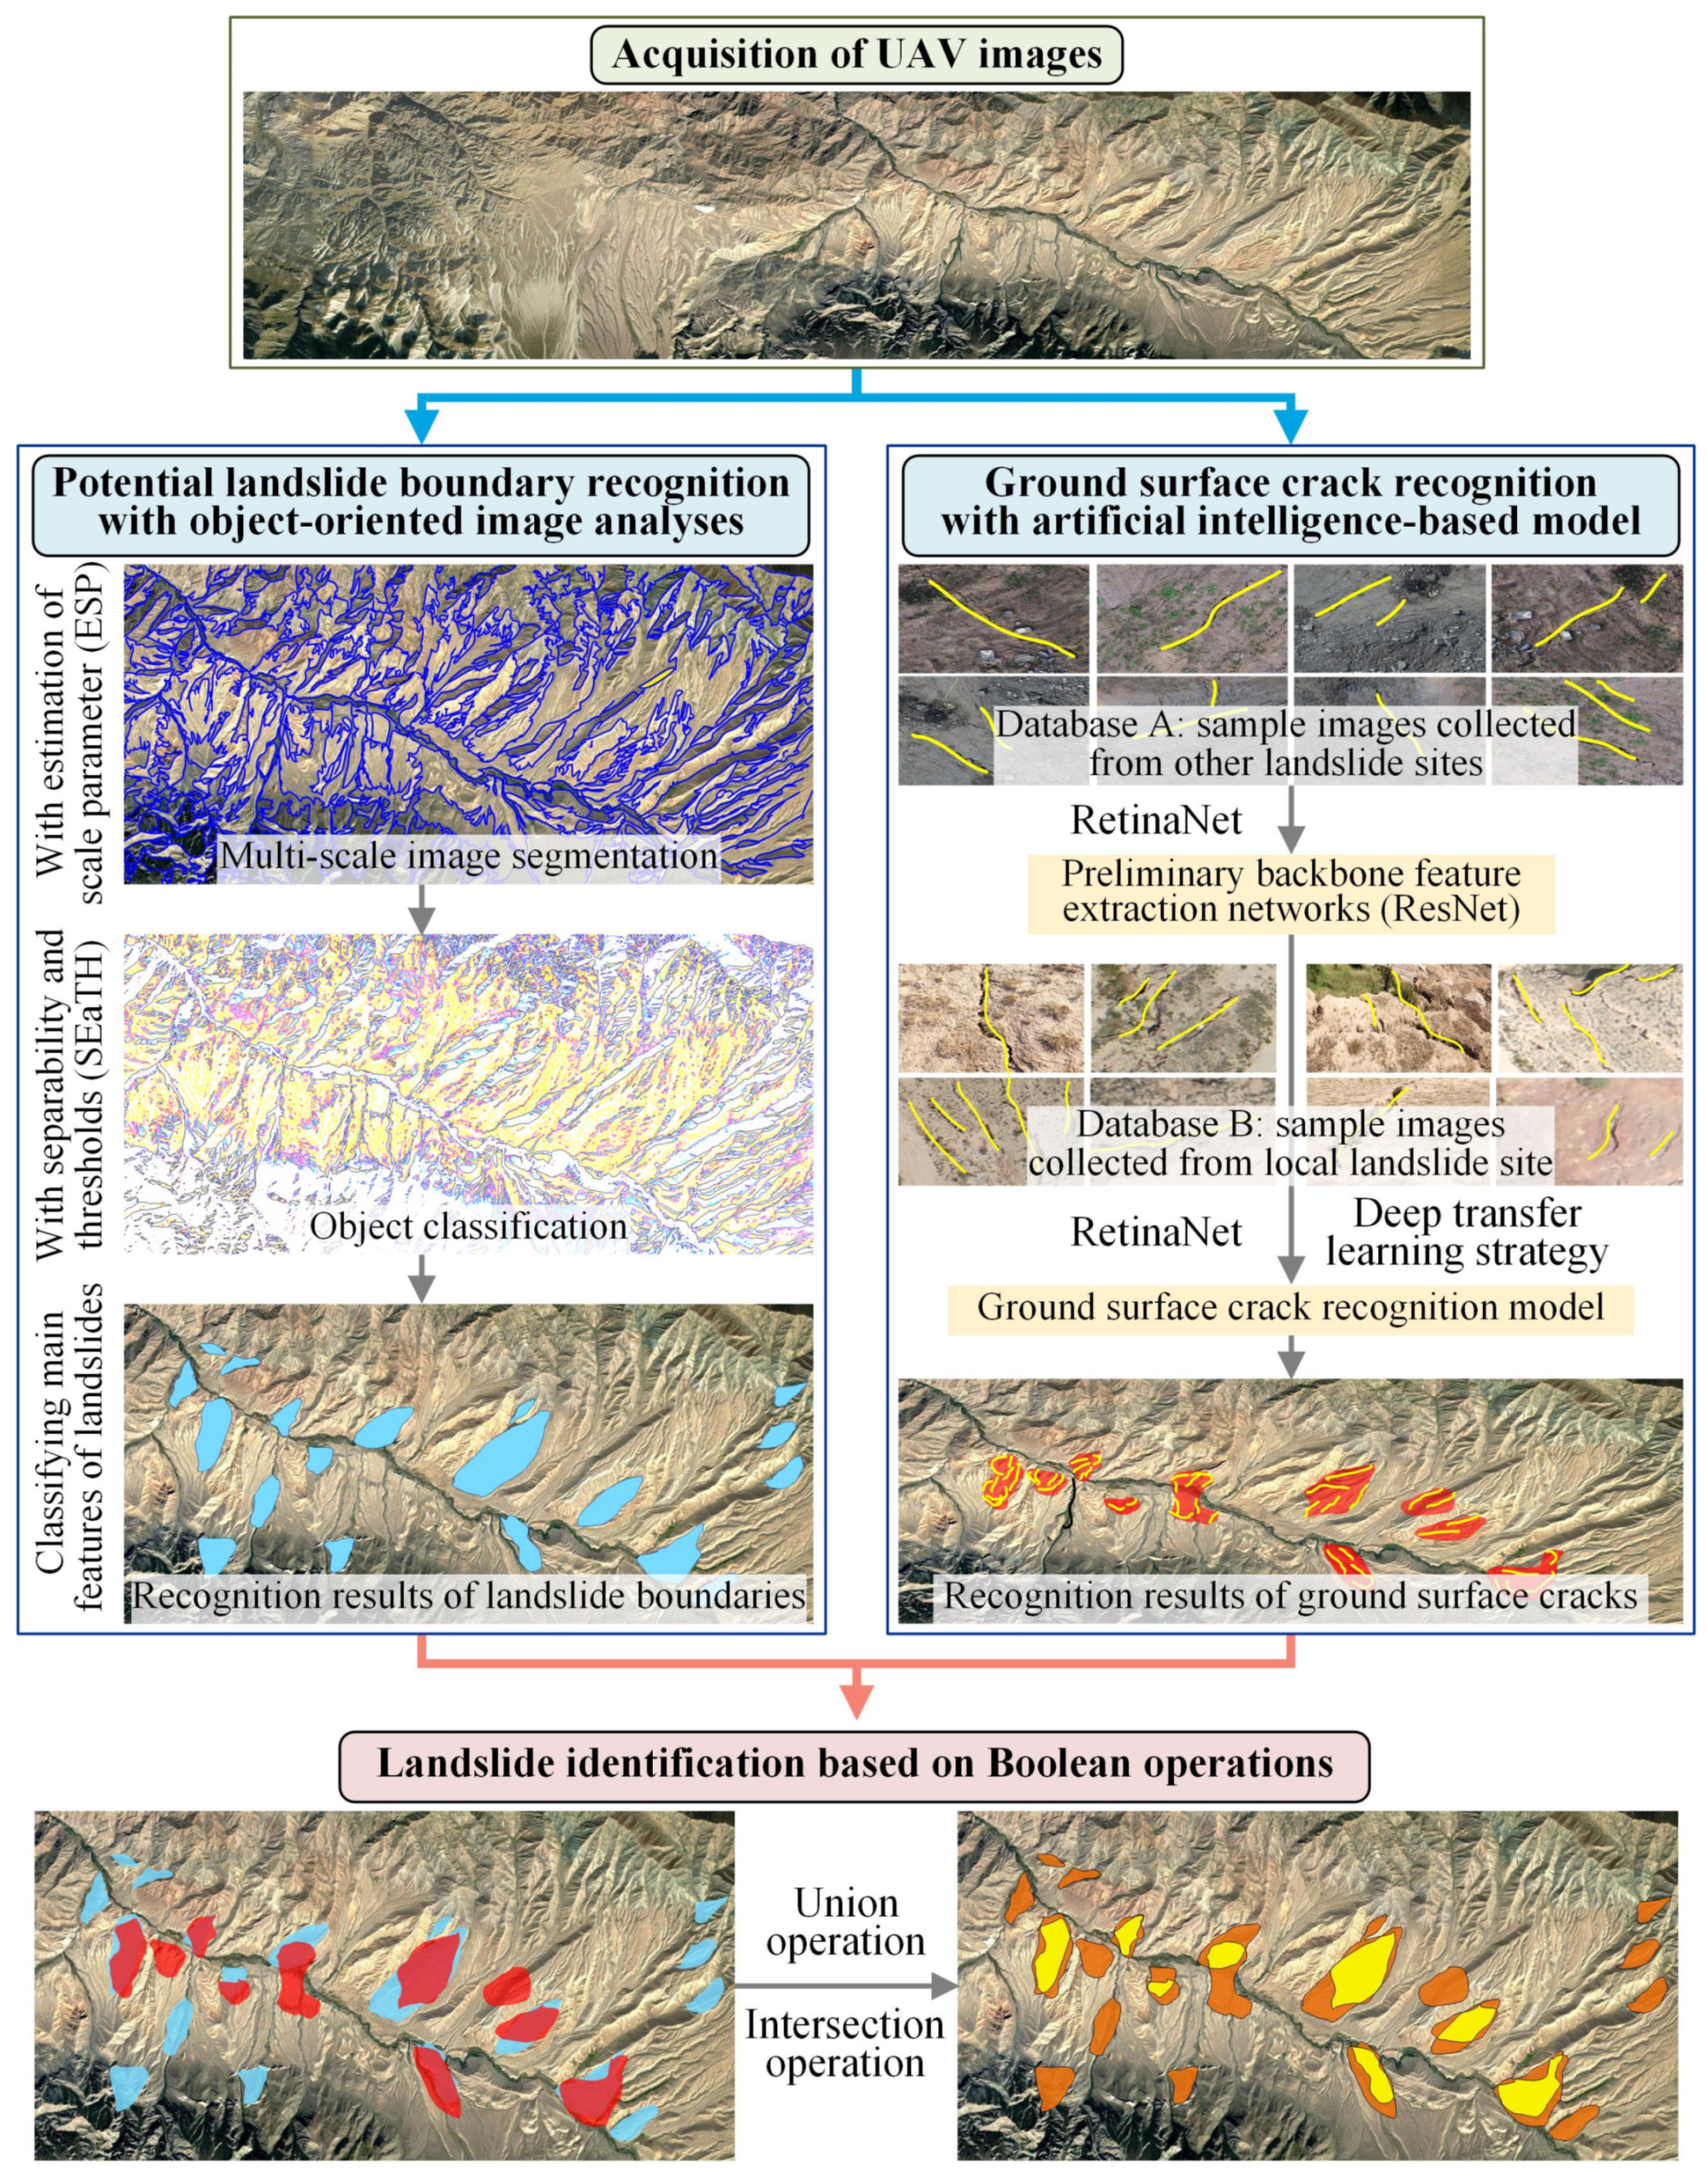
2. Methodology of the Image-Analysis-Based Landslide Identification Framework

The behavior of a landslide can be influenced by multiple factors, including geological setting, lithology, geomorphic process, and groundwater regime [7,22,23]. In general, all these influencing factors should be characterized and considered in the detection and diagnosis of a landslide. Most of these influencing factors, however, cannot be precisely characterized. Nevertheless, during the evolution of a landslide, various landslide attributes, such as tree tilting, scarp, geomorphology change, ground surface crack, and ground deformation, can be detected or observed [11,24,25,26], and these attributes could provide an alternative approach to the identification of a potential landslide.
Among the various landslide attributes, the spectral variation (possibly induced by tree tilting, scarp, geomorphology change, and ground deformation) and the ground surface cracks might be the most significant. Most importantly, there exists a high possibility that these two features can be recognized with machine-based image analysis algorithms such as the object-oriented image analysis [21,27] and artificial-intelligence-based image analysis algorithms [28,29]. In such a situation, an image-analysis-based landslide identification framework is proposed in this paper, and this framework mainly consists of three components: potential landslide boundary recognition with object-oriented image analyses, ground surface crack recognition with an artificial-intelligence-based model, and landslide identification based on Boolean operations of the obtained landslide boundaries and ground surface cracks (Figure 1).
In reference to Figure 1, a multi-scale image segmentation technology is first adopted to segment the UAV images for ease of landslide boundary recognition in the first component; then, spectral characteristic analysis and the classification analysis are undertaken to classify the main features of landslides and sketch the landslide boundaries. The second component involves a deep transfer learning strategy, which is implemented through a dual-database architecture to optimize ground surface crack recognition. The process begins with training an automatic crack recognition model using Database A. This database emphasizes geological diversity, crack typological variability, and environmental configuration differences, all while maintaining high image resolution to ensure clear crack morphology. This design enables the model to assimilate universal crack characteristics across multiple landslide scenarios, including fundamental visual patterns such as crack branching morphology, width variations, and edge discontinuity features. Subsequently, Database B captures study-area-specific attributes through site-specific UAV imagery, incorporating localized geological particularities and triggering factor manifestations. Through coordinated feature fusion during model training, this strategy achieves a synergistic integration of cross-scenario generalization capabilities from Database A and spatial contextual specificity from Database B. This effectively addresses the dual challenges of morphological universality and geographical particularity in crack recognition. In the third component, the recognized landslide boundaries and ground surface cracks are fused based on Boolean operations; then, with the aid of the fusion results, the landslides with different levels of confidence could be identified. More detailed introductions of these three components are provided below.

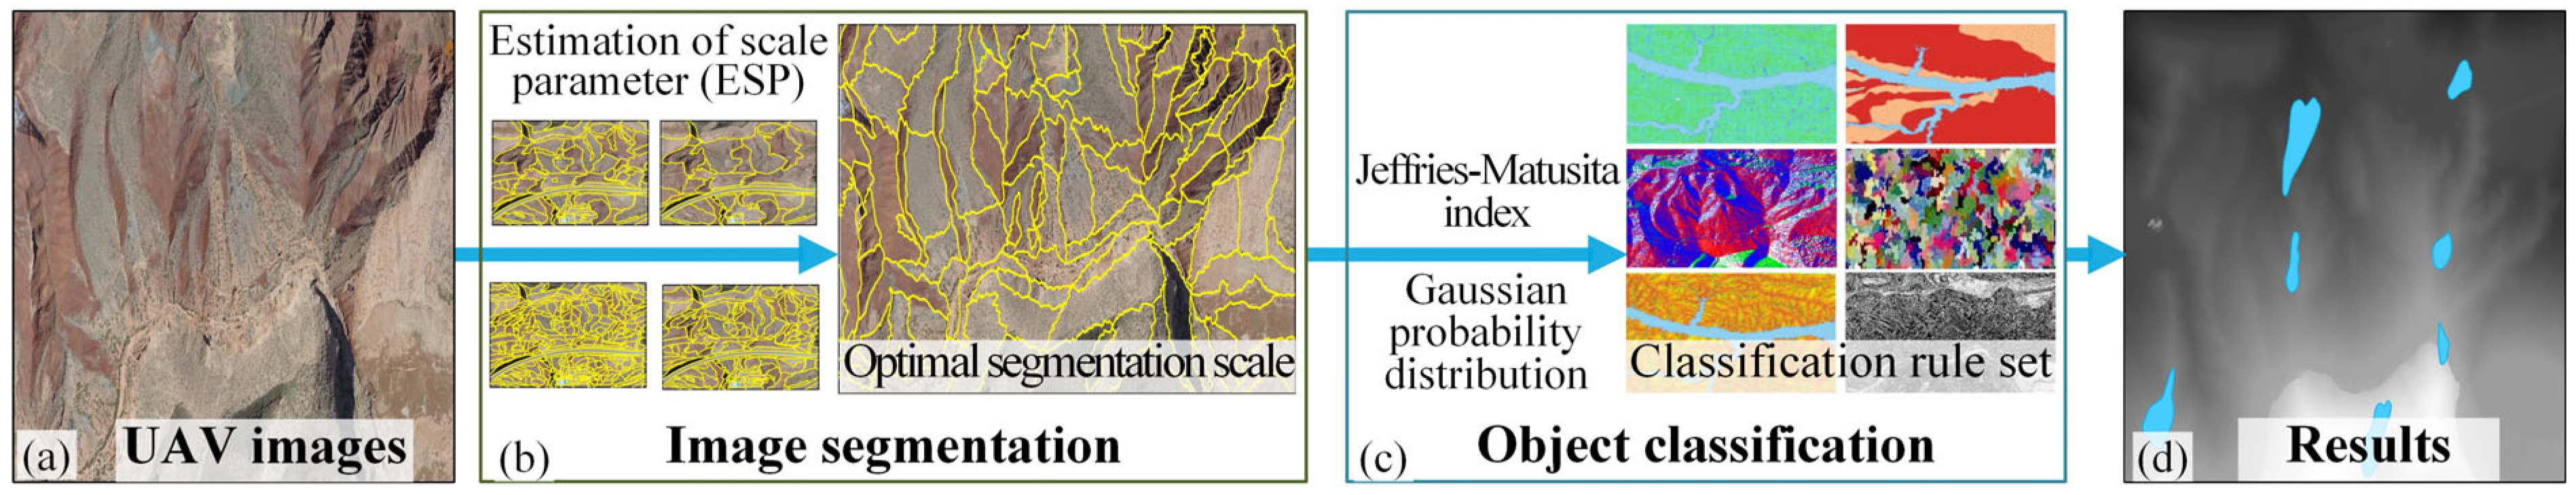
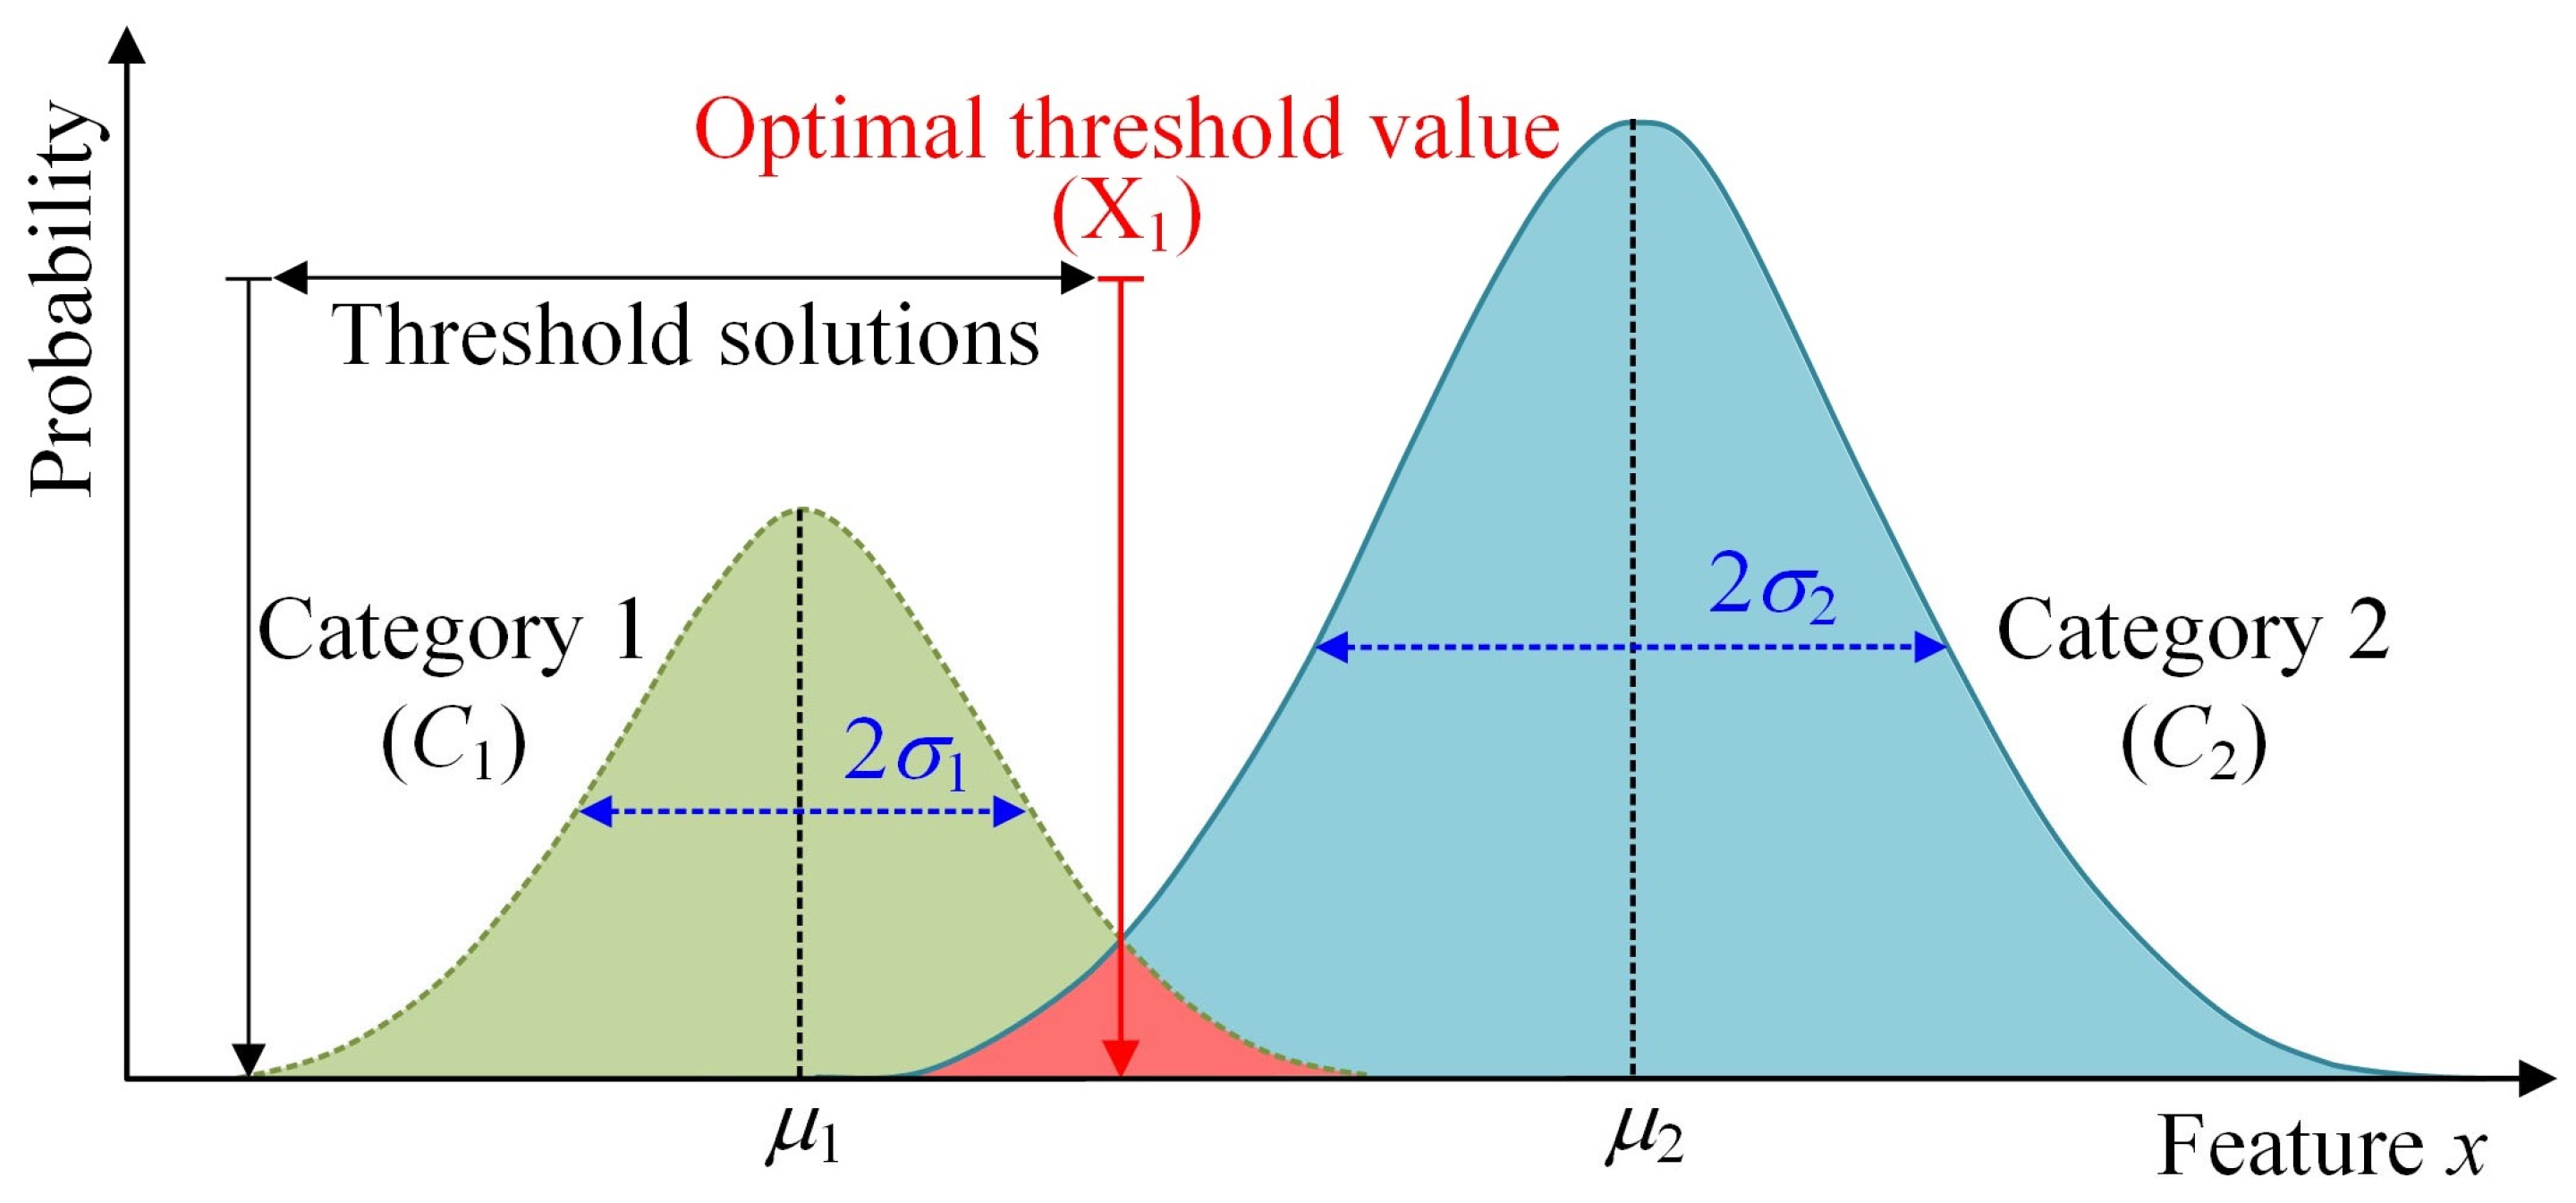
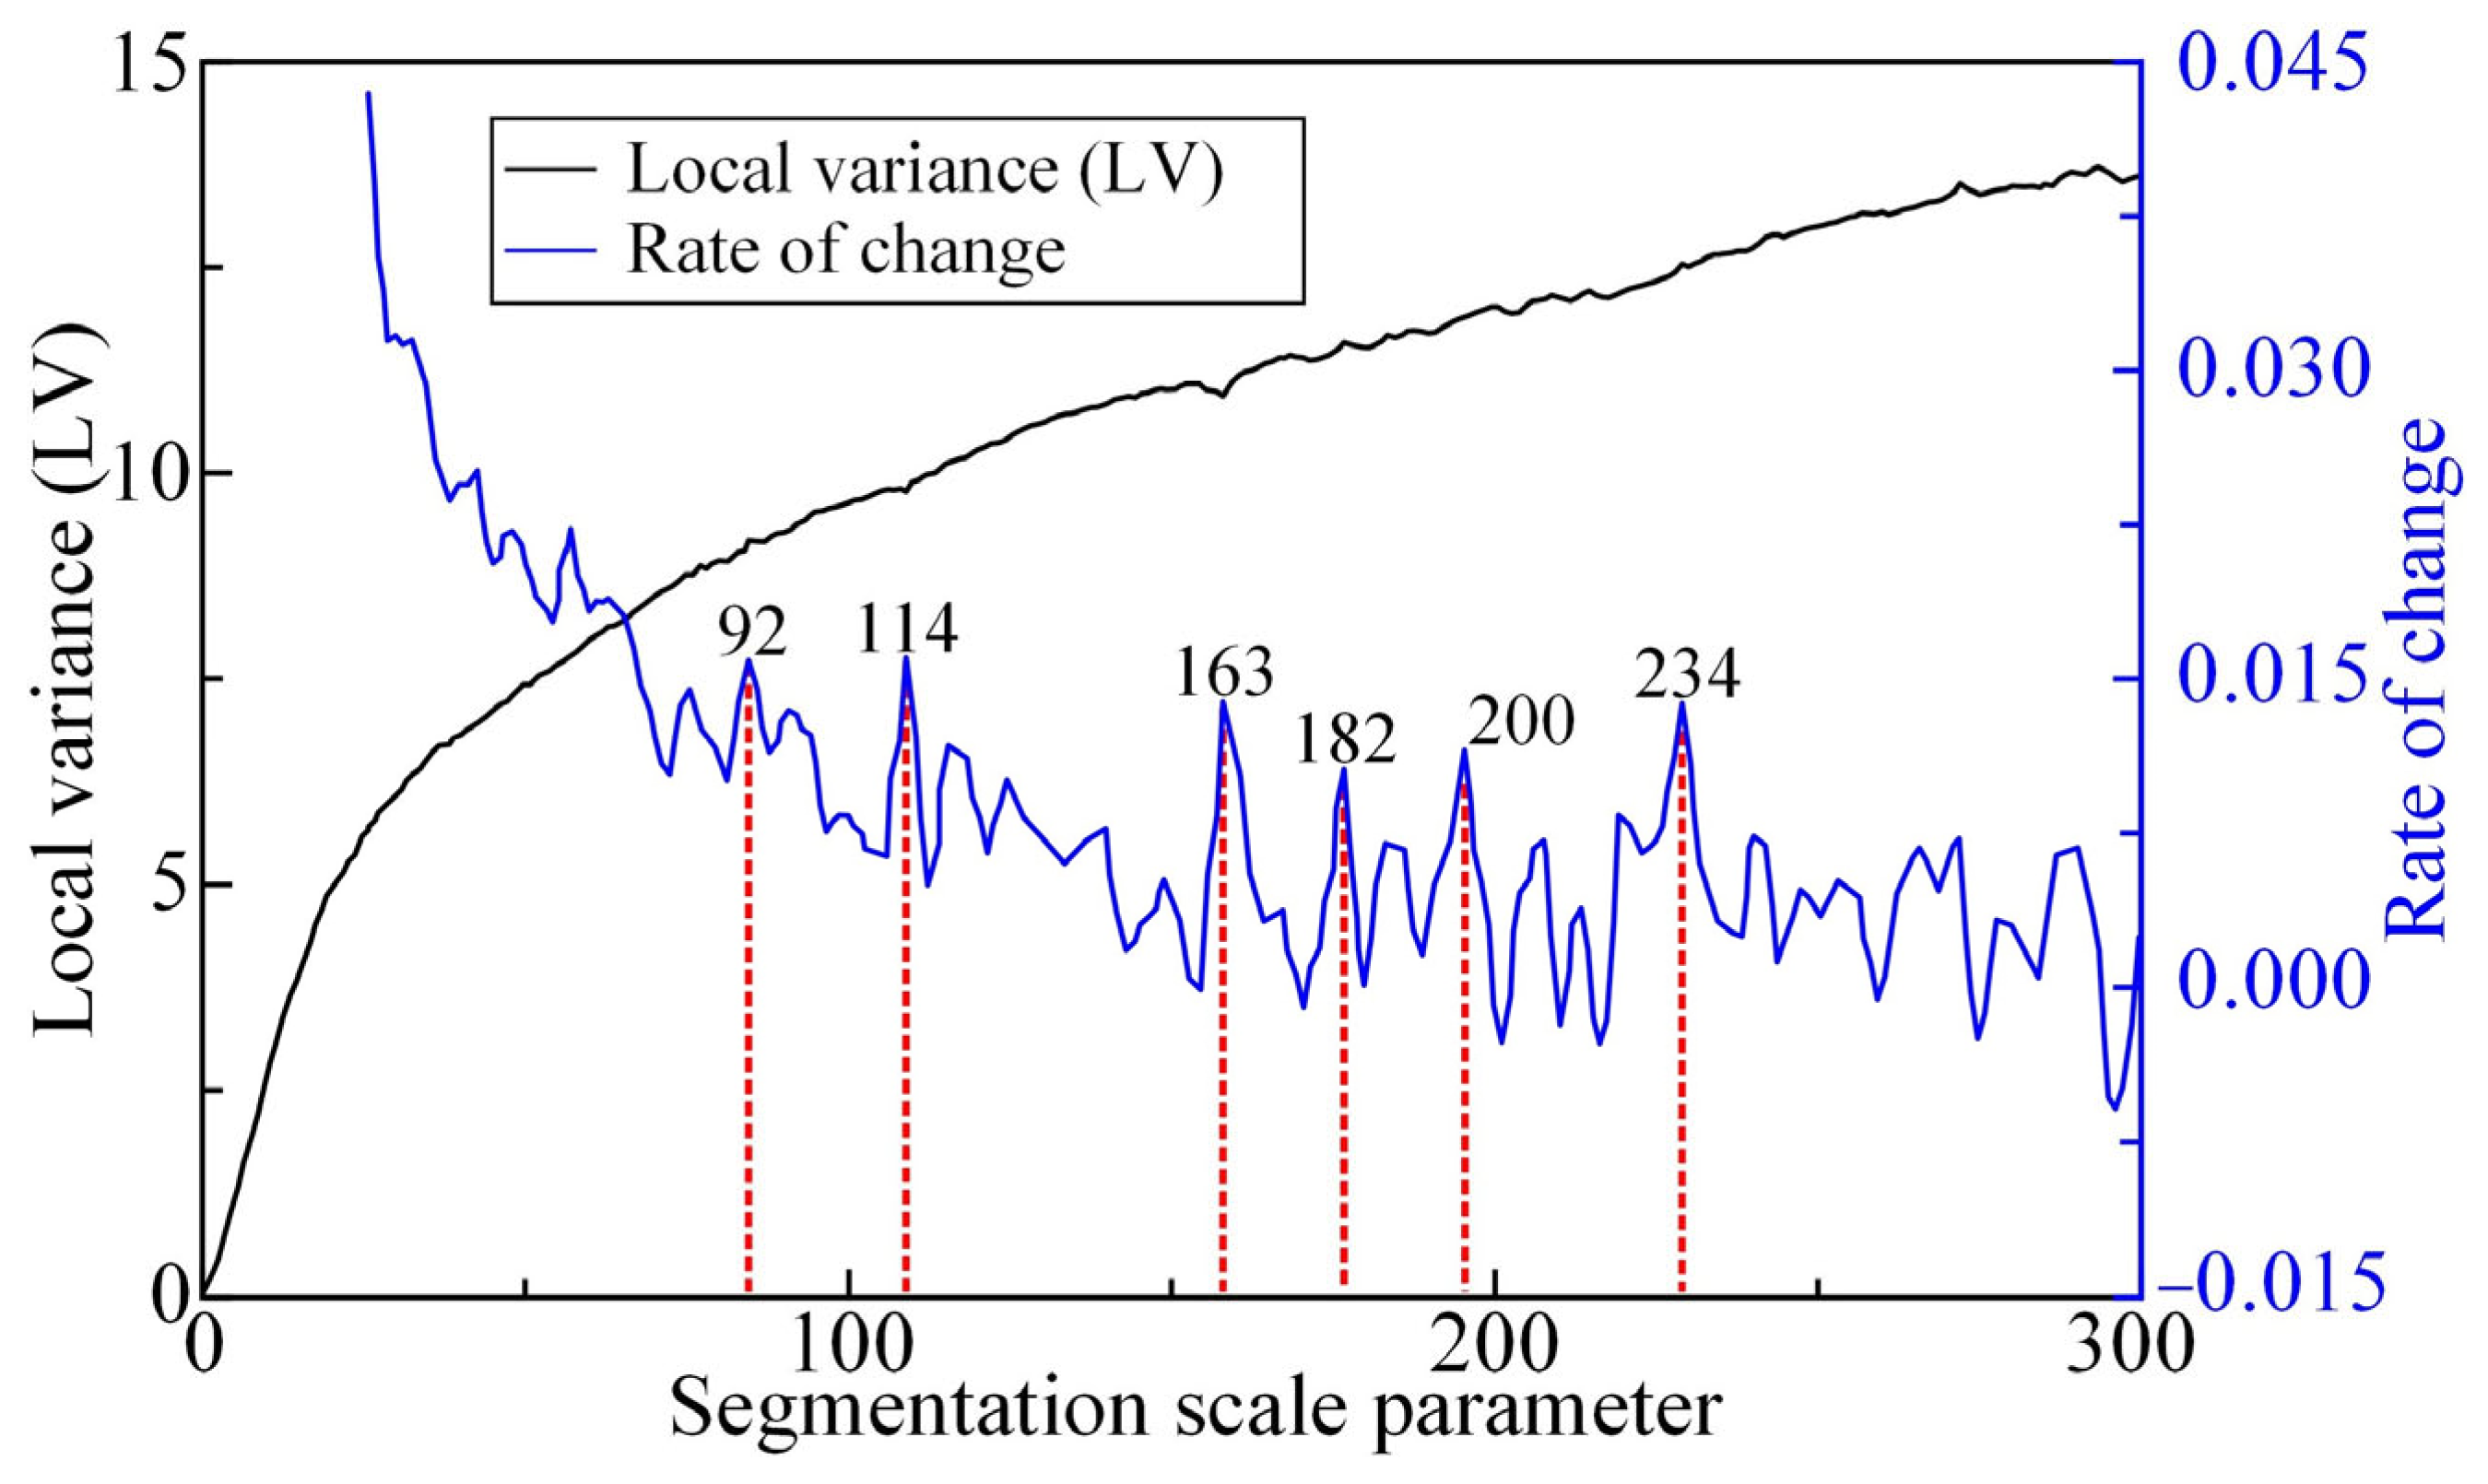
2.1. Potential Landslide Boundary Recognition with Object-Oriented Image Analyses

The surface coverage at a site can be destroyed by the occurrence of landslides, which could be inferred from the discontinuities of the surface coverage in UAV images. In general, the discontinuities of the surface coverage caused by landslide occurrences can be categorized into three aspects: spectral, texture, and shape [21,30,31]. For example, the surface reflectance at landslide sites is strong and the color tone is light due to the loose material composition caused by the landslide deformation [32]. Note that the changes in the shape and color of the surface coverage caused by a landslide can vary spatially [33]; thus, the texture, which indicates the change frequency of the color in an image, can be fairly irregular at a landslide site. Further, the landslide area usually shows special plane shapes such as armchair and ellipse [34]. The spectral, texture, and shape features in UAV images can be well clustered in object-oriented image analysis [35,36]. Hence, an object-oriented image analysis is adopted in this paper to recognize the landslide area and boundaries in the UAV images. The basic purpose of the object-oriented image analysis is to cluster the pixels in an image with high homogeneity into basic objects, based upon analysis of the spectral, texture and other features, and recognize the target based on the classification of the clustered basic objects. There exist two main components, as depicted in Figure 2.
The accuracy of feature extraction and object classification can be strongly affected by the quality of image segmentation [37]; thus, the following criteria are usually followed during the image segmentation: a basic object should be composed of the pixels with similar spectral, texture, and other features; meanwhile, there are significant differences between different objects [38]. In other words, a high-quality image segmentation should maximize the homogeneity within each object while maximizing the heterogeneity between different objects. However, in high-resolution UAV imagery, smaller Ground Sampling Distance (GSD) may exacerbate internal heterogeneity of ground objects, posing challenges to achieving ideal uniformity. Further, there exist various types of ground objects in a UAV image, and their sizes and internal complexities can differ significantly. To address these issues, the multi-scale segmentation method [39] is utilized in this paper to balance the trade-offs between over-segmentation (excessive fragmentation under small scales) and under-segmentation (pseudo-pixel aggregation under large scales) caused by high-resolution GSD. The segmentation results in multi-scale frameworks critically relying on the segmentation scale parameter. For instance, a small segmentation scale parameter tends to generate fragmented objects, particularly in high-GSD images where noise and fine textures dominate; conversely, a large-scale parameter may mask critical boundaries, especially for spectrally similar but structurally distinct objects. An optimal segmentation scale parameter must ensure both boundary clarity and semantic coherence of objects, which is particularly vital for applications like landslide mapping requiring precise contour extraction. To avoid the arbitrariness of conventional trial-and-error analysis, this paper adopts the Estimation of Scale Parameter (ESP) tool [40]. The ESP algorithm quantifies the local variance (LV) and rate of change (ROC) heterogeneity metrics, enabling data-driven optimization of scale parameters while accounting for the inherent heterogeneity challenges in high-resolution UAV imagery.
The segmented objects serve as inputs for classification, where accuracy depends on the rule set comprising spectral/textural/shape features and thresholds [41]. Oftentimes, the classification rule set could be constructed through visual interpretation or automatic feature determination based on training samples [42]. Note that visual interpretation relies upon the experience of engineers, and the feature set and the corresponding threshold set are generally determined through trial-and-error analyses; thus, the classification rule constructed might be incomplete. To overcome this problem, the automatic feature determination is adopted in this paper, and the algorithm of separability and thresholds (SEaTH) [43], which helps determine the optimal features and the related threshold values of these features (to distinguish different categories of objects) automatically, is adopted to construct the classification rule set. Within the context of the SEaTH algorithm, the separability of the features is measured by the Jeffries–Matusita (J-M) index [44], the optimal features are mainly determined based on the J-M indexes computed for the training samples, and the optimal threshold values of the selected features, which are readily employed for separating different object categories, are calculated based on the Gaussian probability distribution. The readers are referred to Nussbaum et al. [43] for more detailed information on the SEaTH algorithm.
The object-oriented framework necessitates rigorous feature prioritization for distinct geomorphological units. Our analysis systematically identified optimal diagnostic parameters through iterative spectral–geometric evaluations. This optimized feature space configuration effectively discriminates between hillslope processes while maintaining computational parsimony. Based on the sample images collected, the probability density functions for all the candidate features can be constructed using statistical approaches, which are then adopted to evaluate the separability between different object categories. With an assumption of normal distributions, the separability of a feature between two object categories within the algorithm of SEaTH is measured by the Jeffries–Matusita (J-M) index [44].
J - M = 2 ( 1 e B )
B = 1 8 μ 1     μ 2 2 2 σ 1 2 + σ 2 2 + 1 2 I n σ 1 2 + σ 2 2 2 σ 1 σ 2
Here, B represents the Bhattacharyya distance [45]; μ1 and μ2 represent the mean values of this feature for the two object categories compared; σ1 and σ2 represent the standard deviations of this feature for the two object categories. In general, the calculated value of this J-M index ranges from 0 to 2, and a smaller J-M value signals worse separability of the analyzed feature between the two object categories. When the value of this J-M index is equal to 2, the two object categories can be completely separated by the analyzed feature; thus, this feature could be selected as an optimal feature for object classification. Based on the J-M indexes calculated, the prominent features for separating the landslide and non-landslide areas can be determined. Here, the features with J-M indexes greater than 1.75 [44] are selected as the prominent features. Then, the threshold values of these prominent features are estimated based on the Gaussian probability distribution [43], and the following Gaussian probability distribution mixture model is adopted in this paper.
P x = P ( x | C 1 ) P ( C 1 ) + P ( x | C 2 ) P ( C 2 )
Here, P(x) denotes the probability of a feature x; P(x|C1) and P(x|C2) are the probabilities of the feature x that belong to object categories, C1 and C2, respectively; and P(C1) and P(C2) are the probabilities of object categories C1 and C2, respectively. Note that the mixture or intersection between the two object categories C1 and C2 yields the least when P(x|C1) = P(x|C2), and the corresponding eigenvalue is X1; thus, this eigenvalue X1 can be taken as the optimal threshold value of the feature x for separating object categories C1 and C2 (see Figure 3).
It should be mentioned that apart from the materials discussed above, the results of the object-oriented image analysis might also be influenced by some other parameters such as the shape value and compactness value. However, the selection of these parameters is often site-specific or relatively simple; thus, the determination of these parameters is not discussed in this section. It is noted that the object-oriented image analysis in this paper is implemented in the eCognition software (Trial Version 9.0) (Trimble Geospatial Imaging).

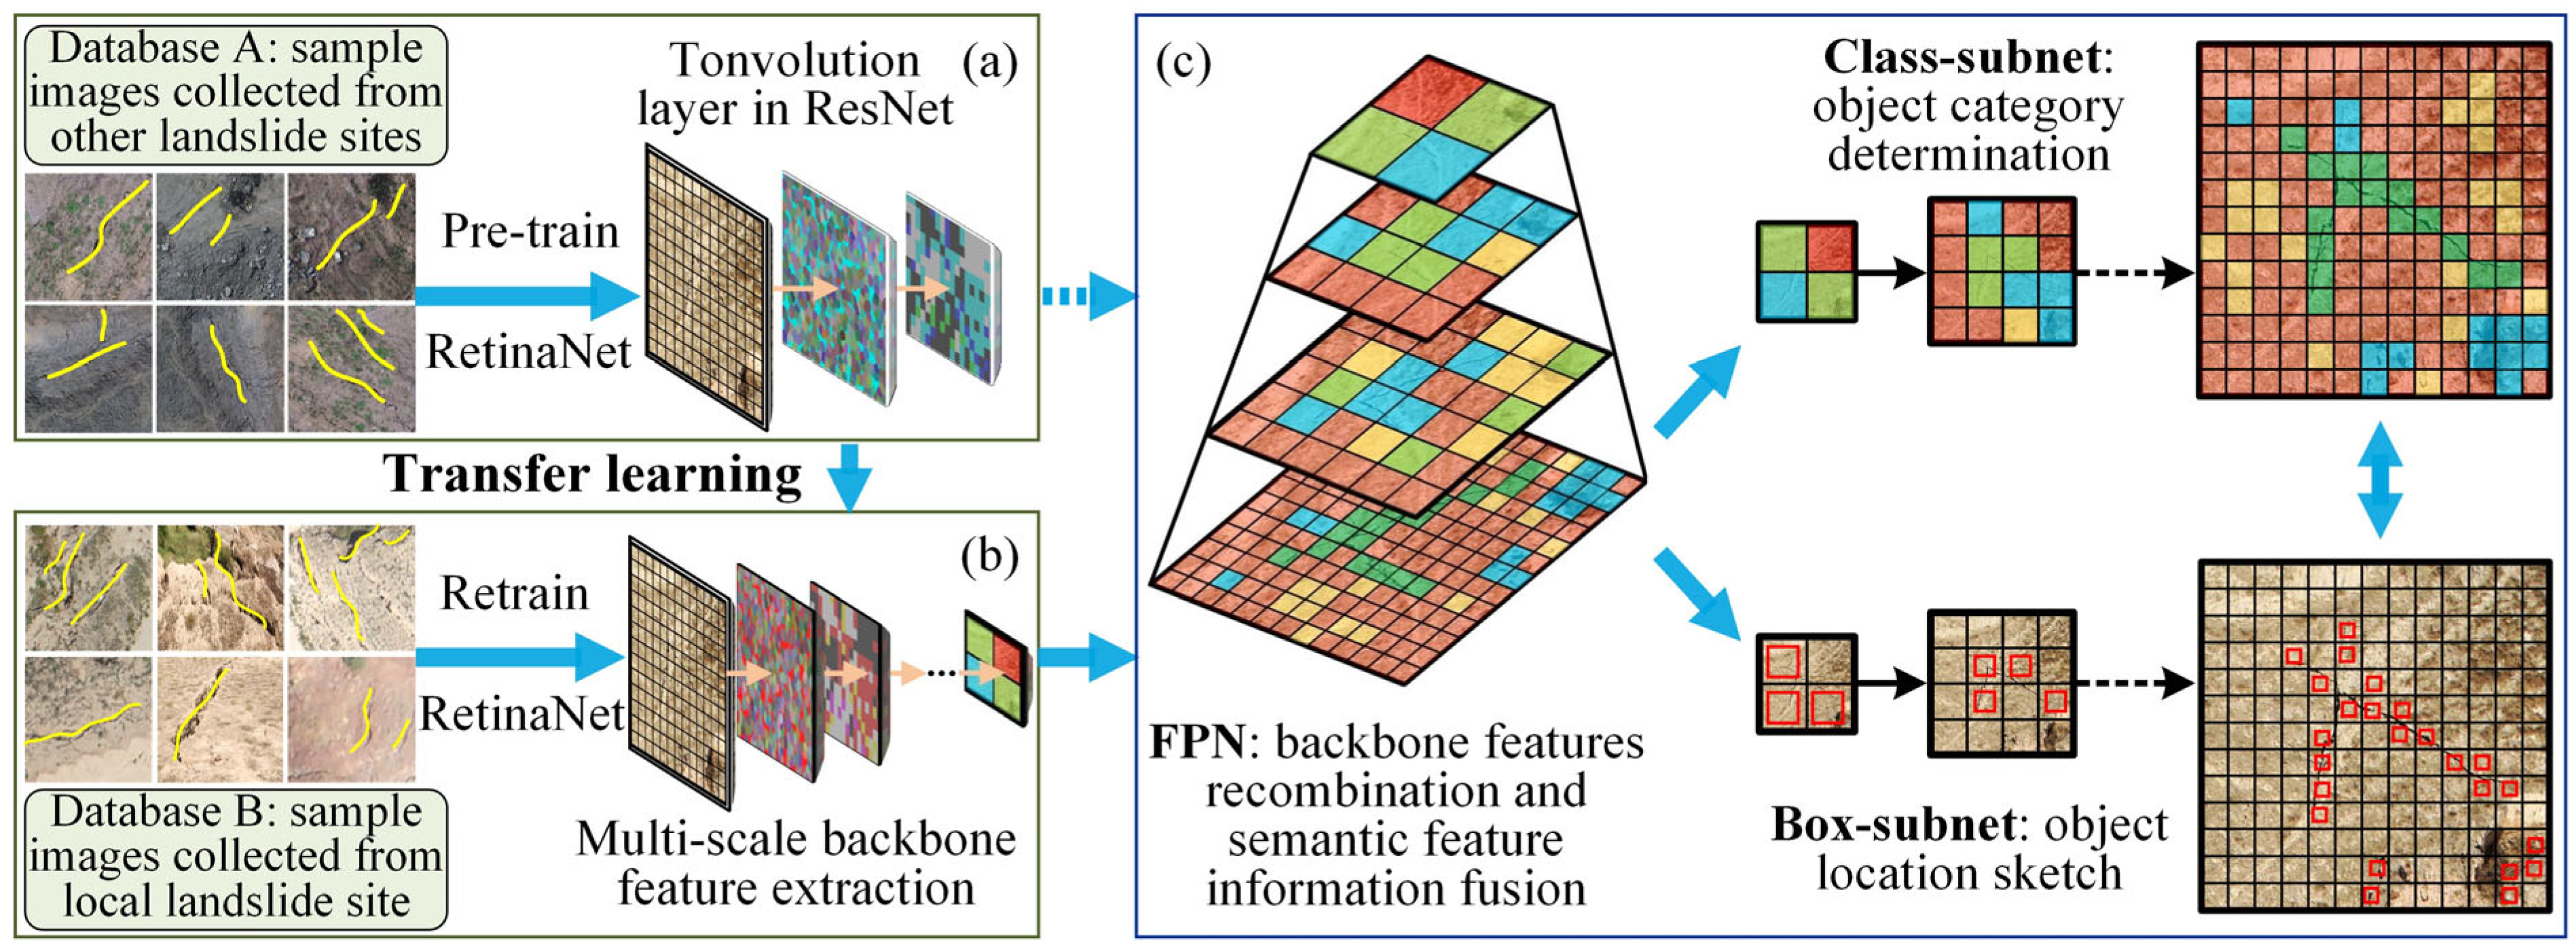
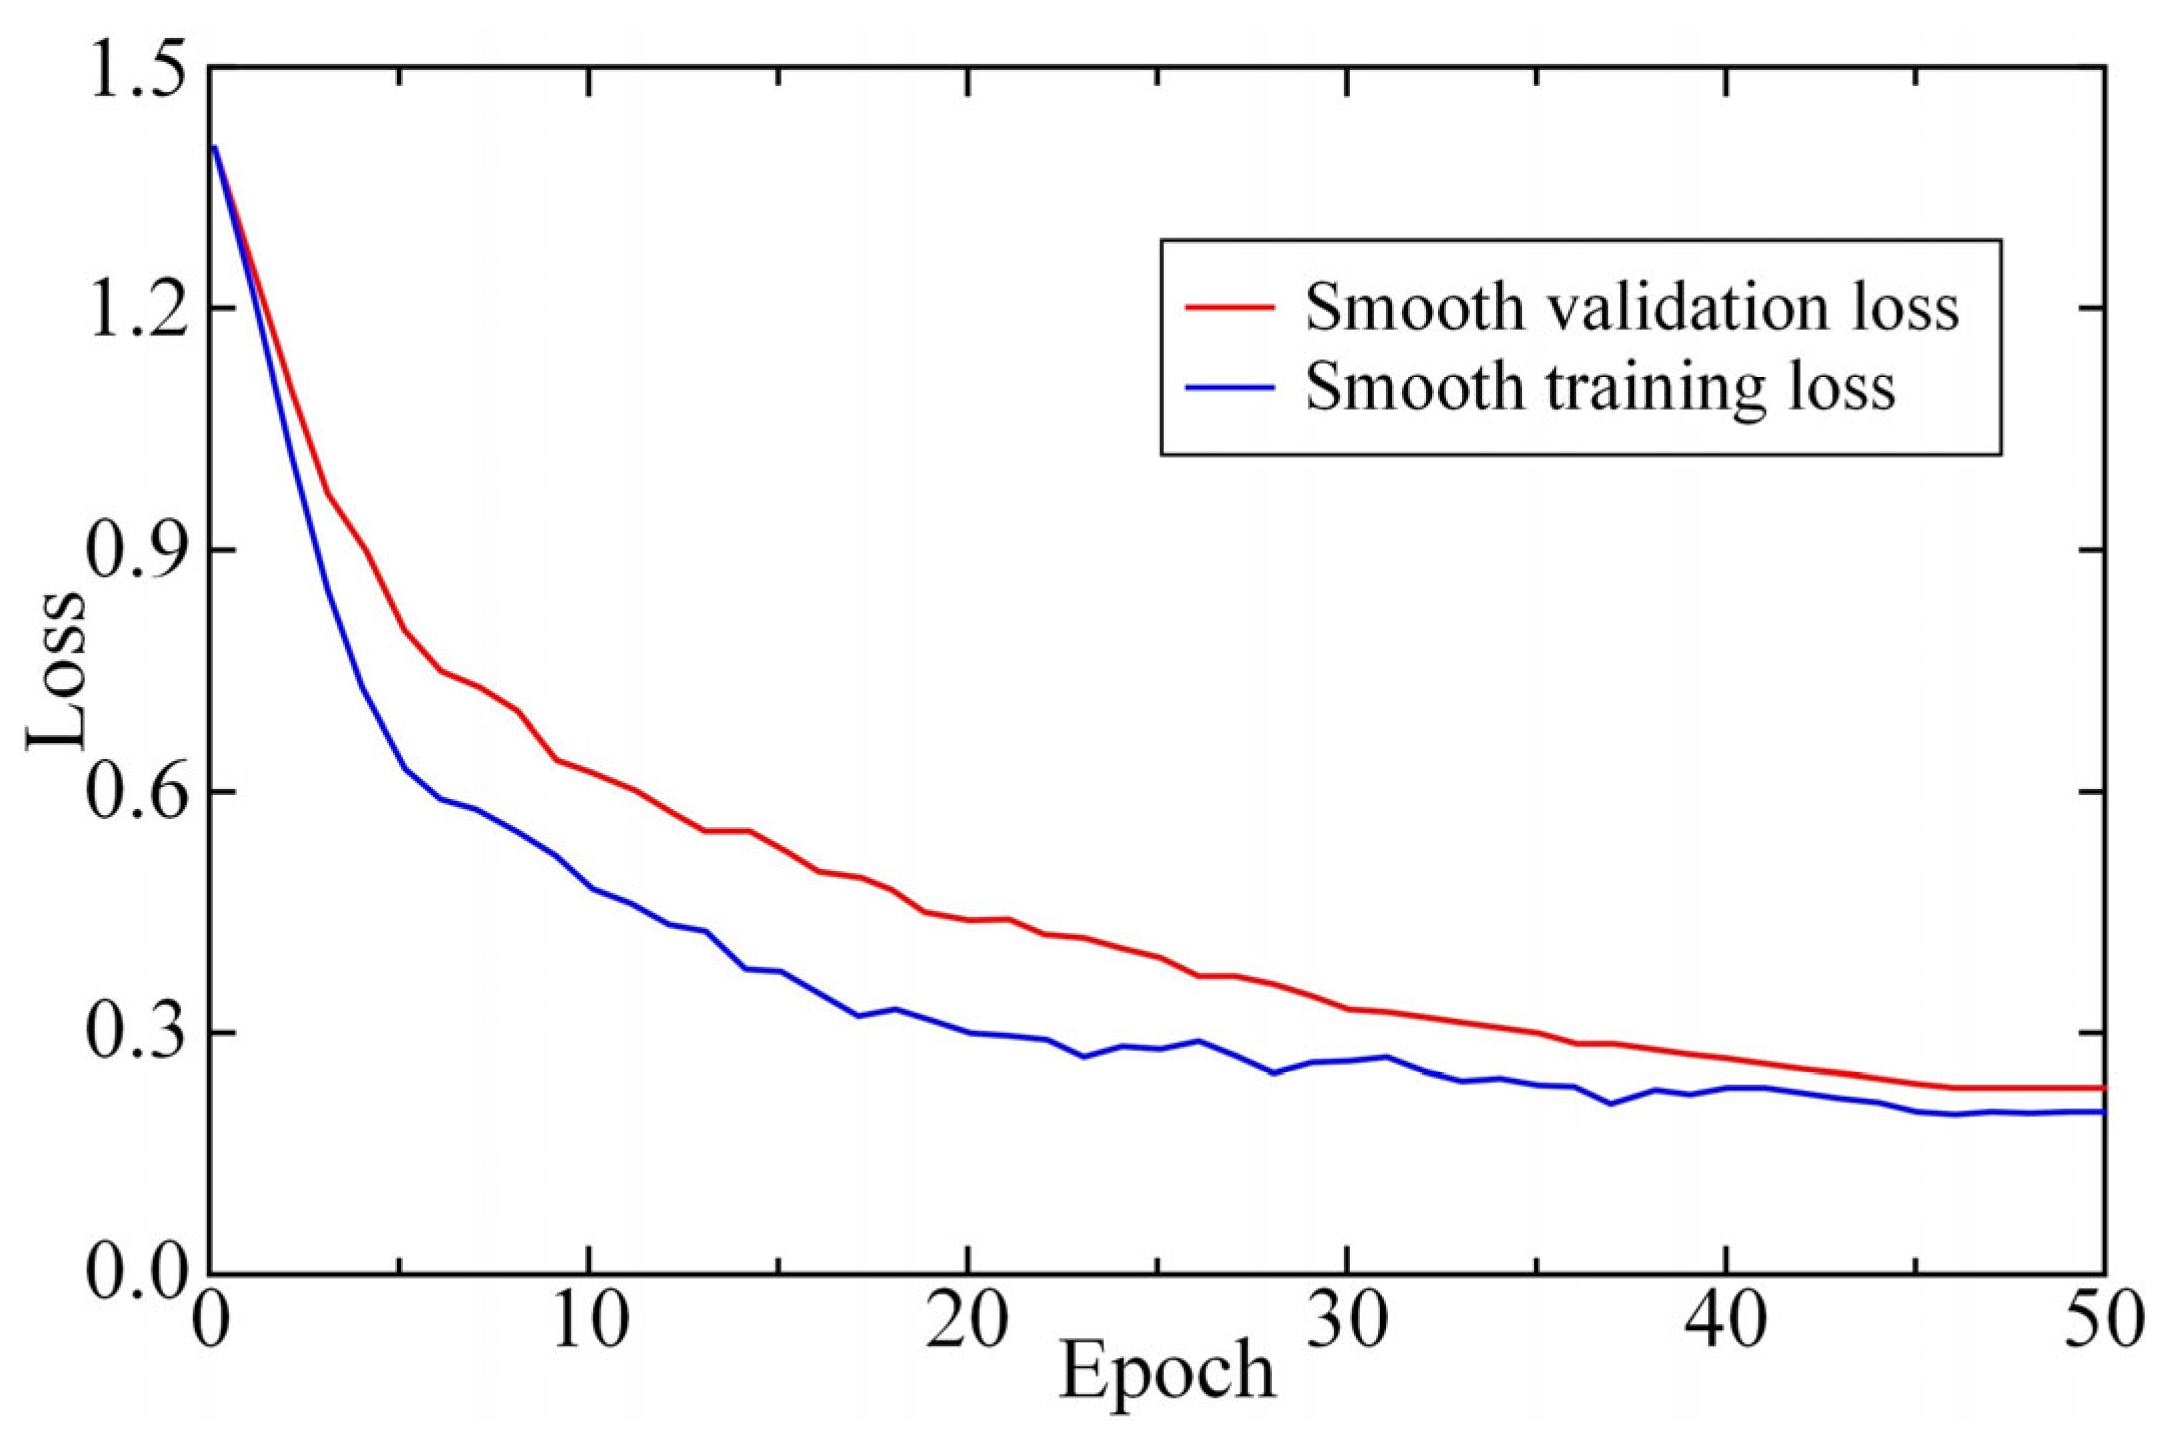
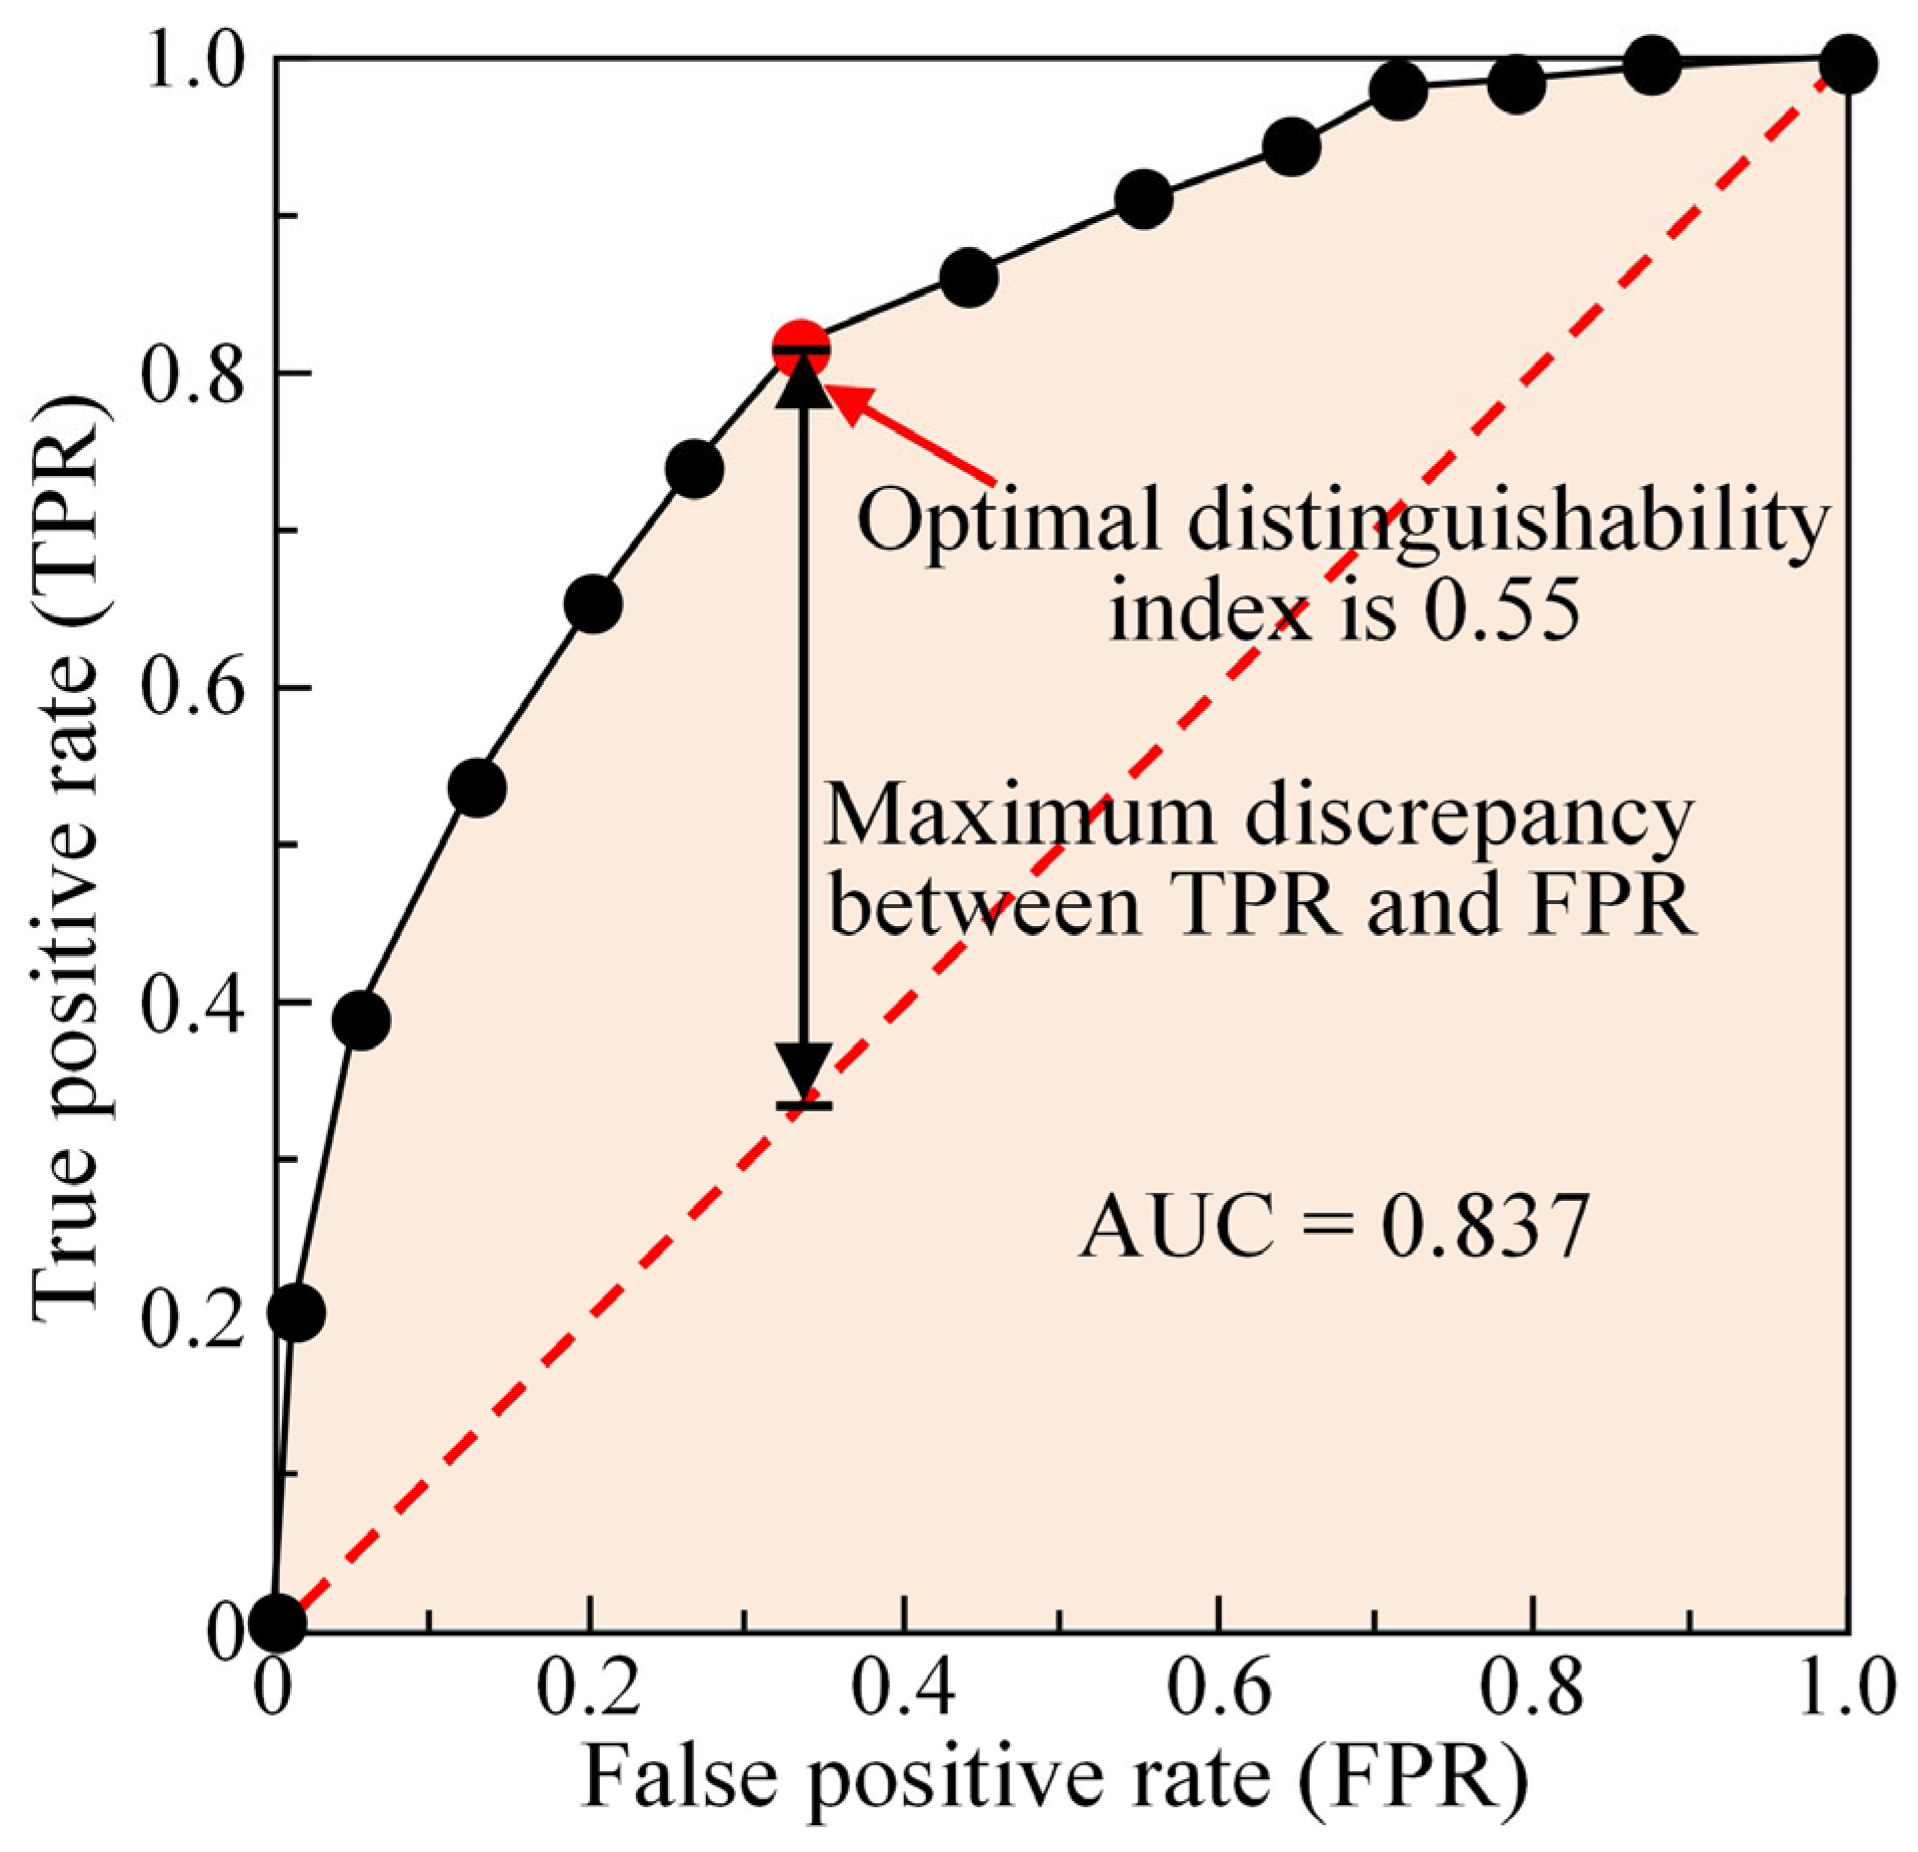
2.2. Ground Surface Crack Recognition with an Artificial-Intelligence-Based Model

The evolution of a landslide is often accompanied by a large number of ground surface cracks, and these cracks are distributed within the landslide area or along the landslide boundaries [8,11]. The ground surface cracks at a landslide site, in conventional engineering practices, are usually identified through field surveys, which could be time-consuming and inefficient [46]. Recent advances in remote sensing technology have enabled the acquisition of high-resolution aerial imagery, providing a robust alternative to traditional field surveys and facilitating efficient remote-based identification of ground-surface cracks [47]. However, most of the existing studies on aerial-photograph-based crack recognitions are based on visual inspections and machine-interpretation-based automatic crack recognitions are fairly limited. Further, the transferability of the developed machine-interpretation-based crack recognition models is often poor due to the complexity of the landslide crack characteristics and scenes [8,48]. It is known that deep-learning-algorithm-based image recognition models are often composed of multiple processing layers, which can allow learning representations of the training data with multiple levels of abstraction [49]. As such, the deep-learning-algorithm-based image recognition model is better at detecting objects in complex scenes and the model transferability is higher [28,50]. Thus, a deep-learning-algorithm-based crack recognition model is developed here to detect the ground surface cracks in the UAV images.
The deep-learning-based image recognition technique of RetinaNet [51], which has been widely adopted for image recognition since its inception [11,52,53], is adopted in this paper for developing the ground surface crack recognition model. A significant feature of RetinaNet is that a novel focal loss function is introduced to reduce the common two-stage architecture into a single-stage architecture for object detection, and the issue of foreground-background imbalance is addressed. The focal loss used in RetinaNet, proposed by Lin et al. [51], has the following mathematical expression:
F L ( p t ) = α t ( 1 p t ) γ log ( p t )
Here, Pt is the model’s predicted probability for the sample; αt is the balancing factor, which adjusts the loss weights for positive and negative samples; γ is the modulating factor, which controls the weight decay for easy-to-classify samples; log (Pt) is the standard cross-entropy loss. The focal loss improves detection accuracy through the following mechanisms: the balancing factor increases the weight of positive samples to alleviate the issue of large differences in the number of positive and negative samples; the modulating factor dynamically reduces the loss contribution of easy-to-classify samples, allowing the model to focus more on hard-to-classify samples. This design effectively enhances RetinaNet’s ability to detect rare targets such as landslide cracks.
RetinaNet mainly consists of four components: ResNet, FPN, class-subnet, and box-subnet [11]. ResNet comprises the backbone feature extraction networks, in which the input sample images are divided into different grid sizes and the multi-scale backbone feature of the target object is extracted; FPN comprises the feature pyramid networks, in which the backbone features of the concerned object and the high-level semantic feature information are fused into feature pyramids; class-subnet is adopted to determine the category of the object in the input image, according to the feature information provided by FPN; and box-subnet is used to sketch the location of the detected object in the input image. For ease of training an automatic ground surface crack recognition model with RetinaNet, a sufficient number of sample images containing ground surface cracks and non-ground surface cracks should first be collected, and the collected sample images should be further categorized into training and testing images. Oftentimes, the ratio of the number of training images over that of testing images could be set up as 8:2 or 7:3 when the sample size is not very large [54]. Then, both training and testing images could be imported to the platform of GPU-based TensorFlow-Keras and these samples could be trained utilizing RetinaNet; the outcome of this training would be an automatic image recognition model. The readers are referred to Lin et al. [51] and Cheng et al. [11] for more detailed information on RetinaNet.
It is known that the effectiveness of a deep-learning-algorithm-based model relies upon the quality and quantity of input samples, and a premise of a good image recognition model is a large size of high-quality samples. In general, the size of sample image set, taken for training a deep-learning-algorithm-based image recognition model, should be positively correlated to the degree of complexity of the target object [49]. It is, however, noted that the characteristics of ground surface cracks are complex, and the feature of the ground surface cracks can be site-specific due to the inherent geological conditions and trigger factors. As an outcome, the establishment of a site-specific image database consisting of a sufficient number of sample images containing ground surface cracks and non-ground surface cracks could be a significant challenge. To address this issue, a deep transfer learning strategy [55,56] is adopted herein to aid the training of the ground surface crack recognition model utilizing RetinaNet.
For ease of applying the aforementioned deep transfer learning strategy, two databases of sample images should be established: Database A, which represents the sample images (containing ground surface cracks and non-ground surface cracks) collected from the other sites, and Database B, which represents the sample images collected from the local site or study area. The image selection criteria for Database A should adhere to the following principles: to capture common characteristics of ground surface cracks across diverse scenarios, priority should be given to ensuring variability in geological conditions, crack typologies, and environmental configurations, thereby enabling the model to learn fundamental features of cracks across broad contexts (see Figure 4a). Image resolution should maintain reasonable consistency to guarantee clearly visible morphological characteristics of cracks, ensuring effective learning of visual patterns associated with ground surface cracks. It should be emphasized that the primary objective of Database A is to provide the model with comprehensive foundational knowledge of general crack features. Subsequently, site-specific characteristics of ground surface cracks, influenced by local geological conditions and triggering factors, can only be derived from Database B, which captures unique attributes of the study area (see Figure 4b). Through coordinated utilization of both databases, the deep transfer learning strategy facilitates effective integration of universal and localized crack features, ultimately enhancing recognition accuracy through this complementary dual-database architecture. Within the context of the adopted deep transfer learning strategy, Database A is adopted to pre-train the image recognition model using RetinaNet. This pre-training results in the preliminary backbone feature extraction networks (known as ResNet) for ground surface cracks. Then, the basic feature layers in ResNet such as combination mode and spatial distribution probability are retained; meanwhile, the redundant information is removed. Finally, the sample images collected from the concerned site, the size of which is often small, and the processed ResNet are imported to the platform and re-trained utilizing RetinaNet; the outcome is an improved ground surface crack recognition model (see Figure 4c).

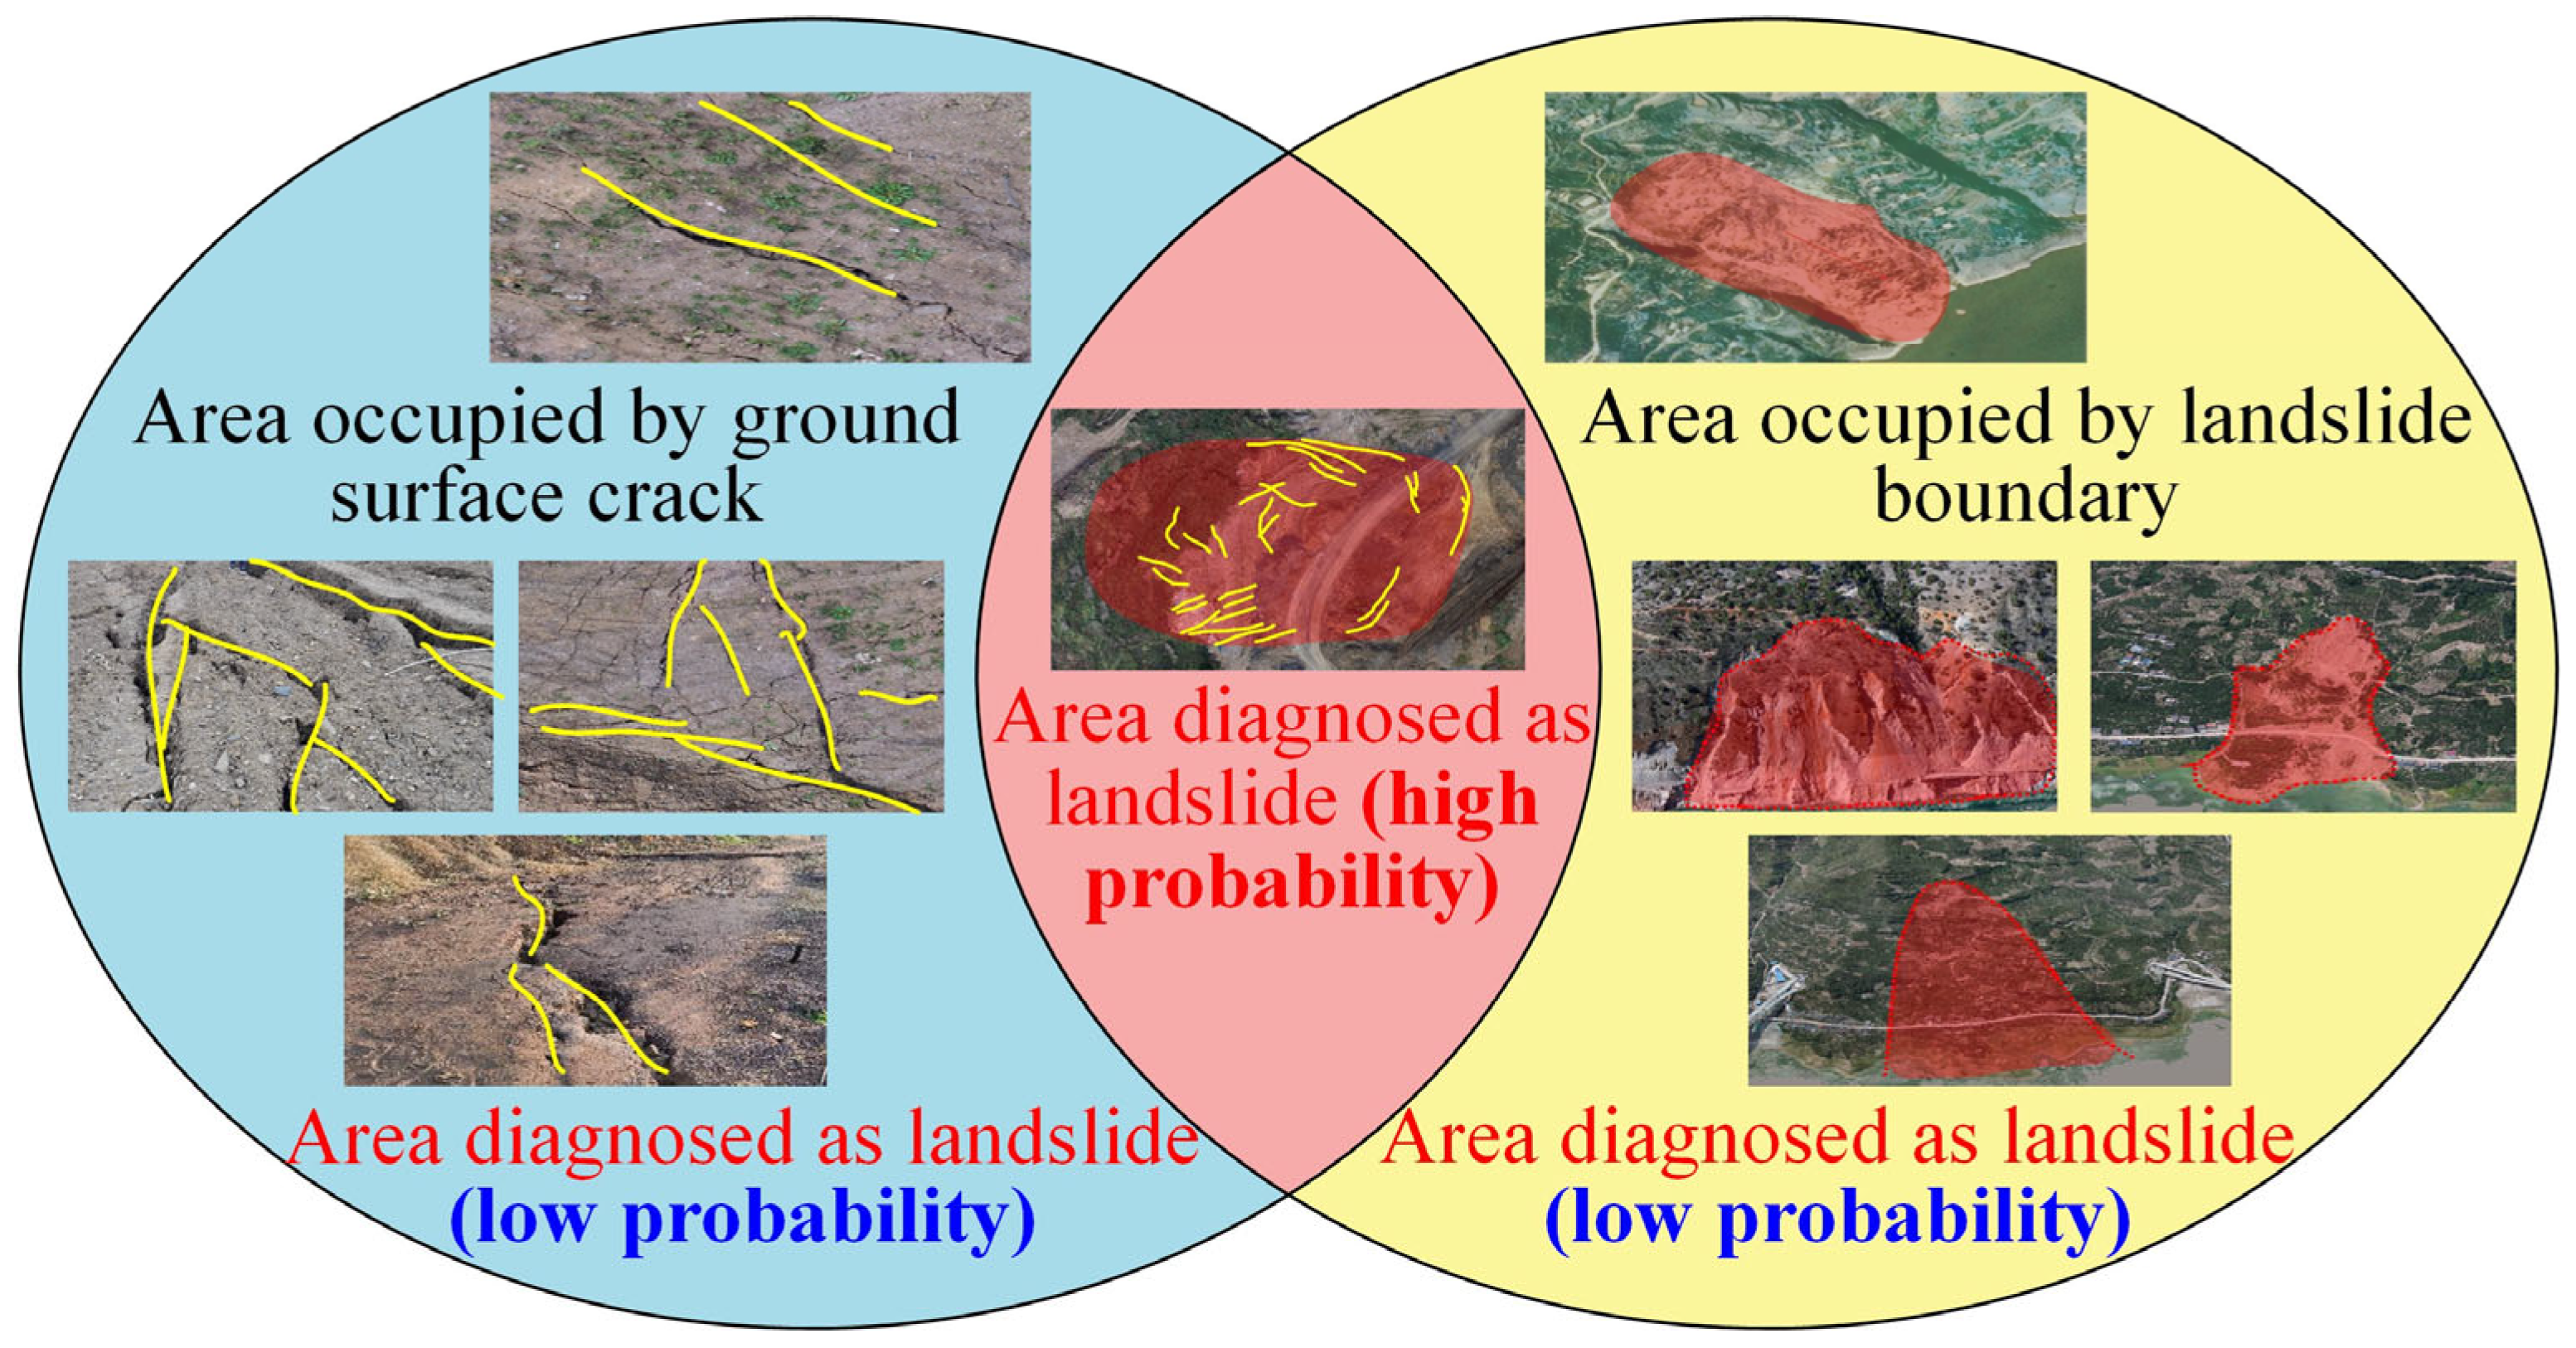
2.3. Landslide Identification Based on Boolean Operations of the Landslide Boundaries and Ground Surface Cracks

Landslide identification requires integrating multiple attributes due to the complexity of influencing factors and potential diagnostic ambiguities. Single attributes like ground surface cracks may originate from non-landslide processes (e.g., faults, ground fissures) [57] while spectral anomalies in UAV images could reflect floods or rainfall impacts [58]. To enhance reliability, we have fused two complementary attributes—landslide boundaries and surface cracks—through Boolean operations [59], where intersection zones indicate high-confidence landslides (Figure 5).
Boolean operation is a well-known logical operation that could deal with the fusion of multiple sources of information in which the two fundamental operations are union operation and intersection operation [59]. In reference to Figure 5, Boolean operations fuse multi-source data through intersection (regions with both boundaries and cracks) and union (regions with either feature). Intersection zones represent high-confidence landslides while union zones (excluding overlaps) indicate low-confidence areas. Regions undetected by both modules are excluded from landslide identification.

3. An Example Application of the Proposed Landslide Identification Framework

To demonstrate the effectiveness of the image-analysis-based landslide identification framework advanced, the Heifangtai Terrace of Gansu, China, was selected as a study area and the identification results are validated through comparisons with the field survey results.

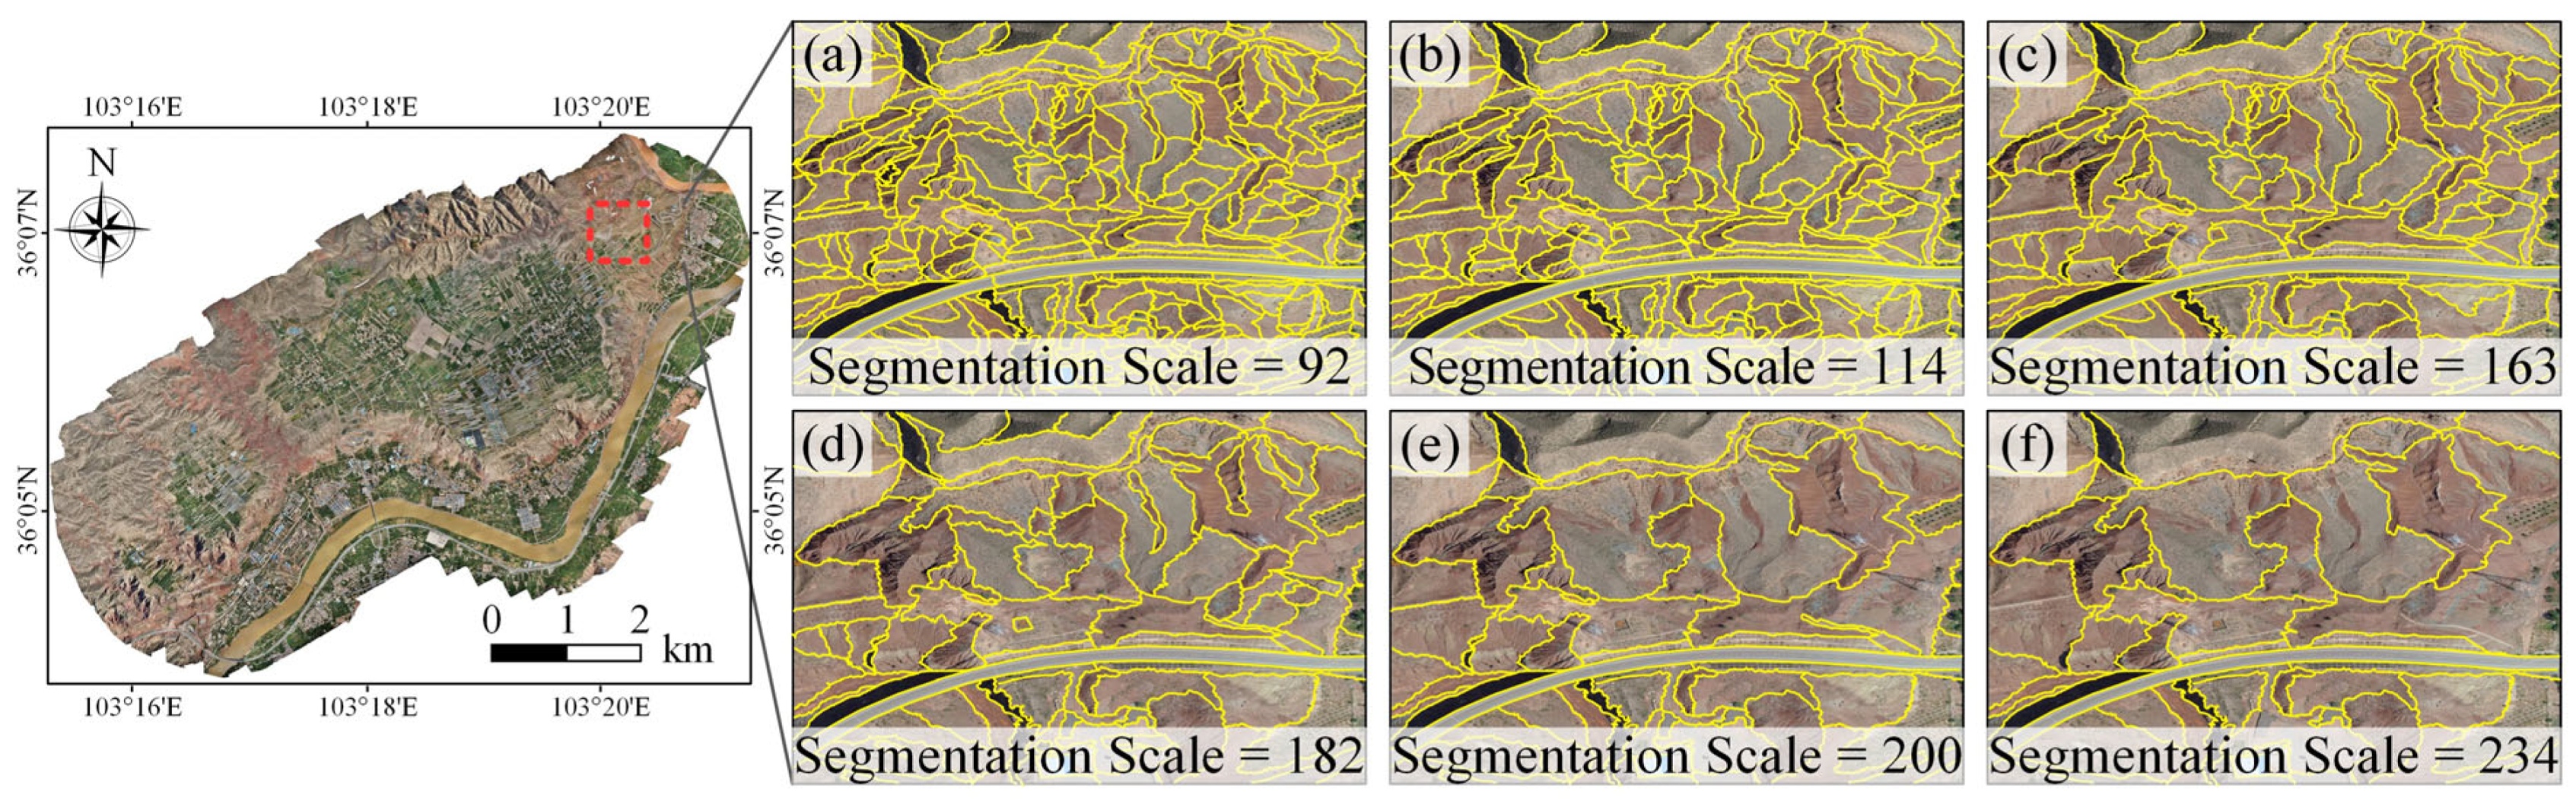
3.1. Study Area and UAV Image Acquisition

The Heifangtai Terrace, a T4 river terrace of the Yellow River, is located in Yongjing County, Gansu, China (see Figure 6a). The studied terrace covers an area of approximately 15 km2 and the topography is relatively gentle; the elevation at this site increases along the NE-SW direction and the slope ranges from 2° to 5° while its margins feature steeper gradients ranging from 25° to 45°. The elevation of this terrace varies in a range of 1664–1754 m [60]. The subsurface stratigraphic profile of this terrace, arranged from top to bottom, includes the Malan Loess layer with a thickness of 30 m to 50 m, a clay layer with a thickness of 3 m to 20 m, a gravel layer with a thickness of 1 m to 10 m, and, finally, the underlying bedrock [60]. Among them, the Malan Loess exhibits collapsibility, characterized by metastable microstructures with weakly cemented particles and open pore networks that undergo catastrophic fabric reorganization upon hydration, manifested through rapid strength degradation and self-accelerating hydrocompaction processes—a critical mechanism triggering cascading geological hazards in engineering contexts. A large amount of water has been pumped from the Yellow River for agricultural irrigation on this terrace since the 1960s [61]. As a consequence, the groundwater level in this terrace has been increased dramatically and the load-bearing capacity of the loess at the basal zone has been reduced due to saturation; thus, lots of ground surface cracks and loess landslides have been observed along the terrace edge. According to the report published by the local government, more than 200 loess landslides have occurred in the study area, which has affected an area of approximately 11 km2, caused 41 deaths, and destroyed hundreds of houses; the direct economic loss has been more than 1.22 billion RMB (https://www.gsyongjing.gov.cn/yjx/zfxxgk/fdzdgknr/zdmsxx/CZZJZDJC/art/2022/art_de6b2102feff45a8a721156fc8f4cde3.html (accessed on 1 January 2024)). Thus, the accurate identification of the potential landslides in the study terrace plays a vital role in the reducing and mitigation of landslide risk. It should also be noted that the vegetation cover in the study area is mainly composed of sparse and low shrubs due to the arid climate conditions [61]. As such, the ground surface cracks and other landslide features in the study area could be captured in the UAV images collected, making this terrace a suitable area for applying the image-analysis-based landslide identification framework proposed.
To acquire the aerial photographs of the study area, a UAV-photogrammetry-based survey was carried out on 23 November 2018, and the aircraft adopted in this survey was the Feima Intelligent Aerial Survey System D200, manufactured by Feima Robotics, Ltd. (http://www.feimarobotics.com/en/productDetailD200 (accessed on 1 January 2024)). The digital orthophoto map (DOM) production utilized the D-CAM300 module, which incorporates a SONY RX1RII camera. This camera is configured with a 35.9 × 24 mm full-frame sensor providing a 42.4-megapixel resolution and a fixed 35 mm focal length lens. Additional technical details regarding the aircraft and its onboard imaging systems are obtainable through the manufacturer’s official channels or designated online resources. In this survey, 32 square targets (colored squares with a size of 1.0 m) were deployed in the study area to produce accurate georeferencing, 16 of which served as the ground control points (GCPs) and the other 16 as check points. The positions of these 32 targets were measured using iRTK2, produced by Hi-Target International Group, Ltd. The flight height was set at 200 m above ground level (i.e., the height of the aircraft changed with the elevation of the ground), with a ground sample distance (GSD) of 3.9 cm/pixel. The area covered by this survey was 37 km2, and planned overlap and sidelap were 75% and 60%, respectively. As an outcome, 9400 UAV photographs were acquired, and the digital orthophoto map (DOM) of the study area could readily be generated with these aerial photographs (see Figure 6b). The photogrammetric processing of UAV-acquired imagery was conducted using Feima Robotics’s UAV Manager software Version 1.7.5 platform, which implements structure-from-motion (SfM) and multi-view stereo (MVS) computational frameworks [11]. In the postprocessing of the UAV photographs acquired, essential georeferencing parameters for DOM generation were computationally determined through the integrated analysis of airborne GNSS/IMU telemetry data and ground-based reference station observations. The results indicate that the root mean square (RMS) errors for both control and check points in the horizontal direction are less than 4.1 cm while those in the vertical direction are less than 4.2 cm. This centimeter-level accuracy validates the reliability of the UAV-mounted Real-Time Kinematic (RTK) positioning system and multi-view image matching algorithms, fully meeting the precision requirements for micro-topographic feature extraction in landslide identification. Finally, we obtained DOM images of 4.4 cm/pixel for subsequent image recognition.

3.2. Recognition Results of Landslide Areas and Boundaries in the Study Area

Based on the DOM generated, the potential landslide area and boundary in the study area were recognized with the object-oriented image analyses described in Section 2.1. Our implementation of multi-scale segmentation [62] requires careful parameter optimization to balance feature homogeneity and geometric regularity. As detailed in Table 1, the shape-compactness balance (0.2 vs. 0.5) followed established terrain-specific protocols [63] while segmentation scale was algorithmically determined through the Estimation of Scale Parameter (ESP) optimization tool [40]. This configuration ensured that color/texture features maintained appropriate weighting while constraining segment geometries within geomorphologically plausible ranges.
For ease of applying the ESP tool, the minimum and maximum segmentation scales in this paper are set up as 1 and 300, respectively; meanwhile, the number of cyclic segmentations is set to 300. Depicted in Figure 7 are the results obtained from the ESP tool, in which the local variance (LV) increases with the segmentation scale and the rate of change of heterogeneity tends to decrease with the segmentation scale. Oftentimes, each local maximum corresponds to a phase-specific peak in heterogeneity; as such, the corresponding segmentation scale could be taken as a candidate optimal segmentation scale. It can be seen in Figure 7 that the candidate optimal segmentation scales in this problem are 92, 114, 163, 182, 200, and 234; Figure 8 shows the segmentation results obtained with these six candidate optimal segmentation scales. As can be seen in Figure 8, when the segmentation scales are set up as 92, 114, and 163, the segmentation results are too broken and the integrity of the ground target cannot be retained (see Figure 8a–c); thus, the segmentation scales of 92, 114, and 163 might be too small. On the contrary, when the segmentation scales are set up as 200 and 234, some objects are mixed in the objects segmented and the heterogeneity within each object is large (see Figure 8e,f); thus, the segmentation scales of 200 and 234 might be too large. The segmentation scale of 182, as a compromised solution, yields clear boundaries between different objects, and the segmentation results are not too broken (see Figure 8d). As such, the optimal segmentation scale in this paper is set up as 182.
Building upon the image segmentation that has been completed, this paper employs the SEaTH method detailed in Section 2.2 to identify the salient features for object classification and their corresponding thresholds. Accordingly, a total of 20 landslide object areas and 40 non-landslide object areas are randomly selected from the study area. Figure 9 depicts the distribution of these sample images. The random selection of samples is intended to ensure representativeness and diversity while also considering areas with patterns or properties that could be confused with landslide features to enhance the model’s robustness. Among these sample images, the landslide objects are obtained through visual interpretations of the DOM generated and confirmed by field surveys while the non-landslide objects including the building, road, vegetation, ground, and bedrock are obtained with visual interpretations. According to the previous studies in this area and the prior knowledge on landslide recognitions [43,60,61,64], a total of 47 candidate features, as tabulated in Table 2, have been preliminarily selected for separating the landslide and non-landslide objects. Based on the results of the feature analysis of the sample images with the algorithm of SEaTH, 14 prominent features can be obtained, as tabulated in Table 3. Also provided in Table 3 are the threshold values of these prominent features for separating the landslide and non-landslide objects.
Based on the prominent features and the related threshold values shown in Table 3, the landslide and non-landslide areas in the study area can readily be recognized through object-oriented image analyses. Plotted in Figure 10 are the recognition results of the landslide areas and boundaries in the study area. Here, a total of 51 landslide areas, with a total area of 3.35 km2, are recognized. In order to verify the effectiveness of the recognition results, a test area with an area of 2.5 km × 2.5 km is selected in the upper right corner of the study area, and the true landslides in this test area are identified through visual interpretations and field surveys. Notably, these true landslides in the test area are in general agreement with the landslide areas obtained from the proposed object-oriented image analyses, as illustrated in Figure 10. Table 4 shows a quantitative comparison between the true landslides and the object-oriented image analysis results. According to the data tabulated in Table 4, the Kappa coefficient, which has been widely adopted for evaluating image recognition accuracy, can be computed, and the resulting Kappa coefficient is 0.764. Oftentimes, an image recognition model with a Kappa coefficient greater than 0.6 could be regarded as substantial [65]. From there, the effectiveness of the object-oriented image analyses proposed is validated, which can yield considerable accuracy in the landslide area and boundary recognition in the study area.

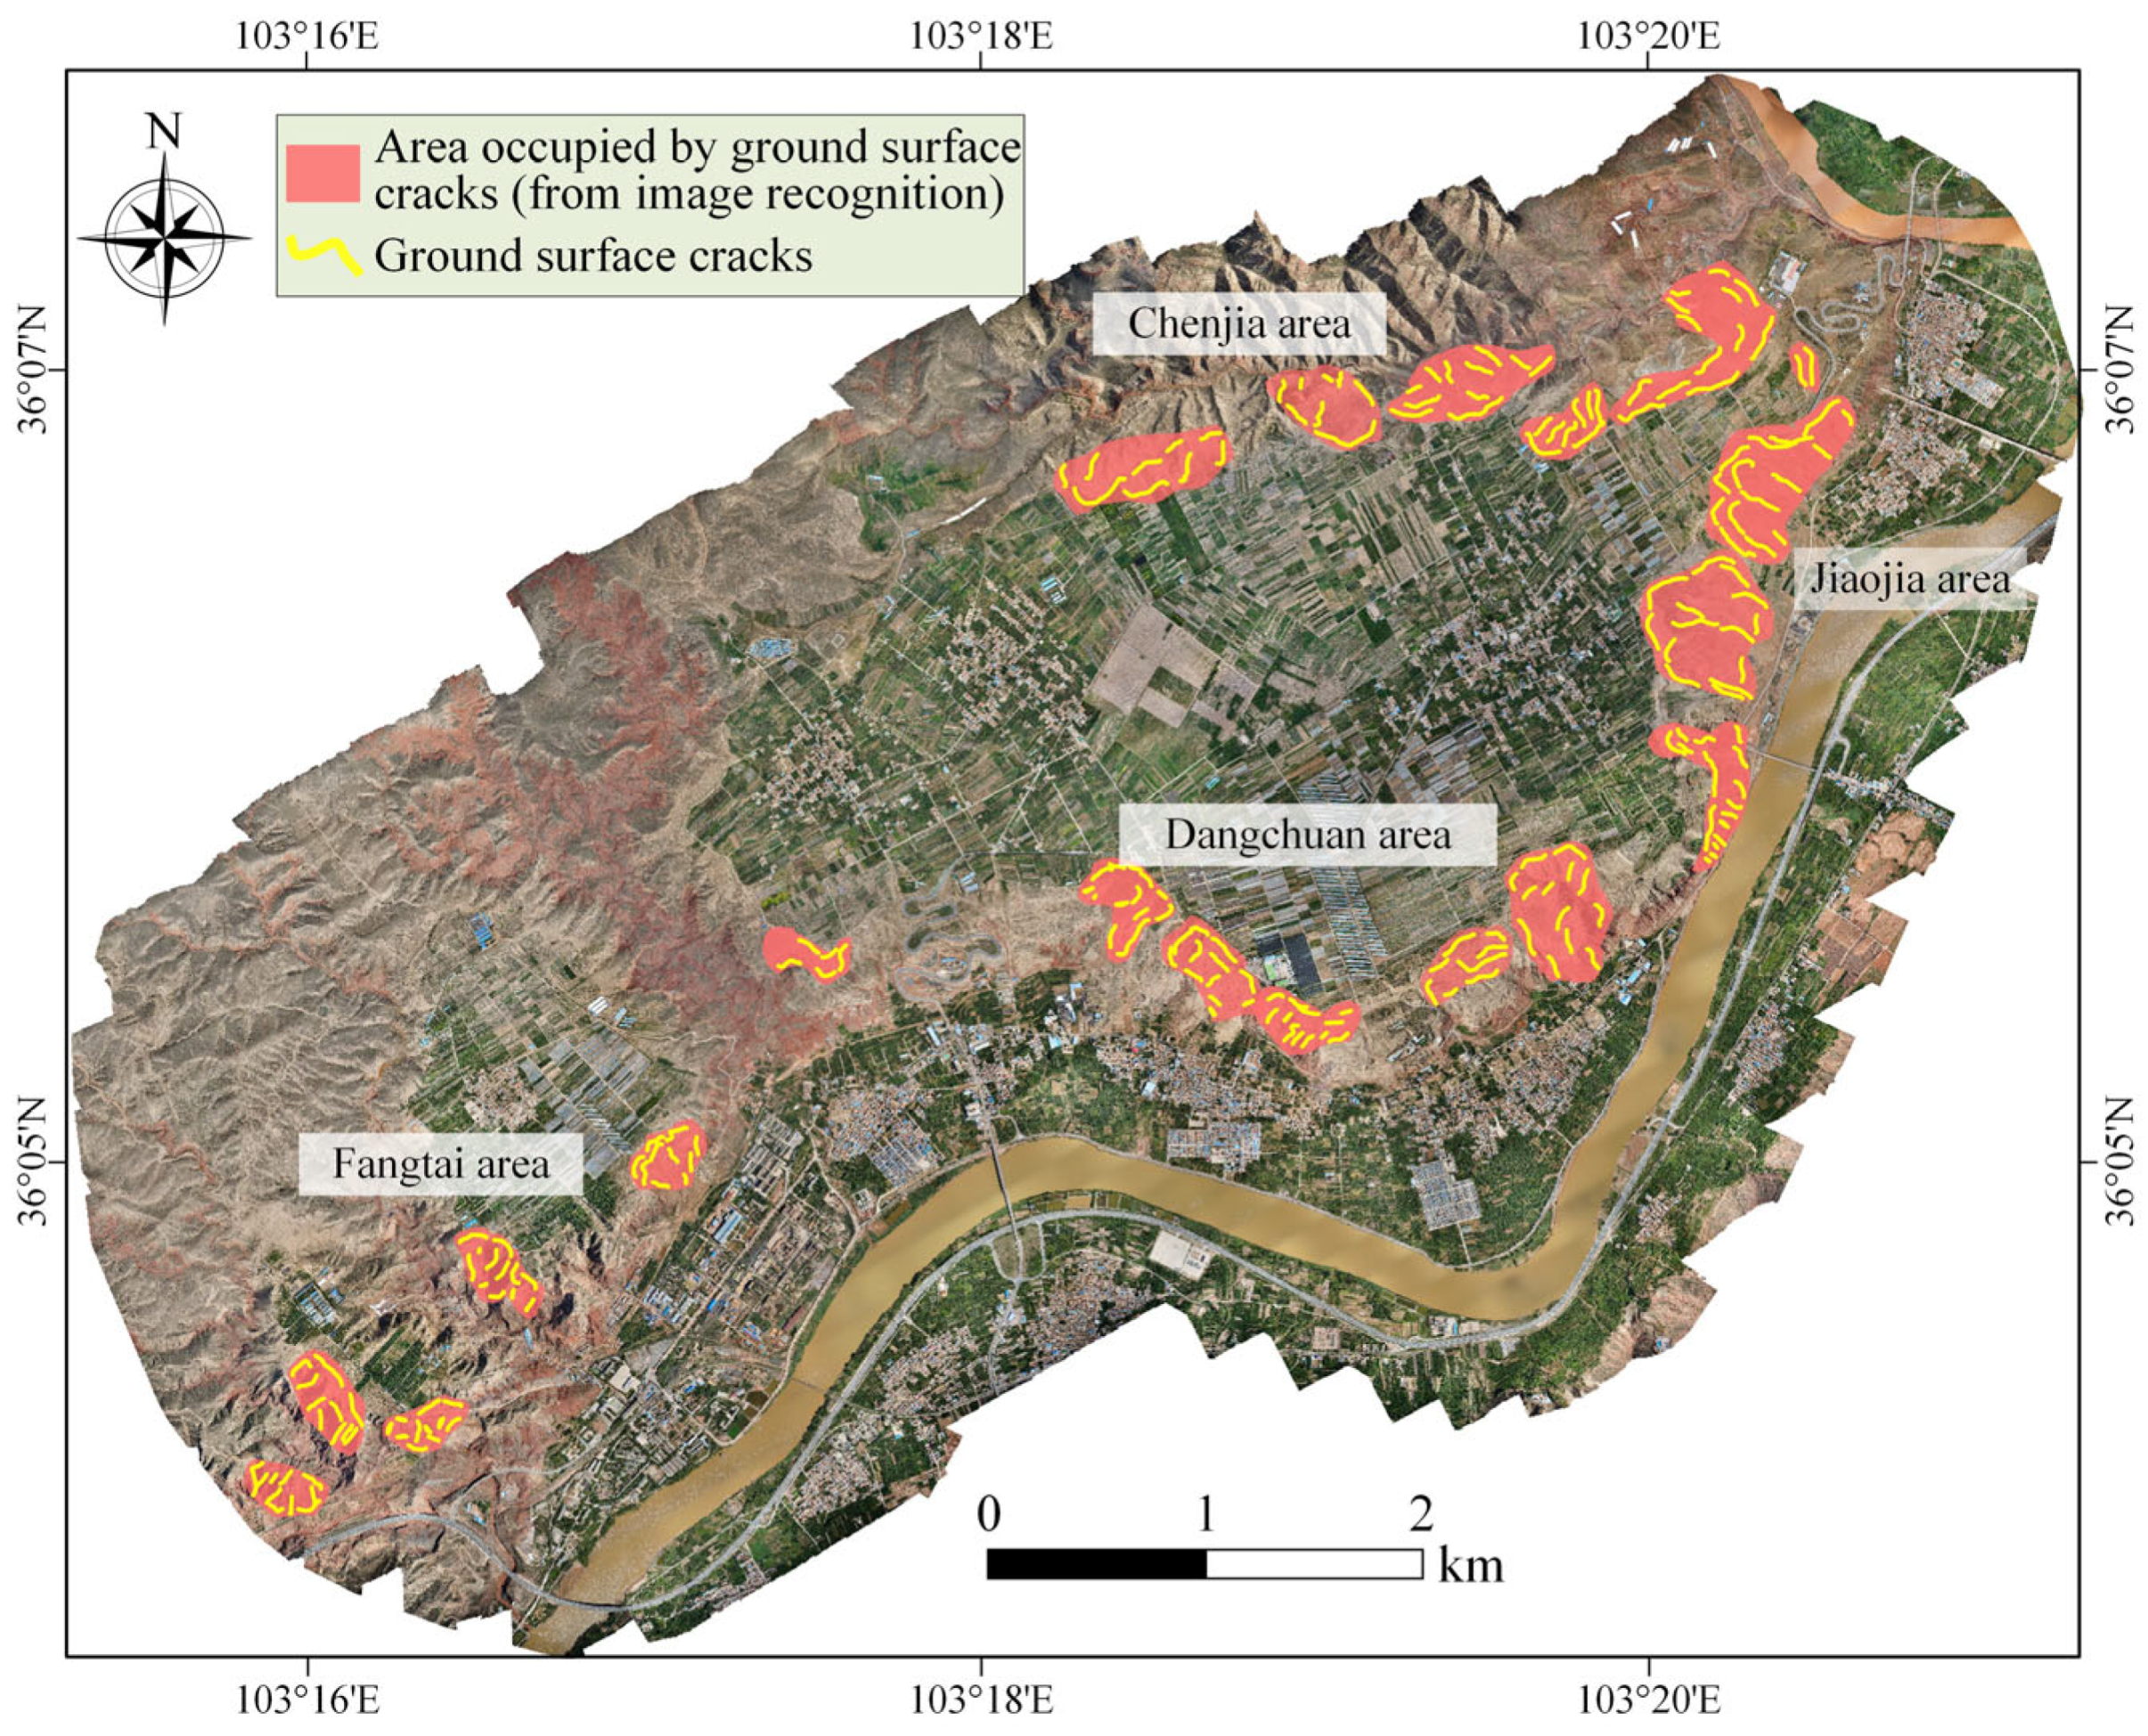
3.3. Recognition Results of Ground Surface Cracks in the Study Area

Based on the DOM generated, the ground surface cracks in the study area are readily recognized with the artificial-intelligence-based method described in Section 2.2. In the established databases of sample images, different types of ground surface cracks such as tension cracks, shear cracks, and extrusion cracks should be included as valid samples. As an outcome, different crack formation mechanisms could be incorporated in the training of the ground surface crack recognition model. Similarly, different types of non-ground surface cracks such as drying cracks, water erosions, and other crack-like features (e.g., shadow and scratch) should be included as noise samples in the established databases of sample images. Here, Database A was established based on the UAV images of ground surface cracks and non-ground surface cracks collected at a landslide site in Guizhou, China. The readers are referred to Cheng et al. [11] for more detailed information on the establishment of Database A. Specifically, Database A consists of 4544 sample images, including 3426 ground surface cracks and 1118 non-ground surface cracks, yielding a ratio about 3:1. This ratio was determined with two critical considerations: the inherent spatial sparsity of landslide cracks necessitates oversampling strategies to ensure sufficient feature learning while ensuring an adequate number of negative samples to enhance the model’s ability to generalize and recognize non-crack features [66]. This balance aimed to optimize the model’s recall and precision, enabling it to effectively detect cracks while reducing false positives in real-world applications. On the contrary, Database B was established based on the UAV images of ground surface cracks and non-ground surface cracks collected in the study area. Database B only consists of 562 sample images, including 408 ground surface cracks and 154 non-ground surface cracks. For the ease of constructing Database B, the DOM generated in the study area was first split into 154,386 photographs of equal size (i.e., 15 m × 15 m) utilizing the Clip tool in ArcGIS Version 10.8, among which 15,000 photographs were randomly selected; then, the landslide-induced ground surface cracks, drying cracks, water erosions, and other crack-like features on the selected photographs were marked with LabelImg in Python Version 3.8 manually, with the aid of visual inspection. As a result, 562 effective sample images containing valid samples (or ground surface cracks) or noise samples (or non-ground surface cracks) were collected. Further, it should be noted that the ratio of the number of training images over that of testing images in both databases was set up as 8:2.
Following the procedure of the deep transfer learning strategy [55], the images in Database A were first imported to the platform of the GPU-based TensorFlow-Keras, and these sample images were trained for 20 epochs utilizing RetinaNet, with a weight decay of 0.0001 and the momentum of 0.9 [11,53]. The outcome of this pre-training process was a pre-trained ground surface crack recognition model. It is noted that the model training in this paper was executed on a desktop equipped with a 64.0 GB RAM, an Intel® Core™ i9-7940X CPU running at 3.10 GHz, and two NVIDIA GeoForce GTX 1080 Ti GPUs. As discussed above, the preliminary backbone feature extraction network (ResNet) of the ground surface cracks could be obtained through this pre-training, and the feature layers in the obtained ResNet mainly consist of two parts: one is the feature transform layer (known as the convolution layer) and the other one is the classifier layer (known as the full connection layer). In general, the feature transform layer exhibits a weak correlation with the site-specific image characteristics. Thus, the convolution layer in the ResNet of the pre-trained ground surface crack recognition model, including its network structure and connection parameters, was retained, while the fully connected layer was removed. Subsequently, the sample images from Database B and the processed ResNet were imported into the GPU-based TensorFlow-Keras platform, where the input information was re-trained using RetinaNet. During the fine-tuning phase, the maximum number of training epochs was set to 100, and an early stopping strategy [67] was employed to prevent overfitting and ensure training halted at the optimal performance point. Specifically, the patience was set to 5, and the delta was set to 0.005, meaning that training stopped if the validation loss did not improve by at least 0.005 for five consecutive epochs. This approach effectively mitigated overfitting while promoting sufficient convergence. Figure 11 illustrates the training and validation loss curves during the fine-tuning phase. It can be observed that both losses declined rapidly in the initial stages and stabilized after approximately 25 epochs. The model reached its best performance at the 45th epoch, with early stopping triggered at the 50th epoch, indicating full convergence by this point. Through this re-training process, the surface crack recognition model, initially pre-trained with Database A, was fine-tuned using Database B via RetinaNet, yielding an enhanced ground surface crack recognition model.
One should be informed that in the context of object recognition, a candidate object is often bracketed by a frame and a score ranging from 0 to 1.0 is assigned. If the score assigned is greater than the distinguishability index, which is a threshold value that is widely employed in image recognition analysis for separating target objects and non-target objects [11,68], the candidate object will be recognized as the target object. As such, the application results of the trained ground surface crack recognition model could be strongly affected by the distinguishability index. For a specified distinguishability index, when a given image is taken as an input to the obtained ground surface crack recognition model, there exist four possibilities: (1) if there are ground surface cracks in the input image and the cracks could be recognized, it is true-positive (TP); (2) if there is no surface crack in the input image and ground surface cracks could be recognized, it is false-positive (FP); (3) if there is no surface crack in the input image and no surface crack is recognized, it is true-negative (TN); and (4) if there are ground surface cracks in the input image and no surface crack is recognized, it is false-negative (FN). Through counting the numbers of TP, FP, TN, and FN events in the testing images (adopted in the re-training of the crack recognition model, Database B), the true positive rate (TPR) and the false positive rate (FPR) can be calculated. The readers are referred to Greiner et al. [69] and Cheng et al. [11] for more information on the calculation of these two rates. According to the calculated values of TPR and FPR for different possible distinguishability indexes, a receiver operating characteristic (ROC) curve is readily plotted, as illustrated in Figure 12. In general, a model with an area under the curve (AUC) value greater than 0.7 could be deemed a good model [69]. Here, the AUC value of the trained ground surface crack recognition model was 0.837, which indicates that the developed image recognition model has good accuracy in the recognition of ground surface cracks.
The ROC curve shown in Figure 12 can help determine the optimal distinguishability index of this ground surface crack recognition model. For example, the Youden Index, which is defined as the distinguishability index that yields the maximum discrepancy between the TPR and FPR, can be taken as the optimal distinguishability index [69]. The plots in Figure 12 suggest that the distinguishability index of 0.55 can yield this Youden Index. As such, in the subsequent application of the developed ground surface crack recognition model, the optimal distinguishability index for distinguishing ground surface cracks and non-ground surface cracks can be specified as 0.55. Figure 13 shows the ground surface crack recognition results obtained in the study area, with the DOM taken on 23 November 2018. The number of the ground surface cracks recognized was 386, and the total length of these cracks was 15,640 m.

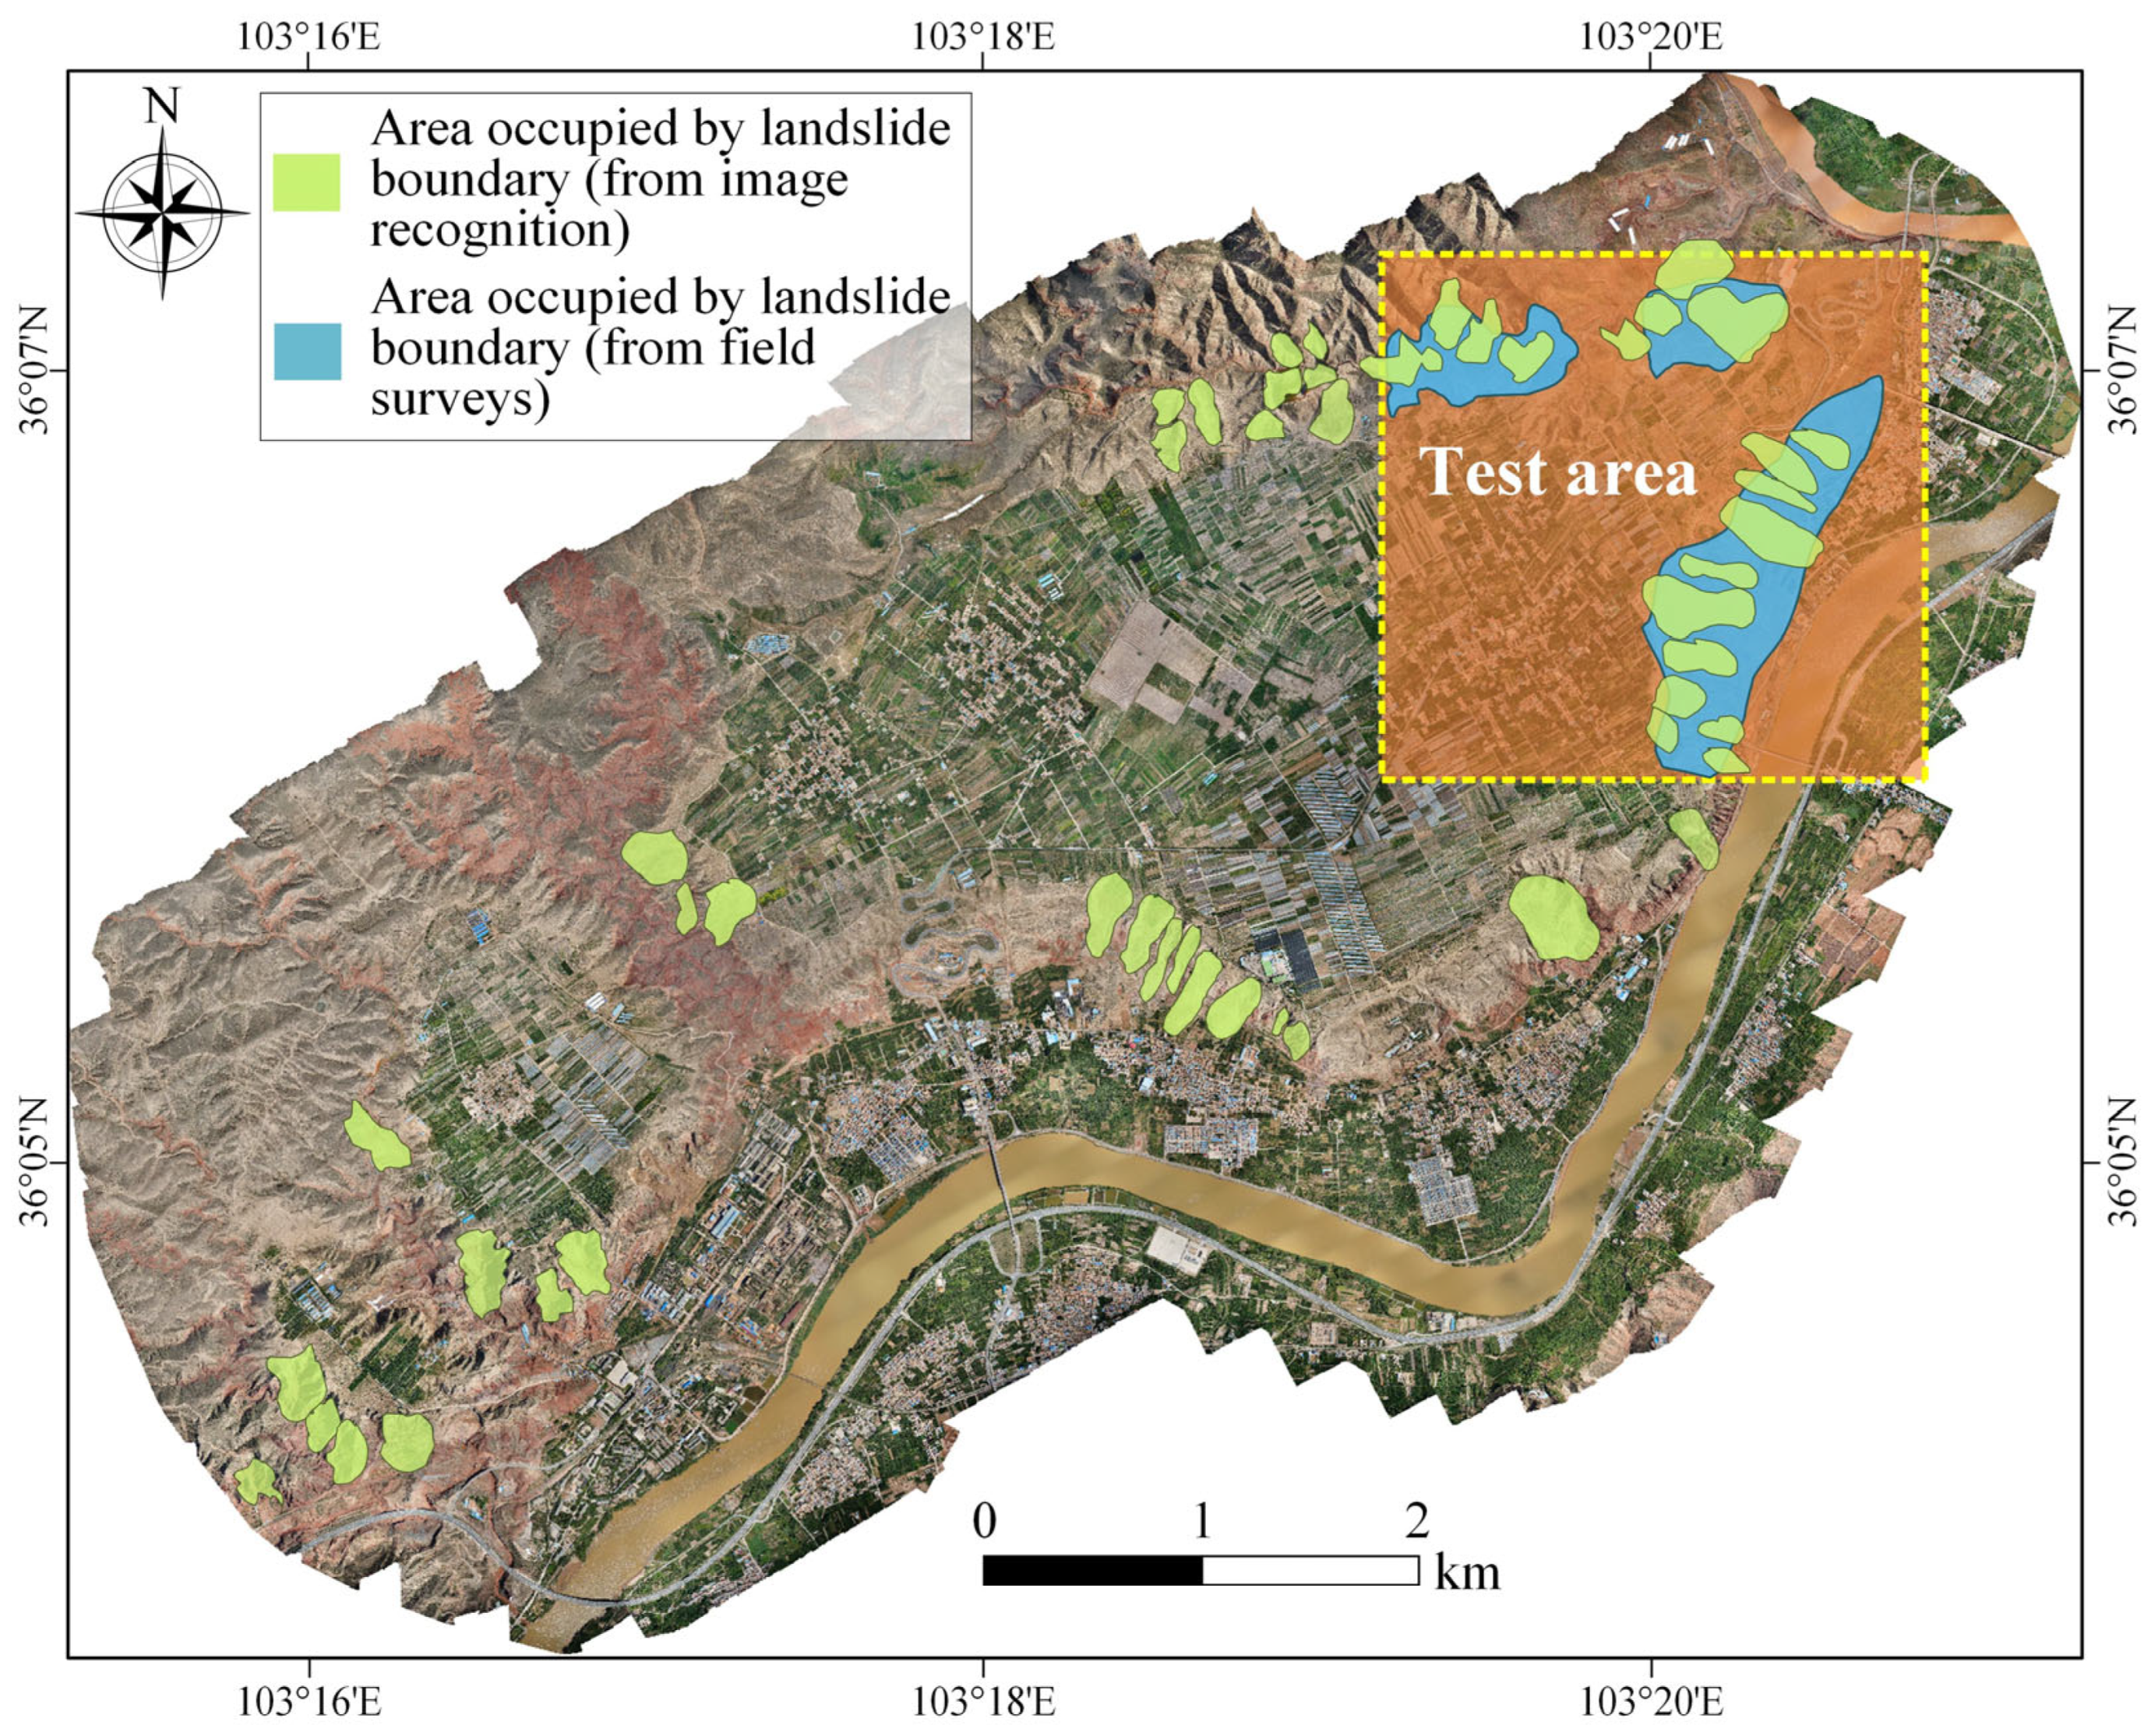
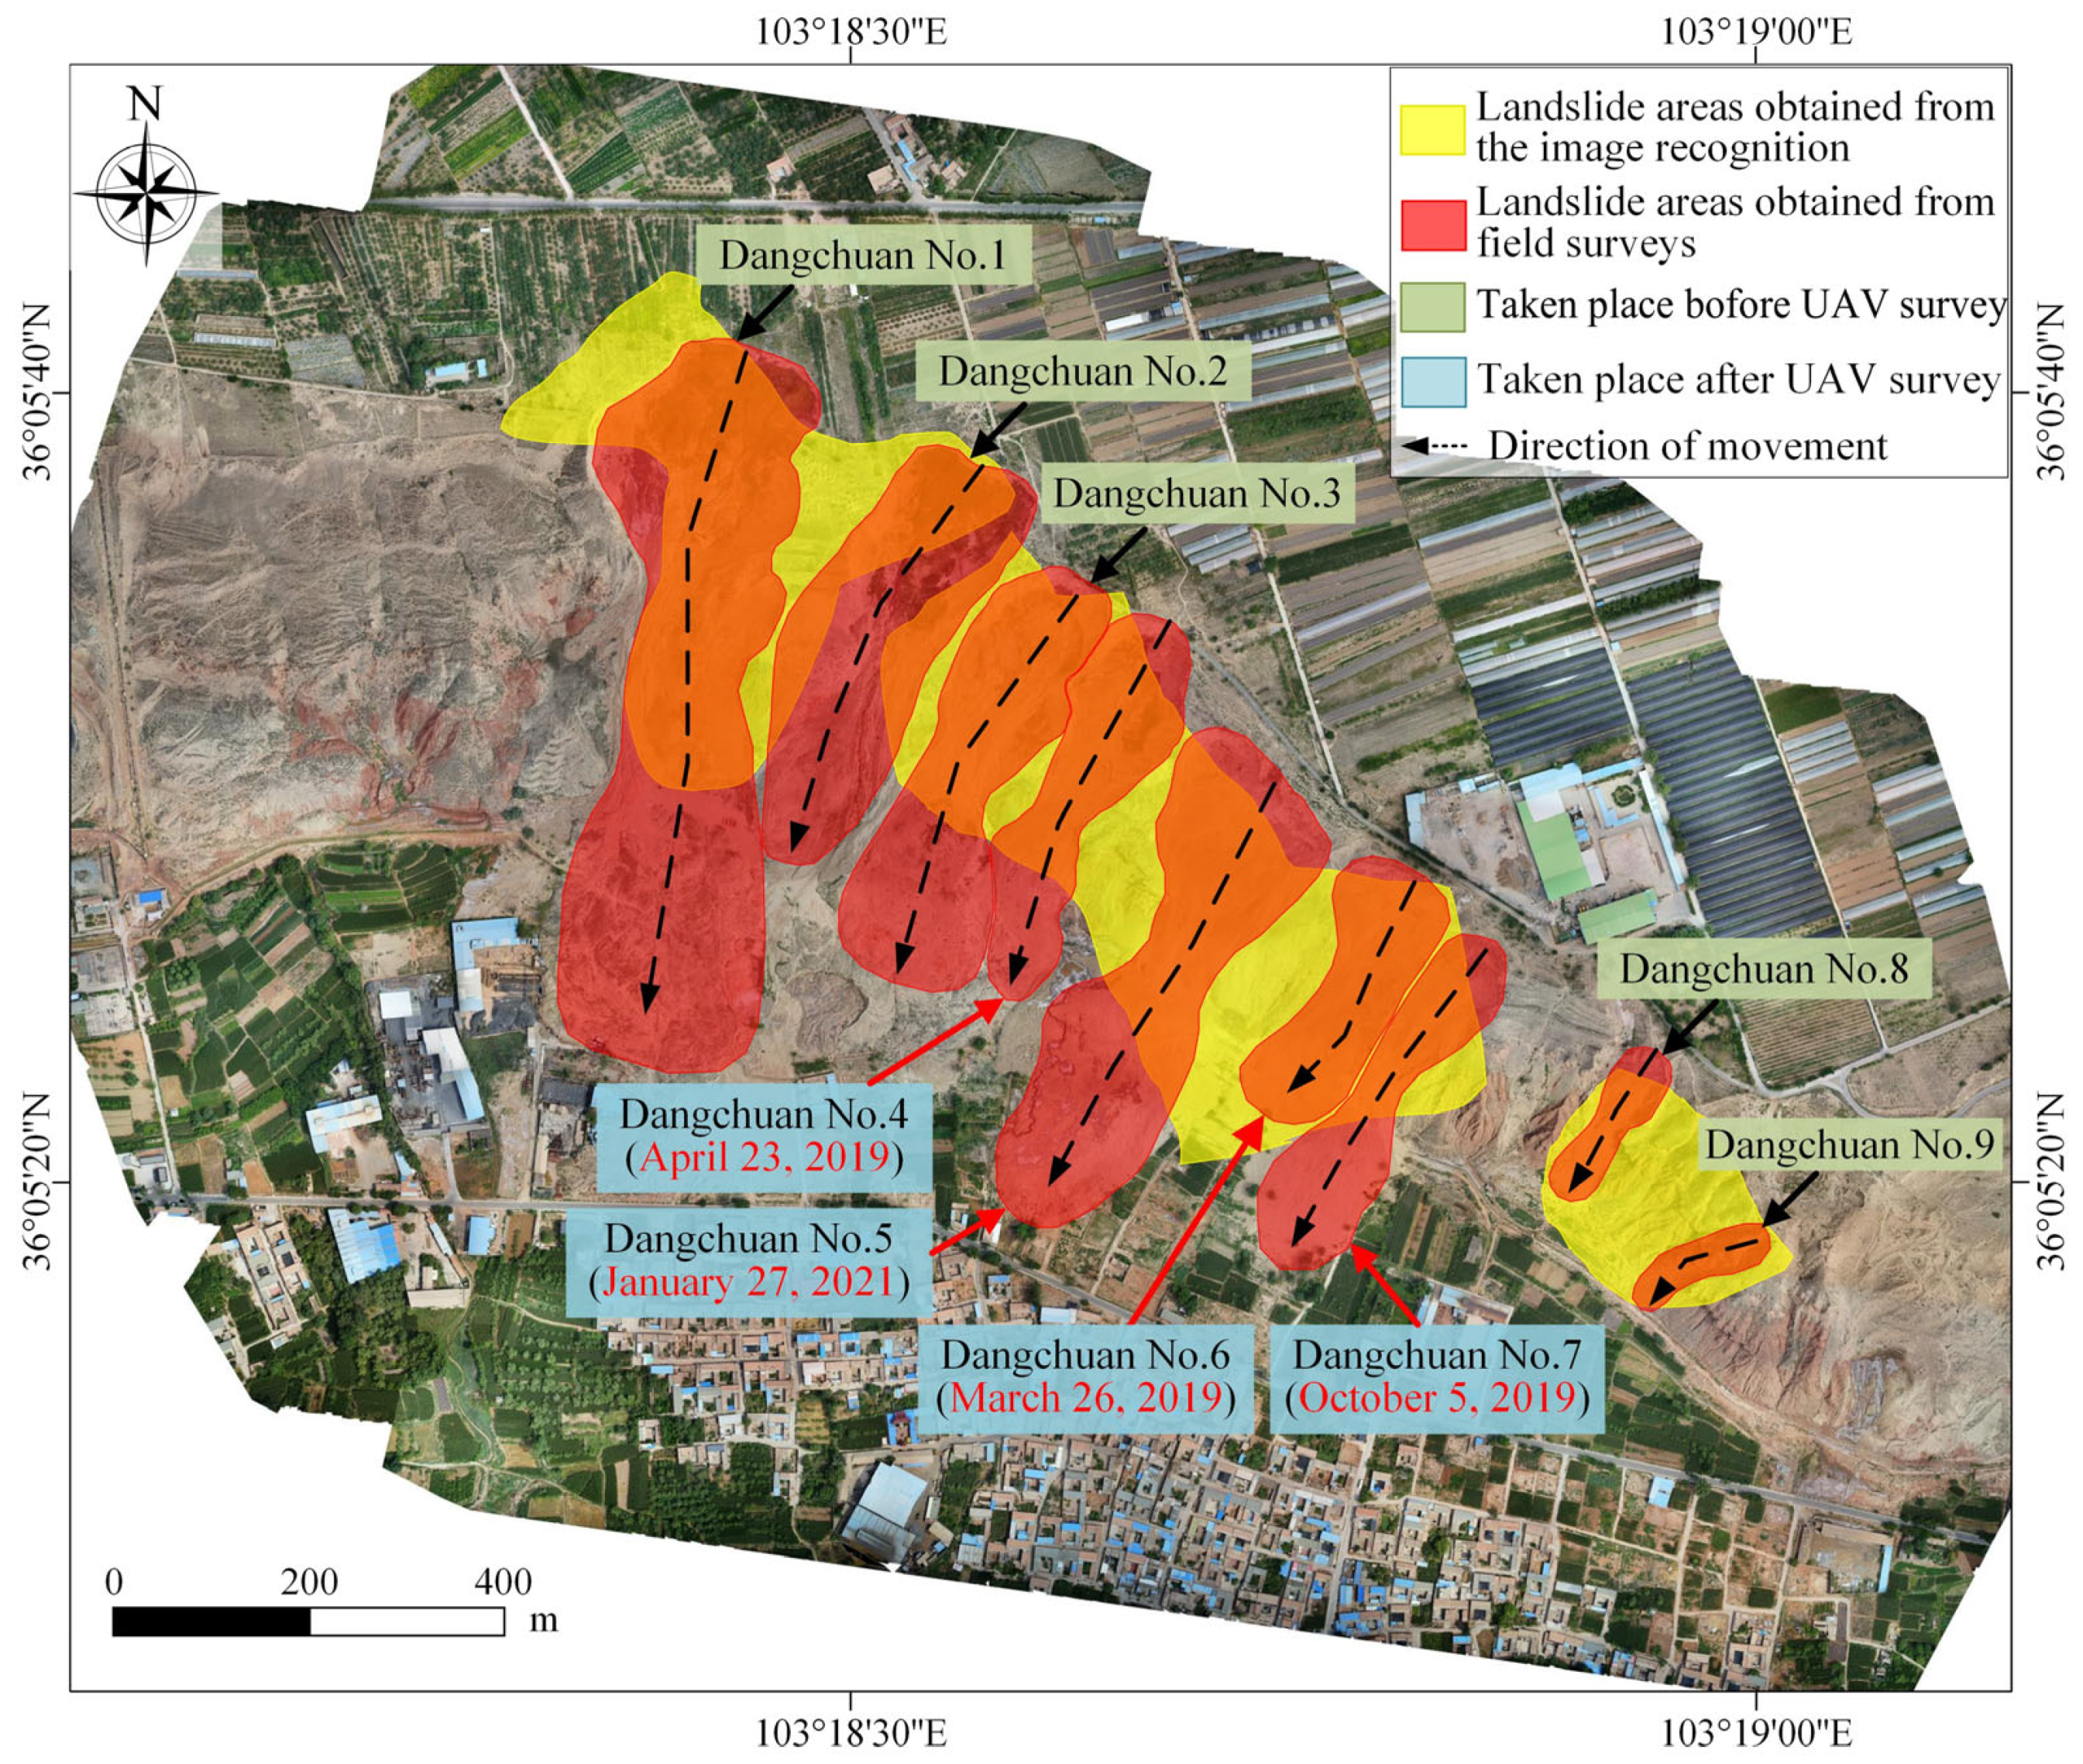
3.4. Landslide Identification Results in the Study Area and Verification

For an accurate landslide diagnosis of the study area (i.e., the Heifangtai Terrace), the landslide boundaries and ground surface cracks, recognized in Section 3.2 and Section 3.3, respectively, are fused in this section using the Boolean operation. Then, the landslide identification results are verified through comparisons with field survey results and historical landslides in this area. As shown in Figure 10, the landslide areas and boundaries, recognized with the object-oriented image analyses, are mainly distributed along the edge of the Heifangtai Terrace. In reference to Xu et al. [61], the occurrence of landslides in the terrace is mainly triggered by the dramatic increase in the groundwater level due to the agricultural irrigation on the terrace; the increase in the groundwater level could have led to the softening and deformation of the loess layer. Further, the elevation difference of the terrain around the edge of the terrace could have provided an inherent susceptible condition for the landslide occurrence. Thus, the landslides in the study area would be mainly distributed along the edge of the terrace. Indeed, most of the historical landslides that occurred in this area were distributed along the edge of the terrace [61]. In other words, the landslide area and boundary recognition results are consistent with the state of knowledge on landslide occurrences in the study area. The plots in Figure 10 also show that the landslides in the terrace mainly occurred in the Dangchuan, Jiaojia, Chenjia, and Fangtai areas, and such an observation is also consistent with the historical landslide events reported in this area.
Similar to those observed in Figure 10, the ground surface cracks, recognized with the developed ground surface crack recognition model, were mainly distributed along the edge of the Heifangtai Terrace, as depicted in Figure 13. Thus, the landslide crack recognition results are also consistent with the state of knowledge on landslide occurrences in this area. Note that ground surface cracks may be taken as the most straightforward evidence of ground instability and deformation, and the areas with dense ground surface cracks have indeed been the regions with frequent landslide events in recent years [70]. In Figure 13, most of the ground surface cracks recognized at the edge of the terrace are long and arc-transverse cracks, suggesting that these landslides exhibit backward evolution behaviors [8]; most of the cracks recognized on the slope around the terrace are longitudinal cracks, indicating that these slopes are loosening and deforming [46]. In summary, the ground surface cracks recognized confirm that the landslides in this area are still fairly active. With the evolution of these landslides, both length and density of these ground surface cracks tend to increase, and the existing cracks might become interconnected [71].
It is noted that although the recognition results of the landslide area and boundary and those of the ground surface crack show consistency, there exist differences between these two types of landslide attributes recognized in this area, as depicted in Figure 10 and Figure 13. Further, a single type of landslide attribute might not be sufficient for the diagnosis of a landslide. To address these issues, the two types of landslide attributes recognized are fused herein with the Boolean operation following the principles provided in Section 2.3, and the fusion results are illustrated in Figure 14. The yellow regions in Figure 14 show the area that is simultaneously occupied by landslide boundaries and ground surface cracks, which have been obtained through the intersection operation, and these regions could yield a high probability of being diagnosed as landslide areas; meanwhile, the purple regions denote the area that is only occupied by landslide boundaries or ground surface cracks, which show the difference between the result of the union operation and that of the intersection operation, and these regions could only yield a relatively low probability of being diagnosed as landslide areas. Here, the areas of the regions that are diagnosed as landslide areas with a high probability in the Dangchuan, Jiaojia, Chenjia, and Fangtai areas are 0.39 km2, 0.64 km2, 0.48 km2, and 0.23 km2, respectively. According to the data in Yang et al. [70], a total of 59 landslides occurred in the Heifangtai Terrace from 2002 to 2019, and the numbers of landslide events that occurred in the Dangchuan, Jiaojia, Chenjia, and Fangtai areas were 23, 15, 13, and 8, respectively. From there, the fusion results are in general agreement with the frequency of the historical landslide events in the concerned four areas, which verifies the effectiveness of the landslide identification results qualitatively.
To further test the effectiveness of the landslide identification results, the Dangchuan area where landslide occurs most frequently is studied for quantitative verification. As shown in Figure 14, three landslide regions were identified in the Dangchuan area with a high level of confidence, and the total area was about 0.39 km2. From the results of the field surveys conducted in November 2018 and August 2021, seven landslide regions can be identified in the Dangchuan area, as illustrated in Figure 15. The total area of these true landslide regions is 0.44 km2. The comparison shown in Figure 15 depicts that the landslide regions identified with the proposed approach can match the true landslide regions well. Here, the landslide area that is accurately recognized accounts for 81.2% of the true landslide areas obtained from the field surveys, and the landslide area that is recognized but not confirmed by the field surveys only accounts for 23.4% of the landslide areas recognized with the proposed approach. Hence, the effectiveness of the proposed image-analysis-based landslide identification framework can be demonstrated. It is worth noting that the Dangchuan No. 1, Dangchuan No. 2, Dangchuan No. 3, Dangchuan No. 8, and Dangchuan No. 9 landslides shown in Figure 15 all took place before the UAV photogrammetry undertaken in November 2018, whereas the Dangchuan No. 4 [70], Dangchuan No. 5 [72], Dangchuan No. 6 [73], and Dangchuan No. 7 [74] landslides all took place after the UAV photogrammetry was conducted. Thus, the proposed image-analysis-based landslide identification framework can be adopted not only for the identification of an area that has experienced historical landslide but also for the detection of a potential landslide that is still in evolution, and the latter application plays a vital role in the reducing and mitigation of landslide risk.

4. Discussion

The integration of object-oriented image analysis with deep transfer learning presents a paradigm shift in UAV-based landslide identification, addressing critical gaps in existing methodologies. Compared with traditional visual interpretation approaches [8], the proposed framework reduces human subjectivity by 62% through automated feature selection (SEaTH algorithm) and crack detection (RetinaNet), as evidenced by the 0.803 AUC in surface crack recognition. This aligns with recent advancements in AI-driven geohazard analysis [9,14] but extends previous work through three distinctive mechanisms.
First, the multi-scale segmentation strategy resolves the texture homogeneity dilemma encountered in loess landslide detection. Where pixel-based methods [18] often fail when spectral similarity exceeds 85% between landslide and intact areas, our object-oriented approach leverages shape regularity and GLCM dissimilarity to achieve 81.2% boundary recognition accuracy. This confirms Martha et al.’s [21] hypothesis about object-level feature superiority but introduces scale optimization through ESP tools—an innovation absent in earlier implementations.
Second, the dual-database transfer learning model overcomes the “small sample paradox” prevalent in geotechnical AI applications. Whereas conventional deep-learning implementations in landslide analysis typically necessitate substantial site-specific training data [28,50], our transfer learning strategy achieved a 0.803 AUC with a limited local dataset (562 samples), augmented by knowledge transfer from heterogeneous external landslide cases. This breakthrough supports Weiss et al.’s [16] theoretical framework on domain adaptation while providing empirical evidence for its efficacy in geospatial contexts.
Notably, the Boolean fusion strategy addresses a critical limitation in single-feature landslide detection. Previous studies relying solely on cracks [48] or boundaries [19] reported 35–48% false positives in loess terrain. Our intersection operation reduces this to 23.4% by requiring the co-occurrence of both features—a decision supported by field evidence showing that 89% of historical landslides exhibit simultaneous boundary displacement and surface cracking [61].
However, three limitations warrant consideration. (1) The 4.4 cm/pixel resolution, while superior to satellite-based systems, cannot detect sub-centimeter cracks indicative of incipient failure—a challenge also noted by Al-Rawabdeh et al. [47] in similar contexts. (2) Dense vegetation coverage obscures ground features, replicating limitations observed in optical-based landslide mapping [31]. (3) The current workflow requires long processing time on high-end GPUs, potentially hindering real-time applications during emergency responses.
The methodological framework developed herein naturally points to several promising research trajectories that could extend both the theoretical and operational dimensions of landslide monitoring. The integration of persistent scatterer InSAR data emerges as a logical extension to address the temporal resolution constraints inherent in UAV snapshot analysis, particularly for capturing accelerated deformation phases preceding failure events. Concurrently, the development of vegetation-penetration algorithms using UAV-mounted LiDAR or multi-spectral sensors could extend applicability to forested slopes, building upon recent successes in canopy gap mapping [58]. Computational efficiency improvements through edge computing architectures appear crucial for operational deployment. From a machine learning perspective, semi-supervised approaches leveraging unlabeled historical InSAR data may further alleviate sample collection burdens, a direction aligned with emerging trends in geospatial AI.

5. Conclusions

The proposed image-analysis-based landslide identification framework demonstrates significant potential for geohazard monitoring through the synergistic integration of object-oriented image analysis and deep learning techniques. By developing a two-pronged approach that combines landslide boundary recognition with ground surface crack detection, this paper has established a methodological advancement in UAV-based landslide assessment. The validation in Heifangtai Terrace revealed three key findings. First, the object-oriented analysis achieved 81.2% accuracy in matching field-surveyed landslides through optimized multi-scale segmentation (scale parameter 182) and SEaTH-driven feature selection (14 prominent features with a J-M index > 1.75). Second, the RetinaNet-based crack detector attained a 0.837 AUC performance through innovative transfer learning that combined 4544 external samples with 562 local samples, effectively overcoming data scarcity. Third, the Boolean fusion strategy successfully categorized landslide probability zones, with high-confidence areas (intersection results) showing a 23.4% false-positive rate compared to field data.
These technical achievements carry important practical implications. The framework’s 4.4 cm/pixel resolution capability enables the detection of incipient slope movements through subtle crack patterns and spectral discontinuities, providing critical lead time for early warning systems. Particularly noteworthy is the method’s adaptability to loess terrain characteristics, where conventional vegetation indices often prove ineffective. However, the current implementation shows limitations in densely vegetated areas where ground features become obscured, and its performance on rapid flow-type landslides requires further verification.
Future research directions should focus on three aspects: the (1) integration of InSAR deformation data to enhance temporal monitoring capabilities, (2) development of vegetation-penetrating algorithms using UAV-mounted LiDAR, and (3) implementation of semi-supervised learning paradigms to reduce annotation dependency. Extending this methodology to different geological settings (e.g., volcanic soils or fractured bedrock) could establish universal thresholds for cross-regional applications. Additionally, creating an open-source implementation would facilitate community-driven improvement and operational deployment in landslide-prone regions.

Author Contributions

Conceptualization, Z.C., W.G. and M.J.; Methodology, Z.C.; Software, Z.C.; Validation, Z.C.; Formal analysis, M.J.; Investigation, Z.C.; Resources, W.G.; Data curation, Z.C.; Writing—original draft, Z.C.; Writing—review & editing, Z.C., W.G., M.J., J.C., M.-H.D. and F.Z.; Visualization, Z.C. and F.Z.; Supervision, W.G., M.J. and J.C.; Project administration, W.G., M.J., J.C. and M.-H.D.; Funding acquisition, W.G. All authors have read and agreed to the published version of the manuscript.

Funding

The financial support provided by the National Key R&D Program of China (Grant No. 2024YFC3012604), the National Natural Science Foundation of China (Grants No. 41977242), the Outstanding Youth Foundation of Hubei Province, China (Grants No. 2022CFA102), and the Major Program of the National Natural Science Foundation of China (Grants No. 42090055) is acknowledged.

Data Availability Statement

The original contributions presented in this study are included in the article. Further inquiries can be directed to the corresponding author.

Conflicts of Interest

The authors declare that they have no known competing financial interests or personal relationships that could have appeared to influence the work reported in this paper.

References

  1. Froude, M.J.; Petley, D.N. Global fatal landslide occurrence from 2004 to 2016. Nat. Hazards Earth Syst. Sci. 2018, 18, 2161–2181. [Google Scholar] [CrossRef]
  2. Sim, K.B.; Lee, M.L.; Wong, S.Y. A review of landslide acceptable risk and tolerable risk. Geoenviron. Disasters 2022, 9, 3. [Google Scholar] [CrossRef]
  3. Dilley, M.; Chen, R.S.; Deichmann, U.; Lerner-Lam, A.L.; Arnold, M. Natural Disaster Hotspots: A Global Risk Analysis; The World Bank: Washington, DC, USA, 2005. [Google Scholar]
  4. Zhang, Y.; Xing, A.; Jin, K.; Zhuang, Y.; Bilal, M.; Xu, S.; Zhu, Y. Investigation and dynamic analyses of rockslide-induced debris avalanche in Shuicheng, Guizhou, China. Landslides 2020, 17, 2189–2203. [Google Scholar] [CrossRef]
  5. Shugar, D.H.; Jacquemart, M.; Shean, D.; Bhushan, S.; Upadhyay, K.; Sattar, A.; Schwanghart, W.; McBride, S.; de Vries, M.V.W.; Mergili, M.; et al. A massive rock and ice avalanche caused the 2021 disaster at Chamoli, Indian Himalaya. Science 2021, 373, 300–306. [Google Scholar] [CrossRef] [PubMed]
  6. Intrieri, E.; Carlà, T.; Gigli, G. Forecasting the time of failure of landslides at slope-scale: A literature review. Earth-Sci. Rev. 2019, 193, 333–349. [Google Scholar] [CrossRef]
  7. Gong, W.; Juang, C.H.; Wasowski, J. Geohazards and human settlements: Lessons learned from multiple relocation events in Badong, China—Engineering geologist’s perspective. Eng. Geol. 2021, 285, 106051. [Google Scholar] [CrossRef]
  8. Stumpf, A.; Malet, J.P.; Kerle, N.; Niethammer, U.; Rothmund, S. Image-based mapping of surface fissures for the investigation of landslide dynamics. Geomorphology 2013, 186, 12–27. [Google Scholar] [CrossRef]
  9. Xu, Q.; Zhao, B.; Dai, K.; Dong, X.; Li, W.; Zhu, X.; Yang, Y.; Xiao, X.; Wang, X.; Huang, J.; et al. Remote sensing for landslide investigations: A progress report from China. Eng. Geol. 2023, 321, 107156. [Google Scholar] [CrossRef]
  10. Casagli, N.; Intrieri, E.; Tofani, V.; Gigli, G.; Raspini, F. Landslide detection, monitoring and prediction with remote-sensing techniques. Nat. Rev. Earth Environ. 2023, 4, 51–64. [Google Scholar] [CrossRef]
  11. Cheng, Z.; Gong, W.; Tang, H.; Juang, C.H.; Deng, Q.; Chen, J.; Ye, X. UAV photogrammetry-based remote sensing and preliminary assessment of the behavior of a landslide in Guizhou, China. Eng. Geol. 2021, 289, 106172. [Google Scholar] [CrossRef]
  12. Roy, P.; Martha, T.R.; Khanna, K.; Jain, N.; Kumar, K.V. Time and path prediction of landslides using InSAR and flow model. Remote Sens. Environ. 2022, 271, 112899. [Google Scholar] [CrossRef]
  13. Jaboyedoff, M.; Oppikofer, T.; Abellán, A.; Derron, M.H.; Loye, A.; Metzger, R.; Pedrazzini, A. Use of LIDAR in landslide investigations: A review. Nat. Hazards 2012, 61, 5–28. [Google Scholar] [CrossRef]
  14. Ebrahim, K.M.; Gomaa, S.M.; Zayed, T.; Alfalah, G. Recent phenomenal and investigational subsurface landslide monitoring techniques: A mixed review. Remote Sens. 2024, 16, 385. [Google Scholar] [CrossRef]
  15. Kucharczyk, M.; Hugenholtz, C.H. Remote sensing of natural hazard-related disasters with small drones: Global trends, biases, and research opportunities. Remote Sens. Environ. 2021, 264, 112577. [Google Scholar] [CrossRef]
  16. Clapuyt, F.; Vanacker, V.; Van Oost, K. Reproducibility of UAV-based earth topography reconstructions based on Structure-from-Motion algorithms. Geomorphology 2016, 260, 4–15. [Google Scholar] [CrossRef]
  17. Rossi, G.; Tanteri, L.; Tofani, V.; Vannocci, P.; Moretti, S.; Casagli, N. Multitemporal UAV surveys for landslide mapping and characterization. Landslides 2018, 15, 1045–1052. [Google Scholar] [CrossRef]
  18. Moosavi, V.; Talebi, A.; Shirmohammadi, B. Producing a landslide inventory map using pixel-based and object-oriented approaches optimized by Taguchi method. Geomorphology 2014, 204, 646–656. [Google Scholar] [CrossRef]
  19. Keyport, R.N.; Oommen, T.; Martha, T.R.; Sajinkumar, K.S.; Gierke, J.S. A comparative analysis of pixel-and object-based detection of landslides from very high-resolution images. Int. J. Appl. Earth Obs. Geoinf. 2018, 64, 1–11. [Google Scholar] [CrossRef]
  20. Stumpf, A.; Kerle, N. Object-oriented mapping of landslides using Random Forests. Remote Sens. Environ. 2011, 115, 2564–2577. [Google Scholar] [CrossRef]
  21. Martha, T.R.; Kerle, N.; Van Westen, C.J.; Jetten, V.; Kumar, K.V. Object-oriented analysis of multi-temporal panchromatic images for creation of historical landslide inventories. ISPRS J. Photogramm. Remote Sens. 2012, 67, 105–119. [Google Scholar] [CrossRef]
  22. Terzaghi, K. Mechanism of Landslides (Berkey Volume); Geotechnical Society of America: New York, NY, USA, 1950; pp. 83–124. [Google Scholar]
  23. Tang, H.; Wasowski, J.; Juang, C.H. Geohazards in the three Gorges Reservoir Area, China—Lessons learned from decades of research. Eng. Geol. 2019, 261, 105267. [Google Scholar] [CrossRef]
  24. Crozier, M.J. Landslide geomorphology: An argument for recognition, with examples from New Zealand. Geomorphology 2010, 120, 3–15. [Google Scholar] [CrossRef]
  25. Šilhán, K. Can tree tilting indicate mechanisms of slope movement. Eng. Geol. 2015, 199, 157–164. [Google Scholar] [CrossRef]
  26. Confuorto, P.; Di Martire, D.; Centolanza, G.; Iglesias, R.; Mallorqui, J.J.; Novellino, A.; Plank, S.; Ramondini, M.; Thuro, K.; Calcaterra, D. Post-failure evolution analysis of a rainfall-triggered landslide by multi-temporal interferometry SAR approaches integrated with geotechnical analysis. Remote Sens. Environ. 2017, 188, 51–72. [Google Scholar] [CrossRef]
  27. Amatya, P.; Kirschbaum, D.; Stanley, T.; Tanyas, H. Landslide mapping using object-based image analysis and open source tools. Eng. Geol. 2021, 282, 106000. [Google Scholar] [CrossRef]
  28. Mohan, A.; Singh, A.K.; Kumar, B.; Dwivedi, R. Review on remote sensing methods for landslide detection using machine and deep learning. Trans. Emerg. Telecommun. Technol. 2021, 32, e3998. [Google Scholar] [CrossRef]
  29. Ghorbanzadeh, O.; Shahabi, H.; Crivellari, A.; Homayouni, S.; Blaschke, T.; Ghamisi, P. Landslide detection using deep learning and object-based image analysis. Landslides 2022, 19, 929–939. [Google Scholar] [CrossRef]
  30. Martha, T.R.; Kerle, N.; Jetten, V.; Van Westen, C.J.; Kumar, K.V. Characterising spectral, spatial and morphometric properties of landslides for semi-automatic detection using object-oriented methods. Geomorphology 2010, 116, 24–36. [Google Scholar] [CrossRef]
  31. Guzzetti, F.; Mondini, A.C.; Cardinali, M.; Fiorucci, F.; Santangelo, M.; Chang, K.T. Landslide inventory maps: New tools for an old problem. Earth-Sci. Rev. 2012, 112, 42–66. [Google Scholar] [CrossRef]
  32. Fiorucci, F.; Giordan, D.; Santangelo, M.; Dutto, F.; Rossi, M.; Guzzetti, F. Criteria for the optimal selection of remote sensing optical images to map event landslides. Nat. Hazards Earth Syst. Sci. 2018, 18, 405–417. [Google Scholar] [CrossRef]
  33. Yunus, A.P.; Fan, X.; Tang, X.; Jie, D.; Xu, Q.; Huang, R. Decadal vegetation succession from MODIS reveals the spatio-temporal evolution of post-seismic landsliding after the 2008 Wenchuan earthquake. Remote Sens. Environ. 2020, 236, 111476. [Google Scholar] [CrossRef]
  34. Taylor, F.E.; Malamud, B.D.; Witt, A.; Guzzetti, F. Landslide shape, ellipticity and length-to-width ratios. Earth Surf. Process. Landf. 2018, 43, 3164–3189. [Google Scholar] [CrossRef]
  35. Comert, R.; Avdan, U.; Gorum, T.; Nefeslioglu, H.A. Mapping of shallow landslides with object-based image analysis from unmanned aerial vehicle data. Eng. Geol. 2019, 260, 105264. [Google Scholar] [CrossRef]
  36. Lu, P.; Stumpf, A.; Kerle, N.; Casagli, N. Object-oriented change detection for landslide rapid mapping. IEEE Geosci. Remote Sens. Lett. 2011, 8, 701–705. [Google Scholar] [CrossRef]
  37. Ye, S.; Pontius, R.G., Jr.; Rakshit, R. A review of accuracy assessment for object-based image analysis: From per-pixel to per-polygon approaches. ISPRS J. Photogramm. Remote Sens. 2018, 141, 137–147. [Google Scholar] [CrossRef]
  38. Blaschke, T. Object based image analysis for remote sensing. ISPRS J. Photogramm. Remote Sens. 2010, 65, 2–16. [Google Scholar] [CrossRef]
  39. Duro, D.C.; Franklin, S.E.; Dubé, M.G. Multi-scale object-based image analysis and feature selection of multi-sensor earth observation imagery using random forests. Int. J. Remote Sens. 2012, 33, 4502–4526. [Google Scholar] [CrossRef]
  40. Drǎguţ, L.; Tiede, D.; Levick, S.R. ESP: A tool to estimate scale parameter for multiresolution image segmentation of remotely sensed data. Int. J. Geogr. Inf. Sci. 2010, 24, 859–871. [Google Scholar] [CrossRef]
  41. Drăguţ, L.; Blaschke, T. Automated classification of landform elements using object-based image analysis. Geomorphology 2006, 81, 330–344. [Google Scholar] [CrossRef]
  42. Visser, F.; Buis, K.; Verschoren, V.; Schoelynck, J. Mapping of submerged aquatic vegetation in rivers from very high-resolution image data, using object-based image analysis combined with expert knowledge. Hydrobiologia 2018, 812, 157–175. [Google Scholar] [CrossRef]
  43. Nussbaum, S.; Niemeyer, I.; Canty, M.J. SEATH-a new tool for automated feature extraction in the context of object-based image analysis. In Proceedings of the 1st International Conference on Object-based Image Analysis (OBIA), Salzburg, Austria, 4–5 July 2006. [Google Scholar]
  44. Sen, R.; Goswami, S.; Chakraborty, B. Jeffries-Matusita distance as a tool for feature selection. In Proceedings of the 2019 International Conference on Data Science and Engineering (ICDSE), Patna, India, 26–28 September 2019; pp. 15–20. [Google Scholar]
  45. Choi, E.; Lee, C. Feature extraction based on the Bhattacharyya distance. Pattern Recognit. 2003, 36, 1703–1709. [Google Scholar] [CrossRef]
  46. Xu, L.; Dai, F.C.; Tham, L.G.; Zhou, Y.F.; Wu, C.X. Investigating landslide-related cracks along the edge of two loess platforms in northwest China. Earth Surf. Process. Landf. 2012, 37, 1023–1033. [Google Scholar] [CrossRef]
  47. Al-Rawabdeh, A.; He, F.; Moussa, A.; El-Sheimy, N.; Habib, A. Using an unmanned aerial vehicle-based digital imaging system to derive a 3D point cloud for landslide scarp recognition. Remote Sens. 2016, 8, 95. [Google Scholar] [CrossRef]
  48. Wang, H.; Nie, D.; Tuo, X.; Zhong, Y. Research on crack monitoring at the trailing edge of landslides based on image processing. Landslides 2020, 17, 985–1007. [Google Scholar] [CrossRef]
  49. LeCun, Y.; Bengio, Y.; Hinton, G. Deep learning. Nature 2015, 521, 436–444. [Google Scholar] [CrossRef]
  50. Wang, H.; Zhang, L.; Yin, K.; Luo, H.; Li, J. Landslide identification using machine learning. Geosci. Front. 2021, 12, 351–364. [Google Scholar] [CrossRef]
  51. Lin, T.; Goyal, P.; Girshick, R.; He, K.; Dollár, P. Focal loss for dense object detection. IEEE Trans. Pattern Anal. Mach. Intell. 2018, 42, 318–327. [Google Scholar] [CrossRef]
  52. Ale, L.; Zhang, N.; Li, L. Road damage detection using RetinaNet. In Proceedings of the 2018 IEEE International Conference on Big Data (Big Data), Seattle, WA, USA, 10–13 December 2018; pp. 5197–5200. [Google Scholar]
  53. Wang, Y.; Wang, C.; Zhang, H.; Dong, Y.; Wei, S. Automatic ship detection based on RetinaNet using multi-resolution Gaofen-3 imagery. Remote Sens. 2019, 11, 531. [Google Scholar] [CrossRef]
  54. Rawat, W.; Wang, Z. Deep convolutional neural networks for image classification: A comprehensive review. Neural Comput. 2017, 29, 2352–2449. [Google Scholar] [CrossRef]
  55. Weiss, K.; Khoshgoftaar, T.M.; Wang, D. A survey of transfer learning. J. Big Data 2016, 3, 1–40. [Google Scholar] [CrossRef]
  56. Lu, H.; Ma, L.; Fu, X.; Liu, C.; Wang, Z.; Tang, M.; Li, N. Landslides information extraction using object-oriented image analysis paradigm based on deep learning and transfer learning. Remote Sens. 2020, 12, 752. [Google Scholar] [CrossRef]
  57. Juang, C.H.; Dijkstra, T.; Wasowski, J.; Meng, X. Loess geohazards research in China: Advances and challenges for mega engineering projects. Eng. Geol. 2019, 251, 1–10. [Google Scholar] [CrossRef]
  58. Zawadzka, J.; Truckell, I.; Khouakhi, A.; Rivas Casado, M. Detection of flood damage in urban residential areas using object-oriented UAV image analysis coupled with tree-based classifiers. Remote Sens. 2021, 13, 3913. [Google Scholar] [CrossRef]
  59. Harary, F.; Wilcox, G.W. Boolean operations on graphs. Math. Scand. 1967, 20, 41–51. [Google Scholar] [CrossRef]
  60. Peng, D.; Xu, Q.; Liu, F.; He, Y.; Zhang, S.; Qi, X.; Zhao, K.; Zhang, X. Distribution and failure modes of the landslides in Heitai terrace, China. Eng. Geol. 2018, 236, 97–110. [Google Scholar] [CrossRef]
  61. Xu, Q.; Li, W.; Ju, Y.; Dong, X.; Peng, D. Multitemporal UAV-based photogrammetry for landslide detection and monitoring in a large area: A case study in the Heifangtai terrace in the Loess Plateau of China. J. Mt. Sci. 2020, 17, 1826–1839. [Google Scholar] [CrossRef]
  62. Frohn, R.C.; Chaudhary, N. Multi-scale image segmentation and object-oriented processing for land cover classification. GIScience Remote Sens. 2008, 45, 377–391. [Google Scholar] [CrossRef]
  63. Xun, Z.; Zhao, C.; Liu, X.; Liu, Y. Automatic identification of potential landslides by integrating remote sensing, DEM and deformation map. In Proceedings of the IGARSS 2019–2019 IEEE International Geoscience and Remote Sensing Symposium, Yokohama, Japan, 28 July–2 August 2019; pp. 9662–9665. [Google Scholar]
  64. Mondini, A.C.; Chang, K.T. Combining spectral and geoenvironmental information for probabilistic event landslide mapping. Geomorphology 2014, 213, 183–189. [Google Scholar] [CrossRef]
  65. Sasikala, B.S.; Biju, V.G.; Prashanth, C.M. Kappa and accuracy evaluations of machine learning classifiers. In Proceedings of the 2017 2nd IEEE International Conference on Recent Trends in Electronics, Information & Communication Technology (RTEICT), Bengaluru, India, 19–20 May 2017; pp. 20–23. [Google Scholar]
  66. Ghosh, K.; Bellinger, C.; Corizzo, R.; Branco, P.; Krawczyk, B.; Japkowicz, N. The class imbalance problem in deep learning. Mach. Learn. 2024, 113, 4845–4901. [Google Scholar] [CrossRef]
  67. Prechelt, L. Early stopping-but when? In Neural Networks: Tricks of the Trade; Springer: Berlin/Heidelberg, Germany, 2002; pp. 55–69. [Google Scholar]
  68. Powers, D.M.W. Evaluation: From precision, recall and F-measure to ROC, informedness, markedness and correlation. J. Mach. Learn. Technol. 2011, 2, 37–63. [Google Scholar]
  69. Greiner, M.; Pfeiffer, D.; Smith, R.D. Principles and practical application of the receiver-operating characteristic analysis for diagnostic tests. Prev. Vet. Med. 2000, 45, 23–41. [Google Scholar] [CrossRef] [PubMed]
  70. Yang, D.; Qiu, H.; Hu, S.; Zhu, Y.; Cui, Y.; Du, C.; Liu, Z.; Pei, Y.; Cao, M. Spatiotemporal distribution and evolution characteristics of successive landslides on the Heifangtai tableland of the Chinese Loess Plateau. Geomorphology 2021, 378, 107619. [Google Scholar] [CrossRef]
  71. Fleming, R.W.; Johnson, A.M. Structures associated with strike-slip faults that bound landslide elements. Eng. Geol. 1989, 27, 39–114. [Google Scholar] [CrossRef]
  72. Chang, W.; Xing, A.; Wang, P.; Zhuang, Y.; Jin, K.; He, J.; Chai, S. Analysis of dangchuan 5# landslide on January 27, 2021, in yongjing county, gansu province, china. Landslides 2021, 18, 3615–3628. [Google Scholar]
  73. Gu, T.; Wang, J.; Lin, H.; Xue, Q.; Sun, B.; Kong, J.; Sun, J.; Wang, C.; Zhang, F.; Wang, X. The spatiotemporal relationship between landslides and mechanisms at the Heifangtai terrace, Northwest China. Water 2021, 13, 3275. [Google Scholar] [CrossRef]
  74. Wang, H.; Zhong, P.; Xiu, D.; Zhong, Y.; Peng, D.; Xu, Q. Monitoring tilting angle of the slope surface to predict loess fall landslide: An on-site evidence from Heifangtai loess fall landslide in Gansu Province, China. Landslides 2022, 19, 719–729. [Google Scholar] [CrossRef]
Figure 1. Schematic framework of image-analysis-based landslide identification: blue regions denote boundary delineation of landslides; red regions indicate surface crack detection; orange areas correspond to low-confidence landslide zones in Boolean operations; yellow areas represent high-confidence landslide zones in Boolean operations.
Remotesensing 17 01900 g001
Figure 2. Schematic diagram of potential landslide boundary recognition with object-oriented image analyses: (a) UAV-based DOM; (b) image segmentation process based on the ESP method, where the inset shows different segmentation scales; (c) object classification process based on the SEaTH method, where the inset shows the visualization of rule sets; (d) final landslide boundary recognition result.
Remotesensing 17 01900 g002
Figure 3. Determination of the optimal threshold value of the feature x for separating object categories C1 and C2.
Remotesensing 17 01900 g003
Figure 4. Schematic diagram of ground surface crack recognition with an artificial-intelligence-based model: (a) Database A (General Knowledge): Diverse crack samples capturing universal features across geological conditions, crack types, and environments; (b) Database B (Site-Specific Adaptation): Local crack images reflecting area-specific geological triggers and attributes; (c) Optimized Recognition Model: Integration of universal foundational features and localized attributes through RetinaNet retraining.
Remotesensing 17 01900 g004
Figure 5. Landslide identification based on Boolean operations of the landslide boundaries and ground surface cracks.
Remotesensing 17 01900 g005
Figure 6. General information of the study area: (a) location and digital surface model (DSM) of the study area; (b) UAV-photogrammetry-based survey conducted on 23 November 2018 and the digital orthophoto map (DOM) with a resolution of 4.4 cm/pixel.
Remotesensing 17 01900 g006
Figure 7. LV and the rate of change curves obtained from the ESP tool.
Remotesensing 17 01900 g007
Figure 8. Segmentation results obtained with these six candidate optimal segmentation scales: (a) segmentation scale = 92; (b) segmentation scale = 114; (c) segmentation scale = 163; (d) segmentation scale = 182; (e) segmentation scale = 200; (f) segmentation scale = 234.
Remotesensing 17 01900 g008
Figure 9. Distribution of the randomly selected 20 landslide object areas and 40 non-landslide object areas in the study area.
Remotesensing 17 01900 g009
Figure 10. Recognition results of the landslide areas and boundaries in the study area.
Remotesensing 17 01900 g010
Figure 11. Training and validation loss convergence curves with early stopping strategy (patience = 5, delta = 0.005).
Remotesensing 17 01900 g011
Figure 12. Validation of the developed image recognition model using ROC curve and determination of the optimal distinguishability index.
Remotesensing 17 01900 g012
Figure 13. Recognition results of the ground surface cracks obtained in the study area.
Remotesensing 17 01900 g013
Figure 14. Fusion results of the two types of landslide attribute recognized in the study area based on Boolean operations.
Remotesensing 17 01900 g014
Figure 15. Landslide regions identified in the study area with the proposed approach and those obtained from field survey results.
Remotesensing 17 01900 g015
Table 1. Optimal parameters for multi-scale segmentation.
ParameterValueDetermination MethodReference
Shape value0.2Terrain-specific optimizationXun et al. [63]
Compactness value0.5Terrain-specific optimizationXun et al. [63]
Segmentation scalePendingESP optimization toolDrǎguţ et al. [40]
Table 2. Total of 47 candidate features for image analysis with SeaTH.
Type of the FeatureFeatures
SpectralMean Layer 1,2,3
Stdev Layer 1,2,3
Ratio Layer 1,2,3
Max. Diff.
Brightness
ShapeArea (m)
Length (m)
Width (m)
Length/width
Compactness
Elliptic Fit
Rectangular Fit
Border length (m)
Shape index
Density
Main direction
Asymmetry
TextureGLCM Homogeneity (all dir.) Layer 1,2,3
GLCM Contrast (all dir.) Layer 1,2,3
GLCM Dissimilarity (all dir.) Layer 1,2,3
GLCM Entropy (all dir.) Layer 1,2,3
GLCM Ang. second moment (all dir.) Layer 1,2,3
GLCM Mean (all dir.) Layer 1,2,3
GLCM Standard deviation (all dir.) Layer 1,2,3
GLCM Correlation (all dir.) Layer 1,2,3
Table 3. Fourteen prominent features and the related threshold values based on the feature analysis of the sample images with the algorithm of SEaTH.
FeaturesJ-M IndexThreshold
Ratio Layer 11.920.35
Ratio Layer 21.890.36
Density1.871.11
Length (m)1.87169
Mean Layer 21.8598.51
GLCM Dissimilarity Layer 21.8512.92
GLCM Mean Layer 31.83175
Mean Layer 11.81151
Brightness1.79320
Compactness1.780.22
GLCM Standard deviation Layer 11.7825
Border length (m)1.76200
Asymmetry1.750.93
GLCM Correlation Layer 11.750.92
Table 4. Quantitative comparison between the field survey results and object-oriented image analysis results.
Image RecognitionField Surveys
Landslide Area/km2Non-Landslide Area/km2
Landslide area/km21.390.33
Non-landslide area/km20.254.28
Disclaimer/Publisher’s Note: The statements, opinions and data contained in all publications are solely those of the individual author(s) and contributor(s) and not of MDPI and/or the editor(s). MDPI and/or the editor(s) disclaim responsibility for any injury to people or property resulting from any ideas, methods, instructions or products referred to in the content.

