Article

Remote Sensing in the 15 µm CO2 Band: Key Concepts and Implications for the Heat Balance of Mesosphere and Thermosphere

by
Alexander Kutepov
1,*,
Artem Feofilov
2,
Ladislav Rezac
3 and
Konstantinos S. Kalogerakis
4
1
Physics Department, The Catholic University of America, Washington, DC 20064, USA
2
Laboratoire de Météorologie Dynamique/Institut Pierre Simon Laplace (IPSL), Sorbonne Université, Centre National de la Recherche Scientifique, Institut Polytechnique de Paris, 75252 Paris, France
3
Max Planck Institute for Solar System Research, 37077 Göttingen, Germany
4
Center for Geospace Studies, SRI International, Menlo Park, CA 94025, USA
*
Author to whom correspondence should be addressed.
Remote Sens. 2025, 17(11), 1896; https://doi.org/10.3390/rs17111896
Submission received: 6 March 2025 / Revised: 12 May 2025 / Accepted: 21 May 2025 / Published: 29 May 2025
(This article belongs to the Section Atmospheric Remote Sensing)

Abstract

:
We investigated the algorithms and physical models currently applied to remote sensing of the mesosphere and lower thermosphere (MLT) using space-based observations of the CO2 15 µm emission. We show that the measured 15 µm radiation constrains the population of excited CO2 vibrational levels and the 15 µm radiative flux divergence in the MLT, but not the 15 µm cooling. Moreover, the models of the non-local thermodynamic (non-LTE) excitation of CO2 in the MLT contradict the laboratory studies of this excitation. We present a new model of the non-LTE in CO2 that is both consistent with the observed CO2 15 µm radiation and provides the CO2 cooling of the MLT, which aligns with the laboratory-measured rate coefficient k O of the CO2 vibrational excitation by collisions with O(3P) atoms. Its application shows that the current non-LTE models dramatically overestimate this cooling. Even for the low laboratory-confirmed rate coefficient of the CO2-O(3P) excitation, k O = 1.5 × 10 12   s 1 cm 3 , excess cooling is equal or higher than the true cooling, reaches a value of 10 K/day, and is maximized in the mesosphere region around 100 km—a region which is very sensitive to any changes in the heat balance. For k O = 3.0 × 10 12   s 1 cm 3 , which is currently used in the general circulation models of the MLT, excess cooling reaches 25–30 K/day. The results of this study contradict the widely held belief that the 15 µm CO2 emission is the primary cooling mechanism of the middle and upper atmospheres of Earth, Venus, and Mars. A significant reduction in 15 µm cooling will have a major impact on both the modeling of the current MLT and the estimation of its future changes due to increasing CO2. It also strongly influences the interpretation of MLT 15 µm emission observations and provides new insights into the role of this emission in the middle and upper atmospheres of Mars, Venus, and other extraterrestrial planets.

1. Introduction

The year 2025 marks the 55th anniversary of Paul Crutzen’s (1995 Nobel Prize in Chemistry) hypothesis [1] that collisions of CO2 molecules with O(3P) atoms is the dominant process responsible for the excitation of the bending vibrational mode of CO2, and that the resulting 15 µm infrared (IR) emission from vibrationally excited CO2 provides a remote sensing window into the temperature profiles, energy budget, and heat balance of the middle and upper atmospheres.
Since then, limb space observations of the 15 µm emission from a number of orbiting instruments have been used to retrieve vertical temperature profiles in the mesosphere and lower thetmosphere (MLT); see, e.g., [2,3,4], and references therein to earlier experiments.
Today, it is also accepted that the 15 µm infrared emission of CO2 is the main cooling mechanism of the middle and upper atmospheres of Earth, Venus, and Mars (e.g., [5,6,7,8,9,10]). On Earth, it has been shown that this cooling affects both the mesospheric temperature and height [8]. Much work has been devoted to developing an efficient way to estimate this cooling in general circulation models (GCMs) of the middle and upper atmospheres of terrestrial planets (e.g., [11,12,13,14,15,16,17,18]).
However, the CO2 + O(3P) problem has remained open for the past five decades due to unacceptably large discrepancies between the laboratory measurements of the rate coefficient for this process, its values inferred from space-based observations, and the rate coefficient values used in the GCMs for estimating the CO2 cooling of the MLT. Extensive laboratory studies of this process confirmed the hypotheses of Crutzen [1], showing that the rate coefficient for this process k O (1.3–2.7) × 10 12   s 1 cm 3 [19] is even much higher than his previous estimate. Nevertheless, all studies aimed at modeling space observations of the very strong 15 µm emission required even higher k O = (5–9) × 10 12   s 1 cm 3 to fit these observations [19]. Therefore, for many years, there has been a tacit agreement: (1) the low laboratory values of this coefficient are ignored and not used in atmospheric studies; (2) the high value k O = 6.0 × 10 12   s 1 cm 3 is used to retrieve temperatures and pressures from space observations [6,20,21,22,23,24]; and (3) its twice-lower value k O = 3.0 × 10 12   s 1 cm 3 is used in GCMs to model the current ionosphere, mesosphere, and lower thermosphere to reproduce their observed variation over the last half century, as well as to predict their expected changes (see, for instance, [25,26,27,28,29,30,31,32] as a sample from the multitude of similar works, which include copious titles). Most recently, Lübken [33] highlighted the importance of this unresolved atmospheric physics problem: “A long-standing and still unresolved problem in the MLT relates to non-LTE and its relevance for the energy budget in that region… Unfortunately, values for k(CO2-O) as used in satellite retrieval algorithms are different from values obtained from laboratory measurements (Feofilov and Kutepov [10]). This coefficient has a major influence on radiative heating/cooling and therefore on background temperatures. Non-LTE is therefore of high relevance for MLT science and deserves to be studied further in the future”.
On the other hand, the analysis of the CO2 cooling of the thermosphere derived directly from the SABER/TIMED observations of the 15 µm emission by Mlynczak et al. [20] implies that the problem described above does not seem to exist at all. The authors found that the CO2 cooling, expressed in energy units of Wm 3 and derived from space observations, is almost insensitive to k O , i.e., a factor of 4 variation of this key parameter from 1.5 to 6.0 × 10 12   s 1   cm 3 had only a moderate effect (less than 15%) on this cooling. Based on their results, Mlynczak et al. [20] offered the SABER h data in the form of a universal data set for MLT energy budget studies. Since then, dozens of papers have relied on these data; see, for example, the recent papers of Mlynczak et al. [34,35] and the references therein.
The “essential insensitivity” of h to non-LTE reported by Mlynczak et al. [20] contradicts the above studies, where the CO2 cooling was strongly dependent on k O in both Wm 3 and K/day. The study we present in this paper was inspired by this inconsistency. It aims to (a) investigate the algorithms and physical models currently used for remote sensing of the MLT using space-based observations of the CO2 15 µm emission, (b) analyze the CO2 15 µm cooling of the MLT derived from these observations, and (c) critically compare the cooling models used in current GCMs of the MLT. We show that the current models of the non-local thermodynamic (non-LTE) excitation of CO2 in the MLT contradict both the laboratory studies of this excitation and the space observations of this emission. Finally, we present a novel model of the non-LTE in CO2 that is both consistent with the observed CO2 15 µm emission and provides the CO2 cooling of the MLT that is consistent with the laboratory-measured rate coefficient k O of the CO2 vibrational excitation by collisions with O(3P) atoms.
In Section 2 of this paper, we analyze the retrieval algorithms and non-LTE models used to interpret the measured limb 15 µm radiances as well as how these observations relate to the 15 µm radiative flux divergence, to the CO2 cooling derived from these observations, and to the CO2 cooling in the current GCMs of the MLT.
In Section 3, we describe the new non-LTE model for the calculation of the CO2 15 µm radiative cooling in the MLT, which satisfies both the 15 µm limb emission observations and the laboratory studies of CO2 ( ν 2 ) quenching.
In Section 4, we present the results of the CO2 15 µm cooling calculation in the MLT obtained using the new model and compare them with those of standard non-LTE models. In the Conclusions section, we summarize the main results of our study and discuss their implications for further observations and modeling of the MLT.

2. The Limb Observations of the CO2 15 µm Emission of MLT

Mlynczak et al. [20] showed that the CO2 15 µm cooling in W m 3 derived with the SABER temperature and pressure retrievals is “essentially independent” of the non-LTE in CO2. They observed this for 7 days of the 2008 SABER observations for the zonally averaged cooling values. Although for these mean data, this “essential independence” appears rather moderate (the mean cooling shows considerable variability, up to 15%), it is still a very interesting feature of the cooling obtained directly from the observations. Mlynczak et al. [20] describe this phenomenon as a purely technical aspect of the retrieval approach, when the decreasing k O rate coefficient leads to a decrease in the population of excited CO2 molecules, but the SABER retrieval algorithm compensates for this decrease by increasing the temperature and pressure to match the measured radiance. In general, this is an explanation of how any forward-fit retrieval algorithm works by fitting measured signals and inferring the volume emission rates. However, this explanation does not clarify the “essential independence” of the 15 µm cooling, since the radiative cooling is not equivalent to the volume emission rate, but is the difference between the energy the unit volume gains by absorbing the radiation and the volume emission rate.
Later in this section, we present a rigorous theoretical analysis of the current retrieval techniques and the non-LTE models used for the interpretation of the 15 µm emission limb observations. This is conducted to answer the basic question of whether the effect observed by Mlynczak et al. [20] in the numerical experiments is true or is an artificial feature caused by the retrieval scheme and/or applied non-LTE model.

2.1. The 15 µm Radiative Flux Divergence

In the upper mesosphere and thermosphere, the fundamental 15 µm transition 0110 → 000 of the main CO2 isotope dominates the 15 µm limb emission and cooling [9,36]. The radiative transfer equation (RTE) in a single line of this band is [37,38]
d I ν d s = ϕ ( ν ) [ ( n 1 j B 1 j , 2 j n 2 j B 2 j , 1 j ) I ν A 2 j , 1 j n 2 j ] ,
where I ν is the radiative intensity in the line; ϕ ( ν ) is the normalized line shape function; n 1 j and n 2 j are the populations of lower and upper ro-vibrational levels; and A 2 j , 1 j n 2 j , B 1 j , 2 j , and B 2 j , 1 j are the Einstein coefficients for spontaneous emission, absorption, and stimulated emission in the line, respectively. Following Goody [39] and Lopez-Puertas and Taylor [9], we will ignore for simplicity the stimulated emission, which has little effect on the 15 µm fundamental band emissions in the middle and upper atmospheres of terrestrial planets because n 2 j n 1 j (this is called “the linear approximation in the non-LTE radiative transfer theory” [40]).
The energy loss of the atmospheric unit volume due to the radiation is calculated as the radiative flux divergence taken with the opposite sign. To obtain the cooling in the 15 µm fundamental band, we integrate (1), taken with an opposite sign over all angles and frequencies [9,37]:
h = l d ω d ν d I μ ν d s = n 1 B 12 J A 21 n 2 ,
where n 1 and n 2 are the populations of the ground levels (000) and the first excited (0110) CO2 levels, respectively; A and B are the Einstein coefficients for the band; and J is the mean radiative intensity in the band. l in (2) describes the sum over all lines in the band that are considered non-overlapping. For simplicity, we also rely on the assumption of rotational LTE for both vibrational levels. A detailed derivation of (2) can be found in [37]. The source function in the fundamental 15 µm band of the CO2 molecule is [9,37]
S = 2 h ν 3 c 2 g 1 g 2 n 2 n 1 ,
where g are the statistical weights of vibrational levels. The integral Λ -operator, which is defined by the solution of RTE (1) with further integrations over angles and frequencies, as specified in (2), links J at a given point with source function values all over the atmosphere [37,41,42]:
J = Λ [ S ] .
Accounting for (3) and (4), (2) may be rewritten as [37]
h = n 1 B 12 { Λ [ S ] S } = C ˜ [ S ] .
where C ˜ = Λ I is the integral Curtis operator (with I being the unit operator), which links h at a given point with the source function in the band all over the atmosphere [5,9].

2.2. Radiative Flux Divergence and the 15 µm Limb Emission

The measured limb radiance in a certain frequency interval may be presented as the solution of the RTE (1) along the slant pass in geometrical coordinates. In the spherical symmetric atmosphere (e.g., [43,44]),
I ( z t ) = z t W ˜ ( z t , z ) A 21 n 2 d z = z t W ( z t , z ) S ( z ) d z ,
or in the operator form
I = W ˜ [ n 2 ] = W [ S ] ,
where z t is the tangent height and W are the integral limb operators. We assume here that the frequency integration (accounting for the instrumental function) and the field-of-view integration are explicitly taken into account in W ˜ ( z t , z ) or W ( z t , z ) .
If we apply in this expression the inverse of (5),
S = C ˜ 1 [ h ] ,
then
I = W [ S ] = W C ˜ 1 [ h ] .
This equation expresses the inverse problem, which the SABER operational algorithm solves, when it iteratively fits the measured signal. Mlynczak et al. [20] explains this as follows: “Specifically, the Curtis matrix approach [45,46] is employed in the SABER non-LTE modeling and temperature derivation process and directly yields the infrared radiative cooling rates in kelvin per day”.
It follows from expression (9) that the 15 μm CO2 radiative flux divergence in the thermosphere is rigorously constrained by the measured limb radiation regardless of whether the LTE or the non-LTE is valid. The operator W C ˜ 1 of this simple problem demonstrates no dependence on the non-LTE model parameters. It simply “does not know” whether the CO2 ( 01 1 0 ) level is in the LTE or not.
This lemma elucidates the theoretical background of the “essential insensitivity” of h in the thermosphere to the non-LTE in CO2, which Mlynczak et al. [20] observed in numerical experiments.
Meanwhile, (9) is the direct consequence of expression (6). Equation (6) states that the population of excited vibrational level n 2 or the source function S in the 15 µm CO2 band are rigorously constrained by the measured limb radiation regardless of the validity of LTE.
While the condition imposed by the expression (9) on the radiative flux divergence may look novel, the same cannot be said for the condition imposed by the expression (6) on the volume emission rate A 21 n 2 or the source function S. This is widely understood by modelers involved in interpreting the measured 15 µm limb emissions, including the authors of [20]; see [47].
Finally, we note that Mlynczak et al. [20] reported the “essential independence” of h on the non-LTE for the zonal averaged “cooling” altitude profiles. However, it follows from (6) and (9) that the source function S or h are rigorously constrained by the measured limb radiation for each individual scan.

2.3. The Radiative Flux Divergence and the 15 µm Cooling

We have shown above that the 15 µm flux divergence in the MLT may be derived directly from the 15 µm limb emission observations. The next question is whether h derived in this way can be associated with the radiative cooling of these layers. In order to answer this question, we need to briefly analyze the non-LTE models of the 15 µm emission.
The current models of the 15 µm emission [10,18,38,48] assume that the only non-radiative processes causing excitation/quenching of the CO2 ν 2 -bending mode are inelastic collisions with molecules or atoms of other atmospheric constituents. These collisions can cause vibrational–translational (VT) and vibrational–vibrational (VV) energy exchanges. In the first case, vibrational energy transfers into (or is obtained from) the heat reservoir, which consists of the translational energy of atmospheric constituents. The VV processes provide the ν 2 quanta exchange between the CO2 molecules of the same or other CO2 isotopic species as well as with other vibrationally excited molecules. In the upper mesosphere and thermosphere, both for day and night conditions, the VV ν 2 quanta exchange processes are very weak; the same is also true for the energy transfer to CO2 ( ν 2 ) from CO2 ( ν 3 ) and higher combinational levels at daytime, which are pumped by the absorption of the solar near-infrared radiation [9,48,49]. Therefore, we have neglected both in the consideration that follows.
As was noted above in Section 2.1, the fundamental 15 µm transition 0110 → 000 of the main CO2 isotope dominates the 15 µm limb emission and cooling in the upper mesosphere and thermosphere. The steady-state equation for the upper level of this band, which expresses the balance between its radiative and collisional excitation and de-excitation, is as follows [11,37,38,49,50]:
d n 2 d t = n 1 B 12 J A 21 n 2 + C 12 n 1 C 21 n 2 = 0 ,
where C 12 and C 21 are the total rate coefficients of inelastic VT collisions of the CO2 molecule with molecules and atoms of other atmospheric constituents, which cause excitations as well as quenching of vibrational level 2, respectively, thus linking the vibrational energy of the 0110 CO2 state directly to the translational energy of the atmospheric constituents (the heat reservoir).
In the current non-LTE models, the molecules of N2 and O2, as well as the O(3P) atoms are considered the collisional partners of CO2 molecules in the MLT [37,38,48]. Therefore,
C 21 = k N 2 [ N 2 ] + k O 2 [ O 2 ] + k O [ O ] ,
where k M are the rate coefficients for the quenching of level 0110 by collisions with the N2 and O2 molecules, along with O(3P) atoms, respectively, and [M] are the densities of these collisional partners. In the thermosphere, collisions with O(3P) atoms dominate collisional quenching and excitation. The coefficients C 12 and C 21 are related by the following standard detailed balance relation:
C 12 = g 2 g 1 C 21 exp ( E 2 k T ) ,
where E 2 is the vibrational energy of level 0110.
It follows from (2) and (10) that in this simple model,
h = n 1 B 12 J A 21 n 2 = C 21 n 2 C 12 n 1
or the CO2 vibrational energy gain or loss in the atmospheric unit volume due to the absorption or emission of the 15 µm radiation is completely balanced by the loss or gain of the heat reservoir energy.
Therefore, in the framework of the non-LTE models that are currently used to retrieve temperature from space observations, as in [20], or in the GCMs [15,17,18], and in which, apart from absorption and emission of radiation, only inelastic collisions provide the CO2 ( ν 2 ) excitation/de-excitation, the answer to the question whether the radiative flux divergence h derived from the observations represents the “cooling” of the atmosphere is “yes”.

2.4. The 15 µm “Cooling” Derived from Observations and the CO2 Cooling in the GCMs

After finding the low sensitivity of h derived from the SABER observations to the k O variations Mlynczak et al. [20] offered the SABER h data in the form of a universal data set for further studies of the MLT energy budget and for validating the 15 µm cooling routines in GCMs. They wrote “These parameterizations are very sensitive to the non-LTE processes including the rate coefficient for energy transfer between atomic oxygen and CO2 because they have no constraint (e.g., a measured radiance). Through such comparisons the long-standing discrepancies between renderings of the key non-LTE parameters may be resolved”.
Recently, Kutepov and Feofilov [18] proposed a new routine for calculating non-LTE 15-µm cooling in GCM. Unlike the routines of Fomichev et al. [15] and López-Puertas et al. [17], this routine is free of very large cooling errors for temperature profiles, which are disturbed by gravity waves and diurnal tides. Validating this new algorithm using SABER data would be very useful.
The steps to carry out this comparison are as follows. The routine of Kutepov and Feofilov [18] requires the input of p and T as well as CO2 and O(3P) densities. Let us take as these inputs the SABER-retrieved p and T as well as the [CO2] and [O(3P)] used for these retrievals (all of this information is available at https://saber.gats-inc.com/data.php) (accessed on 20 May 2025). The SABER h is given for the unit volume in energy units W m−3. In contrast, the routine of Kutepov and Feofilov [18] calculates h per unit mass in K/day as T / t , as is required in GCMs. These quantities are linked by the first law of thermodynamics:
h = ρ C p T t ,
where C p is the heat capacity at constant pressure and ρ is the density in mass units. So, we simply need to convert the routine-calculated cooling into energy units (or vice versa).
The main question in this comparison is what k O value should be used for calculating h? The SABER operational retrievals utilize k O = 6.0 × 10 12   s 1 cm 3 . This high value of k O is applied because it allows for reproducing the measured 15 µm radiation, using the values p and T as fitting parameters and retrieving, in this way, p and T that are in good agreement with independent observations (see Section 3.1). If we use the same rate coefficient for calculating h, then we would obtain a very good agreement with the SABER data. However, current GCM users prefer to use a twice-smaller rate coefficient, i.e., k O = 3.0 × 10 12   s 1 cm 3 [25,26,27,28,29,30,31]. If this lower value is used in the routine, we would obtain up to twice-lower values of h, no matter in what units, which will be in strong disagreement with the SABER data. Even lower h, up to a factor of four lower than the SABER cooling, would be obtained if the low laboratory rate coefficient k O = 1.5 × 10 12   s 1 cm 3 is used in these calculations (see detailed comparisons of h calculated for different values of k O in Section 4).
This simple ”thought experiment” shows that using the SABER h data to validate the CO2 cooling routines used in the GCMs does not seem practical. They do not help to answer the question of what rate coefficient k O should be used in these routines as Mlynczak et al. [20] have suggested. They simply dictate that the same high k O value be used in the GCMs as is used in the SABER temperature retrievals.

3. New Model for Calculating the 15 µm Cooling of MLT

The problem of large discrepancies between laboratory measurements of k O and the values derived from space observations, as outlined in the Introduction, has been addressed in detail by Feofilov et al. [19]. In Table 1, which consists of 20 records, Feofilov et al. [19] presented the historical review of the k O quenching rate coefficient laboratory measurements and atmospheric retrievals with corresponding references. This review covers more than 40 years (1970–2012) of efforts to determine one of the key parameters for middle atmospheric physics. The review shows how, with improvements in laboratory measurement techniques and in the accuracy of atmospheric observations and models, the discrepancy between the results of these two sets of measurements first gradually increases and then stabilizes at values that differ by at least a factor of 4 for the mesospheric and lower thermospheric temperatures (see discussion in Section 3.2). Feofilov et al. [19] also presented their own determination of k O based on the analysis of atmospheric observations using coincident SABER 15 µm emission and Fort Collins’ (Colorado, USA) sodium lidar temperature observations [51] by minimizing the difference between measured and simulated broadband limb 15 µm radiation independently at each particular altitude. The averaged k O value obtained in this work is k O = ( 6.5 ± 1.5 ) × 10 12   s 1 cm 3 , which is close to other estimates of this coefficient from atmospheric observations.
Since the study by Feofilov et al. [19] and to date, no new results have been published either from laboratory measurements or atmospheric retrievals of k O .
The current situation, where two sets of k O measurements differ by at least a factor of 4, is a telltale sign of a major fundamental deficiency in the understanding of the processes that control the CO2( ν 2 ) excitation in the middle atmosphere. One can assume that there is either (a) a bias in the laboratory values of the rate coefficient k O , (b) one or more significant excitation mechanisms of CO2( ν 2 ) that are not accounted for, or (c) other deficiencies in the current non-LTE CO2 models or in the pressure and temperature retrieval algorithms.
Feofilov et al. [19] considered problem (b) from above. They (1) assumed that the low k O obtained in the laboratory is the actual rate coefficient for quenching the CO2 ( ν 2 ) vibrations by collisions with thermalized O(3P) atoms alone. To compensate for the low degree of VT excitation of the CO2( ν 2 ) vibrations that these thermalized O(3P) atoms can provide, they (2) assumed the presence of a non-thermal source of CO2 excitation in the MLT. They associated this source with collisions of the CO2 molecules with super-thermal (hot) O(3P) atoms [52,53]. Sharma et al. [54] refined this idea: the collisions of super-thermal O(3P) atoms in the MLT occur mostly with the N2 molecules and cause a very strong rotational excitation of these molecules. When these rotationally super-thermal N2 molecules collide with the CO2 molecules, the vibrational–rotational (VR) near-resonant energy transfer leads to an additional CO 2 ( 01 1 0 ) excitation.
In order to account for additional excitation mechanisms that compensate for the reduced effect of CO2 excitation by collisions with O(3P), as seen in the laboratory experiments, Feofilov et al. [19] included in the non-LTE model additional excitation sources Y v for each vibrational CO2 level v. In the case of the fundamental 15 µm band considered above in Section 2.3, the modified steady-state Equation (10) is
d n 2 d t = n 1 B 12 J A 21 n 2 + C 12 n 1 C 21 n 2 + Y = 0 ,
where as in (10), C 12 and C 21 are again the total rate coefficients (11,12) of inelastic collisions with N2, O2, and O(3P). However, now the contribution of the O(3P) collisions in (11) is calculated with the low laboratory confirmed rate coefficient k O .
Taking (13) into account, (15) can be rewritten as:
h + Y = h ,
with
h = C 21 n 2 C 12 n 1 ,
where h is the radiative flux divergence and h is the term that specifies the transfer of energy from the heat reservoir into the vibrational energy of CO2, i.e., true cooling of the atmosphere. One may see that in this model, h is not equivalent to the cooling of the atmosphere as it is in the standard model (10) used by Mlynczak et al. [20].
Up to now, the additional excitation source term Y in (15), as well as similar terms in the steady-state equations for other CO2 vibrational levels, remain unspecified. More studies of possible mechanisms outlined above are needed to define these terms.
However, can we efficiently calculate the CO2 cooling of the MLT without precisely specifying these excitation terms? In the next section, we describe a new model for calculating this cooling, which avoids this exact specification. We start with formulating two basic features of this model and then describe its performance.

3.1. Constrained CO2 Vibrational Level Populations

We showed in Section 2.2 that the outgoing radiation imposes a constraint on the populations of the CO2 excited levels regardless of how these levels are populated. Any algorithm aimed at retrieving p and T in the MLT, such as the operational SABER retrieval code does, solves the non-LTE problem and, thus, indirectly retrieves the CO2 vibrational level populations.
The main question here is how good are the retrieved populations? Dawkins et al. [55] performed a comprehensive comparison of the SABER operational T retrievals with the high-resolution ground-based lidar temperature profiles around the world. This study showed that for the MLT T profiles measured by SABER in the broad latitude range of 83°N-52°S or 52°N-83°S, the accuracy of a single temperature profile is ≈3.3–10.5 K at 90–110 km. The main conclusion Dawkins et al. [55] drew from this study was that “Overall, the SABER temperature retrievals were able to reproduce the general latitudinal and seasonal variations in the lidar temperature profiles and were shown to be statistically similar for most seasons, at most locations, for most altitudes, and with no overall bias”.
This means that the rate coefficient k O = 6.0 × 10 12   s 1 cm 3 applied in the SABER and other non-LTE models is a good fitting parameter, which, in combination with properly chosen [CO2] and [O(3P)], provides retrieved p and T in the MLT in good agreement with independent lidar T observations for a broad variety of atmospheric conditions. The same is true for the retrieved populations of vibrational levels since they facilitate the fitting of the measured signals.
As was mentioned by Mlynczak et al. [20], the lack of a constraint (e.g., a measured radiance) is the main problem with the CO2 cooling routines used in GCMs today. To overcome this problem, we applied in our revised cooling model the high rate coefficient k O = 6.0 × 10 12   s 1 cm 3 to simulate the populations, which are consistent with the observed high 15 µm emissions.

3.2. Low Laboratory-Measured k O for Calculating the CO2 Cooling

We examined the available laboratory investigations of the O(3P) + CO2 energy transfer, summarized by Feofilov et al. [19], to address potential bias of the low rate coefficient k O obtained in these studies. Overall, the measurements by several groups have provided consistent results. Despite the challenging nature of such experimental studies, there is no obvious indication of artifacts and potential bias in the results. Two experiments by different groups addressed the temperature dependence of the rate coefficient and found it rather weak. Shved et al. [56] extended the method [57] and determined that k O was slowly decreasing from ( 1.56 ± 0.2 ) to ( 1.4 ± 0.2 ) × 10 12   s 1 cm 3 , while the temperature increased from 200 to 360 K, which was consistent with Shved et al. [57]’s earlier result. Castle et al. [58] performed the most recent laboratory studies on the vibrational relaxation of CO2(010) by O(3P) atoms and reported results for the 142–490 K temperature range, which is relevant to the 75–120 km altitude region of the terrestrial atmosphere. This study also found weak, negative temperature dependence in this rate coefficient, with values ranging from ( 2.7 ± 0.4 ) × 10 12   s 1 cm 3 at 142 K to ( 1.3 ± 0.2 ) × 10 12   s 1 cm 3 at 490 K. Given the available information, it does not appear likely that the laboratory experiments underestimated the rate coefficient by a factor of 2 or more, in disagreement with the values used in GCMs or in the temperature retrievals.
Based on this analysis, we used in our new model the laboratory values of k O to calculate the true 15 µm CO2 radiative cooling.
Most of the calculations reported in Section 4 use the rate coefficient k O = 1.5 × 10 12   s 1 cm 3 , which corresponds to the value reported at 200 K by Shved et al. [56]. This value may be considered as the minimum experimental value anticipated at 200 K. An upper limit value (1- σ ) of the rate coefficient at this temperature based on the study of Castle et al. [58] would be 2.5 × 10 12   s 1 cm 3 . This value is also used in our calculations to demonstrate the variation in the true cooling depending on the k O .

3.3. The Model Performance

Summarizing the discussion above, we propose a new 15 µm cooling model which uses two values of the k O coefficient: (a) the high value k O = 6.0 × 10 12   s 1 cm 3 derived from the space observations of the 15 µm emission, which is used to calculate the CO2 vibrational level populations, constrained by the radiation; and (b) the low, laboratory-confirmed k O = 1.5 × 10 12   s 1 cm 3 , which is used to calculate the 15 µm cooling of the MLT using constrained populations.
We illustrate how this model works with Equations (10) and (17). Equation (10) expresses the standard non-LTE model for the fundamental band of the main CO2 isotope in the MLT. Let us solve it with the rate coefficients C calculated using k O = 6.0 × 10 12   s 1 cm 3 . To do this, we must add to this equation the conservation equation
n C O 2 n 1 + n 2 ,
where n C O 2 is the total CO2 density, which is valid in MLT. With this solution, we obtain the populations n 1 and n 2 , which are consistent with the observed strong emission of this band. We now substitute these populations into (17), where the rate coefficients C have been calculated using the low value k O = 1.5 × 10 12   s 1 cm 3 . Since these rates define the actual exchange of energy between the radiative field and the atmospheric heat, we then obtain the true cooling of the atmosphere in the fundamental CO2 15 µm band.

3.4. Modification of the ALI-ARMS Code

Calculations presented in the next section are performed using the ALI-ARMS code [10,37] and the non-LTE reference model in CO2 described by Kutepov and Feofilov [18] following the new approach defined above.
ALI-ARMS rigorously solves the non-LTE problems by accounting for the stimulated emission terms both in the RTE and SSE (dropped off for simplicity in Equations (2), (3), and (10) above), which are ignored in most of the other codes (e.g., Funke et al. [38]). The code produces the non-LTE populations as the key product. The populations are then used for calculating the outgoing radiation and the cooling.
For the cooling calculations, according to the new approach described above, the ALI-ARMS code was slightly modified. In the steady-state equations for the CO2 vibrational states accounted, the terms n v C v , v and n v C v , v describe the transition of the CO2 molecules from the vibrational level v to level v and vice versa, which are induced by inelastic collisions of CO2 molecules with N2 and O2 molecules and O(3P) atoms, with total rate coefficients C v , v and C v , v .
The modified code works as follows. In the first step, the code solves the non-LTE problem as usual when all rate coefficients are calculated with k O = 6.0 × 10 12   s 1 cm 3 and the populations of all vibrational levels are obtained. Then, in the new second step, the rate coefficients C v , v and C v , v are recalculated using k O = 1.5 × 10 12   s 1 cm 3 , and the true cooling for each transition v v is calculated as performed above for the fundamental band in (17). The total true CO2 cooling is obtained by summing the contributions of each transition.

4. Calculation Results and Discussion

In this section, we present the results of the 15 µm cooling calculations using the revised cooling model described in the previous section. We used as input five typical atmospheric scenarios, described in detail by Feofilov and Kutepov [10] in Section 2.4, into the ALI-ARMS code. Figure 1 shows the temperature profiles used in the study. These profiles cover most of the situations that are observed in the atmosphere, unperturbed by gravity waves. In the following, we use the abbreviations for these atmospheric models: SAW for subarctic winter, MLW for mid-latitude winter, TROP for the tropical atmosphere, MLS for mid-latitude summer, and SAS for subarctic summer.
The calculations presented below in Section 4.1, Section 4.2, Section 4.3 and Section 4.4 correspond to the nighttime conditions. To avoid overloading the paper, we do not show the results of the daytime calculations, since they are only slightly different from the nighttime results. We address these differences in Section 4.5.

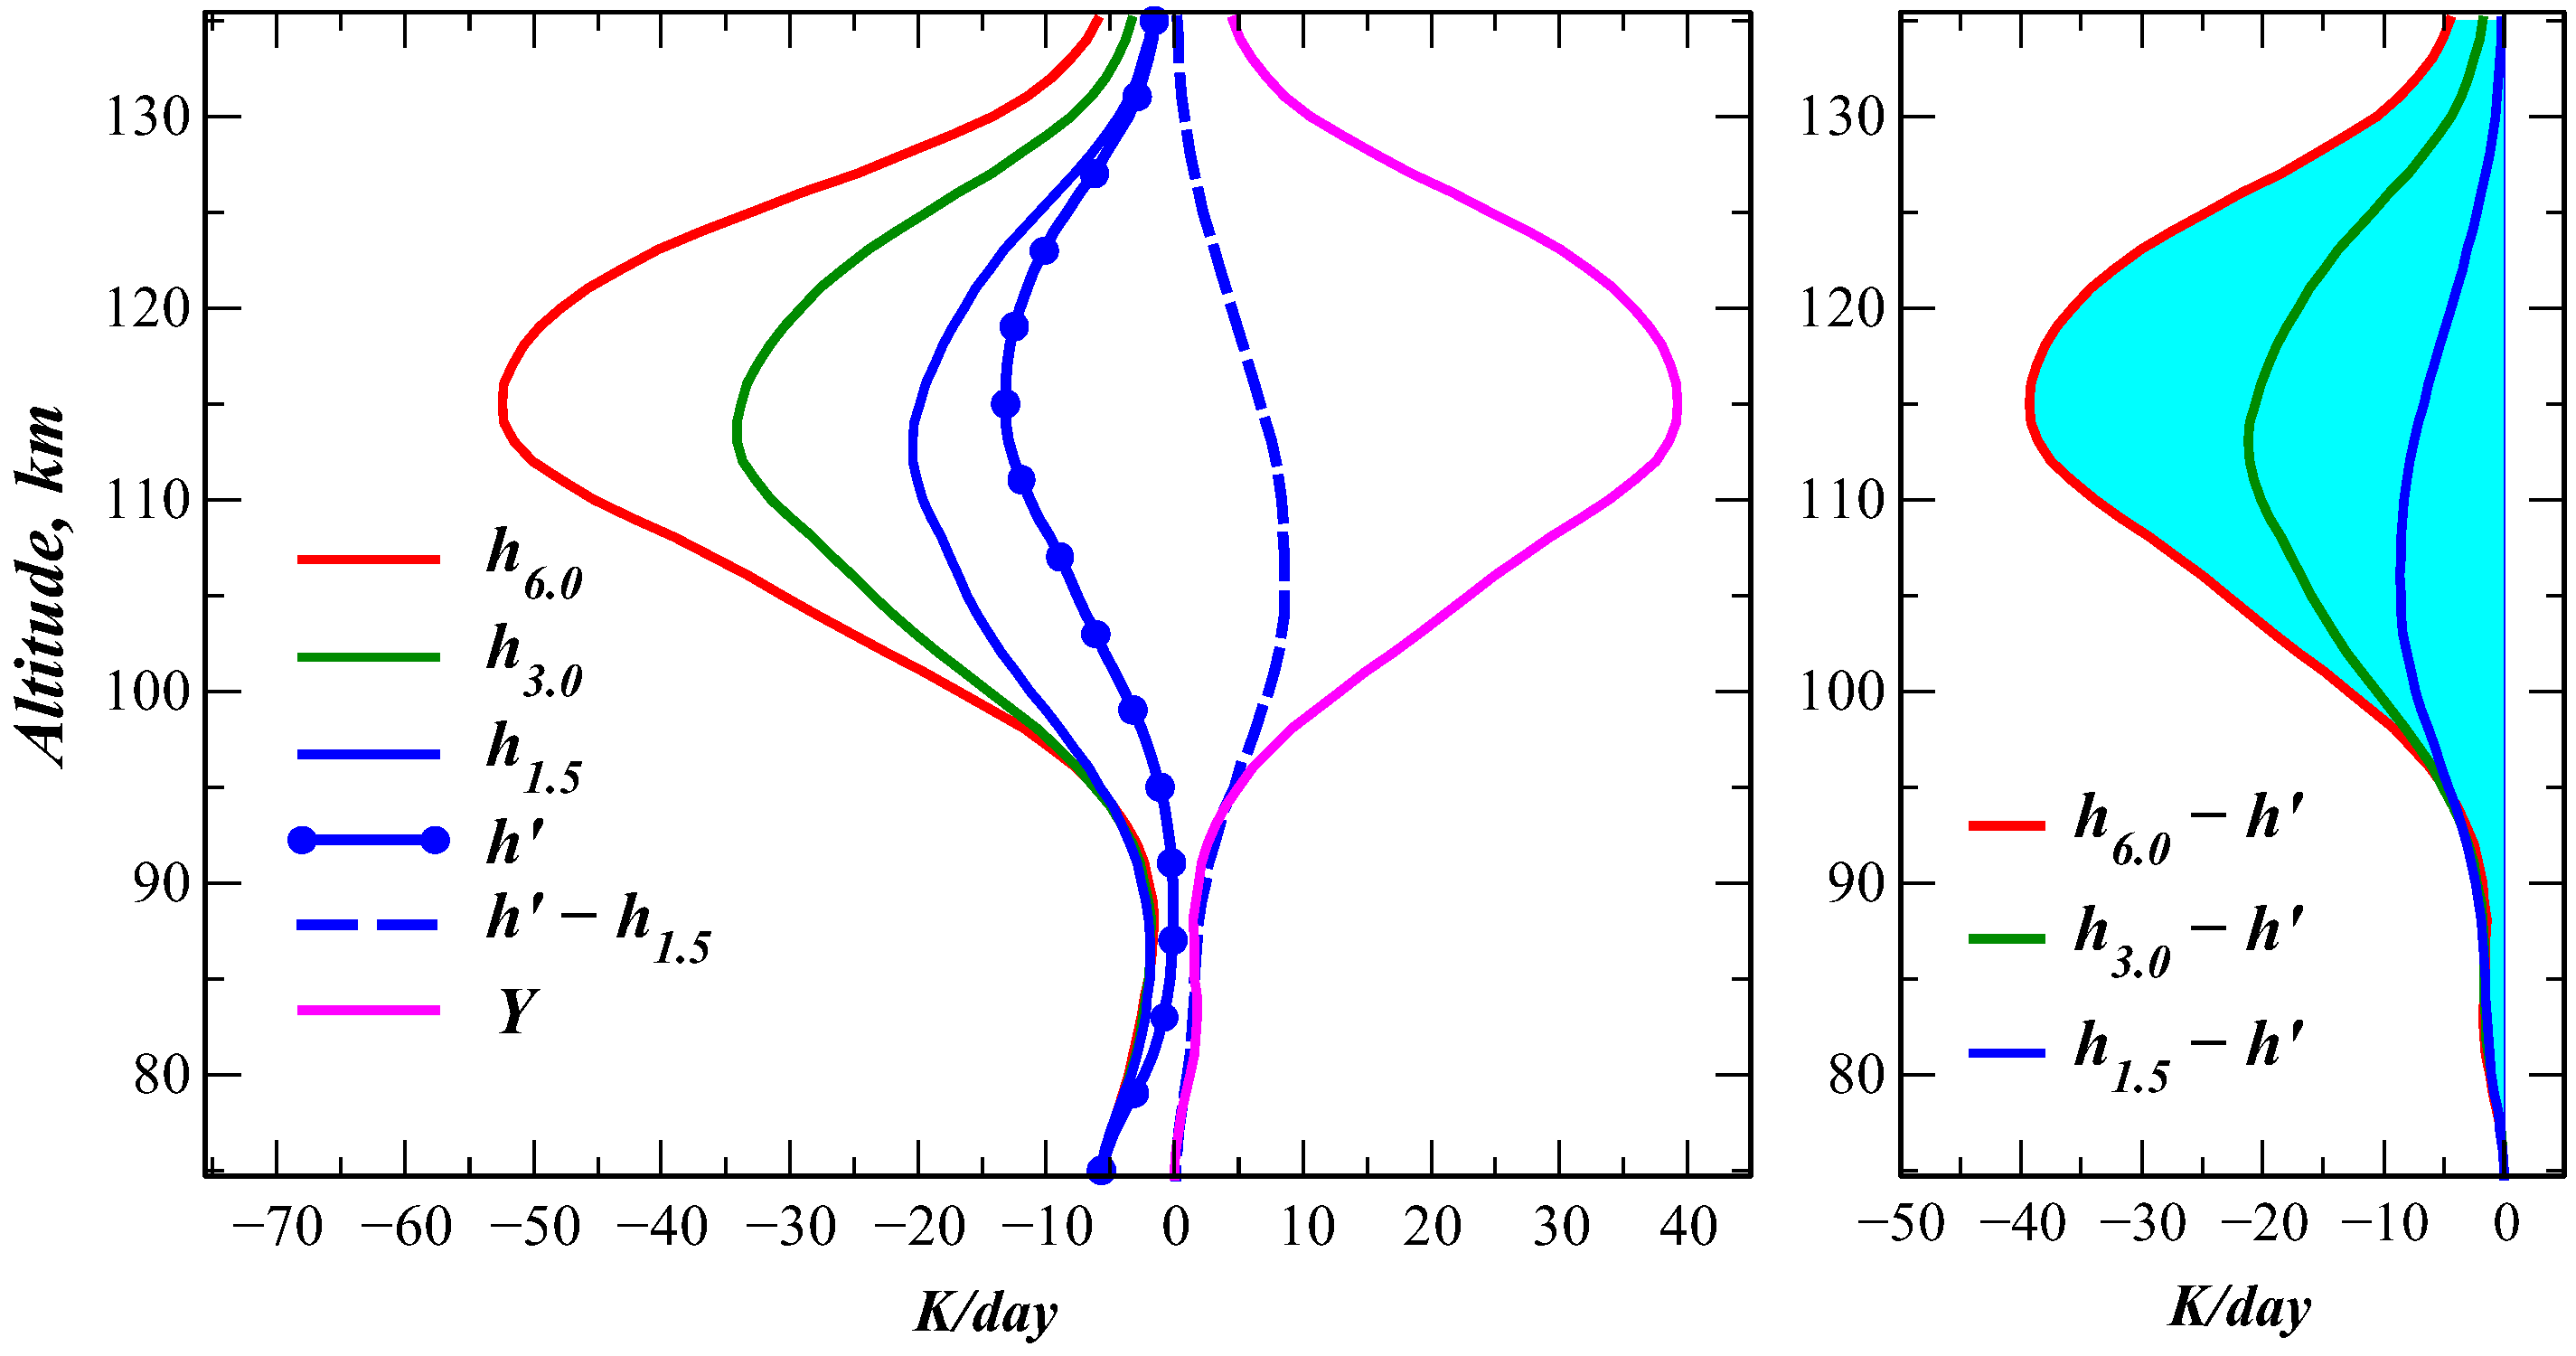
4.1. True Cooling for the Lower Limit of the Laboratory-Confirmed Value k O = 1.5 × 10 12   s 1 cm 3

In order to simplify the discussion below, we introduce two notations: The single-rate run, which corresponds to the normal ALI-ARMS code run when a single rate coefficient value from the range k O = (1.5–6.0) × 10 12   s 1 cm 3 is used to calculate both vibrational level populations and cooling rates. The second notation is the two-rate run, which corresponds to the run of the modified code version as described in the last paragraph of Section 5, where k O = 6.0 × 10 12   s 1 cm 3 is first applied for calculating the vibrational level populations, and then k O = 1.5 × 10 12   s 1 cm 3 is applied for calculations of cooling.
In the left panel of Figure 2, we show the CO2 15 µm cooling for the mid-latitude summer atmosphere. h in this panel were obtained in single-rate runs for k O = (1.5–6.0) × 10 12   s 1 cm 3 . h (true CO2 15 µm cooling) in this panel is the cooling obtained in the two-rate run. Y in this panel is the term from (15), calculated according to (16) as the difference h h 6.0 between the true cooling h and the radiative flux divergence. It quantifies the total effect of the mechanisms that can pump this level in addition to the excitation caused by collisions with the O(3P) atoms obeying the lab-confirmed rate coefficient.
In the right panel of Figure 2, the differences (excess cooling) between the single-rate run cooling h for three values k O and the true cooling h are presented.
In Figure 3, Figure 4, Figure 5 and Figure 6, the calculation results for the four other atmospheric scenarios are shown.

4.2. New Heating Source of MLT

Attention should be brought to an important new feature as shown in the left panels of Figure 2, Figure 3, Figure 4, Figure 5 and Figure 6. For all scenarios considered here, the true cooling h obtained in the two-rate runs is significantly lower than the cooling h 1.5 of the one-rate runs for the lower limit rate coefficient k O = 1.5 × 10 12   s 1 cm 3 . It is worth recalling here that the true cooling h is obtained using the same low rate coefficient confirmed in the laboratory.
This new and interesting effect is explained as following. In the standard one-rate run for the low rate coefficient, Equation (10),
d n 2 d t = n 1 B 12 J A 21 n 2 + C 12 n 1 C 21 n 2 = 0 ,
is solved together with the conservation of Equation (18) with the coefficients C 12 and C 21 calculated using this low rate coefficient. Let us notify this solution as n 1 1.5 and n 2 1.5 . Following (13), the cooling in this case is
h 1.5 = C 21 n 2 1.5 C 12 n 1 1.5 .
Subtracting this expression from (13), we get
h h 1.5 = C 21 ( n 2 n 2 1.5 ) C 12 ( n 1 1.5 n 1 ) ( n 2 n 2 1.5 ) C 21 ,
where we accounted for n 2 n 2 1.5 = ( n 1 1.5 n 1 ) and C 21 C 12 , which follow from (18) and the detailed balance relation (12), respectively. n 2 obtained for large k O = 6.0 × 10 12   s 1 cm 3 , which simulates the contribution of additional excitation sources, is larger than n 2 1.5 . Therefore, h h 1.5 in this region is positive, showing how much of this additional excitation energy is converted into heat. We see this in the left panels of Figure 2, Figure 3, Figure 4, Figure 5 and Figure 6. We note that the strongest heating h h (∼10 K/Day) is observed in the mesosphere region at altitudes around 100 km, which is very sensitive to even small changes in the energy balance (e.g., [59]).

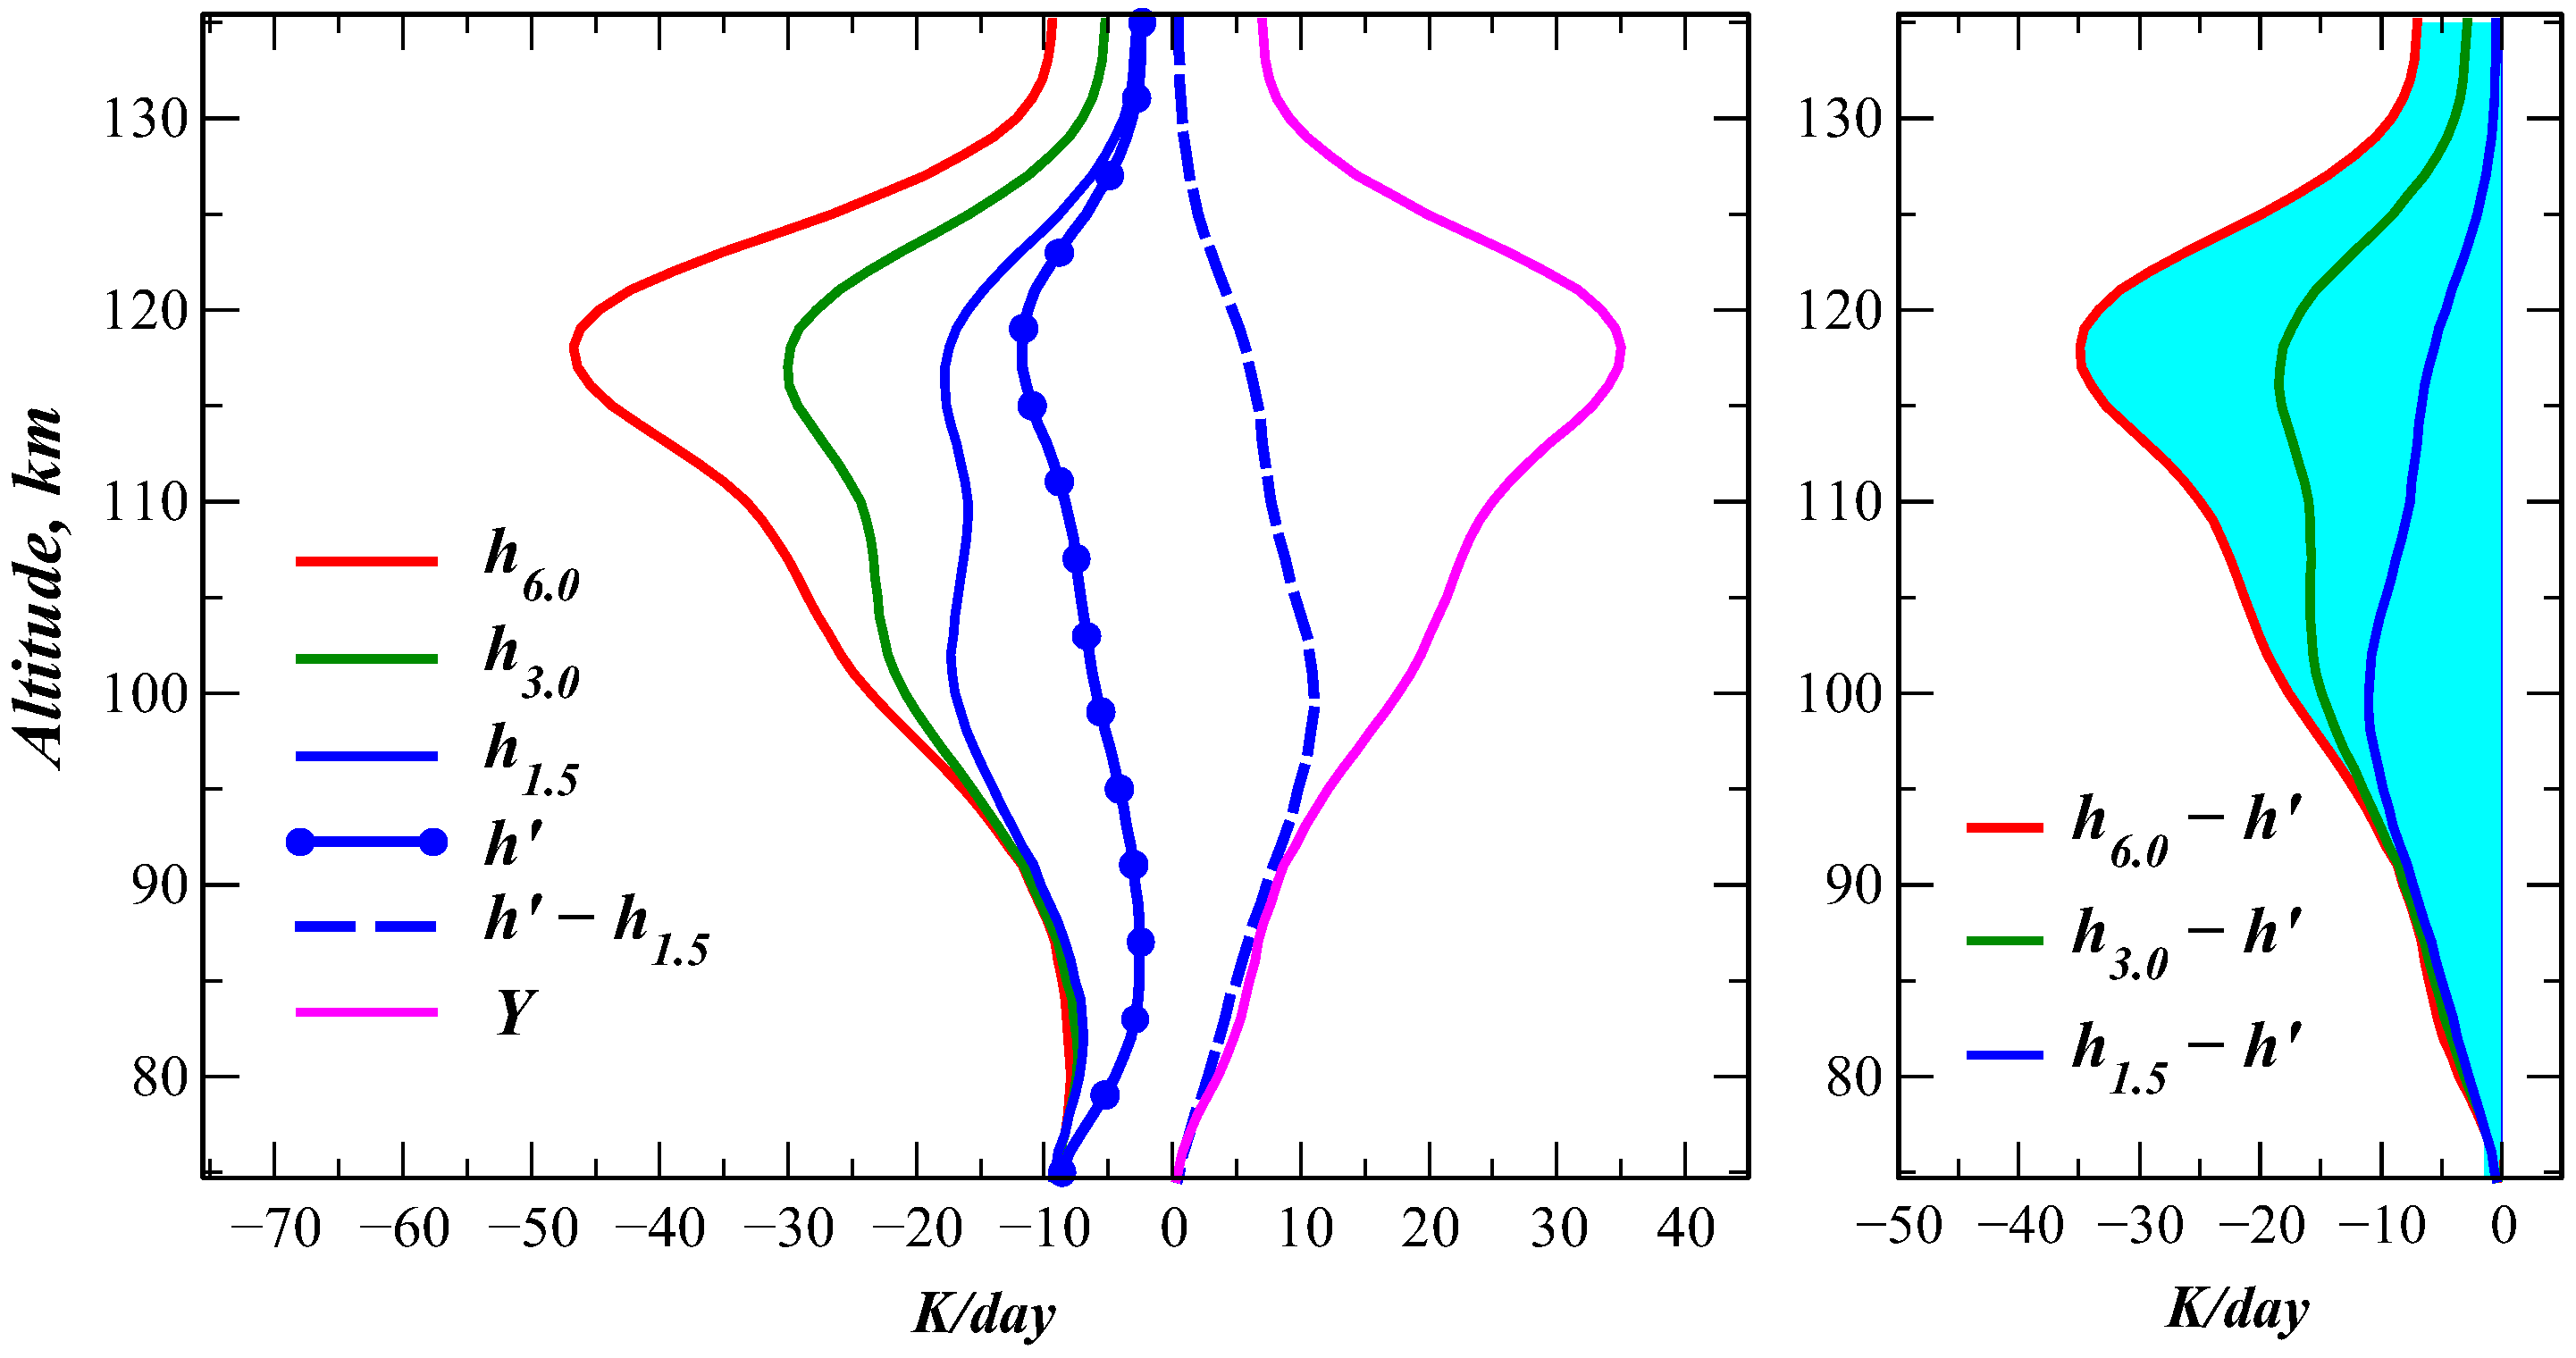
4.3. The Excess Cooling

The right panels of Figure 2, Figure 3, Figure 4, Figure 5 and Figure 6 demonstrate how much the standard one-rate CO2 15 µm cooling models, which use k O = (1.5–6.0) × 10 12   s 1 cm 3 , overestimate the CO2 15 µm cooling of MLT compared to the new two-rate model. As we already mentioned above even for the lowest rate coefficient k O , the true cooling is almost twice as low as the standard model, with the excess cooling reaching up to 10 K/day. For higher values of k O applied in the single-rate runs, this excess cooling increases dramatically. For instance, for the rate coefficient k O = 3.0 × 10 12   s 1 cm 3 , which is currently applied in all GCMs, this excess cooling reaches 30 K/day. Recently, López-Puertas et al. [17] recommended using k O = 6.0 × 10 12   s 1 cm 3 for estimating CO2 cooling in GCMs. Figure 2, Figure 3, Figure 4, Figure 5 and Figure 6 demonstrate that in this case, the excess cooling reaches large values of up to 60 K/day.

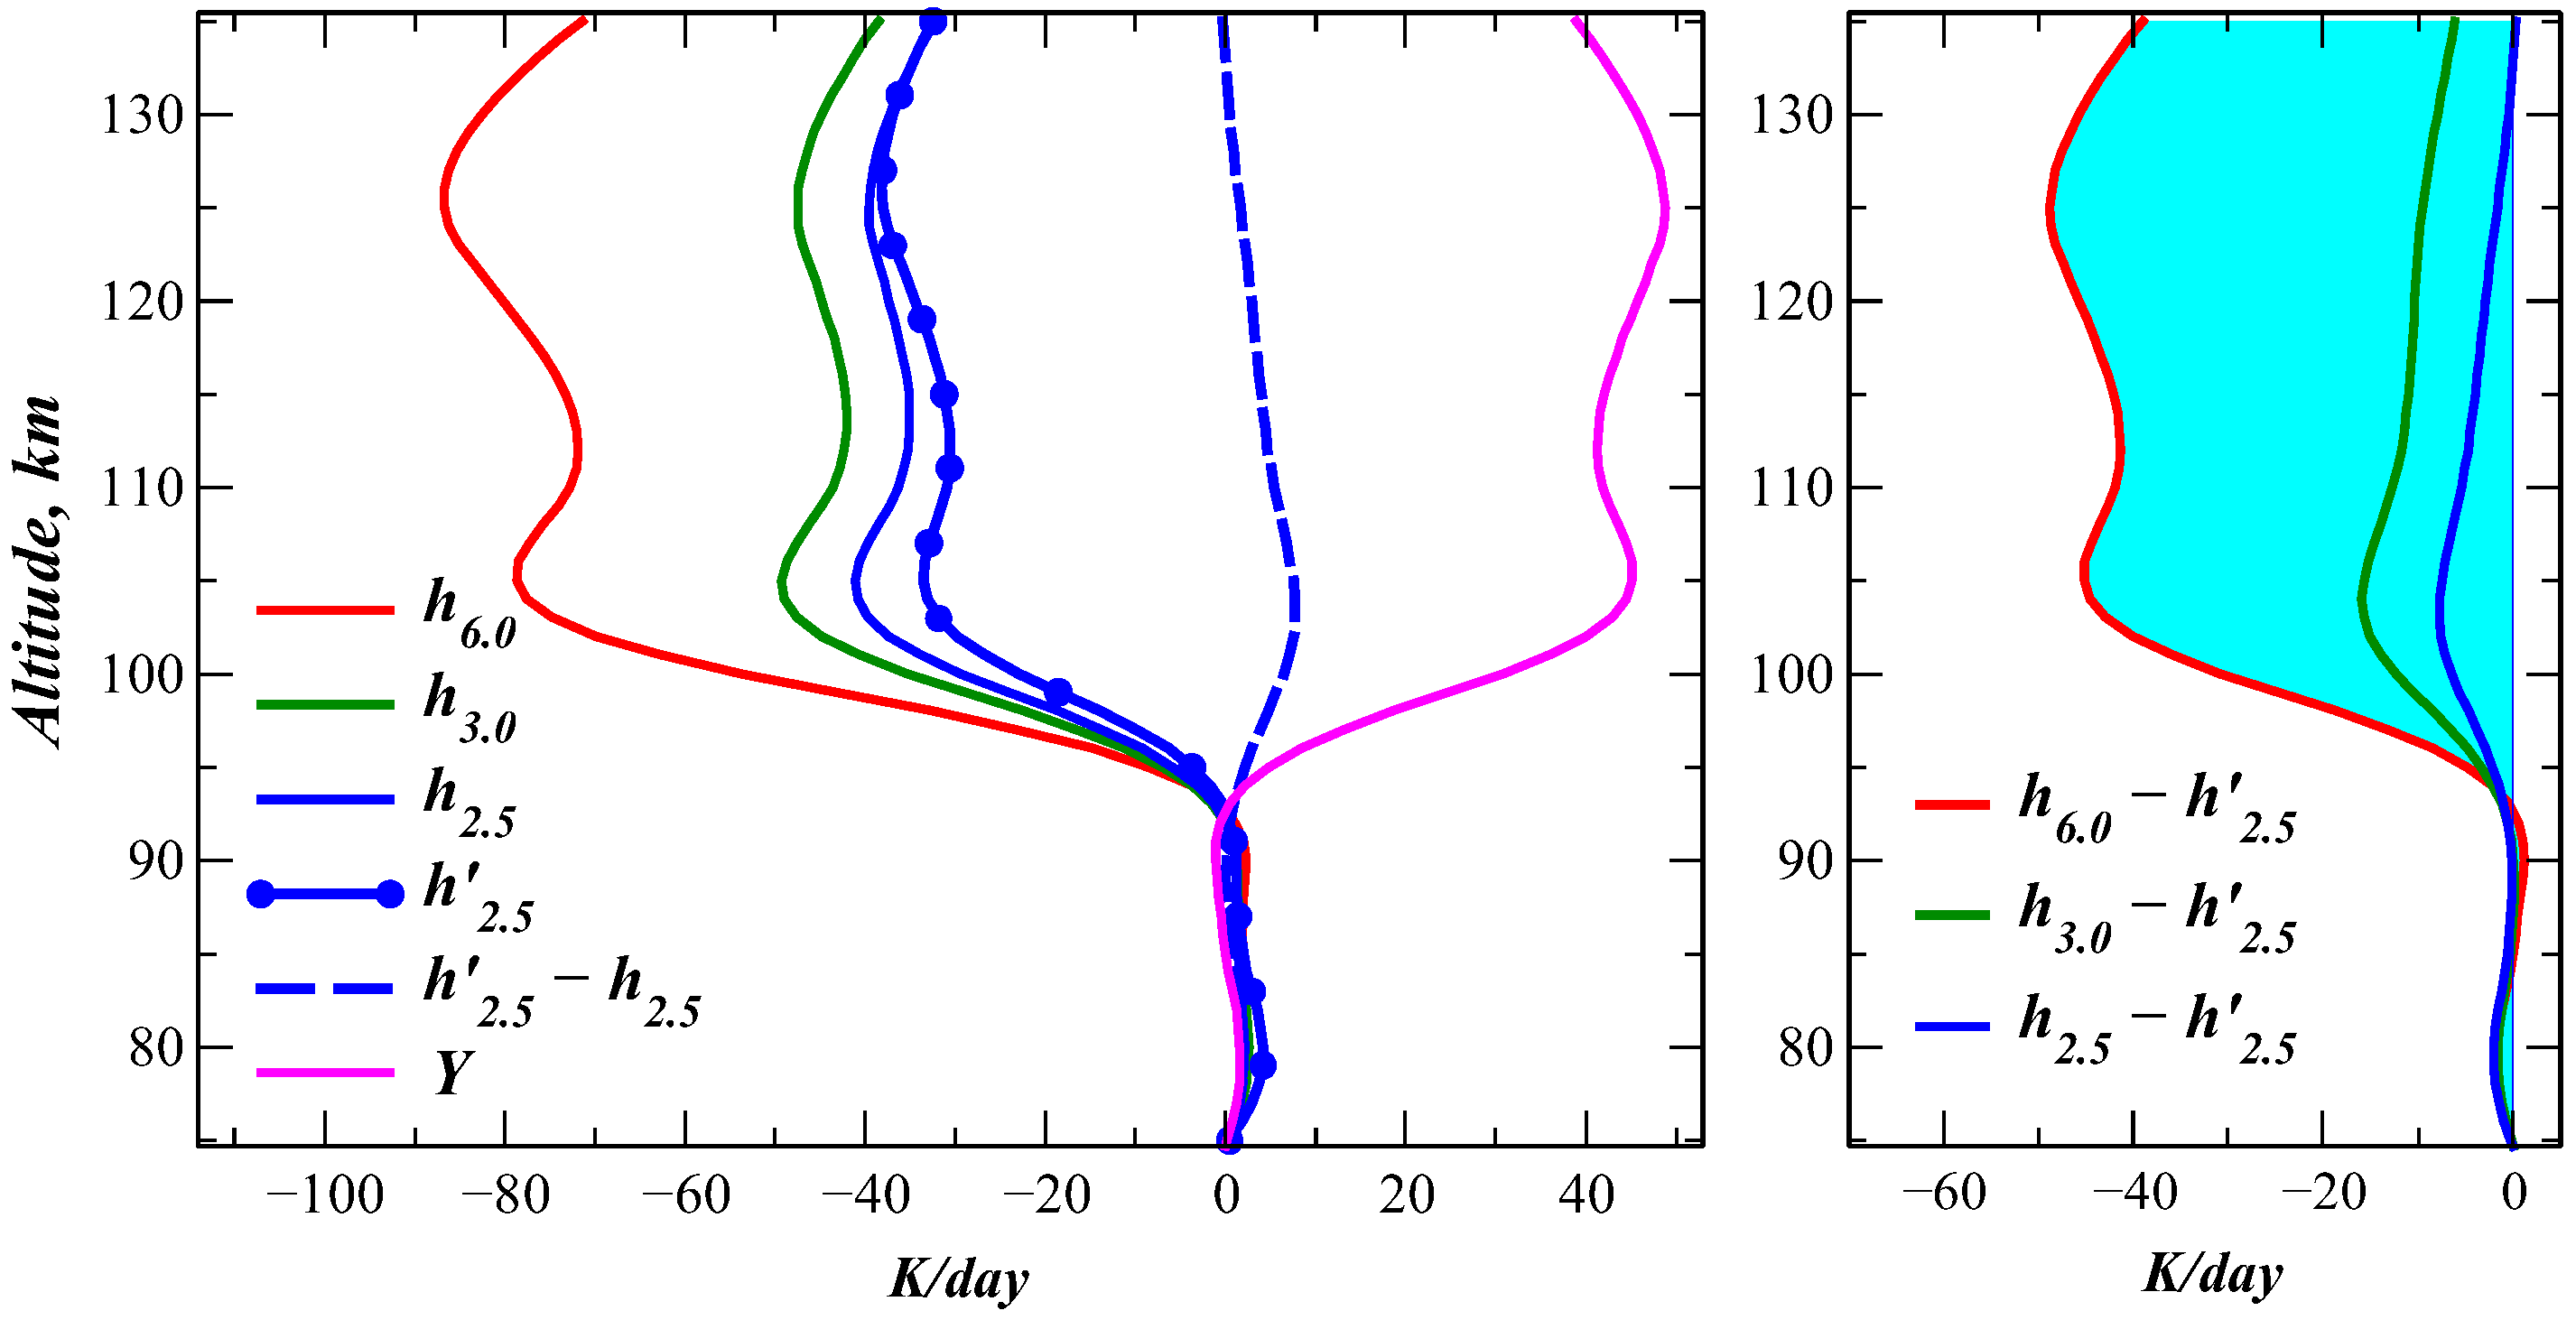
4.4. True Cooling for the Upper Limit of the Laboratory-Confirmed Value k O = 2.5 × 10 12   s 1 cm 3

In Figure 7 and Figure 8, we show the calculation results for k O = 2.5 × 10 12   s 1 cm 3 as an upper limit of the experimentally confirmed value of k O for 200 K.
Comparing the left panels of Figure 7 and Figure 8 for the MLW and SAS models with the left panels of Figure 4 and Figure 6 for the same models, we see that the true cooling h shows a moderate increase with increasing k O , reaching 5 K/day and 10 K/day for the MLW and SAS scenarios, respectively. Subsequently, the excess cooling shown in the right panels of Figure 7 and Figure 8 relative to the true cooling h decreases with increasing k O . Nevertheless, compared to the true cooling this excess cooling for the one-parameter run with k O = 2.5 × 10 12   s 1 cm 3 , remains significant, reaching 10 K/day. Also, similarly to h h 1.5 in the left panels of Figure 2, Figure 3, Figure 4, Figure 5 and Figure 6, the h h 2.5 in the left panels of Figure 7 and Figure 8 is positive.

4.5. The Accounting for the Absorption of the Solar Radiation

The calculations presented above in Section 4.1, Section 4.2, Section 4.3 and Section 4.4 correspond to the nighttime models.
During the day, the heating due to absorption of solar radiation in the CO2 bands around 1.0–4.3 µm represents a small reduction in the total CO2 cooling (up to about 2.0 K/day). It is calculated as as the difference between the total cooling for the day h * and the total cooling for the night h. The complex mechanisms of conversion of solar radiation energy absorbed by CO2 molecules into heat have been investigated in a number of studies. The most recent study on this topic was published by Ogibalov and Fomichev [60]. These authors calculated the solar heating for five atmospheric models similar to those used in our study, for solar zenith angles (SZAs) varying between 0° and 89°. They showed that this heating in the MLT is maximized for SZA = 0° and gradually decreases with increasing SZA. Finally, Ogibalov and Fomichev [60] compiled the lookup table of solar heating, which allows its quick estimation in GCMs for different SZAs and CO2 densities. This table is used as a daytime supplement to the [15,17] nighttime cooling parameterizations.
In Figure 9, we show the solar heating obtained in our calculations for the mid-latitude summer model for SZA = 0°. The heating in the standard non-LTE model for k O = (1.5–6.0) × 10 12   s 1 cm 3 was calculated as the difference between the total daytime cooling h * and the total nighttime cooling h. The heating in the new non-LTE model was calculated as the difference between the total true cooling h * for the day and the total true cooling h * for the night, both obtained in the two-parameter runs described in Section 3.3. We do not show the solar heating results for the other atmospheric models used in this study, as they are very similar to those in Figure 9.
It can be seen from Figure 9 that the solar heating calculated in the standard non-LTE model has two local maxima of about 2 K/day and about 1.7 K/day at altitudes of about 88 km and 74 km, respectively, and varies slightly with k O . It almost reproduces the heating for the same model obtained in [60]. However, the profile of solar heating in the new model is very different from that of the standard models. It has the same local maxima, but the maximum at 88 km is almost twice lower (about 1.2 K/day) than on the curves for the standard model. This is the result of the lower efficiency of the transformation of the absorbed solar energy into heat in the new model.
Finally, we can see that daytime solar heating causes only a small reduction in the total CO2 cooling for the nighttime conditions discussed above in Section 4.1, Section 4.2, Section 4.3 and Section 4.4. Therefore, taking into account the absorption of solar radiation does not change the main conclusions we reached by analyzing the nighttime data.

5. Practical Application of the New the 15 µm Cooling Model

The calculations presented in this paper were performed using our exact non-LTE ALI-ARMS research code as described above in Section 3.4.
But what about using the new two-parameter model to calculate the 15 µm cooling in the GCMs? The routines for calculating the 15 µm cooling in GCMs that use variable k O can be divided into three types: (1) Full matrix procedures covering both the upper non-LTE and lower LTE layers (e.g., [12]). (2) Combined procedures that use matrices for the lower layers, the approximate formula for h derived by Kutepov [11] for the upper non-LTE layers, and some parametric expressions that link “up” and “bottom”. The first procedure of this type was proposed by Kutepov and Fomichev [13] and Fomichev et al. [14]. It was then twice updated later, first by Fomichev et al. [15] and recently again by López-Puertas et al. [17]. Finally, (3) optimized accurate non-LTE code. The first version of routine of this type based on the optimized version of the ALI-ARMS code was developed for the Martian GCM [16]. Its revised version for the Earth’s atmosphere was recently released by Kutepov and Feofilov [18].
Type 1 and Type 2 parameterizations calculate directly the 15 µm cooling without prior population calculations. They are optimized by adjusting the fitting parameters so that the cooling has a minimum error when compared to accurate reference calculations. They cannot be directly used for the two-parameter cooling calculations.
Additionally, we note that the nighttime CO2 cooling parameterizations by Fomichev et al. [15] and López-Puertas et al. [17] use the solar heating lookup table calculated by Ogibalov and Fomichev [60] using the standard non-LTE model for daytime as a supplement. This heating, however, significantly differs for the heating obtained in the new two-rate model (see Section 4.5).
In comparison, the routine of Kutepov and Feofilov [18] for calculating both day and night 15 µm cooling in GCMs is based on the optimized ALI-ARMS code version. It calculates the non-LTE populations first, and then the populations are used to calculate the cooling. Therefore, it requires only a minor modification, described in the Section 3.4, to be used for the two-parameter calculations of the true CO2 cooling in the GCMS.
However, is it possible to simulate the true CO2 cooling using the routines of Fomichev et al. [15] and López-Puertas et al. [17] with the properly selected values of the rate coefficient k O ?
We answer this question with the calculations presented in Figure 10. This figure shows a comparison of the ALI-ARMS two-parameter and one-parameter cooling calculations for our five atmospheric scenarios. It can be seen that, to bring the one-parameter calculations closer to the two-parameter results, it is necessary to use values of k O , which are much lower than its lab-confirmed minimum value. The single-parameter calculations in no way reproduce either the absolute values of true cooling or its altitude variations.

6. Conclusions

We presented a detailed analysis of current techniques and the non-LTE models used for retrieving pressures and temperatures from the 15 µm limb emission observations of MLT. We show that this emission rigorously constrains the 15 µm radiative flux divergence in the MLT, but not the 15 µm cooling. Numerical demonstrations by Mlynczak et al. [20] of the 15 µm radiative flux divergence’s low sensitivity to variation in the non-LTE model parameters corroborate this theoretical fact.
Today, we find no reason to doubt the following two important observational results: (a) the strong atmospheric 15 µm emission of the MLT observed from space, and (b) the low laboratory-measured rate coefficient k O (1.5–2.5) × 10 12   s 1 cm 3 for the CO2-O(3P) quenching process.
The current non-LTE models in CO2 contradict these observational facts: the use of the high rate coefficient k O = 6.0 × 10 12   s 1 cm 3 to fit the strong 15 µm measured signals contradicts laboratory measurements of this coefficient; the use of the low laboratory-measured rate coefficient contradicts atmospheric observations; and the use of the median k O = 3.0 × 10 12   s 1 cm 3 , as all GCM users currently do, contradicts both simultaneously.
The apparent solution to this quandary is that both atmospheric observations and laboratory studies are overall reliable, but not all sources of the CO2 vibrational excitation are accounted for in the current non-LTE models. New theoretical and laboratory studies are needed to find and explain the sources of the additional non-thermal excitation of vibrations of the CO2 molecules in the MLT. Such work may require additional decades of research. However, after nearly 50 years, we believe that an important step can now be taken that will allow us to take advantage of our current knowledge of the 15 µm emission and use it to improve the modeling of the current MLT and its expected future changes.
We have proposed a new model of the non-LTE 15 µm cooling of the MLT, which is constrained by, and is in agreement with, the observational facts discussed above. It simultaneously uses two different values of the rate coefficient k O for the CO2+O(3P) process: first, the large rate coefficient is used to calculate the non-LTE populations of the CO2 vibrational levels that are in agreement with the space-observed 15 µm emission; second, the small laboratory-confirmed rate coefficient is applied to these populations to obtain the energy exchange between the 15 µm radiation and the atmospheric heat reservoir—the true CO2 radiative cooling of the MLT.
We have applied the new model to calculate the CO2 radiative cooling of the MLT for the five atmospheric scenarios that cover most of the situations observed in the atmosphere. These calculations demonstrate very strong differences between the cooling obtained with the standard CO2 15 µm non-LTE models and that obtained when the new model presented in this study is applied. The main conclusion from this comparison is that the standard non-LTE models strongly overestimate the total CO2 15 µm cooling of the MLT. Even for the smallest rate coefficient k O , the cooling obtained with the standard model is almost twice larger that of the new model. This is already a striking difference, but for higher values of k O , the overestimation of cooling increases dramatically. For instance, for the rate coefficient k O = 3.0 × 10 12   s 1 cm 3 , which is currently applied in all GCMs, this excess cooling can exceed 30 K/day. For k O = 6.0 × 10 12   s 1 cm 3 , which is recommended by López-Puertas et al. [17] in the revised version of the [15] routine, this excess cooling reaches large values of up to 60 K/day.
Our calculations also show the additional heating in the MLT, resulting from the collisional assimilation into the heat of a fraction of the CO2 ( ν 2 ) vibrational energy associated with an additional pumping mechanism of the CO2( ν 2 ) vibrations, so far unknown and not yet quantified in the laboratory measurements or theoretical calculations. The strongest additional heating of ∼10 K/day is observed in the mesosphere at altitudes around 100 km, a region which is very sensitive to any changes in the energy balance.
The main part of the calculations reported in Section 4 used the rate coefficient k O = 1.5 × 10 12   s 1 cm 3 , which may be considered as the minimum experimental value anticipated at 200 K (see discussion in Section 3.2). In Section 4.4, we also show how much true cooling h varies if we apply in calculations k O = 2.5 × 10 12   s 1 cm 3 as an upper limit value of k O for this temperature. Although the true cooling increases and excess cooling decreases with increasing k O , these changes are, however, between low and moderate, and, therefore, do not influence the main conclusions of this study based on the calculation with the lower value k O = 1.5 × 10 12   s 1 cm 3 .
We note that the new model of the CO2 cooling proposed here, and the main results of its application that we demonstrate, remain generally valid even if new sources of excitation are found and quantified. This will only help to better explain the low cooling we found and to clarify the new mesospheric heating mechanism we observe in our calculations.
The results of our study cast serious doubt on the widespread belief that infrared emission of the 15 µm CO2 is the primary cooling mechanism of the middle and upper atmospheres of Earth, Venus, and Mars (e.g., [5,6,7,8,9,10]). This must stimulate the search for other possible cooling mechanisms that could compensate for the strongly reduced 15 µm emission we observed. One promising candidate is dynamical cooling by dissipating and/or breaking gravity waves (GWs). According to the mechanism first described by Walterscheid [61], such waves induce a downward sensible heat flux, the divergence of which results in large cooling rates (per unit mass) at and above the levels with the largest amplitudes and a relatively weak heating below. Medvedev and Klaassen [62] quantified this mechanism, and Yiǧit and Medvedev [63] explored it using a comprehensive Coupled Middle-Atmosphere-Thermosphere-2 (CMAT2) GCM extending from the tropopause to the F2 region. Cooling by GWs was shown to be the second strongest mechanism (after molecular heat conduction) for removing heat from the thermosphere. In the MLT, where GW breaking/saturation is particularly intense, the associated net cooling rates are on the order of several tens of K/day (see Figure 2b in [63]), which is remarkably consistent with the “missing” cooling due to CO2 we observe in our new model. In particular, this figure shows that between 100 and 130 km, the wave-induced cooling rates reach 60 K/day in the winter polar region and vary with latitude between 10 and 30 K/day.
The application of the new 15 µm cooling model will have a strong impact on modeling the current MLT as well as lead to reducing its future changes due to the increasing CO2 predicted by Akmaev and Fomichev [25], Laštovička et al. [26], Jonsson et al. [64], and Laštovička [32], as well as in many other similar studies. It will also influence the interpretation of the 15 µm emission observations from space and provide a new look at the role of the 15 µm emission in the middle and upper atmospheres of Mars and Venus, and in the studies of terrestrial exoplanets (e.g., [65] and references therein).

Author Contributions

Conceptualization: A.K.; investigation: A.K., A.F. and K.S.K.; methodology: A.K., A.F. and L.R.; software: A.F. and L.R.; writing—original draft: A.K., A.F., L.R. and K.S.K. All authors have read and agreed to the published version of the manuscript.

Funding

This research was funded by the US National Science Foundation grants AGS-2312191/92 and AGS-2125760, and by the NASA grant 80NSSC21K0664.

Data Availability Statement

The original contributions presented in this study are included in the article. Further inquiries can be directed to the corresponding author.

Acknowledgments

A.K., A.F., and L.R. would like to express their deep gratitude to Richard Goldberg (†2019), the former NASA GSFC Project Scientist for the NASA TIMED mission, and James Russell III, the former PI of the TIMED SABER instrument, who gave them the opportunity to work on the analysis of the TIMED SABER observations and who was always interested in new scientific concepts and methods to be used in this analysis. The authors also thank Alexander Medvedev for his lively interest in this work. A.M. also drew the attention of the authors to the significant cooling of the MLT due to gravity wave activity and contributed to a relevant paragraph on this subject.

Conflicts of Interest

The authors declare no conflicts of interest.

Abbreviations

The following abbreviations are used in this manuscript:
ALI-ARMSAccelerated lambda iteration for atmospheric radiation and molecular spectra research code
CMAT2Coupled middle-atmosphere-thermosphere-2 GCM
CO2Carbon dioxide
GSFCGoddard Space Flight Center
GCMGeneral circulation model
KKelvin degrees
MLSMid-latitude summer atmosphere
MLTMesosphere and lower thermosphere
MLWMid-latitude winter atmosphere
NASANational Atmospheric and Space Administration
Non-LTENon-local thermodynamic equilibrium
[NN]Density of the molecular or atomic atmospheric component NN
N2Molecular nitrogen
O2Molecular oxygen
O(3P)Atom of oxygen in the ground state 3P
RTRotational–translational energy transfer
RTERadiative transfer equation
SABERSounding of the atmosphere using broadband emission radiometry instrument on board of TIMED
SASSubarctic summer atmosphere
SAWSubarctic winter atmosphere
TIMEDNASA’s Thermosphere Ionosphere Mesosphere Energetics Dynamics satellite
TROPtropical atmosphere
VTVibrational–translational energy transfer
VVVibrational–vibrational energy transfer
83°NLatitude 83 degrees north of the Equator

References

  1. Crutzen, P.J. Discussion of paper “Absorption and emission by carbon dioxide in the atmosphere” by J. T. Houghton. Q. J. R. Meteorol. Soc. 1970, 96, 767–770. [Google Scholar] [CrossRef]
  2. Offermann, D.; Grossmann, K.U.; Barthol, P.; Knieling, P.; Riese, M.; Trant, R. Cryogenic Infrared Spectrometers and Telescopes for the Atmosphere (CRISTA) experiment and middle atmosphere variability. J. Geophys. Res. 1999, 104, 16311–16326. [Google Scholar] [CrossRef]
  3. Russell, J.M.; Mlynczak, M.G.; Gordley, L.L.; Tansock, J.J.; Esplin, R.W. Overview of the SABER experiment and preliminary calibration results. In Proceedings of the Optical Spectroscopic Techniques and Instrumentation for Atmospheric and Space Research III; Society of Photo-Optical Instrumentation Engineers (SPIE) Conference Series; Larar, A.M., Ed.; SPIE: Bellingham, WA, USA, 1999; Volume 3756, pp. 277–288. [Google Scholar] [CrossRef]
  4. Fischer, H.; Birk, M.; Blom, C.; Carli, B.; Carlotti, M.; von Clarmann, T.; Delbouille, L.; Dudhia, A.; Ehhalt, D.; Endemann, M.; et al. MIPAS: An instrument for atmospheric and climate research. Atmos. Chem. Phys. 2008, 8, 2151–2188. [Google Scholar] [CrossRef]
  5. Goody, R.M.; Yung, Y.L. Atmospheric Radiation: Theoretical Basis, 2nd ed.; Oxford University Press: Oxford, UK, 1995. [Google Scholar]
  6. Sharma, R.D.; Wintersteiner, P.P. Role of carbon dioxide in cooling planetary thermospheres. Geophys. Res. Lett. 1990, 17, 2201–2204. [Google Scholar] [CrossRef]
  7. Pollock, D.S.; Scott, G.B.I.; Phillips, L.F. Rate constant for quenching of CO2(010) by atomic oxygen. Geophys. Res. Lett. 1993, 20, 727–729. [Google Scholar] [CrossRef]
  8. Bougher, S.W.; Hunten, D.M.; Roble, R.G. CO2 cooling in terrestrial planet thermospheres. J. Geophys. Res. 1994, 99, 14609–14622. [Google Scholar] [CrossRef]
  9. Lopez-Puertas, M.; Taylor, F.W. Non–LTE Radiative Transfer in the Atmosphere; World Scientific: Singapore, 2001; ISBN 9810245661. [Google Scholar] [CrossRef]
  10. Feofilov, A.G.; Kutepov, A.A. Infrared Radiation in the Mesosphere and Lower Thermosphere: Energetic Effects and Remote Sensing. Surv. Geophys. 2012, 33, 1231–1280. [Google Scholar] [CrossRef]
  11. Kutepov, A.A. Parametrization of the radiant energy influx in the CO2 15 microns band for Earth’s atmosphere in the spoilage layer of local thermodynamic equilibrium. Akad. Nauk SSSR Fiz. Atmos. I Okeana 1978, 14, 216–218. [Google Scholar]
  12. Zhu, X. Carbon dioxide 15-micron band cooling rates in the upper middle atmosphere calculated by Curtis matrix interpolation. J. Atmos. Sci. 1990, 47, 755–774. [Google Scholar] [CrossRef]
  13. Kutepov, A.A.; Fomichev, V.I. Application of the second-order escape probability approximation to the solution of the NLTE vibration-rotational band radiative transfer problem. J. Atmos. Terr. Phys. 1993, 55, 1–6. [Google Scholar] [CrossRef]
  14. Fomichev, V.I.; Kutepov, A.A.; Akmaev, R.A.; Shved, G.M. Parameterization of the 15-micron CO2 band cooling in the middle atmosphere (15–115 km). J. Atmos. Terr. Phys. 1993, 55, 7–18. [Google Scholar] [CrossRef]
  15. Fomichev, V.I.; Blanchet, J.P.; Turner, D.S. Matrix parameterization of the 15 µm CO2 band cooling in the middle and upper atmosphere for variable CO2 concentration. J. Geophys. Res. Atmos. 1998, 103, 11505–11528. [Google Scholar] [CrossRef]
  16. Hartogh, P.; Medvedev, A.S.; Kuroda, T.; Saito, R.; Villanueva, G.; Feofilov, A.G.; Kutepov, A.A.; Berger, U. Description and climatology of a new general circulation model of the Martian atmosphere. J. Geophys. Res. (Planets) 2005, 110, E11008. [Google Scholar] [CrossRef]
  17. López-Puertas, M.; Fabiano, F.; Fomichev, V.; Funke, B.; Marsh, D.R. An improved and extended parameterization of the CO2 15 µm cooling in the middle/upper atmosphere (CO2_cool_fort-1.0). Goesci. Model Dev. 2024, 17, 4401–4432. [Google Scholar] [CrossRef]
  18. Kutepov, A.; Feofilov, A. New Routine NLTE15µmcool-E V1.0 For Calculating The Non-Local Thermodynamic Equilibrium (Non-LTE) CO2 15 µm Cooling in General Circulation Models (GCMs) of Earth’s Atmosphere. Geosci. Model Dev. 2024, 17, 5331–5347. [Google Scholar] [CrossRef]
  19. Feofilov, A.G.; Kutepov, A.A.; She, C.Y.; Smith, A.K.; Pesnell, W.D.; Goldberg, R.A. CO2(ν2)-O quenching rate coefficient derived from coincidental SABER/TIMED and Fort Collins lidar observations of the mesosphere and lower thermosphere. Atmos. Chem. Phys. 2012, 12, 9013–9023. [Google Scholar] [CrossRef]
  20. Mlynczak, M.G.; Hunt, L.A.; Thomas Marshall, B.; Martin-Torres, F.J.; Mertens, C.J.; Russell, J.M.; Remsberg, E.E.; López-Puertas, M.; Picard, R.; Winick, J.; et al. Observations of infrared radiative cooling in the thermosphere on daily to multiyear timescales from the TIMED/SABER instrument. J. Geophys. Res. (Space Phys.) 2010, 115, A03309. [Google Scholar] [CrossRef]
  21. Gusev, O.; Kaufmann, M.; Grossmann, K.U.; Schmidlin, F.J.; Shepherd, M.G. Atmospheric neutral temperature distribution at the mesopause altitude. J. Atmos. Sol.-Terr. Phys. 2006, 68, 1684–1697. [Google Scholar] [CrossRef]
  22. García-Comas, M.; López-Puertas, M.; Marshall, B.T.; Wintersteiner, P.P.; Funke, B.; Bermejo-Pantaleón, D.; Mertens, C.J.; Remsberg, E.E.; Gordley, L.L.; Mlynczak, M.G.; et al. Errors in Sounding of the Atmosphere using Broadband Emission Radiometry (SABER) kinetic temperature caused by non-local-thermodynamic-equilibrium model parameters. J. Geophys. Res. (Atmos.) 2008, 113, D24106. [Google Scholar] [CrossRef]
  23. García-Comas, M.; Funke, B.; López-Puertas, M.; Bermejo-Pantaleón, D.; Glatthor, N.; von Clarmann, T.; Stiller, G.; Grabowski, U.; Boone, C.D.; French, W.J.R.; et al. On the quality of MIPAS kinetic temperature in the middle atmosphere. Atmos. Chem. Phys. 2012, 12, 6009–6039. [Google Scholar] [CrossRef]
  24. Rezac, L.; Kutepov, A.; Russell, J.M.; Feofilov, A.G.; Yue, J.; Goldberg, R.A. Simultaneous retrieval of T(p) and CO2 VMR from two-channel non-LTE limb radiances and application to daytime SABER/TIMED measurements. J. Atmos. Sol.-Terr. Phys. 2015, 130, 23–42. [Google Scholar] [CrossRef]
  25. Akmaev, R.A.; Fomichev, V.I. Cooling of the mesosphere and lower thermosphere due to doubling of CO2. Ann. Geophys. 1998, 16, 1501–1512. [Google Scholar] [CrossRef]
  26. Laštovička, J.; Akmaev, R.A.; Beig, G.; Bremer, J.; Emmert, J.T.; Jacobi, C.; Jarvis, M.J.; Nedoluha, G.; Portnyagin, Y.I.; Ulich, T. Emerging pattern of global change in the upper atmosphere and ionosphere. Ann. Geophys. 2008, 26, 1255–1268. [Google Scholar] [CrossRef]
  27. Jackson, D.R.; Fuller-Rowell, T.J.; Griffin, D.J.; Griffith, M.J.; Kelly, C.W.; Marsh, D.R.; Walach, M.T. Future Directions for Whole Atmosphere Modeling: Developments in the Context of Space Weather. Space Weather 2019, 17, 1342–1350. [Google Scholar] [CrossRef]
  28. Garcia, R.R.; Yue, J.; Russell, J.M. Middle Atmosphere Temperature Trends in the Twentieth and Twenty-First Centuries Simulated With the Whole Atmosphere Community Climate Model (WACCM). J. Geophys. Res. (Space Phys.) 2019, 124, 7984–7993. [Google Scholar] [CrossRef]
  29. Jackson, D.R.; Bruinsma, S.; Negrin, S.; Stolle, C.; Budd, C.J.; Dominguez Gonzalez, R.; Down, E.; Griffin, D.J.; Griffith, M.J.; Kervalishvili, G.; et al. The Space Weather Atmosphere Models and Indices (SWAMI) project: Overview and first results. J. Space Weather Space Clim. 2020, 10, 18. [Google Scholar] [CrossRef]
  30. Wallis, S.; Schmidt, H.; von Savigny, C. Impact of a strong volcanic eruption on the summer middle atmosphere in UA-ICON simulations. Atmos. Chem. Phys. 2023, 23, 7001–7014. [Google Scholar] [CrossRef]
  31. McInerney, J.M.; Qian, L.; Liu, H.L.; Solomon, S.C.; Nossal, S.M. Climate Change in the Thermosphere and Ionosphere From the Early Twentieth Century to Early Twenty-First Century Simulated by the Whole Atmosphere Community Climate Model—eXtended. J. Geophys. Res. (Atmos.) 2024, 129, e2023JD039397. [Google Scholar] [CrossRef]
  32. Laštovička, J. Progress in investigating long-term trends in the mesosphere, thermosphere, and ionosphere. Atmos. Chem. Phys. 2023, 23, 5783–5800. [Google Scholar] [CrossRef]
  33. Lübken, F.J. Physics in the mesosphere/lower thermosphere: A personal perspective. Front. Astron. Space Sci. 2022, 9, 1000766. [Google Scholar] [CrossRef]
  34. Mlynczak, M.G.; Hunt, L.A.; Garcia, R.; Lopez-Puertas, M.; Mertens, C.J.; Nowak, N.; Marshall, B.T. Energy Conservation in the Cooling and Contracting Upper Mesosphere and Lower Thermosphere. Geophys. Res. Lett. 2024, 51, e2024GL109757. [Google Scholar] [CrossRef]
  35. Mlynczak, M.G.; Hunt, L.; Nowak, N.; Marshall, B.T.; Mertens, C.J. Infrared Radiation in the Thermosphere From 2002 to 2023. Geophys. Res. Lett. 2024, 51, e2024GL109470. [Google Scholar] [CrossRef]
  36. Ogibalov, V.P.; Kutepov, A.A.; Shved, G.M. Non-local thermodynamic equilibrium in CO2 in the middle atmosphere. II. Populations in the ν1ν2 mode manifold states. J. Atmos. Sol.-Terr. Phys. 1998, 60, 315–329. [Google Scholar] [CrossRef]
  37. Kutepov, A.A.; Gusev, O.A.; Ogibalov, V.P. Solution of the non-LTE problem for molecular gas in planetary atmospheres: Superiority of accelerated lambda iteration. J. Quant. Spectrosc. Radiat. Transf. 1998, 60, 199–220. [Google Scholar] [CrossRef]
  38. Funke, B.; López-Puertas, M.; García-Comas, M.; Kaufmann, M.; Höpfner, M.; Stiller, G.P. GRANADA: A Generic RAdiative traNsfer AnD non-LTE population algorithm. J. Quant. Spectrosc. Radiat. Transf. 2012, 113, 1771–1817. [Google Scholar] [CrossRef]
  39. Goody, R.M. Atmospheric Radiation. I. Theoretical Basis (Oxford Monographs on Meteorology); Clarendon Press, Oxford University Press: Oxford, UK, 1964. [Google Scholar]
  40. Ivanov, V.V. Transfer of Radiation in Spectral Lines; National Bureo of Standarts: Gaithersburg, MD, USA, 1973; Volume 385. [Google Scholar]
  41. Mihalas, D. Stellar Atmospheres; Freeman: San Francisco, CA, USA, 1978. [Google Scholar]
  42. Hubeny, I.; Mihalas, D. Theory of Stellar Atmospheres; Princeton University Press: Princeton, NJ, USA, 2015. [Google Scholar]
  43. Abbas, M.M.; Guo, J.; Conrath, B.J.; Kunde, V.G.; Maguire, W.C. Finite field of view effects on inversion of limb thermal emission observations. J. Geophys. Res. Atmos. 1985, 90, 3903–3909. [Google Scholar] [CrossRef]
  44. Bullitt, M.K.; Bakshi, P.M.; Picard, R.H.; Sharma, R.D. Numerical and analytical study of high-resolution limb spectral radiance from nonequilibrium atmospheres. J. Quant. Spectrosc. Radiat. Transf. 1985, 34, 33–53. [Google Scholar] [CrossRef]
  45. López-Puertas, M.; Rodrigo, R.; Molina, A.; Taylor, F.W. A non-LTE radiative transfer model for infrared bands in the middle atmosphere. I. Theoretical basis and application to CO2 15 µm bands. J. Atmos. Terr. Phys. 1986, 48, 729–748. [Google Scholar] [CrossRef]
  46. Lopez-Puertas, M.; Rodrigo, R.; Lopez-Moreno, J.J.; Taylor, F.W. A non-LTE radiative transfer model for infrared bands in the middle atmosphere. II. CO2 (2.7 and 4.3 µm) and water vapour (6.3 µm) bands and N2(1) and O2(1) vibrational levels. J. Atmos. Terr. Phys. 1986, 48, 749–764. [Google Scholar] [CrossRef]
  47. Gordley, L.L.; Marshall, B.T.; Jacobson, S.B.; Mlynczak, M.G.; Russell, J.M., III. Rapid non-LTE analysis of CO2 limb emission from the upper mesosphere to obtain kinetic temperature and pressure. In Proceedings of the Remote Sensing of Clouds and the Atmosphere VIII; Society of Photo-Optical Instrumentation Engineers (SPIE) Conference Series; Schaefer, K.P., Comeron, A., Carleer, M.R., Picard, R.H., Eds.; SPIE: Bellingham, WA, USA, 2004; Volume 5235, pp. 240–249. [Google Scholar] [CrossRef]
  48. Shved, G.M.; Kutepov, A.A.; Ogibalov, V.P. Non-local thermodynamic equilibrium in CO2 in the middle atmosphere. I. Input data and populations of the ν3 mode manifold states. J. Atmos. Sol.-Terr. Phys. 1998, 60, 289–314. [Google Scholar] [CrossRef]
  49. Kutepov, A.A.; Shved, G.M. Radiative transfer in the 15-micron CO2 band with the breakdown of local thermodynamic equilibrium in the earth’s atmosphere. Acad. Sci. USSR Izv. Atmos. Ocean. Phys. Transl. 1978, 14, 18–30. [Google Scholar]
  50. Shved, G.M. Non-LTE radiative transfer in the vibration-rotation bands of linear molecules. Astron. Zhurnal 1974, 51, 841. [Google Scholar]
  51. She, C.Y.; Sherman, J.; Yuan, T.; Williams, B.P.; Arnold, K.; Kawahara, T.D.; Li, T.; Xu, L.F.; Vance, J.D.; Acott, P.; et al. The first 80-hour continuous lidar campaign for simultaneous observation of mesopause region temperature and wind. Geophys. Res. Lett. 2003, 30, 1319. [Google Scholar] [CrossRef]
  52. Balakrishnan, N.; Kharchenko, V.; Dalgarno, A. Slowing of energetic O(3P) atoms in collisions with N2. J. Geophys. Res. 1998, 103, 23393–23398. [Google Scholar] [CrossRef]
  53. Kharchenko, V.; Dalgarno, A.; Fox, J.L. Thermospheric distribution of fast O(1D) atoms. J. Geophys. Res. (Space Phys.) 2005, 110, A12305. [Google Scholar] [CrossRef]
  54. Sharma, R.D.; Wintersteiner, P.P.; Kalogerakis, K.S. A new mechanism for OH vibrational relaxation leading to enhanced CO2 emissions in the nocturnal mesosphere. J. Geophys. Res. Atmos. 2015, 42, 4639–4647. [Google Scholar] [CrossRef]
  55. Dawkins, E.C.M.; Feofilov, A.; Rezac, L.; Kutepov, A.A.; Janches, D.; Höffner, J.; Chu, X.; Lu, X.; Mlynczak, M.G.; Russell, J. Validation of SABER v2.0 Operational Temperature Data with Ground-Based Lidars in the Mesosphere-Lower Thermosphere Region (75–105 km). J. Geophys. Res. (Atmos.) 2018, 123, 9916–9934. [Google Scholar] [CrossRef]
  56. Shved, G.M.; Khvorostovskaya, L.E.; Potekhin, I.Y.; Ogibalov, V.P.; Uzyukova, T.V. Measurement of rate constant for quenching CO2(0110) by atomic oxygen at low temperatures: Reassessment of the population of CO2(0110) and the CO2 15-µm emission cooling in the lower thermosphere. In Proceedings of the Remote Sensing of Clouds and the Atmosphere VII; Society of Photo-Optical Instrumentation Engineers (SPIE) Conference Series; Schaefer, K.P., Lado-Bordowsky, O., Comeron, A., Picard, R.H., Eds.; SPIE: Bellingham, WA, USA, 2003; Volume 4882, pp. 106–116. [Google Scholar] [CrossRef]
  57. Shved, G.M.; Khvorostovskaia, L.E.; Potekhin, I.I.; Dem’ianikov, A.I.; Kutepov, A.A. The measurement of the rate constant of CO2/01 super-1 0/ quenching by atomic oxygen and the importance of the rate constant magnitude for the thermal regime and radiation of the lower thermosphere. Akad. Nauk SSSR Fiz. Atmos. I Okeana 1991, 27, 431–437. [Google Scholar]
  58. Castle, K.J.; Black, L.A.; Simione, M.W.; Dodd, J.A. Vibrational relaxation of CO2(ν2) by O(3P) in the 142–490 K temperature range. J. Geophys. Res. (Space Phys.) 2012, 117, A04310. [Google Scholar] [CrossRef]
  59. Kutepov, A.A.; Feofilov, A.G.; Medvedev, A.S.; Berger, U.; Kaufmann, M.; Pauldrach, A.W.A. Infra-red Radiative Cooling/Heating of the Mesosphere and Lower Thermosphere Due to the Small-Scale Temperature Fluctuations Associated with Gravity Waves. In Climate and Weather of the Sun-Earth System (CAWSES): Highlights from a Priority Program; Lübken, F.J., Ed.; Springer: Dordrecht, The Netherlands, 2013; pp. 429–442. [Google Scholar] [CrossRef]
  60. Ogibalov, V.P.; Fomichev, V.I. Parameterization of solar heating by the near IR CO2 bands in the mesosphere. Adv. Space Res. 2003, 32, 759–764. [Google Scholar] [CrossRef]
  61. Walterscheid, R.L. Dynamical cooling induced by dissipating internal gravity waves. Geophys. Res. Lett. 1981, 8, 1235–1238. [Google Scholar] [CrossRef]
  62. Medvedev, A.S.; Klaassen, G.P. Thermal effects of saturating gravity waves in the atmosphere. J. Geophys. Res. (Atmos.) 2003, 108, 4040. [Google Scholar] [CrossRef]
  63. Yiǧit, E.; Medvedev, A.S. Heating and cooling of the thermosphere by internal gravity waves. Geophys. Res. Lett. 2009, 36, L14807. [Google Scholar] [CrossRef]
  64. Jonsson, A.I.; de Grandpré, J.; Fomichev, V.I.; McConnell, J.C.; Beagley, S.R. Doubled CO2-induced cooling in the middle atmosphere: Photochemical analysis of the ozone radiative feedback. J. Geophys. Res. (Atmos.) 2004, 109, D24103. [Google Scholar] [CrossRef]
  65. Chen, H.; Wolf, E.T.; Zhan, Z.; Horton, D.E. Habitability and Spectroscopic Observability of Warm M-dwarf Exoplanets Evaluated with a 3D Chemistry-Climate Model. Astrophys. J. 2019, 886, 16. [Google Scholar] [CrossRef]
Figure 1. Atmospheric temperature profiles used for the CO2 15 µm cooling rate calculations. SAW denotes subarctic winter, MLW denotes mid-latitude winter, TROP stands for tropical profile, MLS denotes mid-latitude summer, and SAS stands for subarctic summer.
Remotesensing 17 01896 g001
Figure 2. The CO2 15 µm cooling/heating for the mid-latitude summer. Left panel: The cooling h obtained in single-rate runs for k O = (1.5–6.0) × 10 12   s 1 cm 3 . h is the result of the two-rate run (the true CO2 15 µm cooling). Y is the pumping in Equation (15). Right panel: The difference between the single-rate run cooling h and the true cooling h (excessive cooling). See text for details.
Remotesensing 17 01896 g002
Figure 3. The same as in Figure 2, but for sub-arctic winter.
Remotesensing 17 01896 g003
Figure 4. The same as in Figure 2, but for sub-arctic summer.
Remotesensing 17 01896 g004
Figure 5. The same as in Figure 2, but for tropical atmosphere.
Remotesensing 17 01896 g005
Figure 6. The same as in Figure 2, but for mid-latitude winter atmosphere.
Remotesensing 17 01896 g006
Figure 7. The same as in Figure 6, but for k O = 2.5 × 10 12   s 1 cm 3 .
Remotesensing 17 01896 g007
Figure 8. The same as in Figure 4, but for k O = 2.5 × 10 12   s 1 cm 3 .
Remotesensing 17 01896 g008
Figure 9. The daytime heating of the atmosphere due to the absorption of the solar radiation for mid-latitude summer atmosphere for the solar zenith angle 0°. See text for details.
Remotesensing 17 01896 g009
Figure 10. Comparison of the two-parameter and the one-parameter model cooling calculations. Blue: h , the same as in Figure 2, Figure 3, Figure 4, Figure 5 and Figure 6; cyan with circles: k O = 1.2 × 10 12   s 1 cm 3 ; cyan with diamonds: k O = 0.8 × 10 12   s 1 cm 3 .
Remotesensing 17 01896 g010
Disclaimer/Publisher’s Note: The statements, opinions and data contained in all publications are solely those of the individual author(s) and contributor(s) and not of MDPI and/or the editor(s). MDPI and/or the editor(s) disclaim responsibility for any injury to people or property resulting from any ideas, methods, instructions or products referred to in the content.

