1. Introduction
Natural disasters endanger human life and property. Therefore, understanding the mechanisms and effects of natural disasters are of great value to the public at large. In recent years, extreme natural disasters, particularly climatic ones, have occurred at a seemly higher frequency [
1], causing incremental losses in many regions of the world. In the US alone, there were 20 climatic events with billions of dollars worth of losses. The total cost from 2021 was
billion; in addition, the total costs over the last five years (
billion) is more than a third of the total cost of the last 42 years (about
trillion with inflation adjusted to 2021 dollars) [
2].
The production and life of the people have had a great impact. In this paper, natural disasters mainly refer to natural phenomena that harm human survival or harm human living environment, such as drought, high temperatures, low temperatures, cold waves, floods, mountain torrents, typhoons, tornados, flame tornados, hail, frost, heavy rain, blizzards, freezing rain, heavy fog, strong winds, icing, haze, smog, earthquakes, tsunamis, landslides, mudslides, floating dust, blowing sand, sandstorm, thunder and lightning, thunderstorms, spherical lightning, and volcanic eruption. Regardless of the type of disaster, the impact it produces is negative, which will hinder the development of human society. However, because the natural disasters are uncontrollable and unpredictable, how to make effective responses immediately after disasters is the focus of current scholars. This has led to the all-day, all-weather, large-scale collection, monitoring, and digital management of landmark information in the three stages before, during, and after disasters. It is of great significance to realize high-efficiency disaster prevention, disaster reduction, and emergency rescue.
Remote sensing is a science and technology that can reveal the spatial distribution characteristics and spatial variation laws of various elements on the earth’s surface. It has the characteristics of a wide observation range, a fast speed, safety, and not being blocked by topography and geomorphology. Because remote sensing images are intuitive, informative, and accurate, they have played an important role in the field of natural disaster emergency mitigation and assessment. Compared with conventional collection methods, remote sensing technology has obvious advantages in obtaining disaster area information, and its main advantages are shown in the following aspects:
(1) With wide coverage, remote sensing technology can observe and collect data in disaster-stricken areas and reflect the disaster situation from a macro perspective. For example, Sentinel-2 provides imagery with a swath width of 290 km and a spatial resolution of up to 10 m, making it suitable for regional-scale damage assessment. In the same way, the large-scale data acquisition capability makes the data collection capability strong, which promotes the training of disaster recognition models.
(2) Remote sensing technology benefits from a fast acquisition speed and near-real-time data. Remote sensing technology can make periodic observations of disaster-stricken areas to obtain images of different periods. By comparing the remote sensing images before and after a disaster, it can not only locate the affected area and predict the scope of the disaster image, but also track the dynamic changes of the disaster. For example, the SRV sensor of the Spot satellite has the ability to observe obliquely and can observe the same area from different perspectives on different orbits, and it can generate a stereo pair to provide three-dimensional spatial information for subsequent three-dimensional reconstruction and other tasks. It allows for the possibility to obtain disaster information in real time.
(3) Remote sensing images contain a large amount of information. At present, most satellites are equipped with infrared ray sensors. Satellites can obtain information on vegetation coverage, land moisture content, hydro-geology, and surface morphology by detecting information at different wavelengths, such as visible light, reflected infrared, thermal infrared, and microwaves, to accurately predict a disaster. Different satellites are equipped with one or more different resolution sensors, which can meet the needs of disaster monitoring at different scales.
Despite their numerous advantages, optical sensors exhibit inherent limitations when applied to geological disaster mapping. Their performance can be severely hindered during flood events, particularly due to persistent cloud cover, inadequate illumination, and atmospheric disturbances. Additionally, atmospheric scattering and terrain-induced shadows further compromise the accuracy of water-body delineation. To mitigate these limitations, the integration of Synthetic Aperture Radar (SAR) data is recommended, as SAR sensors can penetrate cloud cover and provide reliable surface observations regardless of lighting conditions. Additionally, LiDAR systems and UAV-based platforms offer high-resolution topographic data and operational flexibility in inaccessible or rapidly changing flood-prone regions.
Therefore, how to apply remote sensing images to disaster monitoring correctly and efficiently has become an active topic. The mainstream method is to monitor the changes of remote sensing image pairs in the same area at different times. Remote sensing image-based change detection refers to the use of multi-temporal remote sensing images and other auxiliary data covering the same area to determine and analyze surface changes. Many classical detection methods rely on a binary temporal comparison of pre- and post-event images to identify flood-affected areas. While this binary approach enables a rapid assessment of flood impact, it overlooks the temporal dynamics of flood evolution and recovery. To capture flood progression more comprehensively, multi-temporal analysis using continuous monitoring frameworks should be considered, which can provide insights into the onset, peak, and recession phases of flooding events.
In this paper, we use a computer image processing system to identify and determine the target or state changes in remote sensing images taken at different times, and perform quantitative and qualitative analysis. Disaster monitoring applications that combine deep learning and remote sensing images have a wide range of application and commercial value. This work contributes by critically assessing the operational readiness of optical remote sensing for flood mapping, highlighting key limitations and opportunities. It introduces a multi-sensor-aware perspective, explores lightweight machine learning pipelines for near-real-time analysis, and proposes the GloFIM Gateway as a practical, user-oriented platform for disaster response.
2. Literature Review
Disaster detection based on satellite imagery has a long history. Starting from the first experts manually judging the level of disasters, how to determine the degree of damage quantitatively and qualitatively to buildings has become a topic of discussion for experts. It is obvious that disaster detection manually is not only time-consuming and labor-intensive, but also has great empirical judgment problems. Different experts may have different focuses, or the time, angle, light, and shadow of the images they observe are different, which will lead to differences in their judgments on the level of the disaster. If the disaster occurs in a dense urban area, the difficulty of manual judgment will increase sharply.
Later, with the rapid development of the computer field, some scholars began to think about whether computers can be used to continue automatic or semi-automatic disaster detection. Computer-based disaster detection is divided into two parts: one is building or water-body object detection, and the other is judging the degree of damage to these buildings. This is all based on graphical analysis. One of the basic tasks of image analysis is to perform pixel-level classification tasks and target extraction based on satellite images. Because buildings are an important feature of urban areas, our disaster monitoring is mainly carried out for urban areas. In this article, we will focus on methods for automated building extraction and disaster monitoring.
The current methods for building extraction using high-resolution satellite images are mainly divided into two categories. The first category involves combining image information and elevation information to extract buildings, which is currently the most extensive and in-depth method of research. The main principle of this method is to extract the roof of the building based on the height difference between the building and the surrounding environment. There are already many relatively mature algorithms, such as CSG and other methods. Although there are many mature commercial software systems that have this additional function, since most of these methods require auxiliary data, such as Digital Elevation Models (DEM) and Digital Surface Models (DSM), they are not suitable for general users. The second category involves using image information, combined with image processing and analysis, machine vision, artificial intelligence, and other methods to extract image information, to automatically or semi-automatically identify roof targets. An important characteristic of these methods is that it does not need other external information and multi-scene images, so it has a wide range of application prospects. However, since the information on which these methods mainly rely is image gray information, spectral information, building shape information, and some prior knowledge, it is hard to extract building information from a limited image. In other words, these methods require a large amount of annotated data to support. Moreover, with the acceleration of urbanization and the tilt of image shooting angles, buildings are often obscured by some other man-made or natural objects, and the information extraction of obscured buildings has become a major challenge; on the other hand, due to different image shooting times, there is also a difference in the light when shooting, which will cause buildings or other shadows to interfere with the judgment of the model. These are the difficulties faced by building extraction.
Since the mid to late 1980s, many scholars have conducted in-depth research on target detection and semantic segmentation technology. At first, researchers analyzed the spatial relationship of the line segments in the image, combined with the perceptual grouping theory to hypothesize and verify the target of the building [
3]. Later, with the popularity of machine learning, some researchers searched for parallel structures by combining edge detection algorithms and perceptual grouping theory. They searched for rectangles to obtain a building outline [
4]. Similarly, by relying on wavelet transform to extract effective information in remote sensing images, a new algorithm combining mathematical morphology and edge detection emerged, and it can effectively extract building edge information and classify it.
Later, with the rapid development and wide application of artificial intelligence, researchers began to think about how to use artificial intelligence to realize fully automatic building extraction and disaster area classification. Deep learning technology is one application of multi-layer neural networks. Deep learning network models are mainly used in semantic segmentation and object recognition. To solve the task of object classification, many different models have been invented. In 1986, the Back Propagation (BP) algorithm was provided, and it made the training process of neural networks simple and feasible and laid a foundation for future work about inventing networks [
5]. In 2012, the AlexNet model, which proposed the ReLu activation function, overlapping pooling, and dropout to enhance model performance, made convolutional neural networks a critical model of computer vision [
6]. Later, some researchers used multiple different convolution kernels for sampling at different scales to improve network performance. The most typical one is the inception network [
7]. In addition, the VGG model is also a very classic classification model, which uses multiple small convolution kernels to deepen the network in order to improve network performance [
8]. After that, some scholars combined the above two ideas and proposed ResNet and the residual structure, which solved the gradient disappearing problem and the problem that network performance decreased as network depth increased [
9]. In order to show how the deep learning model works, Matthew D. Zeiler visualized the features extracted from different layers of the deep learning network, proving that the features extracted by the network can provide meaningful information, which can then be successfully used for future tasks [
10].
In this way, we assume that the building information has been effectively extracted. How to determine the level of disaster now needs to be considered. In the field of traditional machine learning, researchers are accustomed to using change detection methods to determine the degree of damage to buildings. Change detection is mainly used to quantitatively analyze and determine the extracted features from remote sensing images taken at different times. The research object of change detection is features, including natural features and human-made features. The features of ground objects include spatial distribution characteristics, spectral reflection and radiation characteristics, and temporal change characteristics.
Remote sensing image change detection methods are divided into two categories: one is the post-classification comparison method, and the other is the direct multi-temporal image classification method. The post-classification comparison method first classifies the images taken in the same area at different time periods, and then compares the resulting maps. If the classification of the pixel has not changed, we infer that the surface features have not changed; otherwise, it is believed that the land characteristics have changed. The advantage of this method is that no normalization process is needed because the two images are classified separately. This reduces the problems caused by differing acquisition times and atmospheric conditions. However, this method has higher requirements for the reasonable classification of categories. If the image has too many classes, the detection error will increase, but if the classification is too coarse, the classification result will not reflect the actual geomorphic features. At the same time, this kind of method is very sensitive to misclassification, and the misclassification of any picture will lead to errors in the result. The other method is to identify the change area by performing detection analysis on the combined data taken two or more times. However, this method has high requirements for geographic location calibration. Once the shooting angle of the image group has an error, misjudgment easily occurs. For this reason, scholars have conducted experiments to improve the performance of the model. For example, Nielsen, Conradsen, and Simpson found that MAD and MAF conversion can effectively remove incoherent noise in image data and detect outliers (like color matching errors), and it is better than simple PCA in practical applications [
11]. Using the Gramm–Schmidt method to detect changes in forest mortality, which can effectively extract the characteristics of the detection target [
12]. A multi-scale change curve (MCP) was proposed as a change detection method based on the evolution of the local statistics of the image between two dates to generate change information and better characterize the appropriate scale [
13]. At the same time, a new texture difference metric, derived from the relationship of local gradient vectors, was proposed to calculate the difference in texture patterns [
14]. Given that high-resolution satellite images already have rich texture features, researchers generally use object-oriented change detection methods such as homogeneous area recognition, PCA, cluster extraction, and the morphological index calculation method, which see each single building as a whole to extract texture features. However, these methods have many limitations. For example, the precise matching of satellite images of the same target that these methods need is too high to achieve, and the different shooting angles and lighting conditions will affect these methods’ performances as well. Therefore, Chen proposed a region-based method that not only ensures the structural integrity of the single building in the remote sensing satellite image, but also corrects the small displacement of the pre- and post-disaster image, which can produce improved damage analysis results [
15].
Disaster detection methods based on remote sensing images have a long history. Scholars continue to change and innovate on the basis of previous research results, which has produced substantial research and practical value. However, several important gaps remain in both methodology and application. First, a large portion of existing studies rely on cloud-free optical data like Sentinel-2 and Landsat-8, which are often unavailable during actual flood events due to persistent cloud cover and poor weather conditions. This limitation is rarely addressed through systematic SAR-optical fusion frameworks. Second, current machine learning models are typically trained and validated on well-curated datasets such as xBD or BigEarthNet, which are biased toward urban, high-income settings, and this constrains their applicability in rural or underrepresented flood-prone regions. Third, very few studies focus on the operationalization of flood mapping pipelines in near-real-time settings, with limited discussions on latency, bandwidth constraints, and computational feasibility for deployment in disaster zones. Existing research also lacks ablation studies or benchmarking of weakly supervised vs. fully supervised learning approaches, which are particularly relevant in data-scarce environments.
Future research should explore scalable, low-latency, multi-modal architectures that can operate under cloud occlusion and adapt to varied geographies. There is also a need for unified frameworks that combine SAR, optical, LiDAR, and UAV data in spatiotemporal fusion pipelines. This motivates the design of field-deployable platforms such as the GloFIM Gateway discussed in this paper.
3. Remote Sensing Imagery and Datasets
3.1. Argument
Flood disasters and their catastrophic consequences affect economic activities and threaten human lives on a global scale. At the same time, floods are often triggered by extreme weather events, such as heavy rains or tropical cyclones. From a remote sensing point of view, this characteristic of floods usually reduces the use value of optical remote sensing data because it relies on passive sunlight, especially when direct after-event data is involved. Nevertheless, considering that flooding is the most common type of natural disaster on the earth, optical remote sensing data should be fully utilized. In this article, first, we will critically review remote sensing data and machine learning methods for use in the detection and mapping of damage caused by global floods. We will mainly consider two types of remote sensing data: medium-resolution multispectral data and high-resolution true color or panchromatic data, and will introduce large databases and semantic databases. We will develop a set of best-use case scenarios for using these two types of data to map water bodies and building areas with no to moderate cloud coverage. We will cross-validate traditional machine learning and current deep learning methods, including Random Forests, Support Vector Machines (SVMs), and deep architectures such as ResNet and U-Net, to evaluate their relative performance in flood detection. We also provide benchmark databases and algorithms for the research community. Finally, through this set of data and algorithms, we will demonstrate the development of a portal that supports cloud computing, which includes our remote sensing-based machine learning engine and web-based user interface services. Under this portal, optical satellite data will be retrieved according to the Global Flood Warning System. Near-real-time pre- and post-flood analysis will be displayed for end users to make decisions.
In summary, it is not difficult to see that remote sensing images play an indispensable role in both patch level image classification, pixel level machine learning, and deep learning disaster detection. There is little fully automated disaster detection software based on optical remote sensing images available for civilian use today because, first, visible light remote sensing can only work during the day, and it is greatly affected by meteorological conditions such as clouds, rain and fog. The biggest problem for optical sensors is the weather. When clouds, fog, or water vapor form a certain scale on the signal propagation route, it will cause the image to be inaccurate or simply obscured, especially when the remote sensing exploration uses different bands. When the calculation of time has reached the special surface structure, the calculated result is not reliable at all when considering the insufficient atmospheric influence. On the other hand, when the selected data are compared with each other on a time axis, the effects of weather on different shooting days will make the results incomparable. In order to solve these problems, various levels of proofreading will certainly be carried out, but its reliability has always been questionable.
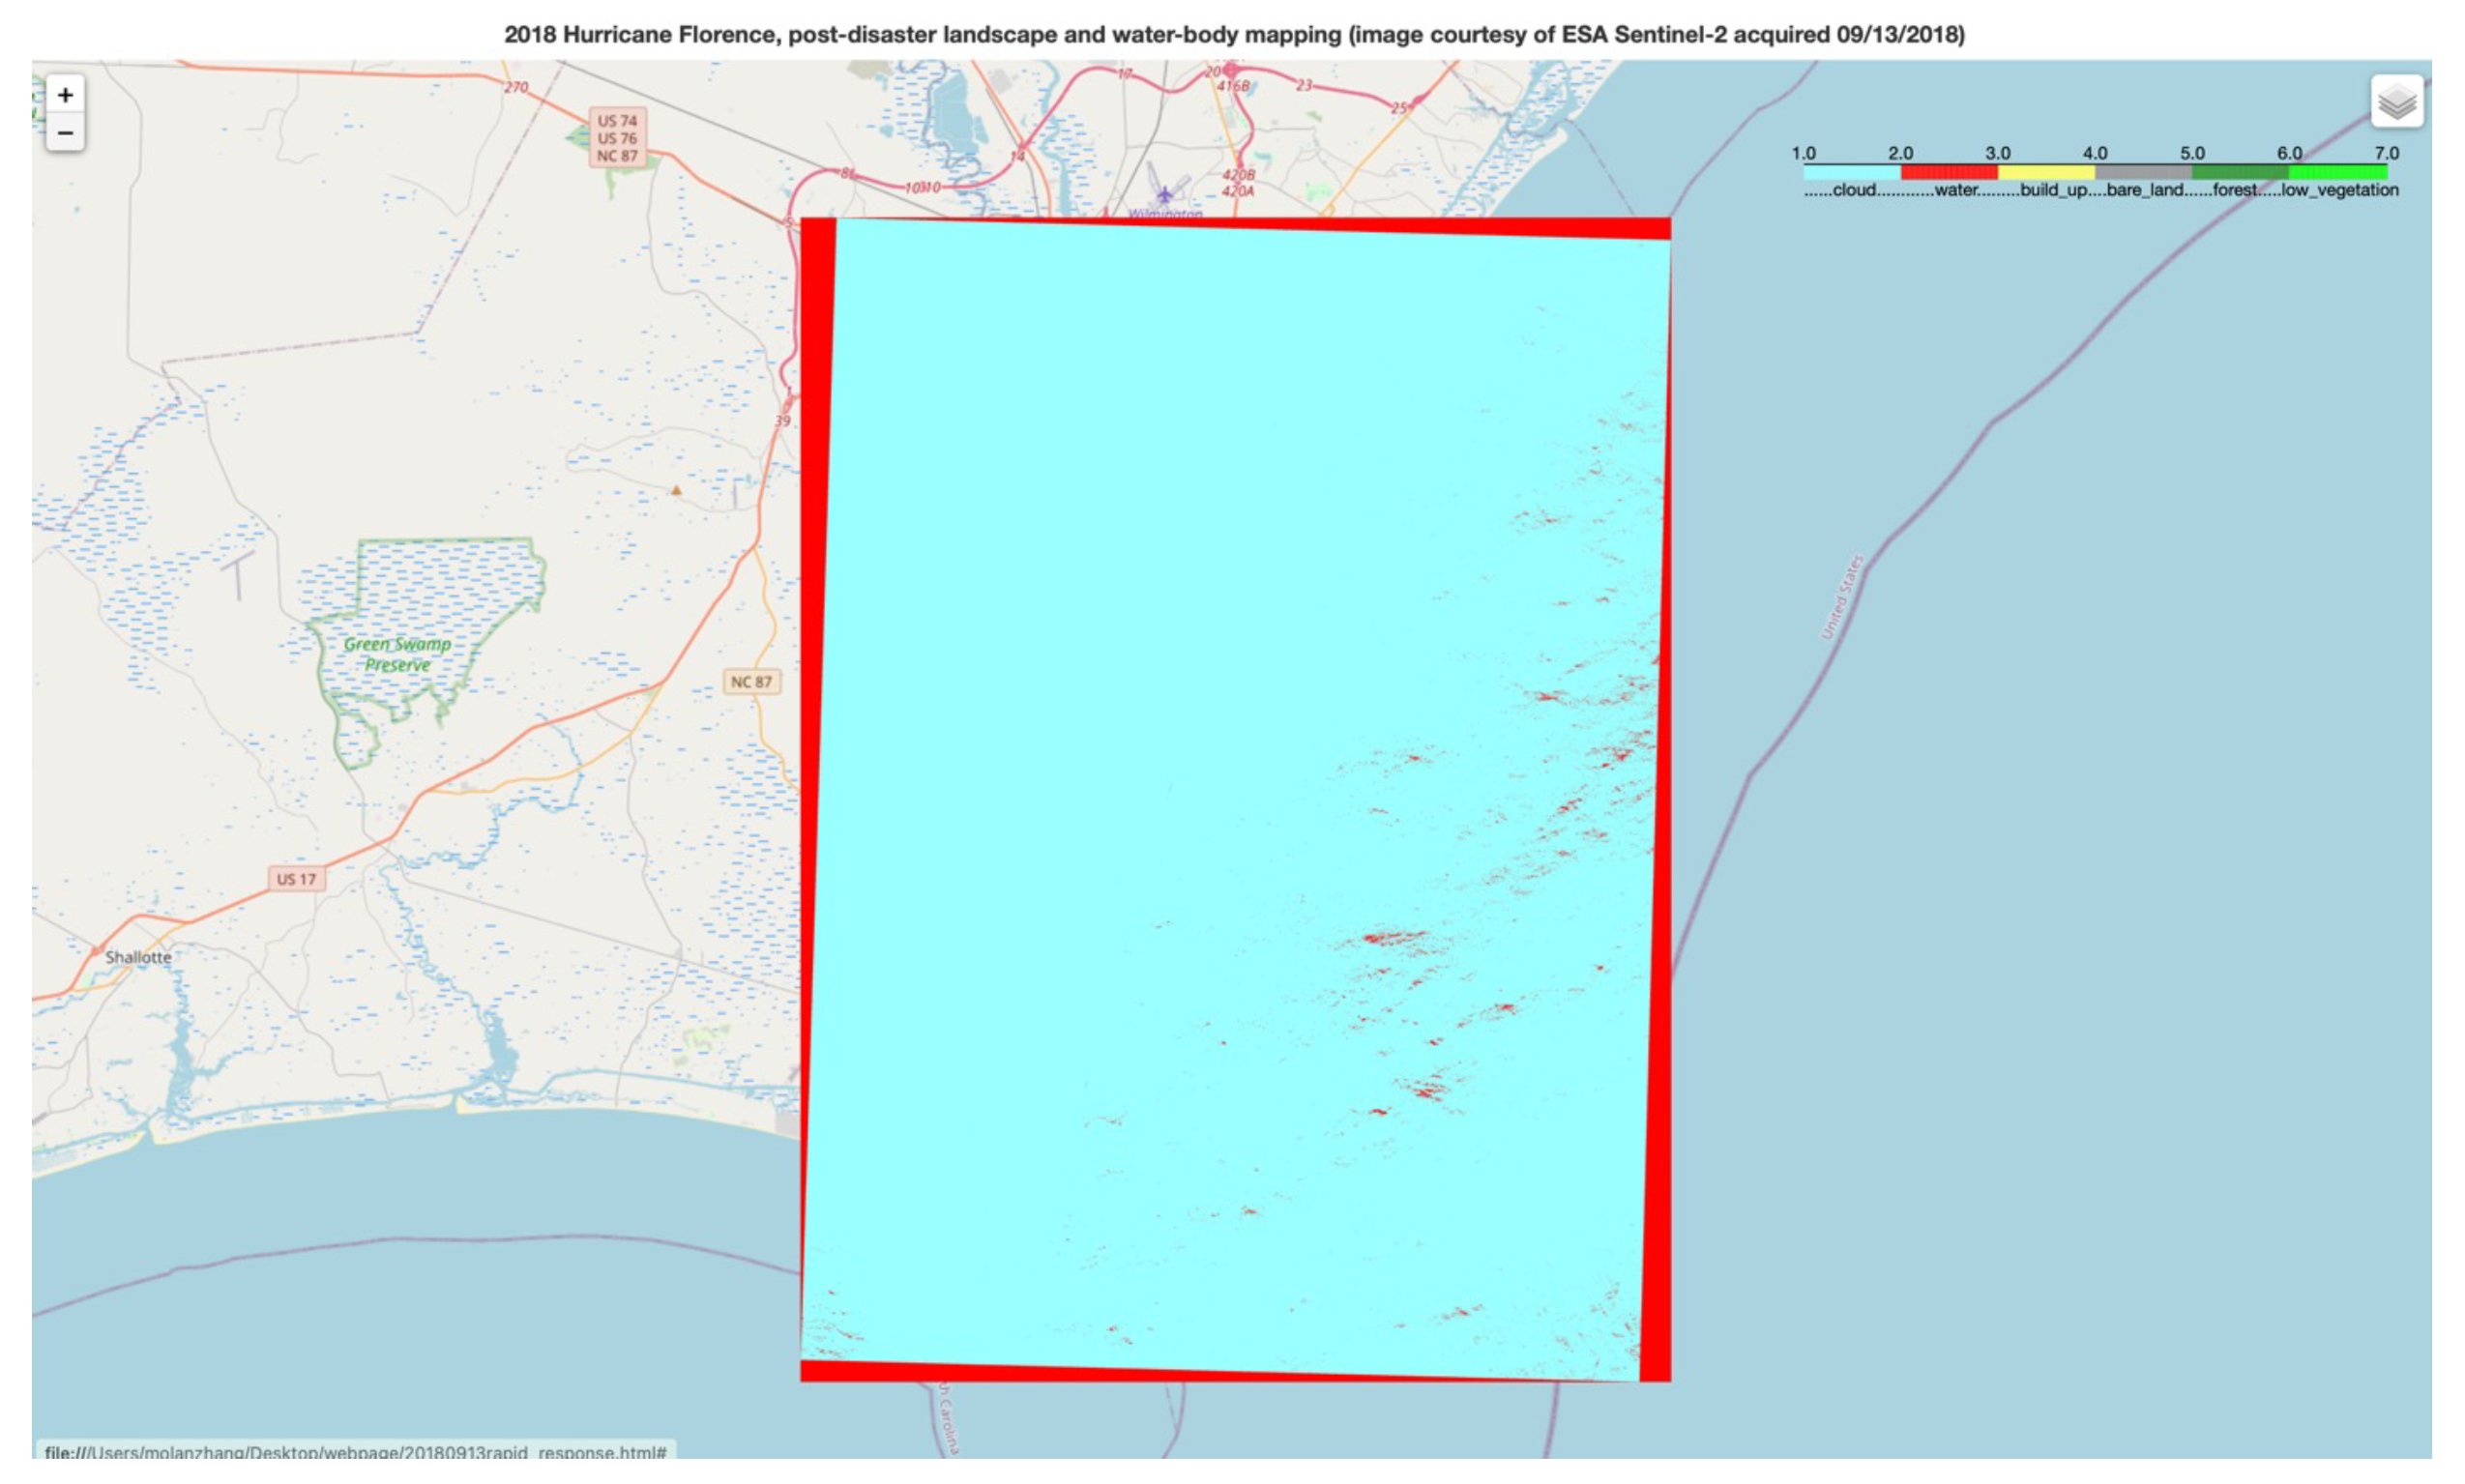
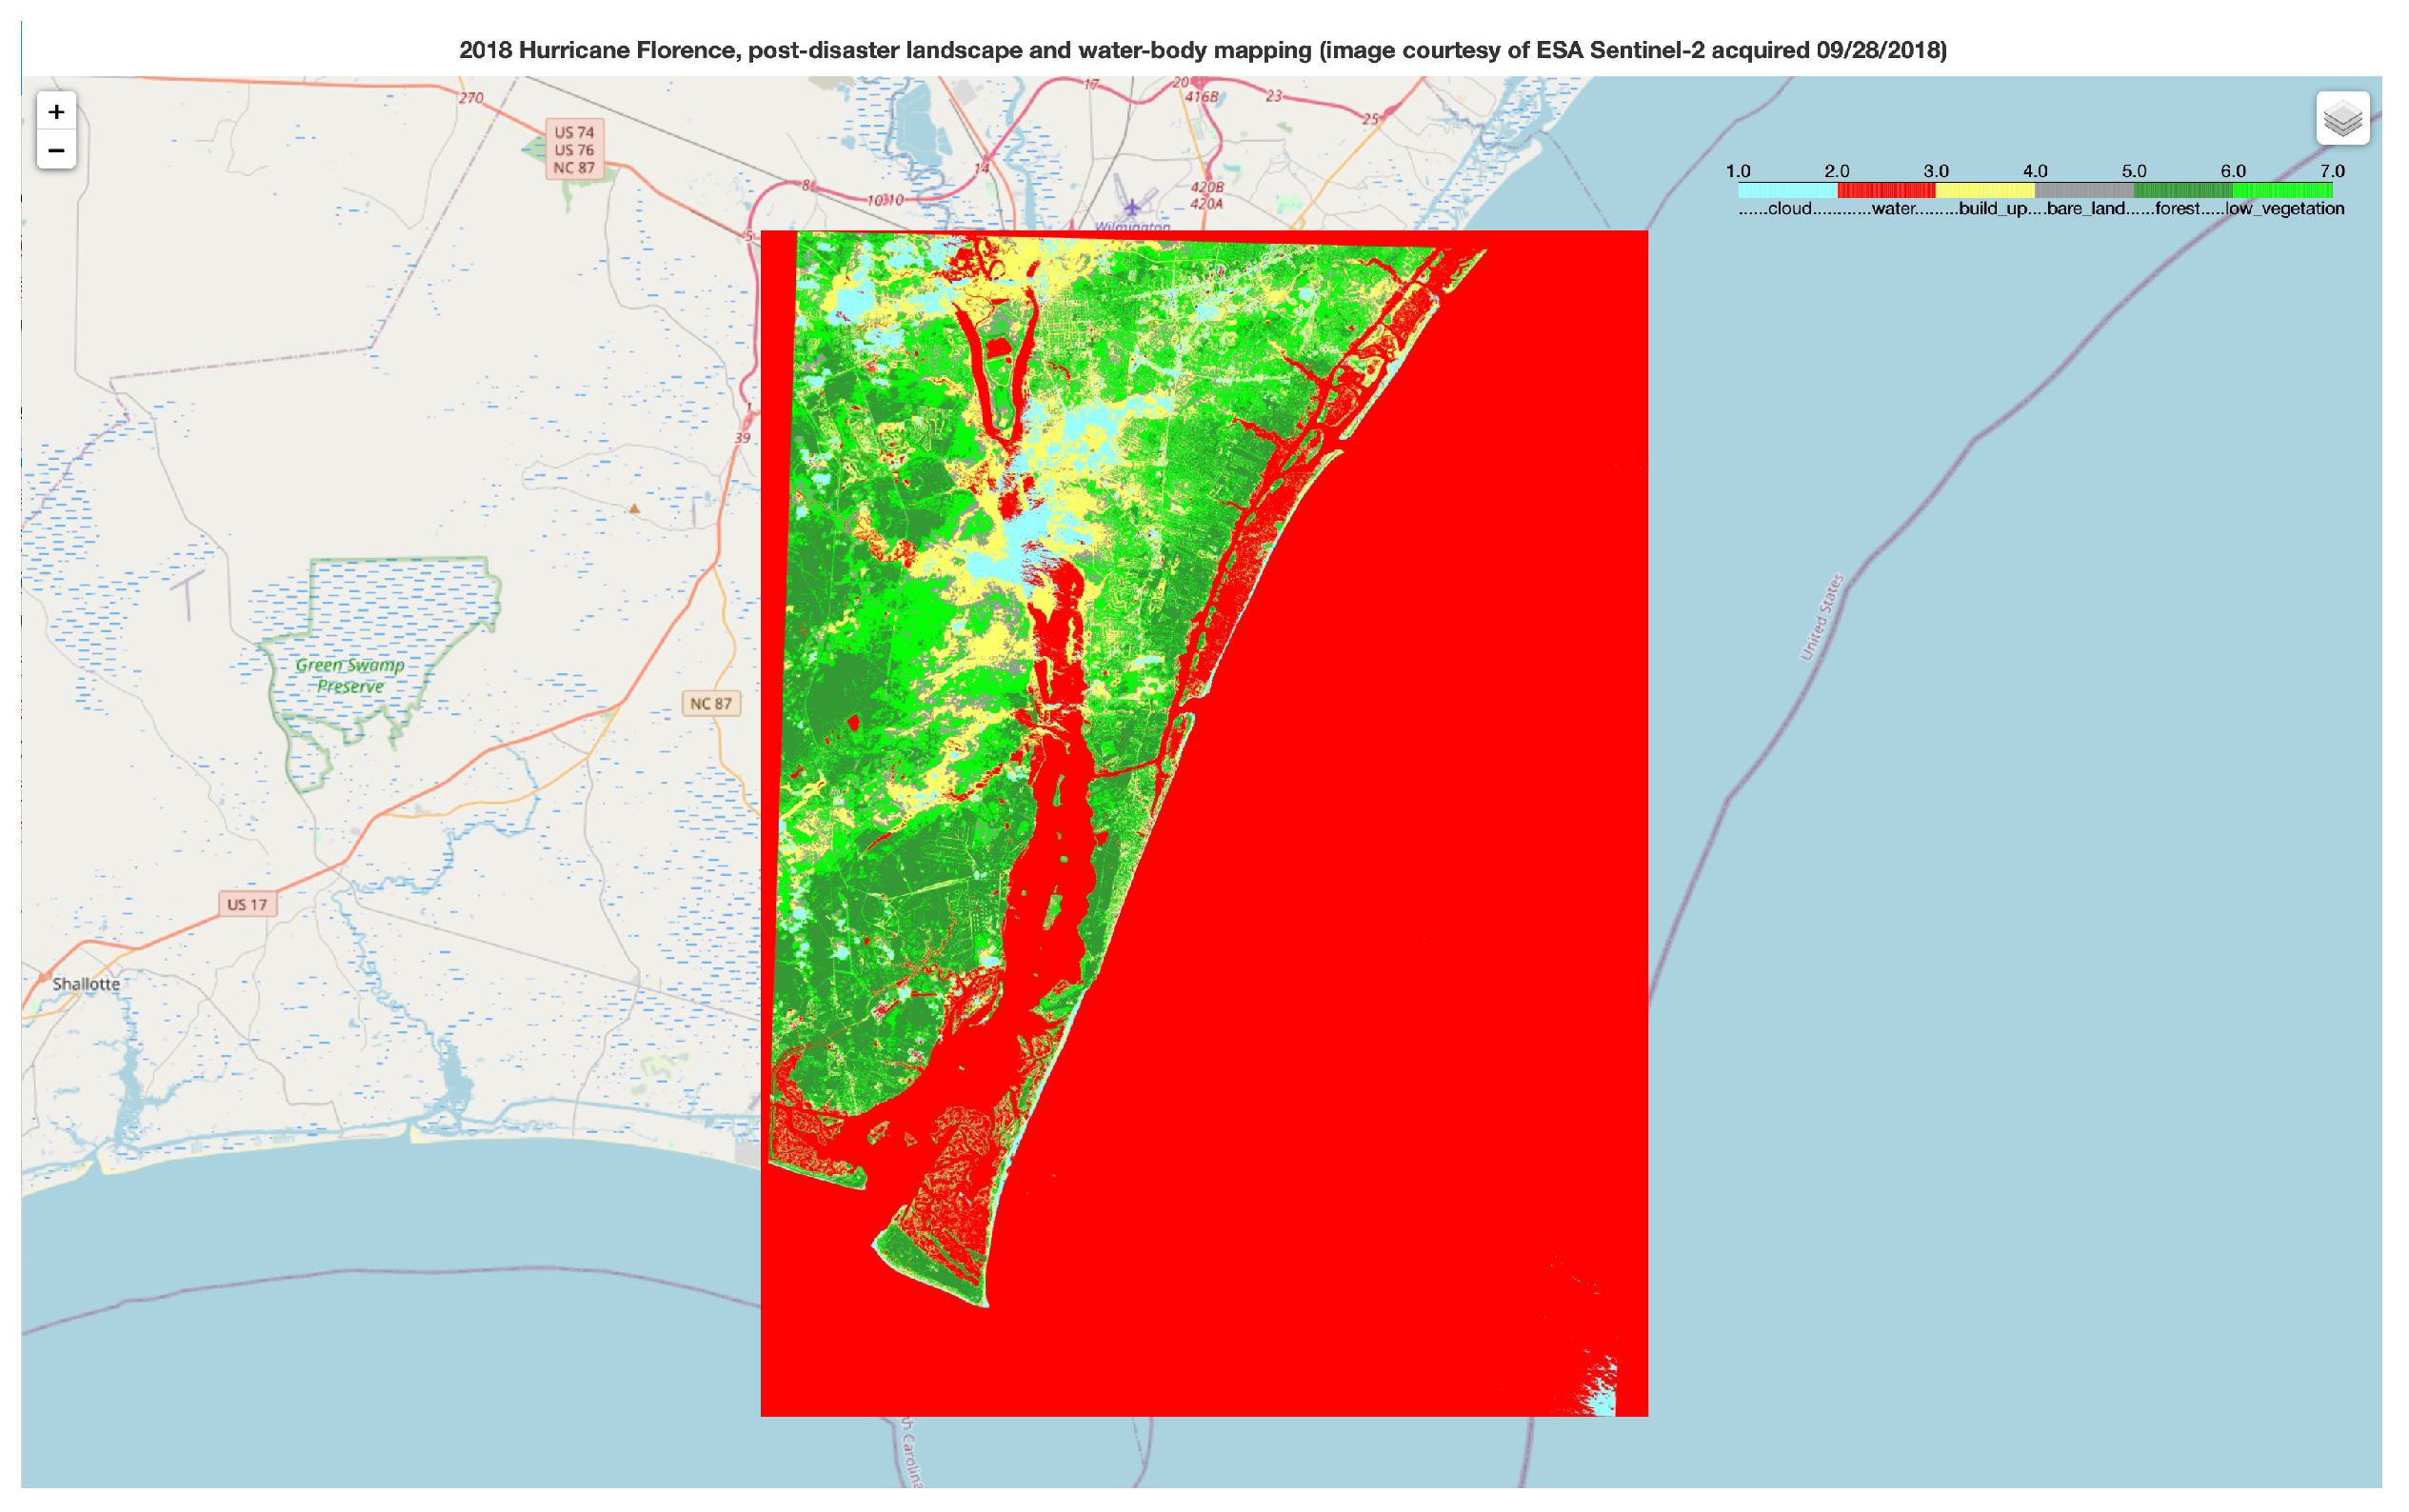
Figure 1 shows an extreme image taken by Sentinel2. The cloud coverage of the image exceeds 0.99. Although the model can identify water vapor and cloud layers, the recognition cannot contribute to the monitoring of the disaster situation in the urban area. Moreover, in the actual situation, a few days after the flood, the weather was mostly cloudy or rainy, which means that we could not obtain the cloud-free optical images that can be used for building disaster situations. In the same way, although optical sensor imaging is intuitive, it is often only suitable for the exploration and monitoring of materials that are visible on the surface. For example, in geological exploration, vegetation will become another major cause of information loss. In addition, winter snow and ice coverage will also affect information utilization has an impact. These limitations will lead to the reduction of available data and the misjudgment of the model under extreme weather.
There are no absolutes. Although the optical remote sensing image still has many limitations, the radar remote sensing core is used for ranging, and all of the analysis of the radar sensor refers to the reflection center, which cannot be simply linked to the material. When the reflection angle is not applicable, it is not possible to directly monitor a certain building, and the specific target of the signal point cannot be determined in detail. Moreover, the radar sensor has noise and may be affected by electromagnetic interference, atmospheric and soil moisture, etc. in some cases. Moreover, almost all radar data is not open source data for civilian use, which means that it is difficult for researchers to obtain corrected, free real-time radar data. In contrast to sightseeing images, as mentioned above, many optical images are open source, and atmospherically corrected images are provided as a free download for the public, which provides a data guarantee for our research. Moreover, with the current technological development, more satellites equipped with optical cameras have been launched, which provides us with near-real-time data and provides a solid foundation for research in the field of emergency disaster response. Although it is inevitable that the optical image will be covered by clouds, it can still be analyzed as long as there is no cloud layer at the pixel point of the surface building. Although the analysis will be more difficult than the cloud-free situation, it is not completely impossible. These three case studies shown below provide more support.
3.2. Optical RS Datasets
A powerful model alone is not enough. Disaster detection is also highly dependent on the data sources. With the introduction of the “digital earth” concept, civilian occasions increasingly need to use remote sensing images, including resource surveys, natural disaster observations, atmospheric weather forecasts, and so on. As the application of remote sensing images in different occasions puts forward different requirements for remote sensing image processing, remote sensing image databases with different configurations have also emerged. Remote sensing images are based on a certain scale to record and reflect the strength and weakness information of the electromagnetic radiation of surface objects objectively and truly. It is a form of remote sensing information obtained by remote sensing detection. Therefore, the core problem of the application of remote sensing technology is to interpret and identify the category and distribution target characteristics based on the electromagnetic radiation intensity of the ground objects on the remote sensing images. Since the 1980s, with the continuous development of imaging spectral remote sensing technology, a large number of satellites equipped with panchromatic, multispectral, and hyperspectral sensors have been developed and launched at home and abroad. Among them, the spatial resolution of panchromatic images is relatively high, up to the meter level. The spectral resolution of multispectral images can reach the micron level, while the spectral resolution of hyperspectral images is higher, generally up to the nanometer level, can provide more abundant information about the earth’s surface. Many domestic and foreign organizations, such as NASA, the European Space Agency (ESA), and others, have public remote sensing satellite databases for users to download and use. For example, Sentinel data can be accessed through the Copernicus Open Access Hub, while Landsat data is distributed via the USGS EarthExplorer platform. These services provide multispectral and SAR data with global coverage. However, there is no systematic introduction to satellite remote sensing data and acquisition methods. How to quickly understand the characteristics of satellite remote sensing data and the acquisition method of data sources is a key issue that needs to be solved urgently in the remote sensing data processing system.
Table 1 lists the main data sources of these remote sensing technologies that can be used for citizen applications. To better understand the nature of these datasets,
Table 1 summarizes the mathematical function expressions and interpretations of different images. Among these remote sensing methods and their data products, a large part of the remote sensing data and products come from traditional space or airborne remote sensing platforms with optical sensors (for example, satellites and airplanes). Therefore, most of the remote sensing data archived so far are optical data. To date, there are a variety of resources that can provide remote sensing data for free (using authorized accounts if necessary), especially after a disaster.
Table 2 lists some centralized sources provided by US government agencies for obtaining remote sensing data. At the same time, with the rise of remote sensing by individuals or communities, especially the use of small GPS drones, the acquisition of remote sensing data on disaster sites has been unprecedentedly high; some of the post-disaster reconnaissance datasets are provided by researchers, and the Design Safe-CI cloud foundation of NSF Planning was recently established in the facility.
By observing the two tables, it is not difficult to see that most of the radar images are not provided to the public for free; they are more for the military industry and the government. Even if a small amount of radar images are provided to the society for free, such as Sentinel1 data, these data are not real time or atmospherically corrected. On the other hand, the resolution of radar images is usually low; they cover a wide range, but the sensor resolution is usually less than 10 m/pixel, and radar images can only reflect limited information, such as the reflectivity of objects. This information has a great effect on water-body detection, but the ability to classify vegetation or buildings of the same material is relatively poor. For example, it is difficult to distinguish forests from artificial orchards, roads, and buildings based on radar images alone. Therefore, the research in this article mainly focuses on optical remote sensing imagery. Since ultra-high-resolution images cannot be used for free, we chose the data source with the best resolution and real-time efficiency in the open source database: Sentinel-2 data.
Sentinel-2 is a high-resolution multispectral imaging satellite that carries a multispectral imager (MSI) for land monitoring [
16]. It can provide images of vegetation, soil and water coverage, inland waterways, and coastal areas, and can also be used for emergency rescue services. It is divided into two satellites, 2A and 2B. After the two enter the operating state at the same time, a complete imaging of the earth’s equatorial region can be completed every five days, while for the higher-latitude European region, this cycle only takes three days. The Sentinel-2 satellite carries a multispectral imager (MSI) with a height of 786 km, which can cover 13 spectral bands with a width of 290 km. The ground resolution is 10, 20, and 60 m. The revisit period of one satellite is 10 days, and the revisit period of two satellites is 5 days. From visible light and near-infrared to short-wave infrared, it has different spatial resolutions. Among the optical data, the Sentinel-2 data is the only data with three bands in the red edge range, which is highly effective for monitoring vegetation health information.
All of the research in this article is based on the Sentinel-2 database, in which we use two different Sentinel-2 based databases xBD and BigEarthNet and a manually labeled Sentinel-2 dataset. Here, the xBD dataset is one of the largest and highest quality public datasets of annotated high-resolution satellite imagery [
17]. It contains more than 850,000 building pairs in six kinds of natural disasters from 15 countries covering more than 45,000 square kilometers. Reviewing the annotations for accuracy and utility for the specific task of automated building localization and damage assessment by expert analysts, this dataset divides image pairs in four categories: no damage, minor damage, major damage, and destroyed. To establish a common standard, the xBD dataset determines a building’s damage level based on comparing pre- and post-event images and the Joint Damage Scale (JDS), a unified assessment scale for building damage in satellite imagery across multiple hazard types, structure categories, and geographical locations. However, its limited coverage of rural and tropical flood-prone regions may hinder model generalizability, particularly in settings where flood dynamics and infrastructure patterns differ significantly. To improve geographic robustness, future studies should prioritize dataset diversification and validate models across multiple biomes and socio-environmental settings. The BigEarthNet archive was built by the Remote Sensing Image Analysis (RSiM) Group and the Database System and Information Management (DIMA) Group of the Technical University of Berlin [
18]. BigEarthNet is a benchmark archive consisting of 590,326 image patches of Sentinel-1 and Sentinel-2. The first version of BigEarthNet (v1.0-beta) contains only Sentinel-2 images. Recently, Sentinel-1 images have enriched it, creating a multi-modal BigEarthNet benchmark archive (also known as BigEarthNet MM).
4. Traditional Machine Learning: Pixel Level Landscope Model
4.1. Background: ML for Remote Sensing-Based Detection and Mapping
Machine learning methods in remote sensing have developed in key ways. Each time period has introduced new techniques that helped improve how remote sensing data are analyzed.
In the early stages, machine learning in remote sensing relied on basic statistical methods. One of the main tools used was called the Maximum Likelihood Classifier (MLC). This method was helpful for identifying and classifying different types of land and other features in images. However, it had limits, especially when the data was complex, since it assumed data followed certain patterns that were not always present in real-world images. In the 1990s, neural networks became a new tool for remote sensing. A model called the Multi-Layer Perceptron (MLP) allowed for the capture of more complex patterns in the data, moving beyond the simpler methods used before. While neural networks showed promise, their use was limited at the time due to slower computers and the lack of large datasets for training. By the 2000s, machine learning methods for remote sensing were advancing further. Random Forest models became popular because they made classification more reliable and accurate. They are robust against overfitting, especially with high-dimensional remote sensing data, and are relatively easy to implement. Other traditional classifiers such as Support Vector Machines (SVMs) are also frequently used due to their strong performance in pixel-based classification tasks.
In recent years, increased attention has been given to analyzing hyperspectral and LiDAR data, which can provide additional information not captured by standard multispectral imagery. A method called 3D CNNs has helped classify LiDAR point clouds, which gives us a clearer understanding of land and buildings in 3D. ML allows for automated, large-scale analysis, reducing manual labor and improving the speed of data processing. This capability is crucial for real-time applications, like disaster response and environmental monitoring. Automated ML workflows help quickly analyze new images, identify affected areas, and support timely decision-making. In summary, ML for remote sensing-based detection and mapping combines data analysis techniques with remote sensing data to enhance our ability to observe and understand changes on Earth. By applying various ML algorithms and integrating multi-modal data, researchers and practitioners can achieve accurate, efficient, and scalable solutions for tasks ranging from environmental monitoring to urban planning.
4.2. Research Motivation
The European Space Agency (ESA) only released the L1C-level multispectral data (MSI) of Sentinel-2 (S2). The L1C-level data are orthographic images that have been geometrically fine-corrected, without radiometric calibration and atmospheric correction. At the same time, ESA also defines the S2 L2A level data [
16]. The L2A level data mainly includes the bottom-of-atmosphere corrected reflectance data after radiation calibration and atmospheric correction. ESA has released a plug-in Sen2cor that specializes in the production of L2A-level data and some related tool libraries to make sure users can easily produce the L2A data by themselves. The Sentinel-2 toolbox consists of a rich set of visualization, analysis, and processing tools for the use of MSI data from Sentinel-2 missions. As a multi-task remote sensing toolbox, it also supports ESA missions Envisat (MERIS and AATSR), ERS (ATSR), and from RapidEye, SPOT, MODIS (Aqua and Terra), Landsat (TM), ALOS (AVNIR and PRISM), and other third-party data. It can call Sen2Cor to perform atmospheric correction, use Sen2 three-level-3 processor for space-time synthesis at the bottom of the atmosphere, and correct the Sentinel-2 level 2a image. In addition to this, the toolbox also includes OTB tools that can handle multivariate AlterationDetector, Pansharpening-bayes, and so on. Relying on Sentinel2’s own toolbox, people can complete most of the remote sensing image data preprocessing work, which greatly facilitates researchers in the civil field. However, most of the land monitoring models included in the toolbox are unsupervised models or simple supervised models, such as random forests. The effect of complex surface classification is not satisfactory, and the error rate is relatively high. Therefore, the author developed a pixel-level landscope classification model for satellite remote sensing images based on machine learning.
4.3. Case Study: Rapid Global Flood Mapping Using Sentinel-2 Data
The model we developed can automatically search for available data, preprocess it based on a user-defined footprint, the shooting date, cloud coverage, and other information, and then rely on the trained random forest model for classification and output. It can classify each pixel into one of six categories: water, cloud, forest, low vegetation, bare land, and urban area. This model can be used in flooding monitoring. For example, if it is known that flooding has occurred on a given day, this model can detect the pre- and post-event images to compare their water-body area, which can help one to determine the most flooded area.
Figure 2 shows the workflow of the model.
This model has the following major functions and features. First of all, data can be downloaded with the Sentinelsat API, which can search for eligible data and download them. The conditions that can be selected here include data type, footprint coverage, cloud coverage, time range, satellite orbit number, etc. Firstly, an account needs to be opened in Scihub, and a geojson file needs to be loaded as a footprint. The eligible data can then be searched and downloaded as zip files. They can then be transformed as GeoTIFF files using the gdal-transfer command. After downloading data that overlap with the footprint, they need to be combined as one GeoTiff file. After that the selected region needs to be cut from it. A mask can be created by a given region, and the overlapping area in the union file can be cut. However, a different file might use a different coordinate reference system. Before creating the mask, the shape file needs to be reprojected with the coordinate reference system of Sentinel-2 data (EPSG:32615). Our cut GeoTiff file includes the B2, B3, B4, and B8 band. At first, the NDVI (from (B8 − B4/B8 + B4)) and NDWI (from (B8 − B3/B8 + B3)) need to be generated and added as input. After that, this array with six channels can be input into the trained Random Forest model, which outputs a 1-channel array with values ranging from 1 to 6. Finally, the model can also overlap the saved output on the Open Street Map or other maps and save it as an html file shown in
Figure 3.
This model can automatically search and download available images, integrate, and preprocess all available images, perform surface classification predictions on this basis, and finally output the visualization results, which is very user-friendly. Because the model is a classification model based on random forest, and a random forest is a flexible and easy-to-use machine learning algorithm, even without hyperparameter adjustment, it will bring with it good results in most cases. It can be used for classification and regression tasks. Decision trees often produce over-fitting problems, especially in decision trees that have entire sets of data. Sometimes the decision tree seems to only memorize data. The random forest is a combination of multiple decision trees, not just one decision tree. The more decision trees under the random forest algorithm, the better the generalization result, and the random forest is very stable. Even if a new data point appears in the dataset, the entire algorithm will not be overly affected. It is difficult for a decision tree to affect all decision trees. Therefore, the model has a high operating efficiency and strong portability after training, can complete the task of near-real-time detection, and make an emergency response to disaster monitoring, which shows a strong application value.
5. Morden Deep Learning: Damage Type and Level Classification Method
5.1. Related Deep Learning Models and Dataset
Starting in the 2010s, deep learning began to transform remote sensing. Convolutional Neural Networks (CNNs) became common for classifying and segmenting images. For time-series data, Recurrent Neural Networks (RNNs) were introduced, helping track changes in images over time. Another major development was transfer learning, which allows one to take large, pre-trained models (like VGG, ResNet, and EfficientNet) and adjust them for remote sensing tasks. This was useful because it meant that good results could be achieved without the need for large amounts of labeled data.
Countless new data analysis methods have gradually emerged, evolved from machine learning and multilayer neural networks. Deep learning is the research frontier of current big data processing and analysis methods. Big data is a large-scale data collection that greatly exceeds the capabilities of traditional database software tools in terms of acquisition, storage, analysis, and management. It has the characteristics of a massive data scale, fast data circulation, diverse data collections, and low value density [
19]. Through the above definition, it is not difficult to see that the main feature of big data is that it is difficult to analyze it through traditional data analysis methods. Due to the large amount of data and the strong data diversity, the era of big data can provide traditional Information that the data cannot provide. Therefore, if deep learning and big data are combined, the information contained in big data can be analyzed in a deep, efficient, and accurate manner, which is also of outstanding significance for the study of remote sensing data.
The use of available big data to train models can make the construction of disaster prediction models more effective. Therefore, the author investigated the open-source Sentinel2 remote sensing satellite-based databases currently available on the market. Due to the sensitivity and emerging nature of remote sensing data, the currently available labeled databases are typically the BigEarthNet dataset and the EuroSAT dataset. The BigEarthNet dataset is a Sentinel-2 dataset, consisting of 590,326 image patches from June 2017 to May 2018 from 10 countries (Austria, Belgium, Finland, Ireland, Kosovo, Lithuania, Luxembourg, Portugal, Serbia, and Switzerland) of Europe. This dataset classified patches in 43 classes manually. The number of images in each class is very unbalanced. However, each patch might have more than one class. Every label has the same weights for its patch. The size of each image patch is 120 × 120 pixels for 10 m bands, 60 × 60 pixels for 20 m bands, and 20 × 20 pixels for 60 m bands. Each spectral band is stored in a separate GeoTIFF file as a georeferenced raster image [
18]. The EuroSAT dataset is based on Sentinel-2 images covering 13 spectral bands and consisting of 10 classes with 27,000 labeled and geo-referenced samples. Its 10 classes are as follows: AnnualCrop, Forest, Herbaceous Vegetation, Highway, Industrial, Pasture, Permanent Crop, Residential, River, and Sea Lake. Each image patch only has one class label. This dataset offers RGB (64 × 64 × 3) and GeoTIFF (64 × 64 × 13) data [
20]. Both databases are based on experts manually labeling part of the data and then using the semi-label neural network for data labeling and cutting. They are released after manual secondary inspection and have strong reliability. However, the classification of BigEarthNet data is too detailed, and it is easy to cause misjudgment in disaster monitoring applications, and since the database has multiple labels, how to distinguish the weights of these labels is still open to question. As for the second database, although it has only 10 categories, it did not classify deserts, bare land, etc.
5.2. Case Study 1: Water-Body Segmentation Based on the Self-Built Database
As mentioned in the previous section, neither of the two databases classifies clouds, but most of the optical remote sensing images will have clouds, and effective cloud free processing cannot be performed for real-time data. Therefore, the two databases were combined, and a small amount of data completely covered by Sentinel2’s cloud layer was downloaded and cut to form our own database suitable for this research, called the flood alert dataset. This dataset is based on Sentinel-2 images covering 12 spectral bands and consisting of 11 classes with 22,000 labeled and geo-referenced samples. Each class has 2000 patches, which are distributed all over Europe. Its 11 classes are as follows: Crop, Pasture, Herbaceous Vegetation, Forest, Residential Built-Up Area, Industrial Buildings, Highway, River&Water Body, Bare Land, Cloud, and Sea&Lake. This dataset offers GeoTIFF (64 × 64 × 13) data, which only has one label per image patch.
Based on our self-built database, the author conducted a simple test on the effectiveness of the database. Here, we have constructed a multi-layer ResNet50 classification network, taking each patch as input, and the landmark nature of the patch as output. It is a lightweight, efficient, and fast network. Image classification is an operation on the input image, and a set of classifications (such as cats, dogs, etc.) or classification probabilities that best describe the content of the image are then output. CNN, also called convnet, stands for a deep learning model commonly used in the field of computer vision. CNN is inspired by the biology of the visual cortex. There are a small number of cells in the visual cortex that are sensitive to certain areas of vision. An interesting study conducted by Hubel and Wiesel in 1962 elaborated on this point of view. They verified that some individual nerve cells in the brain can only respond (i.e., fire) when there are edges in a specific direction [
21]. For example, some neurons are only excited on vertical edges, while others are excited on horizontal or diagonal edges. Hubel and Wisesl found that all these neurons are arranged in columnar structures and work together to produce visual perception. The view that specific components in a system have specific tasks (the neuronal cells of the visual cortex look for specific features) is also applicable in machines, which is the basis of CNN. Based on this point of view, CNN consists of a series of convolutional layers, nonlinear layers, pooling (down sampling) layers, and fully connected layers, and finally achieves a probability output. Because CNN finally converts the input image into a small but deep feature map, the general routine is to use a unified and relatively small kernel (for example, VGG uses 3 × 3), but with the network. As the depth increases, the output channel also increases (the things learned become increasingly complicated), so it is necessary to use Conv Block to convert the dimensions before entering the Identity Block, so that the Identity Block can be continuously connected later. ResNet has two basic blocks: one is Identity Block, where the dimensions of input and output are the same, so it can connect multiple in series, while the other is Conv Block, where the dimensions of input and output are different, so they cannot be connected in series [
9]. The function is to change the dimension of the feature vector. The combination of the two makes the learning result more sensitive to the fluctuation of the network weight and solves the problem of network degradation as the convolutional layer increases.
Therefore, the multi-layer-resnet50 model was used as an experimental model. After 200 epoch training, the network performance was superior to other RGB-based networks. Cross-validation yielded F1 scores of 82–86% per fold. External testing showed a slight drop in accuracy, confirming generalizability but also highlighting areas for improvement.
Table 3 shows the test results of different models on different databases, where we used a CNN architecture, which consists of three convolutional layers with 32, 32, and 64 filters having 5 × 5, 5 × 5, and 3 × 3 filter sizes, one fully connected (FC) layer, and one classification layer as the benchmark model. In all convolution operations, zero padding was used. Max-pooling was used between layers. Among them, only the RGB channels used the network denoted as S-CNN-RGB, while all spectral channels used the network denoted as S-CNN-All. We also trained GoogleNet and ResNet-50, termed as E-GoogleNet and E-ResNet50 for comparison. The results show that using multispectral images as input performs better than using only RGB 3-channel images. Furthermore, the model using original inputs combined with the NDVI and NDWI achieved the best performance.
Figure 4 shows the prediction results for the 2021 flooding in Germany. The news outlet CNN reported that, between July 12 and 15, more than 220 people died in this flooding disaster and that countless buildings and roads were destroyed. Comparing the land classification results before and after flooding, it can be seen that the water-body area increased, and some built-up area became water, which means this area might be a key disaster area that requires pixel-level classification and building damage level detection.
In our experiments, we applied standard CNNs and ResNet-based architectures for water-body segmentation using remote sensing inputs. However, almost all deep learning models are known to be data-hungry and prone to overfitting, particularly when trained on class-imbalanced datasets. While achieving promising benchmark accuracy, model generalization remains a concern. To alleviate overfitting, future iterations will incorporate transfer learning from pretrained satellite image encoders, synthetic data augmentation strategies, and loss function adjustments such as focal loss or class-balanced loss to better handle skewed label distributions. It is also clear that the current approach cannot guarantee the detection of one-day floods due to the five-day revisit interval of Sentinel-2. Instead, our focus is on rapid assessment within 24–72 h after data availability—not flood occurrence. For true real-time monitoring, SAR data fusion or high-temporal-resolution sources (e.g., PlanetScope) are necessary.
5.3. Case Study 2: Muti-Hazard Building Damage Detection Based on the Self-Built Database
As mentioned earlier, our forecast of flood impact is mainly focused on residential areas, so how to identify the post-disaster damage of individual buildings is the focus of this case study. In this part, we propose a new model, which uses the triplet network structure and ResNet50 network as a feature extractor with a linear classifier. It aims to combine pre-disaster and post-disaster images as a high-dimensional input, and learn meaningful features through distance comparison to classify its damage level. The triplet network judges the similarity between three inputs by comparing the distance between them. It consists of three identical feedforward neural networks that share parameters with each other. When three samples are inputted, the model will output two values. They are the L2 distance of the embedded vector of two of its inputs (anchor samples with samples of the same class and samples of the different class) [
22]. The training process has three phases: the initial feature exactor, the training exactor, and the training classifier.
The network structure of the feature exactor part is only suitable for binary classification problems, so in this section we only consider samples that are in the same class as input, without considering their specific category. We first randomly selected a sample of the same class and a sample that is not in the anchor input’s class for the anchor input as
and
. We then input them into three ResNet50 models with the same structure and shared weights for feature extraction. The extracted features are all (1 × 2048) vectors, which are, respectively, named
,
, and
. In order to make the distance between objects of the same category shorter, the distance between different categories is as long as possible. Here we respectively calculate the Euclidean distance between
and
, and the Euclidean distance between
and
as
and
. At this time, triplet loss can be expressed as Equation (
1), where
is a self-defined margin, and
l is the label showing which example is closer to
x.
l is 1, which means
is closer to
x; otherwise,
is closer.
We will train the entire model after obtaining the initial model and feature dataset. The model includes two parts: the feature exactor and the classifer. First, we use the initial feature exactor to extract features from the input x to obtain , and we then find all features of the same category and different categories from the feature dataset according to the disaster level of x. We then average them separately as and . Thirdly, we randomly select b samples from the same feature data and different feature data, and find the sample from the different feature data that is closest to x and the sample from the same feature data with the farthest distance from x, defined respectively as and . After that, we calculate the average of and , which is used to calculate the L2 distance between the anchor sample and the positive/negative sample, which are termed as and . Finally, we use reducing to obtain the triplet loss and back-propagate to update the network parameters.
When the feature exactor completes a round of training, we use it to update the feature dataset, and we then use all data in the feature dataset and their corresponding disaster levels as labels to train a simple classifier. In our case, a SVM was trained with a linear kernel as classifier.
Since the number of buildings in each disaster level is very different, we chose to only use part of the flooding data to create a balanced dataset to train the Tri-BDDN model. In our study, we randomly selected 400 images for each damage level as the training dataset and 130 as the validation dataset. The following tables show the test result for this case study. The confusion matrix (
Table 4) and the object level damage detection test result (
Table 5) shows that the network performance is balanced, and similar accuracy can be obtained for different damage levels. We can also see that the network has relatively good performance on small datasets.
Figure 5 shows the detection results of part of the xBD dataset. Different colors represent different disaster levels. Red means destroyed, yellow means major damage, green means minor damage, white means no damage, and black means background. It is worth mentioning that this model focuses on individual houses and does not include the building footprint extraction part.
6. Weakly Supervised Deep Learning for Remote Sensing
6.1. WSL for RS Data Understanding
In recent years, researchers have continued to push the boundaries of deep learning by exploring new architectures and techniques to improve model performance. One of the most popular models in traditional deep learning areas is the convolutional neural network (CNN), which is specifically designed for processing and analyzing visual data such as images. CNNs are characterized by their use of convolutional layers, which apply filters to input data to extract spatial features, and pooling layers, which down-sample the feature maps to reduce dimensionality and extract key information [
23]. The other notable advancement is the Vision Transformer (ViT), a deep learning architecture that leverages self-attention mechanisms to capture long-range dependencies in images. Unlike traditional CNNs, which process images in a hierarchical manner, ViT treats images as sequences of tokens, allowing for more effective feature extraction and classification [
24].
By combining CNN and ViT, researchers are also exploring the potential of weakly supervised learning (WSL) in image understanding to bridge the gap between visual interpretation and pixel-level delineation in image understanding tasks [
25]. WSL techniques aim to learn from data that is only partially labeled, making them well-suited for tasks where obtaining precise annotations is challenging or impractical. Instead of relying on fully labeled datasets, WSL algorithms use image-level labels or bounding boxes to draw pixel-level segmentation results. These approaches have the potential to provide more accurate and robust models for tasks like object detection, semantic segmentation, and image classification, enabling us to extract valuable insights from visual data with greater efficiency and reliability.
However, after looking through the recent works, almost all of them were trained on the classical RGB images. None of them is used for RS data understanding. There is a significant need for one WSL model that can be applied on RS data and to natural disaster management as we have.
6.2. Case Study: Global Landscape and Flood Impact Mapping
This model introduces an ambitious research effort to bridge this significant gap by exploring the BigEarthNet dataset. The application context or the engineering significance is to resolve an outstanding research challenge, which is to assess global flood impact in near-real time.
The proposed methodology uses some comprehensive and advanced techniques, blending attention mechanisms and Multiple Instance Learning to develop a novel framework for global flood impact monitoring. By seamlessly integrating deep learning feature extraction, the transformative Vision Transformer architecture, and a novel contrastive loss function framework, this methodology is proposed to help the transition from caption-level labeled remote sensing data to high-fidelity pixel-level flood impact maps applied to Sentinel-2 imagery.
Table 6 shows that our proposed method achieves a precision of 53.4%, indicating the percentage of correctly classified landscape pixels among all pixels predicted as belonging to each specific class. This shows the effectiveness of our approach in accurately predicting different landscape classes within the imagery. The F1 score stands at 61.89%, which provides a balanced measure of the model’s overall performance, considering both its ability to correctly classify landscape pixels and its ability to capture all relevant landscape features. Comparing our proposed method with existing fully supervised and weakly supervised models such as MCTformer, the ArcGIS Land Cover Classification Model, and the RS-ResNet Model, our approach has the best performance across precision, recall, and F1 score metrics, marking its effectiveness in accurately segmenting landscapes across various environmental contexts. This trade-off is justified in data-scarce disaster contexts.
Figure 6 shows some samples for the visual inspection of segmentation results, which intuitively shows the performance of our proposed method to capture complex landscape features, ranging from rugged terrains in the western United States to lush vegetation in the middle regions, and to the vast coastline in the eastern states. The segmentation maps generated by our model looks similar with ground truth annotations, proving its ability to accurately classify and segment different landscapes in a variety of scenes. Our validation results based on the BigEarthNet dataset shows the proposed method’s efficacy for capturing landscape features across diverse geographical regions, showcasing its potential for various applications, including environmental monitoring, land cover classification, and urban planning.
7. The GloFIM Gateway Development
Visualization can directly reflect the data, which is conducive to subsequent analysis and decision-making. If the user is not sensitive to the data, the visualized image can play the role of emphasis and “translation.” Moreover, visualization can transmit information quickly and display multi-dimensional data at the same time. For example, users can pay attention to changes in water bodies and urban areas at the same time, and important information will not be missed. On the other hand, the visualized results can explain the point of view more intuitively, bring a deeper impression to the viewer, and better explain the information. The human–computer interaction page not only ensures that ordinary users can also use the disaster detection model we developed without barriers, but also gives users the right to independently choose the observation location, monitoring time, and so on, so that the model can better serve users. Since the model we developed is mainly oriented to the public and experts in the field of civil engineering, most of them do not have the ability to compile code, which is the main reason why we need to develop a user-friendly interface. Moreover, if we have a human–computer interaction page, we can also connect the previous research results with the currently developed model. Based on the previous work, we developed a user-friendly gateway named the GloFIM gateway, a global flood impact monitoring gateway.
While cloud-based services like Google Earth Engine and NASA HDDS offer powerful analytics, very few publications critically evaluate their use for real-time disaster management or propose alternative lightweight deployments. GloFIM differs from Google Earth Engine and NASA HDDS by integrating pretrained ML flood detection models in an automated workflow, targeting operational users with minimal technical expertise, and incorporating modular microservices for real-time model inference, not only data access or visualization.
The GloFIM Gateway is a modular, cloud-deployable platform that can enhance usability for decision-makers during flood events. The system aggregates multi-source flood mapping outputs, dynamic visualizations, and real-time model predictions from various remote sensing and machine learning services.
Figure 7 shows GloFIM’s architecture. The near-real-time gateway pipeline was trained offline using xBD and BigEarthNet datasets. Once models were validated, they were deployed within a cloud-based microservice structure that ingests newly available imagery, preprocesses it automatically, and applies the trained classifier to generate flood maps. It includes applications that can find all available data in the focus area and in a given date range, download Sentinel-2 images, and classify them pixel by pixel automatically. This gateway can be used in flooding monitoring. For example, if it is known flooding has occurred on a given day, the user can detect the pre- and post-event images to compare their water-body area, which can help one to determine the most flooded area.
Figure 8 shows two ways to use the GloFIM Gateway. It can mark the entire flooding area, the server level, the starting date, and the ending date based on the output from MoM track2. The user can choose from markers shown on the map to make predictions. Users can also draw out or upload their focused area and choose a searching data range as a customized input. If there is no eligible data, GloFIM will alert the user. When the ML model finishes prediction, GloFIM will overlap the prediction map with the Open Street Map or other maps and show it. The user can also download the predicted GeoTIFF file by clicking the “download” button.
However, this gateway still has some room for improvement. For example, the platform provides centralized flood intelligence. Its real-world deployment depends on computational scalability, network bandwidth, and access to reliable satellite feeds—factors that can be challenging in remote or disaster-stricken regions. Future development will focus on optimizing GloFIM for offline caching, lightweight edge processing, and integration with mobile GIS apps to improve field operability under constrained conditions.
8. Discussion
In summary, the resolution of a remote sensing image refers to the size of the smallest unit that can be distinguished in detail on the image, or a measure of the smallest angle or linear distance at which a remote sensor can distinguish two targets. Because the remote sensing images are made from different-definition photographic equipment at different heights and mounted on different carriers, these remote sensing images are photos with different definitions and resolutions. Images with different resolutions can be used in different areas. For example, low-resolution images like Sentinel-2 images can be used for patch-level or pixel-level landscape prediction based on machine learning or deep learning models, since each pixel covers a 10 by 10 m area, which means it can only be used for rough surface classification. When the machine learning model or the patch-level deep learning model shown before performs land classification, though the change detection method can be used to obtain the land surface changing information, the human-in-the-loop method is still chosen. Firstly, due to the low resolution, it is not hard for experts to compare the pre- and post-event prediction maps, which can lead to a better result than the change detection method. Secondly, the cloud coverage changed between pre- and post-event image pairs, so the change detection map will yield unnecessary information, and experts still need to manually review the output to extract effective information.
For high-resolution images, the situation is different. For example, the xBD dataset’s resolution is 0.5 m/pixel, which means land surface details like buildings and roads can be seen. Therefore, this dataset can be used for object damage state detection. However, with the acceleration of urbanization, urban agglomerations have become denser, and the types of buildings have become more abundant. In many developed densely populated urban areas, such as Queens, New York, the density of houses has reached an unimaginable level. This also means that it is difficult for people to distinguish the damage of buildings one by one with the naked eye. This also requires manpower and material resources. Overly dense urban buildings can also easily lead to judgment errors by experts, such as incorrect house matching or light and shadow image building forms. Therefore, in this case, we adopted a change detection method to automatically identify building damage, and this model not only can quickly and efficiently obtain the disaster map, but also facilitates follow-up research and the processing of experts.
Based on this, we believe that the research and development of disaster detection models based on optical remote sensing images is still necessary and of practical value. However, much work needs to be done. One task is the visualization of monitoring results and the development of human–computer interaction pages that are user-friendly. As shown in the example in
Figure 9, it is not difficult to see that, although the waterbody prediction maps are provided, we still need to conclude what is affected by the flood by comparing the classification results of the same location before and after the disaster manually. Research can then be done using more data. While this paper mainly focuses on optical imagery for global disaster detection, we acknowledge that the sole reliance on optical data may constrain model robustness in certain scenarios, particularly under adverse weather conditions. Sentinel-2 and xBD datasets were emphasized for their spatial and temporal richness; however, these are inherently limited during cloud-covered flood events. To enhance flood detection robustness, future efforts should incorporate data fusion techniques like combining optical data with radar or UAV-derived imagery to improve reliability across varied environmental conditions and terrains. Our future work will explore SAR-optical hybrid networks, including late-fusion and attention-based architectures, to mitigate cloud occlusion and enable 24/7 flood monitoring. Sentinel-1’s open availability and revisit frequency make it a strong candidate for integration.
In summary, while we employed publicly available datasets such as xBD and BigEarthNet, which have become widely adopted benchmarks in remote sensing for disaster monitoring and provide multispectral imagery and annotated flood-affected regions across multiple countries, these datasets disproportionately represent urbanized or developed regions, potentially limiting model effectiveness in rural, tropical, or underserved flood-prone areas. Future efforts should focus on expanding dataset coverage to include diverse geographies and flood typologies to improve generalizability and fairness in predictive modeling.
9. Conclusions
We have here reviewed the process and development history of disaster detection, and on this basis summarized the advantages and disadvantages of previous methods. We also summarized the remote sensing image data and its characteristics. We justified the decision to use Sentinel2 as the main data of the experiment. After that, we described a case study using different methods. We classified Sentinel2 data at the pixel level with a simple machine model and manual labeling of data. This method is simple and efficient, and it is very meaningful for emergency response applications that have high practical requirements. Next, we combined the theory of big data, used the BigEarth dataset and EuroSAT data to build a database, used that database to train a simple classification model of patch levels, and achieved remarkable results. Finally, we used a novel ternary network to monitor the building disaster level of the object level. The model performed well and was shown to have strong practical value.
We also discussed the advantages and disadvantages of optical image and radar images, and put forward feasible development and improvement plans. We believe that this project is of great significance to the stable development of human society and can provide new ideas for subsequent disaster detection. We believe that with people’s continuous research and efforts, we can live in harmony with nature and minimize the losses to society caused by disasters.


 ,
, 


