Article

Assessing Climate and Land Use Change Impacts on Ecosystem Services in the Upper Minjiang River Basin

1
Chengdu Institute of Biology, Chinese Academy of Sciences, Chengdu 610213, China
2
Institute of Tibetan Plateau Research, Chinese Academy of Sciences, Beijing 100101, China
3
Global Institute for Interdisciplinary Studies, Kathmandu 44600, Nepal
4
State Key Laboratory of Cryospheric Science and Frozen Soil Engineering, Northwest Institute of Eco-Environment and Resources, Chinese Academy of Sciences, Lanzhou 730000, China
5
Mangkang Biodiversity and Ecological Station, Tibet Ecological Safety Monitor Network, Changdu 854000, China
*
Author to whom correspondence should be addressed.
Remote Sens. 2025, 17(11), 1884; https://doi.org/10.3390/rs17111884
Submission received: 22 March 2025 / Revised: 19 May 2025 / Accepted: 26 May 2025 / Published: 29 May 2025

Abstract

:
Ecosystem services (ESs) are fundamental to human well-being, yet the capacity of ecosystems to provide ESs is increasingly altered by anthropogenic climate and land use changes. Understanding how climate change and land use change impact ecosystem service (ES) dynamics is critical for promoting sustainable region development in ecologically sensitive regions. Using the InVEST model and a scenario-based framework, this study assesses the relative contributions of climate and land use changes to water yield, soil conservation, carbon sequestration, and habitat quality in the upper Minjiang River basin, China from 1990 to 2020 and projects ES changes under future climate and land use scenarios for 2050. Our results show that climate change played a dominant role in increasing water yield and soil conservation services, particularly after 2000, while land use changes enhance carbon sequestration and habitat quality. Although forest expansion contributed positively to carbon storage and erosion control, the loss of grassland and increased construction land reduced habitat quality and intensified erosion risks in some areas. Scenario simulations for 2050 demonstrate that the ecological protection scenario yields the most balanced improvements in all four ESs. These findings highlight the distinct roles of climate and land use changes in shaping ecosystem service provision and offer a scientific basis for promoting the sustainable regional environment in alpine regions under changing climate and land use.

1. Introduction

Global climate change and increased anthropogenic land use changes have significantly altered ecosystem functions and services [1,2,3]. Understanding the ecological impacts of climate and land use changes is critical to managing the human-nature relationship and achieving the sustainable development goals [4]. Ecosystem services (ESs), generally classified into provisioning, regulating, supporting, and cultural services [5,6], refer to the products or benefits, directly or indirectly obtained from ecosystems. These services play an irreplaceable role in human well-being [5] and integrating ESs into sustainable development strategies is vital for achieving the Sustainable Development Goals (SDGs) [6,7]. However, the capacity of ecosystems to provide ESs is declining at an unprecedented rate due to anthropogenic activities, including climate change and land use change [8], affecting global and regional sustainability [9] and human well-being [10]. Given these challenges, continuous monitoring and evaluating of ES dynamics are essential to elucidate the underlying divers of change and informing decision-makers in formulating effective environmental management strategies. Currently, ES evaluations are broadly categorized into monetary and non-monetary approaches [11]. With the development of GIS (Geographic Information System) and improved understanding of ecosystem processes, several ES assessment models have been developed. Among these, the InVEST (Integrated Valuation of Ecosystem Services and Tradeoffs) model has gained widespread popularity for mapping and valuing ESs, serving as a decision support tool for environmental planning and management [12,13].
Climate change and land use changes are recognized as major direct drivers of change in nature and its contribution to human well-being [14,15]. Land use change (LUC), a key indicator of human-induced environmental modification, not only underpins socio-economic development but also contributes to biodiversity loss and the decline of multiple ESs [16]. Studies have quantified the changes in ESs resulting from both the combined and independent effects of climate change and LUC [17] through scenario analysis in China [18,19] and elsewhere. For example, Li et al. [20] showed that LUC primarily drives the changes in water yield in Karst mountainous areas, while soil conservation is greatly influenced by climate change. Ma et al. [21] and Xiao et al. [22] found that water yield and soil conservation dynamics in the Zhejiang and Liaoning Provinces in China, respectively, are mainly governed by climate change. Furthermore, Zhang et al. [23] and Sun et al. [24] constructed future climate and LUC scenarios to explore their combined effects in the Xijiang River Basin and Yunan Province, respectively. These findings indicate that ES networks are more sensitive to LUC [23], whereas future climate and land use changes are projected to exert negative impacts on water conservation and water quality purification [24]. These studies highlight the spatial and scale-dependent variations in the relative contributions of climate and land use change on ES, making broad generalizations difficult. Such uncertainties demand further investigation into the underlying mechanisms driving ES dynamics in response to climate change and LUC, both independently and jointly. This understanding is essential for promoting sustainable regional development and enhancing ES provision in the upper reaches of the Minjiang River, an ecologically significant region of China currently undergoing rapid climate changes and land transformations driven by both anthropogenic activity and geological hazards.
Mountain ecosystems play a critical role in ecological processes, providing important regulating services, such as soil preservation, biodiversity conservation, carbon sequestration, and water purification [25]. However, unsustainable exploitation of mountainous regions has resulted in severe ecological degradation worldwide, including China, undermining their natural capacity to deliver various ESs [26]. In response to ecological degradation, China has introduced the “Production-Living-Ecological Space” framework to promote efficient, livable, and environmentally sustainable land use [27]. While the implementation of new land use policies that include land engineering and spatial optimization of urban–rural areas are expected to influence mountainous ecosystems, climate change has already exerted significant impacts on ecosystems and associated ESs of the Qinghai–Tibet Plateau [28,29].
The upper reaches of the Minjiang River—a transitional zone between the Qinghai–Tibet Plateau and the Chengdu Plain—possess a unique natural geography and ecological environment, making the region highly significant for ecological protection and sustainable development. This typical mountain valley landscape is ecologically fragile [30] and its complexity is further complicated by its status as a multi-ethnic agglomeration area [31]. In recent years, rapid urban expansion and tourism development have exacerbated the environmental pressures, resulted in substantial alterations in natural ecosystems [32], and increased soil erosion [33], the frequency of natural disasters, and hydrological disturbances in the Minjiang River [34]. Since the early 2000s, several ecological restoration initiatives, including “Natural Forest Protection” and “Grain for Green” programs, have been implemented in the region, contributing to notable land use transformations. Given the compound effects of climate change, particularly warming and land use transformations, driven by new policies, research on ES dynamics in this region holds both scientific and practical significance to regional sustainable development [35].
Therefore, this study aims to: (1) assess the spatial and temporal changes in climate and land uses in the upper reaches of the Minjiang River from 1990 to 2020, and simulate future changes for 2050; (2) evaluate the spatial and temporal variations in ESs under the combined influence of climate and land use changes; (3) compare ES dynamics under different simulated scenarios; and (4) quantify the independent contributions of climate and land use changes to ESs and their temporal dynamics. Understanding these contributions is essential for optimizing land resource allocation, formulating effective land use policies, developing climate adaptation strategies, and promoting sustainable ecosystem management.

2. Materials and Methods
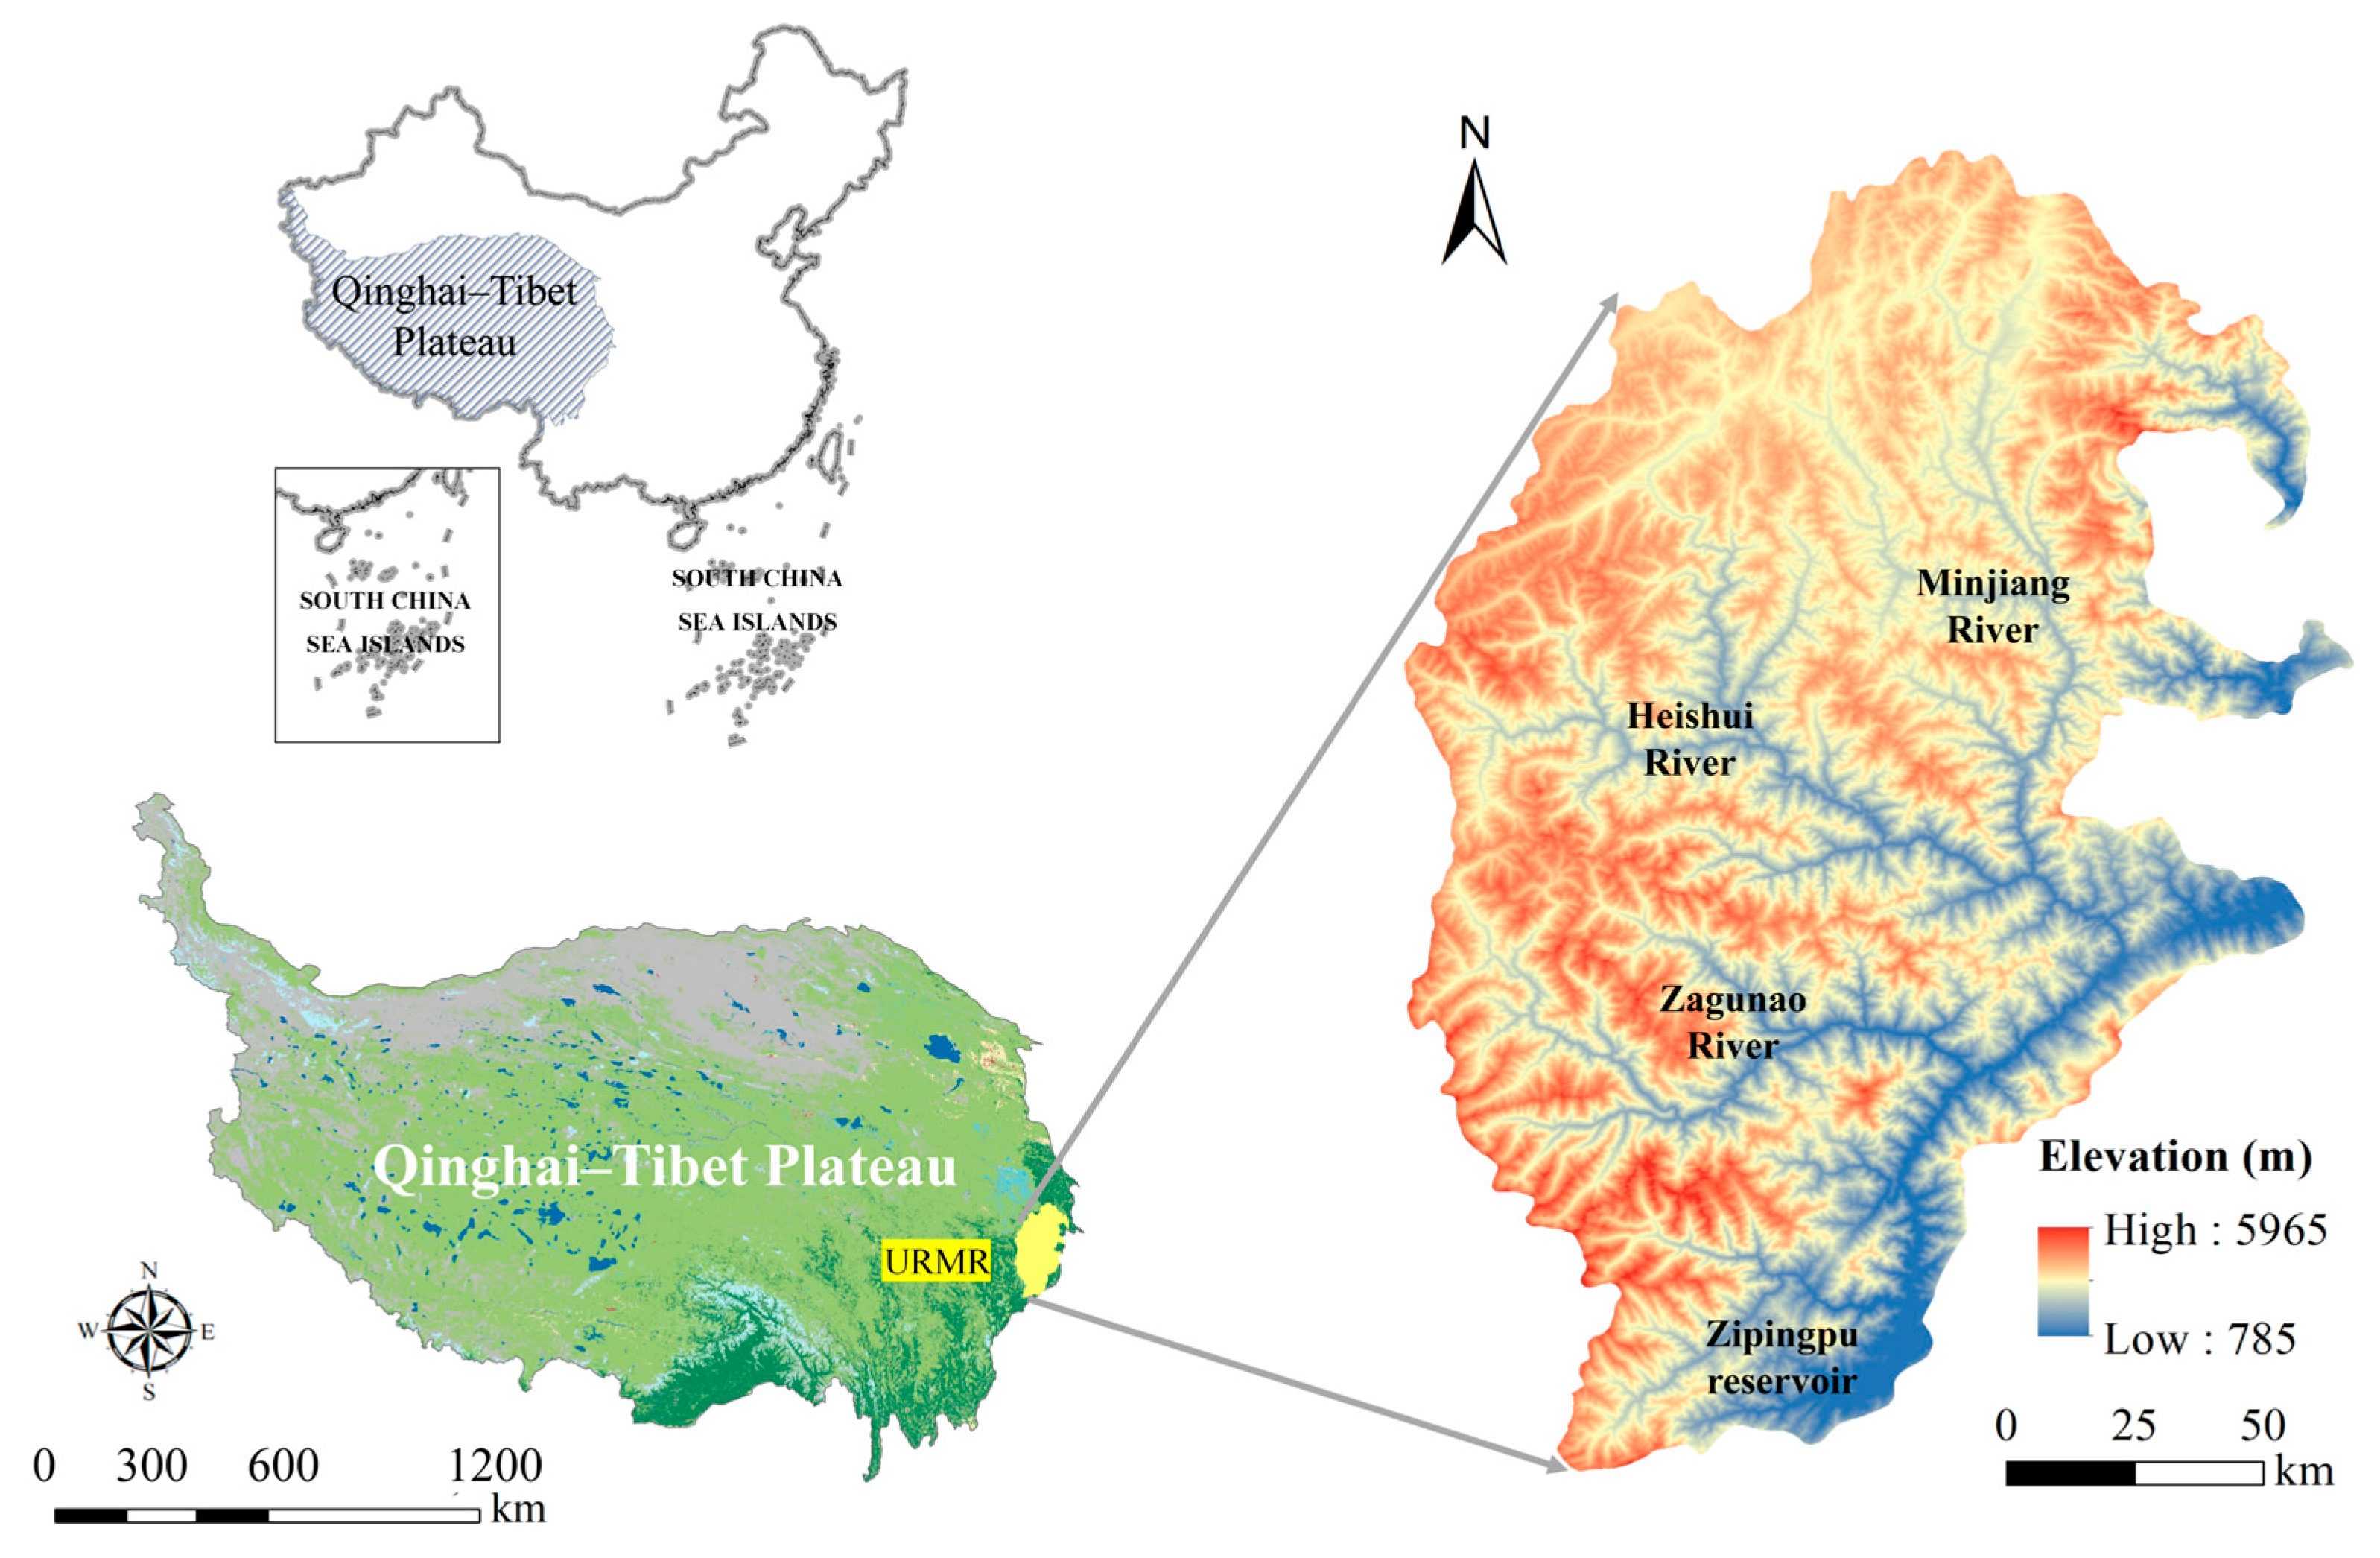
2.1. Study Area

The upper reaches of the Minjiang River (URMR) encompass the area above the Zipingpu Reservoir, including the river’s headwater areas and the tributaries of the Heishui River and the Zagunao River (Figure 1). Covering approximately 2.48 × 10⁴ km2 basin area [36], this region largely overlaps with the administrative districts of Songpan, Heishui, Mao, Li, and Wenchuan in Aba Tibetan and Qiang Autonomous Prefecture of Sichuan Province. The region is characterized by a plateau monsoon climate, with vertical temperature gradients, distinct seasonal transitions, and concentrated rainfall with annual rainfall between 600 and 900 mm. Dominant soil types include sub-alpine meadow soil, cold desert soil, and loess, which support diverse vegetation types, such as broad-leaved forests, coniferous forests, coniferous forests, shrubs, and meadows, which collectively contribute to the region’s rich biodiversity. There are many nature reserves in the URMR, such as Wolong, Huanglong, Caopo, Baiyang, and Miyaluo, established to preserve the regions’ biodiversity.
Located at the eastern edge of the Qinghai–Tibet Plateau, the URMR lies in the northern Hengduan Mountains and northwestern Sichuan and is predominantly plateau and mountainous terrain, with elevations ranging from 785 m and 5965 m. Tectonic activity caused by structural expansion and compression has resulted in well-developed folds and active fault structures, making the region prone to geological hazards, such as mountain floods, debris flows, and landslides, rendering it one of the most disaster-prone areas in China [33]. Recently, the Ms 8.0 Wenchuan Earthquake on 12 May 2008 caused profound ecological disturbances, significantly altering local landscapes and ecosystem functions.
Despite its ecological significance, the region is economically underdeveloped, resulting in high dependence of local communities on natural resources for their livelihoods. The URMR region is sparsely populated and is home to Qiang, Tibetan, and Hui ethnic minorities, who live in compact settlements. The region serves as a historical migration corridor, marking the transition between traditional Chinese farming cultures and nomadic pastoralism.

2.2. Data Collection

To assess the impacts of climate and land use changes on ESs in the URMR, this study used multiple datasets:
(1)
Land use land cover (LULC) data: Land use land cover datasets with 30 m spatial resolution from 1990 to 2020 were obtained from Wuhan University. These LULC data were classified into cultivated land, forest, grassland, water body, construction land, and unused land following the classification system of the Chinese Academy of Sciences.
(2)
Digital elevation model (DEM): This DEM data with 30 m resolution were gathered from the Geospatial Data Cloud.
(3)
Meteorological data: Data on temperature, precipitation, and potential evapotranspiration with 1 km resolution from 1990 to 2020 were obtained from the National Tibet Plateau Data Center.
(4)
Soil data: Soil data with 1 km resolution were obtained from the World Soil Database through the National Qinghai–Tibet Plateau Data Center.
All datasets were resampled to a uniform 30 m resolution using a cubic convolution technique in the ArcGIS 10.7 software and clipped to the extent of the study area. Data sources of these datasets are listed in Table 1.

2.3. ESs Assessment and Mapping

ESs are broadly categorized into provisioning, regulating, supporting, and cultural services [37]. Based on previous research [38,39], the ecological and geographic characteristics of the URMR, and the availability of data, we selected four relevant ESs for assessment and mapping: water yield, soil conservation, carbon sequestration, and habitat quality. We applied the InVEST model, a widely used open-source tool designed for mapping and valuing ecosystem services to inform environmental decision-making [12].

2.3.1. Water Yield

Water yield is a critical ES in the URMR, supporting agricultural production, domestic, and ecological needs both locally and downstream and maintaining regional water balance [40]. The region has distinct dry and wet seasons, and its arid river valley topography strongly influences hydrological processes. Assessing water supply and demand dynamics is essential for the optimal use and protection of water resources. Thus, water yield was selected as a key evaluation index.
The water yield module of the InVEST model is based on the regional water balance principle [41], incorporating climate, soil, terrain, and vegetation parameters to improve simulation accuracy and applicability [42]. The model uses the following formulas to calculate water yield:
WY = ( 1 A E T P r e ) × P r e
A E T P r e = 1 + P E T P r e [ 1 + ( P E T P r e ) ω ] 1 ω
where WY represents the water yield capacity, AET represents the actual evapotranspiration (mm), PET is the potential evapotranspiration (mm), Pre refers to annual precipitation (mm), and ω is the empirical parameter.

2.3.2. Soil Conservation

Soil conservation services are estimated by measuring the difference between potential soil loss (under bare conditions) and actual soil loss (under existing vegetation and land management) [43]. We used the SDR (sediment delivery ratio) module of InVEST to estimate soil erosion under both conditions, defining soil conservation as:
SC = RKLS − USLE
RKLS = R × Ks × LS
USLE = R × Ks × LS × C × P
where RKLS represents the potential soil erosion (t/hm2), USLE represents the actual soil erosion (t/hm2), R denotes the precipitation erosion factor derived from daily rainfall data [44], Ks represents the soil erodibility factor [45], LS represents the slope length–gradient factor calculated using DEM, C denotes the vegetation cover and crop management factor, and P represents the support practice factor that accounts for the effect of soil and water conservation measures [46].

2.3.3. Carbon Sequestration

Terrestrial ecosystems sequester carbon dioxide through plant photosynthesis, converting it into biomass and storing it in carbon pools, thereby facilitating carbon transformation [47]. In the URMR, forests and grasslands are the primary carbon sinks. The carbon sequestration module quantifies carbon storage by calculating the carbon content in above-ground biomass, below-ground biomass, soil, and dead organic matter for different land use types and adds these components to obtain the total carbon reserves as follows:
CS = Ca + Cb + Cs + Cd
where CS represents the total carbon reserves (t/ha), and Ca, Cb, Cs, and Cd denotes carbon density in above-ground biomass, below-ground biomass, soil, and dead organic matter (t/ha), respectively.

2.3.4. Habitat Quality

The URMR harbors rich biodiversity and critical river and glacial ecosystems, functioning as a high-altitude biodiversity reservoir resource and is recognized globally as an important “ecological source” [48,49]. However, increasing anthropogenic pressures threaten its habitat quality and integrity.
Habitat quality, a proxy for ecosystem health, was evaluated using the InVEST Habitat Quality (HQ) module, as this is widely used for habitat quality assessment [50]. This module relies on LULC data and incorporates threat factors (e.g., cultivated, construction, and unused land) to calculate a habitat quality index [51]. The InVEST-HQ model is computationally efficient and requires minimal input data, nevertheless the selection of threat sources depends entirely on existing expert knowledge and empirical observations. The habitat quality index is calculated as follows [12]:
H Q i = H i   ( 1 ( D i Z D i Z + K Z ) )
where H i represents the habitat fitness of land use type i, H D i denotes the total threat level, Z is the scaling parameter set at 0.05, and K is the half-saturation constant (initially set to 0.5, adjusted to half the highest threat level).

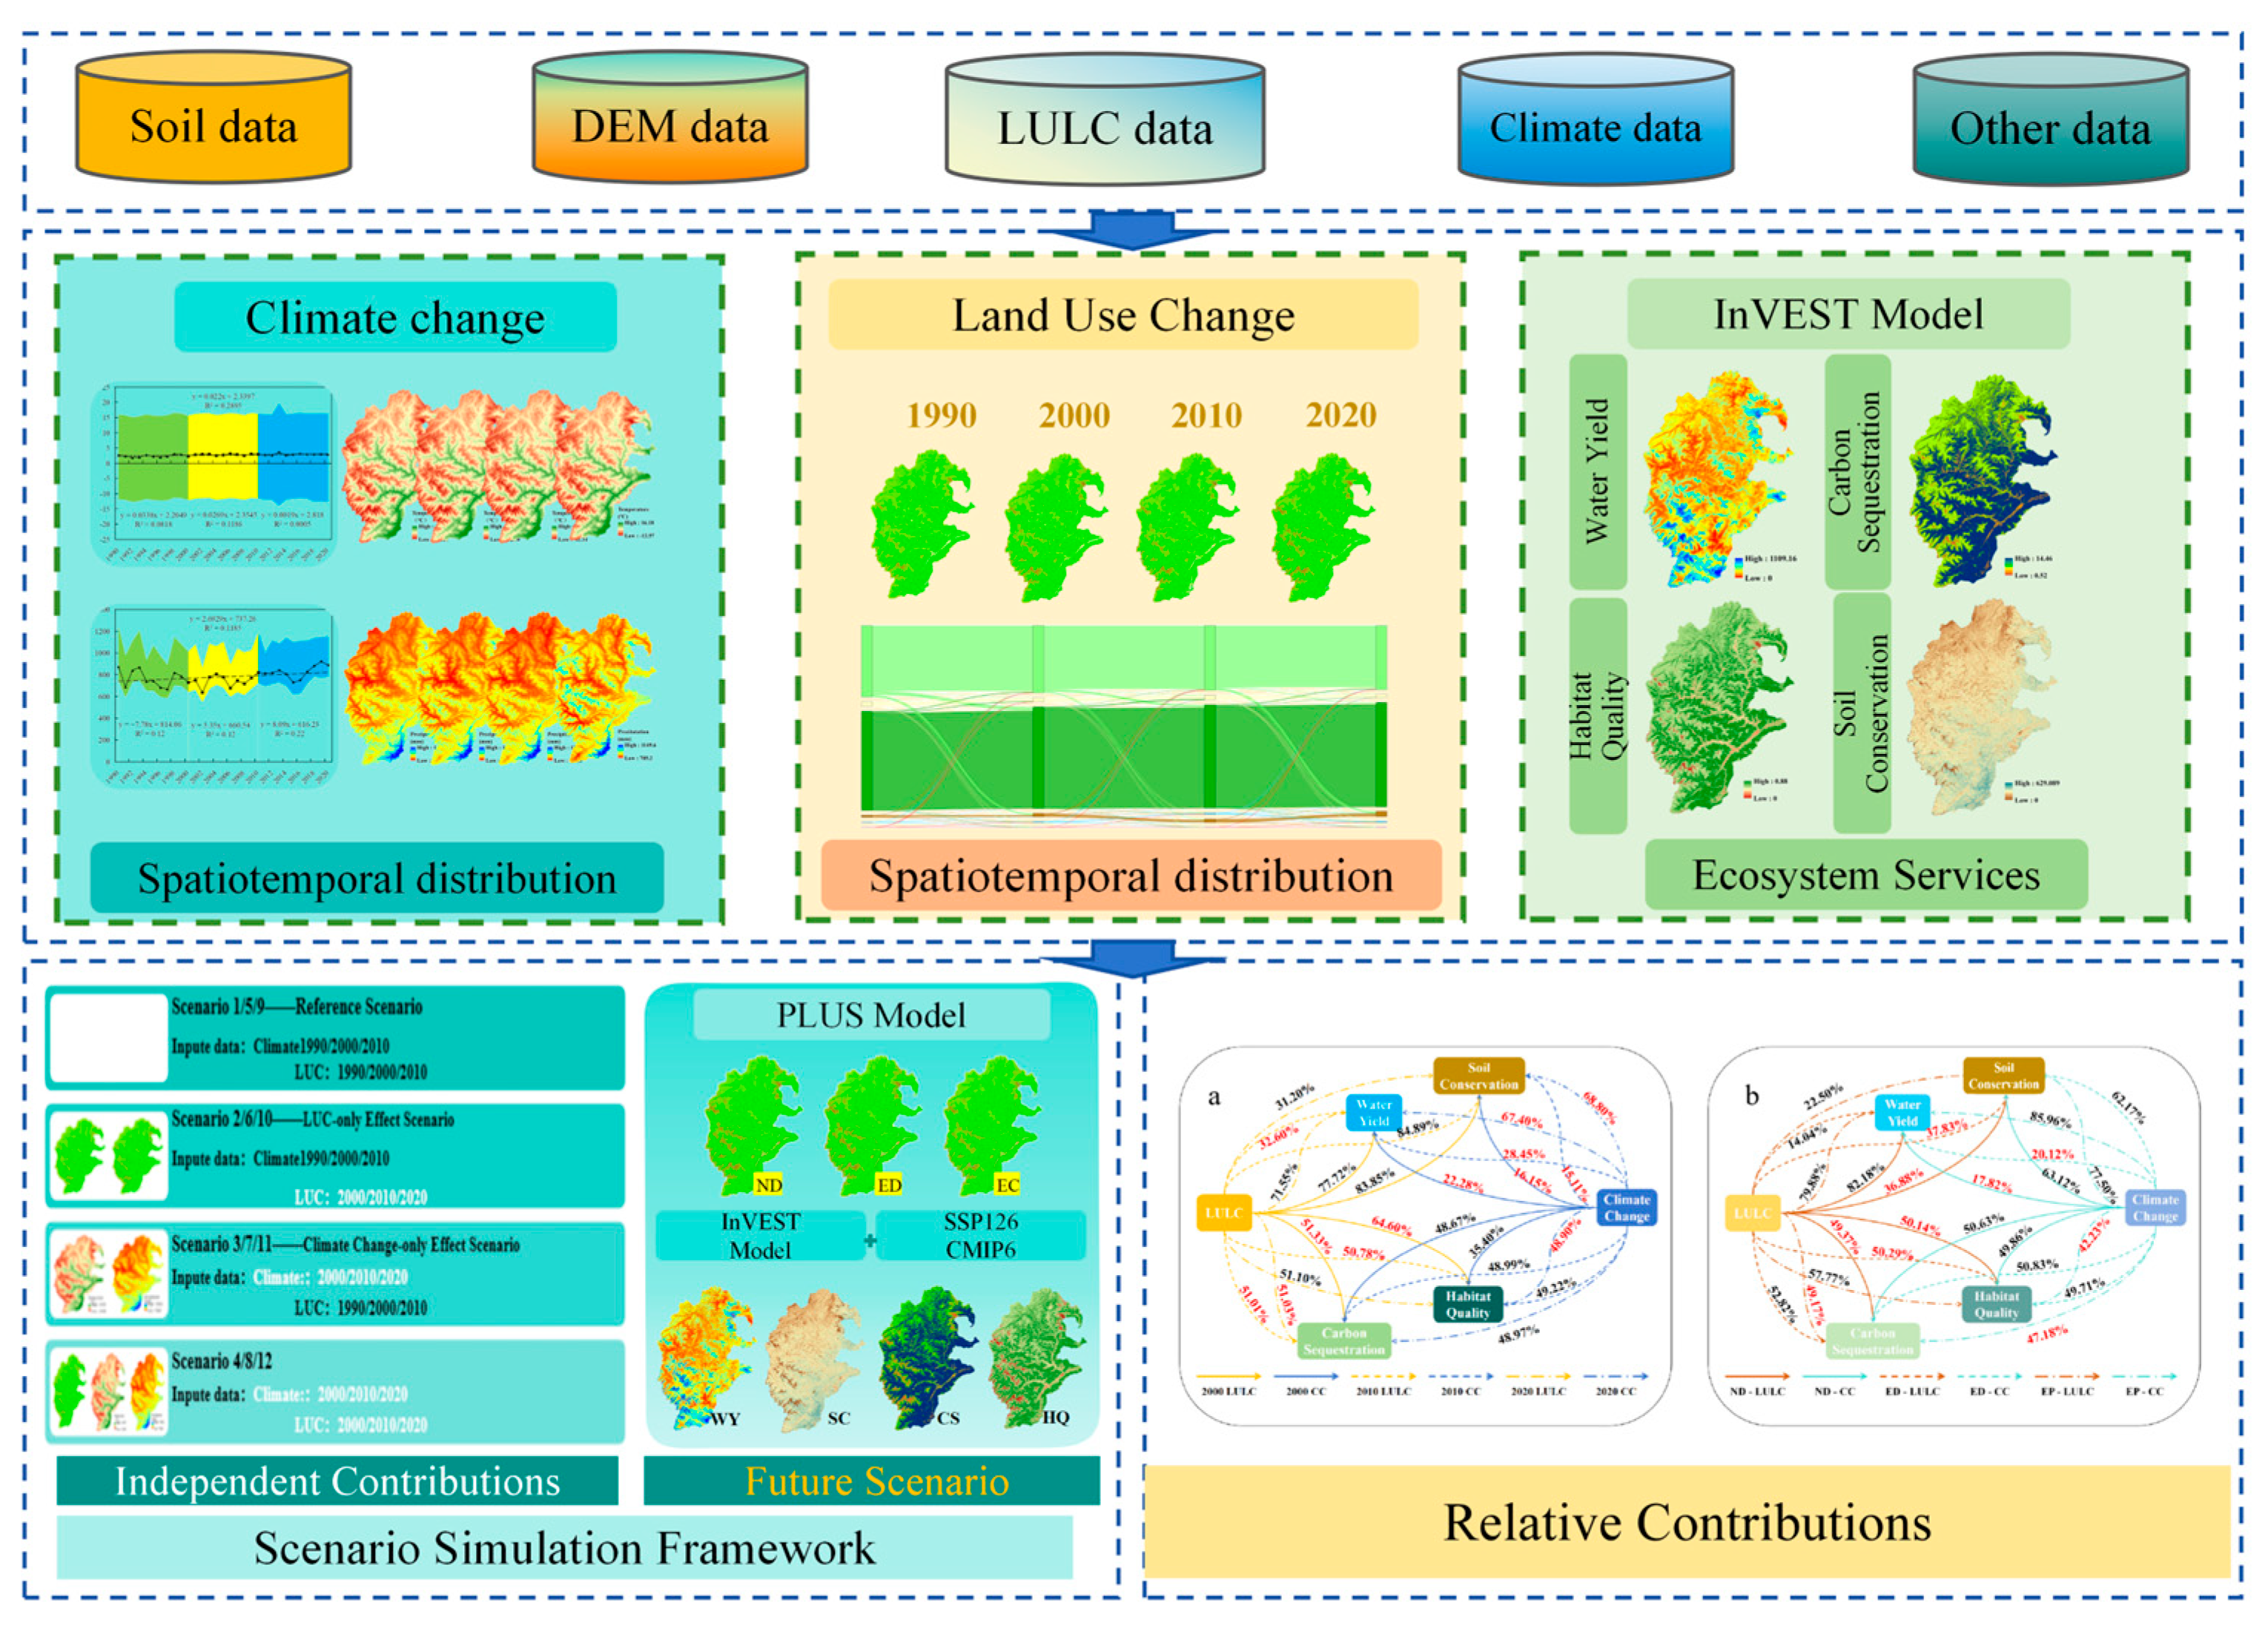
2.4. Scenario Simulation Framework

To simulate the impacts of climate and land use change on ESs, we developed three distinct scenarios: (a) land use change only, (b) climate change only, and (c) the combined effects of land use change and climate change. We evaluated the relative contributions of climate and land use changes over three time periods: 1990–2000, 2000–2010, and 2010–2020 (Table 2).
For 1990–2000, we defined the following scenarios:
  • Scenario 1 (baseline scenario): 1990 land use and 1990 climate data,
  • Scenario 2 (land use change effect only): 2000 land use data with 1990 climate data,
  • Scenario 3 (climate change effect only): 1990 land use data with 2000 climate data,
  • Scenario 4 (combined effects): 2000 land use data with 2000 climate data.
The same four scenarios were repeated for 2000–2010 and 2010–2020.
The relative contributions were calculated as follows:
∆ES = ESm − Ren
Clucc = (ESlucc − Ren)/∆ES × 100%
Ccli = (EScli − Ren)/∆ES × 100%
where ESm represents the modelled ES, Ren denotes the baseline ES. ESlucc and EScli refer to ESs under land use change only and climate change only, respectively, and Clucc and Ccli refer to the contributions of land use change and climate change to ES changes, respectively. The schematic of the methodology and simulation scenario framework is given in Figure 2 and Table 2, respectively.
Based on land use data of 1990–2020, the Patch-generating Land Use Simulation (PLUS) model was used to simulate three future land use scenarios for 2050, aligned with SSP-RCP frameworks under CMIP6 (Couple Model Intercomparison Project Phase 6).
Natural Development Scenario (ND Scenario): This scenario assumes that the future land change rate will be consistent with the magnitude of change observed in 1990–2020 with unrestricted land conversions.
Economic Development Scenario (ED Scenario): This scenario assumes a high and rapid development of the economy, resulting in an accelerated conversion of other land uses to construction land without ecological constraints.
Ecological Protection Scenario (EP Scenario): This scenario restricts conversion of lands with high-ecological benefits to low ecological benefits, promoting sustainable development.

3. Results

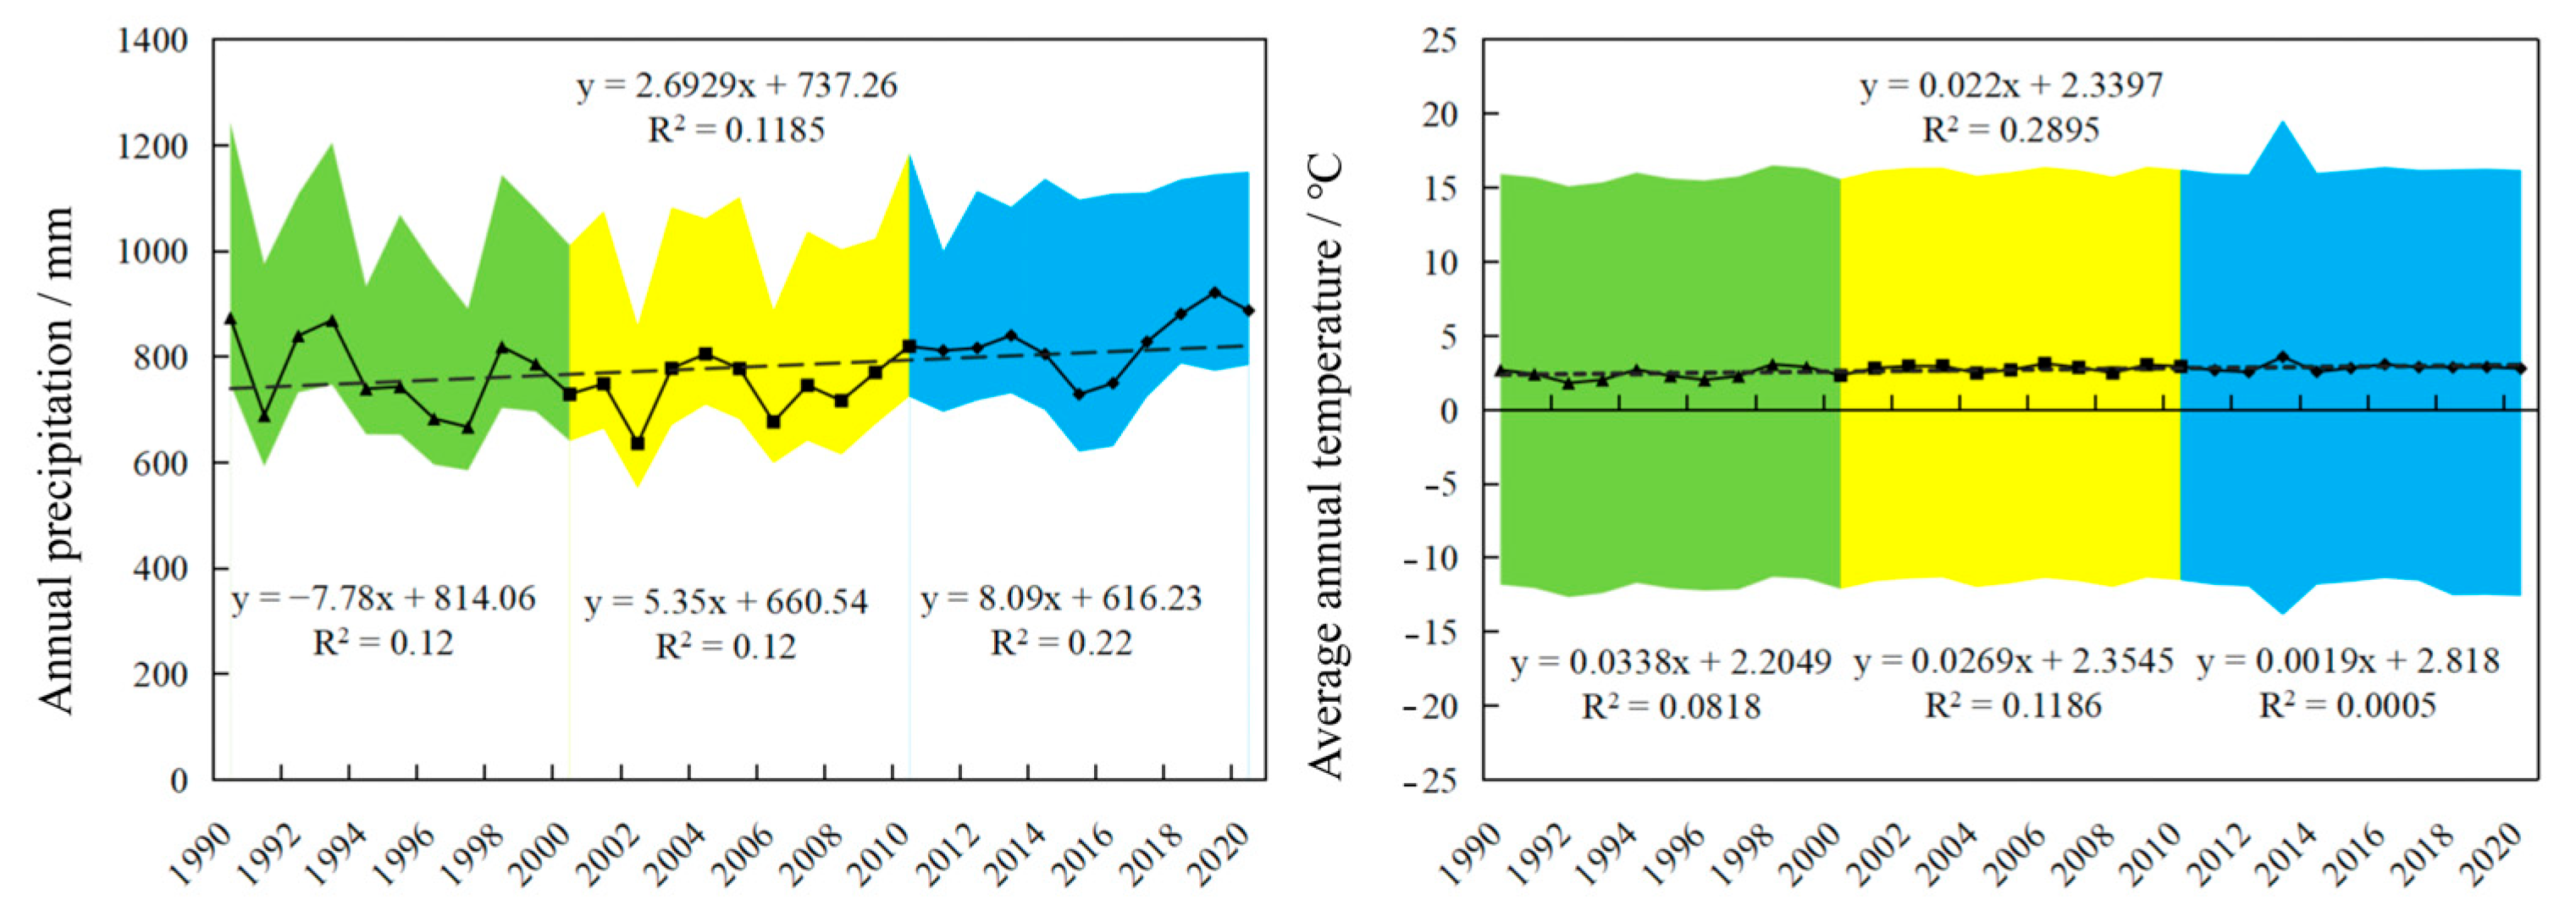
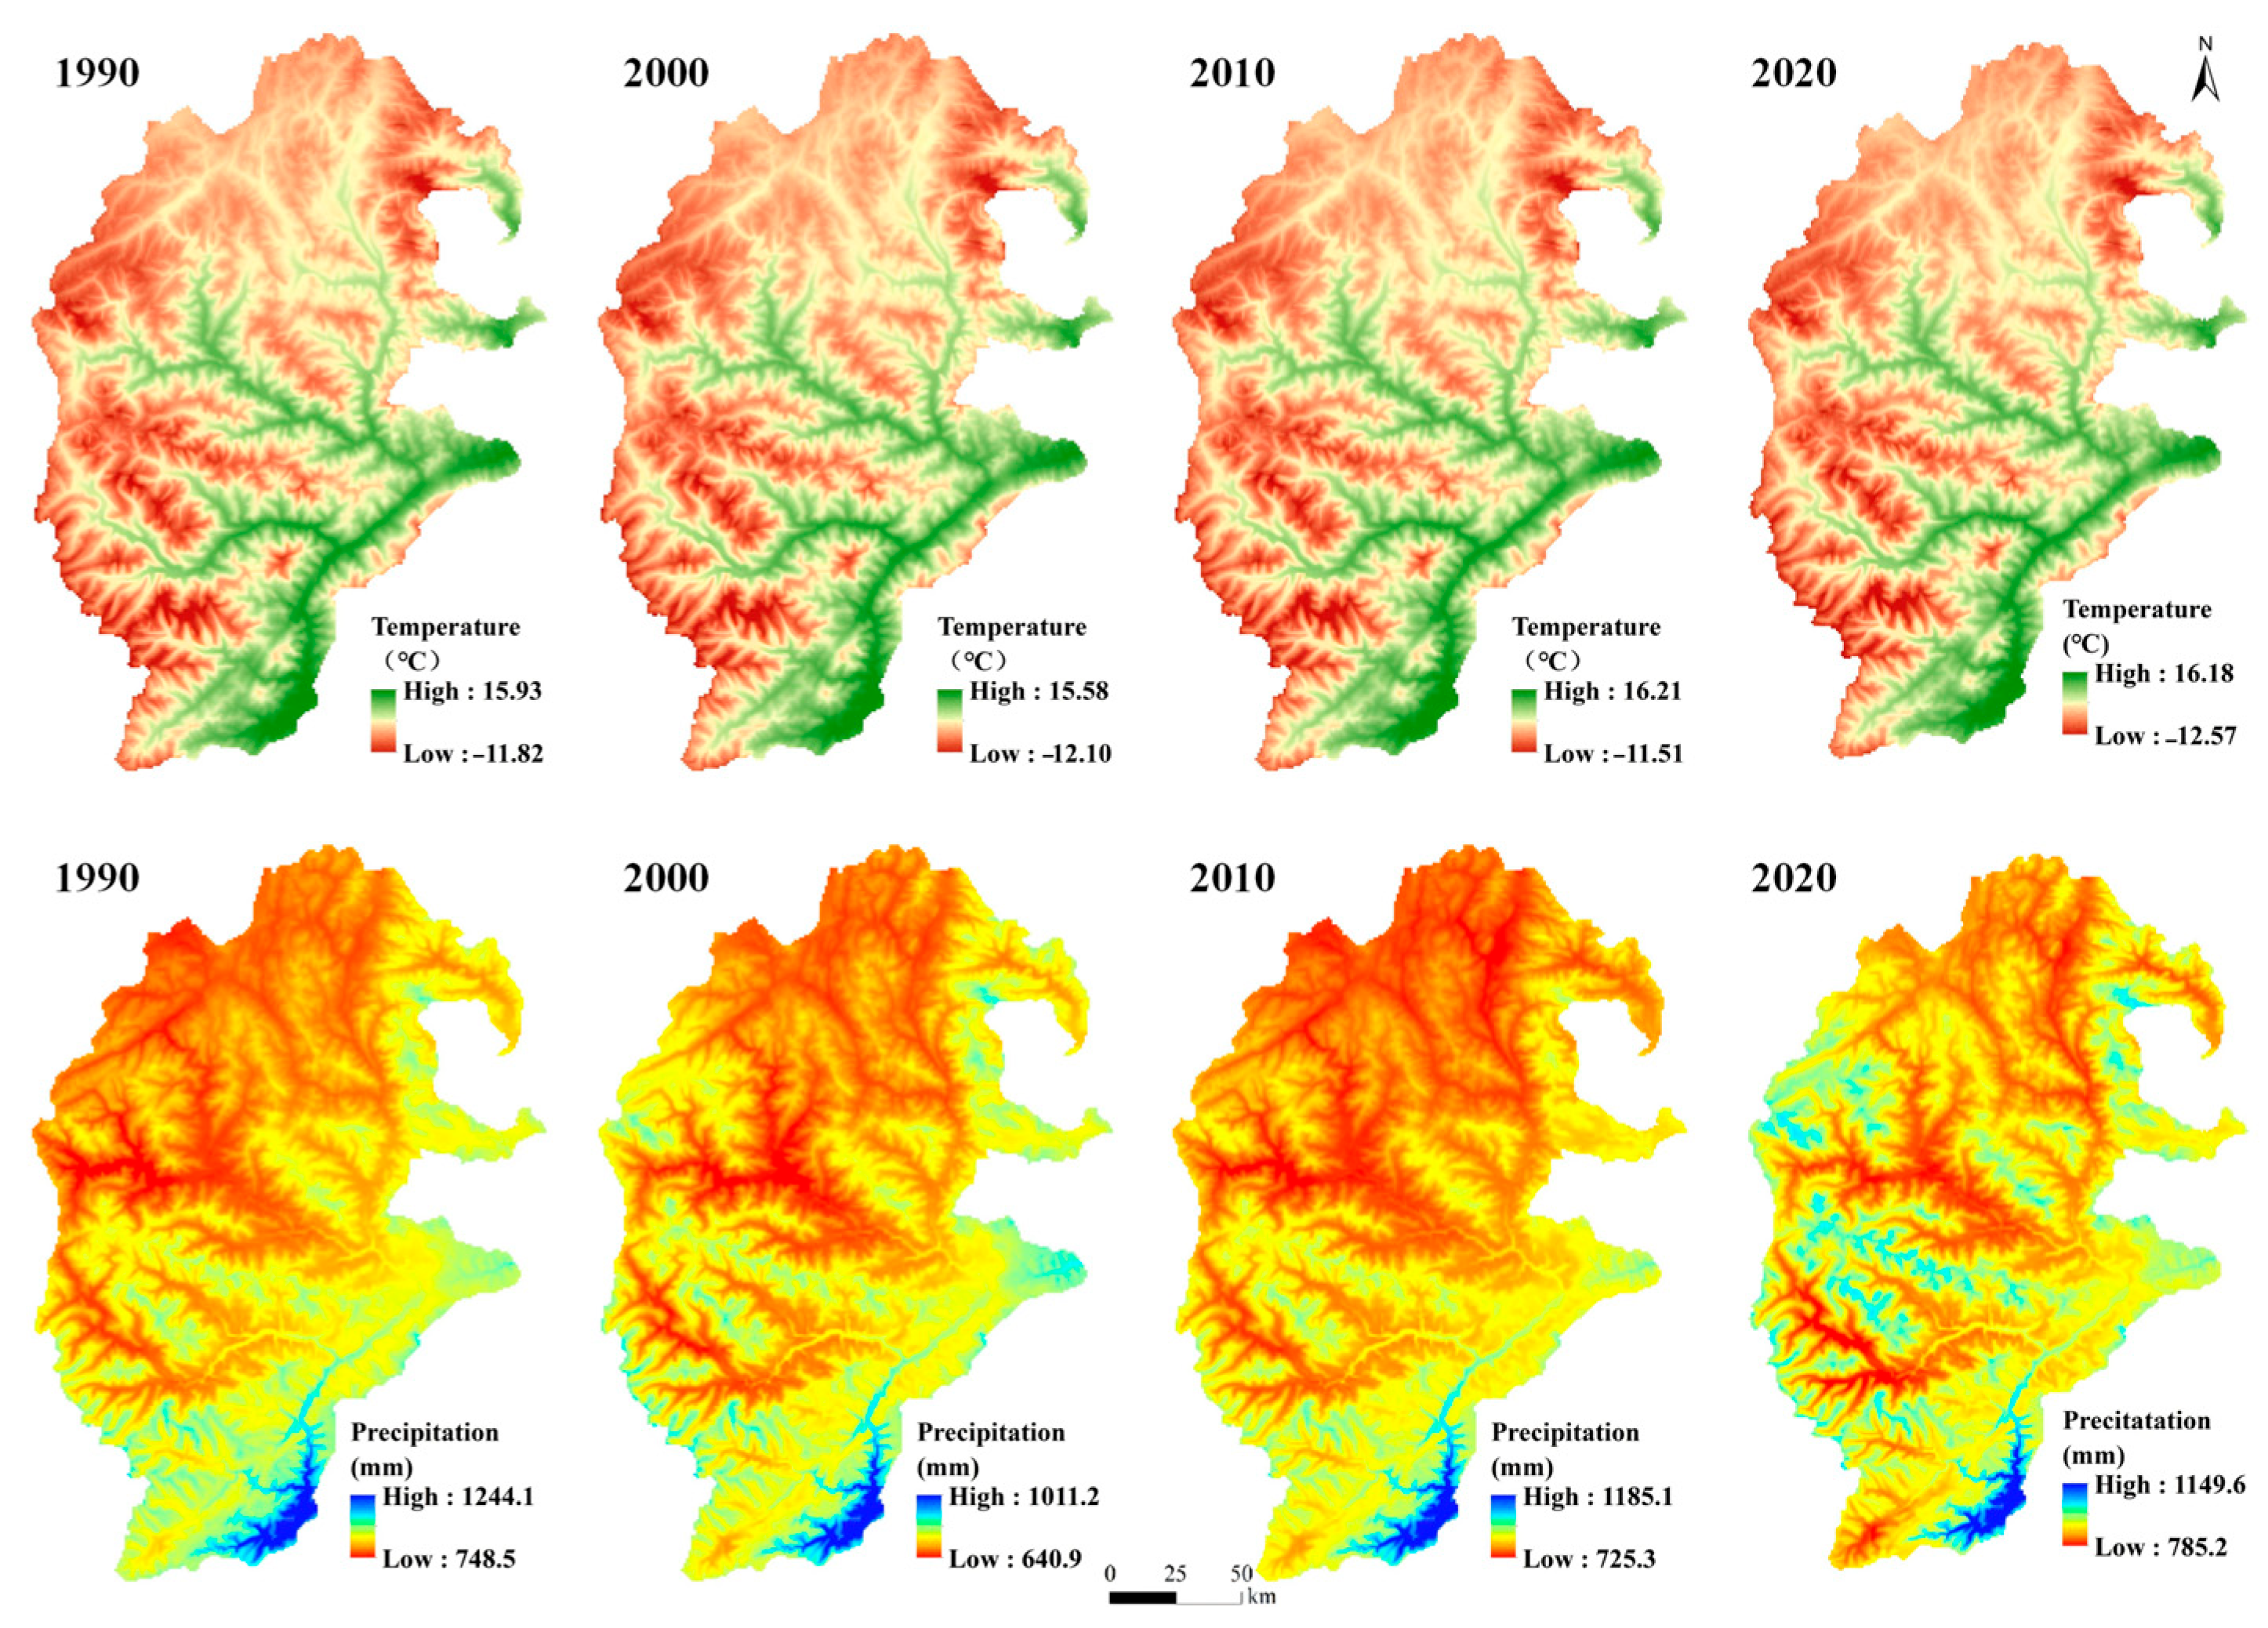
3.1. Climatic Change

From 1990 to 2020, the climate in the URMR showed increasingly warm and wet trends, with both annual rainfall and average annual temperature showing fluctuating but rising trends (Figure 3). The regionally averaged annual temperature from 1990 to 2020 was 2.69 °C. A consistent warming trend was observed across three decades, although the rate of warming declined over time, with respective warming rates of 0.034 °C/year in 1990–2000, 0.027 °C/year in 2000–2010, and 0.019 °C/a in 2010–2020. The regionally averaged annual rainfall over the same periods was 780.34 mm. Precipitation decreased in 1990–2000 at a rate of 7.78 mm/year but increased thereafter, at 5.35 mm/year in 2000–2010, and 8.09 mm/year in 2010–2020.
Spatially, temperature and precipitation distributions in 1990, 2000, 2010, and 2020 showed similar patterns, with values gradually decreasing from southeast to northwest (Figure 4). Influenced by the region’s complex mountainous topography, low precipitation and low temperatures were observed at higher elevations, whereas warmer and wetter conditions were observed in valley areas.

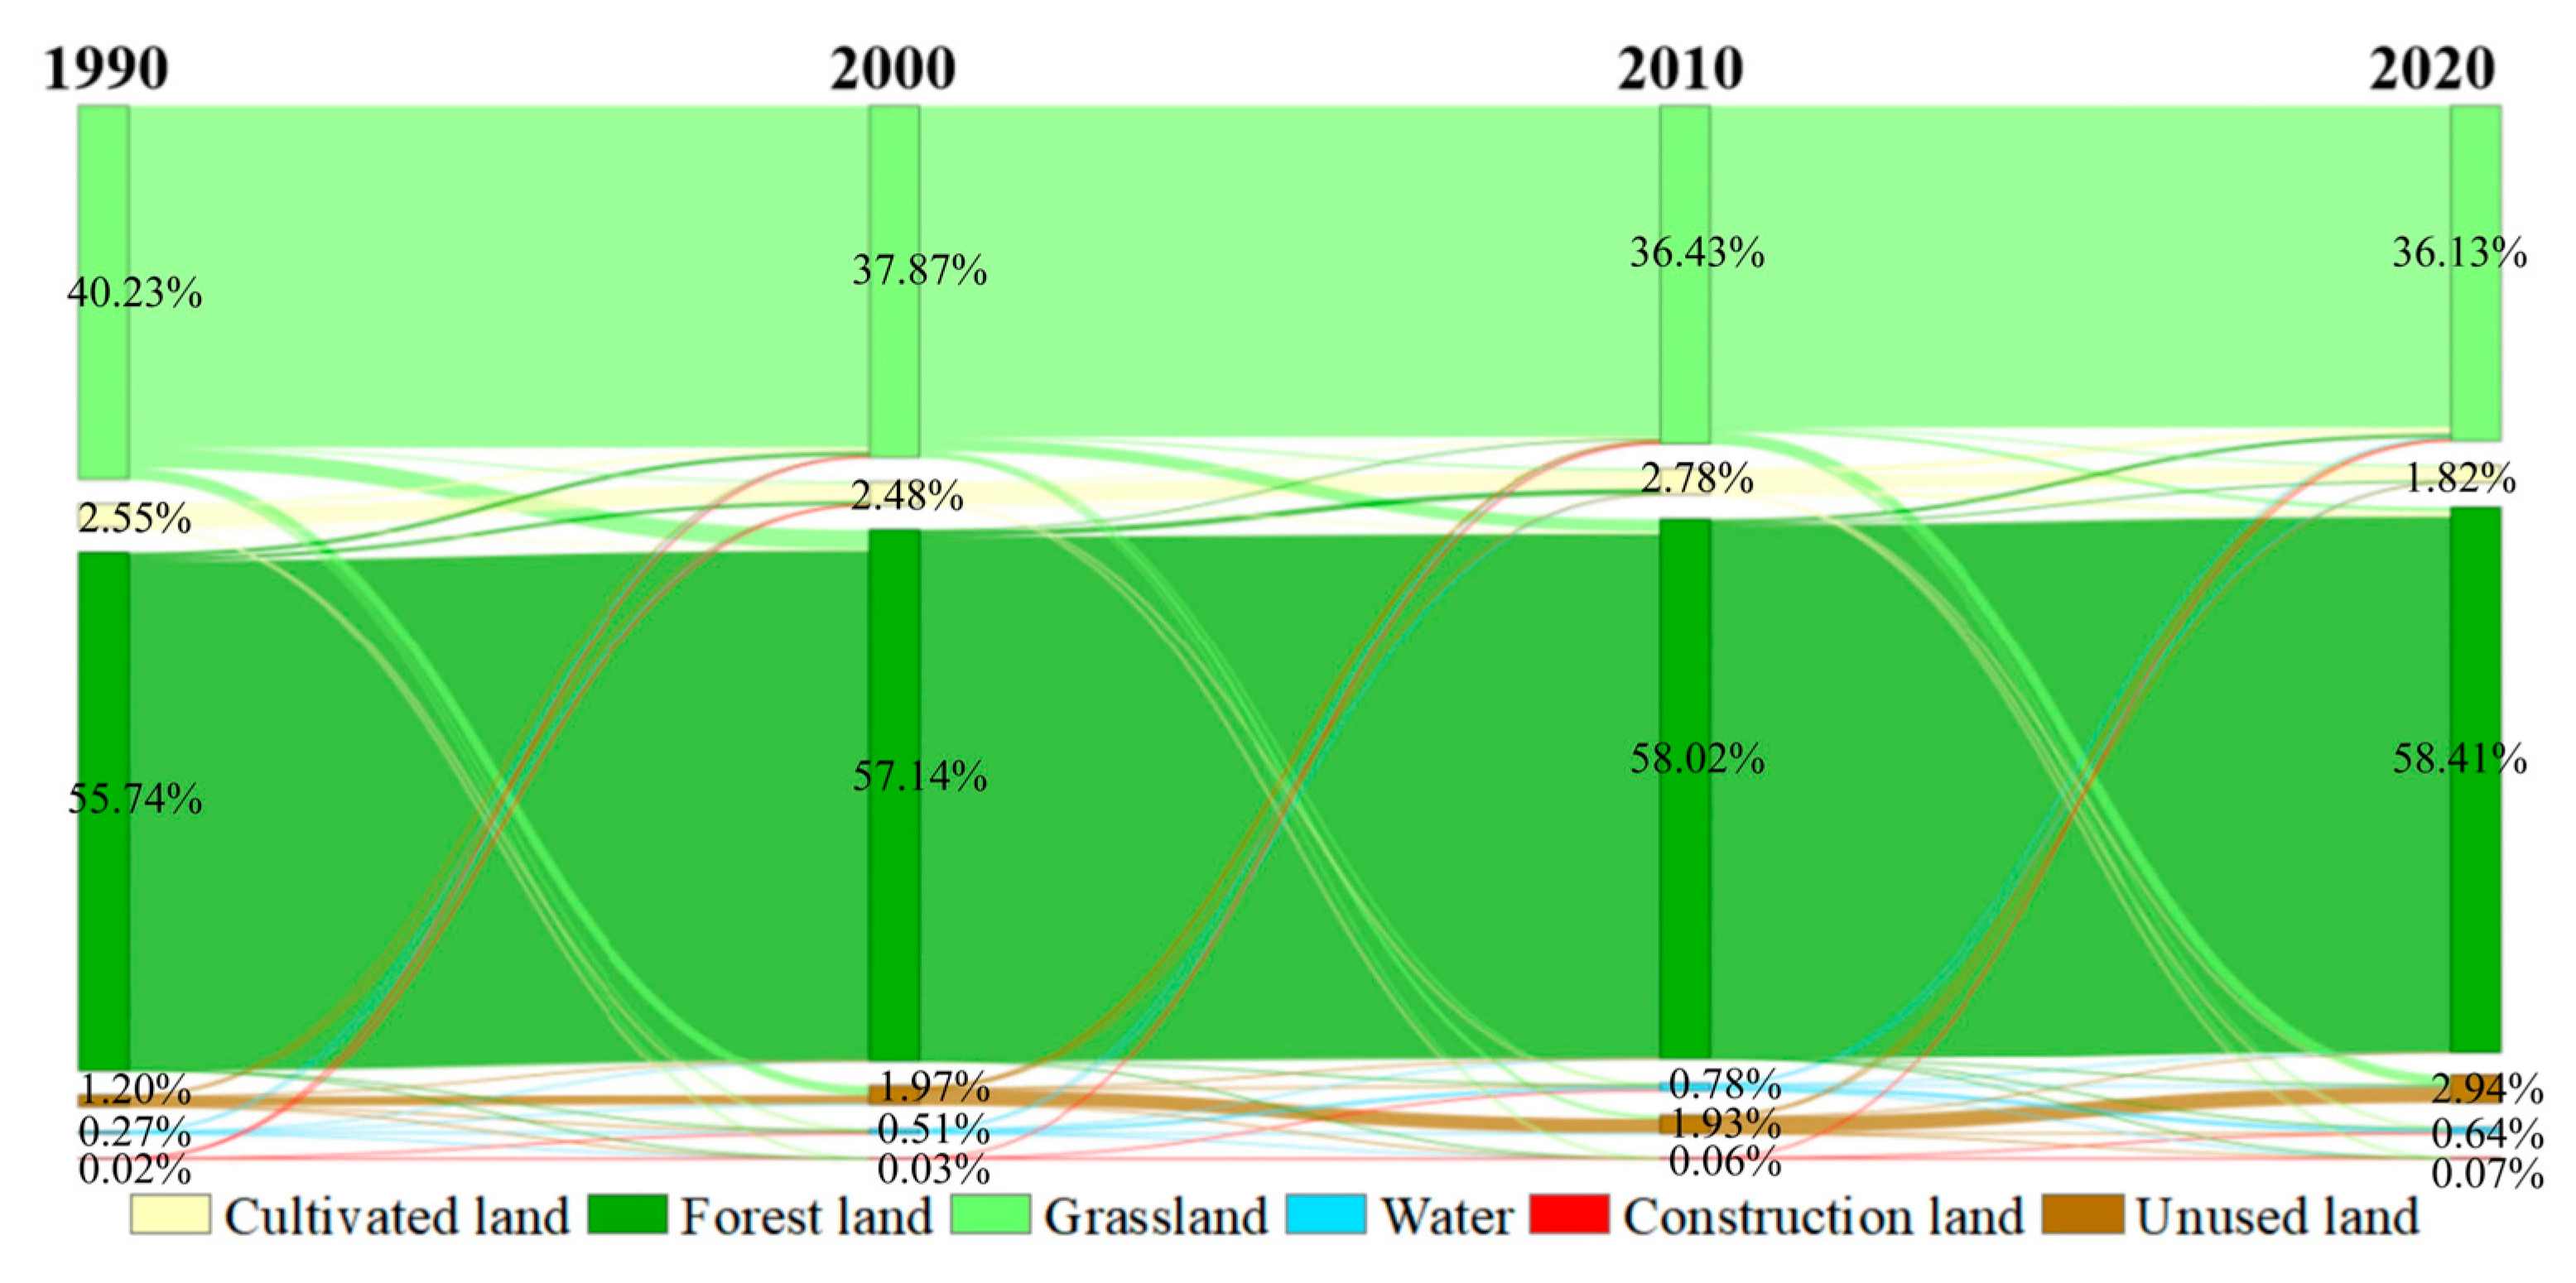
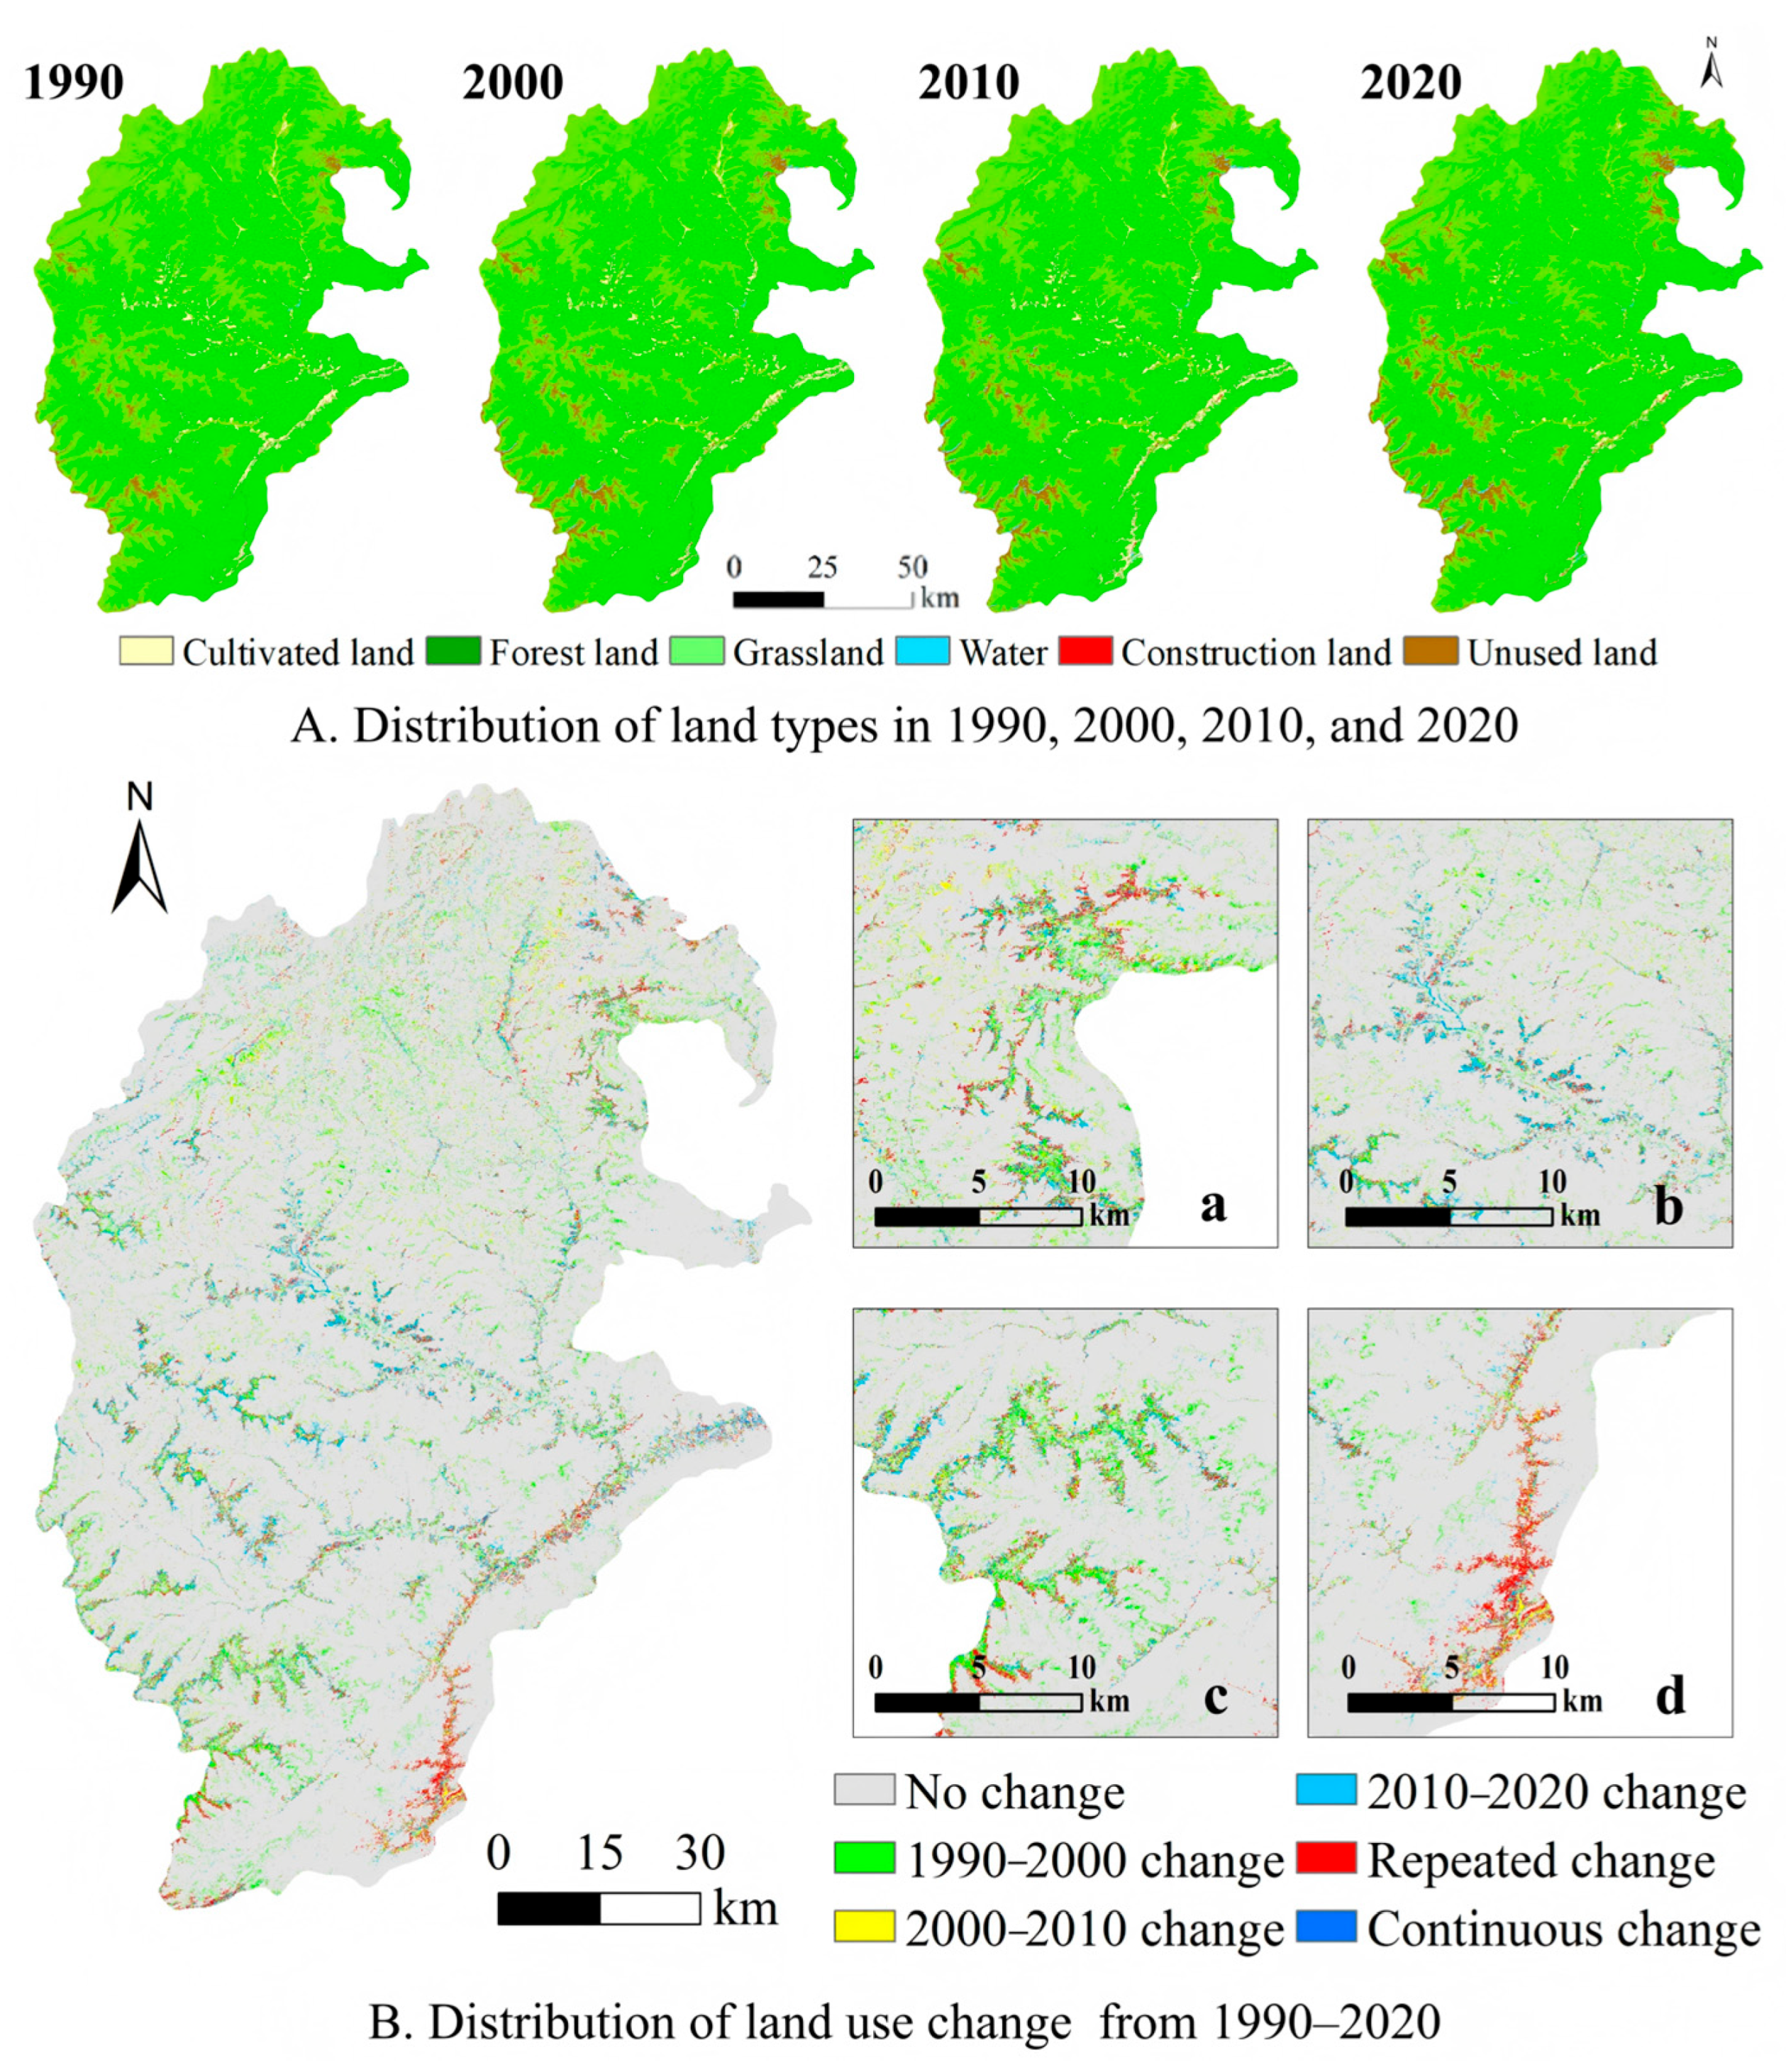
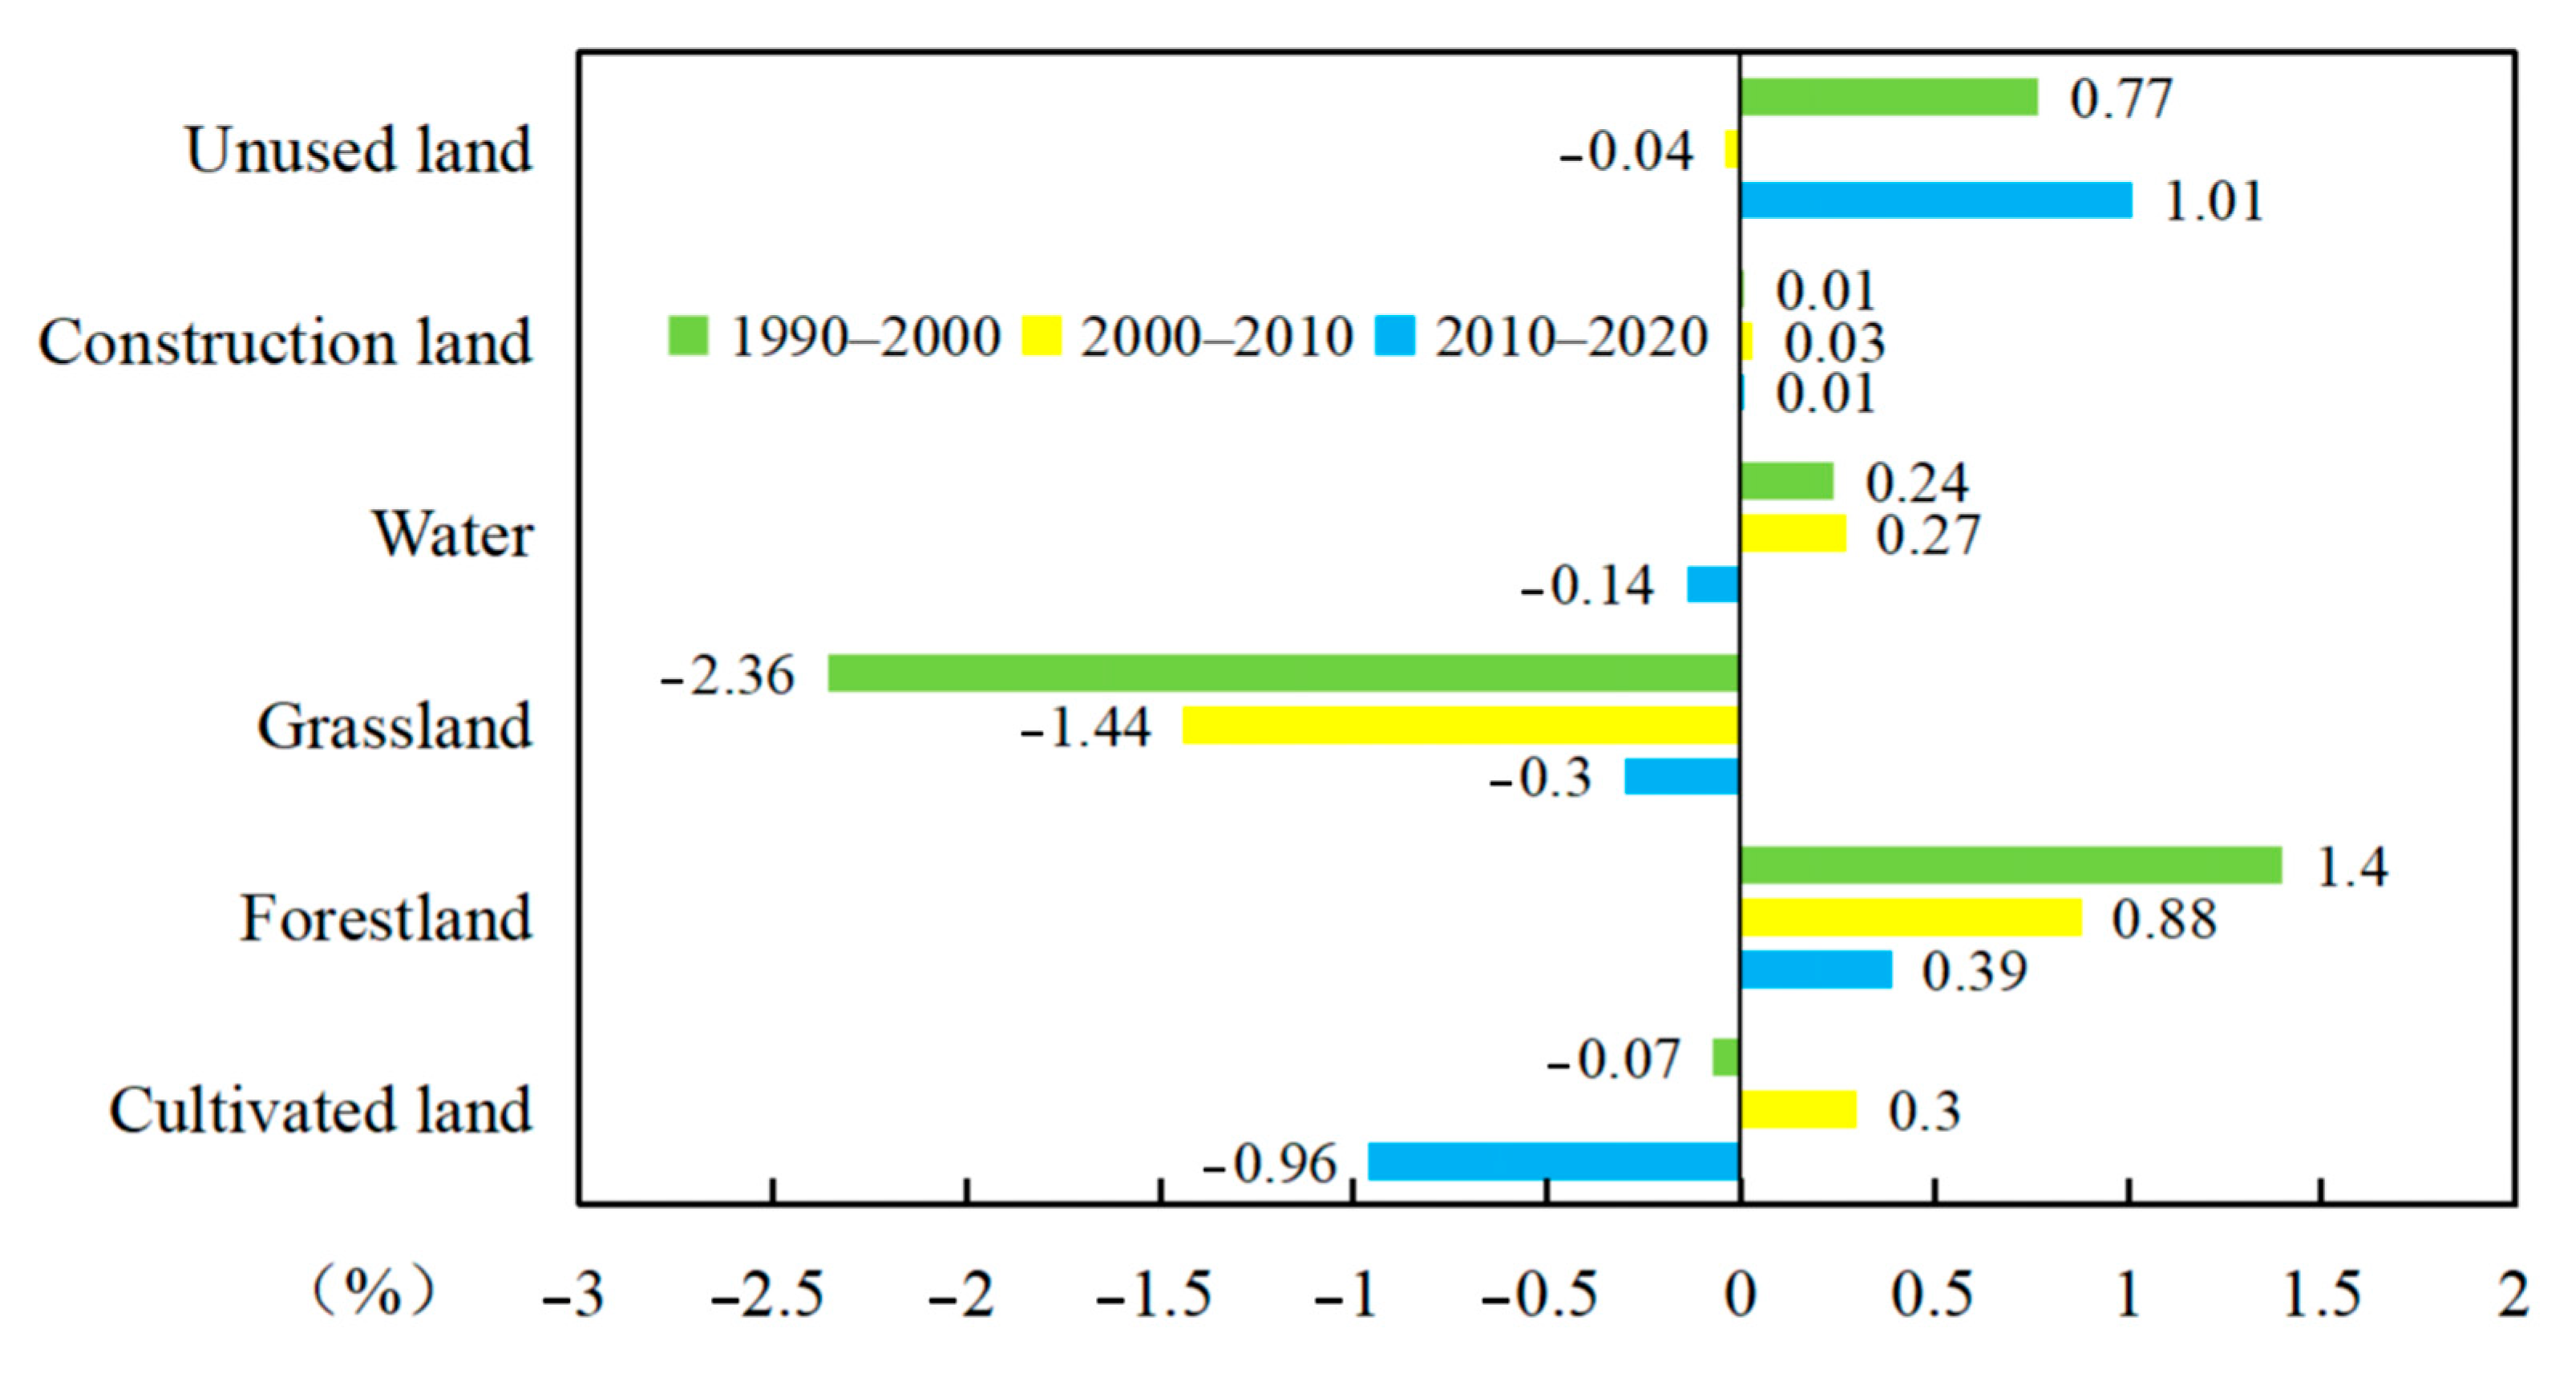
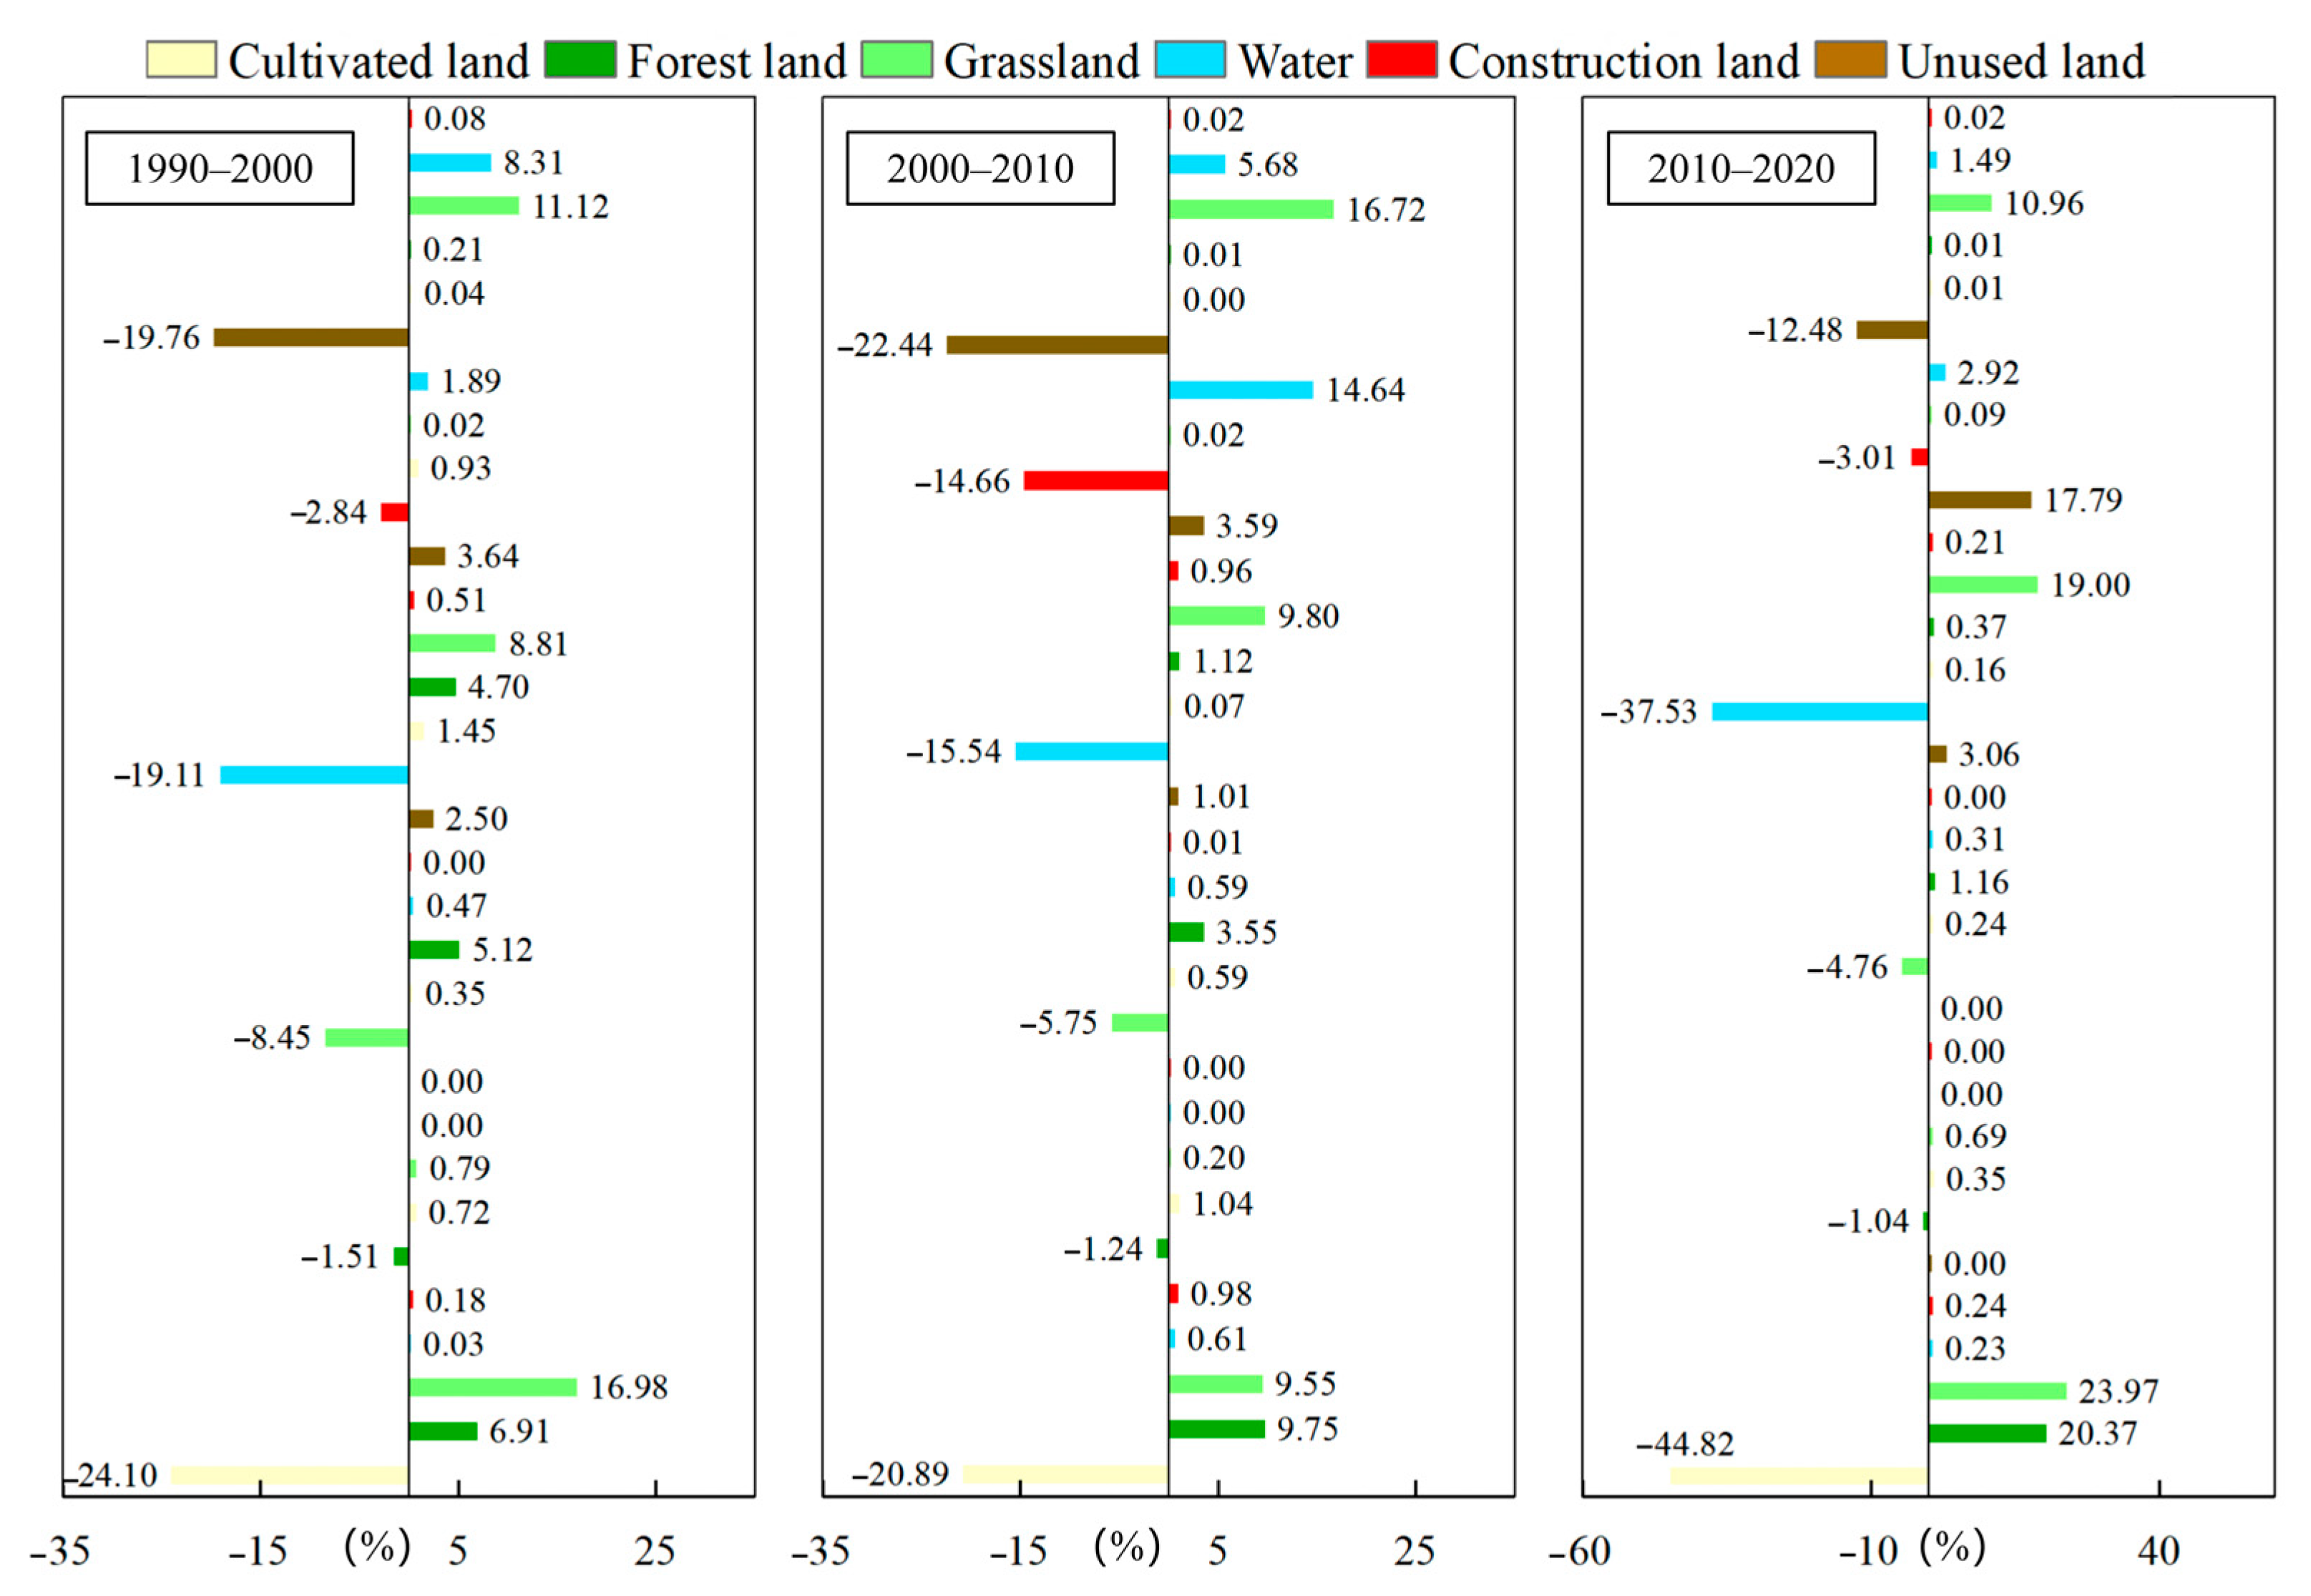
3.2. Temporal and Spatial Variations in LUC

Temporal and spatial changes in land use in the URMR from 1990 to 2020 are given in Table 3 and Figure 5. Over the period, forest and grassland remained the dominant land use types, collectively accounting for over 90% of the total area, followed by cultivated land and unused land. Water bodies and construction land occupied a small proportion, each accounting for less than 1% of the total area.
In 1990, forest covered 55.74% of the total area, followed by grassland (40.23%) and cultivated land (2.55%). Between 1990 and 2020, grassland decreased by 4.10%, with 1.20 × 10⁵ ha grassland converted to other land use types. Conversely, forest area increased by 2.67%, expanding from 1.63 × 10⁶ ha to 1.71 × 10⁶ ha. The cultivated land declined by 0.73%, shrinking by 2.12 × 10⁴ ha, while water bodies, construction land, and unused land increased by 0.37%, 0.05%, and 1.74%, respectively.
The spatial distribution of land use in the URMR was greatly affected by the altitude. Forest and grassland—the most dominant land use types were distributed across the region, while cultivated land and construction land were primarily found in lowland valleys. Unused land and water bodies were scattered sparsely across the region. While the overall land use pattern remained largely stable, local land transformations were observed, especially in alpine areas due to human activity (Figure 6d). Significant modifications have been observed in specific periods and locations. For example, between 1990 and 2000, maximum land use changes were observed in the southern forest and grass interlaced areas (Figure 6a,c). In 2000–2010, the most extensive changes were observed in the northern grassland area, whereas in 2010–2020, land use changes were found to be distributed mainly in the central part of the region (Figure 6b). Repeated land use changes were primarily observed in valley lowland areas, particularly in the regions of cultivated land and construction land in the southeastern URMR (Figure 6d).

3.3. ESs Dynamics

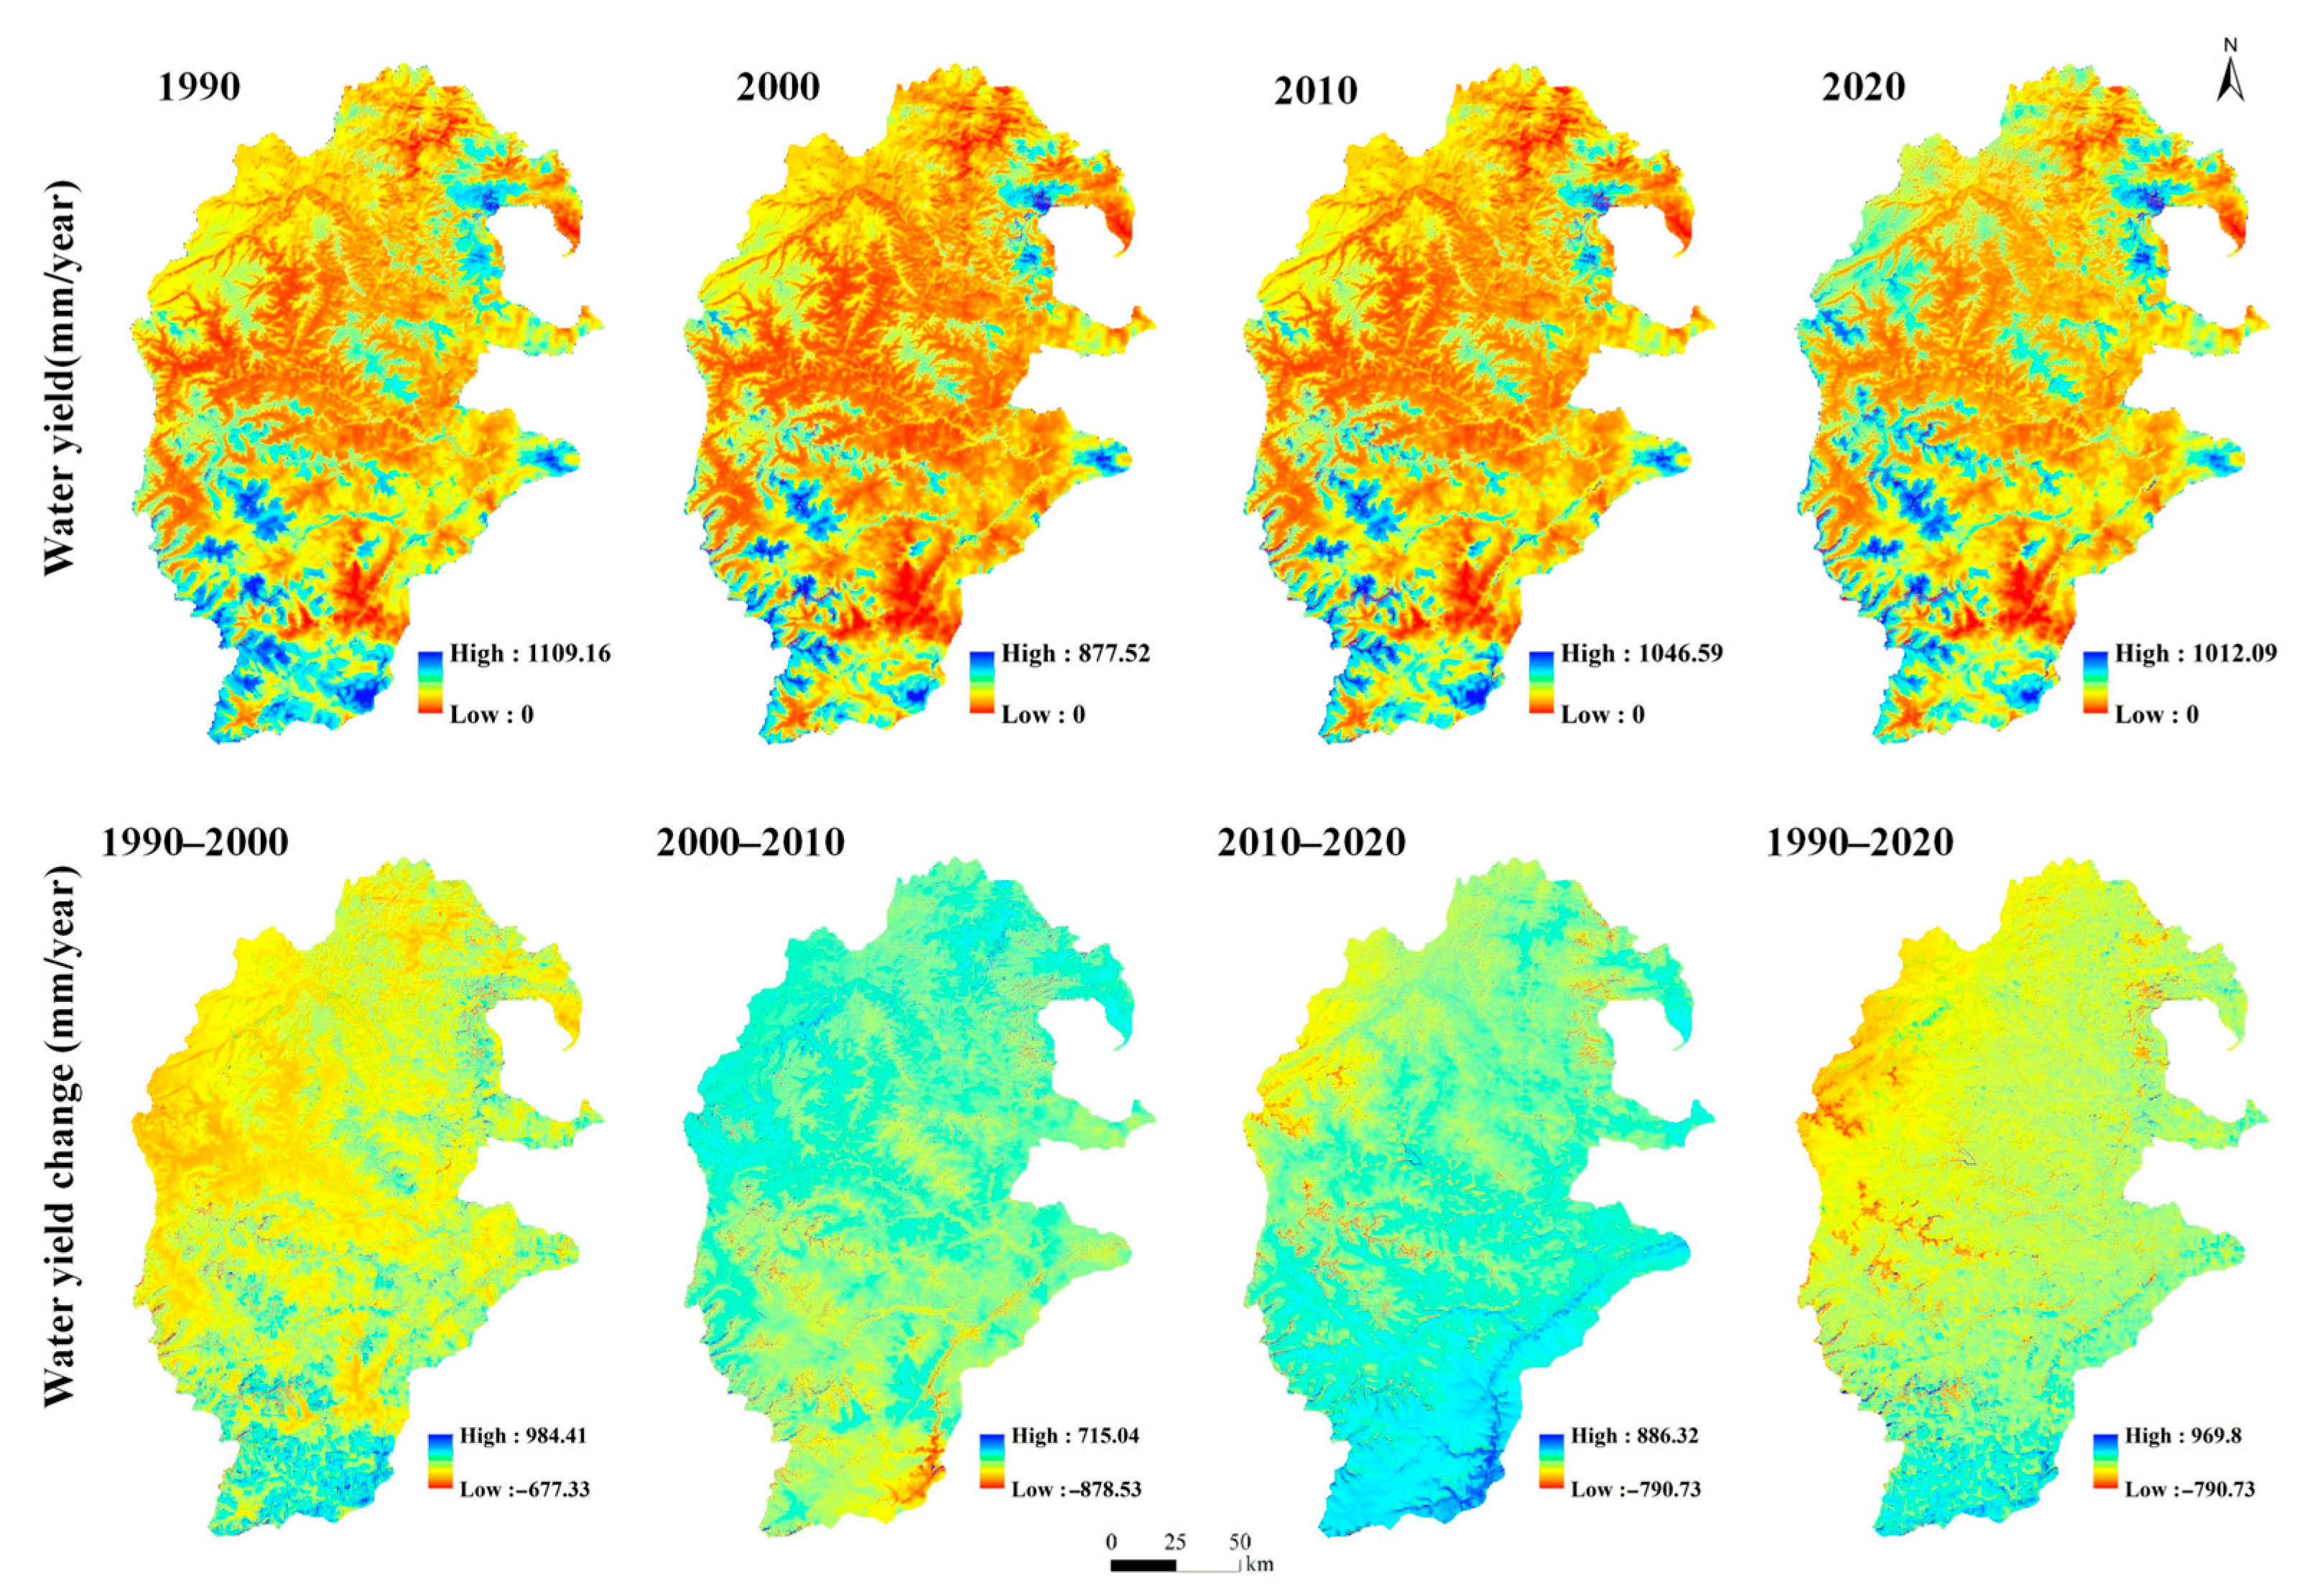
3.3.1. Changes in Water Yield Service

From 1990 to 2020, water yield service in the URMR showed an overall increasing trend (Figure 7). It initially decreased from 273.52 mm/year in 1990 to 166.01 mm/year in 2000, then rebounded to 219.30 mm/year in 2010, and further increased to 282.83 mm/year in 2020. The temporal variation in water yield closely followed precipitation trends; however, strong spatial variations influenced by land use change in local areas were observed. Spatially, from 1990 to 2020, water yield increased in low-elevation southeastern areas, while declines in water yield were seen in the northwestern highlands of the URMR.

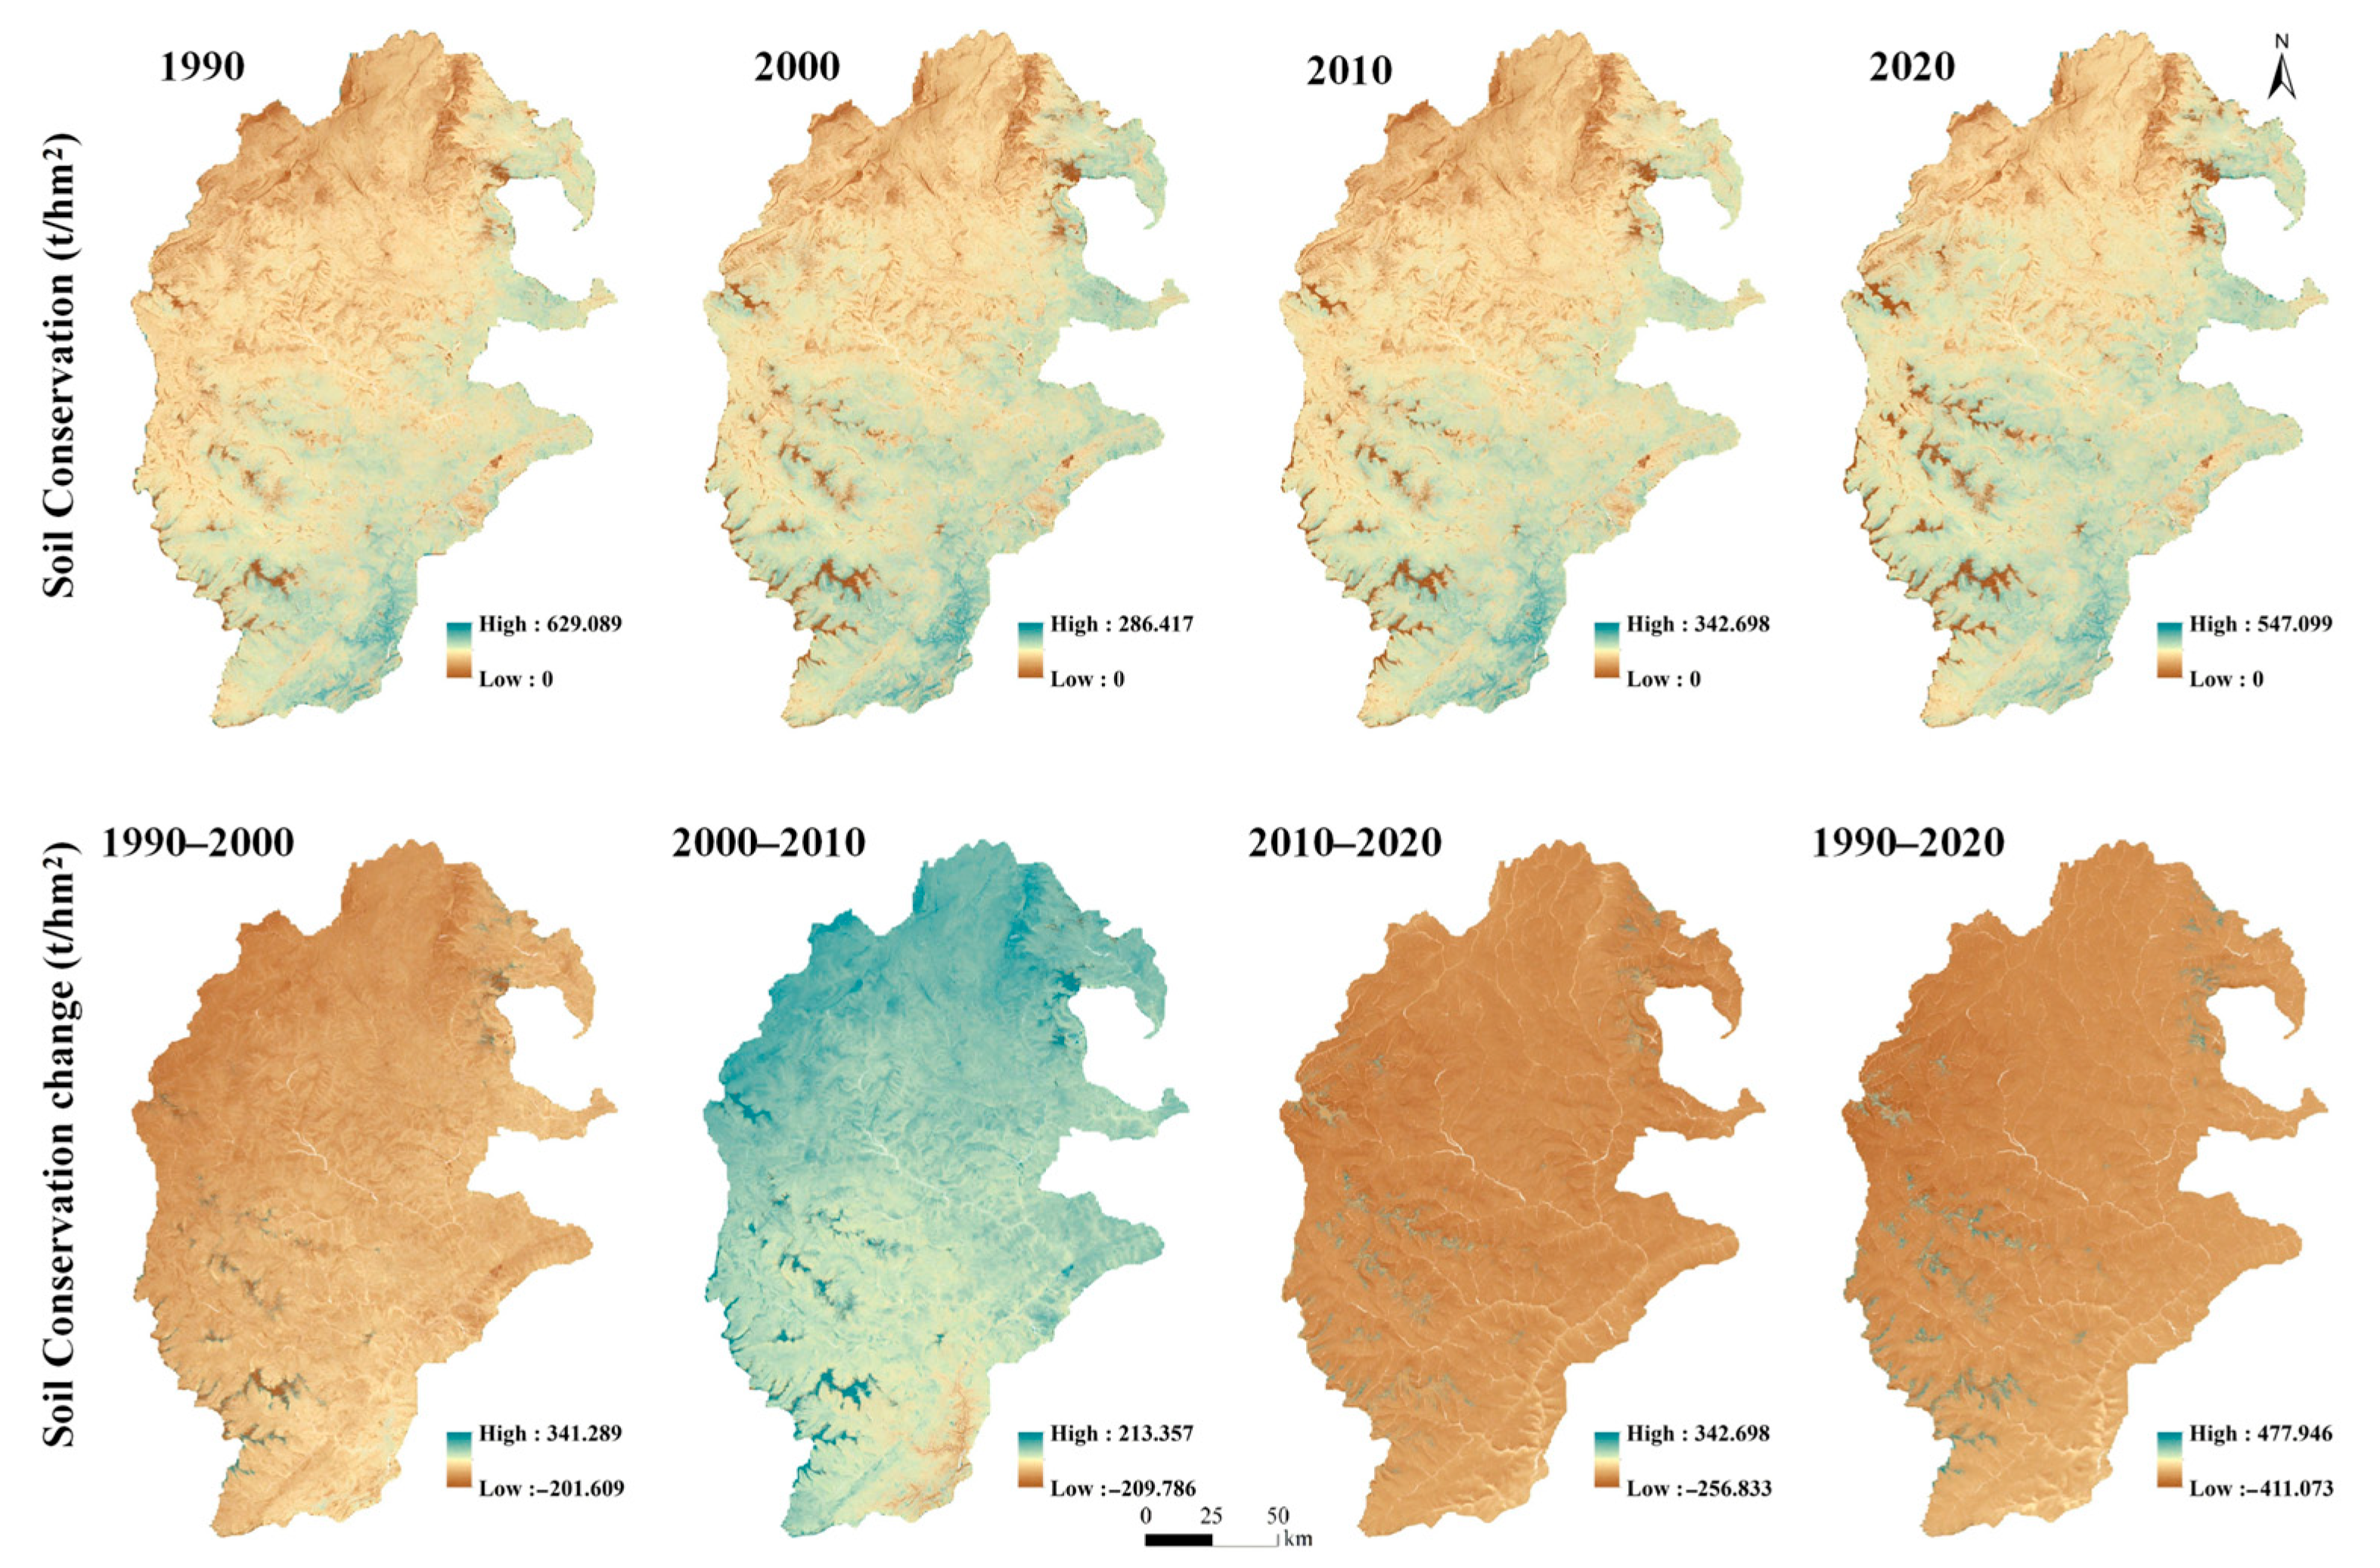
3.3.2. Changes in Soil Conservation Service

From 1990 to 2020, soil conservation showed a fluctuating trend (Figure 8). The average soil conservation service was reduced from 33.2 t/hm2 in 1990 to 24.5 t/hm2 in 2000, then subsequently increased to 29.9 t/hm2 in 2010, and further increased to 33.4 t/hm2 in 2020. This pattern closely aligned with precipitation and water yield trends. Spatially, soil conservation services varied across different land use types, showing significant spatial heterogeneity caused by topographic conditions, meteorological factors, and soil and vegetation conservation measures. Although net soil conservation declined regionally from 1990 to 2020, some local improvements were observed in certain areas.

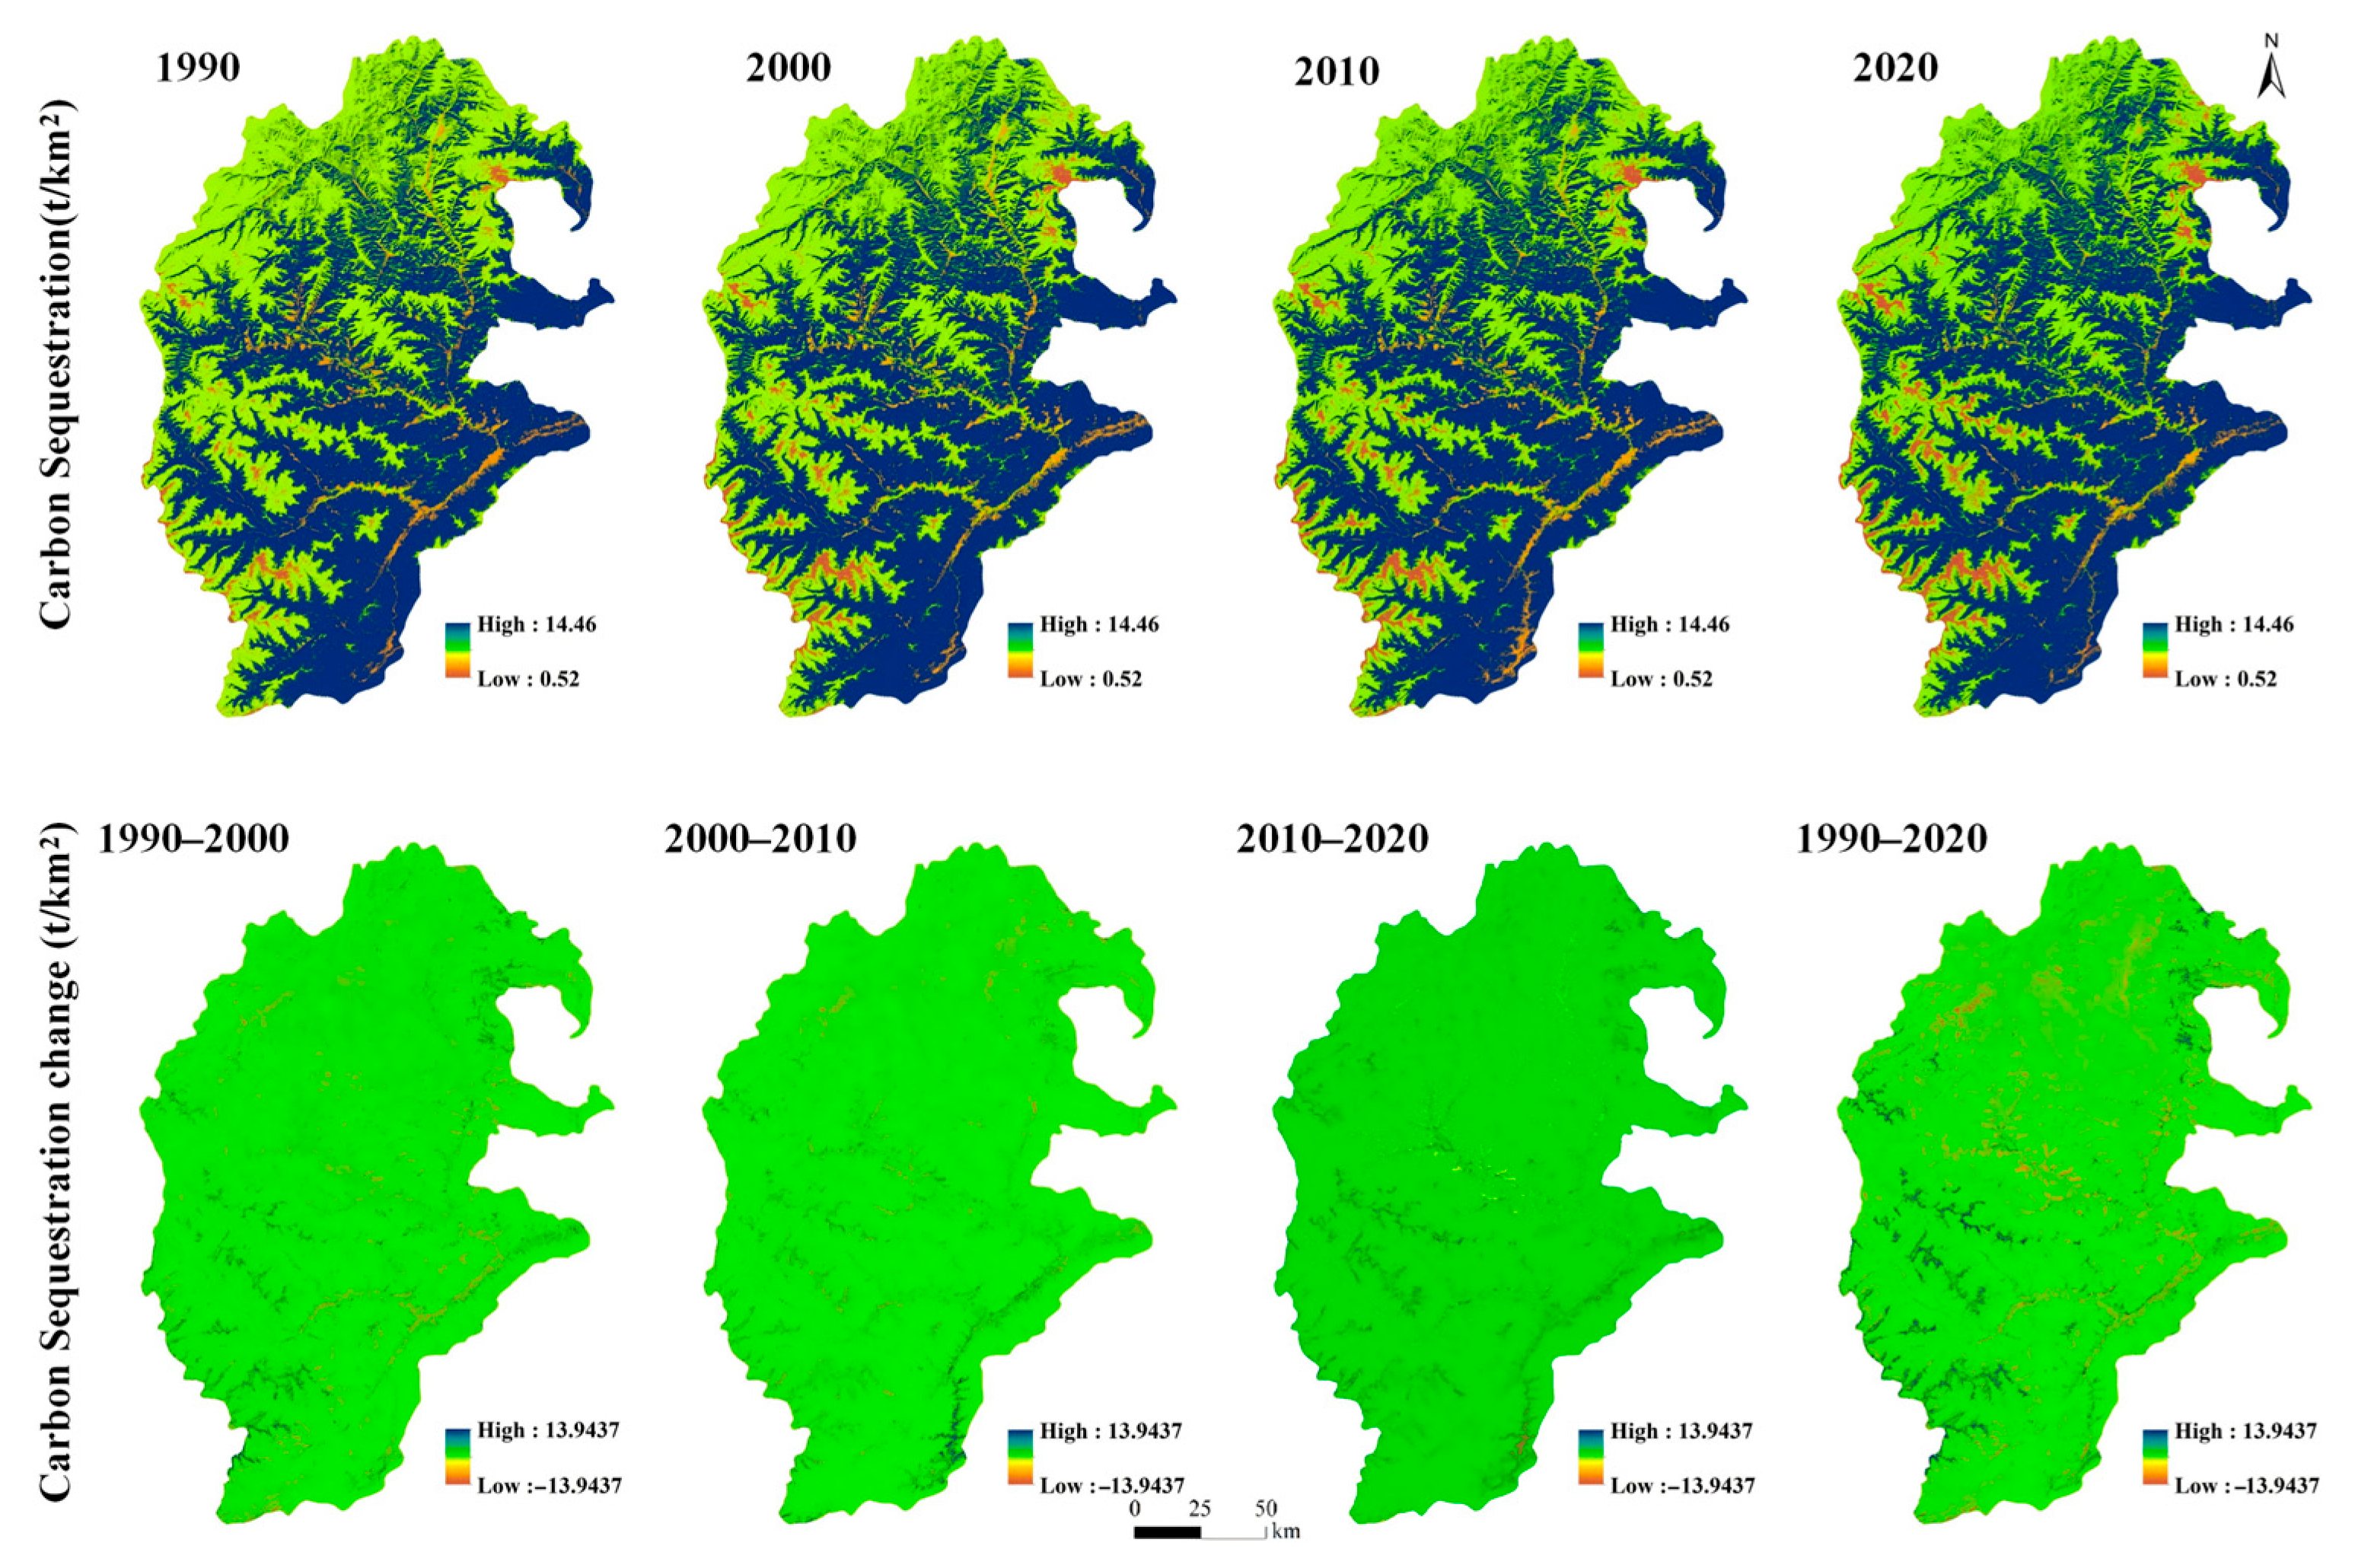
3.3.3. Changes in Carbon Sequestration Service

From 1990 to 2020, carbon sequestration services showed a consistent increasing trend. Average carbon sequestration services were 11.23 t/ km2 in 1990, 11.26 t/km2 in 2000, 11.30 t/km2 in 2010, and 11.31 t/km2 in 2020, respectively (Figure 9). The spatial distribution of carbon sequestration services was heterogeneous across the region. From 1990 to 2000, the decreased area of carbon sequestration services accounted for 2.28%, and the increased area accounted for 2.85%. The decreased area of carbon sequestration services accounted for 1.67%, and the increased area accounted for 2.23% in 2000–2010. From 1990 to 2000, the decreased area of carbon sequestration services accounted for 2.16%, and the increased area accounted for 1.95%.

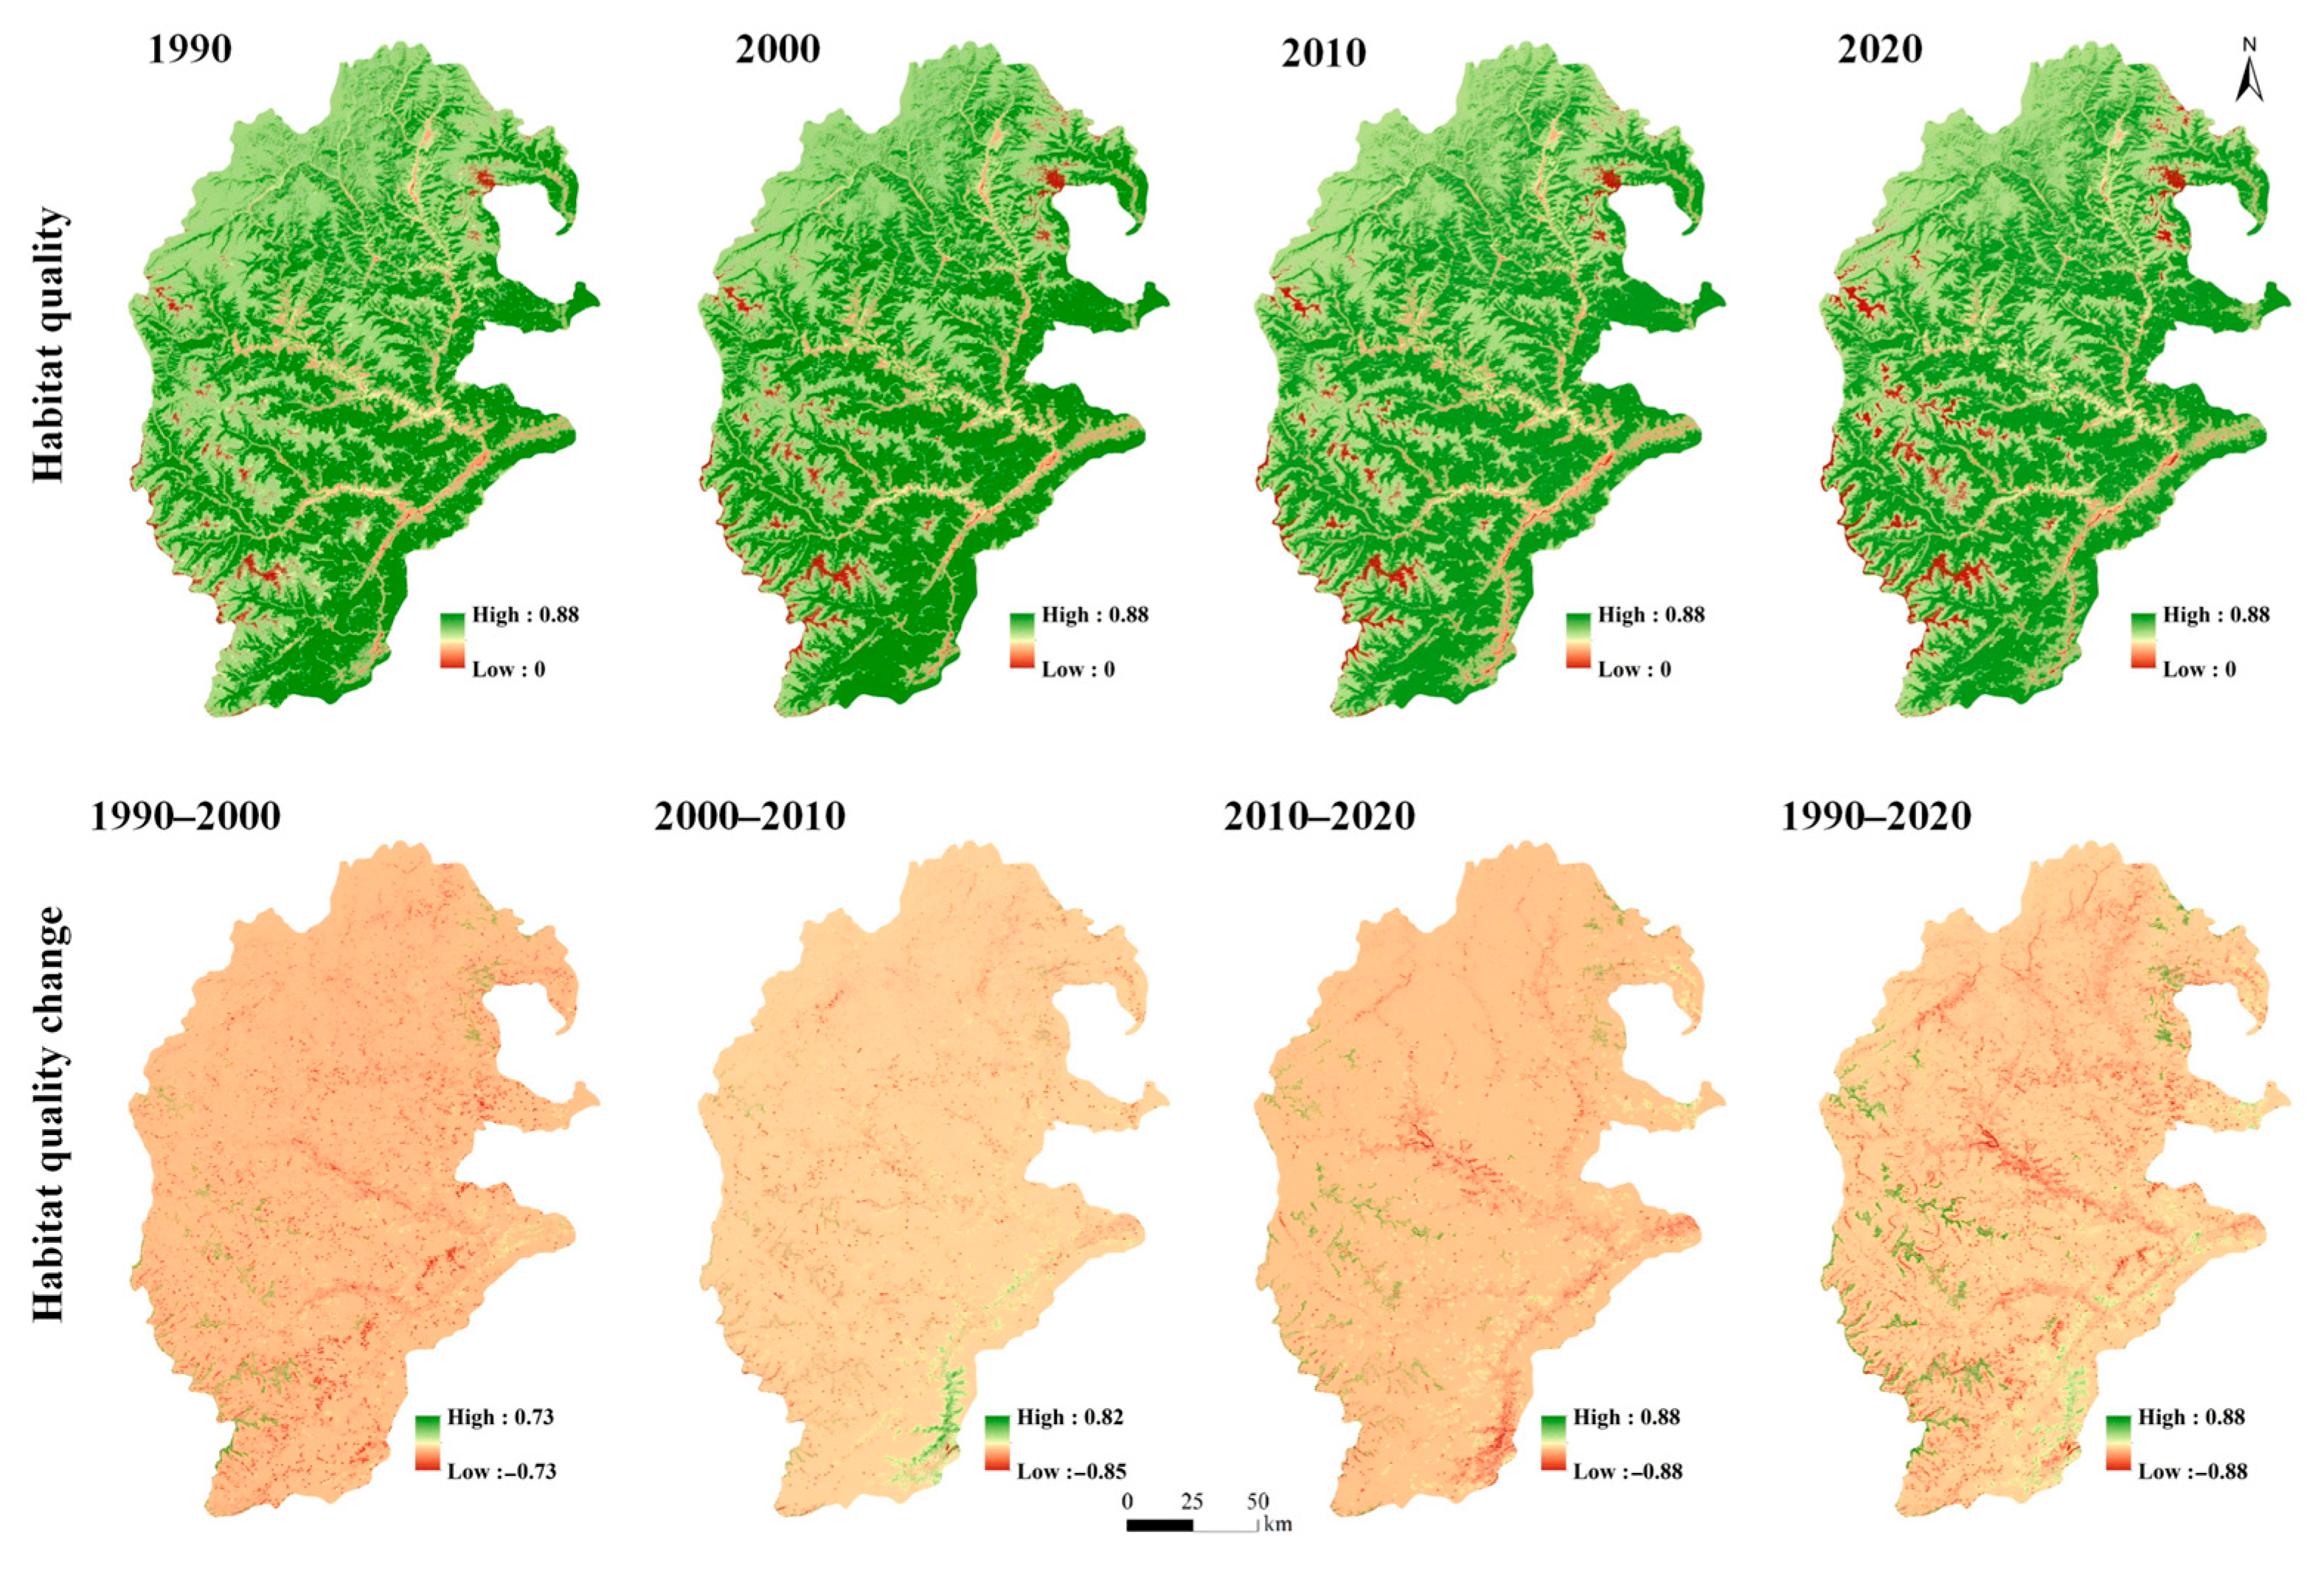
3.3.4. Changes in Habitat Quality Service

From 1990 to 2020, habitat quality exhibited an overall increasing trend. The average habitat quality values were 0.7054, 0.7134, 0.7154, and 0.7125 in 1990, 2000, 2010, and 2020, respectively (Figure 10). Spatially, from 1990 to 2020, degradation in habitat quality was distributed in the southwestern and northeastern regions, while improvements were observed in the central eastern region. Between 2000 and 2010, habitat quality decreased significantly in the southeastern region but showed a recovery between 2010 and 2020. However, in 2010–2020, the habitat quality improved significantly in the central alpine regions, while some areas experienced a decline.

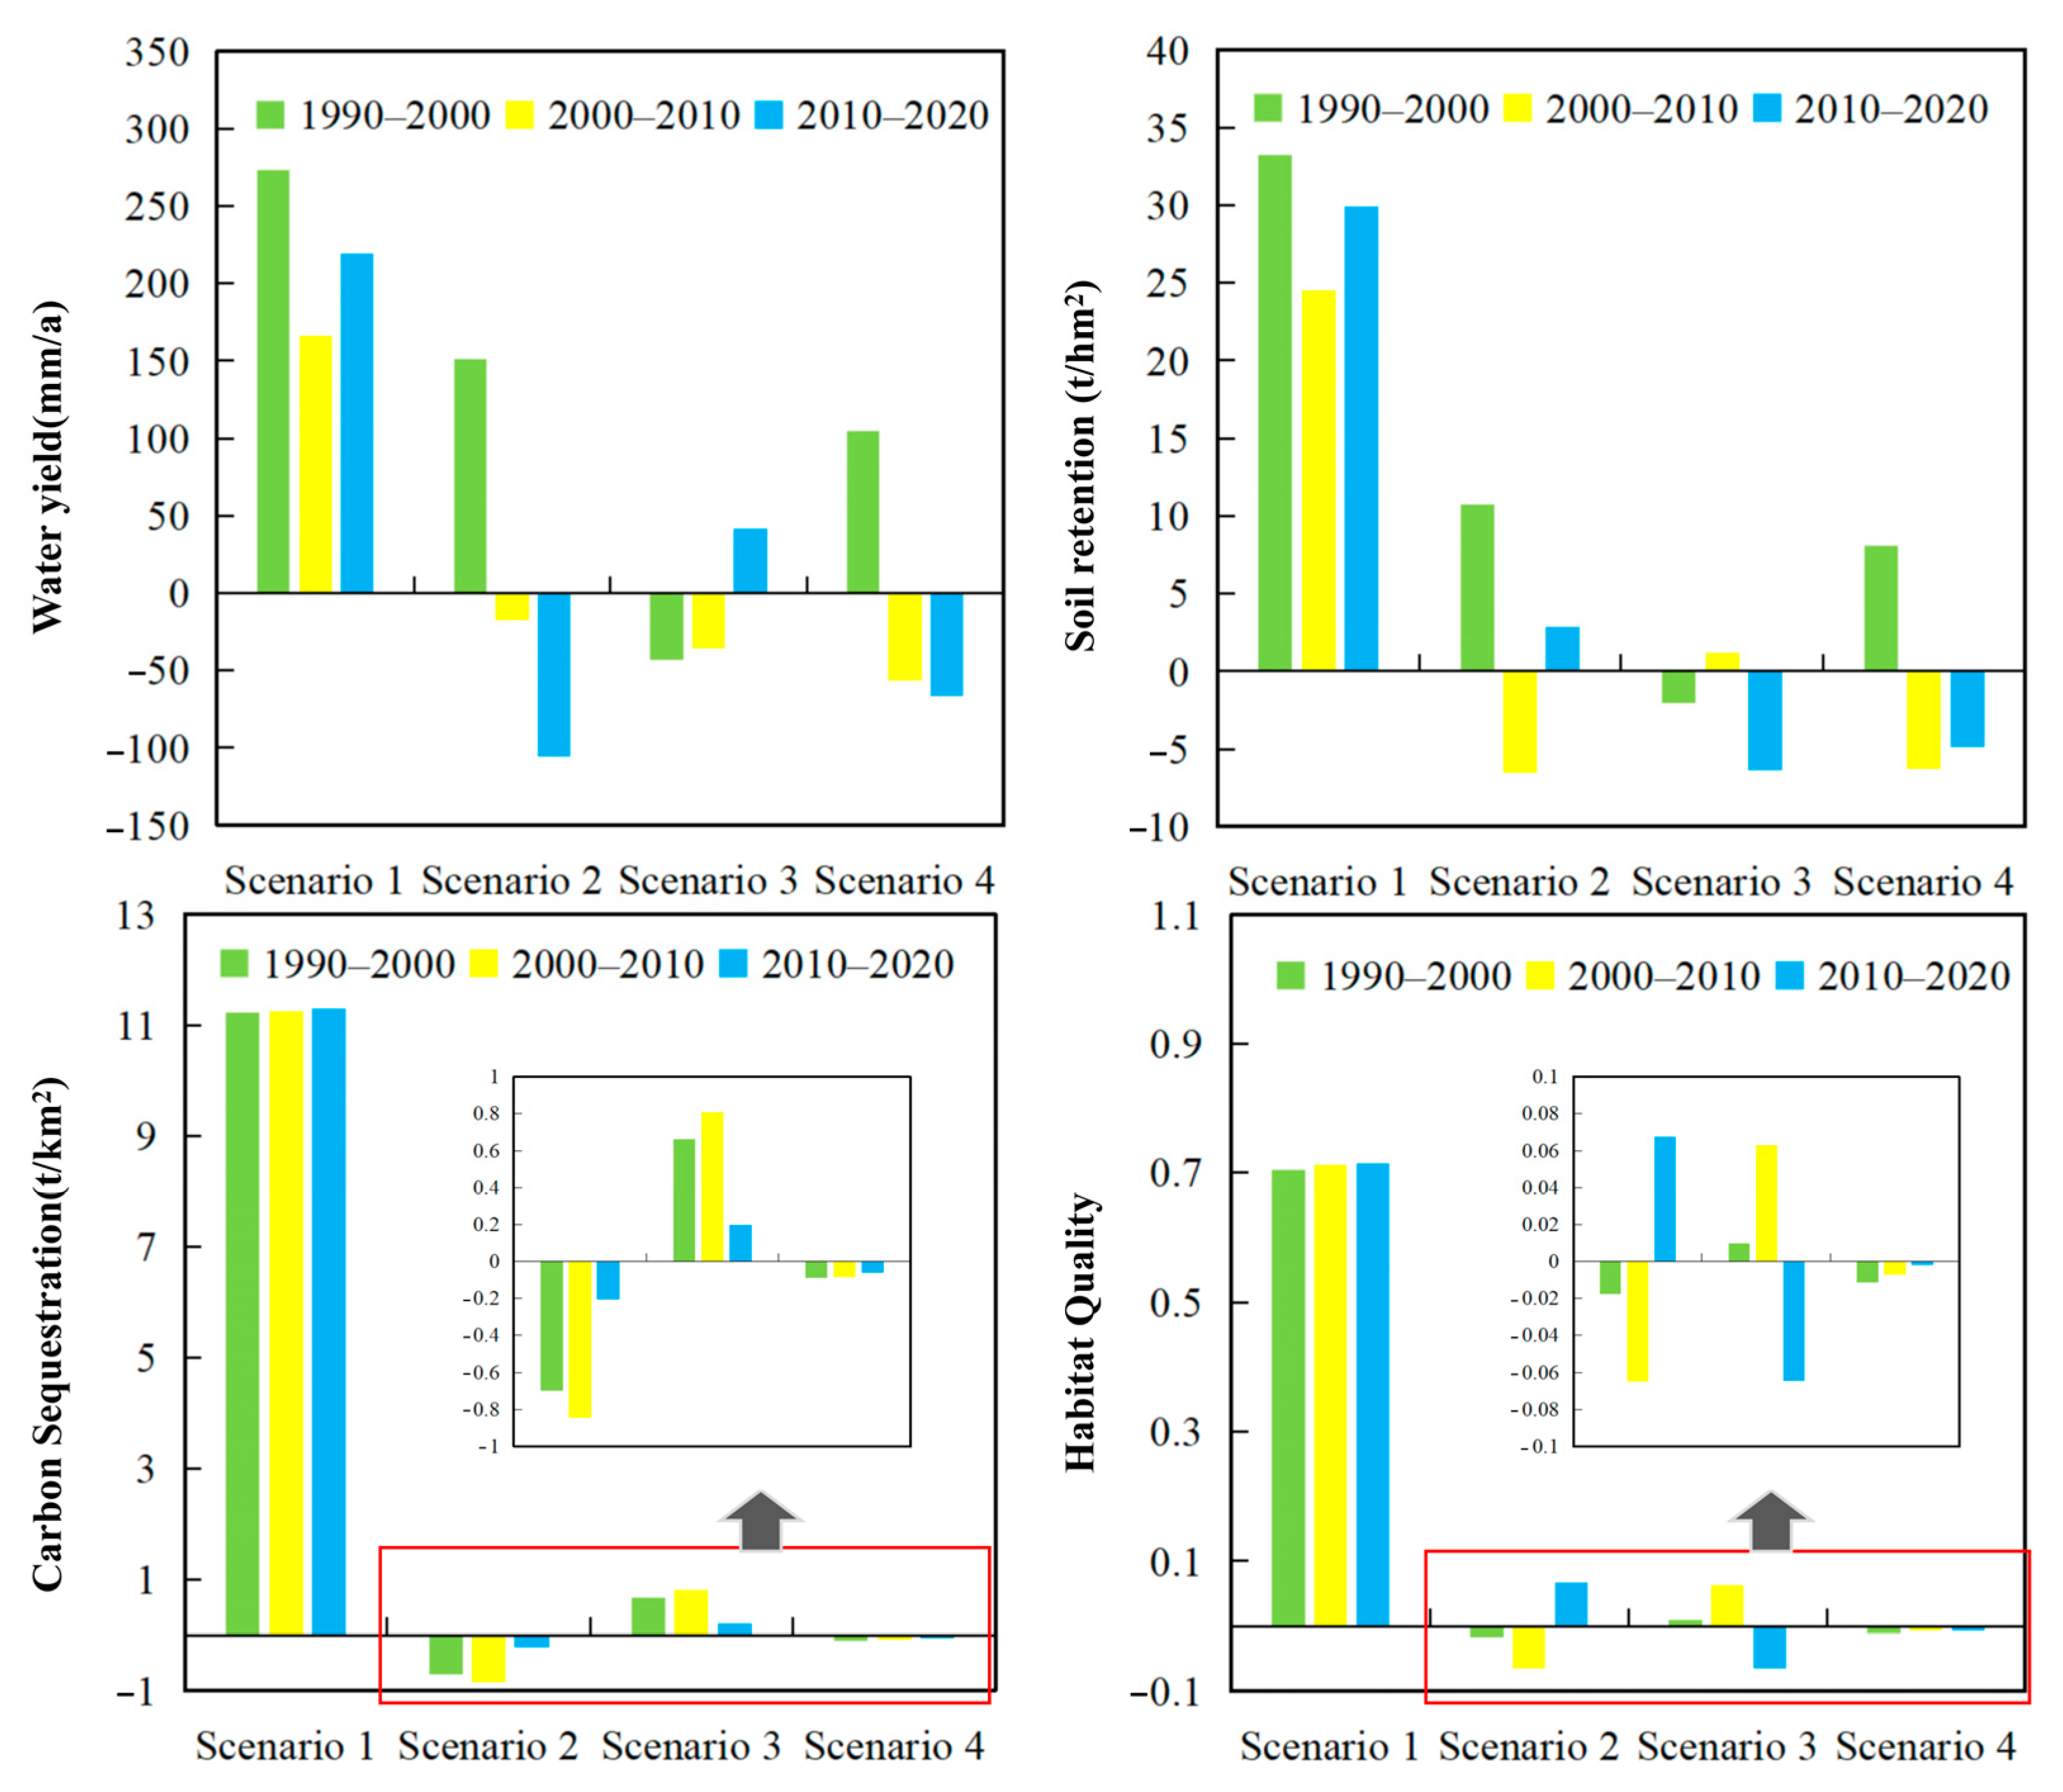
3.4. ESs Dynamics Under Different Simulation Scenarios from 1990–2020

Simulation results revealed spatial and temporal variations in ES dynamics across the URMR (Figure 11). Between 1990 and 2000, under the climate-only scenario, water yield, soil conservation, carbon sequestration, and habitat quality had changed by −43.2151 mm, −2.0695 t/hm2, 0.6621 t/hm2, and 0.0097, respectively. Similarly, under the LUC-only scenario, water yield, soil conservation, carbon sequestration, and habitat quality changed by 150.7291 mm, 10.7469 t/hm2, −0.6982 t/hm2, and −0.0177, respectively, during the same period.
Between 2000 and 2010, under the climate-only scenario, water yield, soil conservation, carbon sequestration, and habitat quality changed −35.9195 mm, 1.1615 t/hm2, 0.8087 t/hm2, and 0.063, while water yield, soil conservation, carbon sequestration, and habitat quality changed −17.371 mm, −6.5267 t/hm2, −0.8421 t/hm2, and−0.065 by 2010, respectively, under the LUC-only scenario.
Between 2010 and 2020, under the climate-only scenario, water yield, soil conservation, carbon sequestration, and habitat quality changed by 41.9262 mm, −6.3562 t/hm2, 0.0198 t/hm2, and −0.0645, while water yield, soil conservation, carbon sequestration, and habitat quality changed by −105.4632 mm, 2.8829 t/hm2, −0.2063 t/hm2, and 0.0674, respectively, under LUC-only scenario.

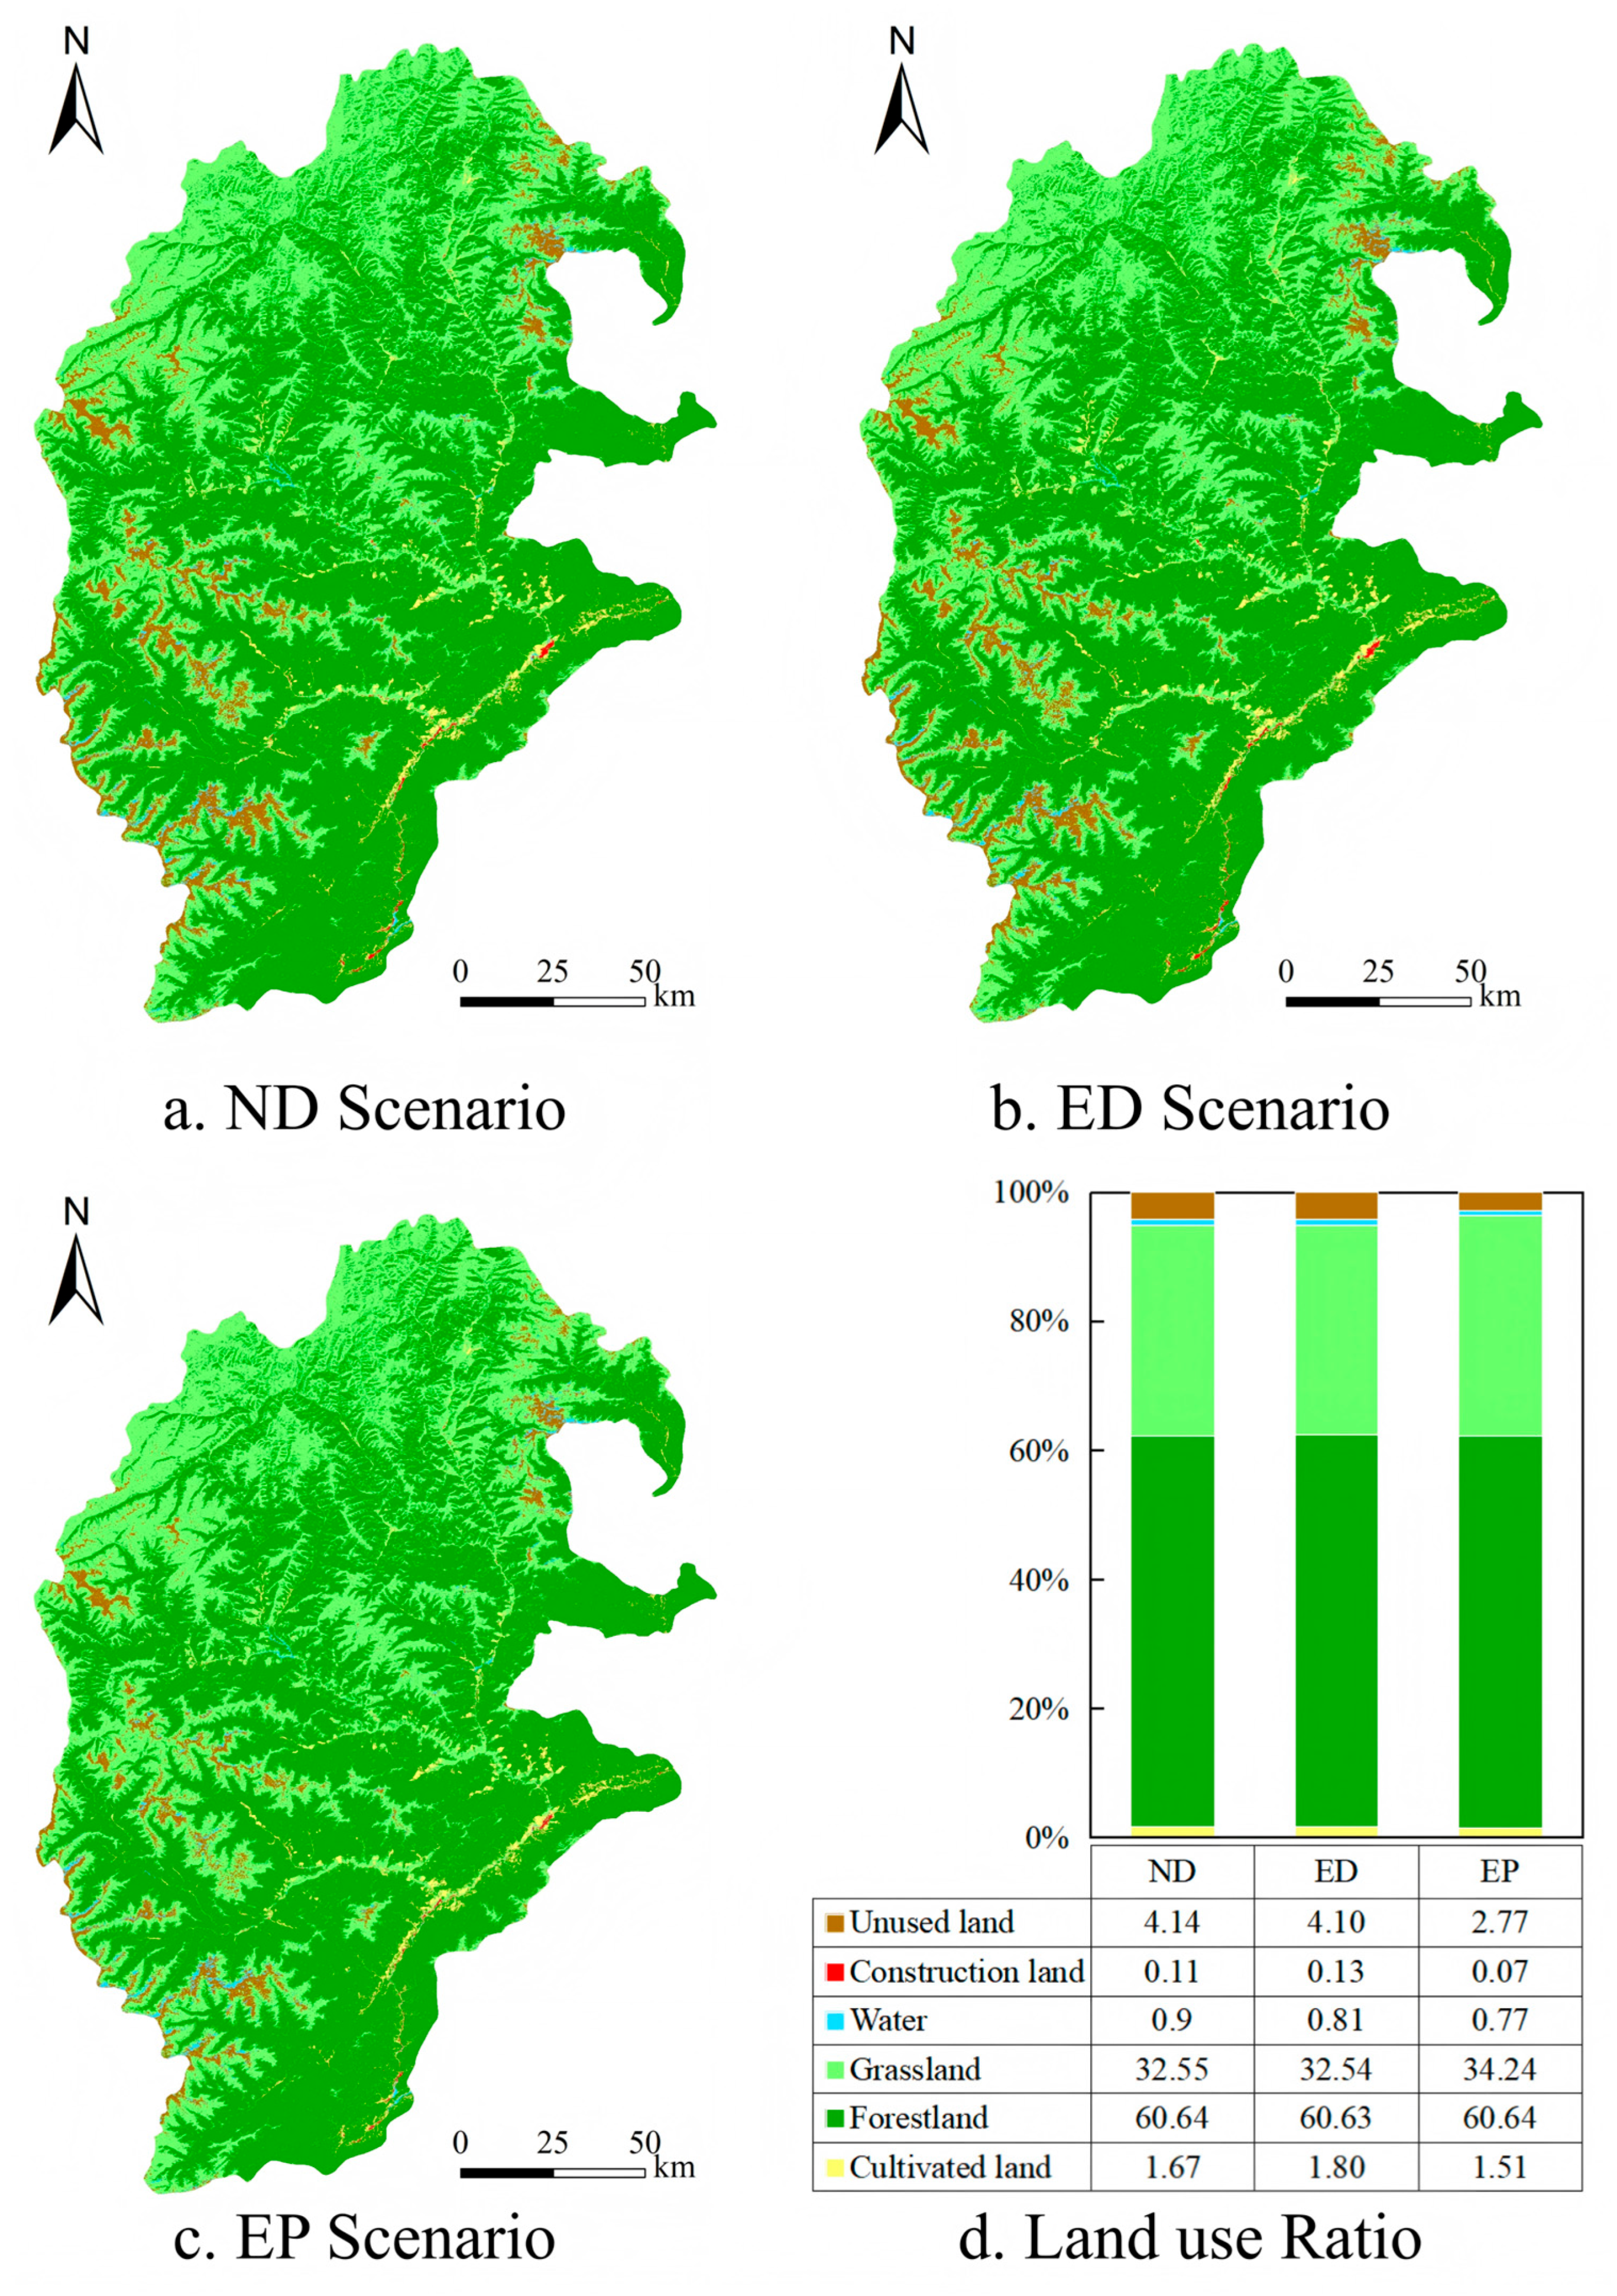
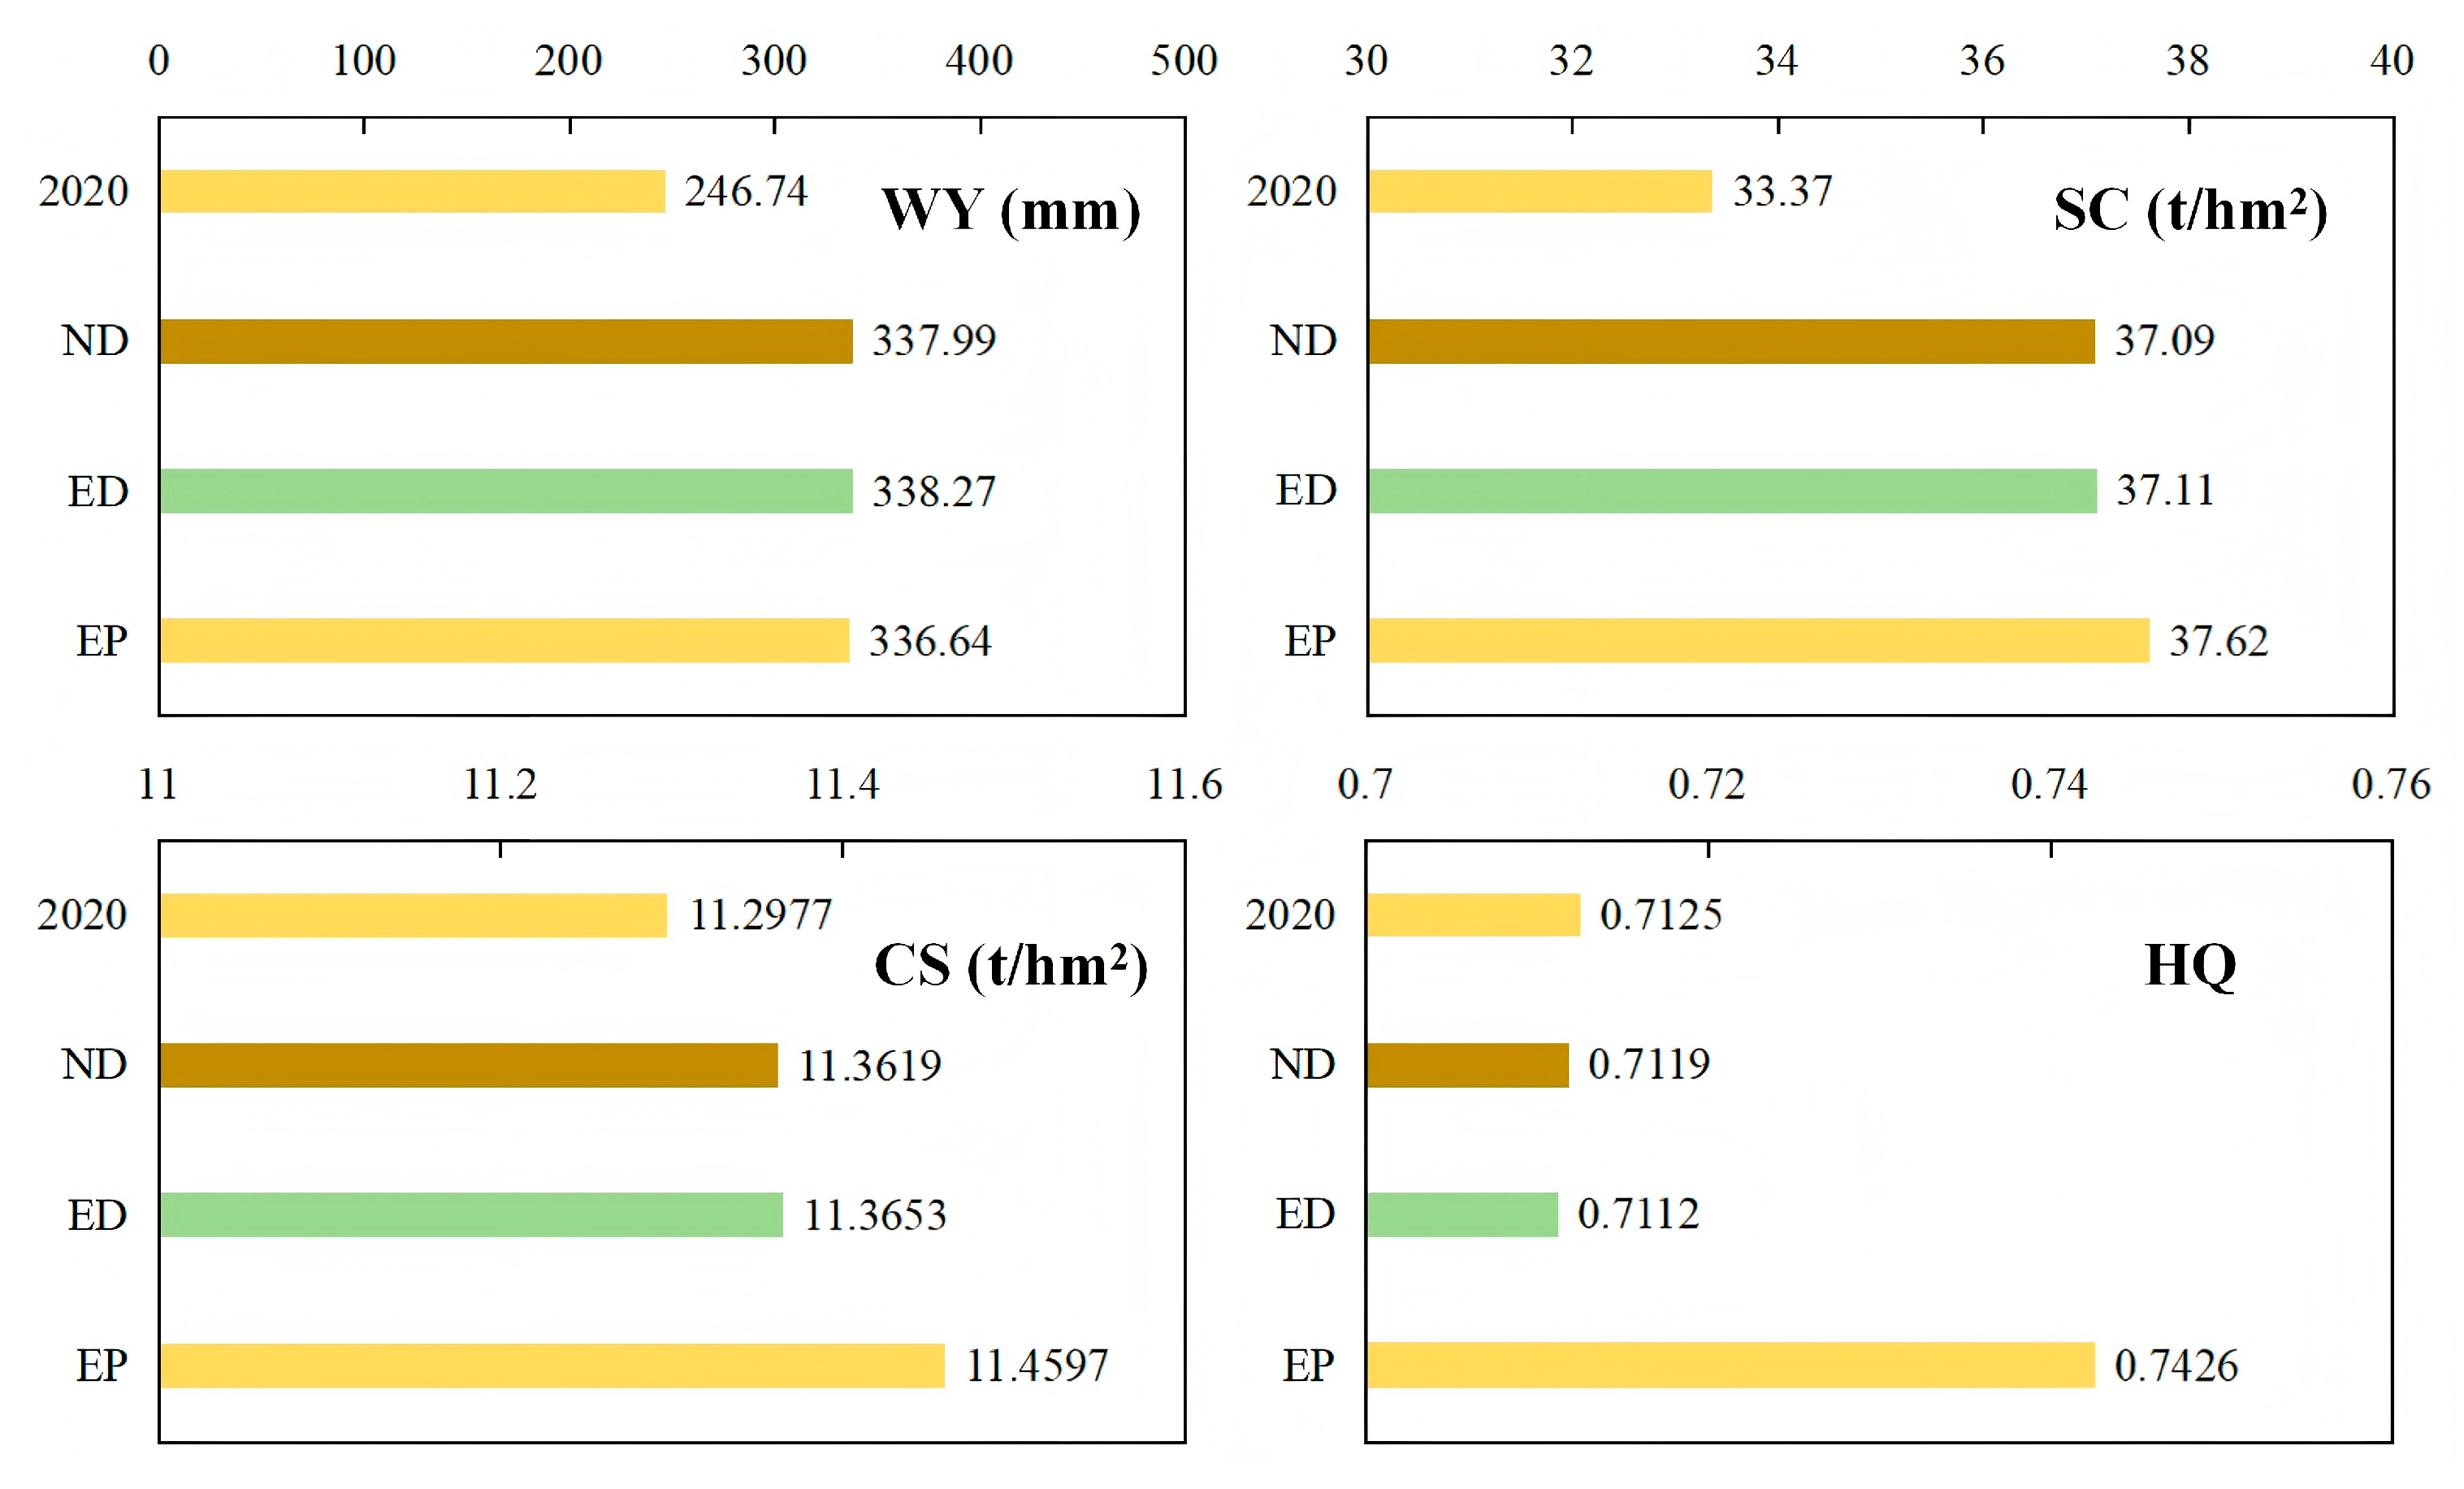
3.5. ESs Dynamics Under Different Simulation Scenarios in 2050

Using the PLUS model, the simulated 2020 land use was compared to actual data, showing 95.98% accuracy and a kappa coefficient of 0.92, indicating high reliability of the model. This model was then used to simulate three 2050 scenarios (Figure 12a–c) and compute land use proportions (Figure 12d).
Under the SSP126 scenario, InVEST simulated ES dynamics for 2050 (Figure 13). Compared with 2020, WY, CS, and SC increased, but HQ decreased under economic development (ED) scenarios compared with natural development (ND) scenarios, while the ecological protection (EP) scenario reduced WY services and increased SC, CS, and HQ by 2050.

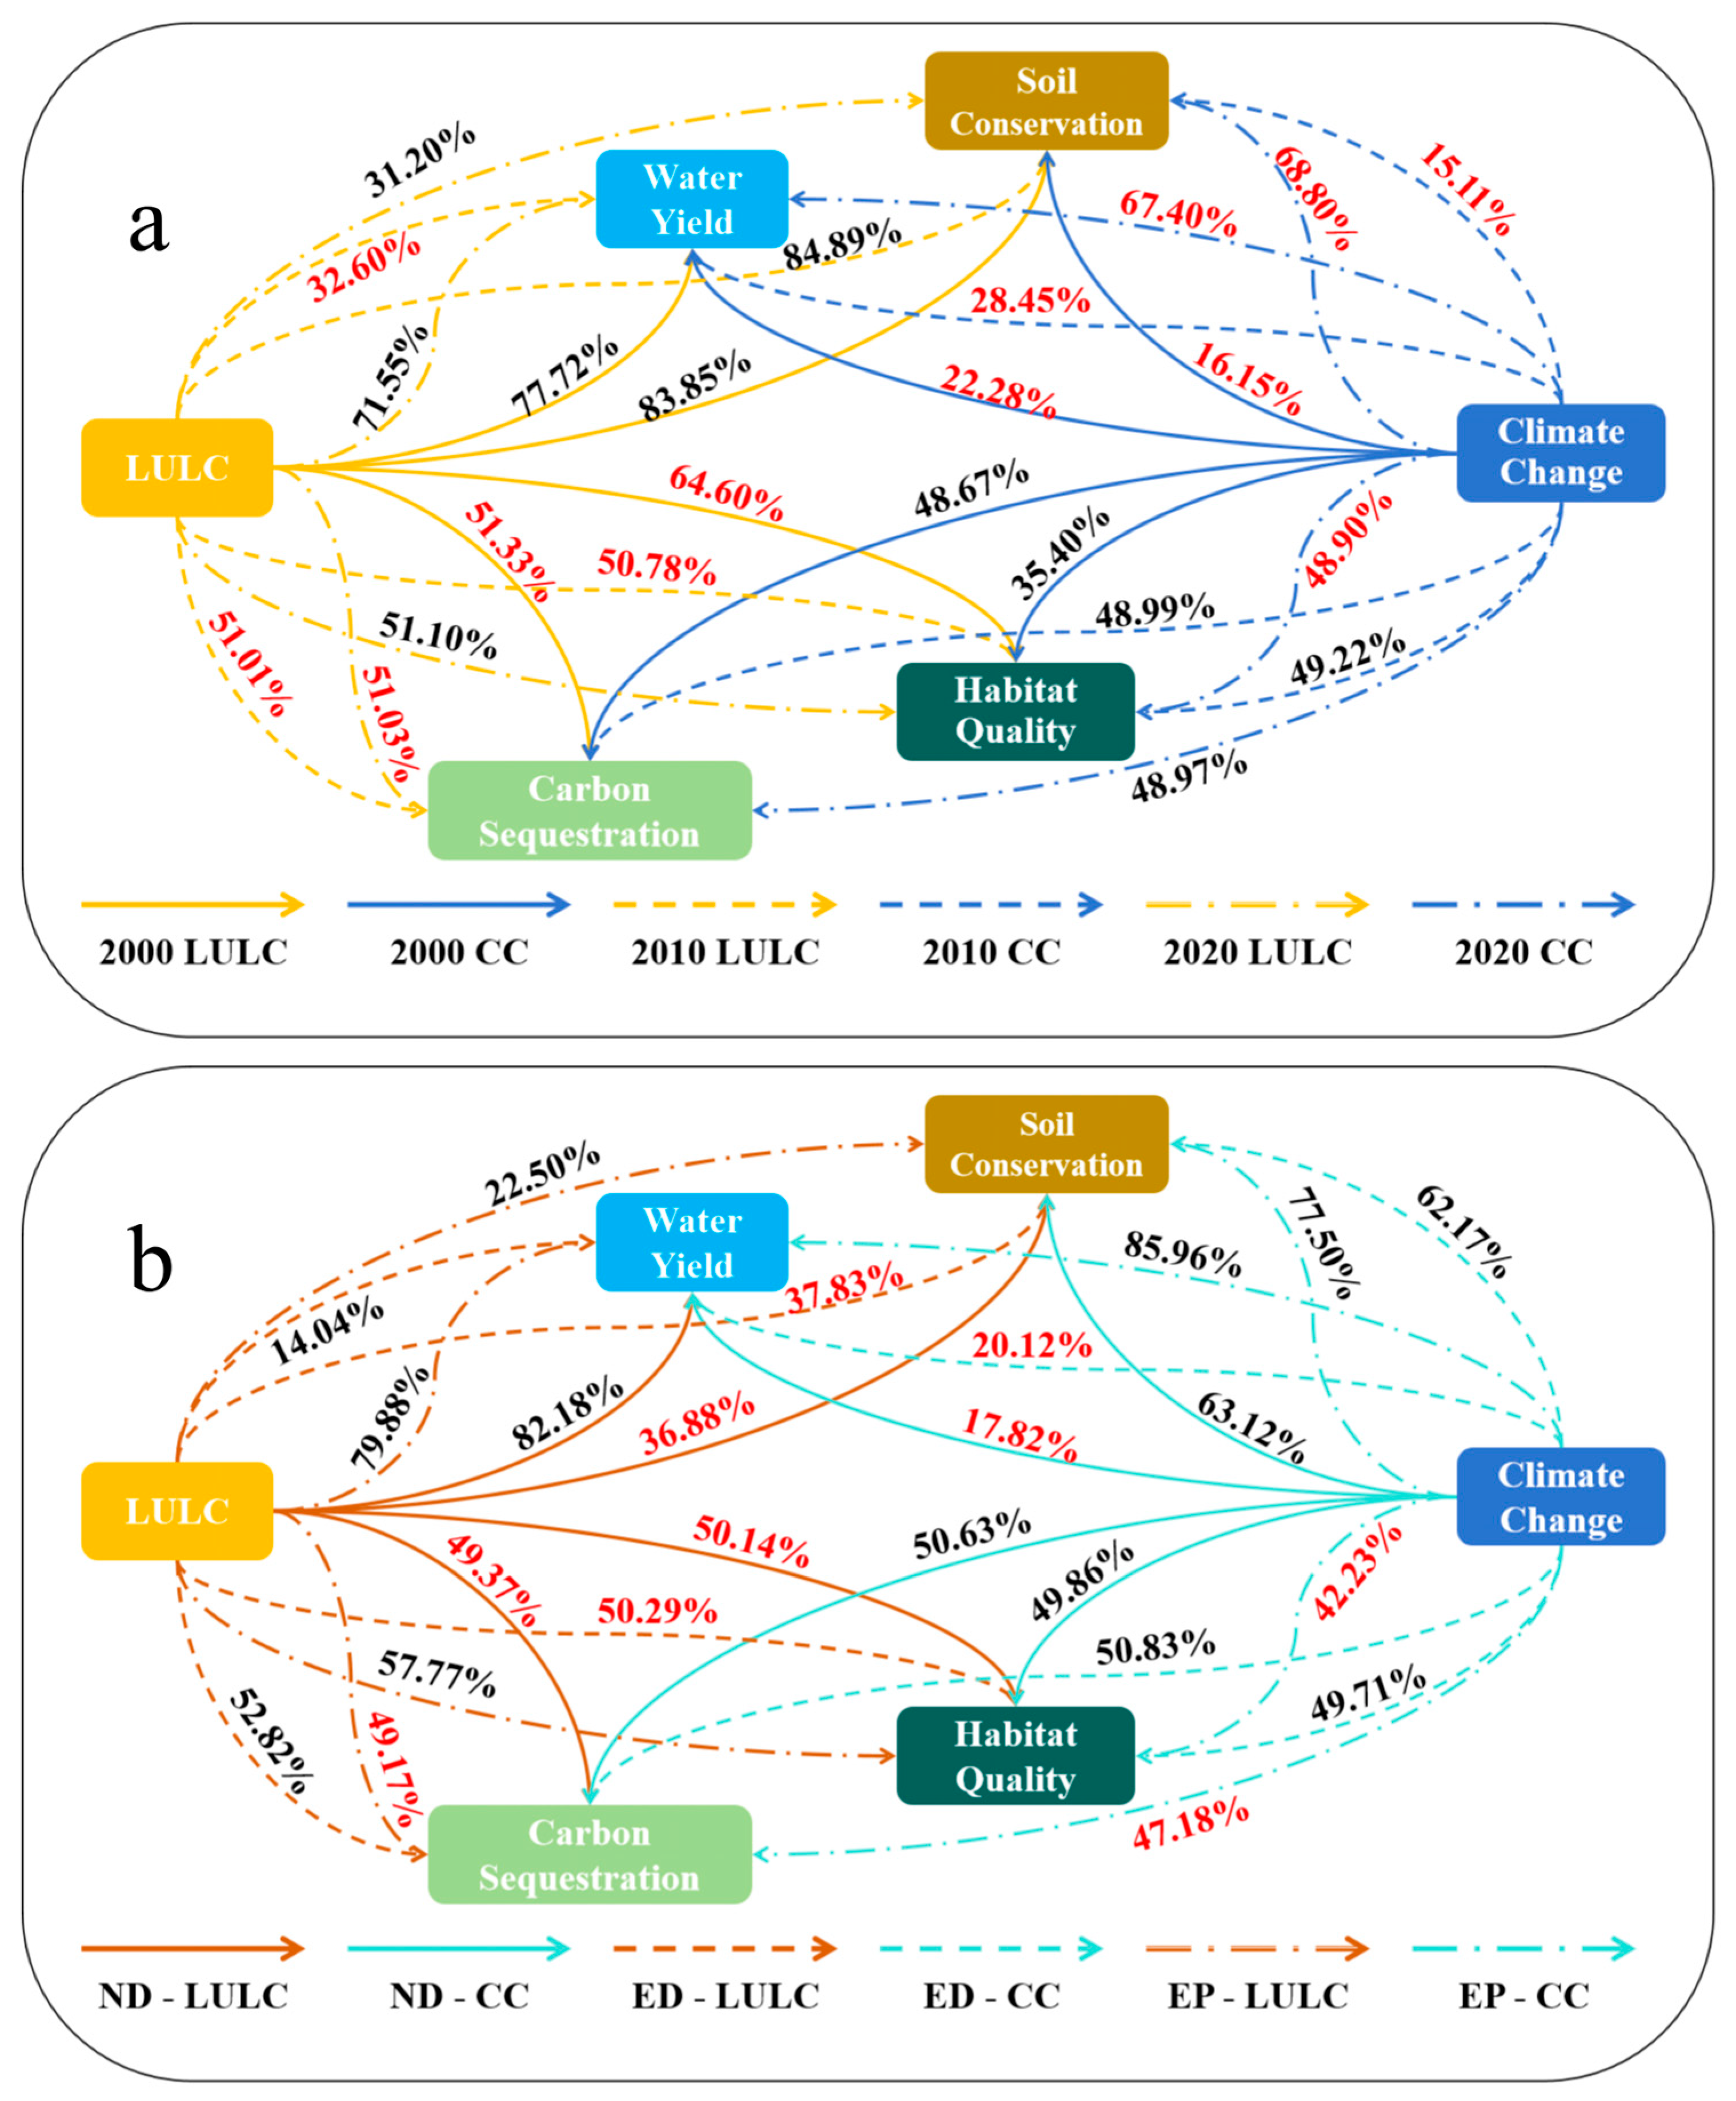
3.6. The Independent Contributions of Climate Change and LUC to ES Dynamics

From 1990 to 2020, climate and land use changes had varying impacts on ESs in the URMR (Figure 14a). Climate change positively increased water yield by 22.28% (1990–2000), 28.45% (2000–2010), and 67.40% (2010–2020). In contrast, the contribution of LUC to water yield was positive only in 2000–2010.
The contribution of climate change to soil conservation services was also positive. However, the rate of contribution fluctuated showing a decline, followed by an increase in the periods 1990–2000, 2000–2010, and 2010–2020. LUC, on the other hand, negatively affected regional soil conservation services, but the effect in 2010–2020 was smaller than that in the previous periods. The contributions of climate and land use changes to carbon sequestration services in the URMR were neither consistently positive nor negative. While land use led to a reduction in carbon sequestration services, climate change led to an increase in carbon sequestration services.
Habitat quality followed a similar trend to soil conservation, showing positive contributions between 1990–2000 and 2000–2010, whereas in 2010–2020, climate change contributed to a decline in habitat quality, but LUC had the opposite effects.
Climate and land use changes had varying impacts on ESs under different scenarios in the URMR for 2050 (Figure 14b). Under the ND scenario, LUC had a positive effect on WY and negative effects on CS, CS, and HQ, whereas climate change had the opposite effect. Under the ED scenario, LUC and CC exerted similar impacts on ESs. In contrast, under the EP scenario, LUC had positive impacts on all four ESs, whereas climate change had negative effects on CS and HQ.

4. Discussion

This study provides empirical evidence on the impacts of climate and land use changes on spatio-temporal dynamics of four ecosystem services in a lesser-explored region of China—the upper reaches of the Minjiang River Basin. Globally, climate change and land use changes are the major drivers influencing ecosystem services, contributing both positively and negatively depending on local biophysical conditions and land use patterns [52]. In the URMR, areas affected by LUC are relatively smaller and ESs in most areas were primarily influenced by climate change. However, rapid urbanization, agriculture intensification, and industrialization have drastically transformed global land use patterns [53], making LUC a major driver of biodiversity loss and ES degradation [14,54]. LUC alters ecosystem processes by modifying the surface properties, such as evapotranspiration, albedo, and surface roughness, while climate change influences temperature and hydrological cycles, consequently affecting water yield. For example, precipitation declines reduce water yield in arid regions [55], and warming negatively impacts grassland ESs in Mongolia [56].
We found that water yield in the URMR declined between 1990 and 2000 but increased in 2000–2010 and 2010–2020. Climate change positively contributed to regional water yield, with its relative contribution increased from 22.8% in 1990–2000 to 66.4% in 2010–2020, consistent with previous findings in the region [34]. The impact of LUC on water yield was negative in 1990–2000 and 2010–2020. Since grassland and cultivated land are major contributors to water yield [57], the reduction of those land areas in 1990–2000 and 2010–2020, likely caused decreased water yield. In contrast, the expansion of forest and cultivated land between 2000 and 2010 contributed to increased water yield, but their contribution was relatively low compared to that of climate change. Our finding that LUC has a dominant role in shaping in regional water yield aligns with previous findings [58,59,60] but contradicts others [61], likely due to differences in spatial scale. Urban surfaces with impervious layers increase runoff by reducing infiltration, thereby enhancing the surface runoff. Therefore, when other land use types are converted into urban areas or construction lands, the water yield is likely to increase. Between 1990 and 2020, the construction land in the URMR expanded from 0.02% in 1990 to 0.07% in 2020, adding 509.15 km2 area, mainly in low mountain valley areas. This expansion has likely contributed to increased surface runoff and subsequently increased regional water yield.
Theoretically, changes in precipitation patterns directly affect hydrological processes, influencing runoff, sediment transport, and soil erosion. Over the past 30 years, changes in regional soil conservation followed a similar trend consistent with the changes in water yield service, which decreased in 1990–2000 and increased thereafter. The gradually declining rate of increase was associated with changes in regional precipitation, suggesting the role of climate in stabilizing erosion control. In contrast, LUC had a negative impact on soil conservation, primarily through grassland decline and forest expansion. Grassland area decreased by 2.36%, 1.44%, and 0.3% in 1990–2000, 2000–2010, and 2010–2020, respectively, in URMR, whereas the forest cover expanded by 1.4%, 0.88%, and 0.39%, respectively (Figure 15 and Figure 16). While forest expansion helped contain soil erosion, the loss of grassland and increase in unused land increased regional soil erosion risks. The steep slope and complex topography of the URMR creates vertical heterogeneity in climate, vegetation, and landscape, further influencing soil and water conservation capacities [62].
From 1990 to 2020, carbon sequestration and habitat quality in the URMR increased by 0.69% and 1.01%, respectively. Forests with dense vegetation cover and high carbon storage potential play a critical role in enhancing these ESs [63]. Following the implementation of environmental policies after the 1998 floods, regional forest cover increased from 55.77% in 1990 to 58.41% in 2020, significantly contributing to regional carbon sequestration capacity and habitat quality improvement [32]. Although LUC positively influenced carbon sequestration, its contribution gradually declined over time. In contrast, LUC had positive impacts on habitat quality in 1990–2000 and 2000–2010 but a negative impact in 2010–2020 due to increased construction land and unused land, both are considered threat sources in habitat quality assessments. Expansion of construction land, in the valley lowland areas—due to their higher suitability for settlements—reduced cultivated land, thereby diminishing carbon sequestration capacity and habitat quality.
ES trends differed substantially across the three scenarios for 2050, particularly under the ED scenario. Under future climate change, SC, CS, and HQ were enhanced, while WY declined, consistent with the findings of a previous study [64]. This may reflect both altered precipitation patterns and reduced anthropogenic pressures under ED. While LUC had positively contributed to carbon sequestration, climate change exerted a negative influence—a result that contrasts with findings in arid zones [65], likely due to differences in precipitation patterns. The URMR located in the southwest monsoon area receives substantial monsoon rainfall, which buffers vegetation from precipitation fluctuations.
The loss of natural habitats from human activities weakens ecosystem functions and ES provision. The URMR is home to Tibetan, Qiang, Hui, Han, and other ethnic groups, whose traditional ecological knowledge emphasizes nature–culture harmony and environmental stewardship [66]. However, economic growth driven by tourism has increased environmental pressures despite the promotion of economic growth. The region’s growing tourist industry demands more infrastructure and resources, which can reduce ES provision and degrade habitat quality—effects likely to be exacerbated by climate change. Therefore, balancing the trade-off between economic growth and ecological sustainability is essential.
The analysis was based on data from four different time points (1990, 2000, 2010, and 2020), which may overlook finer-scale temporal variations and events, such as the 2008 Wenchuan earthquake. Nevertheless, this multi-temporal approach has been widely used in numerous studies [15,17,24]. With increasing availability of satellite remote sensing data, continuous time-series analyses should be carried out in the future. For example, Gao et al. [63] demonstrated such an approach, which could address these limitations. Additionally, cultural service is not included in the analysis due to the challenges in quantifying it and the lack of a robust framework. Evaluating cultural services in the URMR will require long-term ethnographic research that systematically integrates cultural practices and traditional ecological knowledge of minority communities into sustainability assessments.

5. Conclusions

This study provides empirical evidence on the spatiotemporal dynamics of ESs in the upper reaches of the Minjiang River Basin from 1990 to 2020. Using model simulations, we quantified the relative contributions of climate and land use changes to water yield, soil conservation, carbon sequestration, and habitat quality and assessed how these ESs have changed over the past three decades and are projected to change by 2050. The findings indicate that climate change played a dominant role in increasing water yield and soil conservation services, whereas land use change primarily contributed to improvements in carbon sequestration and habitat quality. These changes are driven by warming and wetting trends in the region, along with significant land use transitions—including forest expansion and the conversion of cultivated land to construction land—that have led to changes in ecosystem functions and thereby ES provisions. To sustain and enhance ESs in this ecologically sensitive region, it is crucial to implement climate-resilient land use policies, optimize spatial planning, and scale up ecological restoration initiatives. Such integrated strategies are essential for promoting regional sustainability and resilience under future climate and land use scenarios.

Author Contributions

For Conceptualization, C.L. and J.L.; methodology, C.L.; software, C.L.; validation, L.Z. and J.W.; formal analysis, C.L.; investigation, J.W.; resources, L.Z. and J.W.; data curation, C.L.; writing—original draft preparation, C.L.; writing—review and editing, U.B.S., J.L. and J.W.; visualization, U.B.S., L.Z., Y.W., D.L. and J.W.; supervision, U.B.S., L.Z., Y.W., D.L. and J.W.; project administration, J.W.; funding acquisition, J.W. All authors have read and agreed to the published version of the manuscript.

Funding

This research was funded by the Sichuan Natural Science Foundation, grant number 2024NSFSC0352, and the National Natural Science Foundation of China, grant number 31971436. The APC was funded by the Chengdu Institute of Biology, Chinese Academy of Sciences.

Data Availability Statement

No new data were created or analyzed in this study. Data sharing is not applicable to this article.

Acknowledgments

We would like to express our sincere appreciation to the editors and reviewers for their valuable contributions and support throughout this research. We are grateful for their helpful suggestions and assistance in improving the quality of this study.

Conflicts of Interest

The authors declare no conflicts of interest.

References

  1. Malhi, Y.; Franklin, J.; Seddon, N.; Solan, M.; Turner, M.G.; Field, C.B.; Knowlton, N. Climate change and ecosystems: Threats, opportunities and solutions. R. Soc. 2020, 375, 20190104. [Google Scholar] [CrossRef] [PubMed]
  2. Lawler, J.J.; Lewis, D.J.; Nelson, E.; Plantinga, A.J.; Polasky, S.; Withey, J.C.; Helmers, D.P.; Martinuzzi, S.; Pennington, D.; Radeloff, V.C. Projected land-use change impacts on ecosystem services in the United States. Proc. Natl. Acad. Sci. USA 2014, 111, 7492–7497. [Google Scholar] [CrossRef] [PubMed]
  3. Hasan, S.S.; Zhen, L.; Miah, M.G.; Ahamed, T.; Samie, A. Impact of land use change on ecosystem services: A review. Environ. Dev. 2020, 34, 100527. [Google Scholar] [CrossRef]
  4. Ostrom, E. A general framework for analyzing sustainability of social-ecological systems. Science 2009, 325, 419–422. [Google Scholar] [CrossRef] [PubMed]
  5. Díaz, S.; Pascual, U.; Stenseke, M.; Martín-López, B.; Watson, R.T.; Molnár, Z.; Hill, R.; Chan, K.M.; Baste, I.A.; Brauman, K.A. Assessing nature’s contributions to people. Science 2018, 359, 270–272. [Google Scholar] [CrossRef]
  6. Costanza, R.; d’Arge, R.; De Groot, R.; Farber, S.; Grasso, M.; Hannon, B.; Limburg, K.; Naeem, S.; O’neill, R.V.; Paruelo, J. The value of the world’s ecosystem services and natural capital. Nature 1997, 387, 253–260. [Google Scholar] [CrossRef]
  7. Wood, S.L.; Jones, S.K.; Johnson, J.A.; Brauman, K.A.; Chaplin-Kramer, R.; Fremier, A.; Girvetz, E.; Gordon, L.J.; Kappel, C.V.; Mandle, L. Distilling the role of ecosystem services in the Sustainable Development Goals. Ecosyst. Serv. 2018, 29, 70–82. [Google Scholar] [CrossRef]
  8. Costanza, R.; De Groot, R.; Sutton, P.; Van der Ploeg, S.; Anderson, S.J.; Kubiszewski, I.; Farber, S.; Turner, R.K. Changes in the global value of ecosystem services. Glob. Environ. Change 2014, 26, 152–158. [Google Scholar] [CrossRef]
  9. Zhang, G.; Zheng, D.; Xie, L.; Zhang, X.; Wu, H.; Li, S. Mapping changes in the value of ecosystem services in the Yangtze River Middle Reaches Megalopolis, China. Ecosyst. Serv. 2021, 48, 101252. [Google Scholar] [CrossRef]
  10. Srivathsa, A.; Vasudev, D.; Nair, T.; Chakrabarti, S.; Chanchani, P.; DeFries, R.; Deomurari, A.; Dutta, S.; Ghose, D.; Goswami, V.R. Prioritizing India’s landscapes for biodiversity, ecosystem services and human well-being. Nat. Sustain. 2023, 6, 568–577. [Google Scholar] [CrossRef]
  11. Schirpke, U.; Ghermandi, A.; Sinclair, M.; Van Berkel, D.; Fox, N.; Vargas, L.; Willemen, L. Emerging technologies for assessing ecosystem services: A synthesis of opportunities and challenges. Ecosyst. Serv. 2023, 63, 101558. [Google Scholar] [CrossRef]
  12. Sharp, R.; Douglass, J.; Wolny, S.; Arkema, K.; Bernhardt, J.; Bierbower, W.; Chaumont, N.; Denu, D.; Fisher, D.; Glowinski, K. InVEST 3.8.7. User’s Guide; The Natural Capital Project, Standford University, University of Minnesota, The Nature Conservancy, and World Wildlife Fund: Standford, CA, USA, 2020; pp. 20–40. [Google Scholar]
  13. Bagstad, K.J.; Semmens, D.J.; Waage, S.; Winthrop, R. A comparative assessment of decision-support tools for ecosystem services quantification and valuation. Ecosyst. Serv. 2013, 5, 27–39. [Google Scholar] [CrossRef]
  14. Díaz, S.M.; Settele, J.; Brondízio, E.; Ngo, H.; Guèze, M.; Agard, J.; Arneth, A.; Balvanera, P.; Brauman, K.; Butchart, S. The Global Assessment Report on Biodiversity and Ecosystem Services: Summary for Policy Makers; IPBES: Bon, Germany, 2019. [Google Scholar]
  15. Mendoza-Ponce, A.; Corona-Núñez, R.; Kraxner, F.; Leduc, S.; Patrizio, P. Identifying effects of land use cover changes and climate change on terrestrial ecosystems and carbon stocks in Mexico. Glob. Environ. Change 2018, 53, 12–23. [Google Scholar] [CrossRef]
  16. Foley, J.A.; DeFries, R.; Asner, G.P.; Barford, C.; Bonan, G.; Carpenter, S.R.; Chapin, F.S.; Coe, M.T.; Daily, G.C.; Gibbs, H.K. Global consequences of land use. Science 2005, 309, 570–574. [Google Scholar] [CrossRef]
  17. Su, C.; Fu, B. Evolution of ecosystem services in the Chinese Loess Plateau under climatic and land use changes. Glob. Planet. Change 2013, 101, 119–128. [Google Scholar] [CrossRef]
  18. Hicke, J.A.; Lobell, D.B.; Asner, G.P. Cropland area and net primary production computed from 30 years of USDA agricultural harvest data. Earth Interact. 2004, 8, 1–20. [Google Scholar] [CrossRef]
  19. Meersmans, J.; Arrouays, D.; Van Rompaey, A.J.; Pagé, C.; De Baets, S.; Quine, T.A. Future C loss in mid-latitude mineral soils: Climate change exceeds land use mitigation potential in France. Sci. Rep. 2016, 6, 35798. [Google Scholar] [CrossRef] [PubMed]
  20. Li, Y.; Luo, H. Trade-off/synergistic changes in ecosystem services and geographical detection of its driving factors in typical karst areas in southern China. Ecol. Indic. 2023, 154, 110811. [Google Scholar] [CrossRef]
  21. Ma, S.; Li, Y.; Zhang, Y.; Wang, L.-J.; Jiang, J.; Zhang, J. Distinguishing the relative contributions of climate and land use/cover changes to ecosystem services from a geospatial perspective. Ecol. Indic. 2022, 136, 108645. [Google Scholar] [CrossRef]
  22. Xiao, J.; Song, F.; Su, F.; Shi, Z.; Song, S. Quantifying the independent contributions of climate and land use change to ecosystem services. Ecol. Indic. 2023, 153, 110411. [Google Scholar] [CrossRef]
  23. Zhang, Y.; Wu, T.; Song, C.; Hein, L.; Shi, F.; Han, M.; Ouyang, Z. Influences of climate change and land use change on the interactions of ecosystem services in China’s Xijiang River Basin. Ecosyst. Serv. 2022, 58, 101489. [Google Scholar] [CrossRef]
  24. Sunl, Y.; Sun, M. Coupled impacts of climate and land use changes on regional ecosystem services. J. Environ. Manag. 2023, 326, 116753. [Google Scholar]
  25. Seidl, R.; Albrich, K.; Erb, K.; Formayer, H.; Leidinger, D.; Leitinger, G.; Tappeiner, U.; Tasser, E.; Rammer, W. What drives the future supply of regulating ecosystem services in a mountain forest landscape? Forest Ecol. Manag. 2019, 445, 37–47. [Google Scholar] [CrossRef] [PubMed]
  26. Payne, D.; Spehn, E.M.; Snethlage, M.; Fischer, M. Opportunities for research on mountain biodiversity under global change. Curr. Opin. Environ. Sustain. 2017, 29, 40–47. [Google Scholar] [CrossRef]
  27. Liu, Y.; Li, J.; Yang, Y. Strategic adjustment of land use policy under the economic transformation. Land Use Policy 2018, 74, 5–14. [Google Scholar] [CrossRef]
  28. Yuan, Z.; Liang, Y.; Zhao, H.; Wei, D.; Wang, X. Trade-offs and synergies between ecosystem services on the Tibetan Plateau. Ecol. Indic. 2024, 158, 111384. [Google Scholar] [CrossRef]
  29. Luo, D.; Gao, Z.; Chen, F.; Wang, L.; Liu, J.; Li, S.; Shen, Q.; Zao, Y. Revised understanding of permafrost shape: Inclusion of the transition zone and its climatic and environmental significances. J. Earth Sci. 2025, 36, 339–349. [Google Scholar] [CrossRef]
  30. Zhang, J.; Sun, J.; Ma, B.; Du, W. Assessing the ecological vulnerability of the upper reaches of the Minjiang River. PLoS ONE 2017, 12, e0181825. [Google Scholar] [CrossRef]
  31. Liu, Y.; Wang, L.; Zou, Q.; Li, J.; Lu, Y.; Li, L.; Xu, B.; Wang, L. Post-disaster spatial reconstruction from the perspective of a rural settlement niche in the upper reaches of the Minjiang River. J. Mt. Sci. 2024, 21, 1630–1646. [Google Scholar] [CrossRef]
  32. Liu, M.; Hu, Y.; Chang, Y.; He, X.; Zhang, W. Land use and land cover change analysis and prediction in the upper reaches of the Minjiang River, China. Environ. Manag. 2009, 43, 899–907. [Google Scholar] [CrossRef]
  33. Li, A.; Wang, A.; Liang, S.; Zhou, W. Eco-environmental vulnerability evaluation in mountainous region using remote sensing and GIS—A case study in the upper reaches of Minjiang River, China. Ecol. Model. 2006, 192, 175–187. [Google Scholar] [CrossRef]
  34. Hou, J.; Ye, A.; You, J.; Ma, F.; Duan, Q. An estimate of human and natural contributions to changes in water resources in the upper reaches of the Minjiang River. Sci. Total Environ. 2018, 635, 901–912. [Google Scholar] [CrossRef] [PubMed]
  35. Fu, B.; Stafford-Smith, M.; Wang, Y.; Wu, B.; Yu, X.; Lv, N.; Ojima, D.S.; Lv, Y.; Fu, C.; Liu, Y.; et al. The Global-DEP conceptual framework—Research on dryland ecosystems to promote sustainability. Curr. Opin. Environ. Sustain. 2021, 48, 17–28. [Google Scholar] [CrossRef]
  36. Tang, Q.; He, X.; Bao, Y.; Zhang, X.; Guo, F.; Zhu, H. Determining the relative contributions of climate change and multiple human activities to variations of sediment regime in the Minjiang River, China. Hydrol. Process. 2013, 27, 3547–3559. [Google Scholar] [CrossRef]
  37. Millennium Ecosystem Assessment. Ecosystems and Human Well-Being: Synthesis; Island Press: Washington, DC, USA, 2005. [Google Scholar]
  38. Duan, L.; Yang, S.; Xiang, M.; Li, W.; Li, J. Spatiotemporal evolution and driving factors of ecosystem service value in the Upper Minjiang River of China. Sci. Rep. 2024, 14, 23398. [Google Scholar] [CrossRef]
  39. Zhang, W.; Hu, Y.; Zhang, J.; Liu, M.; Yang, Z. Assessment of land use change and potential eco-service value in the upper reaches of Minjiang River, China. J. For. Res. 2007, 18, 97–102. [Google Scholar] [CrossRef]
  40. Feng, X.; Sun, G.; Fu, B.; Su, C.; Liu, Y.; Lamparski, H. Regional effects of vegetation restoration on water yield across the Loess Plateau, China. Hydrol. Earth Syst. Sci. 2012, 16, 2617–2628. [Google Scholar] [CrossRef]
  41. Lang, Y.; Song, W.; Zhang, Y. Responses of the water-yield ecosystem service to climate and land use change in Sancha River Basin, China. Phys. Chem. Earth. 2017, 101, 102–111. [Google Scholar] [CrossRef]
  42. Yang, D.; Liu, W.; Tang, L.; Chen, L.; Li, X.; Xu, X. Estimation of water provision service for monsoon catchments of South China: Applicability of the InVEST model. Landsc. Urban Plan. 2019, 182, 133–143. [Google Scholar] [CrossRef]
  43. Xiao, Q.; Hu, D.; Xiao, Y. Assessing changes in soil conservation ecosystem services and causal factors in the Three Gorges Reservoir region of China. J. Clean. Prod. 2017, 163, S172–S180. [Google Scholar] [CrossRef]
  44. Zhang, K.; Shu, A.; Xu, X.; Yang, Q.; Yu, B. Soil erodibility and its estimation for agricultural soils in China. J. Arid Environ. 2008, 72, 1002–1011. [Google Scholar] [CrossRef]
  45. Jones, C.; Dyke, P.; Williams, J.; Kiniry, J.; Benson, V.; Griggs, R. EPIC: An operational model for evaluation of agricultural sustainability. Agric. Syst. 1991, 37, 341–350. [Google Scholar] [CrossRef]
  46. Renard, K.G. Predicting Soil Erosion by Water: A Guide to Conservation Planning with the Revised Universal Soil Loss Equation (RUSLE); US Department of Agriculture, Agricultural Research Service: Beltsville, MD, USA, 1997.
  47. Falkowski, P.; Scholes, R.J.; Boyle, E.; Canadell, J.; Canfield, D.; Elser, J.; Gruber, N.; Hibbard, K.; Högberg, P.; Linder, S. The global carbon cycle: A test of our knowledge of earth as a system. Science 2000, 290, 291–296. [Google Scholar] [CrossRef] [PubMed]
  48. Peng, Y.; Yang, W.; Li, J.; Wang, B.; Zhang, C.; Yue, K.; Wu, F. Contribution of soil fauna to foliar litter-mass loss in winter in an ecotone between dry valley and montane forest in the upper reaches of the Minjiang River. PLoS ONE 2015, 10, e0124605. [Google Scholar] [CrossRef] [PubMed]
  49. Yang, Z.S. Investigation and Study of Wild Vegetable Resources of the Upper Reach of the Minjiang River. Adv. Mater. 2014, 864, 2474–2477. [Google Scholar] [CrossRef]
  50. Tang, F.; Fu, M.; Wang, L.; Zhang, P. Land-use change in Changli County, China: Predicting its spatio-temporal evolution in habitat quality. Ecol. Indic. 2020, 117, 106719. [Google Scholar] [CrossRef]
  51. Song, Y.; Wang, M.; Sun, X.; Fan, Z. Quantitative assessment of the habitat quality dynamics in Yellow River Basin, China. Environ. Monit. Assess. 2021, 193, 614. [Google Scholar] [CrossRef]
  52. Ferreira, P.; van Soesbergen, A.; Mulligan, M.; Freitas, M.; Vale, M.M. Can forests buffer negative impacts of land-use and climate changes on water ecosystem services? The case of a Brazilian megalopolis. Sci. Total Environ. 2019, 685, 248–258. [Google Scholar] [CrossRef]
  53. Wang, X.; Wu, J.; Liu, Y.; Hai, X.; Shanguan, Z.; Deng, L. Driving factors of ecosystem services and their spatiotemporal change assessment based on land use types in the Loess Plateau. J. Environ. Manag. 2022, 311, 114835. [Google Scholar] [CrossRef]
  54. Lei, J.; Wang, S.; Wu, J.; Wang, J.; Xiong, X. Land-use configuration has significant impacts on water-related ecosystem services. Ecol. Eng. 2021, 160, 106133. [Google Scholar] [CrossRef]
  55. Wu, Y.; Zhang, X.; Li, C.; Xu, Y.; Hao, F.; Yin, G. Ecosystem service trade-offs and synergies under influence of climate and land cover change in an afforested semiarid basin, China. Ecol. Eng. 2021, 159, 106083. [Google Scholar] [CrossRef]
  56. Wang, H.; Zhou, S.; Li, X.; Liu, H.; Chi, D.; Xu, K. The influence of climate change and human activities on ecosystem service value. Ecol. Eng. 2016, 87, 224–239. [Google Scholar] [CrossRef]
  57. Clerici, N.; Cote-Navarro, F.; Escobedo, F.J.; Rubiano, K.; Villegas, J.C. Spatio-temporal and cumulative effects of land use-land cover and climate change on two ecosystem services in the Colombian Andes. Sci. Total Environ. 2019, 685, 1181–1192. [Google Scholar] [CrossRef]
  58. Ciftcioglu, G.C. Revealing major terrestrial-and marine species-based provisioning ecosystem services provided by the socio-ecological production landscapes and seascapes of Lefke Region in North Cyprus. Environ. Dev. Sustain. 2018, 20, 197–221. [Google Scholar] [CrossRef]
  59. Khalifa, M.; Elagib, N.A.; Ribbe, L.; Schneider, K. Spatio-temporal variations in climate, primary productivity and efficiency of water and carbon use of the land cover types in Sudan and Ethiopia. Sci. Total Environ. 2018, 624, 790–806. [Google Scholar] [CrossRef]
  60. Salimi, S.; Almuktar, S.A.; Scholz, M. Impact of climate change on wetland ecosystems: A critical review of experimental wetlands. J. Environ. Manag. 2021, 286, 112160. [Google Scholar] [CrossRef]
  61. Dai, E.; Yin, L.; Wang, Y.; Ma, L.; Tong, M. Quantitative assessment of the relative impacts of land use and climate change on the key ecosystem services in the Hengduan Mountain Region, China. Sustainability 2020, 12, 4100. [Google Scholar] [CrossRef]
  62. Gomes, L.C.; Bianchi, F.J.; Cardoso, I.M.; Fernandes Filho, E.I.; Schulte, R.P. Land use change drives the spatio-temporal variation of ecosystem services and their interactions along an altitudinal gradient in Brazil. Landsc. Ecol. 2020, 35, 1571–1586. [Google Scholar] [CrossRef]
  63. Gao, J.; Bian, H.; Zhu, C.; Tang, S. The response of key ecosystem services to land use and climate change in Chongqing: Time, space, and altitude. J. Geogr. Sci. 2022, 32, 317–332. [Google Scholar] [CrossRef]
  64. Ma, X.; Zhang, P.; Yang, L.; Qi, Y.; Liu, J.; Liu, L.; Fan, X.; Hou, K. Assessing the relative contributions, combined effects and multiscale uncertainty of future land use and climate change on water-related ecosystem services in Southwest China using a novel integrated modelling framework. Sustain. Cities Soc. 2024, 106, 105400. [Google Scholar] [CrossRef]
  65. Liu, X.; Pei, F.; Wen, Y.; Li, X.; Wang, S.; Wu, C.; Cai, Y.; Wu, J.; Chen, J.; Feng, K. Global urban expansion offsets climate-driven increases in terrestrial net primary productivity. Nat. Commun. 2019, 10, 5558. [Google Scholar] [CrossRef] [PubMed]
  66. Naudiyal, N.; Wang, J.; Ning, W.; Gaire, N.P.; Peili, S.; Yanqiang, W.; Jiali, H.; Ning, S. Potential distribution of Abies, Picea, and Juniperus species in the sub-alpine forest of Minjiang headwater region under current and future climate scenarios and its implications on ecosystem services supply. Ecol. Indic. 2021, 121, 107131. [Google Scholar] [CrossRef]
Figure 1. Location map of the upper reaches of the Minjiang River, China.
Remotesensing 17 01884 g001
Figure 2. A schematic of the methodological framework used in this study.
Remotesensing 17 01884 g002
Figure 3. Changes in average annual temperature and annual precipitation in the upper reaches of the Minjiang River from 1990 to 2020.
Remotesensing 17 01884 g003
Figure 4. Spatial distribution of average annual temperature and annual precipitation in the upper reaches of the Minjiang River.
Remotesensing 17 01884 g004
Figure 5. Transfer of land use type area in the upper reaches of the Minjiang River from 1990 to 2020.
Remotesensing 17 01884 g005
Figure 6. Distribution of land use (A) and land use transfer (B) in the upper reaches of the Minjiang River from 1990 to 2020; (ad) of (B) are local land transformations of different periods.
Remotesensing 17 01884 g006
Figure 7. Spatial distribution of water yield from 1990 to 2020.
Remotesensing 17 01884 g007
Figure 8. Spatial distribution of soil conservation from 1990 to 2020.
Remotesensing 17 01884 g008
Figure 9. Spatial distribution of carbon sequestration from 1990 to 2020.
Remotesensing 17 01884 g009
Figure 10. Spatial distribution of habitat quality from 1990 to 2020.
Remotesensing 17 01884 g010
Figure 11. Changes in ESs under different simulation scenarios from 1990 to 2020.
Remotesensing 17 01884 g011
Figure 12. Land use type under future ND, ED, and EP scenarios in 2050. The colors of (ac) present same land use type as (d).
Remotesensing 17 01884 g012
Figure 13. Changes in ESs under future ND, ED, and EP scenarios in 2050.
Remotesensing 17 01884 g013
Figure 14. Climate and land use contributions to ESs and their dynamics from 1990 to 2020 (a) and in 2050 (b).
Remotesensing 17 01884 g014
Figure 15. The proportion of land use change types in different periods from 1990 to 2020.
Remotesensing 17 01884 g015
Figure 16. The percentage of exchange between land cover types from 1990 to 2020.
Remotesensing 17 01884 g016
Table 1. Sources of the spatial datasets used in this study.
DataData Type/ResolutionSourceWebsite
Land use/land coverRaster data/30 mNational Earth System Science Data Centerhttps://www.resdc.cn/
Digital elevation model (DEM)Raster data/30 mNational Earth System Science Data Centerhttps://www.resdc.cn/
TemperatureRaster data/1000 mThe National Tibetan Plateau Data Centerhttps://data.tpdc.ac.cn/
PrecipitationRaster data/1000 mThe National Tibetan Plateau Data Centerhttps://data.tpdc.ac.cn/
Potential evapotranspirationRaster data/1000 mThe National Tibetan Plateau Data Centerhttps://data.tpdc.ac.cn/
Soil dataRaster data/1000 mHarmonized World Soil Databasehttps://www.fao.org/
Table 2. ES scenarios used in this study.
1990–2000Scenario 1Scenario 2Scenario 3Scenario 4
InputClimate1990199020002000
LULC1990200019902000
OutputRe1ESlucc1EScli1ES1
2000–2010Scenario 1Scenario 2Scenario 3Scenario 4
InputClimate2000200020102010
LULC2000201020002010
OutputRe2ESlucc2EScli2ES2
2010–2020Scenario 1Scenario 2Scenario 3Scenario 4
InputClimate2010201020202020
LULC2010202020102020
OutputRe3ESlucc3EScli3ES3
Table 3. Land use type area in the upper reaches of the Minjiang River in 1990–2020.
1990200020102020
Area/km2Ratio (%)Area/km2Ratio (%)Area/km2Ratio (%)Area/km2Ratio (%)
Cultivated land744.472.55725.562.48811.552.78532.21.82
Forestland16,291.1755.7416,700.2657.1416,959.8858.0217,071.8758.41
Grassland11,758.1240.2311,069.2737.8710,647.5836.4310,560.1836.13
Water78.870.27148.510.51228.680.78185.940.64
Construction land350.160.02576.920.03564.20.06859.310.07
Unused land6.231.28.51.9717.121.9319.522.94
Disclaimer/Publisher’s Note: The statements, opinions and data contained in all publications are solely those of the individual author(s) and contributor(s) and not of MDPI and/or the editor(s). MDPI and/or the editor(s) disclaim responsibility for any injury to people or property resulting from any ideas, methods, instructions or products referred to in the content.

