Communication

Risk Assessment of the 2022 Nigerian Flood Event Using Remote Sensing Products and Climate Data

by
Itohan-Osa Abu
1,2 and
Chibuike Chiedozie Ibebuchi
3,4,*
1
Department of Remote Sensing, Institute for Geography and Geology, University of Würzburg, Am Hubland, 97074 Würzburg, Germany
2
Merie Analytics, Kent, OH 44240, USA
3
Department of Geography, Kent State University, Kent, OH 44242, USA
4
ClimRISE Lab, Kent State University, Kent, OH 44242, USA
*
Author to whom correspondence should be addressed.
Remote Sens. 2025, 17(11), 1814; https://doi.org/10.3390/rs17111814
Submission received: 18 March 2025 / Revised: 12 May 2025 / Accepted: 19 May 2025 / Published: 22 May 2025
(This article belongs to the Special Issue Hydrometeorological Modelling Based on Remotely Sensed Data)

Abstract

:
Hydrological extremes, particularly floods, are becoming prevalent in parts of Nigeria. During the 2022 rainy season, Nigeria experienced a devastating riverine flood with severe societal impacts. However, the principal factors contributing to riverine flooding in Nigeria remain debatable, necessitating data-driven and policy-relevant studies to quantify the primary causes of riverine floods in Nigeria. In this study, we applied remote sensing techniques and climate data to characterize the 2022 flood event in Nigeria by quantifying the flooded areas, the number of people affected per state, and riverine flood risk assessment. We investigated rainfall and soil moisture anomalies during the flood event and inferred the contribution of the opening of the Lagdo Dam, in Cameroon, to the severity of the flood event. Our results show that large parts of Cameroon and northern Nigeria experienced above-average rainfall during the 2022 rainy season, contributing to soil saturation. About 50,000 ha of land were flooded in Nigeria between July and August; however, following the opening of the Lagdo Dam in September, the flood extent spiked to 200,000 ha (i.e., about 300% increase), suggesting that excess water from the Lagdo Dam, coupled with inadequate drainage infrastructure, amplified the flood extent in Nigeria. Flooded areas were more extensive in northern Nigeria than in southern regions; however, due to denser settlements in flood-prone areas, Anambra State in southeastern Nigeria was the most affected in terms of people impacted. Therefore, besides rainfall changes and inadequate drainage infrastructures leading to the inundation of the major rivers in Nigeria and their tributaries, we also ranked poor town planning against the population density per square meter as a critical factor that amplifies the societal impacts of flooding in Nigeria. Finally, based on the 2022 conditions and the available pre-flood population data, an estimated number of 105,000 people are at critical risk of riverine flooding in Nigeria.

1. Introduction

Flooding is one of the most widespread and destructive natural hazards globally, disproportionately affecting low- and middle-income regions [1,2,3]. In some countries, where infrastructure and adaptive capacity are limited, flood risks pose a major threat to vulnerable populations [4,5]. Globally, nearly 1.47 billion people face substantial flood risks [1]. In urbanized regions of China, fluvial flood risks are increasingly intensified by rapid development and climate change [6]. Studies assessing urban agglomerations in China reveal varying levels of vulnerability, with flood risk projections worsening under high-emission scenarios [7]. In sub-Saharan Africa, over 238 million people live in informal settlements, which are highly vulnerable to flood impacts [8]. In West African countries, such as Nigeria, vulnerability is intensified by poverty, weak infrastructure, and a lack of institutional capacity, with local populations often lacking the means to evacuate or recover from flood events [9]. These global patterns highlight the urgent need for integrated flood risk assessments and targeted adaptation strategies across high-density urban centers and underserved rural communities.
Recently, during the peak of the rainy season in 2022, Nigeria, located in West Africa (Figure 1), experienced devastating floods, which affected up to 3.2 million people across Nigeria [10]. The flood resulted in the loss of lives, damage to properties, destruction of settlements and croplands, and an increased risk of waterborne diseases [10]. The actual principal cause of the 2022 flood in Nigeria remains debatable. However, heavy rainfall, possibly due to climate change, is argued to be the principal factor against the Lagdo Dam opening in Cameroon on 13 September 2022 [11]. Due to the large population in Nigeria, uncontrolled deforestation, population pressure on land resources, artisanal refining of crude oil, glaring of gases, unchecked combustion of fossil fuels, and low commitment to a renewable source of energy, among others, there is little doubt that land use changes and greenhouse gas emissions are on the rise in Nigeria, and could add up to the several factors that interacted in contributing to the severity of the 2022 flood event in Nigeria [12,13]. Moreover, considering the recent flood events in Nigeria, infrastructural issues such as a lack of proper drainage systems, town planning limiting the establishment of settlements in flood risk areas, and poor expertise in weather predictions [13] can equally be implicated as further factors amplifying the societal impacts of flood events. According to UNICEF [10], the 2022 flood event in Nigeria affected up to 34 states among the 36 states in Nigeria, and left more than 2.5 million people in need of humanitarian assistance.
To address the 2022 flood event and contribute towards the development of sustainability policies to ensure that lives, properties, and the ecosystem in Nigeria are protected against future floods, it is necessary to conduct scientific (data-driven) studies quantifying the several factors that lead to flooding and factors that amplify the societal impact of flooding in Nigeria. In the past, for example, in the 2012 flood event, which was ranked the worst in 40 years [14], the combination of heavy rainfall and the opening of the Lagdo Dam in Cameroon was implicated as the principal cause of the flood event [15]. Indeed, heavy rain in Cameroon, a neighboring country to the east of Nigeria, increases the need to minimize water pressure by releasing excess water from the Lagdo Dam. Before the construction of the Lagdo Dam, an agreement was reached in 1977 to build another dam in Nigeria that would mainly mitigate the downstream effects of the Lagdo Dam [16]. However, the Nigerian government did not complete the intended counter-dam, which makes Nigeria’s inhabitants downstream of the Lagdo Dam vulnerable to flash floods. On the other hand, it is well known in the climatological community that extreme weather conditions leading to rainfall extremes can occur due to natural climate variability, such as anomalies in climate drivers, for example, the El Niño Southern Oscillation [17]. However, anthropogenic climate change can still interfere with the rate and frequency at which natural climate drivers influence a region’s hydroclimate [18]. Therefore, to evade the fingerprint of human activity and decisions on the current flood events in Nigeria is almost inevitable. Thus, using the 2022 flood event as a case study, we apply remote sensing techniques and analysis of observational climate data to characterize the development of the flood, and subsequently perform a flood risk assessment to identify risk areas that can be useful in policymaking against a similar flood event in Nigeria.
Using satellite imagery to identify flooded areas [19], we employed an optimized threshold-based change-detection method (i.e., image ratioing) in this study. This involved dividing pixel values of a post-flood synthetic aperture radar (SAR) image by a pre-flood SAR image to highlight changes in VH backscatter caused by flooding. Areas with significant ratios, typically showing altered backscatter in flooded areas due to double-bounce effects or surface changes, indicated flooding. Thresholding was further applied to the ratio image to delineate flooded areas. The flood extent was intersected with population and land cover datasets to estimate exposed populations and impacted land uses. Rainfall and soil moisture anomalies and trends in heavy rainfall were analyzed using climatological data to assess the meteorological drivers of the flood event. Our approach seeks to better understand the impacts of the 2022 flood event and infer the relative contributions of rainfall and the opening of the Lagdo Dam on the flood extent. Hence, our research goals are to quantify the following: (i) the flood extent before and after the opening of the Lagdo Dam, (ii) estimated settlements affected, and (iii) the estimated number of people affected; and for the climatological analysis, we further investigate the following: (vi) rainfall and soil moisture anomalies in 2022, and (v) historical trends in heavy rainfall across Nigeria. Finally, flood risk areas and population exposure in Nigeria will be identified to inform resource planning and emergency disaster preparedness in case of a similar flood event.

2. Materials and Methods

2.1. Study Area

Figure 1 shows the major rivers in Nigeria. The Lagdo Dam, located northwest of Cameroon, sits on the River Benue (Figure 1). During June and November 2022—that is, before the flood became severe across Nigeria, and after the flood—Figure 2 shows Sentinel-2 satellite imagery (bands 4, 3, and 2) of the first and the second Niger Bridge, which runs across the River Niger, as accessed from Sentinel hub. From Figure 2, the banks of the River Niger were flooded following the 2022 flood event, which forms the foundation of the analysis in the subsequent sections.

2.2. Data

Google Inc.’s Google Earth Engine (GEE), an innovative cloud computing platform, enabled the production of global-scale data products, as shown in Table 1. These data products, described in Table 1, were used for flood analysis in this study.
Sentinel-1 Ground Range Detected (GRD) SAR data were chosen over optical data in this work, because of their unique scattering mechanisms observed at open water surfaces that enhance the SAR sensors’ capacity to detect floods [20].
The rainfall climate data used in this work were obtained from the Climate Prediction Center (CPC) [30]. The CPC data were obtained at a horizontal resolution of 0.5 degrees of longitude and latitude, and the temporal resolution was daily from 1979 to 2022. Monthly soil moisture data were obtained from the European Centre for Medium-Range Weather Forecasts Reanalysis version 5 (ERA5-land) [31] from 1990 to 2022. The horizontal resolution of the ERA5-Land data was 0.1° longitude and latitude. The climate datasets were used to estimate monthly rainfall and soil moisture anomalies during the 2022 flood event.

2.3. Flood Extent Mapping

To map the extent of the 2022 Nigeria flood, caused by heavy rainfall and Lagdo Dam releases, a change detection method (i.e., image ratioing) successfully applied by other studies, e.g., [32,33], was implemented using SAR GRD imagery. Two image composites were prepared: a pre-flood reference and a flood-period image. Images were filtered for Interferometric Wide mode, VH polarization, and ascending orbit, leveraging SAR’s cloud-penetrating water detection. The flood extent was determined by computing the ratio of VH backscatter intensities between the flood period and pre-flood composites (post-flood divided by pre-flood), where flooded areas showed higher backscatter due to double-bounce effects or surface changes. A threshold of 1.25 was applied to classify pixels with ratio values above 1.25 as flooded (annotated as 1) and below this as non-flooded (annotated as 0), producing a 10 m resolution binary raster. This threshold was iteratively tested to optimize inundated area detection while minimizing misclassifications.
In the post-processing step, to refine the flood extent, JRC GSW masked permanent water bodies to focus on temporary flooding. SRTM removed areas with slopes above 5%, as steep terrain resists flooding due to runoff. Isolated flood pixels with fewer than eight neighbors (8-connected neighborhood) were eliminated to reduce SAR speckle noise. The final raster, projected to EPSG:4326, calculated flooded areas in hectares, with each 10 m pixel equivalent to 0.01 hectares.

2.4. Accuracy Assessment

A Random Forest classifier was trained on a stratified random sample of pixels labeled as flooded or non-flooded to validate the flood extent map, using 2022 flood imagery. The classifier achieved an overall accuracy of 0.96 and a Kappa coefficient of 0.91, indicating robust performance. The producer’s accuracy was 0.96 for both non-flooded (class 0) and flooded (class 1) areas, showing reliable detection. The user’s accuracy was 0.95 for non-flooded areas and 0.96 for flooded areas, confirming minimal commission errors, validating the method’s applicability for the 2022 Nigeria flood conditions.

2.5. Impact Assessment

To estimate the population exposed to the 2022 flood, WorldPop quantified individuals per ha in flood-affected areas using the available pre-flood data at the time of performing this analysis (Table 1). The 10 m flood extent raster was resampled to WorldPop’s 100 m resolution and EPSG:4326 projection, then intersected to calculate the total population in flooded cells. ESA WorldCover, with 11 land cover categories, assessed the impacts on cropland and settlements using the pre-flood data available at the time of performing this analysis (Table 1). Cropland and settlement classes were extracted, and the flood extent was resampled to ESA WorldCover’s 10 m resolution and projection. Intersecting these classes quantified the flooded cropland and settlement areas in hectares, highlighting socio-economic impacts.

2.6. Flood Risk Mapping

A risk map was developed on the GEE platform to identify areas at risk of a 2022-like flood. Flood hazard was investigated using SAR imagery (July–October 2022) with a VH polarization image ratioing threshold (1.25). WorldPop was used to create a binary map of human presence in flood zones for exposure. ESA WorldCover assigned vulnerability scores based on 2022 damage patterns. Environmental modifiers included CHIRPS rainfall (July–October 2022, normalized by 800 mm), SRTM elevation/slope, SoilGrids clay content, and NASA SMAP soil moisture. JRC GSW masked permanent water, and FAO GAUL set Nigeria’s boundaries. The risk index was calculated from Equation (1).
R i s k = H a z a r d × E x p o s u r e × V u l n e r a b i l i t y × R a i n f a l l n o r m × C l a y n o r m × S o i l   m o i s t u r e n o r m × ( 1 s l o p e n o r m )
To account for the number of people living in risk areas, we assessed the number of people affected per state within regions corresponding to different normalized risk score categories. The risk categories were defined as follows: 0.0: no risk, 0–0.2: low risk, 0.2–0.4: moderate risk, 0.4–0.6: high risk, 0.6–0.8: severe risk, and 0.8–1.0: critical risk. Finally, the risk map was validated against 2022 flood imagery, confirming alignment with affected areas.

3. Results

From Figure 3, it can be seen that, out of the 36 states in Nigeria, 7 states—including Yobe, Jigawa, Taraba, and Bauchi, located in the northeastern part of Nigeria; Sokoto and Niger, located in the northwestern part of Nigeria; and Kogi, situated in the middle belt—were the most flooded, with an estimated number of more than 32,000 ha affected. Thus, compared to the southern parts, the flooded areas were greater in the northern and central parts of Nigeria, possibly because of their proximity and connection to the flooded rivers in Nigeria and their tributaries.
Figure 4 shows that the number of people affected by the flood per state does not necessarily coincide with the extent of the flooded areas depicted in Figure 3. This is because, as shown in Figure 5, most flooded areas in northern Nigeria do not have a dense population per square meter. Lagos, followed by Anambra State, has the highest population density per square meter (Figure 5). Therefore, from Figure 4, the southern states, specifically Anambra State, recorded the highest estimated number of affected people (about 430,000 people), followed by Kogi (about 230,000 people) and Delta (about 170,000 people).
Further, it is challenging to accurately separate and quantify the contribution of the flood water resulting from the opening of the Lagdo Dam and the flood water resulting from heavy rainfall. However, to proxy the contribution of rainfall and excess water from the Lagdo Dam, we rely on the results from Figure 6 and Figure 7. We recall that during the 2022 flood event in Nigeria, the Lagdo Dam was opened on 13 September [10]. Therefore, we investigated monthly rainfall and soil moisture anomalies in 2022 to assess the role of above-average rainfall before the Lagdo Dam opening (Figure 7). In Figure 6, we further analyze the flood extent in Nigeria before and after the opening of the Lagdo Dam.
Figure 6 shows that before the opening of the Lagdo Dam (i.e., between July and August), about 50,000 ha of land were flooded. The flood water in Nigeria during July, August, and early September (i.e., before the 13 September) can be principally attributed to heavy rainfall, given that from January 2022, parts of Nigeria, especially the northern parts, experienced localized above-average rainfall, with a significant increase in soil moisture, during August (Figure 7). However, following the opening of the Lagdo Dam, Figure 6 shows that by September, there was more than a 300% increase in the flood extent, relative to the 50,000 ha of land that was affected before the opening of the dam in July. Moreover, rainfall anomalies in Nigeria’s southern and southeastern parts were consistently negative from July to September (Figure 7), though these areas had the highest number of affected people (Figure 4). Hence, it is suggested that the consistent above-average rainfall in large parts of Cameroon from July to September 2022 (Figure 7), warranting the release of excess water from the Lagdo Dam, might be implicated in exacerbating the flood water in Nigeria, especially in the southern and southeastern regions.
Next, we examined historical trends in heavy rainfall from 1979 to 2022 during the peak of the rainy season in Nigeria (i.e., between July and September). Figure 8 shows that in the northern parts of Nigeria, specifically around the northeastern parts, the number of days per year with daily rainfall amounts greater than 20 mm has a positive trend. A positive trend can also be seen in Figure 8 in some southwestern parts of Nigeria. Regions with a statistically significant increase in heavy rainfall will likely be more vulnerable to flooding events. Also, the number of days per year with daily rainfall amounts greater than 20 mm shows a positive trend in the southwestern parts of Cameroon (Figure 8). Therefore, future overflowing of the Lagdo Dam might be expected.
Given that from Figure 8, the conditions leading to the 2022 flood events (i.e., heavy rainfall in parts of Nigeria and Cameroon, leading to the release of excess water from the Lagdo Dam) are highly likely to recur, Figure 9a shows the risk areas in Nigeria during the 2022 flood event, based on Equation (1). The high-risk areas are generally closer to riverine areas. Based on Figure 9b, for the normalized risk score (0–1), about 105,000 people are at critical risk (i.e., with risk score between 0.8 and 1.0) of riverine flooding in Nigeria based on the 2022 flooding conditions and pre-flood population data; 31,000 t are at severe risk, 47,000 at high risk, 57,000 at moderate risk, and over 1 million at low risk. Further, from Figure 9c, states with high population density per square meter have the highest number of people exposed to critical risk. In contrast, River state have the highest number of people exposed to low risk.

4. Discussion

In recent decades, Africa has experienced a marked increase in heavy rainfall events, resulting in severe flooding across multiple regions [34,35,36,37]. In northern Nigeria and neighboring countries such as Cameroon, positive trends in rainfall have been observed, consistent with our findings (Figure 8), which heighten the risk of floods [38,39,40]. Direct validation of our flood extent against external data, such as UNICEF’s 2022 Report, was not possible, due to differences in data sources and methodologies. Our analysis relied on high-resolution Sentinel-1 radar imagery, while UNICEF’s assessment mostly integrated ground observations, or models, with varying temporal and spatial resolutions and a focus on humanitarian impacts, rather than precise mapping. Consequently, no direct flood extent comparison could be made. However, our results generally align with UNICEF’s report in identifying key affected regions, supporting the broader impact assessment [10]. Therefore, despite challenges in obtaining accurate long-term observational data, our study demonstrates that remote sensing and climate products, such as the Sentinel-1 Synthetic Aperture Radar, can be utilized to characterize flood events in Nigeria. We used these datasets to assess the 2022 flood event, focusing on the flood extent, the number of people affected per state, the principal drivers of the flood severity, and identifying areas at risk of riverine flooding.
Our analysis reveals that northern and central Nigeria experienced greater flood extents than southern regions, corroborating the positive trend in heavy rainfall in the north [40] (Figure 8). However, southern states, particularly Anambra State, reported the highest number of affected individuals, due to a high population density in flood-prone areas. Consistent with previous studies [41,42,43], we identify population density as a critical factor influencing the human toll of floods. With Nigeria’s population projected to grow, exerting increased pressure on land resources and elevating population density in vulnerable areas [44], the risk of exposure to flooding is likely to intensify. To mitigate this, we advocate for effective urban and regional planning to restrict the development of settlements in flood risk zones, as presented in Figure 9, ensuring sustainable land use even as population pressures mount.
The 2022 rainy season in Nigeria was marked by above-average rainfall in northern and western regions, compounded by heavy rain in parts of Cameroon (Figure 7) and the subsequent release of water from the Lagdo Dam. Our findings indicate that Nigeria’s approximately 50,000 ha of land was inundated before the period of the dam’s opening. Following the release, flood-affected areas surged by over 300%, suggesting the dam’s role in exacerbating the flood’s severity. Therefore, while heavy rainfall in Nigeria and neighboring countries contributed to the event by increasing the antecedent soil moisture (Figure 7), the excess water from the Lagdo Dam could have amplified its impact. To address this, we propose urgent investments in drainage infrastructure, including constructing a counter-dam in Nigeria to store excess water released from the Lagdo Dam, thereby reducing downstream flooding risks.
Under current climate conditions, positive trends in heavy rainfall persist in northern Nigeria and western Cameroon. These trends suggest that above-average rain will likely continue to drive flooding in Nigerian rivers and exacerbate overflow risks at the Lagdo Dam. We recommend developing robust early-warning systems (EWSs) and policy-relevant studies to improve rainfall predictions and projections under future climate change scenarios to enhance resilience. Such measures are critical for preventing flood risks and informing adaptive strategies.

4.1. Proposed Early-Warning Systems for Nigeria: Lessons from Global Examples

To strengthen flood preparedness in Nigeria, we propose integrating an advanced EWS tailored to the country’s unique hydrological and socio-economic context. Drawing on successful EWS implementations in other countries, we outline specific systems that could be adapted for Nigeria, detailing their potential benefits and applicability. Nigeria’s existing forecasting capabilities, led by the Nigerian Meteorological Agency and the Nigerian Hydrological Services Agency, provide a foundation, but coordination gaps hinder effective response [45]. The following global examples offer actionable insights for enhancing Nigeria’s EWS.

4.2. Kenya’s Nzoia River Basin Flood Early-Warning System (Nzoia FldEWS)

Established in 2008 with World Bank support, Kenya’s Nzoia FldEWS integrates real-time data collection, hydrological modeling, and automated dissemination of flood warnings. The system employs automatic weather stations and telemetric river gauging stations to gather real-time data, which feed into the Water Information Management Ecosystem Services platform. Forecasts are disseminated to stakeholders, including government agencies and at-risk communities, through various communication channels [46].

4.3. Google’s AI-Powered Flood Forecasting Initiative

Google’s Flood Forecasting Initiative employs artificial intelligence to predict riverine flooding up to seven days in advance. By integrating data from satellite imagery, weather forecasts, and river gauge measurements, the system provides real-time flood forecasts that are accessible through the Google Flood Hub platform. As of March 2024, the initiative covers over 80 countries, offering timely predictions to help governments, aid organizations, and individuals prepare for potential flooding [47,48].

4.4. NASA’s Global Flood Monitoring System

NASA’s Global Flood Monitoring System offers near-real-time flood detection and forecasting by integrating satellite-based precipitation data with hydrological models. The system provides global coverage, with updates every three hours, enabling the timely identification of flood events and supporting disaster response efforts. This framework particularly benefits regions lacking dense ground-based observation networks [49].

4.5. Copernicus Global Flood Awareness System (GloFAS)

Developed by the European Centre for Medium-Range Weather Forecasts (ECMWF) and the Joint Research Centre (JRC), GloFAS provides global flood forecasts by combining numerical weather predictions with hydrological modeling. The system supports preparatory measures and emergency response to predicted and ongoing major flood events at a global scale. GloFAS data are publicly available, offering valuable insights for flood risk management [50].

4.6. Application to Nigeria

Adapting these global EWS frameworks to Nigeria’s context involves several strategic actions. These include developing real-time monitoring networks for automatic weather stations and river gauging stations; integrating satellite-based observations, especially in data-scarce areas; community engagement and capacity building in implementing the EWS; and collaborating with international partners to provide technical expertise and access to advanced forecasting tools.
By implementing these strategies, Nigeria can develop a robust, integrated flood EWS that enhances disaster preparedness and mitigates the impacts of flooding events. To demonstrate integrating some these global EWS frameworks to Nigerian localities, the authors of this study have developed a user-friendly web application, NaijaFloodWatch (publicly available at https://naijafloodwatch.streamlit.app/ [51] accessed on 2 May 2025) with Python Streamlit v3.9 [52], which obtains the GloFAS discharge forecast data and tailors them for Nigerian local governments over the next 7 days, and compares the discharge forecast with the discharge conditions during the 2022 flood events, in order to provide a user-friendly way of informing locals about flood risk warnings.

5. Conclusions

In this study, we applied change detection techniques using Sentinel-1 Synthetic Aperture Radar remote sensing products, alongside rainfall and soil moisture climate data, to investigate the 2022 flood event in Nigeria. By analyzing the flood extent, the number of people impacted, the contributions of the Lagdo Dam and heavy rainfall to the flood event, heavy rainfall trends, and areas in Nigeria at risk of riverine flooding, we reached the following major conclusions:
1.
The northern and middle-belt regions of Nigeria, including Yobe, Jigawa, Taraba, Bauchi, Sokoto, Niger, and Kogi, were the most impacted in terms of flood extent, with an estimate of over 32,000 ha of land inundated.
2.
Regarding the number of people impacted, southern states, particularly Anambra, ranked highest, with more than 400,000 individuals affected. This high impact is attributed to elevated population density in flood-prone areas, exacerbating vulnerability to flood events.
3.
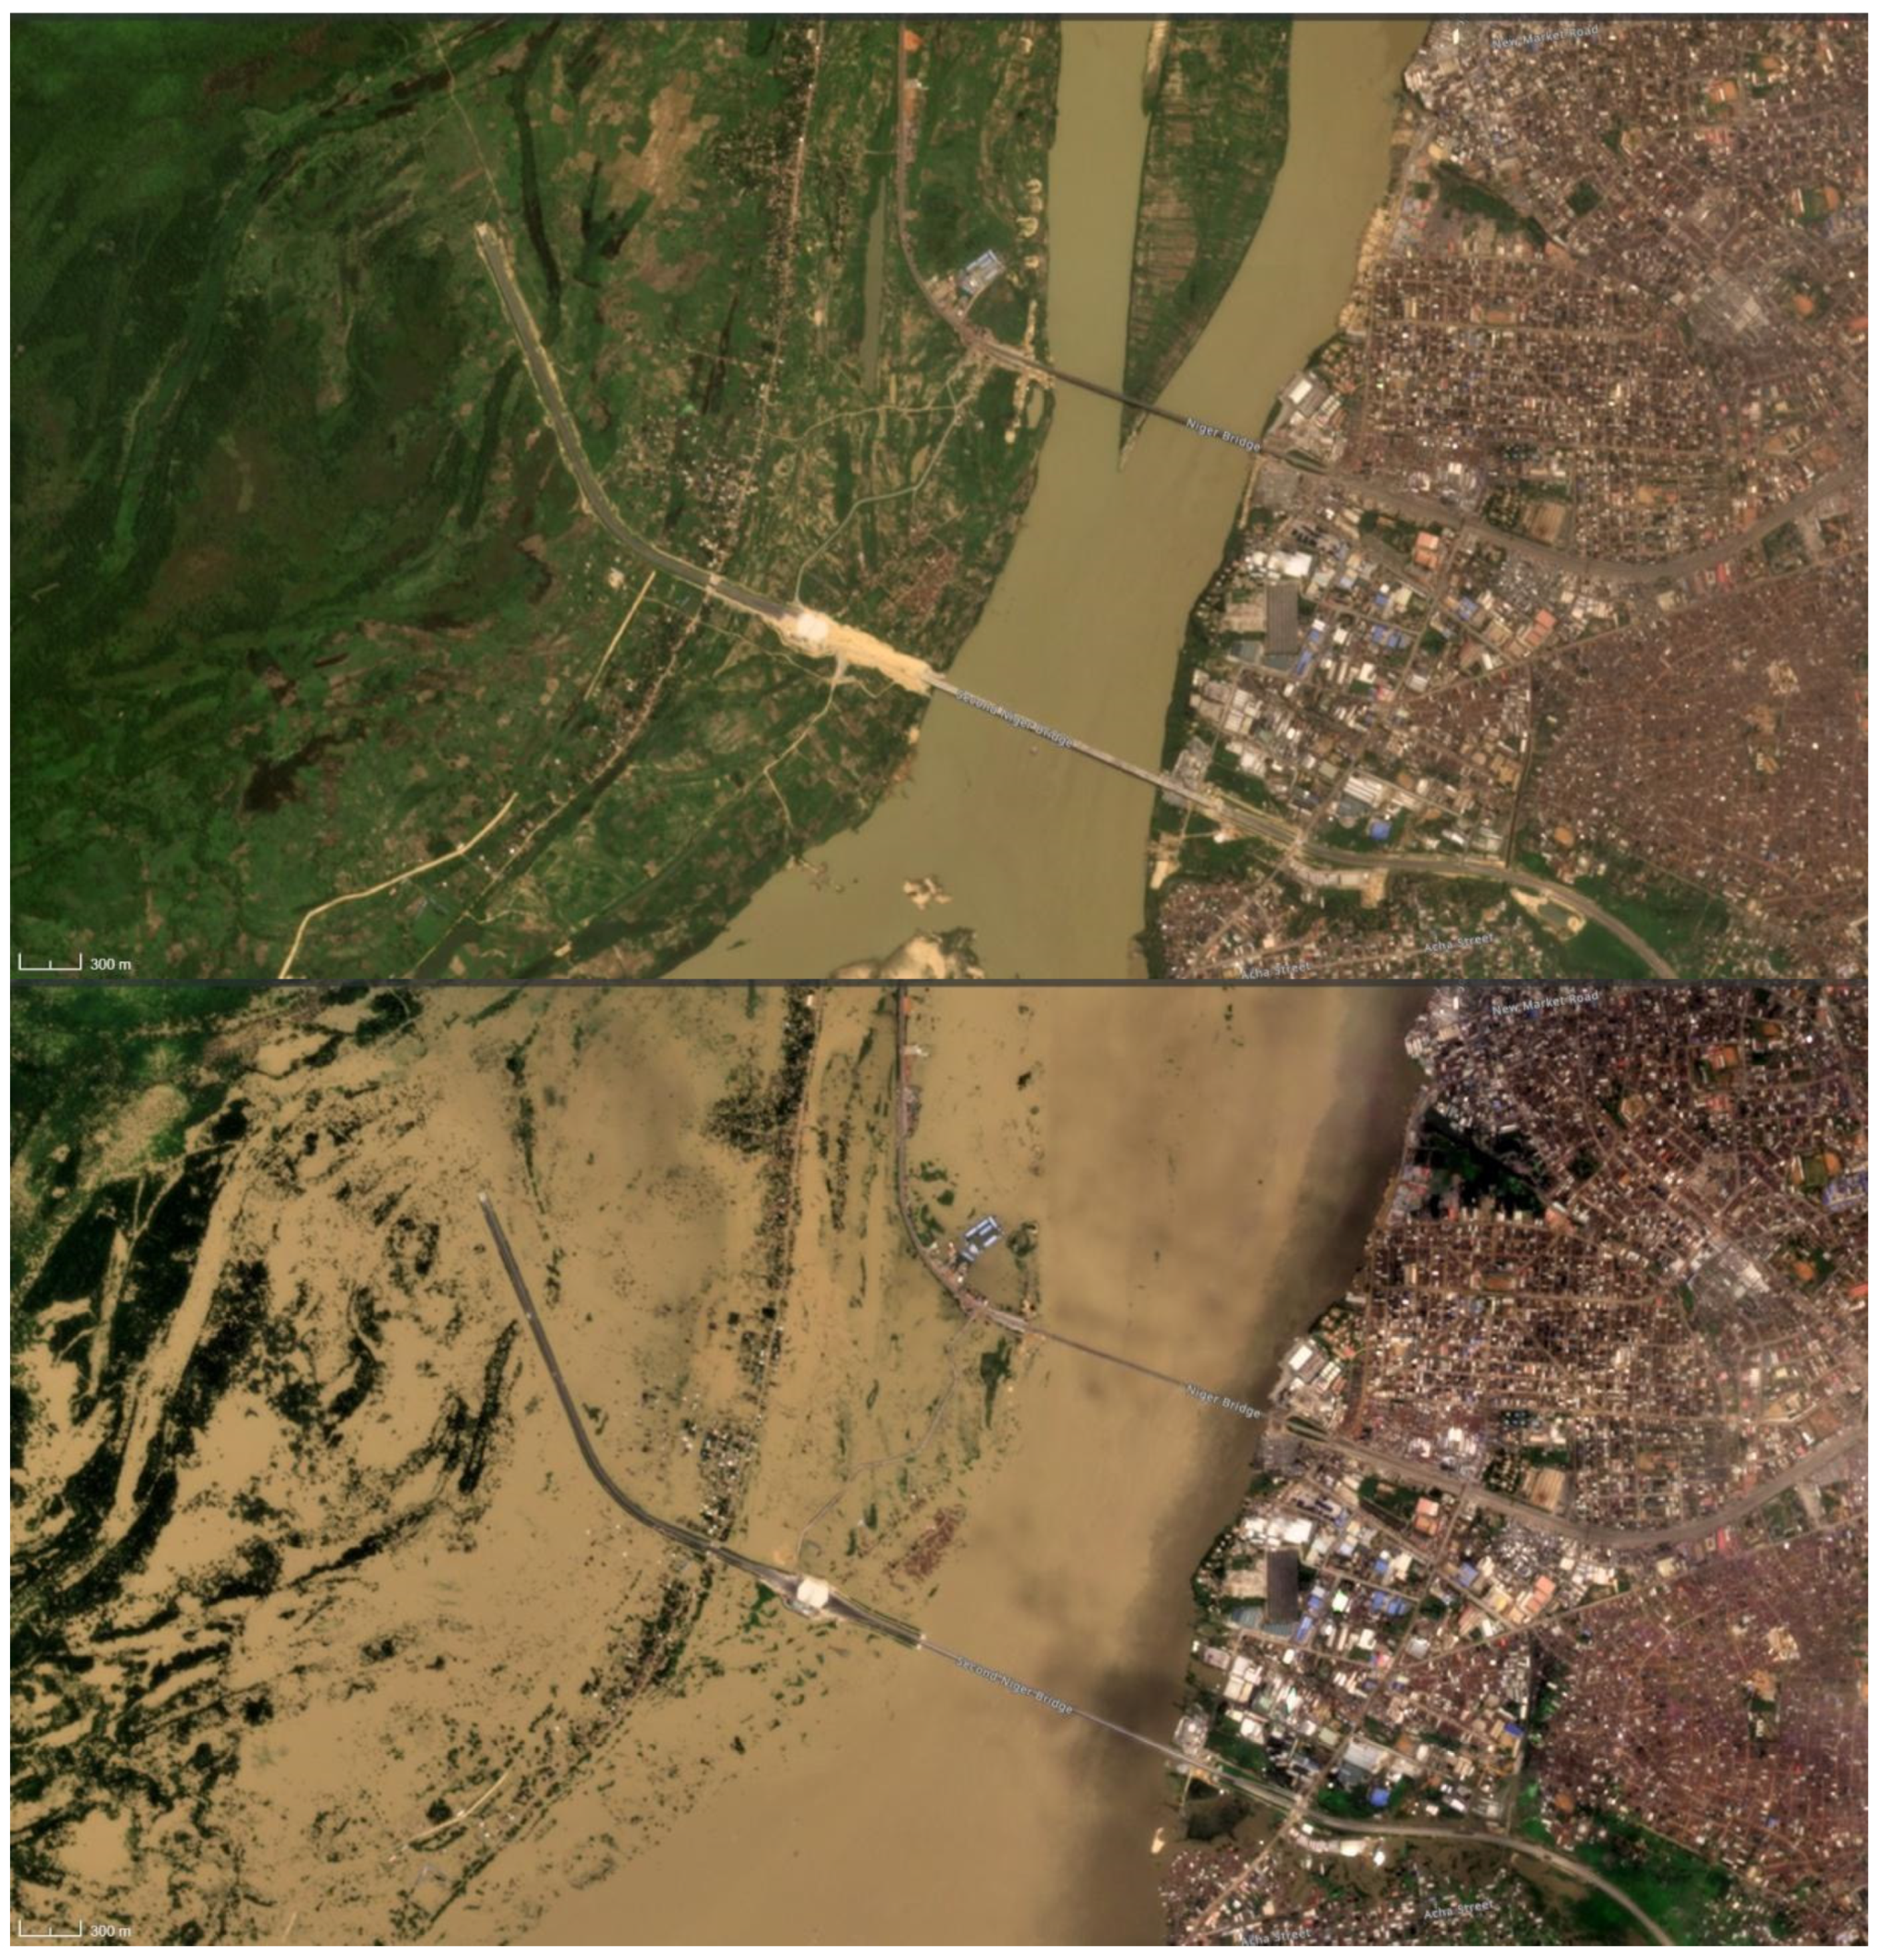
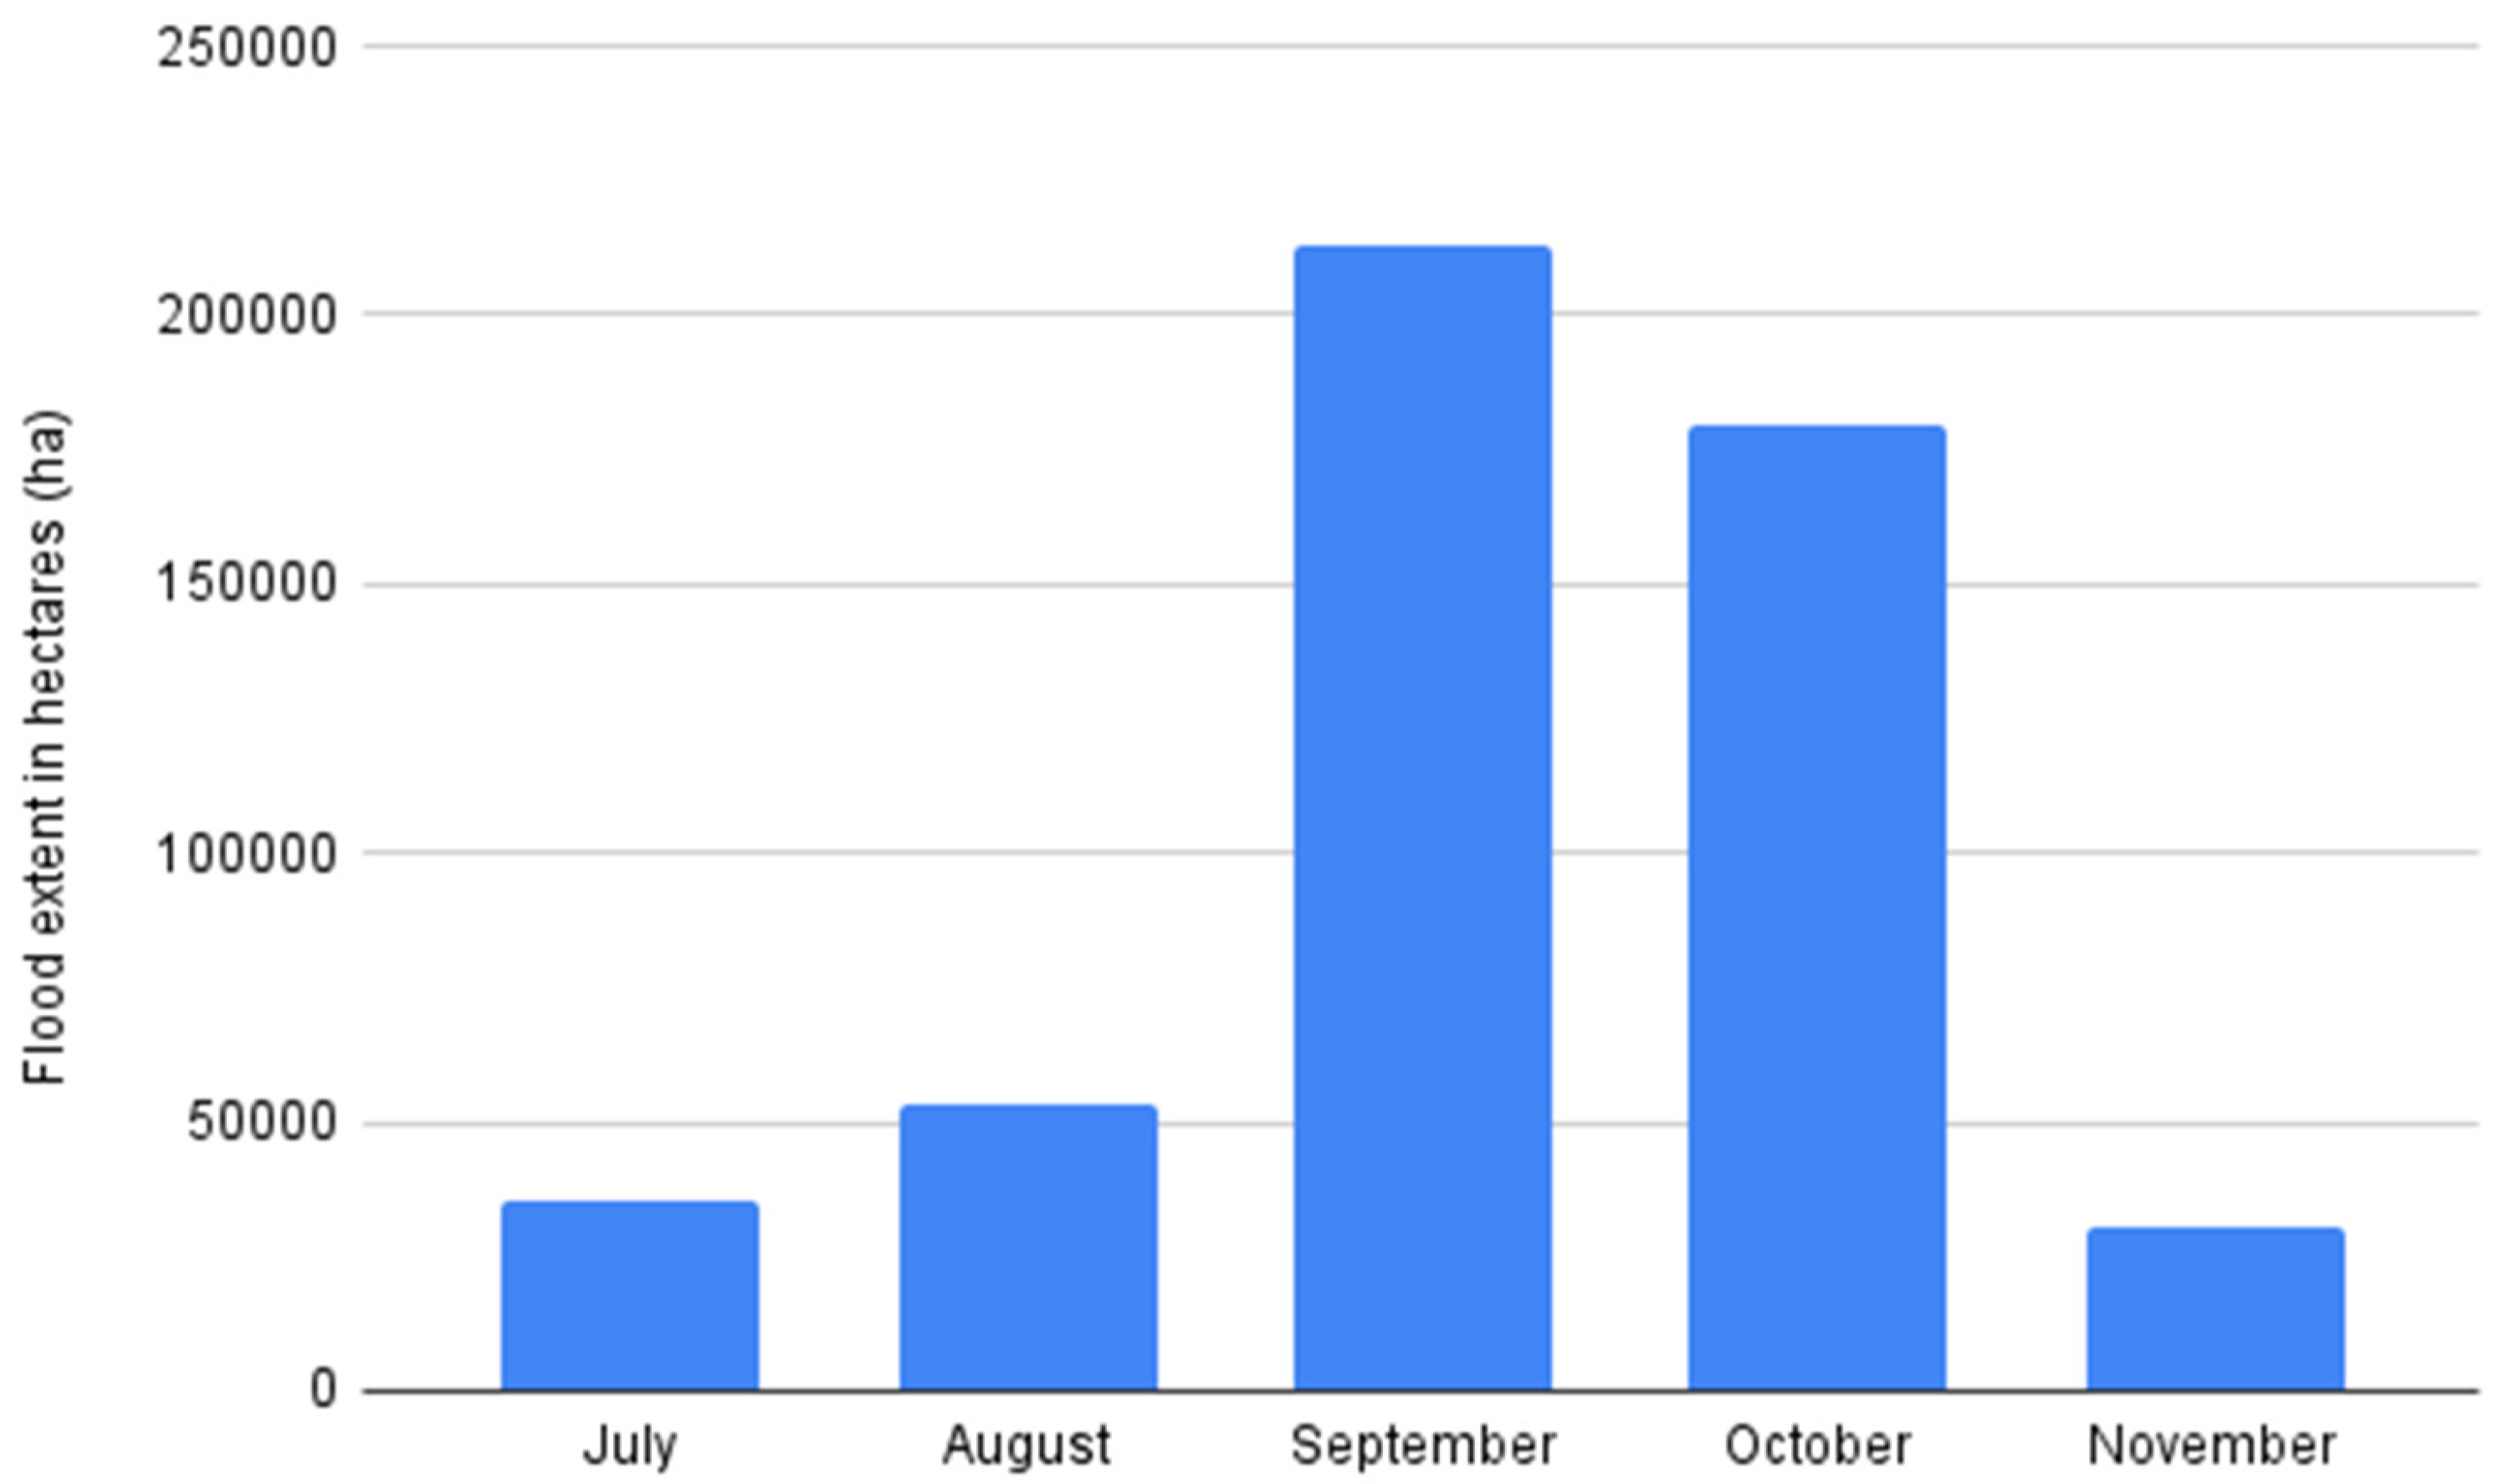
Before the opening of the Lagdo Dam on 13 September 2022, northern and western parts of Nigeria experienced localized above-average rainfall, leading to soil saturation and flooding of approximately 50,000 ha of land. Following the dam’s opening, the flood extent increased by approximately 300%, reaching over 200,000 ha. However, due to the absence of hydrological modeling, our inference about the dam’s impact should be considered indicative rather than definitive.
4.
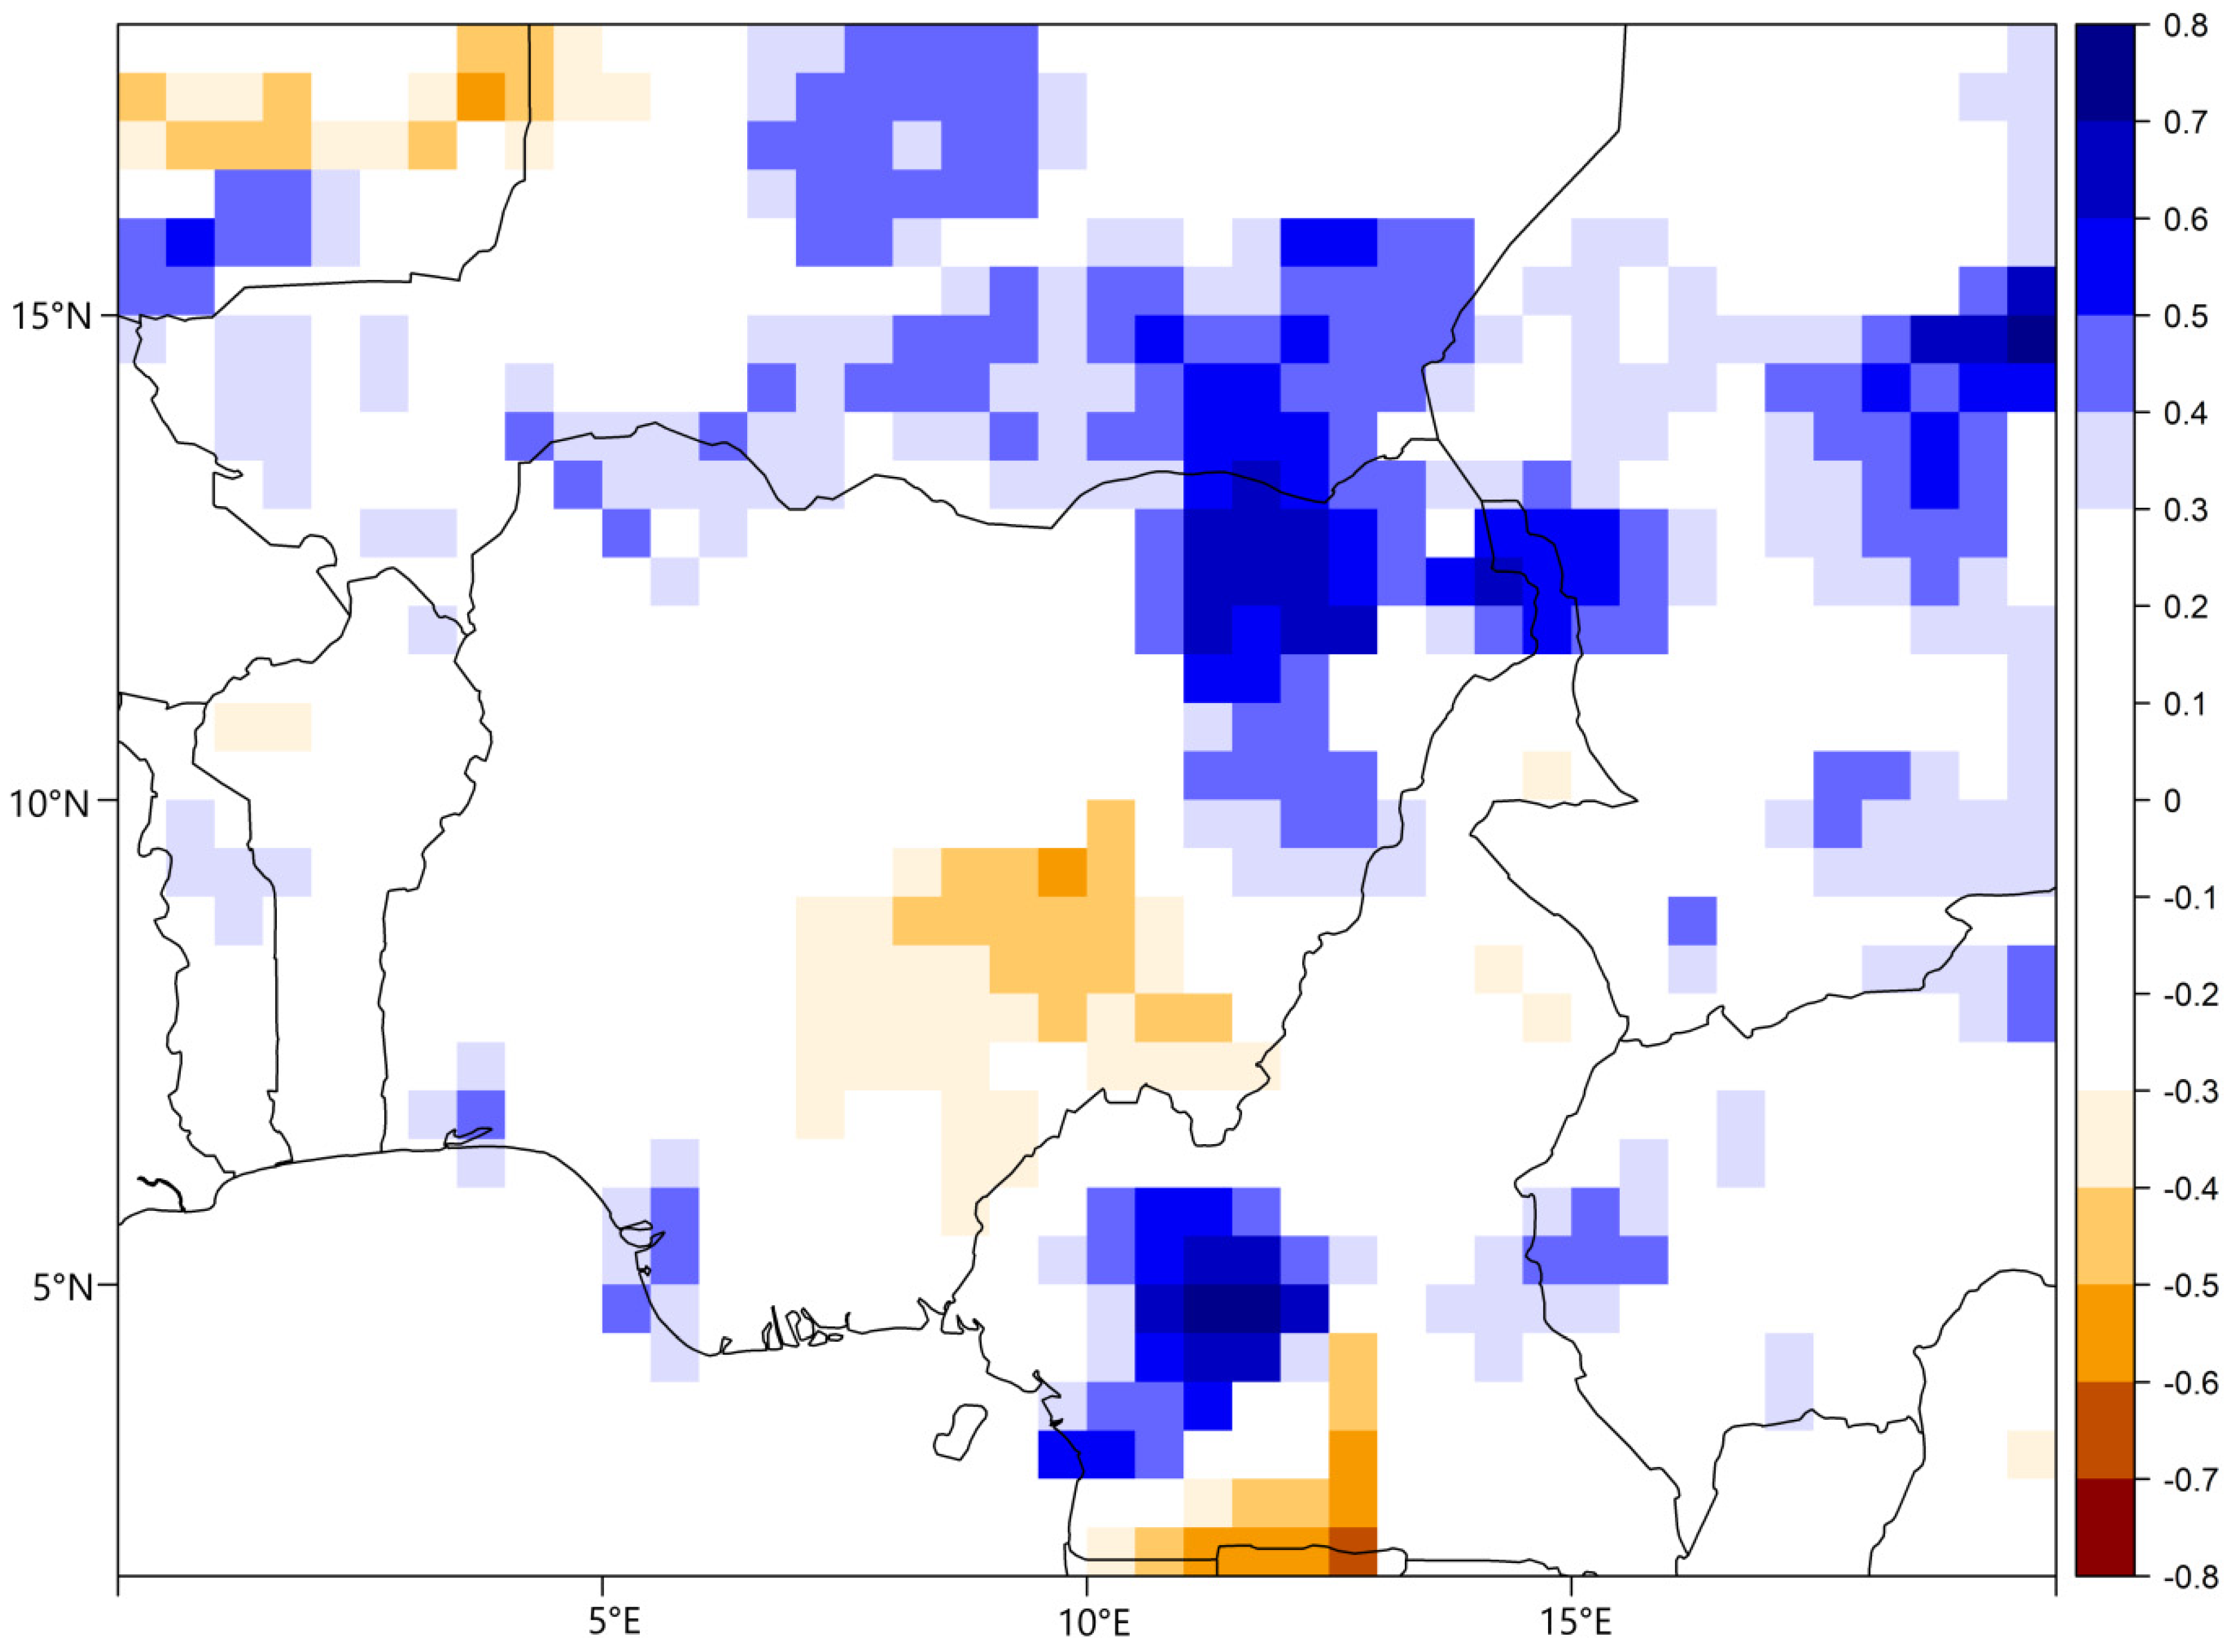
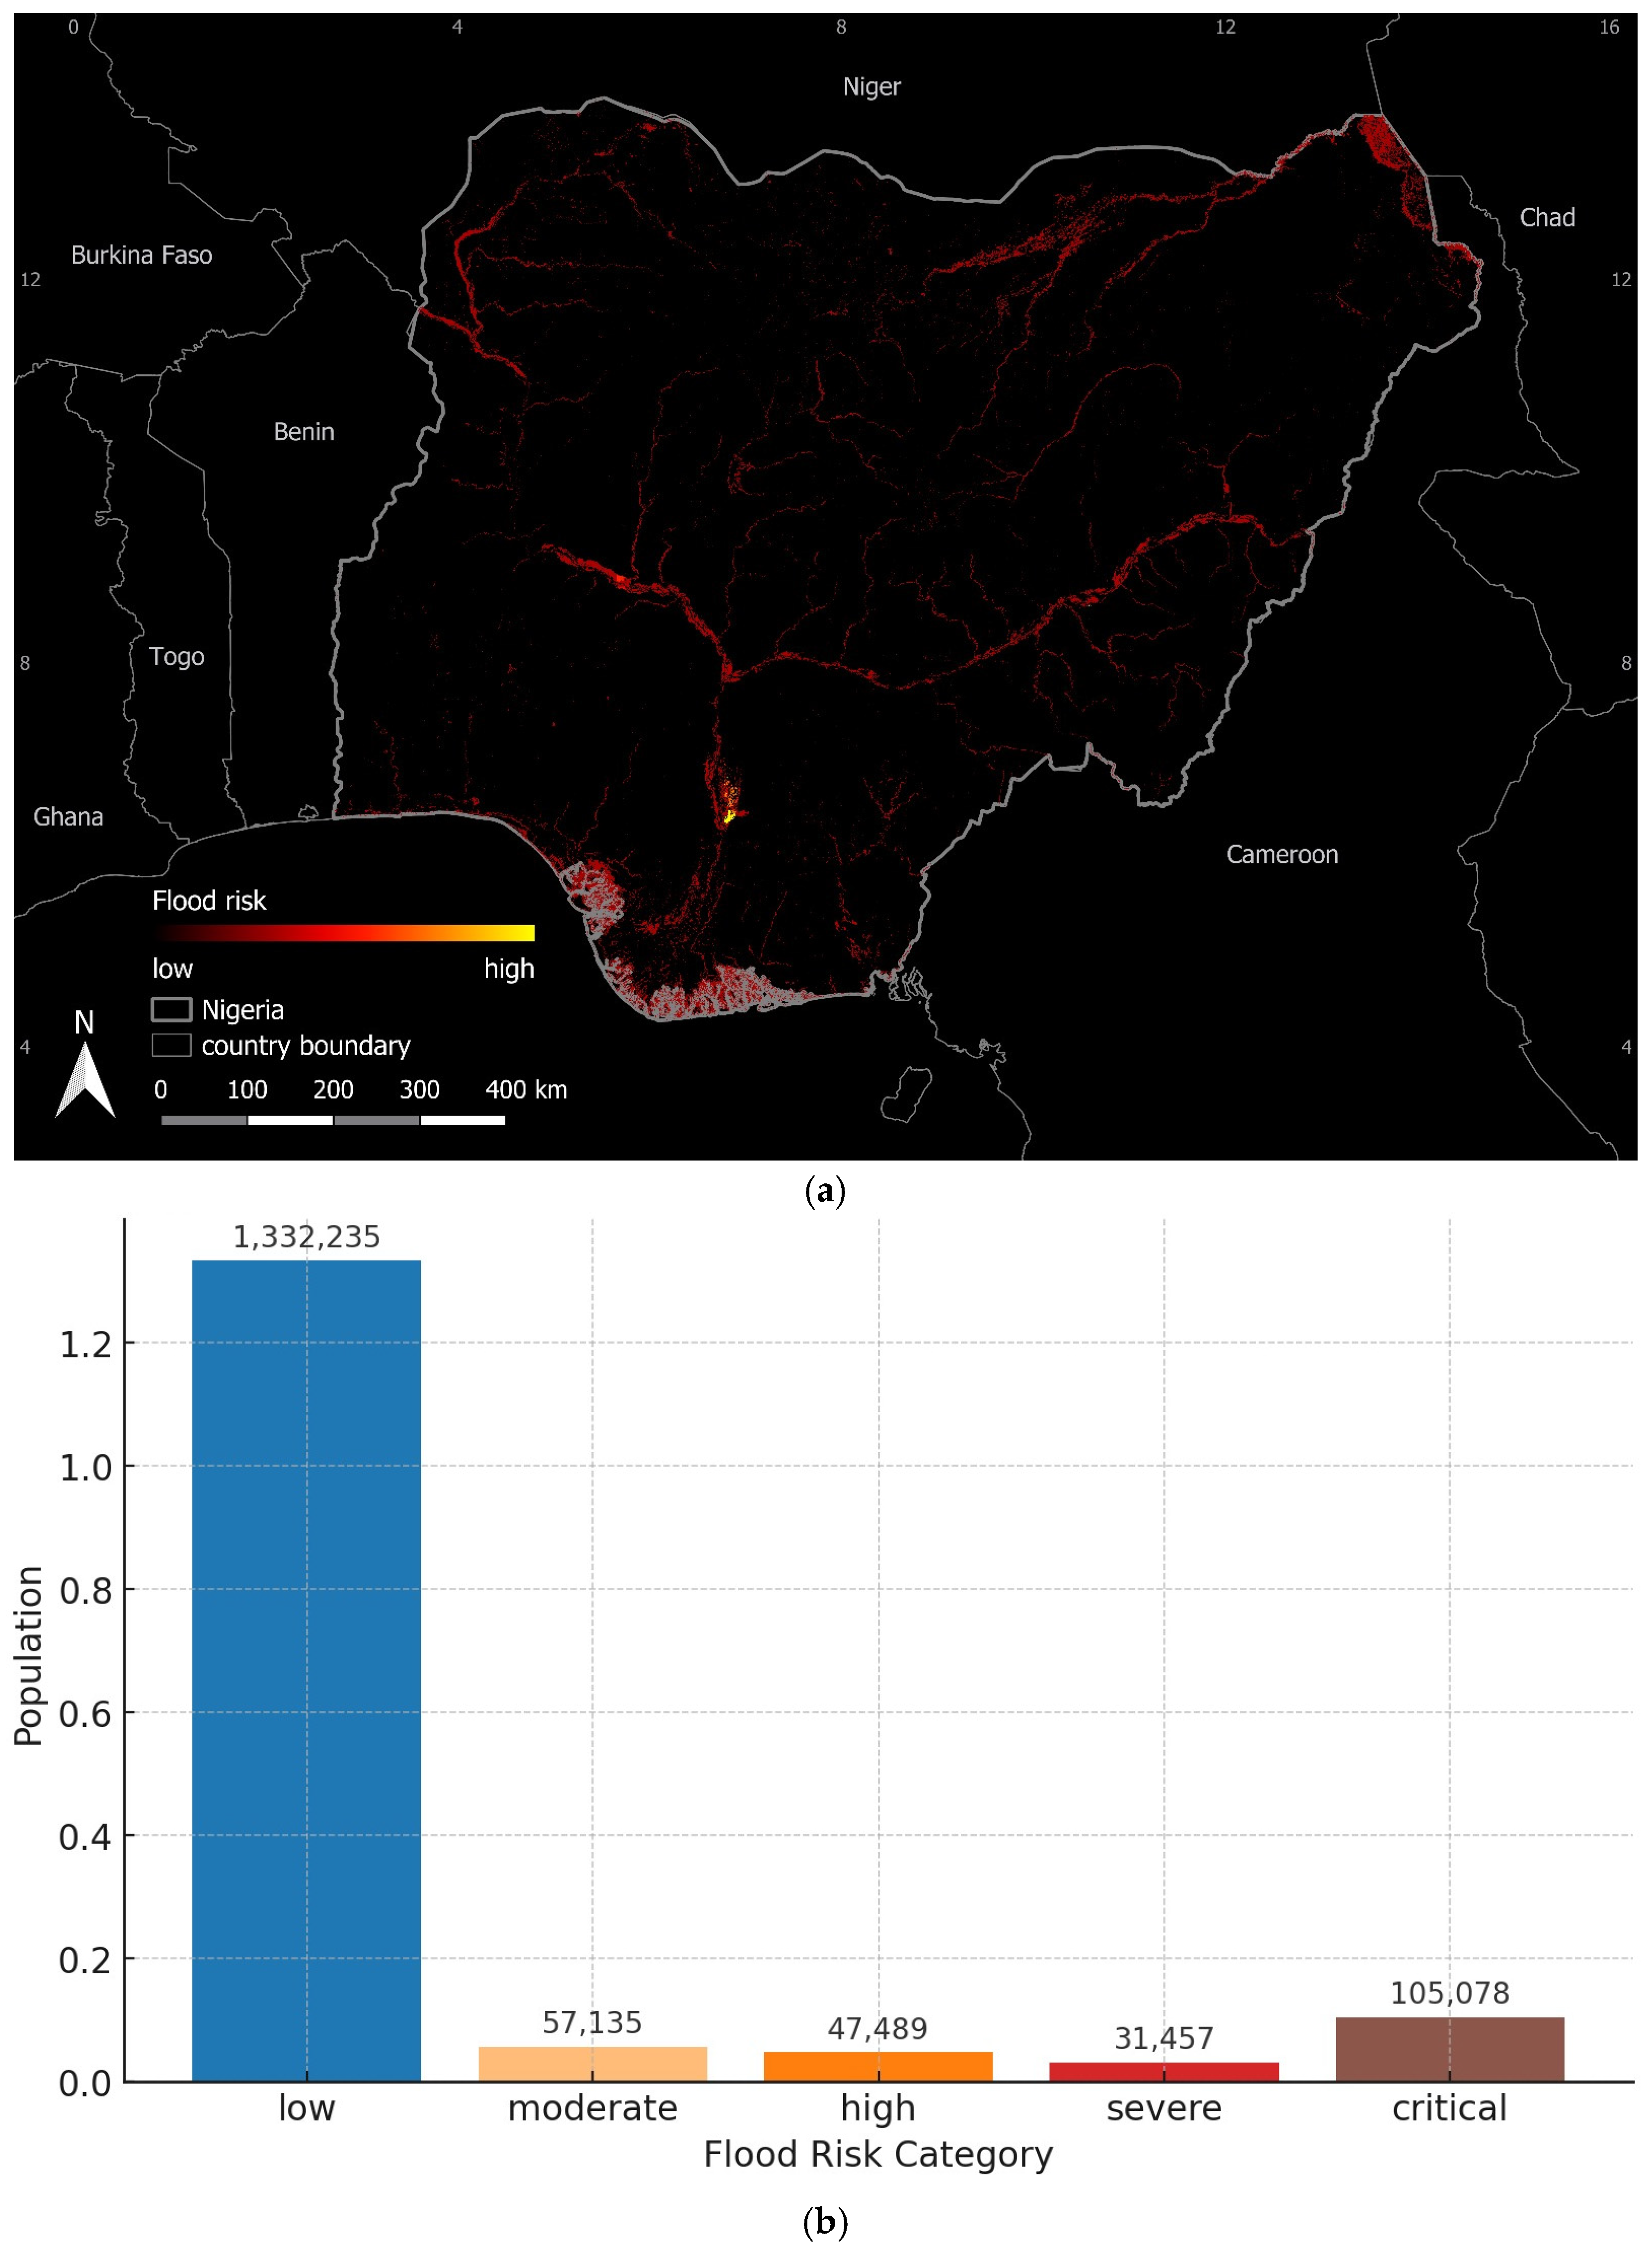
Trends in heavy rainfall were positive in northern Nigeria and parts of Cameroon. The risk assessment of riverine flooding in Nigeria based on the 2022 conditions and pre-flood population data available as of the time of this study indicated that about 105,000 people were at critical risk, particularly in southern states such as Anambra. However, considering the dynamic nature of Nigeria’s population, using pre-flood datasets may slightly misrepresent the impact in highly dynamic areas.
To address these challenges, we recommend developing robust early-warning systems, improving urban planning to reduce settlement in flood risk zones, and investing in infrastructure, such as a counter-dam to manage excess water from the Lagdo Dam. These measures, informed by global EWS examples, can enhance Nigeria’s resilience to future flood events under changing climate conditions.

Author Contributions

Conceptualization, I.-O.A. and C.C.I.; methodology, I.-O.A. and C.C.I.; software, I.-O.A.; validation, I.-O.A. and C.C.I.; formal analysis I.-O.A. and C.C.I.; investigation I.-O.A. and C.C.I.; resources I.-O.A. and C.C.I.; data curation I.-O.A. and C.C.I.; writing—original draft preparation, I.-O.A. and C.C.I.; writing—review and editing, I.-O.A. and C.C.I.; visualization, I.-O.A. and C.C.I.; project administration, I.-O.A. and C.C.I.; funding acquisition, C.C.I. All authors have read and agreed to the published version of the manuscript.

Funding

This study did not receive any funding.

Data Availability Statement

The CPC datasets were obtained from https://psl.noaa.gov/data/gridded/ (accessed on 22 July 2024). The flood datasets will be made available upon request.

Acknowledgments

We thank the Climate Prediction Center for making the CPC gridded precipitation data publicly available.

Conflicts of Interest

Author Itohan-Osa Abu is the founder of the company Merie Analytics. The remaining author declares that the research was conducted in the absence of any commercial or financial relationships that could be construed as a potential conflict of interest.

References

  1. Rentschler, J.E.; Salahab, M. 1.47 billion people face flood risk worldwide: For over a third, it could be devastating. World Bank blogs, 12 November 2020. [Google Scholar]
  2. Nashwan, A.J.; Ahmed, S.H.; Shaikh, T.G.; Waseem, S. Impact of natural disasters on health disparities in low-to middle-income countries. Discov. Health Syst. 2023, 2, 23. [Google Scholar] [CrossRef]
  3. Salam, A.; Wireko, A.A.; Jiffry, R.; Ng, J.C.; Patel, H.; Zahid, M.J.; Mehta, A.; Huang, H.; Abdul-Rahman, T.; Isik, A. The impact of natural disasters on healthcare and surgical services in low-and middle-income countries. Ann. Med. Surg. 2023, 85, 3774–3777. [Google Scholar] [CrossRef] [PubMed]
  4. Lemos, M.C.; Agrawal, A.; Eakin, H.; Nelson, D.R.; Engle, N.L.; Johns, O. Building adaptive capacity to climate change in less developed countries. In Climate Science for Serving Society: Research, Modeling and Prediction Priorities; Springer: Dordrecht, The Netherlands, 2013; pp. 437–457. [Google Scholar]
  5. Brooks, N.; Adger, W.N.; Kelly, P.M. The determinants of vulnerability and adaptive capacity at the national level and the implications for adaptation. Glob. Environ. Change 2005, 15, 151–163. [Google Scholar] [CrossRef]
  6. Yang, L.; Scheffran, J.; Qin, H.; You, Q. Climate-related flood risks and urban responses in the Pearl River Delta, China. Reg. Environ. Change 2015, 15, 379–391. [Google Scholar] [CrossRef]
  7. Jiang, R.; Lu, H.; Yang, K.; Chen, D.; Zhou, J.; Yamazaki, D.; Pan, M.; Li, W.; Xu, N.; Yang, Y.; et al. Substantial increase in future fluvial flood risk projected in China’s major urban agglomerations. Commun. Earth Environ. 2023, 4, 389. [Google Scholar] [CrossRef]
  8. Lumbroso, D. Flood risk management in Africa. J. Flood Risk Manag. 2020, 13, e12612. [Google Scholar] [CrossRef]
  9. Salami, R.; Giggins, H.; von Meding, J. Vulnerability of human settlements to flood risk in the core area of Ibadan metropolis, Nigeria. Jàmbá J. Disaster Risk Stud. 2017, 9, 1–14. [Google Scholar] [CrossRef]
  10. Nigeria Flash Update (Flood), November 2022. Available online: https://www.unicef.org/documents/nigeria-flash-update-flood-november-2022 (accessed on 19 December 2022).
  11. 80% of Floods Caused by Rainfall NOT Lagdo Dam, Says Minister. TheCable. 20 October 2022. Available online: https://www.thecable.ng/80-of-floods-caused-by-rainfall-not-lagdo-dam-says-minister (accessed on 19 December 2022).
  12. Oyedepo, S.O. Energy and sustainable development in Nigeria: The way forward. Energy Sustain. Soc. 2012, 2, 1–17. [Google Scholar] [CrossRef]
  13. Olaniyan, E.; Adefisan, E.A.; Balogun, A.A.; Lawal, K.A. The influence of global climate drivers on monsoon onset variability in Nigeria using S2S models. Model. Earth Syst. Environ. 2019, 5, 1405–1428. [Google Scholar] [CrossRef]
  14. Nkeki, F.N.; Henah, P.J.; Ojeh, V.N. Geospatial techniques for the assessment and analysis of flood risk along the Niger-Benue Basin in Nigeria. J. Geogr. Inf. Syst. 2013, 5, 123–135. [Google Scholar] [CrossRef]
  15. AUdo, E.; Ojinnaka, O.C.; Baywood, C.N.; Gift, U.A. Flood hazard analysis and damage assessment of 2012 flood in Anambra State using GIS and remote sensing approach. Am. J. Geogr. Inf. Syst. 2015, 4, 38–51. [Google Scholar]
  16. Flooding: What you must know about Lagdo Dam. Punch Newspapers. 10 October 2022. Available online: https://punchng.com/flooding-what-you-must-know-about-lagdo-dam/ (accessed on 19 December 2022).
  17. Ibebuchi, C.C. Revisiting the 1992 severe drought episode in South Africa: The role of El Niño in the anomalies of atmospheric circulation types in Africa south of the equator. Theor. Appl. Climatol. 2021, 146, 723–740. [Google Scholar] [CrossRef]
  18. Mueller, W.A.; Roeckner, E. ENSO impact on midlatitude circulation patterns in future climate change projections. Geophys. Res. Lett. 2006, 33, L05711. [Google Scholar] [CrossRef]
  19. Shaker, A.; Yan, W.Y.; Wong, M.S.; El-Ashmawy, N.; Alhaddad, B.I. Flood hazard assessment using panchromatic satellite imagery. Int. Arch. Photogramm. Remote Sens. Spat. Inf. Sci.-ISPRS Arch. 2008, 37, 881–886. [Google Scholar]
  20. DeVries, B.; Huang, C.; Armston, J.; Huang, W.; Jones, J.W.; Lang, M.W. Rapid and robust monitoring of flood events using Sentinel-1 and Landsat data on the Google Earth Engine. Remote Sens. Environ. 2020, 240, 111664. [Google Scholar] [CrossRef]
  21. Pekel, J.-F.; Cottam, A.; Gorelick, N.; Belward, A.S. High-resolution mapping of global surface water and its long-term changes. Nature 2016, 540, 7633. [Google Scholar] [CrossRef]
  22. Farr, T.G.; Rosen, P.A.; Caro, E.; Crippen, R.; Duren, R.; Hensley, S.; Kobrick, M.; Paller, M.; Rodriguez, E.; Roth, L.; et al. The shuttle radar topography mission. Rev. Geophys. 2007, 45, RG2004. [Google Scholar] [CrossRef]
  23. Farr, T.G.; Kobrick, M. Shuttle Radar Topography Mission produces a wealth of data. Eos Trans. Am. Geophys. Union 2000, 81, 583–585. [Google Scholar] [CrossRef]
  24. Tatem, A.J. WorldPop, open data for spatial demography. Sci. Data 2017, 4, 170004. [Google Scholar] [CrossRef]
  25. Zanaga, D.; Van De Kerchove, R.; De Keersmaecker, W.; Souverijns, N.; Brockmann, C.; Quast, R.; Wevers, J.; Grosu, A.; Paccini, A.; Vergnaud, S.; et al. Zenodo—ESA WorldCover 10 m 2020 v100, Version v100; ESA: Paris, France, 2021. [Google Scholar]
  26. Funk, C.; Peterson, P.; Landsfeld, M.; Pedreros, D.; Verdin, J.; Shukla, S.; Husak, G.; Rowland, J.; Harrison, L.; Hoell, A.; et al. The climate hazards infrared precipitation with stations—A new environmental record for monitoring extremes. Sci. Data 2015, 2, 150066. [Google Scholar] [CrossRef]
  27. Hengl, T.; Mendes de Jesus, J.; Heuvelink, G.B.; Ruiperez Gonzalez, M.; Kilibarda, M.; Blagotić, A.; Wei, S.; Wright, M.N.; Geng, X.; Bauer-Marschallinger, B.; et al. SoilGrids250m: Global gridded soil information based on machine learning. PLoS ONE 2017, 12, e0169748. [Google Scholar] [CrossRef] [PubMed]
  28. Reichle, R.H.; De Lannoy, G.J.M.; Koster, R.D.; Crow, W.T.; Kimball, J.S.; Liu, Q. SMAP L4 Global 3-hourly 9 km EASE-Grid Surface and Root Zone Soil Moisture Geophysical Data, Version 4; NASA National Snow and Ice Data Center Distributed Active Archive Center: Boulder, CO, USA, 2018. [Google Scholar] [CrossRef]
  29. Franceschini, G.; Khan, A.; Moretti, L.; Nyabuti, K.; Asif, M.; Bezuidenhoudt, E.; Morteo, K. The Global Administrative Unit Layers (GAUL) 2024: Technical Guidelines; FAO: Rome, Italy, 2025. [Google Scholar] [CrossRef]
  30. Xie, P.; Chen, M.; Yang, S.; Yatagai, A.; Hayasaka, T.; Fukushima, Y.; Liu, C. A gauge-based analysis of daily precipitation over East Asia. J. Hydrometeorol. 2007, 8, 607–626. [Google Scholar] [CrossRef]
  31. Muñoz-Sabater, J.; Dutra, E.; Agustí-Panareda, A.; Albergel, C.; Arduini, G.; Balsamo, G.; Boussetta, S.; Choulga, M.; Harrigan, S.; Hersbach, H.; et al. ERA5-Land: A state-of-the-art global reanalysis dataset for land applications. Earth Syst. Sci. Data 2021, 13, 4349–4383. [Google Scholar] [CrossRef]
  32. Asokan, A.; Anitha, J. Guided filtering based real time flood area identification on bitemporal satellite images. In Proceedings of the 2021 Fourth International Conference on Electrical, Computer and Communication Technologies (ICECCT), Coimbatore, India, 15–17 September 2021; pp. 1–4. [Google Scholar]
  33. Priyatna, M.; Wijaya, S.K.; Khomarudin, M.R.; Yulianto, F.; Nugroho, G.; Afgatiani, P.M.; Rarasati, A.; Hussein, M.A. The use of multi-sensor satellite imagery to analyze flood events and land cover changes using change detection and machine learning techniques in the Barito watershed. J. Degrad. Min. Lands Manag. 2023, 10, 4073. [Google Scholar] [CrossRef]
  34. Tarhule, A. Damaging rainfall and flooding: The other Sahel hazards. Clim. Change 2005, 72, 355–377. [Google Scholar] [CrossRef]
  35. Biasutti, M. Rainfall trends in the African Sahel: Characteristics, processes, and causes. Wiley Interdiscip. Rev. Clim. Change 2019, 10, e591. [Google Scholar] [CrossRef]
  36. Taye, M.T.; Dyer, E. Hydrologic extremes in a changing climate: A review of extremes in East Africa. Curr. Clim. Change Rep. 2024, 10, 1–11. [Google Scholar] [CrossRef]
  37. Yabi, I.; Afouda, F. Extreme rainfall years in Benin (West Africa). Quat. Int. 2012, 262, 39–43. [Google Scholar] [CrossRef]
  38. Umar, N.; Gray, A. Flooding in Nigeria: A review of its occurrence and impacts and approaches to modelling flood data. Int. J. Environ. Stud. 2023, 80, 540–561. [Google Scholar] [CrossRef]
  39. Nouhou, Y.D.; Otache, M.Y.; Illiassou, S.A.; Okunola, O.H.; Okhimamhe, A.A.; Nguyen, T.T. Flood Risk Assessment and Zoning for Niamey and Lokoja Metropolises in Niger and Nigeria. Hydrology 2025, 12, 17. [Google Scholar] [CrossRef]
  40. Ibebuchi, C.C.; Abu, I.O. Rainfall variability patterns in Nigeria during the rainy season. Sci. Rep. 2023, 13, 7888. [Google Scholar] [CrossRef] [PubMed]
  41. Sanyal, J.; Lu, X.X. GIS-based flood hazard mapping at different administrative scales: A case study in Gangetic West Bengal, India. Singap. J. Trop. Geogr. 2006, 27, 207–220. [Google Scholar] [CrossRef]
  42. Islam, M.T.; Meng, Q. Spatial analysis of socio-economic and demographic factors influencing urban flood vulnerability. J. Urban Manag. 2024, 13, 437–455. [Google Scholar] [CrossRef]
  43. Stevens, A.J.; Clarke, D.; Nicholls, R.J.; Wadey, M.P. Estimating the long-term historic evolution of exposure to flooding of coastal populations. Nat. Hazards Earth Syst. Sci. 2015, 15, 1215–1229. [Google Scholar] [CrossRef]
  44. Tartiyus, E.H.; Dauda, T.M.; Peter, A. Impact of population growth on economic growth in Nigeria. IOSR J. Humanit. Soc. Sci. (IOSRJHSS) 2015, 20, 115–123. [Google Scholar]
  45. Oke, A.; Amarnath, G.; Okem, A.; Dembele, M. Strengthening Anticipatory Action Through Flood Forecasting and Early Warning Systems to Mitigate Flood Impacts in Nigeria (No. H052683); International Water Management Institute: Colombo, Sri Lanka, 2023. [Google Scholar]
  46. Kiptum, A.; Mwangi, E.; Otieno, G.; Njogu, A.; Kilavi, M.; Mwai, Z.; MacLeod, D.; Neal, J.; Hawker, L.; O’Shea, T.; et al. Advancing operational flood forecasting, early warning and risk management with new emerging science: Gaps, opportunities and barriers in Kenya. J. Flood Risk Manag. 2025, 18, e12884. [Google Scholar] [CrossRef]
  47. Nearing, G.; Cohen, D.; Dube, V.; Gauch, M.; Gilon, O.; Harrigan, S.; Hassidim, A.; Klotz, D.; Kratzert, F.; Metzger, A.; et al. Global prediction of extreme floods in ungauged watersheds. Nature 2024, 627, 559–563. [Google Scholar] [CrossRef]
  48. Matias, Y. Available online: https://blog.google/technology/ai/google-ai-global-flood-forecasting/ (accessed on 14 January 2025).
  49. NASA Applied Sciences. 2024; Floods. Available online: https://appliedsciences.nasa.gov/what-we-do/disasters/floods (accessed on 14 January 2025).
  50. Global Flood Awareness System (GloFAS). Copernicus Emergency Management Service. 2025. Available online: https://global-flood.emergency.copernicus.eu/technical-information/products/ (accessed on 14 January 2025).
  51. Ibebuchi, C.; Abu, I.-O.; Zenodo. NaijaFloodWatch. 2025. Available online: https://naijafloodwatch.streamlit.app/ (accessed on 2 May 2025).
  52. Python Software Foundation. Python; Version 3.9; 2020; Available online: https://www.python.org (accessed on 14 January 2025).
Figure 1. A map of Nigeria and its location in Africa.
Remotesensing 17 01814 g001
Figure 2. Sentinel-2 satellite imagery of the first and second Niger Bridge, before (30 June 2022) and after (30 October 2022) the 2022 flood event in Nigeria.
Remotesensing 17 01814 g002
Figure 3. Flood extent in Nigeria (top panel) and flooded areas per state (bottom panel) between 1 September and 15 October 2022.
Remotesensing 17 01814 g003aRemotesensing 17 01814 g003b
Figure 4. The number of people affected by the flood per state.
Remotesensing 17 01814 g004
Figure 5. The population density per square meter in Nigeria in 2020 (top panel and bottom panel).
Remotesensing 17 01814 g005
Figure 6. Flooded areas in Nigeria from July 2022 to November 2022.
Remotesensing 17 01814 g006
Figure 7. The monthly anomalies in rainfall (a) and the volumetric soil water layer at the top 7 cm (b) during 2022. The anomaly is the difference between the rainfall in the month in question during 2022 and the 1991–2020 climatology.
Remotesensing 17 01814 g007aRemotesensing 17 01814 g007b
Figure 8. The linear trend in heavy rainfall days in July to September from 1979 to 2022. Color is the standardized regression coefficient. Heavy rainfall is determined according to the number of days per year with rainfall amounts greater than 20 mm.
Remotesensing 17 01814 g008
Figure 9. A flood risk map in Nigeria based on the 2022 flood conditions and pre-flood population data. The top panel (a) shows high- and low-risk areas; the middle panel (b) shows the total population exposed to flood risk per risk category; and the bottom plot (c) shows the exposure per state in Nigeria.
Remotesensing 17 01814 g009aRemotesensing 17 01814 g009b
Table 1. Remote sensing and geospatial datasets used for flood risk analysis.
DatasetResolutionPurpose
Sentinel-1 Ground Range Detected (GRD) [20]10 mDetection and calculation of flood extent, capturing rainfall and Lagdo Dam-driven flooding
Joint Research Centre (JRC) Global Surface Water Mapping Layers [21]30 mMasking permanent water bodies to focus on temporary flooding
Shuttle Radar Topography Mission (SRTM) [22,23]30 mElevation and slope derivation for identifying low-lying flood-prone areas
WorldPop Global Project for 2020 global population data [24]100 mPopulation exposure assessment to identify human presence in flood zones
European Space Agency (ESA) WorldCover for 2021 [25]10 mLand cover classification for vulnerability assessment (e.g., croplands, settlements)
Climate Hazards Group InfraRed Precipitation with Station Data (CHIRPS) [26]5566 m (0.05°)Rainfall aggregation to quantify precipitation driving 2022-like floods
SoilGrids [27]250 mClay content analysis to assess soil water retention capacity
National Aeronautics and Space Administration (NASA) Soil Moisture Active Passive (SMAP) Level 4 [28]9000 mSoil moisture estimation to capture saturation levels during flood season
Food and Agriculture Organization (FAO) Global Administrative Unit Layers (GAUL) [29]Vector (country-level)Defining Nigeria’s boundaries for analysis scope
Disclaimer/Publisher’s Note: The statements, opinions and data contained in all publications are solely those of the individual author(s) and contributor(s) and not of MDPI and/or the editor(s). MDPI and/or the editor(s) disclaim responsibility for any injury to people or property resulting from any ideas, methods, instructions or products referred to in the content.

