1. Introduction
The Synthetic Aperture Radar (SAR) provides high-resolution imaging capabilities that are not affected by sunlight, atmospheric conditions, and various environmental factors [
1,
2,
3]. This makes SAR a crucial instrument for remote sensing tasks [
4,
5,
6]. SAR ship detection plays a crucial role in fields such as national defense, maritime governance, detection of unlawful activities, monitoring of maritime traffic, and coastal protection [
7,
8,
9]. Classical ship detection techniques usually rely on methods such as CFAR [
10] or manually designed features by professionals. However, these methods cannot effectively detect ships at different scales. With the continuous advancement of artificial intelligence and deep learning technology, the intelligent interpretation technology of SAR images is gradually expanding the application scope, such as meteorological observation, water resource management, disaster monitoring and emergency response, environmental change detection, and object detection under the unique SAR imaging. As an important classification of SAR object detection and identification, ship detection plays a key role in the fields of national defense, ocean management, illegal activity identification, maritime traffic monitoring, and coastal security [
7,
8,
9].
Although progress has been made in SAR-based ship detection, there are still several challenges due to the unique properties of SAR imaging. Due to their long wavelength characteristics, SAR results often appear as discrete scattering points in object representations, so it is difficult to maintain structural integrity in detection. Meanwhile, scale variations pose another challenge, as ships exhibit different but visually similar characteristics at different sizes, especially in complex coastal environments. The background clutter, noise, and surrounding structures with similar scattering intensities exacerbate this problem, increasing the possibility of misclassification. In early object detection, studies have mainly relied on traditional image processing techniques, including, but not limited to, the extraction of ship characteristics, such as edge detection and image segmentation, and the use of machine learning-based detection methods, such as support vector machine and K-nearest neighbor algorithms; however, due to the difficulty of feature selection, as well as the aforementioned multi-scale problem and the complexity of the background, SAR ship detection can never be applied on a large scale. To overcome these challenges, various deep learning techniques [
11,
12,
13] have been proposed, focusing on improving feature extraction, enhancing robustness to clutter, and optimizing detection architectures. The most widely used ones are convolutional neural networks (CNNs) and attention mechanisms (AMs). Attributed to their strong hierarchical feature extraction capabilities, CNNs have been the dominant approach for SAR image analysis. CNNs are good at capturing spatial and channel-wise information through multi-layer convolutional operations, allowing for effective local feature learning. Nevertheless, traditional CNN architectures have limited adaptability due to their reliance on fixed-weight convolutions, so they are less effective in handling SAR image variations and small-scale objects. Recently, diffusion models [
14,
15] have become a powerful generative framework that can model complex data distributions through iterative noise refinement. Their ability [
16,
17] to generate high-fidelity samples and learn robust feature representations has stimulated research on their application in SAR-based tasks. Particularly, diffusion-based denoising techniques have shown potential in mitigating SAR-specific noise patterns, thereby improving feature clarity and detection performance in cluttered environments.
Inspired by human visual perception, AMs dynamically reweight features to enhance object representation. In computer vision, they are divided into channel, spatial, temporal, and branching attention. Though temporal and branching attention are common in real-time detection, channel attention is often combined with spatial attention and is particularly effective in remote sensing applications for small-object detection. The concept of channel attention was first put forward by SENet [
18], which proposed the Squeeze-and-Excite (SE) block to model inter-channel dependencies. Though SE blocks are computationally efficient, they rely on global average pooling, so they have limited ability to capture higher-order statistics. GSoP [
19] extended this by integrating global second-order pooling, leading to better feature representation, but at the cost of increased computation. To achieve higher efficiency, SRM [
20] introduced style pooling by leveraging mean and standard deviation for feature recalibration while replacing fully connected layers with channelized fully connected layers to reduce complexity. However, fully connected layers in the excitation module still bring about large parameter overhead, limiting their practicality. To address this issue, gated channel transform [
21] provided an alternative approach that explicitly models channel relationships using L2 normalization and learnable scaling, offering a lightweight and flexible design. Despite this progress, existing methods employ fixed-size convolution kernels to perform channel correlation computation. Manually adjusting kernel sizes to adapt to varying receptive fields is inefficient, especially for high-resolution SAR images (where conventional channel attention mechanisms struggle to deal with scale variance), often resulting in localized information loss and ambiguity.
To overcome these limitations, self-attention mechanisms are receiving increasing attention. The Transformer model [
22], originally developed for natural language processing, has been effectively modified for visual tasks, with Vision Transformers (ViTs) [
23] exhibiting strong performance in classification, detection, and recognition tasks. The key strength of self-attention is its capacity to model long-range connections and capture global contextual interactions across feature maps. Nevertheless, its application to vision tasks is still computationally expensive. Since self-attention treats 2D images as flattened sequences, it disrupts spatial structures and introduces large computational overhead, particularly when processing high-resolution SAR images. Alternatively, large kernel convolutions have been investigated as a hybrid solution. Different from standard CNNs, large kernel networks can mimic self-attention behaviors while retaining the efficient local feature extraction of CNNs. Recent studies, such as the visual attention network [
24], have proposed large kernel attention (LKA), which utilizes depth-wise convolutions with small and large receptive fields to efficiently capture both local and global dependencies. However, existing fixed large kernel methods are still computationally expensive and often fail to generalize well across different feature resolutions.
Given the outstanding capabilities of AMs, their applications in the field of deep learning for SAR ship detection are increasing. In recent years, the combination of different types of AMs and their creative embedding within deep learning frameworks have given rise to new network structures. The model SSE-Ship [
25] is a SAR ship detector based on the STCSPB network that distinguishes between ship and non-ship objects by combining image context feature information and SE attention to improve effective features. It can address the issue of low detection rates in SAR images, particularly in scenarios involving ship combinations and fusion. AMANet [
26] proposes a new adaptive multi-level attention model that allows the network to adaptively aggregate salient features of each feature layer in complex environments by integrating the model between a backbone and a neck with feature pyramid network (FPN) as the main component. Additionally, the model has superior robustness and can be seamlessly integrated into different frameworks to improve object detection performance. It is evident that AMs have much room for exploration within deep learning-based SAR ship detection applications.
This paper proposes AJANet, an enhanced detector that integrates adaptive channel attention (ACA) and adaptive large kernel attention (ALKA) to improve feature extraction and robustness. The core of adaptive joint attention (AJA) is a plug-and-play module that can be adapted to any single-stage object detector. ACA improves the detection of small-scale ships by dynamically adjusting channel-wise attention weights, allowing the model to concentrate on salient object regions while reducing computational overhead. Meanwhile, ALKA optimizes receptive fields based on feature map resolutions, leading to a balanced extraction of local and global features. Different from fixed large kernel convolutions, ALKA dynamically adjusts kernel sizes at different layers, improving ship–background differentiation, especially in complex coastal environments. By integrating these adaptive mechanisms, AJANet effectively refines multi-scale feature representation, contributing to higher detection accuracy and robustness in a broad range of maritime conditions.
To sum up, the main contributions of this paper include the following:
An adaptive attention mechanism, which dynamically enhances small-object feature representation by modulating cross-channel interactions, improving detection accuracy for ships in SAR images, is proposed.
A method for the dynamic selection of the receptive field, which achieves multi-scale feature extraction for different input resolutions, effectively reducing misclassification and improving object–background differentiation, is presented.
By integrating ACA and ALKA into the YOLO series framework, significant improvements are achieved in the main metrics, contributing to robust detection performance in different maritime environments.
2. Methods
2.1. Overview
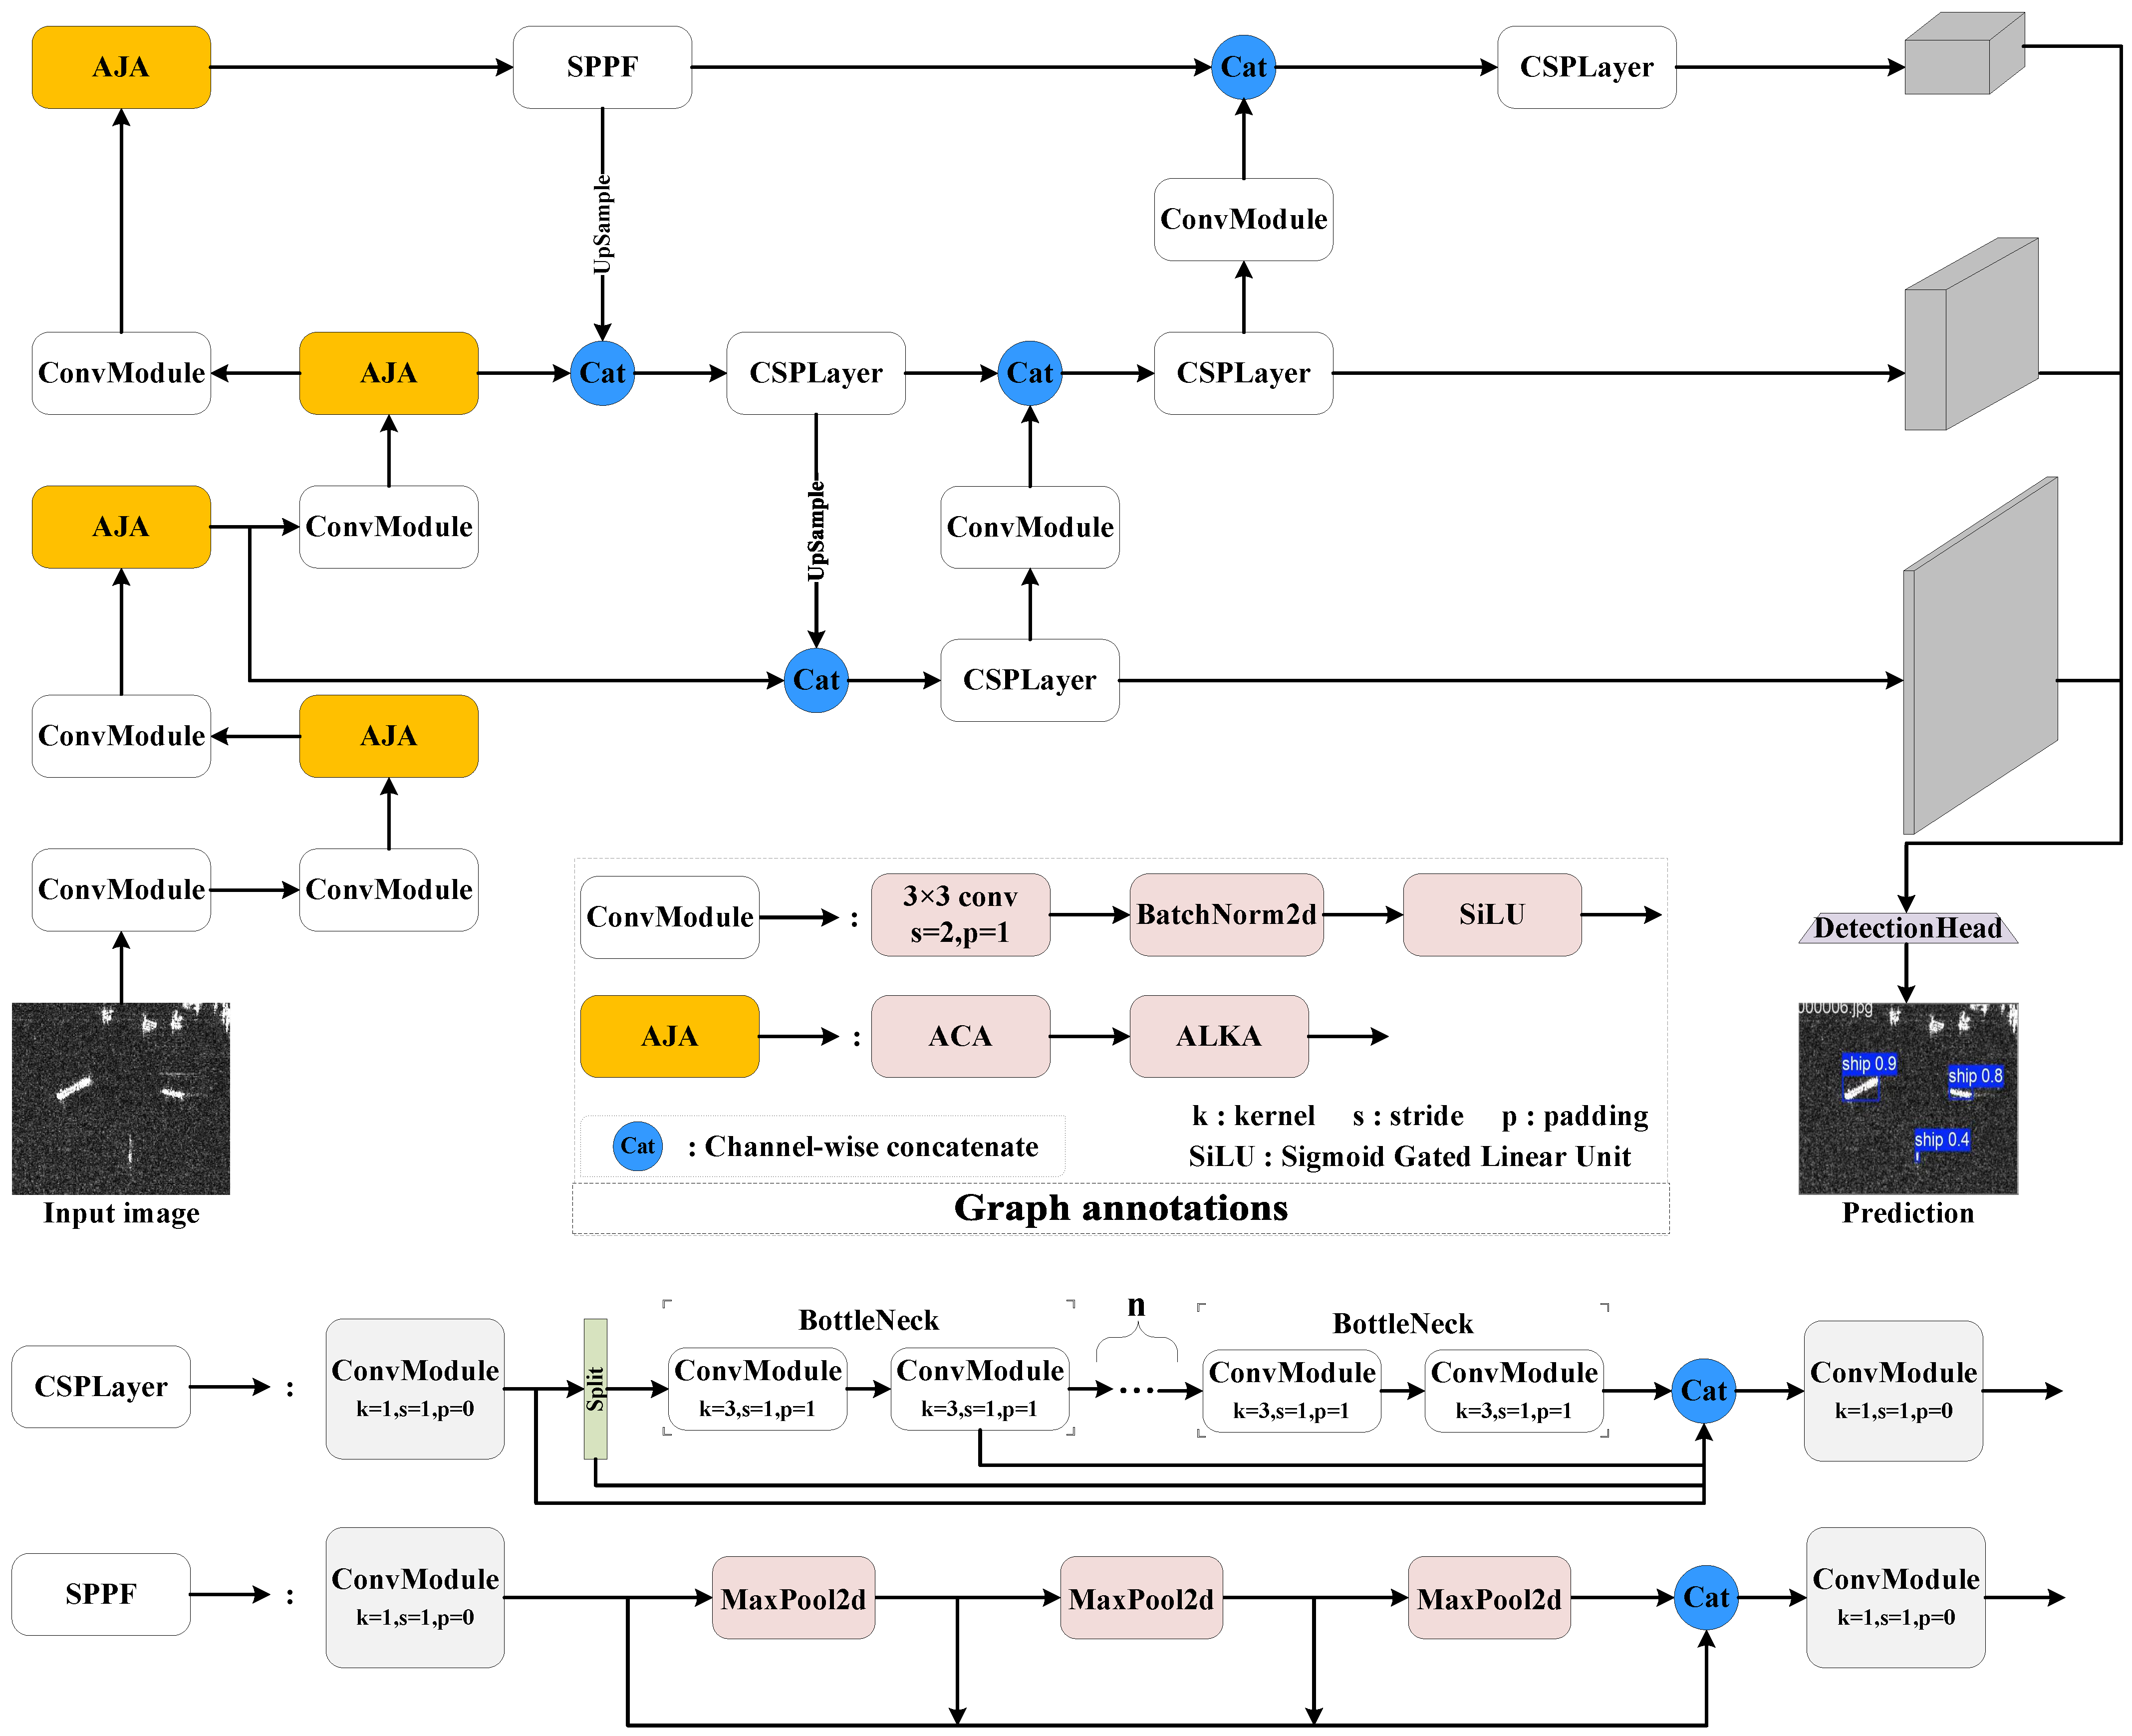
The model’s overall architecture, as demonstrated in
Figure 1, is composed of three key components: the backbone, neck, and head.
In the backbone, the model constructs a multi-stage feature representation through successive convolutional modules. After each convolutional stage, an innovative AJA module is embedded, which contains two key components: the ACA and the ALKA. Among them, the ACA adopts a channel attention mechanism to dynamically adjust the importance of each channel through a learnable weight matrix, allowing the network to autonomously improve the channels containing ship features while suppressing the interference of background clutter; the ALKA can adaptively change receptive fields by dynamically adjusting the size of the convolution kernel, thereby capturing the global features of large ships while retaining the detailed information of small vessels. The synergistic effect of these two components effectively solves the problem of large object scale differences in SAR images.
The FPN adopts an improved PANet structure to fuse features of different layers through bidirectional cross-scale connections. The up-sampling path can accurately recover the spatial details while the down-sampling path retains the high-level semantic information, leading to significantly stronger detection ability of the model for multi-scale objects. As the core of the neck, the CSPLayer fuses and transmits the feature information from the backbone, enabling the network to better deal with complex scenes and multi-scale objects and providing the detection head with the corresponding final feature maps. In the feature fusion process, the network fully exploits the attention information extracted from the backbone to achieve more accurate feature alignment.
The detection head adopts a decoupled design to separate the classification and regression tasks. The classification branch extracts discriminative features through depthwise separable convolution, while the regression branch combines the spatial attention information provided by the AJA module to realize more accurate bounding box prediction. The whole network is optimized in an end-to-end manner with a multi-task loss function, which substantially enhances the robustness of detection under complex sea conditions while retaining the efficient characteristics of the YOLO series.
The dual adaptive feature channel and spatial dimension are achieved through the AJA module, the improved feature pyramid structure improves the multi-scale feature fusion effect, while the detection head and attention mechanism are synergistically optimized. Attributed to these designs, the model can better adapt to the detection needs of ship objects in SAR images.
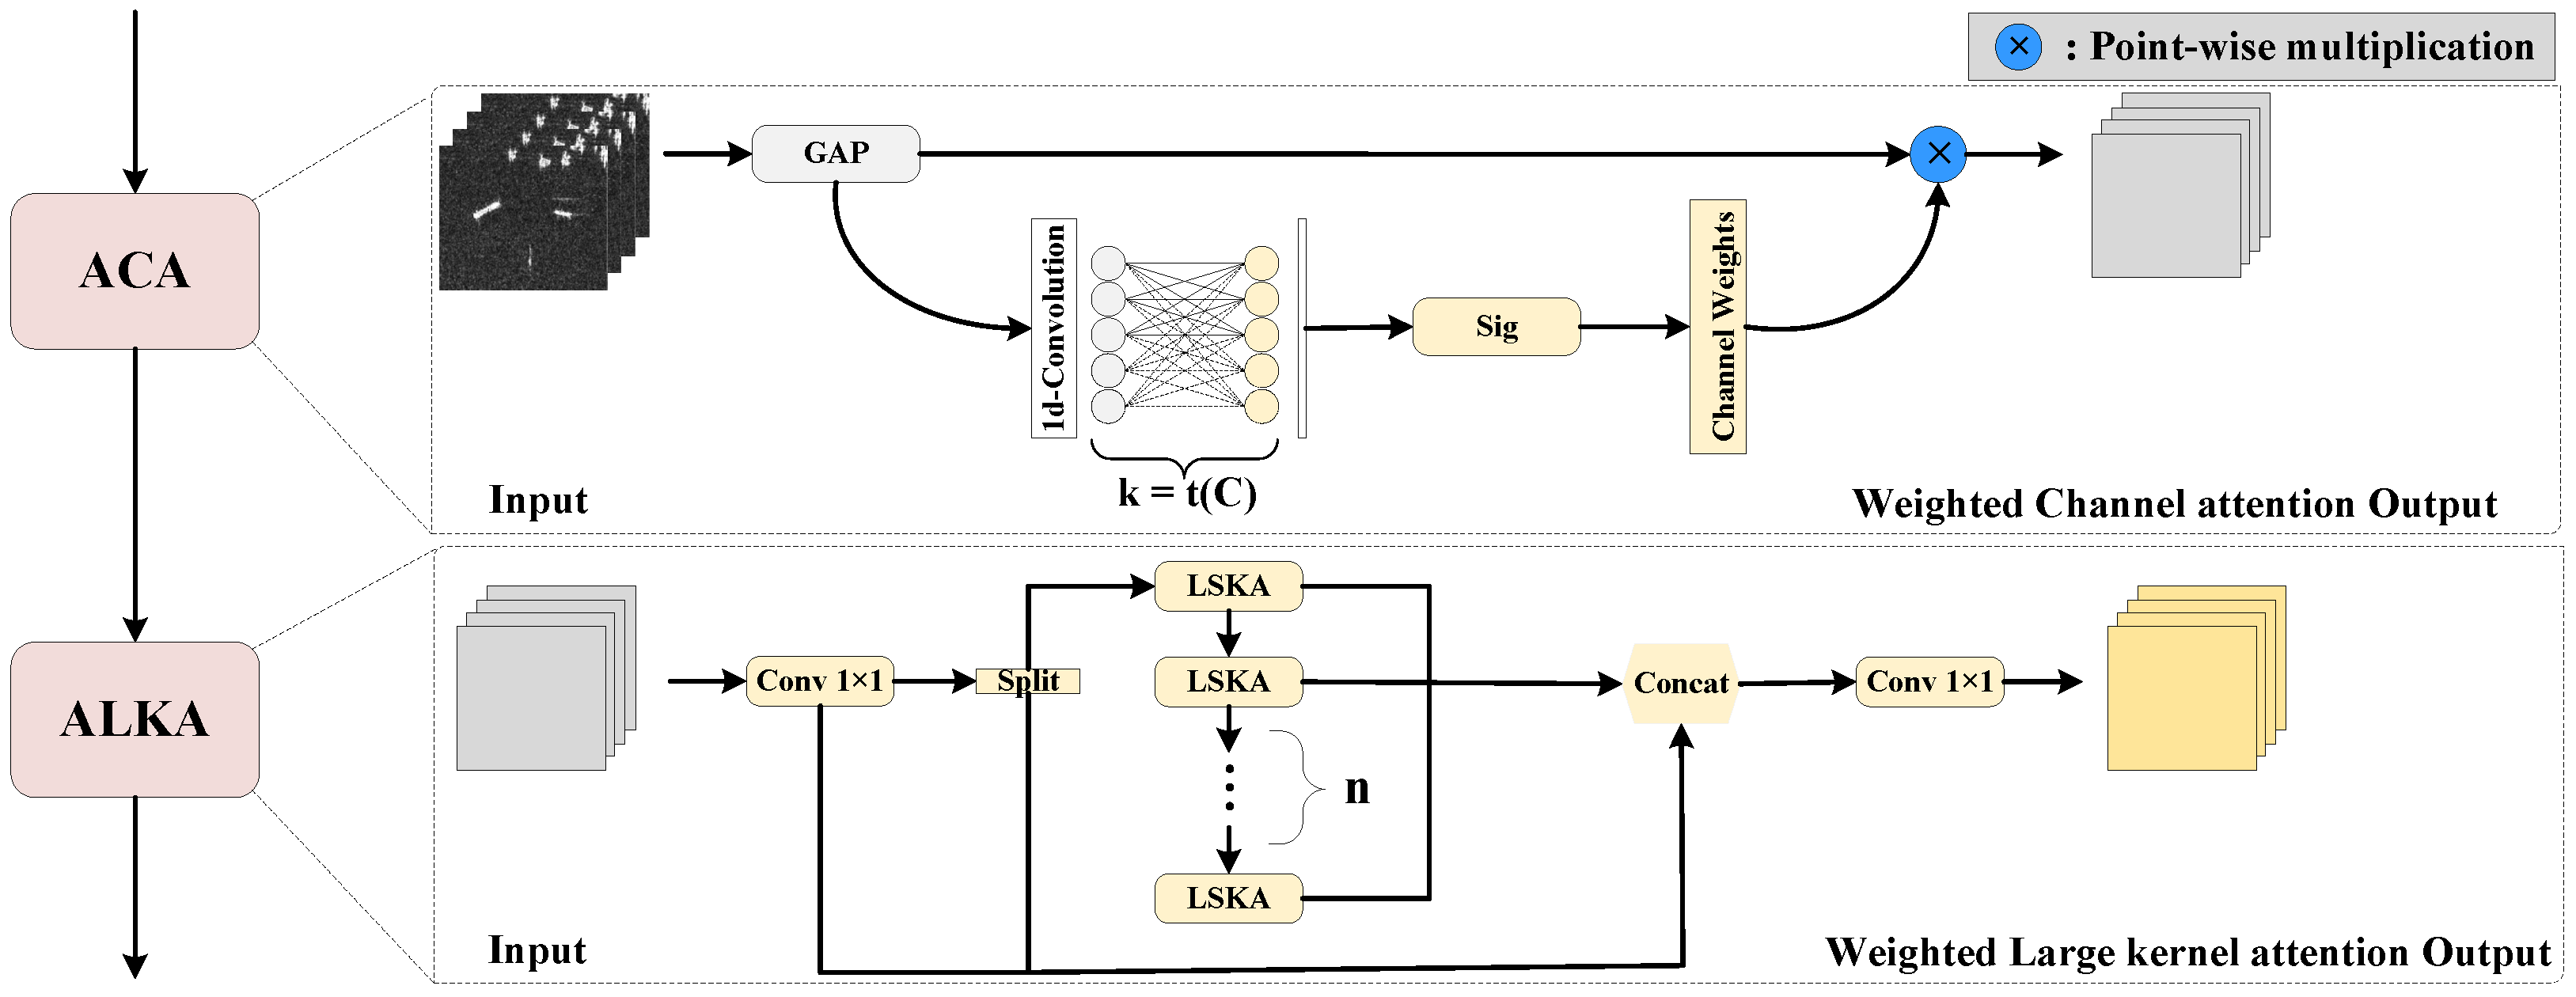
2.2. ACA
Through convolution operations, varying types of features in the image, such as the grayscale, texture, and contour features, are integrated into the feature map as distinct channels. These features play a crucial role in distinguishing the foreground, background, and object noise. Nevertheless, overfocusing on spatial attributes may result in information redundancy, inducing models to capture misleading or non-discriminative feature representations. The ACA mechanism is specifically designed to solve this problem by guiding the model’s focus to the most relevant regions. Its structure is presented in
Figure 2. In the training process, the input set is represented as
, where
B denotes the batch size,
C denotes the number of channels, and
H and
W denote the height and width of the input image, respectively. Convolutional operations are applied to extract the initial features from the input image. To improve the connectivity between channels, all of the channels adopt the same learning parameters, i.e.,
the parameter matrix
is of dimension
. Given a pixel
, the study investigates its receptive field spanning
k units, with
representing the set of
k neighboring channels around
. To effectively model channel interactions, the convolution kernel size
k can be manually tuned to meet different receptive field requirements. However, this manual tuning is inefficient. To overcome this limitation, an adaptive strategy is introduced, where the kernel size
k is dynamically adjusted according to the input channel dimensions, enabling flexible convolution at different feature scales. This relationship is formalized through a mapping between
k and
C:
where
represents taking the nearest odd number in the internal arithmetic, while the scaling factor
and bias term
b are optional parameters in the linear transformation. Through using the mapping function
, channels in higher dimensions are involved in more extensive interactions, whereas those in lower dimensions exhibit more localized interactions owing to the application of a nonlinear mapping relationship.
2.3. LKA
The attention mechanism can be considered a dynamic selection procedure that can identify distinctive features while automatically ignoring the incorrect outputs derived from the input features. A key step in the attention mechanism is to generate an attention map that highlights the significance of various regions. To achieve this, it is important to understand how various features are related.
There are two well-known methods for establishing the relationships between different components. One method leverages the self-attention mechanism [
22] to capture distant dependencies. However, the special form of modeling based on self-attention often results in an exponential increase in its computational overhead when processing high-resolution images, which, in turn, leads to inefficiency in training. The other method uses large kernel convolution [
24] to establish relevance and generate an attention map. Nevertheless, this method still has significant limitations as large kernel convolution introduces considerable computational overhead and a large number of parameters.
To overcome this challenge, Guo et al. [
24] introduced LKA, which strategically decomposes conventional large kernels into three distinct operations: (1) localized spatial processing through depth-wise convolution, (2) extended spatial context modeling through depth-wise dilated convolution, and (3) cross-channel feature transformation through
convolution (visualized in
Figure 3). This factorization method retains the ability to model distant dependencies while greatly decreasing both computational complexity and parameter count. After establishing these long-range dependencies, the system can evaluate spatial significance and generate corresponding attention weights. Mathematically, the LKA mechanism can be formulated as follows:
where
I denotes the input feature map; Attention represents the attention map;
,
, and
correspond to depth-wise convolution, dilation convolution, and
convolution, respectively; and ⊗ denotes the element-wise product.
The configuration of decomposition parameters is a crucial design consideration in LKA blocks. To rapidly expand the receptive field, both kernel dimensions and dilation factors must be appropriately scaled. Accordingly, our methodology establishes the following relationship for the key parameters (kernel size
k, dilation rate
d, and receptive field
R) of the
i-th convolutional layer:
where
denotes the kernel size of the deep convolution, and
represents the kernel size of the dilated deep convolution. It is noteworthy that the above formulas involve multicore decompositions of a single large kernel, but this paper only considered decompositions where the end result is a dual kernel, so only the computation of
and
and their associated parameters will be discussed in the following:
which allows for deriving an inequality between the size of the large kernel and the dilated convolutional expansion rate obtained by decomposition:
Since
d takes only positive integers, from Equations (2) and (3), we can iterate over the size of the
d desirable for different sizes of convolution kernels: When
; When
; When
; When
. To sum up, the larger the convolutional kernel, the faster the expansion rate adopted and the higher the decomposition possibilities for large kernels. The convolution kernel sizes for depth-wise convolution and depth-wise dilation convolution can be determined by combining the following equations, respectively:
where
and
represent the convolution kernel sizes for depth-wise convolution and depth-wise dilated convolution, respectively, while
and
denote the padding values for depth-wise convolution and depth-wise dilated convolution, respectively.
Due to the non-uniqueness of the macrocore decomposition, the actually used expansion rate needs to be specifically chosen based on the dataset employed, the type of object detected, and the image resolution.
2.4. ALKA
ALKA is a modified LKA as the core, and it is combined with an ELAN (Efficient Layer Aggregation Network) structure to design an adaptive plug-and-play attention module, which demonstrates better performance in synergy with ACA. This section is divided into two parts: the improvement of the original LKA, and the implementation of the LKA.
2.4.1. Large Separable Kernel Attention
Though LKA performs well in various types of vision tasks, its large-scale depth-directed convolutional kernel design leads to high memory usage, which further reduces the computational speed. As the kernel size increases, the effectiveness of the model is further reduced [
24].
To enhance the robustness and computational efficiency of the model, this paper incorporates a depth-separable mechanism into LKA. Specifically, the 2D depth convolution from the large kernel decomposition is replaced with two 1D depth convolutions of size
and
. Meanwhile, the depth-null convolution, with an expansion rate of
d, is replaced with two 1D depth-null convolutions of size
and
. This separable LKA is called large separable kernel attention (LSKA) [
27], as illustrated in
Figure 4. By introducing the separable mechanism, the original
standard convolutional computation is in the form of
and
, and the computational complexity also changes from
O(
) to
O(
); the larger the original value of
k, the greater the reduction in computational complexity, which reduces the number of references and substantially improves the computational efficiency of the model. The
convolution can capture the horizontal direction features, and the
convolution can capture vertical direction features. The cascade of the two is almost equivalent to the
convolution receptive field and helps to avoid redundant weights, which makes the gradient propagation more stable and accelerates the convergence. The proposed LSKA module effectively alleviates the two key limitations associated with conventional large kernel attention mechanisms: the quadratic parameter growth with increasing kernel dimensions, and the low computational efficiency manifested as slow training convergence and extended inference latency. Through its innovative decomposition approach, LSKA maintains the representational benefits of large receptive fields while substantially improving parameter efficiency and computational performance.
2.4.2. Realization of LKA
The internal structure of the ALKA module is illustrated in
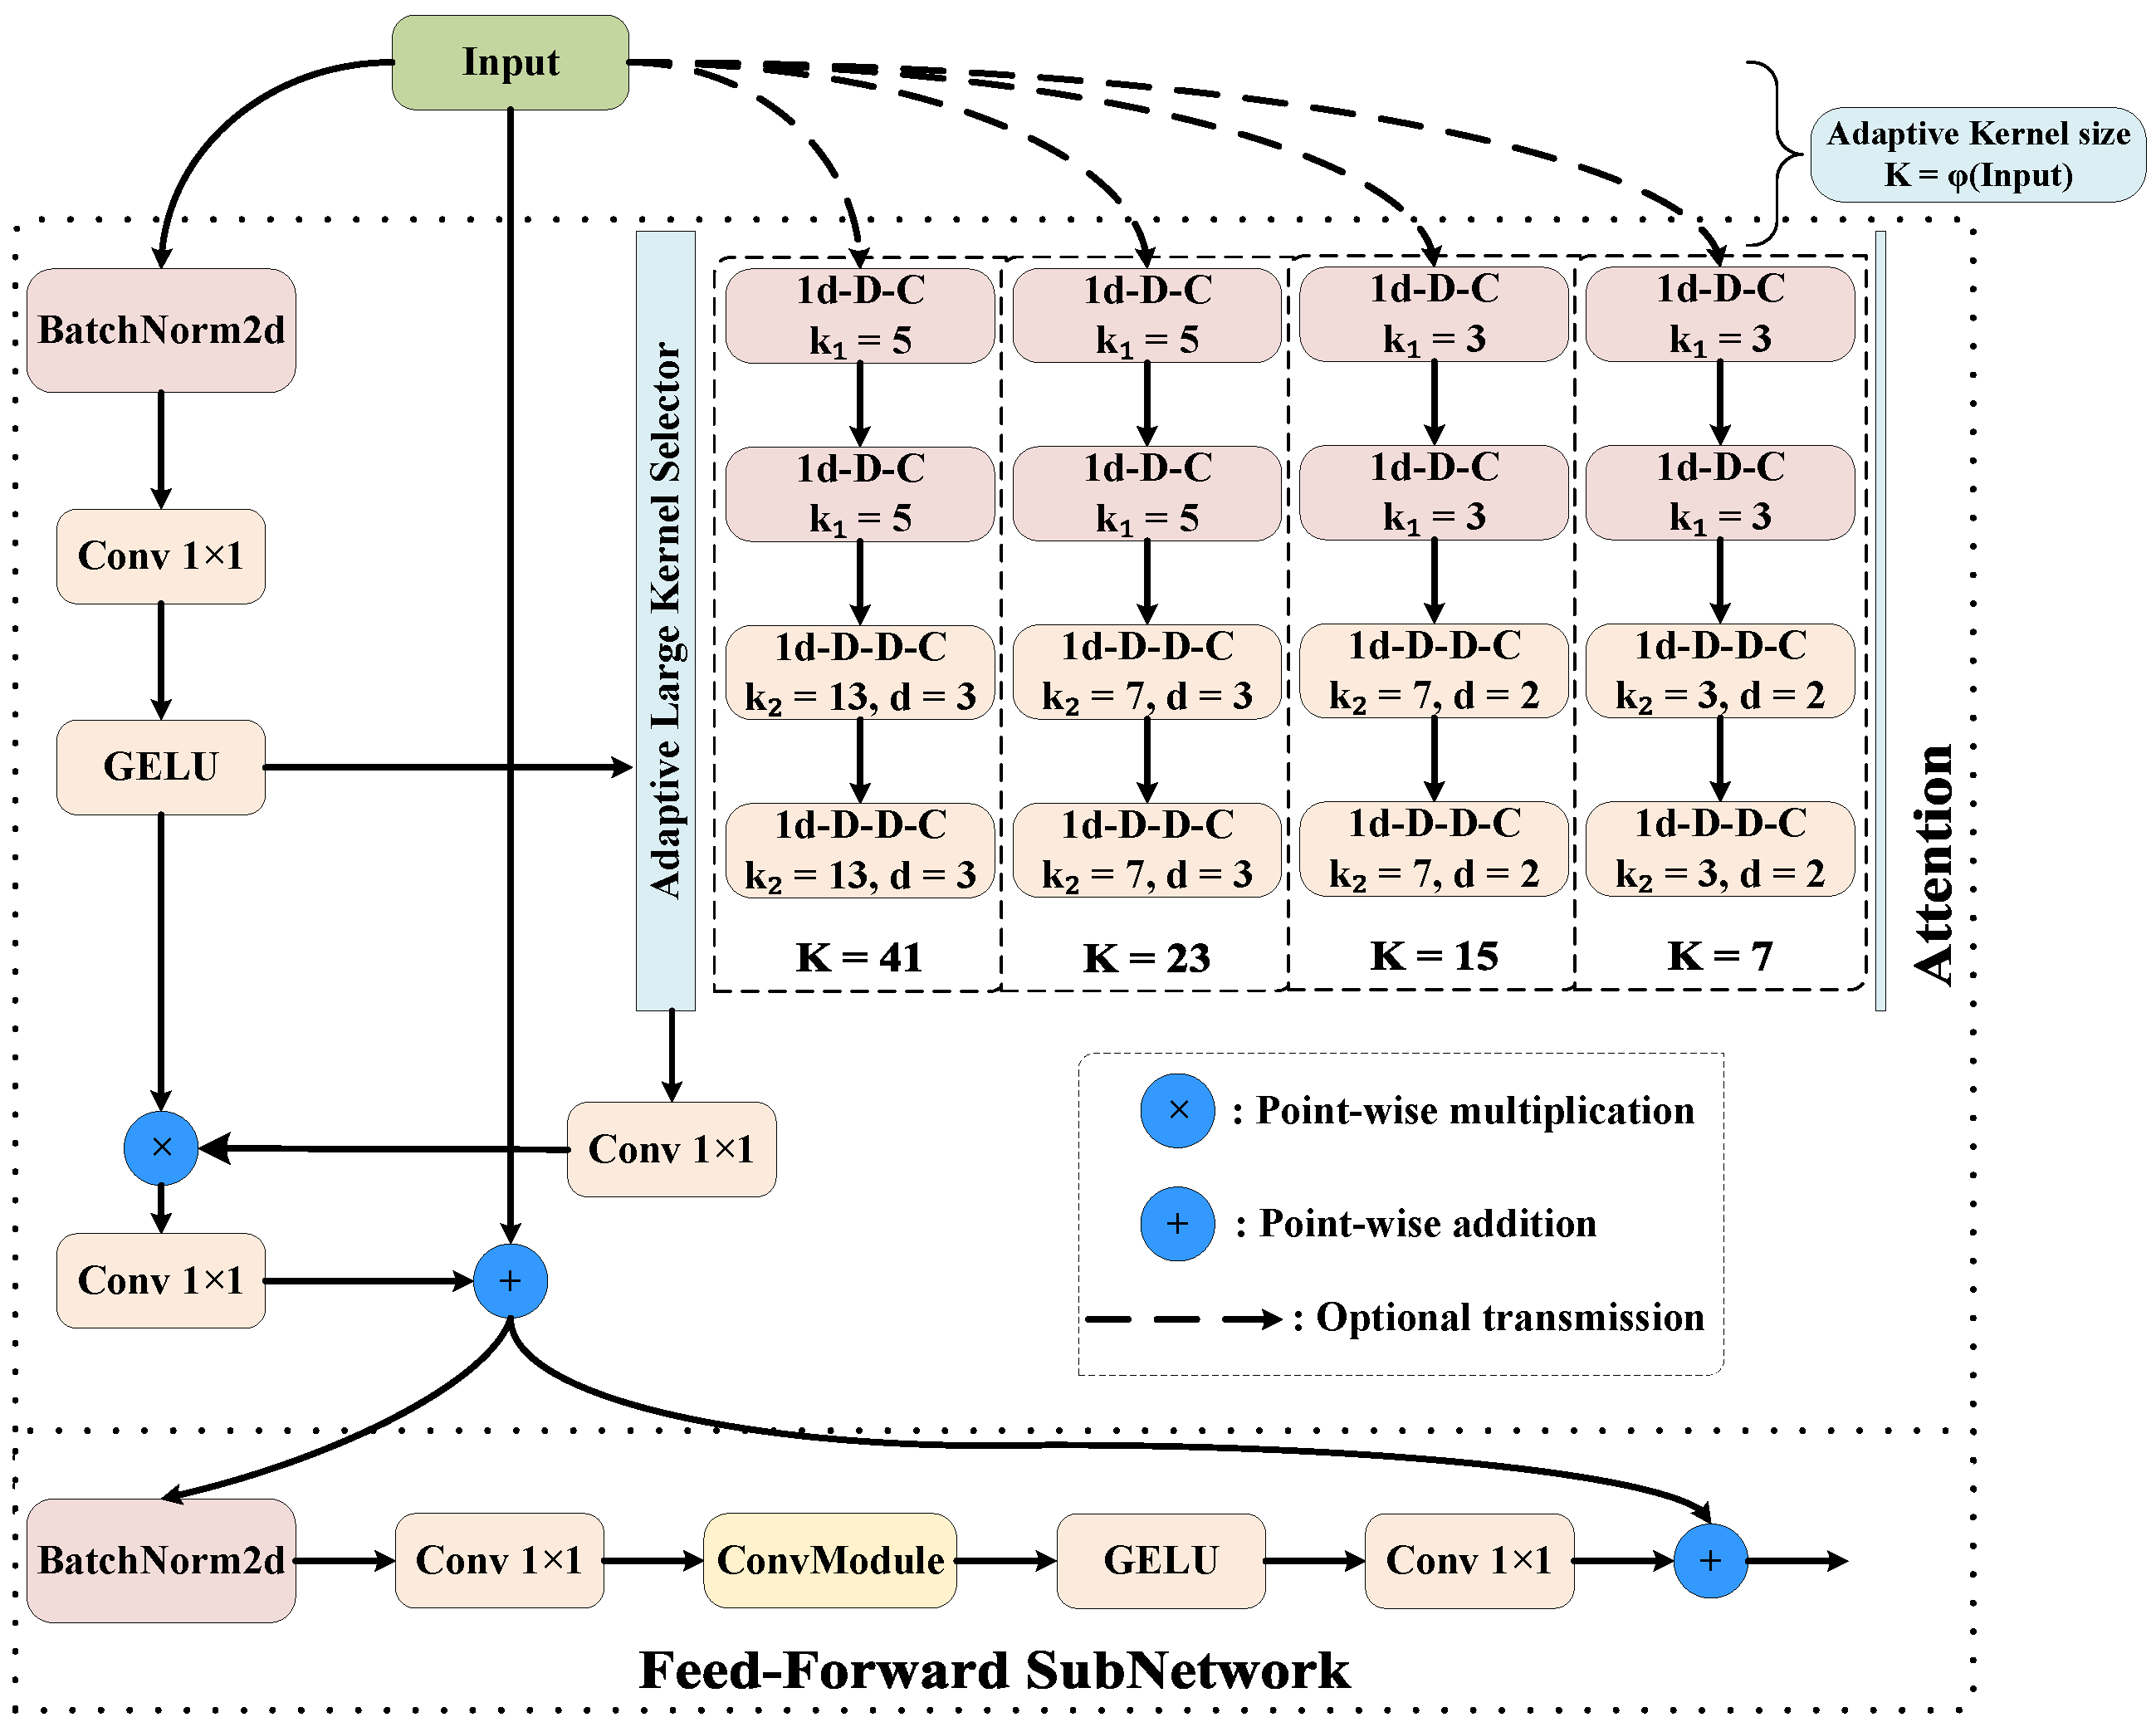
Figure 2, and LSKA is the core component. ALKA adaption is realized by integrating the Adaptable Large Kernel Selector (ALKS), which dynamically adjusts the size of the selected convolutional kernel based on the width and height of the input feature map.
Figure 4 shows how LSKA works. The whole module mainly consists of two parts: the attention and the feed-forward subnetwork. The former adopts the optimized large kernel convolution scheme, which further decomposes the depthwise convolution and depthwise dilated convolution after the large kernel decomposition into two one-dimensional convolutions by adding a separable mechanism, generating the output feature maps after
convolution, and outputing the first-stage resultant feature maps after the processed original feature maps are weighted and multiplied; the latter performs further feature integration and de-linearization of the output feature maps of the first stage.
Nevertheless, in this case, the size of the large kernel in the attention part is fixed, so choosing a size that can be adapted by all layers is a top priority. Utilizing a larger convolutional kernel can expand the receptive field, making it possible to capture more image information and obtain a richer feature representation. Yet, due to the varying scales of input feature maps across different layers, the relative receptive fields of the same convolutional kernel vary for feature maps of different sizes. A too-large receptive field may result in blurring or even loss of extracted information, while a too-small receptive field may fail to comprehensively extract contextual information. This can lead to false detection or missed object detection in multi-scale and complex background detection tasks.
To address this issue, this paper introduces an adaptive mechanism based on the original large kernel convolution. This mechanism evaluates the size of the feature map at each stage based on the input image size and selects the most suitable large kernel size. As depicted in
Figure 4, this is manifested as the ALKA in the attention part, and the principle is as follows:
Considering that the size design of large convolutional kernels and their decomposition principles have strict rules (e.g., the size of large kernels and small kernels after decomposition of large kernels needs to be odd), and the size of different large kernels spans over a large range, this paper chose an approximation strategy for the discrete-value domain when establishing the mapping between the input feature map size and the kernel size, i.e., selecting the one in the set of large convolutional kernels that is closest to the computed value. Here, I represents the input feature map size; denotes the computed kernel size; K stands for the actual chosen kernel size; and and b are free parameters, which can be flexibly adjusted in a task-oriented manner and according to the chosen datasets (both of them were set to seven in this paper).
In addition, this paper adopted the concept of ELAN to create a parallel gradient flow branch with multiple LKA modules. This further refined and improved the features through multiple LKA blocks, capturing more complex contextual relationships and details to enhance the model’s nonlinear representation ability. By introducing the improved LKA mentioned in the previous section within the ELAN architecture, the other core module of the proposed detector, ALKA, was constructed, as shown in
Figure 2.
In ALKA, the output from the previous ACA layer, i.e., the feature map with channel weighting information at this stage, was passed into ALKA as input and was transformed through the first convolutional layer to generate the intermediate feature map. Then, the generated feature map was divided into two sections: one that maintained the original position information and was passed directly to the final contact block, while the other was passed to multiple LSKA blocks for further processing. The feature maps of the input LSKA blocks were processed through a series of convolution, normalization, kernel attention weighting, and activation operations.
The LSKA backbone adopts a residual structure, which improves the robustness of the network training by alleviating the problem of gradient vanishing. The internal modules were mainly split into two parts: weighted separable kernel attention and a feed-forward subnetwork (FFN). The attention mechanism also leverages the streaming design of ALKA, where part of the feature map retains the original information of the input, and it is pixel-added to the input feature map, which is weighted by the kernel’s attention. This enables the output intermediate feature map to be further convolved and activated by the FFN, and the extracted contextual information is aggregated to obtain the output feature map of the LSKA.
At last, the feature maps processed by the LSKA block were spliced with the part of the feature maps passed directly in the contact block to form the fused feature maps, which were subsequently processed by the second convolutional layer to output the final feature maps of the ALKA module.
3. Results
To validate the effectiveness of AJANet, comprehensive experiments were conducted to compare it with leading single-stage detectors on two widely-used SAR ship detection benchmarks: the SSDD and the High-Resolution SAR Images Dataset (HRSID). The experimental results indicate that AJANet achieved state-of-the-art (SOTA) performance.
3.1. Datasets
SSDD. The SSDD dataset [
28], a publicly accessible benchmark for SAR ship detection, is composed of 1160 images collected from multiple satellite platforms including RadarSat-2, TerraSAR-X, and Sentinel-1. These images have varying spatial resolutions between 1 to 15 m, capturing diverse maritime scenarios from open oceans to coastal waters. The dataset contains 2456 manually annotated ship instances and establishes a standardized 8:2 training–validation split for performance evaluation. This carefully curated collection has emerged as an authoritative reference for evaluating SAR-based vessel detection algorithms.
HRSID. The HRSID [
29] is a comprehensive benchmark developed specifically for multi-task learning in SAR image analysis, including ship detection, semantic segmentation, and instance segmentation. This large-scale collection consists of 5604 high-resolution SAR images with 16,951 meticulously annotated ship objects, covering various spatial resolutions, multiple polarization modes, different sea conditions, and extensive coastal coverage. It is noteworthy that HRSID has become a standard evaluation platform for deep learning methods in SAR maritime object analysis. Following established protocols, this paper adopts the recommended 65:35 training–validation split for all experimental validation.
3.2. Evaluation Metrics
To evaluate model performance in maritime remote sensing object detection, three key metrics are used to collectively characterize detection quality. Specifically, Precision (
P) reflects the model’s ability to minimize false alarms by measuring the proportion of correct identifications among all predicted positives. Recall (
R) captures the system’s detection completeness by evaluating the fraction of actual objects that are successfully identified. Average Precision (
) integrates these factors by summarizing performance across all confidence thresholds, providing a balanced view of the detector’s accuracy and robustness. These complementary metrics allow for a comprehensive evaluation of both detection reliability and coverage, which is particularly important for SAR applications, where false positives and missed detections have significant operational consequences. The calculation formulas of
P and
R are given by the following:
where
represents the number of true positives,
represents the number of false positives, and
represents the number of false negatives.
serves as a fundamental evaluation metric in object detection tasks. It is derived from calculating the area under the precision–recall curve, providing a comprehensive evaluation of model performance across various confidence thresholds. The calculation formula of
is given by the following:
The mAP is the average of the AP values and is usually calculated as the mean of the APs across all categories. When object detection tasks involve multiple categories, mAP can be used to measure the combined performance of the model on all categories. However, considering that the detection task in this paper only includes the category of “Ship”, mAP and AP can be considered the same metric. The mAP50 is the mAP at IoU = 0.5. Specifically, it is the average AP across all categories at an IoU threshold of 0.5 (the AP is calculated at an IoU threshold of 0.5). The mAP50–95 is the mAP calculated for IoU thresholds ranging from 0.5 to 0.95 (in steps of 0.05). It considers many different IoU thresholds ranging from 0.5 to 0.95, calculates APs at intervals of 0.05, and averages the final value of these APs. SAR ship detection, as a multi-scale object detection task, usually requires detecting a wide range of objects from small to large. Therefore, it not only needs to perform well at lower IoU thresholds (mAP50), but it also needs to be able to maintain good performance at higher IoU thresholds (mAP50–95). Considering this, mAP50–95 will be used as the first metric to evaluate model performance.
3.3. Implementation Details
The experimental framework is built on PyTorch 2.0.0 and uses an NVIDIA RTX 4070 Ti GPU with 16GB VRAM in a CUDA 11.6 environment to accelerate computation. YOLOv8 is taken as the baseline architecture to implement our proposed network modifications. The training configuration adopts a momentum of 0.937 to stabilize gradient optimization, a batch size of 16 to balance memory efficiency and model convergence, and runs for 200 epochs to ensure complete training. The optimizer is initialized with a learning rate of 0.01, which decays according to a predefined schedule, while a weight decay of 0.0005 prevents overfitting through L2 regularization. All object detection evaluations use the standard IoU threshold of 0.5.
3.4. Ablation Studies and Analysis
This section focuses on evaluating the effectiveness of the two proposed modules and the impact of parameter changes in the modules on network performance. Then, the effectiveness of the modules is tested on the remaining YOLO models to verify their robustness, as shown below: (1) The role of ACA and ALKA. (2) The influence of the number (n) of LSKAs within ALKA in each stage. (3) The role of adaptation in ALKA. (4) The role of adaptation in ACA. (5) The universality of different YOLOs.
3.4.1. Role of ACA and ALKA
First, this paper investigated the extent to which the ACA and ALKA modules in AJANet contribute to performance improvement. As listed in
Table 1, the first set of data represents the results of the YOLOv8n benchmark experiment. The second set of data reflects the performance improvement with the integration of ALKA blocks, with mAP
50–95 increasing by 0.6% and 0.5% on SSDD and HRSID, respectively. The third set of data depicts the performance improvement after the integration of the ACA block, with mAP
50–95 improving by 1.7% and 0.9% on SSDD and HRSID, respectively. Finally, the fourth dataset shows the experimental results of AJANet on SSDD and HRSID. Compared to the baseline, the mAP
50–95 metrics improved by 2.1% on SSDD and 1.1% on HRSID. The results indicate that both the ACA and ALKA blocks contribute to higher model performance, which illustrates that channel details and contextual information are important for SAR ship detection. Moreover, when they are combined, they work synergistically to bring about more significant performance improvements. In addition, it can be seen that the set that introduces ALKA shows a small decrease in its parameters and floating-point operations per second (FLOPs), while the performance of the model increases instead. This proves that the modules can also improve the real-time performance of the model.
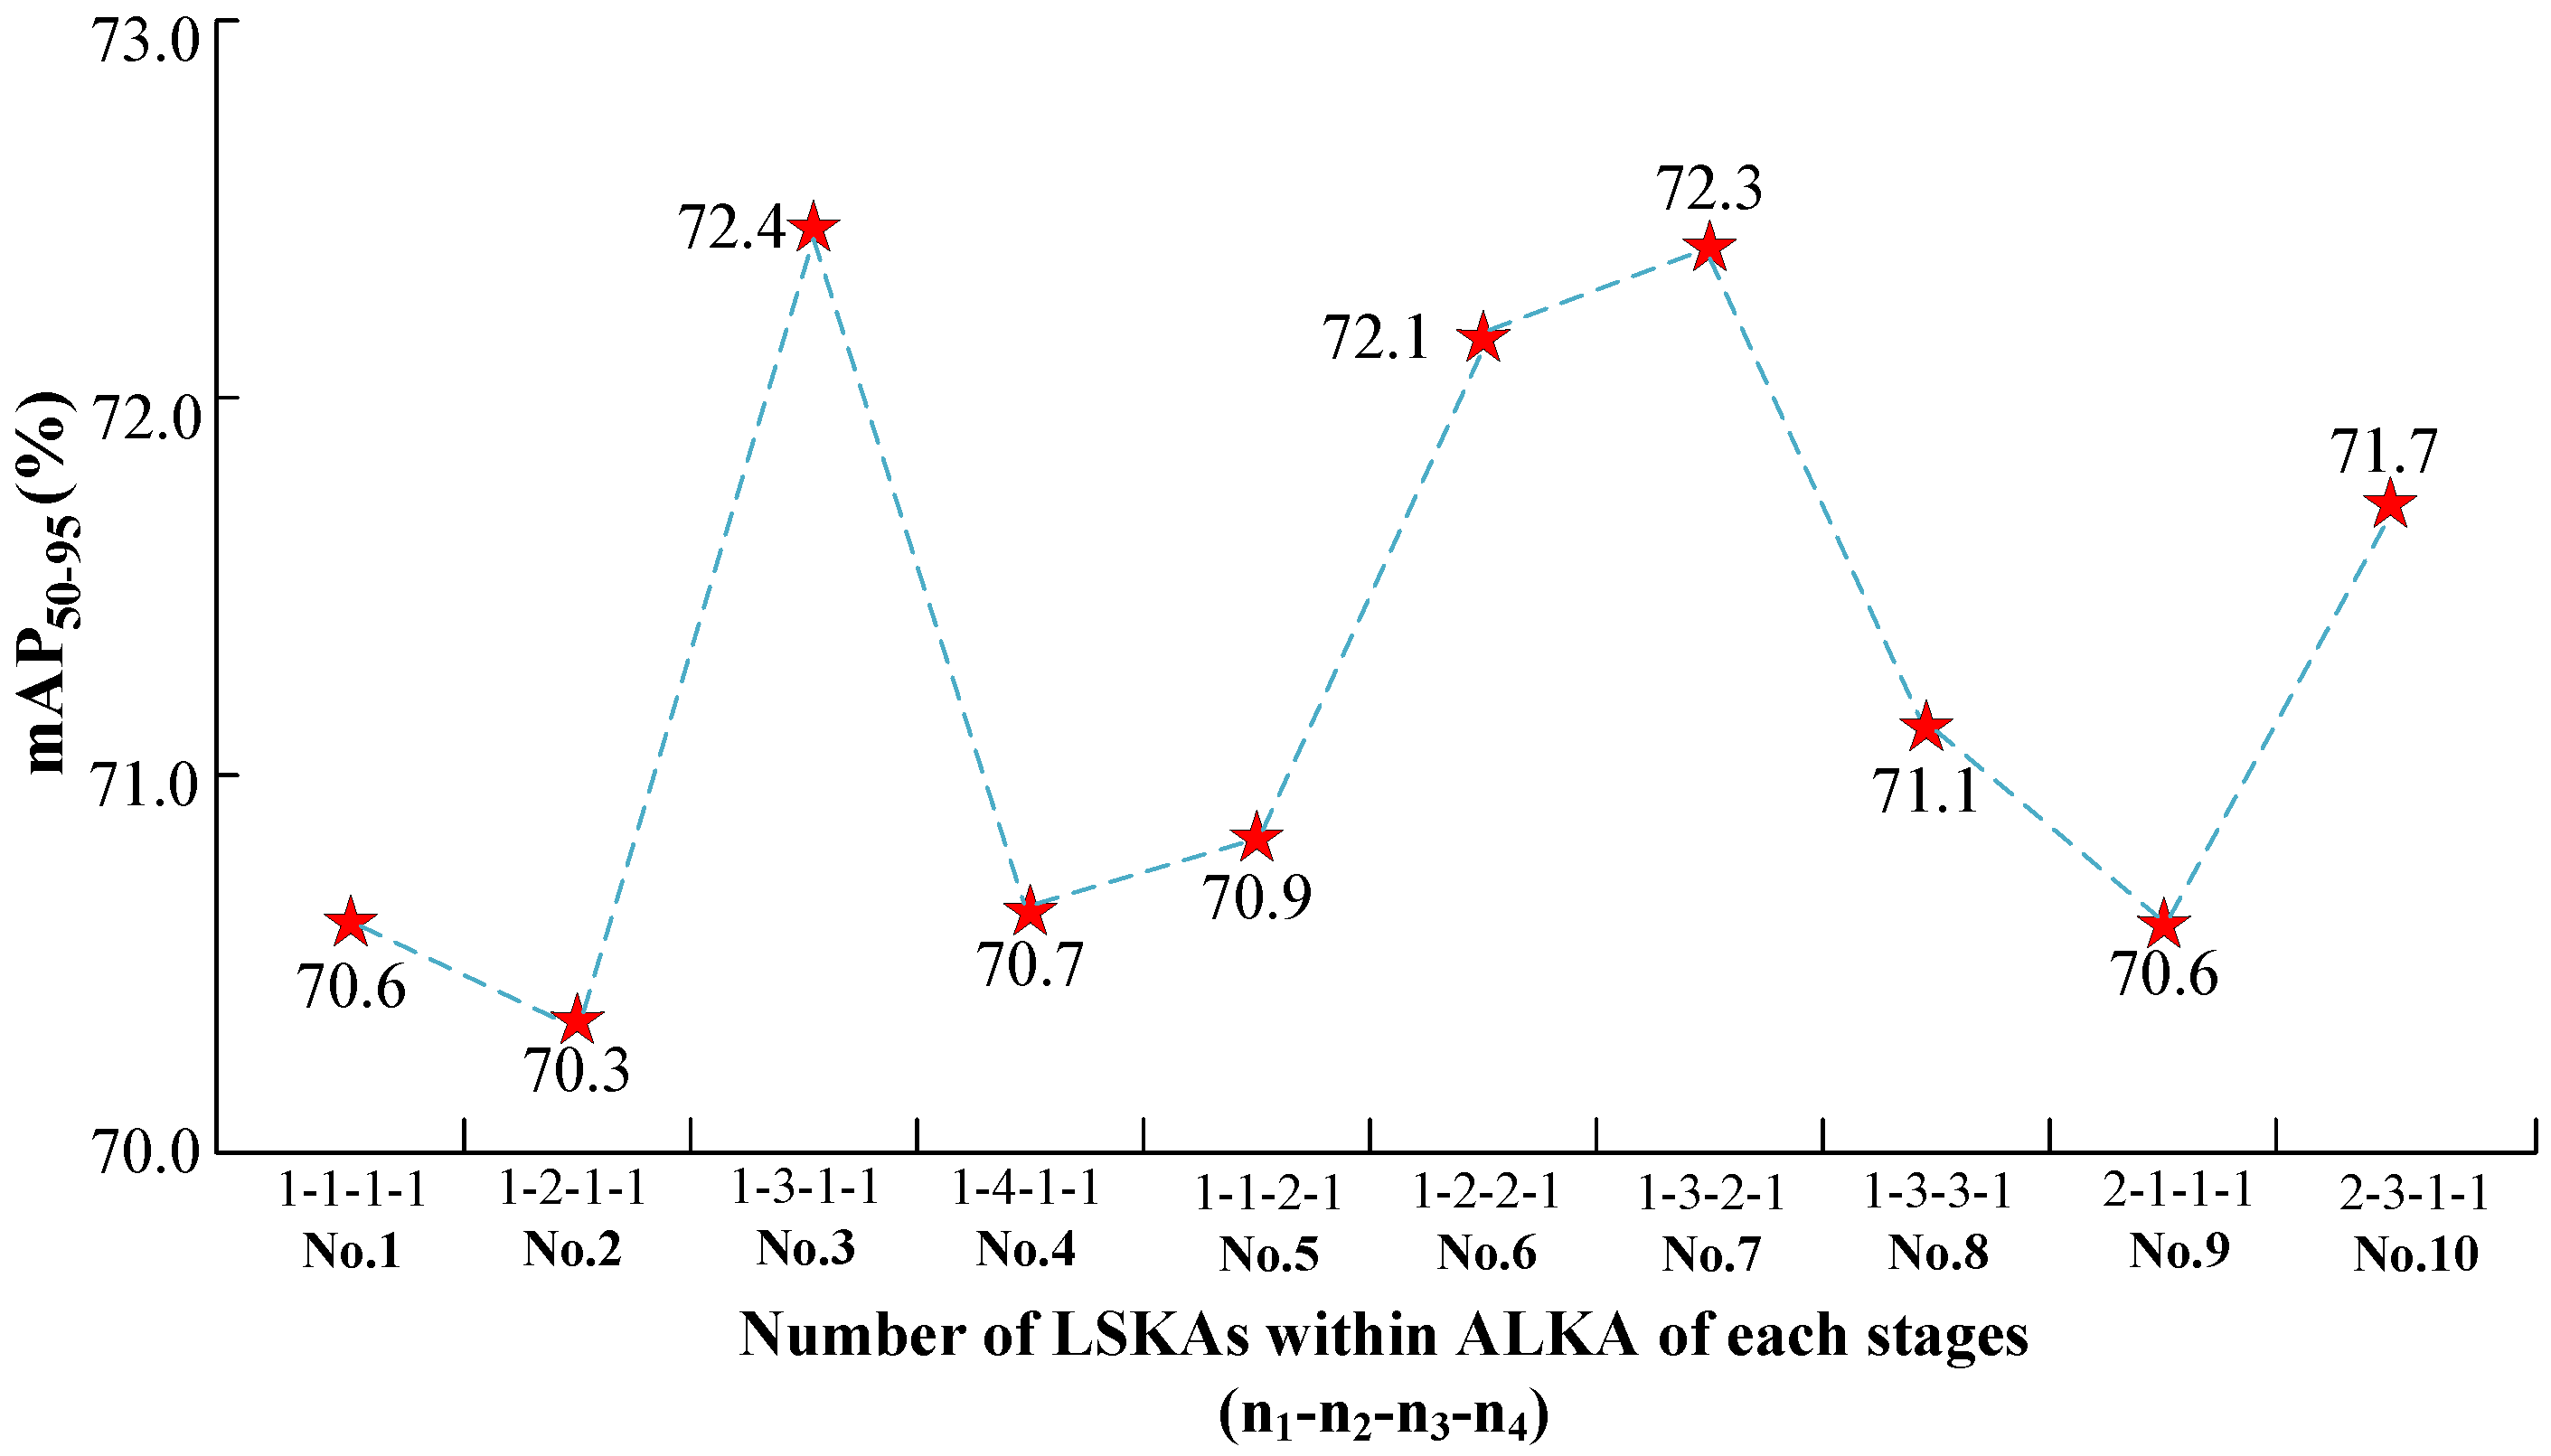
3.4.2. Influence of the Number (n) of LSKAs Within the ALKA of Each Stages
Then, this paper investigates the effect of the number of LSKAs within the ALKA block. As depicted in
Figure 4, increasing the number of LSKAs (denoted as
for each stage) affects feature extraction and model performance. To prevent parameter explosion due to a large increase in
n, control experiments are conducted for Stages 1 to 4. The results indicate that increasing
n in Stage 4 substantially increases parameters without improving performance, so
is set for subsequent experiments.
As illustrated in
Figure 5, increasing
n in Stages 1, 2, or 3 alone or together leads to higher model performance. Using mAP
50–95, the best result is obtained in No. 3, with an improvement of 1.8% over No. 1, 2.1% over No. 2, and 1.7% over No. 4. However, increasing
alone in Stage 3 improves performance slightly, but combining it with the optimal
results in performance declines, with No. 7 and No. 8 showing performance declines of 0.1% and 1.3%, respectively. Further experiments with
show no performance improvement in No. 9 and a performance decline of 0.7% in No. 10, so
will not be further considered. These results highlight that Stage 2 plays the most crucial role in extracting features and capturing global information for AJANet with YOLOv8n. Increasing
n in later stages leads to redundant information and lower performance. Notably, No. 3 performs the best on SSDD (72.4%), but No. 6, the default setting, outperforms it on HRSID.
To sum up, increasing the number of LSKAs for a given stage improves model performance by obtaining more detailed contextual insights, making the model more proficient in distinguishing foreground from background in SAR ship images. However, excessive LSKAs can overfit the model and decrease performance due to redundant information. Thus, the configuration was adopted as it maintains an equilibrium between capturing contextual details and minimizing redundancy.
3.4.3. The Role of Adaptation in ALKA
ALKA introduces ALKS in the large kernel attention module, which dynamically adjusts the large kernel size for convolution and the parameters of the depth convolution and cavity convolution after the large kernel decomposition according to the size of the input feature maps. This ensures that the model has the best ability to obtain contexts of feature maps of different sizes. To this end, as listed in
Table 2, a series of additional experiments were further designed to evaluate the impact of the adaptation mechanism of LSKA on the model.
Here, the conventional small kernel convolution with K=3 was taken as a control group. When no adaption mechanism was introduced and the convolution kernel of all layers of ALKA was uniformly and unconditionally replaced with the same large kernel, the overall performance of the model was better than that of the control group only when , and the model performance gradually decreased as the value of K increased. When , the mAP50 decreased by 0.7% and the mAP50–95 decreased by 1.3% compared to that of , and, when , the model’s mAP50 and mAP50–95 decreased further by 0.6% and 3.2%, respectively. At this time, the adaption mechanism of ALKA was introduced so that the model dynamically selected the large kernel size according to the input feature map size, and it was noted that the model performance was significantly improved, with the mAP50 and mAP50–95 improving to 97.9% and 72.4%, which are 0.4% and 2.1% higher than that of the control group, respectively.
These experimental results emphasize the importance of embedding ALKS in ALKA, as proposed in this paper. By dynamically adjusting the size of large kernels in different layers based on the input feature map size, adaptively enhancing the contextual information aggregation ability across layers enables AJANet to outperform other convolutional schemes. Meanwhile, this side steps the fact that the size of the convolutional kernel should not be enlarged at all, and the receptive field of the kernel needs to be adapted to the size of the processed feature map, as well as the object size. Overall, the shallow network adopts a large kernel with K = 15 or 23 to capture the global context, while the deep network processes the obtained contextual information in detail through dense convolution with a small kernel with K = 3 or 5. This maintains the ability of large kernel convolution to capture image context without losing the local information extraction advantage of small kernel convolution.
3.4.4. The Role of Adaptation in ACA
In a similar way to validating the adaptation mechanism in ALKA, a series of experiments was designed to validate the importance of the adaptation mechanism in ACA, as listed in
Table 3, where
is the standard convolution kernel size that can be taken by the baseline. Meanwhile, as Equation (
2) shows, the following can be observed as
changes.
When , larger kernel values will result in overfitting of the model to some extent. As increases, the model performance gradually improves, which is almost the same as that of and 4, and the model achieves its peak performance when = 5, at which time the mAP50 and mAP50–95 of the model reaches 97.9% and 72.4%, respectively. At this point, the model performance does not grow with . As increases, ACA’s channel convolution kernel size shrinks to a critical point, after which the model performance does not grow with .
These results clearly indicate that the adaptation mechanism greatly enhances the performance of the model, improving the extraction and integration of feature map information by flexibly adjusting the receptive field. Also, it implies that, in smaller networks, smaller channel convolution kernels help avoid overfitting, and localized channel dependencies are more important.
3.4.5. Applicability to Different YOLO Variants
To evaluate the generalizability and stability of the proposed model, the AJA integrating ACA and ALKA is applied to various YOLO models: YOLOv8s, YOLOv11n, YOLOv11s, YOLOv12n, and YOLOv12s. The experimental results, as presented in
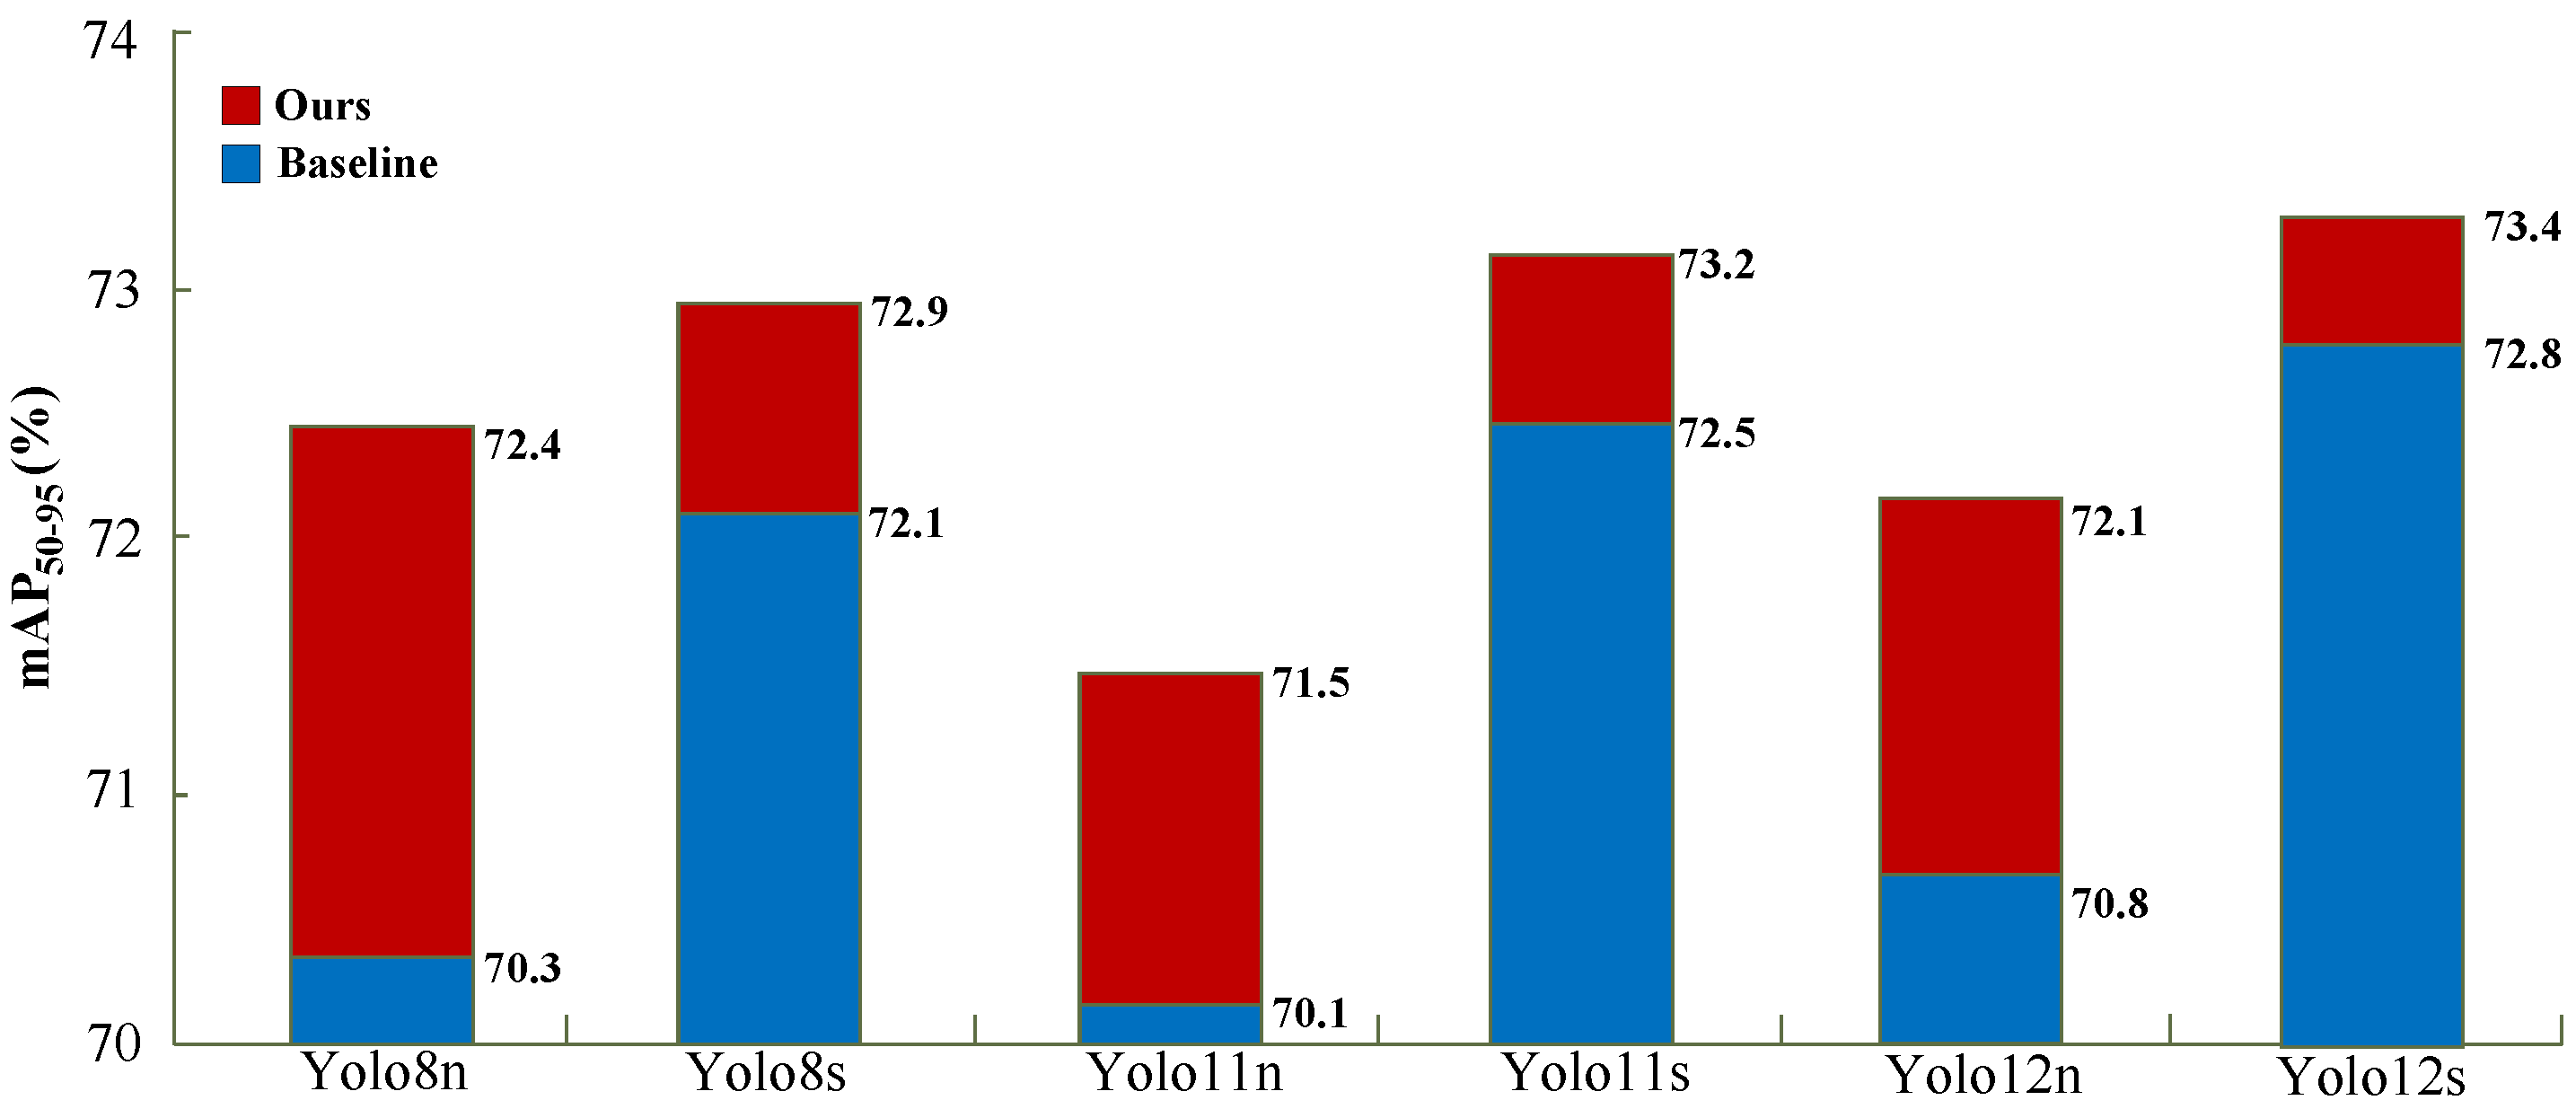
Figure 6, demonstrate the positive impact of AJA on model performance.
Incorporating AJA consistently improved the mAP50–95 across all YOLO variants. For YOLOv8n, AJA contributed to a substantial improvement of 2.1%, raising the mAP50–95 from 70.3% to 72.4%. For YOLOv8s, the incorporation of AJA led to a performance improvement of 0.8%, achieving a final mAP50–95 of 72.9%. YOLOv11n exhibited a more significant performance gain of 1.4%, reaching an mAP50–95 of 71.5%. YOLOv11s benefited from a performance increase of 0.7%, reaching an mAP50–95 of 73.2%. While the gain for YOLOv11s was smaller than that for YOLOv11n, it still marked a notable improvement. Similarly, YOLOv12n showed an increase of 1.3%, with mAP50–95 rising from 70.8% to 72.1%. YOLOv12s achieved the highest overall accuracy among all variants, with AJA pushing the mAP50–95 from 72.8% to 73.4%. These consistent gains across different model scales highlight the generalizability and effectiveness of the proposed AJA mechanism.
These results confirm that AJA improves YOLOv8n and other YOLO models, demonstrating its versatility. The consistent improvements across different YOLO architectures validate AJA’s utility as a valuable tool for enhancing ship inspection accuracy, further emphasizing the adaptability of the proposed method.
3.5. Comparison with SOTA Methods
3.5.1. Comparisons on SSDD
Table 4 summarizes the experimental results on SSDD, highlighting the performance of AJANet compared to other models. Since the experiments were conducted on YOLOv8n in a low-parameter environment, the metrics achieved by AJANet with this as a baseline were not as high as the improved model with a baseline on a larger-scale network, such as YOLOv8s. Even so, our improvements on a small model exhibited the highest performance gains. On SSDD, it achieved an mAP
50–95 of 72.4% and an impressive mAP
50 of 97.9%, even exceeding the performance of quite a few larger models developed in the last two years.
3.5.2. Comparisons on HRSID
Similar to SSDD, our experiments were continued on HRSID with the following results. As presented in
Table 5, but unlike the experiments on SSDD, the experiments on HRSID adopted a larger baseline: YOLOv8s. AJANet performed particularly well with an mAP
50 of 92.1%, and the mAP
50–95 was 69.3%, which was basically on par with the SOTA in recent years. The mAP
50–95 metric of AJANet on HRSID was improved by 3.2% compared to SRDet [
37] and 0.4% compared to AMANet [
26], showing that AJANet exhibited excellent performance on both attention and multi-scale.
3.6. Visualization
Figure 7 and
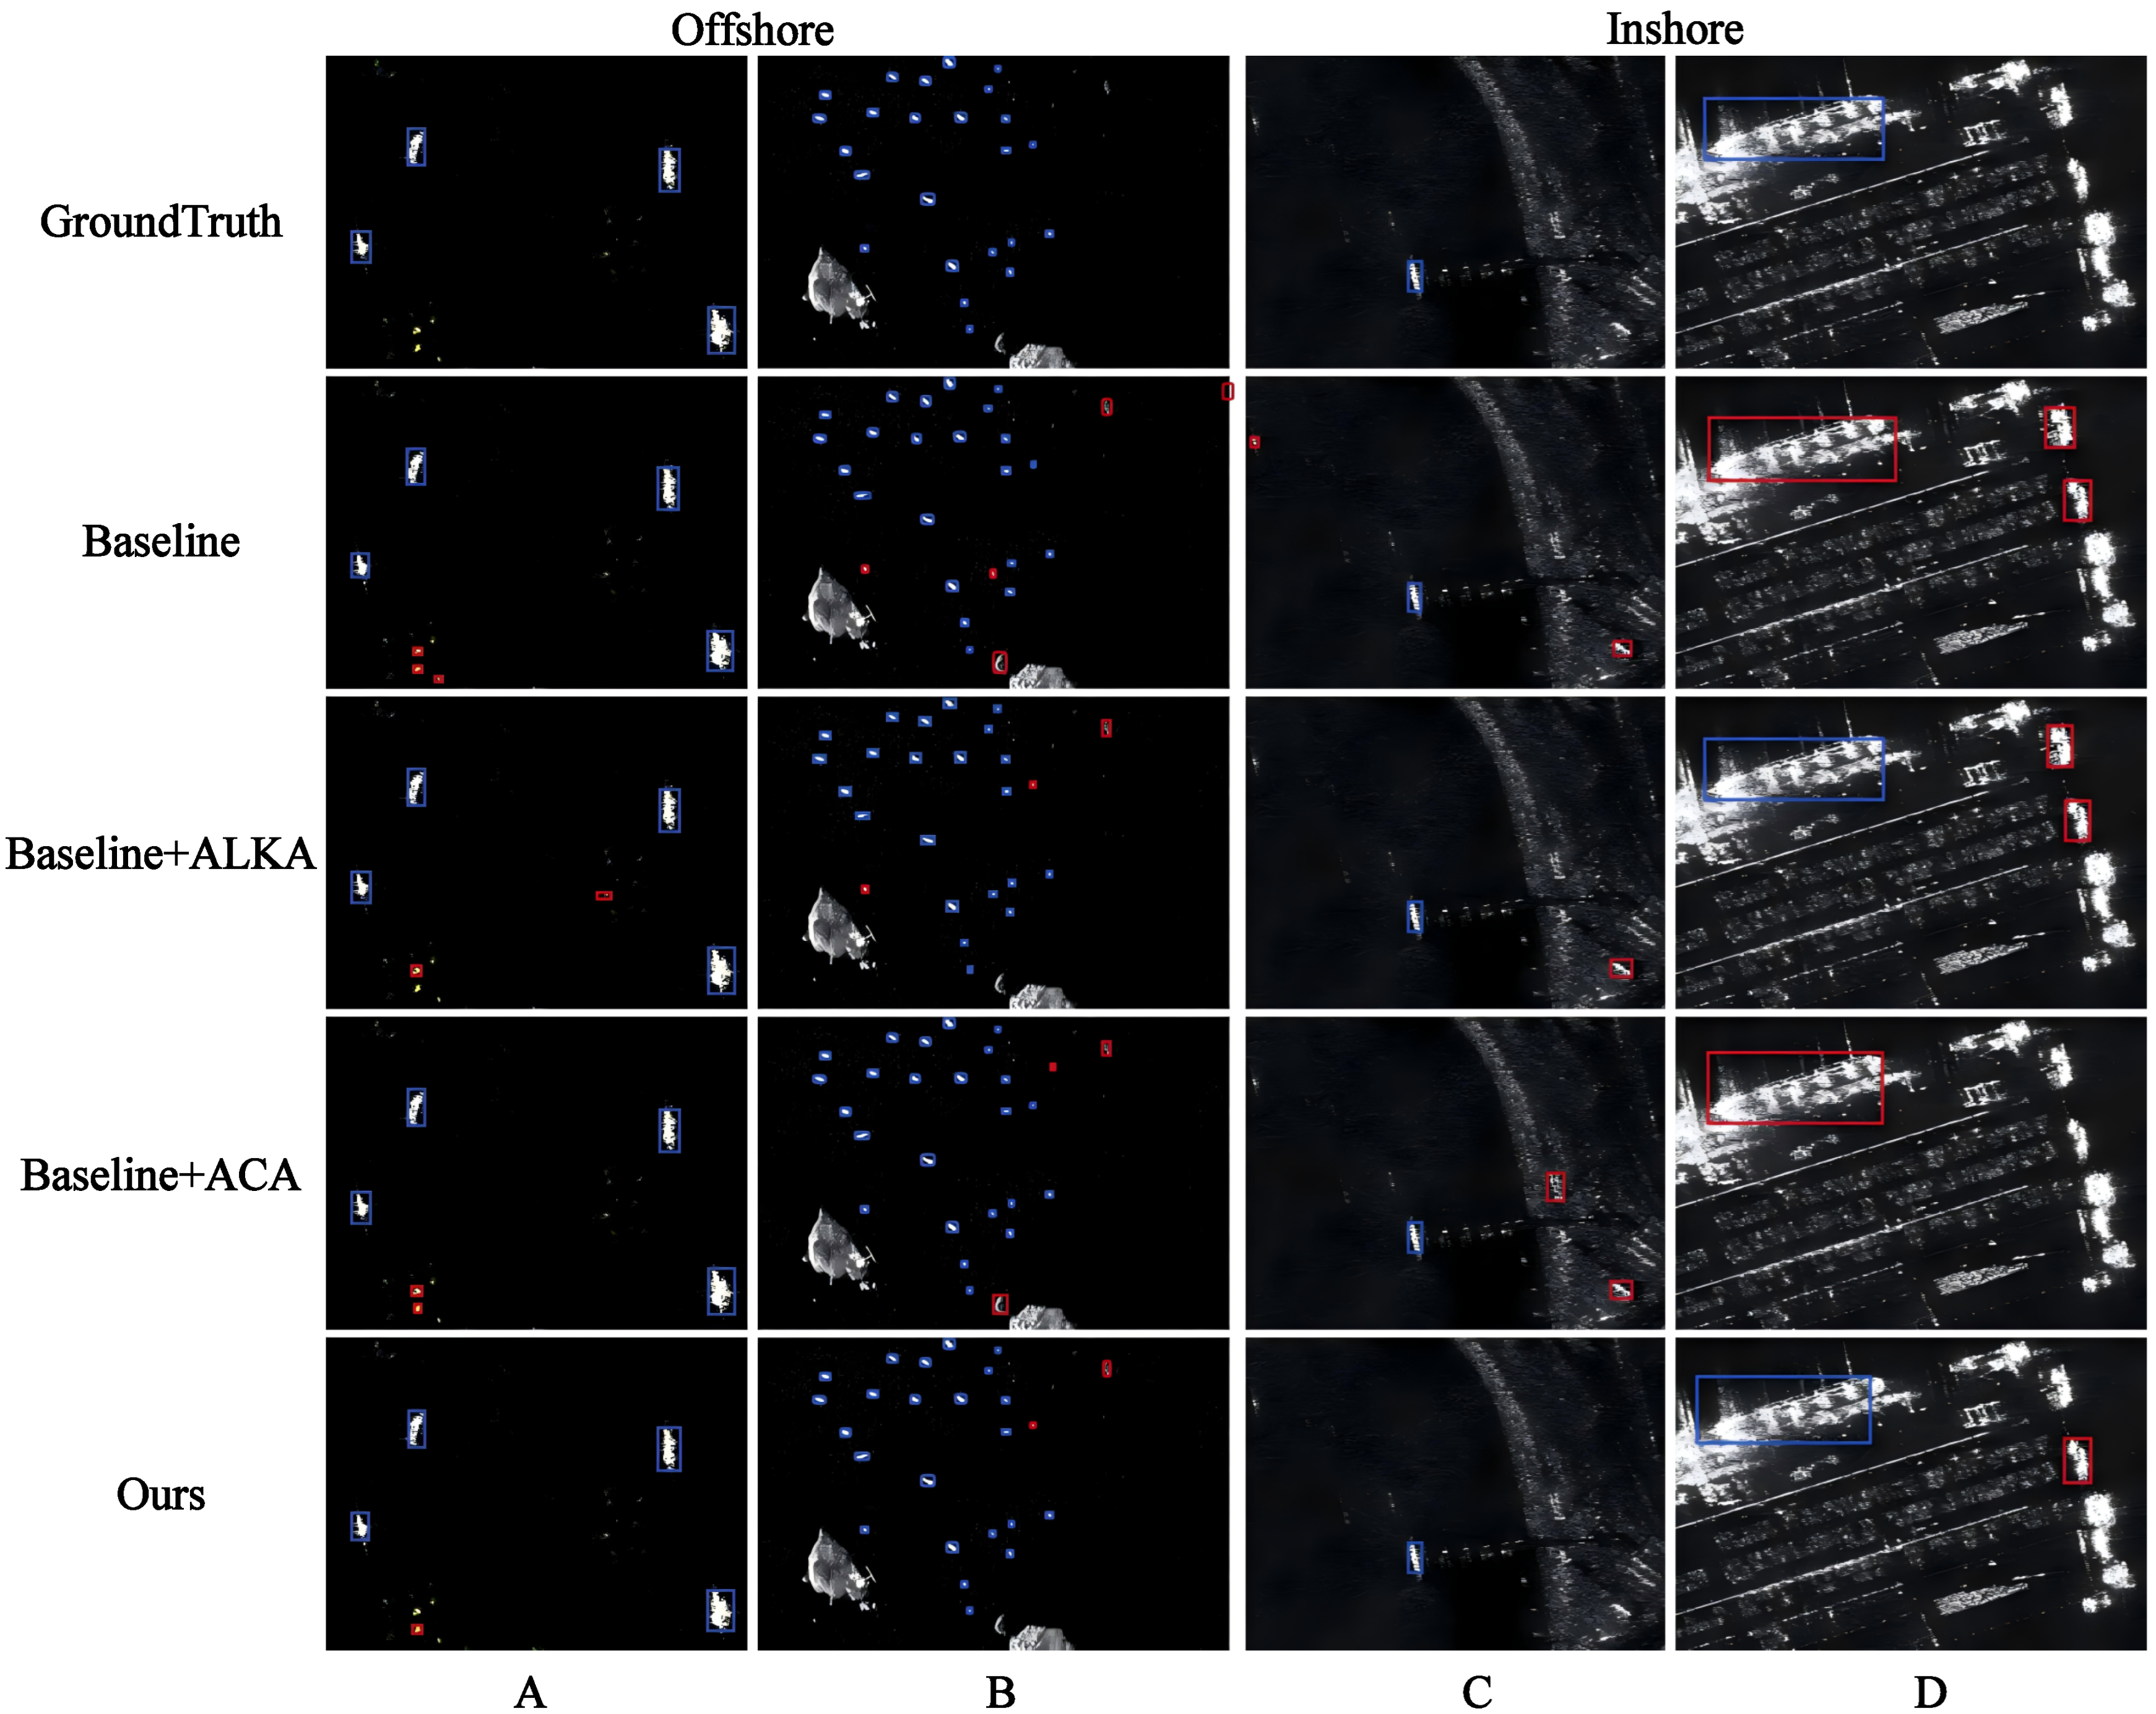
Figure 8 present the results in a visual format, showcasing the performance improvements brought by AJANet.
Figure 7 shows the performance improvement achieved by the module designed in this paper after integrating it into the baseline, where the initial two images are SAR images featuring small ship objects in nearshore conditions. As indicated by the red rectangles, the results of the baseline YOLOv8n showed incorrect detection of small ship objects. Specifically, as shown in
Figure 7A, the baseline model showed three false positives and two misdetections for two ablation experimental models, while AJANet showed only one; as shown in
Figure 7B, the baseline showed three false positives and two false negatives, and it even misdetected both the edge of the image and the island as objects. The ablation model without ACA demonstrated more false detections of small objects, and the ablation model without ALKA misdetected the island as an object compared to AJANet, which only showed one false positive and one false negative, exhibiting a more stable performance in far-shore multi-object detection. Similarly, in the third image, YOLOv8 misdetected the background elements in the coast and ocean with similar scattering properties to ships as ship objects, and the remaining two ablation models made similar mistakes. In comparison, AJANet still maintained a high level of agreement with the ground truth, showing its superior performance in accurately detecting small objects in complex backgrounds. The fourth image is a SAR image of an offshore scene containing a large object and a background filled with massive interfering elements. This is demonstrated in
Figure 8. As shown in
Figure 7D, the baseline YOLOv8 struggled with missed detections and false positives, which exposed its limitations. The ablation model without ACA detected the only large object in
Figure 7C, and it showed more misdetections; the ablation model without ALKA showed no misdetections but missed the only object. In contrast, AJANet was more accurate in its detection results and could accurately localize large objects in the image despite false positives. This suggests that AJANet has fewer false positives and missed detections.
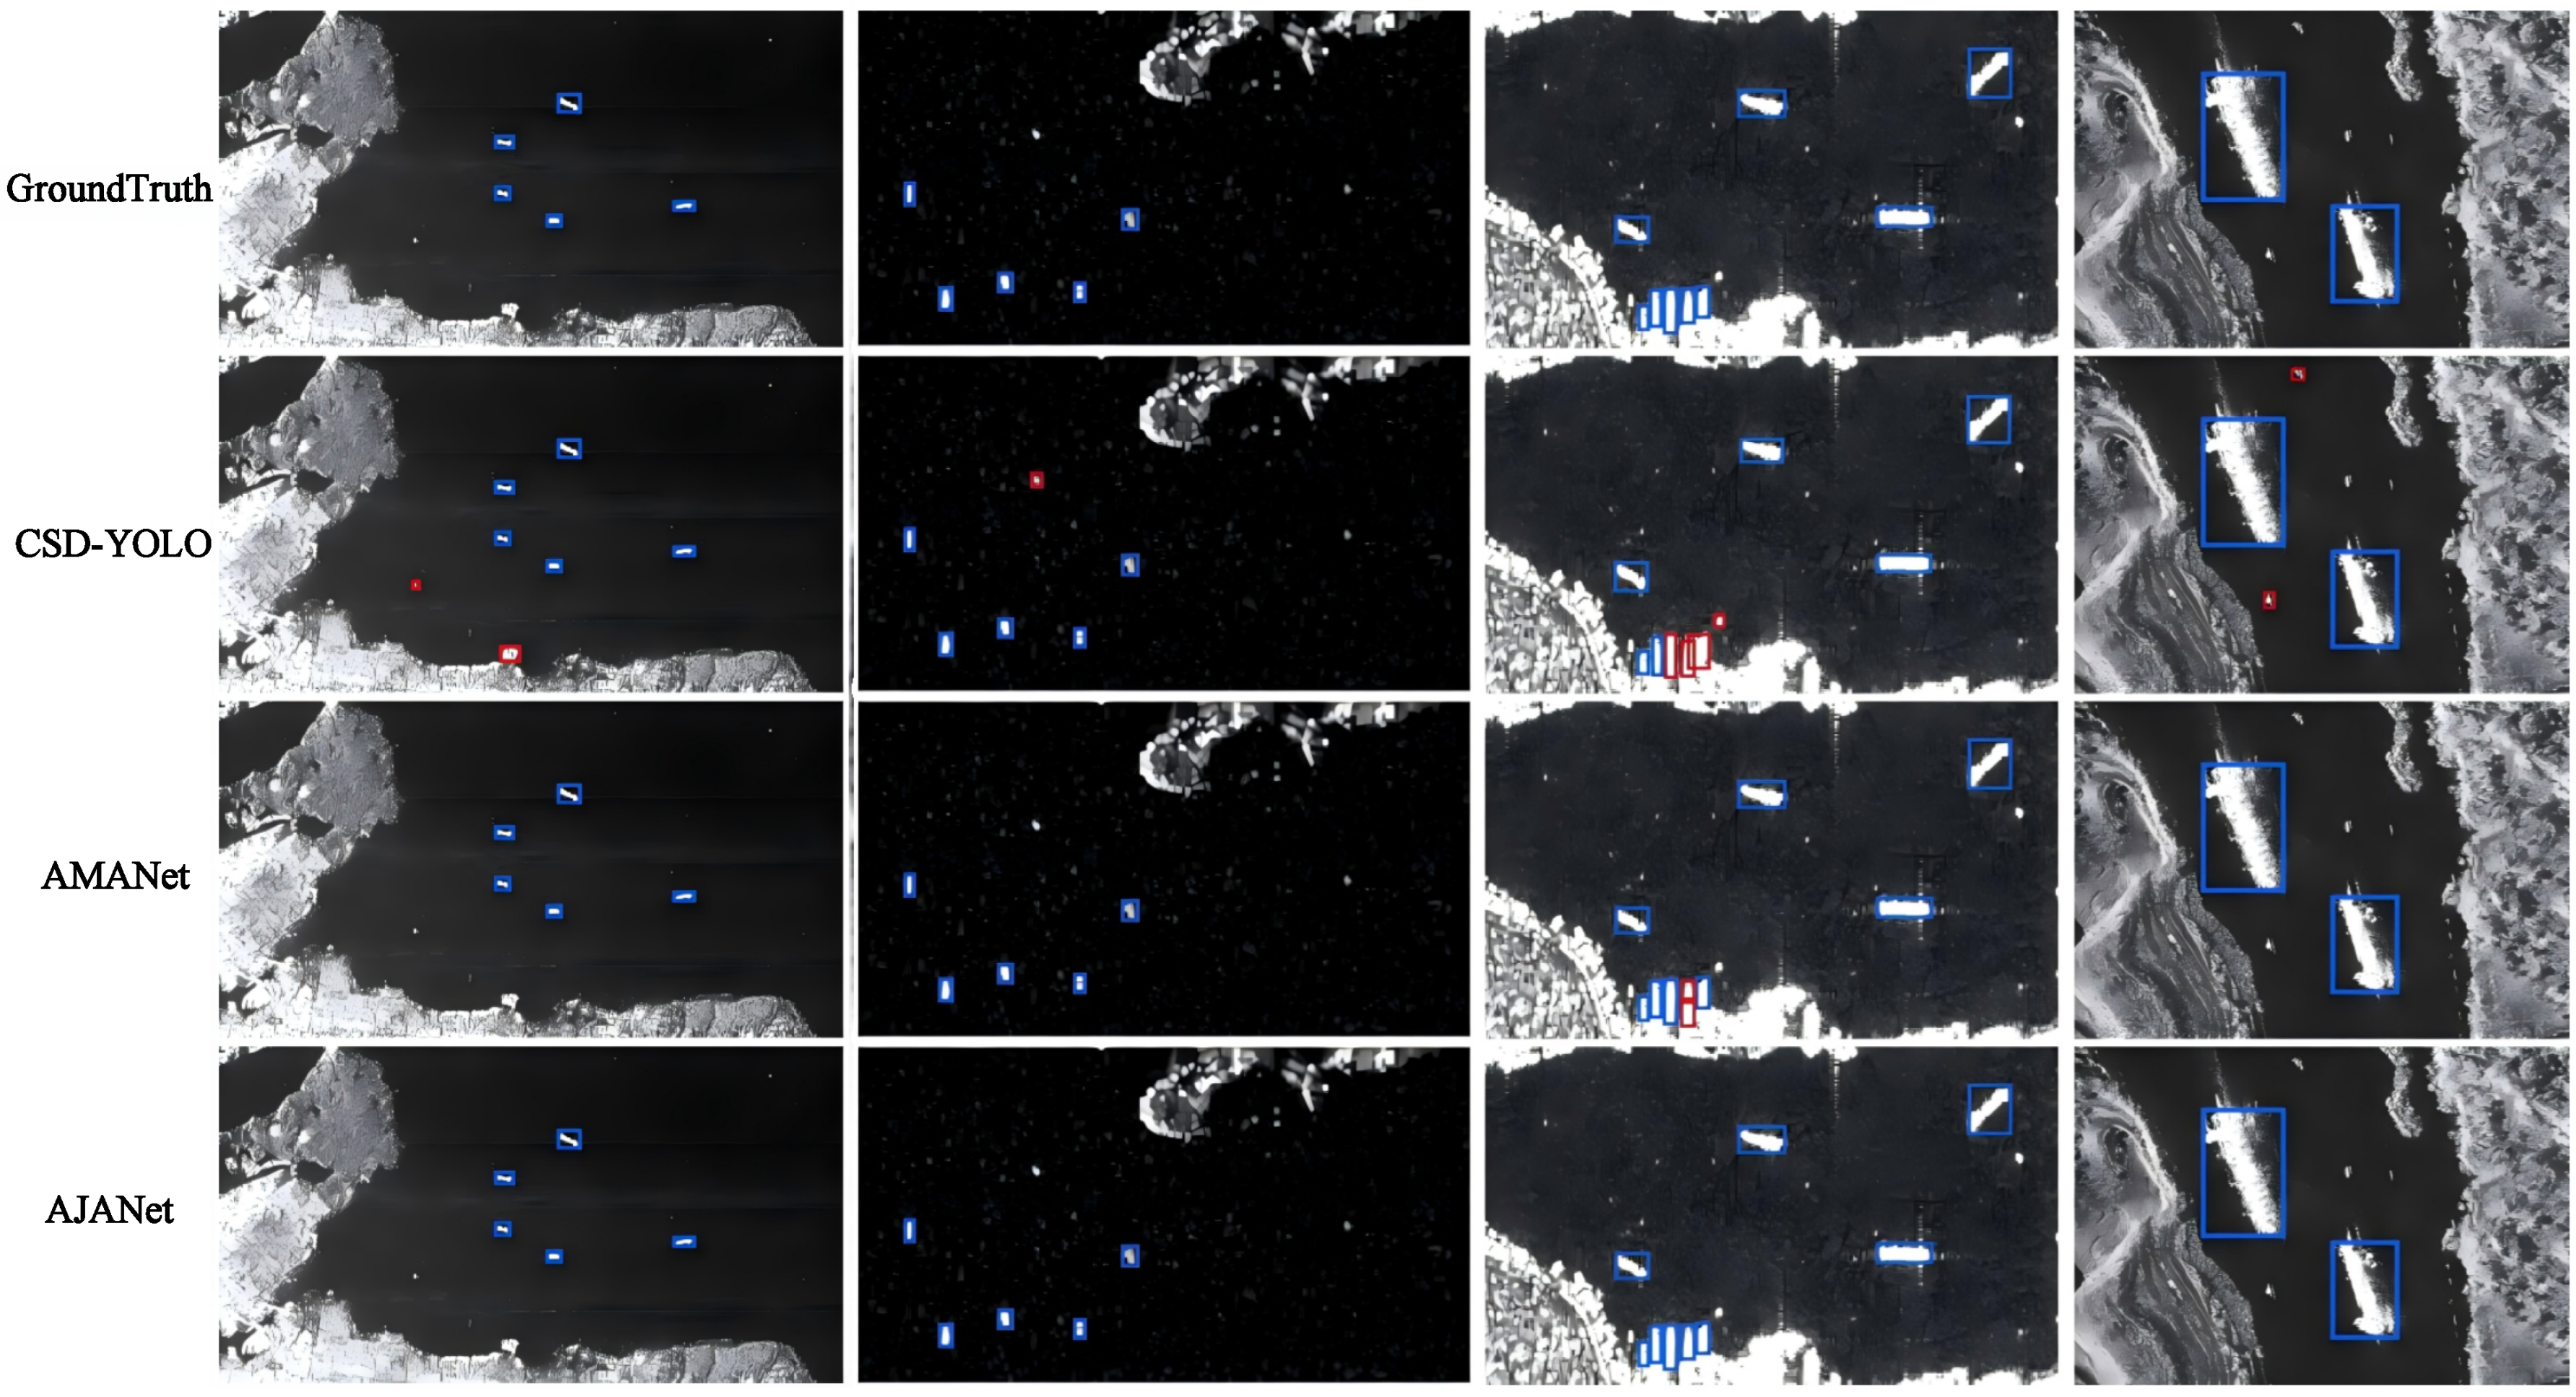
At this point, as shown in
Figure 8, it can be seen that AJANet still achieved the top performance even compared with existing cutting-edge detection methods. In particular, in inshore dense object detection (the comparison chart is the third column), AJANet maintained agreement with the ground truth when the other methods generally produced false positives and false negatives.
These visualizations reflect the exceptional performance of AJANet for ship inspection. By strategically integrating ACA and ALKA blocks, AJANet achieved higher accuracy and robustness. It successfully identified small ship objects in complex inshore conditions and performed better than the baseline and existing methods. The visualized results provide a straightforward and clear depiction of the model’s performance, supporting the experimental findings and demonstrating AJANet’s practical utility in real-world ship detection.
4. Discussion
The above has provided exhaustive ablation and detailed the control experiments that were conducted on the interactions and internal parameters of the core modules of AJANet, and it has also compared AJANet with various cutting-edge methods to demonstrate its superiority. Even so, some limitations of the modules and the transferability of qua-tasks are still worth discussing.
4.1. Adaptability to Specific Tasks
In this paper, two representative tasks, ship detection within optical remote sensing images and ship detection within large remote sensing SAR images, were selected to investigate the robustness of AJANet under similar tasks.
4.1.1. Ship Detection Within Optical Remote Sensing Images
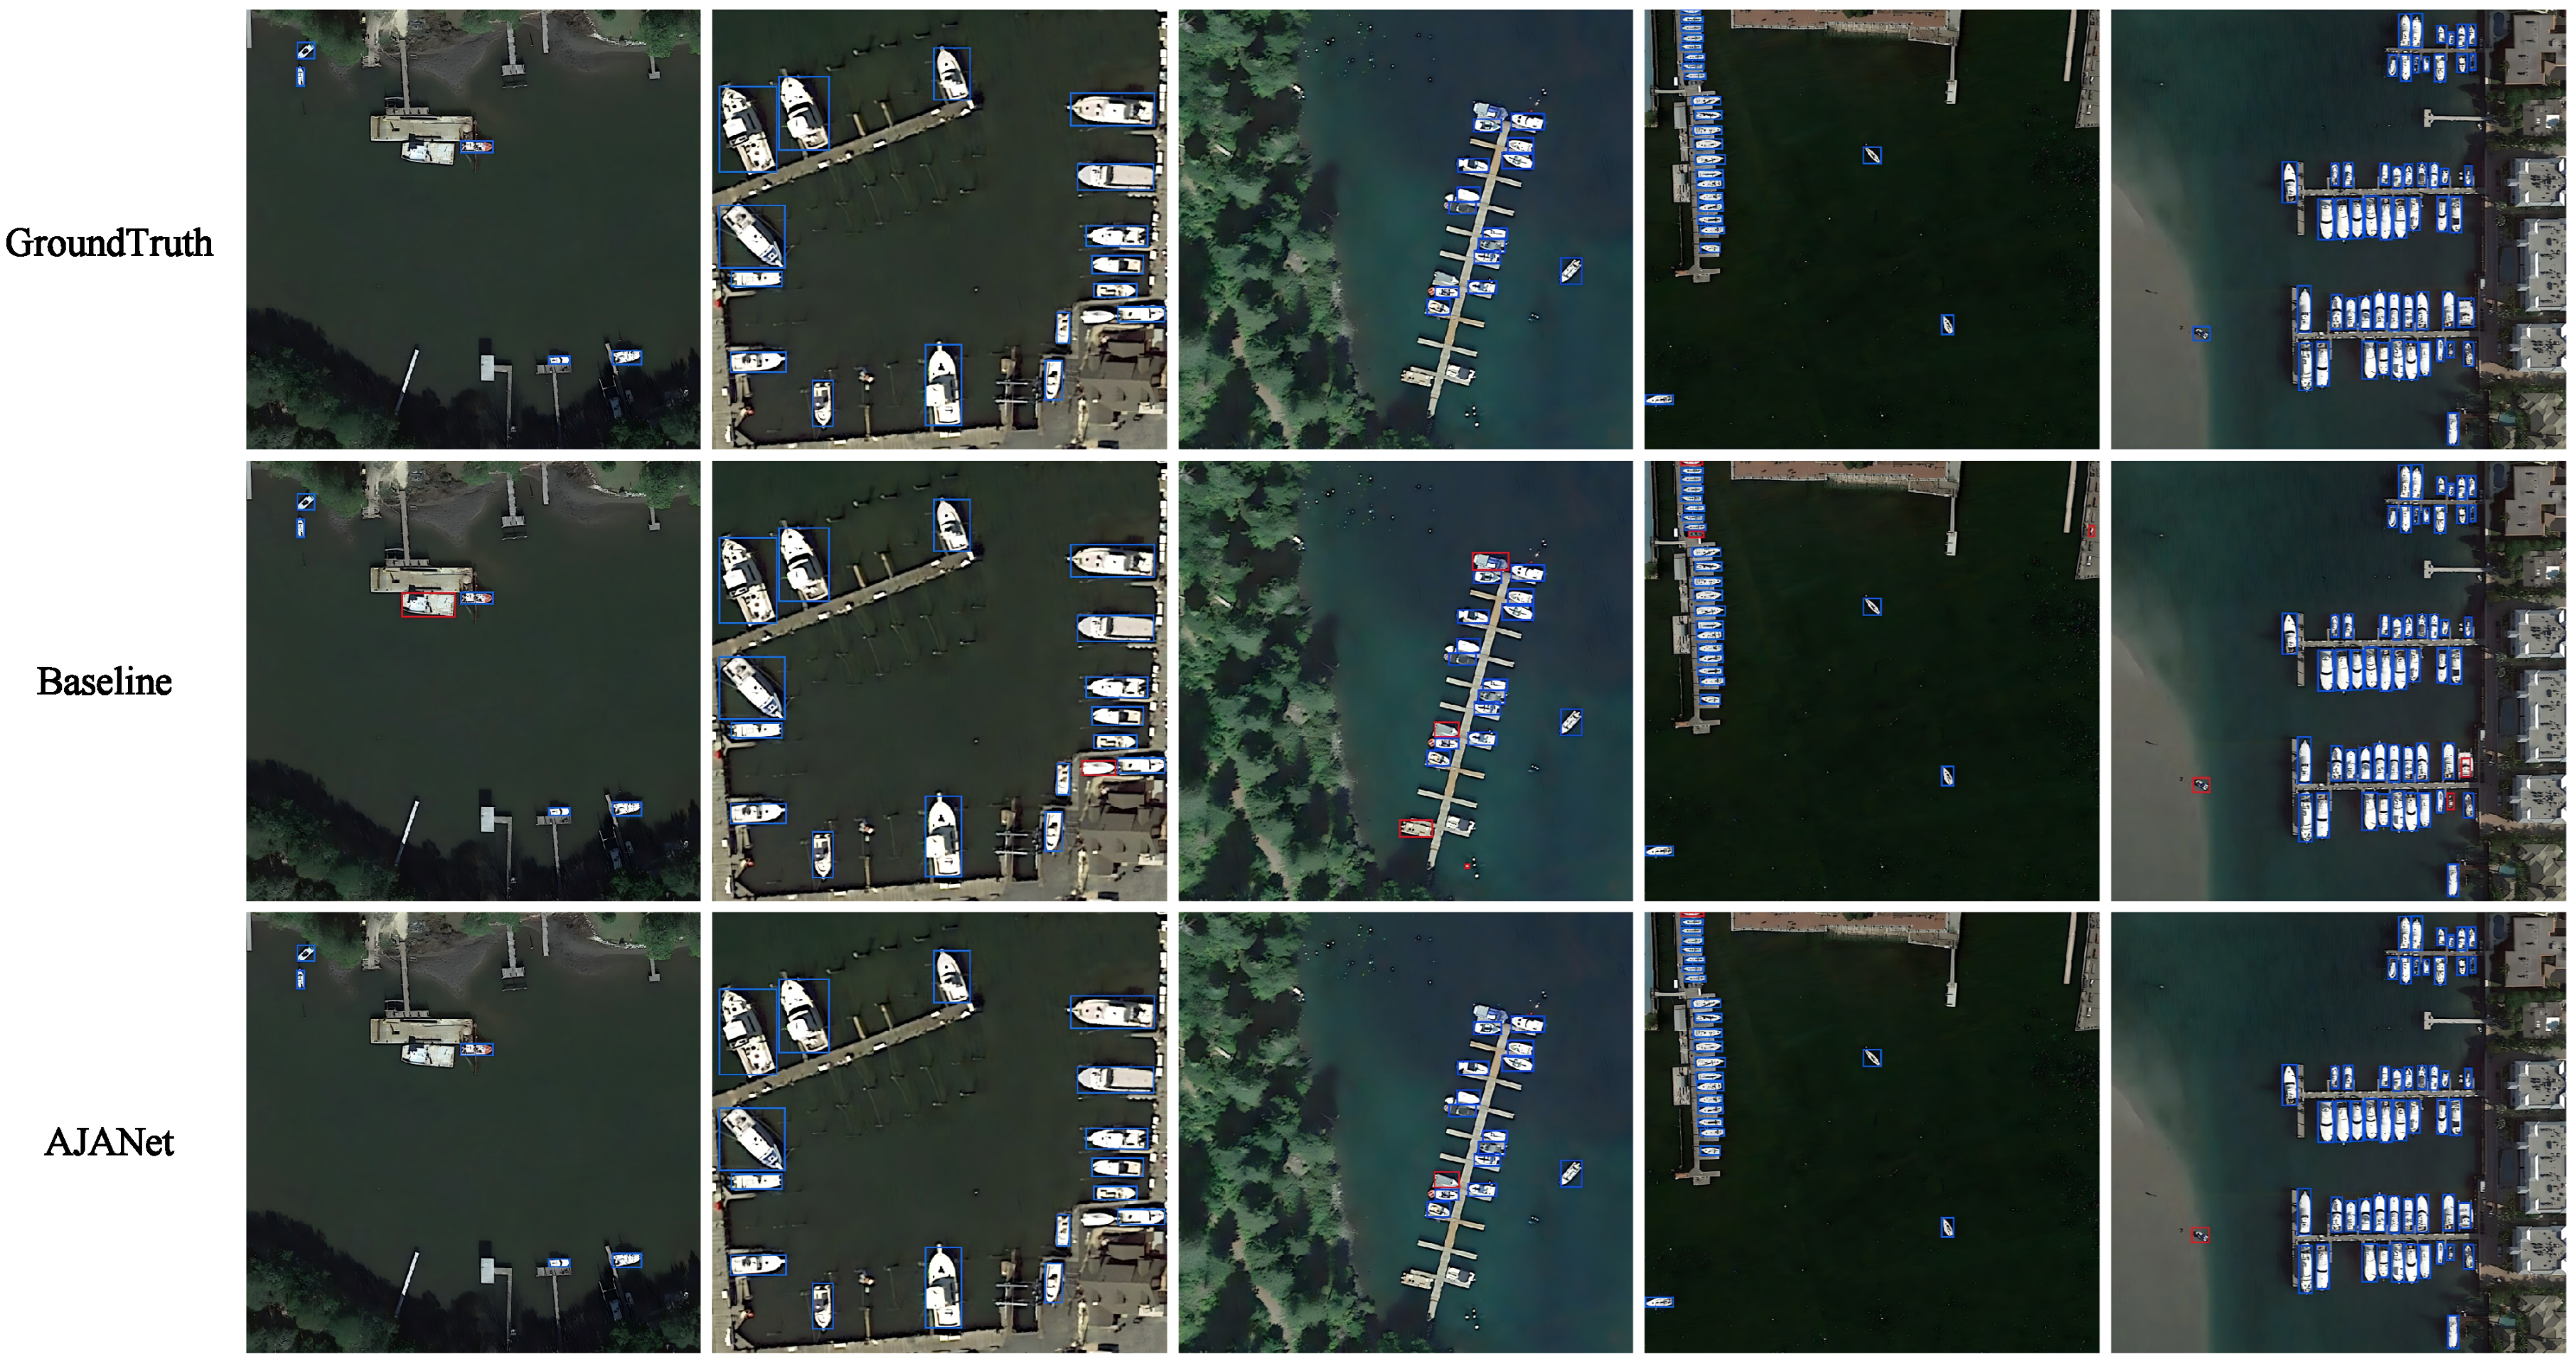
In detailed in this section, the DIOR dataset was selected as the test dataset, the optimal model from the results section was used, the baseline model was taken as the control group, and the dataset division was consistent with HRSID. The following shows the detection results with only the object of “ships” and the corresponding visualizations.
As listed in
Table 6 and
Figure 9, AJANet still achieved better detection performance in optical remote sensing for the object “ship” than the baseline, but the performance improvement was not as much as that of SAR; also, AJANet showed fewer false positives and false negatives in the actual test, indicating that the AJA module has a certain degree of universality in optical remote sensing.
4.1.2. Ship Detection Within Large Remote Sensing SAR Images
In this section, this paper takes RSDD-SAR, an open-source SAR large-image dataset for ship detection, as a test dataset to determine whether the best model obtained in the results section is robust in detecting objects in very large images. The original data of RSDD-SAR consist of 84 views of Gaofen-3 data, 41 views of TerraSAR-X data slices, and 2 views of uncropped large images, i.e., a total of 127 views of data. Given the object detector layer constructed in this paper and considering that the number of shallow parameters was relatively small, it failed to support the direct input and detection of more than 10,000 × 10,000 large images, so this paper used even cropped small images to simulate the effect of detecting large images. The following shows the detection results of our method and the baseline in inshore conditions.
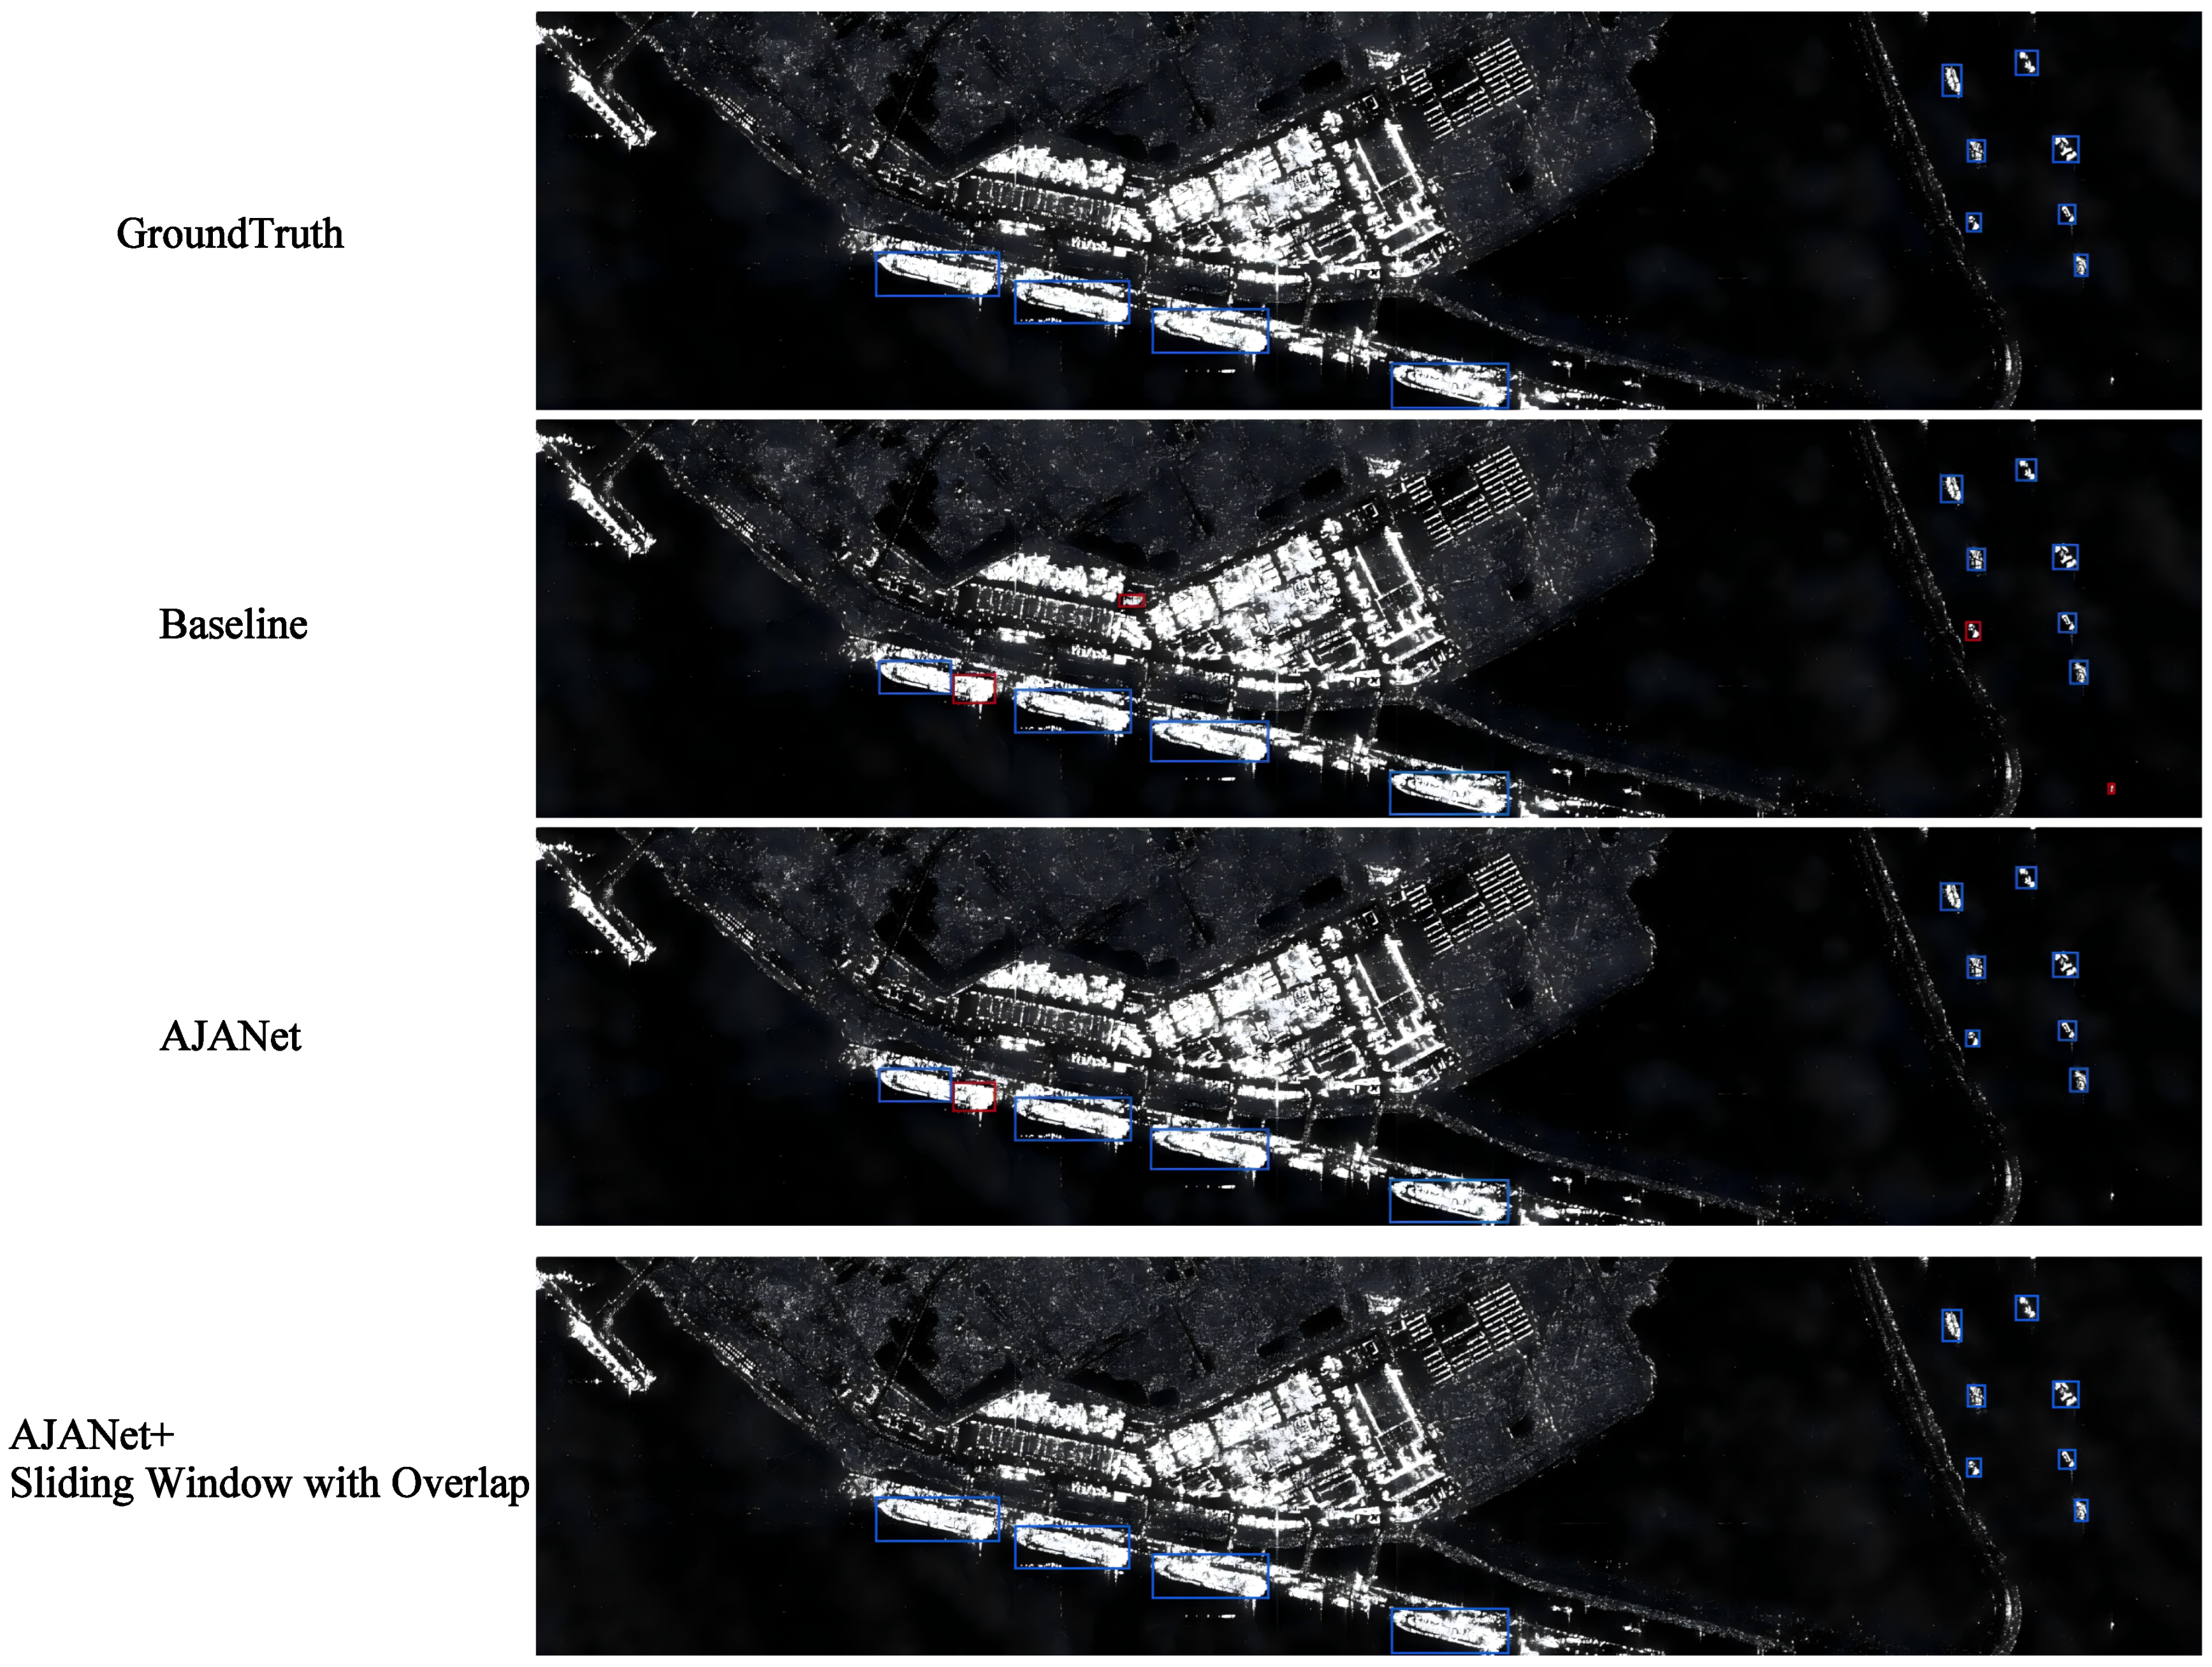
As shown in
Figure 10, AJANet still performed well in large-image detection by eliminating the cases where objects were scattered in multiple slices due to the tile operation, which, in turn, led to incomplete detection. To address the adverse effects of the above problems in large-image detection, the following solutions were used: (1) Sliding window with overlap—in the slicing process, each slice has some overlapping area with its neighboring slices. This ensures that a portion of the object on the boundary of the slice is not lost. (2) Padding—during slicing, a certain “padding area” or “boundary buffer” is added around each slice. This buffer comes from the contents of neighboring slices, thus ensuring that even if the object crosses the boundary, a part of it is still contained in the buffer. (3) Context-aware detection—in the post merge, the results of neighboring slices are combined with their context information to better detect cross-slice objects. (4) Tile merging and linking—during detection, image splicing techniques (e.g., using coordinate information of the image) are employed to link object frames in neighboring slices to avoid objects from being incorrectly segmented due to slice boundaries.
In this paper, the simplest method, i.e., a sliding window with overlap, was used to preprocess the source data, and the final detection results are illustrated in
Figure 10. It can be observed that AJANet can be applied to ship detection within an ultra-large SAR image as long as it is combined with a proper method.
4.2. The Limitations of Modules
At present, AJANet still has several limitations, not only in terms of maladaptation when oriented to tasks with special conditions (e.g., difficulty in detecting objects at the edges of slices in ultra-large images), but also internally. Furthermore, , , and bias(b) are constants within the adaptable functions within ACA and ALKA. In this paper, the parameters that are critical to the value of the convolution kernel had been tuned to their optimal values, but, on a different dataset with a different detection task, the optimal parameters may lose their most adaptive properties in new conditions.
Meanwhile, although the added adaptive attention mechanism can improve the unfavorable conditions of SAR ship detection, such as large variations in object scale, fuzzy boundaries, and dense overlapping, the false positives and false negatives due to these conditions are still unavoidable in actual detection.
4.3. Future Improvement Directions
4.3.1. Introducing Segmentation Models into Detection Models
To further reduce potential false positives and false negatives in detection tasks, future work can explore integrating segmentation models into detection frameworks. This approach has several advantages. First, segmentation models provide pixel-level mask information, allowing for more precise delineation of object boundaries and enhancing the localization accuracy of bounding boxes. Second, segmentation networks have a stronger ability to understand the semantic structures of images, which help distinguish objects within complex backgrounds, especially for small or densely packed objects. The contextual information captured by segmentation models can further assist the detector in differentiating objects from background clutter. Third, many SOTA segmentation networks adopt multi-scale Transformer architectures, which are good at modeling spatial relationships across large, medium, and small objects, thereby improving multi-scale detection performance. In addition, advanced segmentation models can improve the global perceptual capability of the network and strengthen its ability to perceive and differentiate multiple objects within complex scenes.
From an implementation perspective, this paper goes beyond traditional methods, such as structural fusion, feature fusion, and post-processing assistance, and it investigates several potential integration strategies. For instance, spatial–semantic features extracted from the intermediate layers of the segmentation network (e.g., attention maps or mask boundaries) can be integrated into the detection module to allow for intermediate-level feature interaction and to improve feature representation. Alternatively, the detection and segmentation models can be designed to use a common backbone network (e.g., Swin Transformer, RepLKNet, etc.), leading to unified feature extraction within a multi-task learning framework. Another possible strategy is to combine the detection bounding boxes with their corresponding segmentation masks, which is followed by refinement of the bounding box positions to enhance both the interpretability and accuracy of the detection results.
4.3.2. Optimal Selection of Constants Within Adaptive Modules
To overcome the challenge that the constants within the adaptive modules (ACA and ALKA) need to be adjusted when the proposed method is applied to different datasets and tasks, this paper outlines two potential improvements. On the one hand, the performance function can be modeled using a Gaussian process or tree-structured Parzen estimator to predict the optimal parameter combinations. On the other hand, constants such as and bias can be introduced as learnable parameters within the network. Nevertheless, this approach necessitates concurrent modification of the main task’s loss function to ensure gradient stability in the training process.
By integrating these strategies, AJANet can be made more robust and adaptable, enabling it to better meet the demands of object detection in a larger range of computer vision tasks.


