Article

Impacts of Climate Change and Human Activities on Vegetation Productivity in China

1
School of Ecology and Nature Conservation, Beijing Forestry University, Beijing 100083, China
2
Key Laboratory of Water Cycle and Related Land Surface Processes, Institute of Geographic Sciences and Natural Resources Research, Chinese Academy of Sciences, Beijing 100101, China
*
Author to whom correspondence should be addressed.
Remote Sens. 2025, 17(10), 1724; https://doi.org/10.3390/rs17101724
Submission received: 4 March 2025 / Revised: 26 April 2025 / Accepted: 1 May 2025 / Published: 15 May 2025

Abstract

:
Vegetation plays an important role in carbon sequestration in terrestrial ecosystems and is affected by climate change and human activities. As a major factor affecting vegetation growth, the role of soil moisture in the impacts of climate change on vegetation is not well understood. Therefore, the effects of climate change on net primary productivity (NPP) may be underestimated. In this study, we analyzed the spatial distribution of NPP and land use degree comprehensive index (LDCI) in China from 2001 to 2020. The actual and relative contributions of climate change and human activities to NPP variation were explored. The findings indicated that NPP trended upward in 73.12%, 66.78%, and 81.34% of woodland, grassland, and cropland areas, respectively. Most of the woodland and grassland showed a decreasing trend in LDCI, while 48.63% of the cropland showed an increasing trend. The positive joint effects of climate change and human activities increased the NPP of woodlands, grasslands, and croplands by 42.83%, 53.49%, and 45.22%, respectively. Human activities (55.04%) contributed more to NPP than did climate change (44.96%). Analyzing the response of NPP (woodlands, grasslands, and croplands) to climate change and human activities in China is conducive to taking more targeted measures for different land use types to increase carbon sinks in terrestrial ecosystems.

1. Introduction

In terrestrial ecosystems, vegetation affects both biotic and abiotic carbon fixation and storage. The sum of carbon fixed by vegetation (excluding carbon released by respiration) in the atmosphere is net primary productivity (NPP), which indicates vegetation productivity in natural environments [1]. Forests are the primary terrestrial ecosystems and have the largest carbon pool. As vital habitats for nature and people, forests cover 30% of the land surface and support 80% of the plants and animals on the planet [2]. This is crucial for regulating the global carbon balance, mitigating greenhouse gas concentrations, and maintaining climate stability [3]. Forest ecosystems annually sequester nearly two-thirds of terrestrial carbon, with 80% stored aboveground and 40% belowground [4]. China contains almost all forest types in Northern Hemisphere [5], and forests have become significant biomass carbon sinks in recent decades owing to their diversified flora [6]. Twenty-five percent of the worldwide land area is covered by grassland, making it one of the most extensively distributed land cover types [7]. In China, grasslands account for 39.98% of the land area, making up 6–8% of global grasslands [8]. Grasslands produce approximately 20–30% of soil organic carbon, making them one of the most significant carbon sinks in terrestrial ecosystems [9]. It is crucial to balance atmospheric greenhouse gases with the global carbon cycle [10]. Cropland represents 12% of the land surface and 14% of the global terrestrial NPP, having a major impact on maintaining the carbon balance globally and regionally [11]. In China, croplands play a vital role as carbon sinks and contribute significantly to the terrestrial NPP [12], which is closely linked to food security and affects human health [13]. In croplands, photosynthesis and respiration are highly susceptible to changes in climate and human activities, which affect the carbon cycle and food availability [8].
Compared with 1850 to 1900, the mean global surface temperature between 2011 and 2020 increased by 1.1 °C [14]. Increasing temperatures have the potential to affect terrestrial productivity [15]. The unusually compound cold–wet event that occurred over southern China in 2022 seriously damaged the environment, affecting 4.22 × 10⁵ ha of croplands [16]. Plant growth and survival may be affected by extreme drought and heatwaves [17]. Climate change directly affects the vegetation distribution, composition, and structure related to physiological and demographic processes, including growth, death, respiration, photosynthesis, and species competition, thereby driving vegetation succession [18]. Warming increases vegetation NPP by promoting the soil organic carbon decomposition rate and extending growth duration [19]. Prolonged high temperatures can significantly elevate evapotranspiration (ET), potentially leading to water shortages that inhibit vegetation growth [20]. Temperature significantly influences vegetation cover in the middle and high latitudes of temperate regions, whereas precipitation predominantly affects vegetation growth in arid and semiarid areas [21]. An increase in water availability can enhance plant growth and NPP [22] where as flooding events caused by heavy or sustained rainfall can limit plant respiration and photosynthesis in regions with abundant water resources [23].
A previous study demonstrated that vegetation coverage decreased linearly with increasing mean annual precipitation on a large spatial scale [24]. The main factors influencing plant growth are temperature, precipitation, and solar radiation. An appropriate increase in solar radiation can increase the proportion of effective photosynthetic radiation and thus increase the NPP of terrestrial ecosystems [25]. Although decreasing solar radiation is beneficial for counteracting global warming caused by CO2, it may slow down the hydrological cycle and reduce precipitation in some regions [26]. Soil moisture significantly influences physiological functions such as photosynthesis [27]. A lack of soil water can alter the stomatal conductance of plants, leading to impaired photosynthesis and respiration, slowed growth, and limited carbon sequestration function of vegetation [28]. Ignoring the effects of soil moisture when considering the impact of climate change on vegetation dynamics may underestimate the role of climate change. Therefore, the joint effects of soil moisture and other climatic factors on vegetation deserve further study.
The joint effects of climate change and human activities influence vegetation dynamics. Climate change over the past few decades has caused 54% of the changes in NPP [29]. The remaining changes can be explained by human activities. Human activities can increase vegetation cover, improve vegetation NPP, and reduce desertification by transforming land use and land cover [30]. China has contributed 25% of the significant global vegetation greening since the 1970s [31] through large-scale ecological restoration initiatives, such as the Three-North Shelter Forest Program, Conversion of Farmland Back to Forests Project, and National Plain Greening Project [32,33]. However, increasing human activities have led to enormous stress on the increasingly fragile environment, and rapid urbanization has caused a huge occupation of woodlands and croplands for construction, which has significantly reduced vegetation cover [34]. Woodlands include forests and other woody vegetation. In this paper, woodlands include forests and shrubs. Overgrazing, agricultural expansion, and urbanization lead to the overconsumption of natural resources that may cause vegetation degradation in fragile areas [35]. Land use intensity affects vegetation productivity by directly interfering with vegetation growth through its effects on plant communities and nutrient cycling [36].
Therefore, it is necessary to consider the effects of climate change and human activities when investigating NPP dynamics. Ma et al. [37] showed that between 2000 and 2019, human activities had a greater influence on vegetation change in northern China than climate change, and the positive effects of precipitation, temperature, and potential ET declined. Xie et al. [38] confirmed that the contributions of increased atmospheric CO2 concentrations, human activities, and climate change to the gross primary productivity and ET in northern China between 1982 and 2017 were significantly different. Precipitation had the greatest impact on vegetation NPP in China between 2001 and 2018, followed by solar radiation and temperature [39]. Using normalized difference vegetation index (NDVI) data and climatic factors from 1982 to 2020, Gao et al. [40] identified temperature as the primary driver of monthly vegetation growth, precipitation as the primary factor controlling vegetation change at the annual scale, and human activities as the key driver behind overall vegetation change.
Although the effects of climate change and human activities on vegetation in particular areas have received considerable attention in previous research. The regulation of soil moisture on vegetation remains unclear and the divergent responses of woodlands, grasslands, and croplands have not been distinguished. We considered the contribution of soil moisture when exploring the effects of climate change on vegetation productivity. The single effect and interaction of soil moisture on the NPP of woodlands, grasslands, and croplands were elucidated. The aims of this study were to (1) examine the spatial patterns of NPP and land use degree comprehensive index (LDCI) from 2001 to 2020; (2) investigate the effects of climatic factors and LDCI on NPP and its variation in woodlands, grasslands, and croplands; and (3) explore the actual and relative contributions of climate change and human activities to NPP in different land cover types, and identify the dominant factors. The results of this study can help select appropriate types of vegetation transfer and improve vegetation productivity through ecological restoration methods.

2. Materials and Methods

2.1. Study Area

This study comprised the woodlands, grasslands, and croplands in China (Figure 1). Owing to its vast geographic expanse and various natural climate changes, China has a wealth of forest resources and a broad range of forest types that display clear regional distribution patterns. Chinese forests are classified into eight types based on their general traits and habitats: coniferous forests (evergreen and deciduous), broad-leaved forests (evergreen and deciduous), mixed broad-leaved forests (coniferous and evergreen deciduous), rainforests, and seasonal rainforests. Grasslands are classified into four primary types using the Chinese vegetation categorization method: alpine, typical steppe, meadow, and desert grasslands. There are 73 major agricultural products in China, including 12 cereal crops, 8 legume crops, 5 potato crops and fruits, and 48 vegetable crops.

2.2. Data Sources

The MOD17A3HGF dataset with an annual temporal resolution and a spatial resolution of 500 m, spanning January 2001 to December 2020 was obtained from NASA. The NPP dataset is acquired from NASA annually upon the release of the complete 8-day MOD15A2H data. Low-quality inputs were eliminated to improve the NPP data based on quality control for each pixel. The NPP dataset was resampled using the nearest-neighbor approach to a 1 km spatial resolution.
The effect of climate change on NPP was investigated using meteorological data from 2001 to 2020, which included precipitation, air temperature, solar radiation, and soil moisture. Delta spatial downscaling was employed to develop the air temperature and precipitation datasets based on WorldClim and CRU datasets [41,42]. TerraClimate provided solar radiation, which was derived from the Japanese 55-year reanalysis, CRU TS 4.0 time-varying data, and the high-spatial-resolution climatological normal from the WorldClim dataset, which were resampled to 1 km. Soil moisture data were obtained from 1648 meteorological observation stations as a benchmark by machine learning using ERA5_Land meteorological data (leaf area index, land cover types, terrain, and soil properties) [43].
We used the China Land Cover Dataset (CLCD) from 2001 to 2020 to determine vegetation cover and calculate LDCI. The CLCD dataset is based on Landsat imagery from the Google Earth Engine platform using a random forest classifier, post-processing combining spatio-temporal filtering, and logical inference [44]. A 30 m annual land cover dataset for China was generated from 1985 and 1990 to the present with 79.31% accuracy verified by 5463 visually interpreted samples (https://zenodo.org/records/12779975, accessed on 24 July 2024). This dataset contains nine major land cover types: cropland, forest, shrub, grassland, water, snow/ice, barren, impervious, and wetland. The study areas selected for the present analysis were woodlands (forest and shrub), grasslands, and croplands in China and resampled at a spatial resolution of 1 km.

2.3. Methods

2.3.1. Calculation of LDCI

LDCI indicates the effect of human activities on NPP in time and space, which can reflect the intensity of human activities. It is calculated from the land cover dataset and higher LDCI values indicate lower utilization of land natural properties [45]. It is estimated as:
L D C I a = 100   ×   i   =   1 n A i   ×   C i
where LDCIa is the LDCI value of year a and Ai is the classification indices of land use. The numerical values for Ai were 1, 2, 2, 2, 3, and 4, corresponding to unutilized lands, grasslands, woodlands, water bodies, croplands, and urban and built-up lands, respectively. Ci is the proportion of each land use category in a 1 km grid. High LDCI values reflect a higher degree of anthropogenic activities.

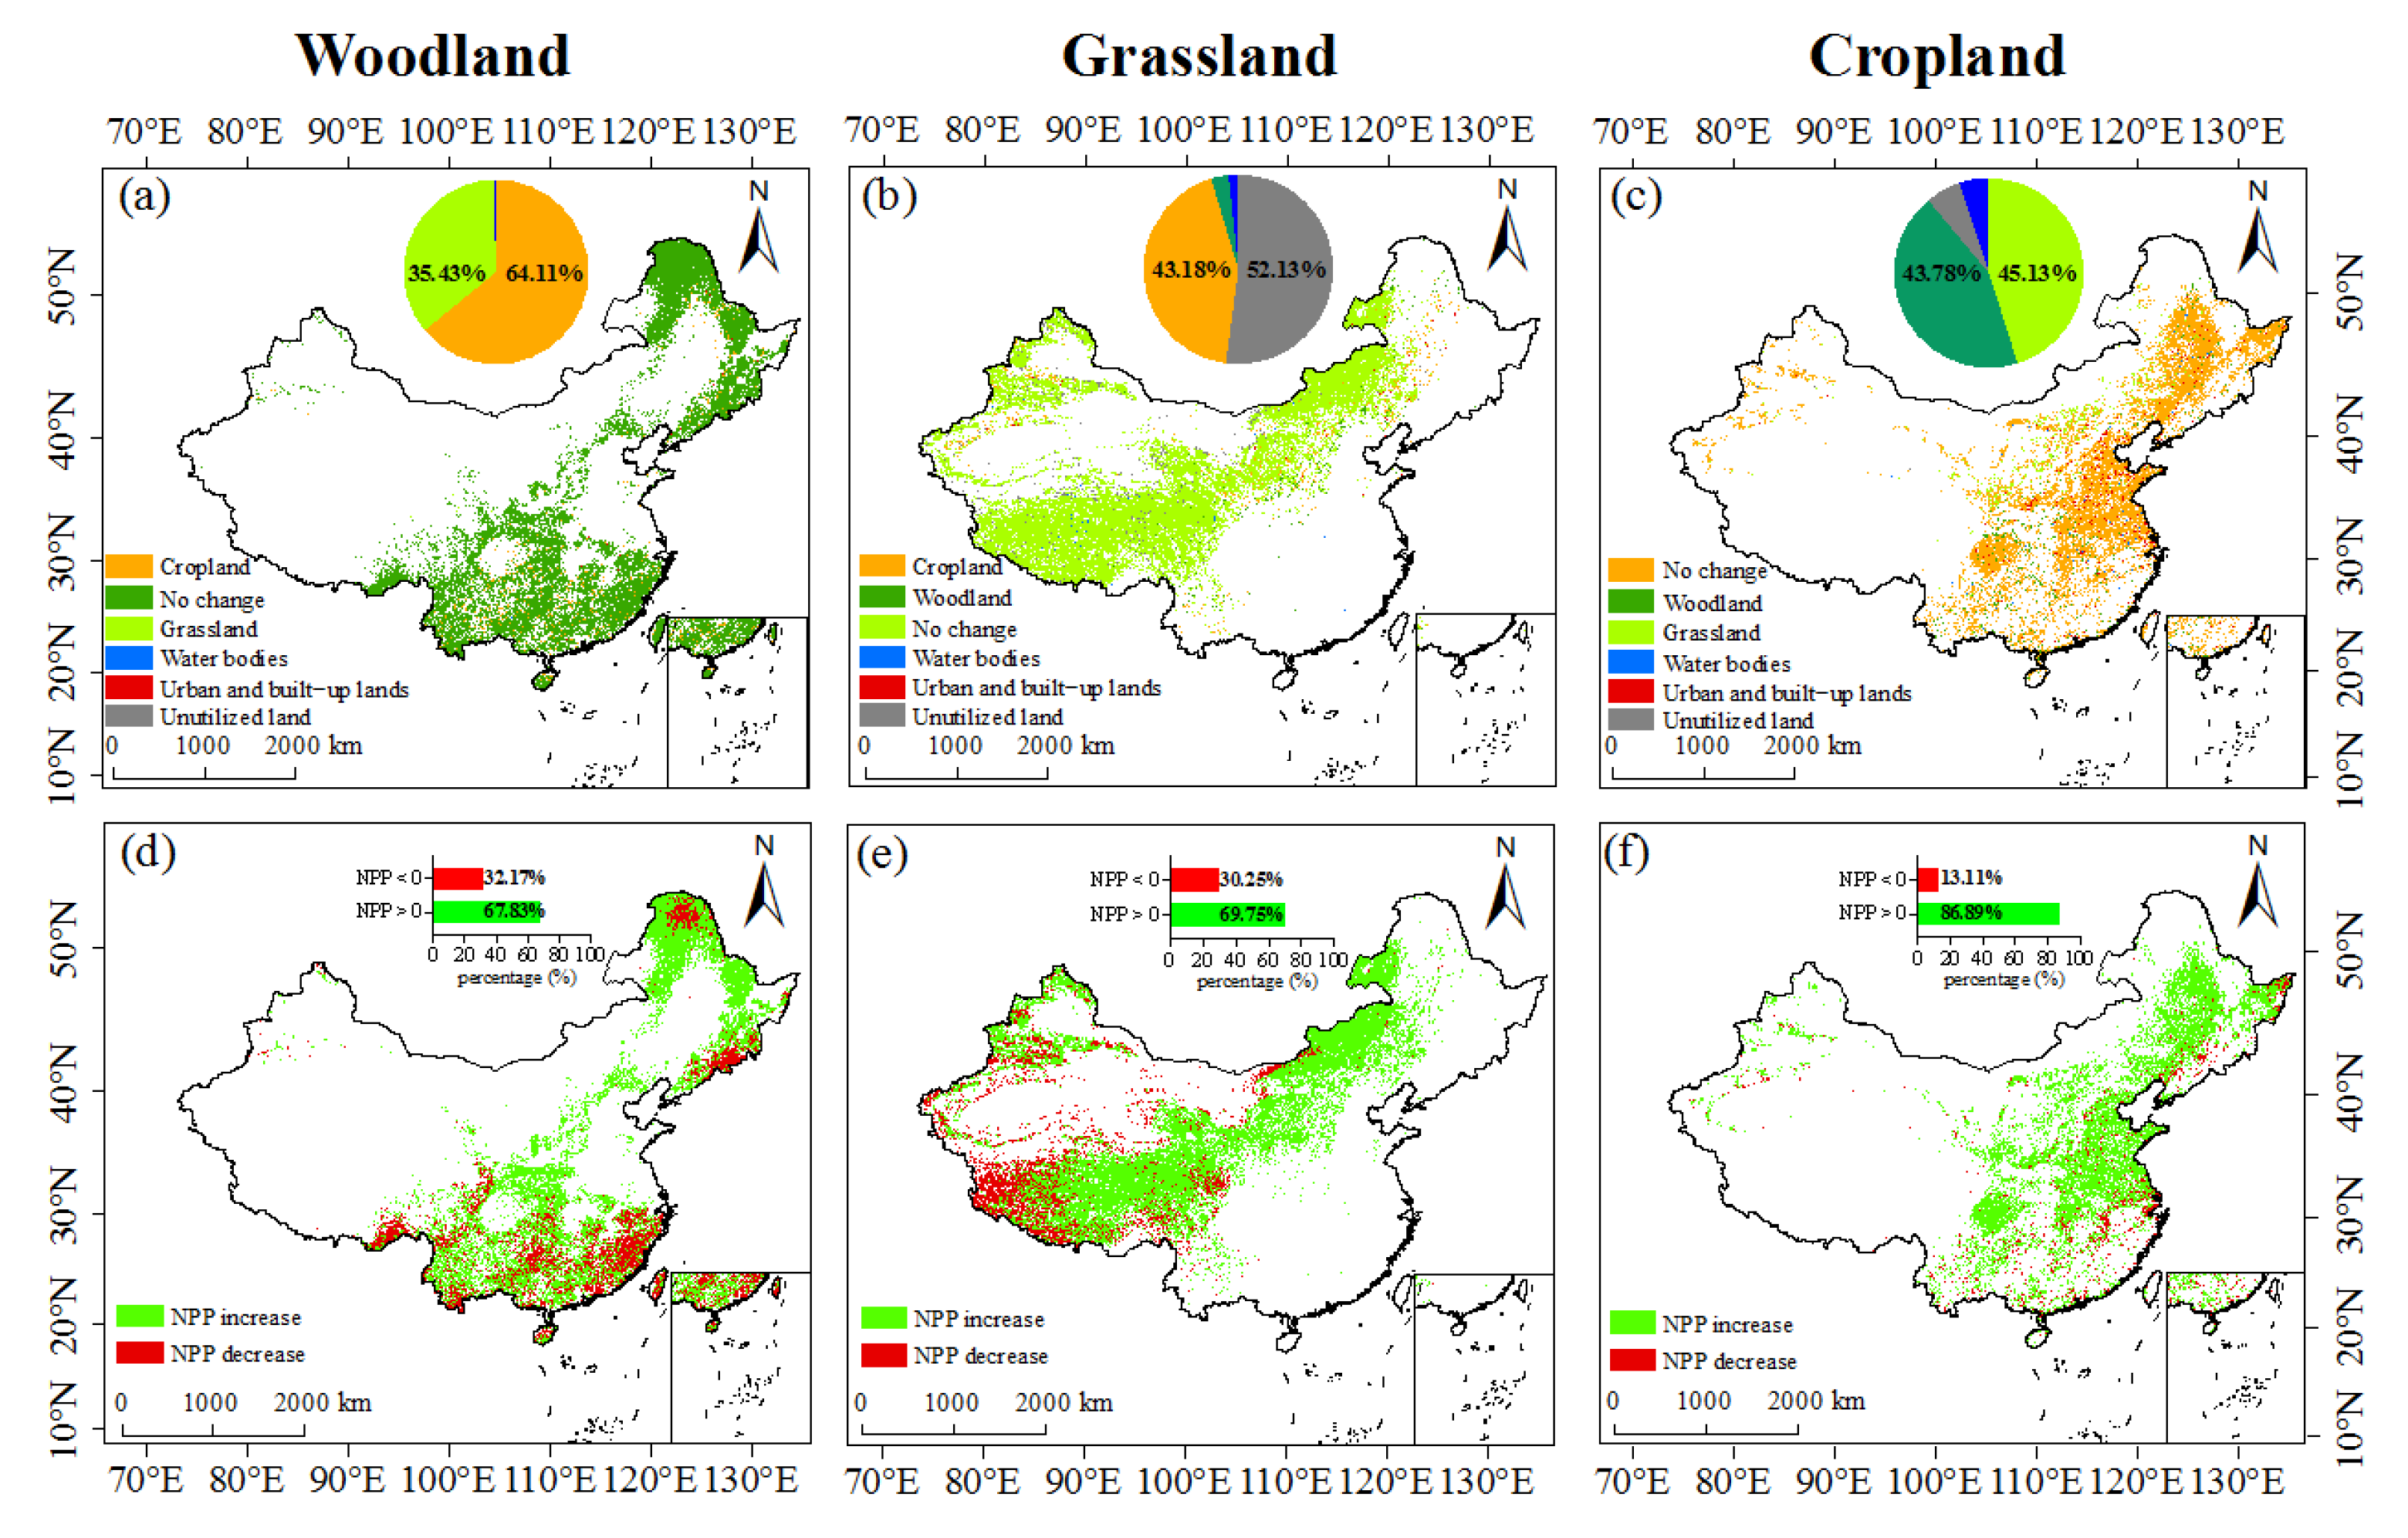
2.3.2. Land Use Transfer Matrix in Woodlands, Grasslands, and Croplands

The land use transfer matrix is an effective method to show how land use has changed spatially over time. This reflects the structure of land use categories at both the start and end of the study period. Land use changes over time because of human and environmental influences. The formula for the land use matrix was:
S i j = S 11 S 12 S 13 S 1 n S 21 S 22 S 23 S 2 n S 31 S 32 S 33 S 3 n S n 1 S n 2 S n 3 S n n
where S and n denote the land area and the number of land use types (n = 6 in this study), respectively. i and j represent the categories of land use at the start (2001) and end (2020) years in this study, respectively.

2.3.3. Contributions of Climate Change and Human Activities to NPP

Residual analysis is a commonly used method for separating vegetation variation caused by human activities from that caused by climate change. To estimate the actual effects of climate factors on vegetation NPP, the original residual analysis used multiple linear regression to calculate the relationships between NPP and air temperature, precipitation, solar radiation, and soil moisture during a particular period. The actual effects of human activities on NPP were estimated by isolating the influence of climate change:
d N P P d t = N P P T E M × d T E M d t + N P P P R E × d P R E d t + N P P S R × d S R d t + N P P S M × d S M d t + H c o n = T E M c o n + P R E c o n + S R c o n + S M c o n + H c o n
where the long-term NPP trend is represented by d N P P d t , the contributions of climatic factors to the yearly fluctuation in NPP are denoted as TEMcon (air temperature), PREcon (precipitation), SRcon (solar radiation), and SMcon (soil moisture). Hcon denotes the discrepancy between the observed and predicted values of d N P P d t . The residual difference between the NPP trend and the contribution of climatic factors reflects the influence of human activities on NPP. d N P P d t , d T E M d t , d P R E d t , d S R d t , and d S M d t represent the NPP trend, air temperature, precipitation, solar radiation, and soil moisture change with time t owing to climate change and human activities, respectively. N P P T E M , N P P P R E , N P P S R , and N P P S M denote the partial derivative of each climatic factor on NPP, respectively. The effect of each climatic factor on the variation in NPP was linear. Each partial derivative was equal to the corresponding third-order partial correlation coefficient by eliminating the influence of the other three climatic variables. Table 1 displays the relative contributions of climate change and human activities to NPP change.
When CNPP > 0, climate change or human activities promote NPP; otherwise, they have a negative effect. The contribution of climate change to NPP change (CCC) is the sum of TEMcon, PREcon, SRcon, and SMcon. The contribution of human activities to variation in NPP is indicated by CHA and is expressed as Hcon.

2.4. Statistical Analysis

Sen’s trend was used to analyze temporal changes in NPP and LDCI, whereas the Mann–Kendall test was used to evaluate the significance of these trends. The spatial aggregation of Sen’s trend in NPP and LDCI was calculated using hot and cold spot analysis. Partial correlation and correlation analyses examined the response of NPP across woodlands, grasslands, and croplands to climatic factors and LDCI, respectively. The above analytical methods were implemented using MATLAB 2020.

3. Results

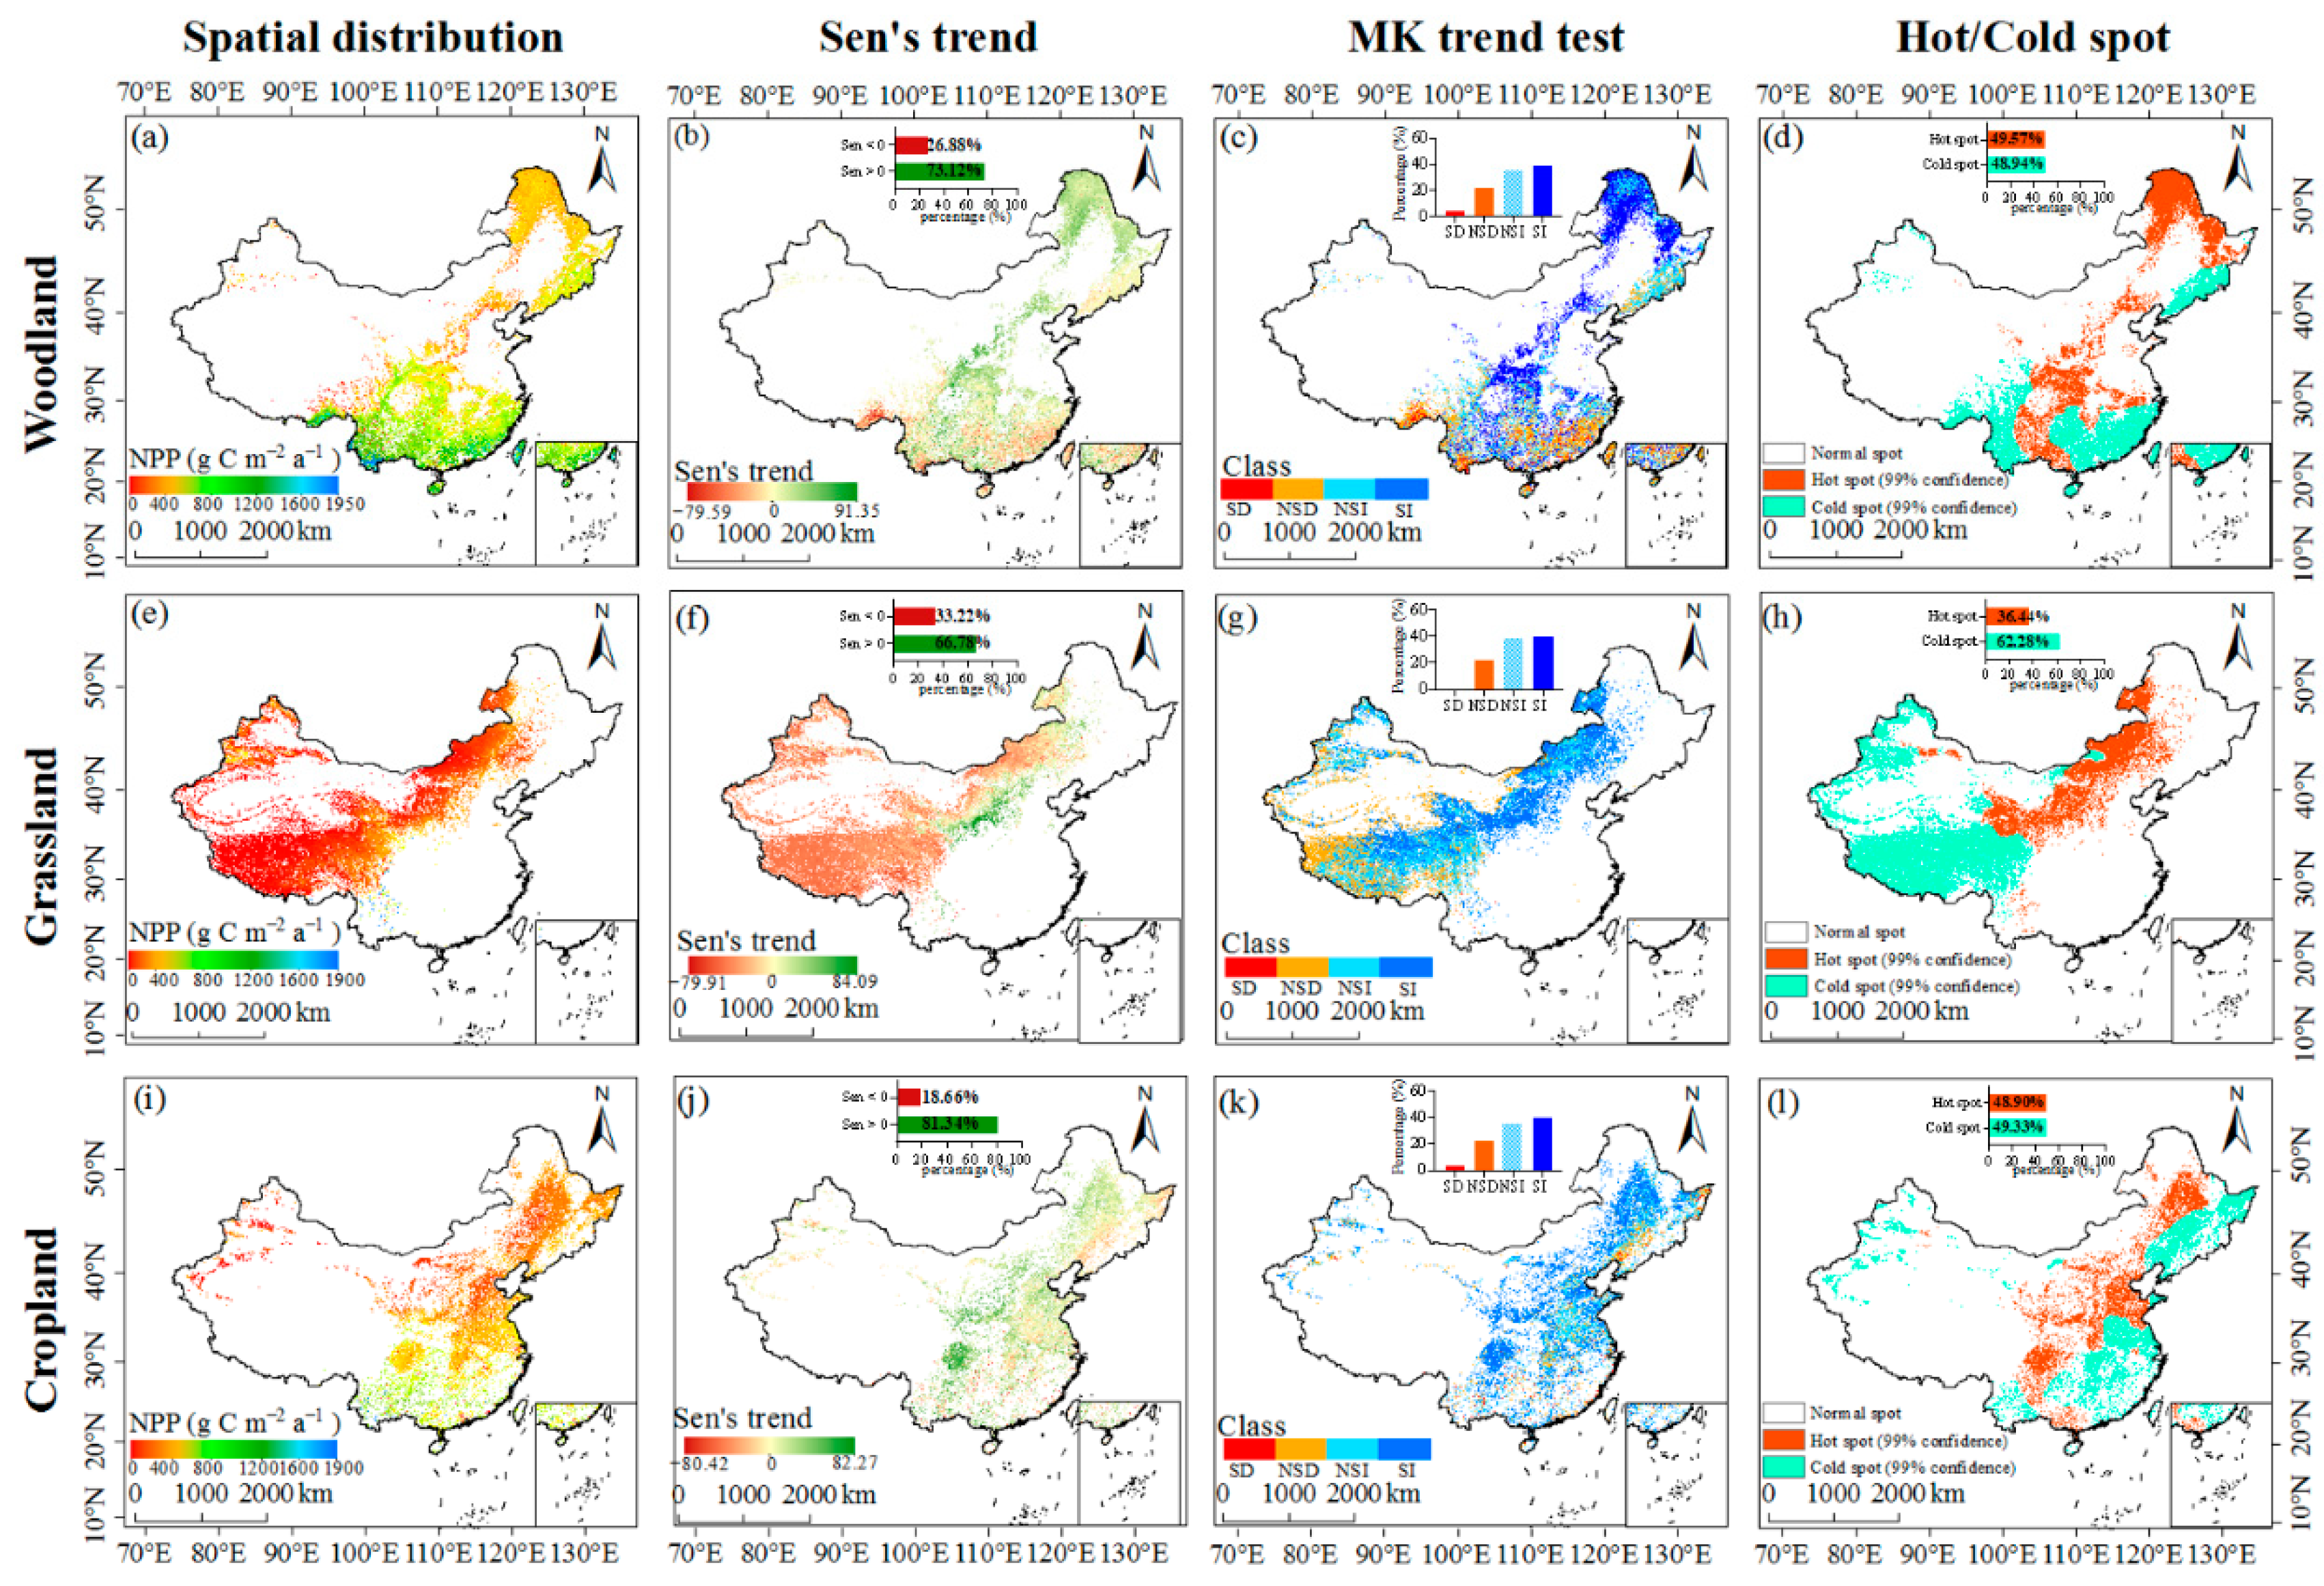
3.1. Spatiotemporal Patterns of NPP in Woodlands, Grasslands, and Croplands

The spatial variations in NPP in woodlands, grasslands, and croplands are shown in Figure 2. From 2001 to 2020, the variation in spatial NPP in woodlands ranged from 8.12 to 1940.64 g C m−2 a−1, averaging 692.55 g C m−2 a−1 (Figure 2a). NPP values of woodlands were high in southern China and areas with low NPP values were dispersed in northern China. NPP values in 73.12% of the woodland showed an increasing trend. Whereas the NPP values in 26.88% of woodland areas displayed a decreasing trend and were mainly distributed in eastern China (Figure 2b). NPP values significantly decreased in 3.81% and significantly increased in 39.32% of the woodlands (Figure 2c). Hot and cold spots indicated significantly spatially clustered regions of high and low values in NPP trends, respectively. The hot spots of woodland NPP trends over the 20 years were concentrated in the northeast and central regions of China, while the cold spots were in the coastal areas (Figure 2d). NPP values of grasslands averaged 162.56 g C m−2 a−1 with a range of 7.30 to 1846.63 g C m−2 a−1 (Figure 2e). Grassland NPP values increased from west to east. In 33.32% of grassland areas, NPP values showed a declining trend primarily concentrated in western China (Figure 2f). Grassland NPP values were significantly increased and significantly decreased by 39.54% and 0.40%, respectively (Figure 2g). The hot spots of the trend in grassland NPP values were distributed in northern China and the cold spots were in western China (Figure 2h). Spatial NPP in croplands varied from 7.37 to 1906.48 g C m−2 a−1, with a mean value of 428.49 g C m−2 a−1, and increased from north to south in China (Figure 2i). NPP values primarily increased across croplands (81.34%) and 18.66% of the area showed a decreasing trend over the previous 20 years (Figure 2j). In the total cropland area, 52.98% of the NPP values increased significantly and 2.00% decreased significantly (Figure 2k). The distribution of hot and cold spots of NPP trends in croplands was the same as that in woodlands (Figure 2l).

3.2. Response of NPP to Climate Change and Human Activities

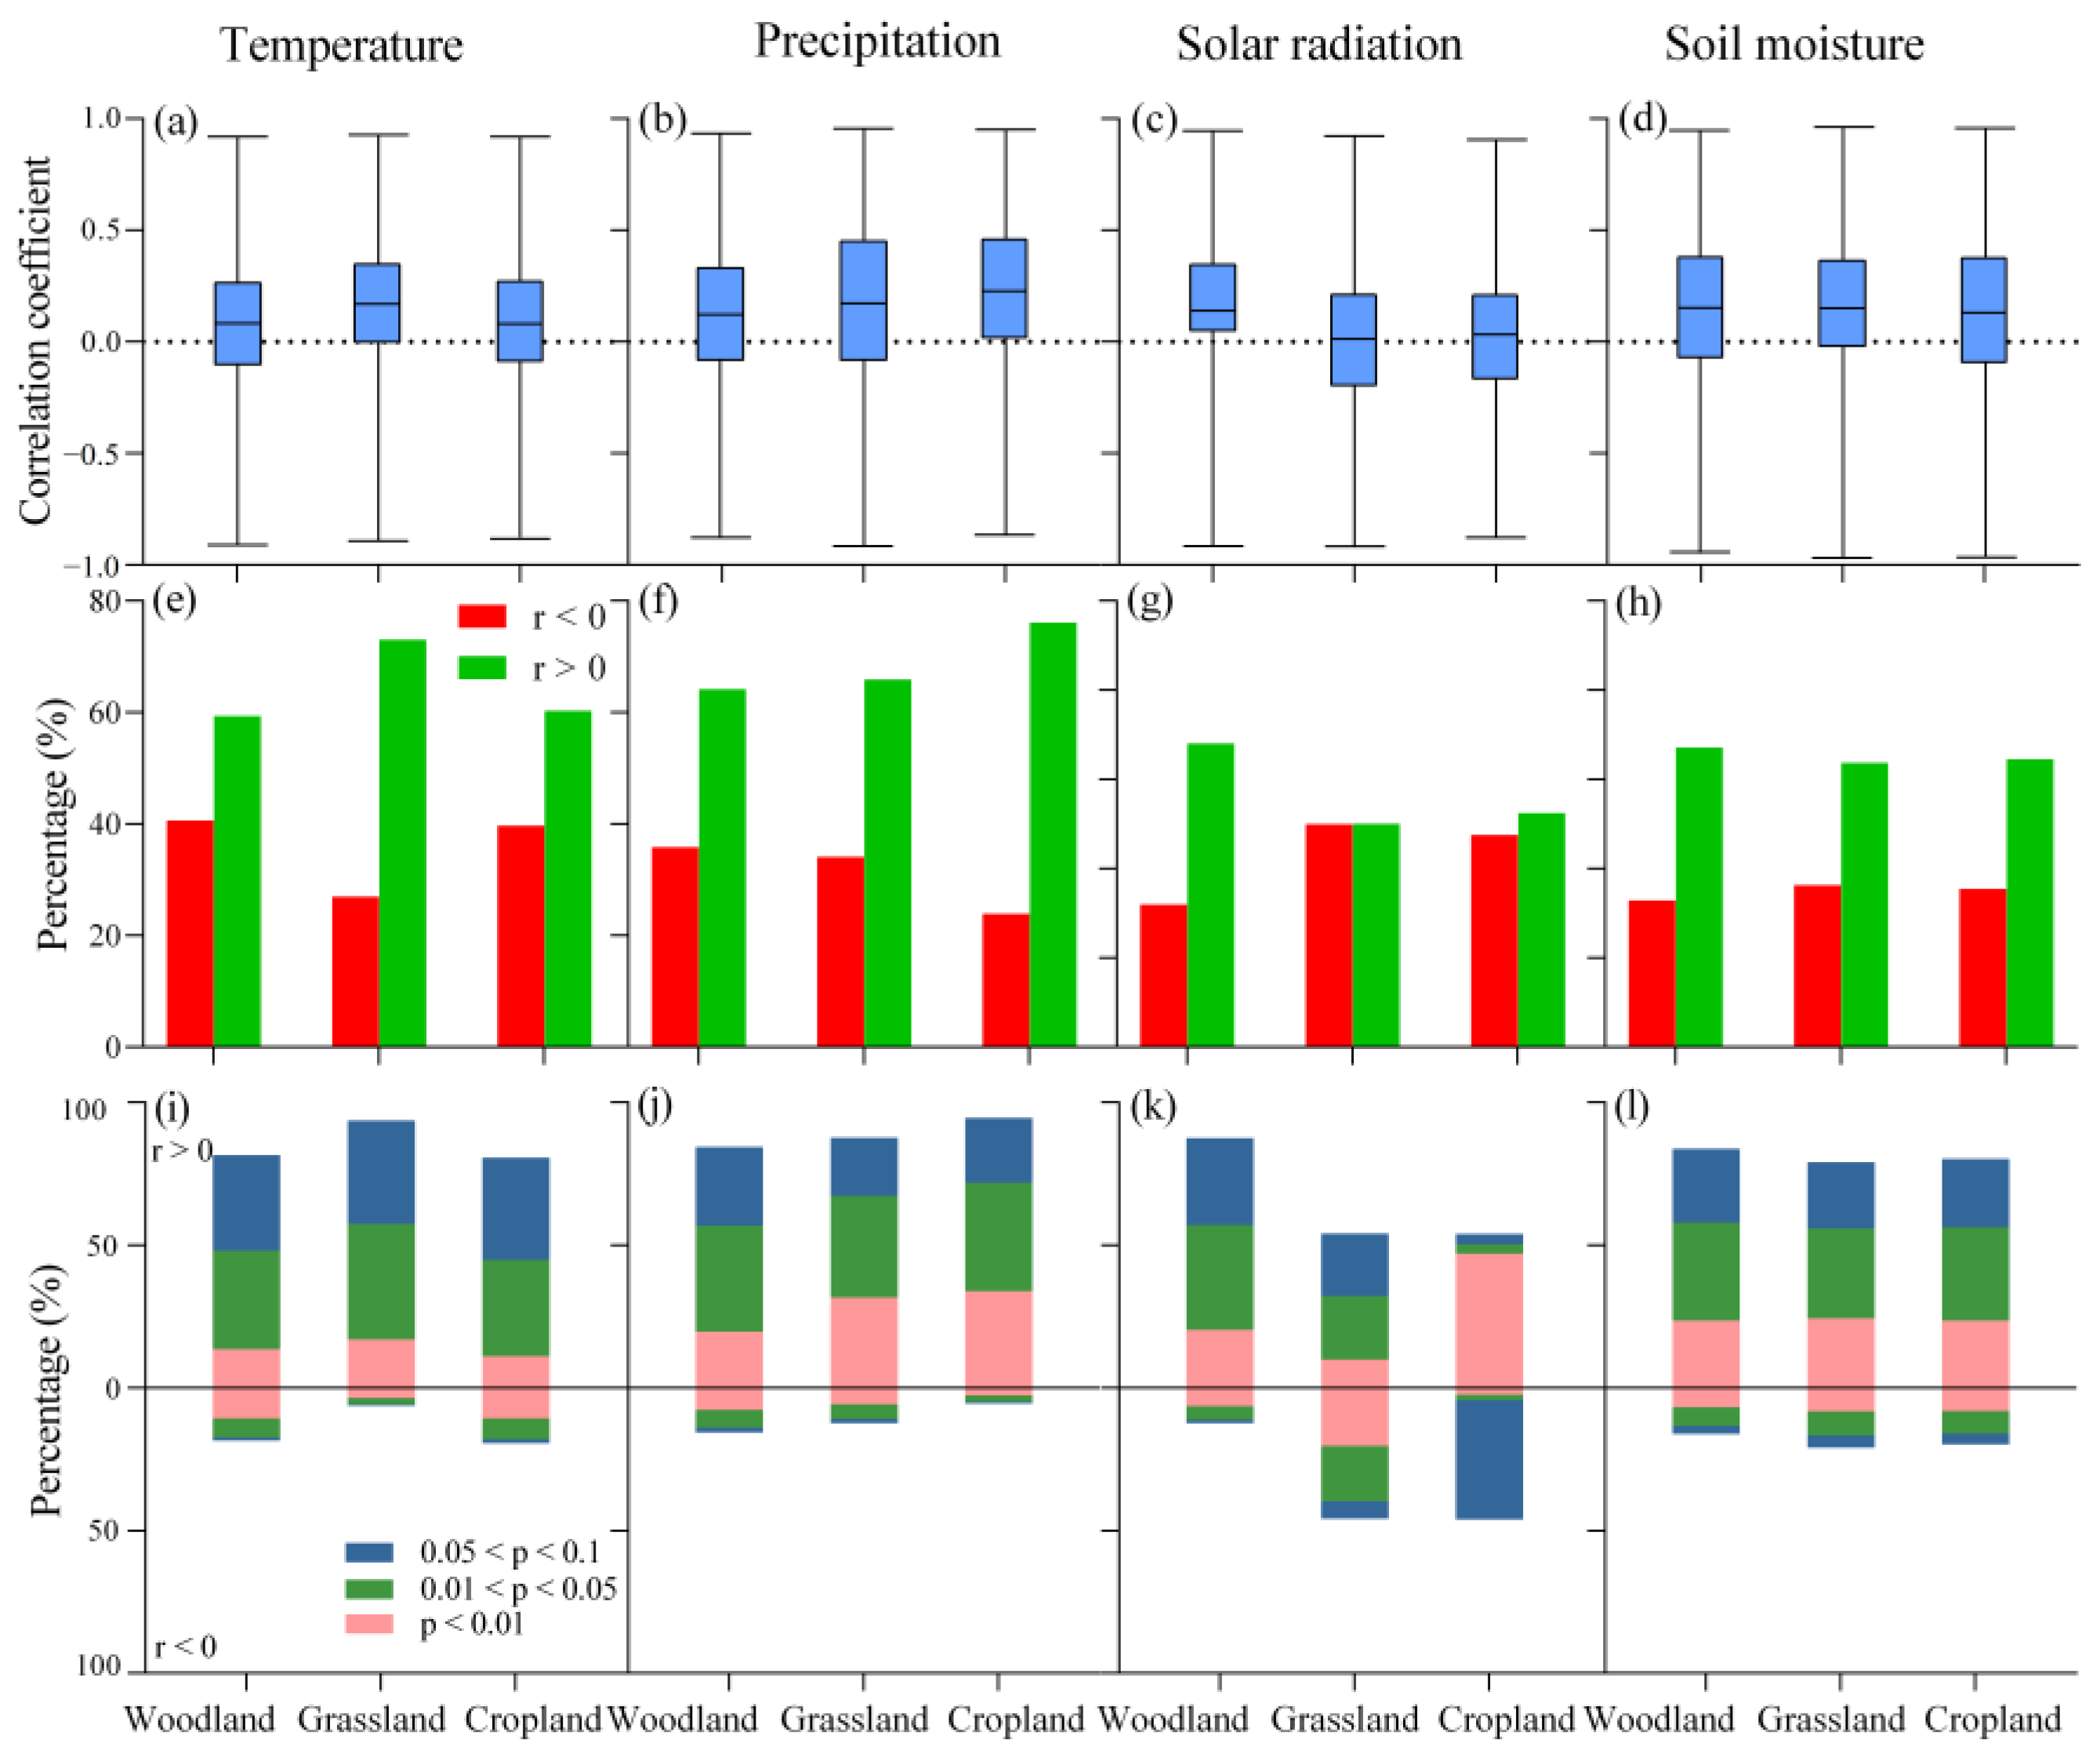
3.2.1. Effects of Climate Factors on NPP in Woodlands, Grasslands, and Croplands

Partial correlation coefficients varied between −0.91 and 0.92, with 59.40% of woodland regions exhibiting a positive correlation between NPP and air temperature, and 40.60% showing a negative correlation (Figure 3a,e). The areas with a positive correlation between NPP values and precipitation (64.19%), solar radiation (68.02%), and soil moisture (67.14%) were larger than areas with a negative correlation (Figure 3f–h). Accordingly, the partial correlation coefficients were −0.88 to 0.93, −0.92 to 0.94, and −0.94 to 0.95, respectively (Figure 3b–d). In grasslands, the areas with NPP values exhibiting positive correlations to air temperature (73.03%), precipitation (65.89%), solar radiation (50.03%), and soil moisture (63.71%) were greater than those with a negative correlation (Figure 3e–h). The partial correlation coefficients ranged from −0.89 to 0.93, −0.92 to 0.95, −0.92 to 0.92, and −0.97 to 0.97, respectively (Figure 3a–d). Cropland areas in China showed larger regions with a positive correlation between NPP values and air temperature (60.29%), precipitation (76.09%), solar radiation (52.50%), and soil moisture (64.54%) than those with negative correlations. The partial correlation coefficients of temperature, precipitation, solar radiation, and soil moisture ranged from −0.88 to 0.92, −0.89, 0.95, −0.88 to 0.90, and −0.97 to 0.97, respectively (Figure 3a–d). In woodlands, grasslands, and croplands, the percentages of significant positive correlations between NPP values and air temperature, precipitation, solar radiation, and soil moisture were higher than the percentages of significant negative correlations (Figure 3i–l).

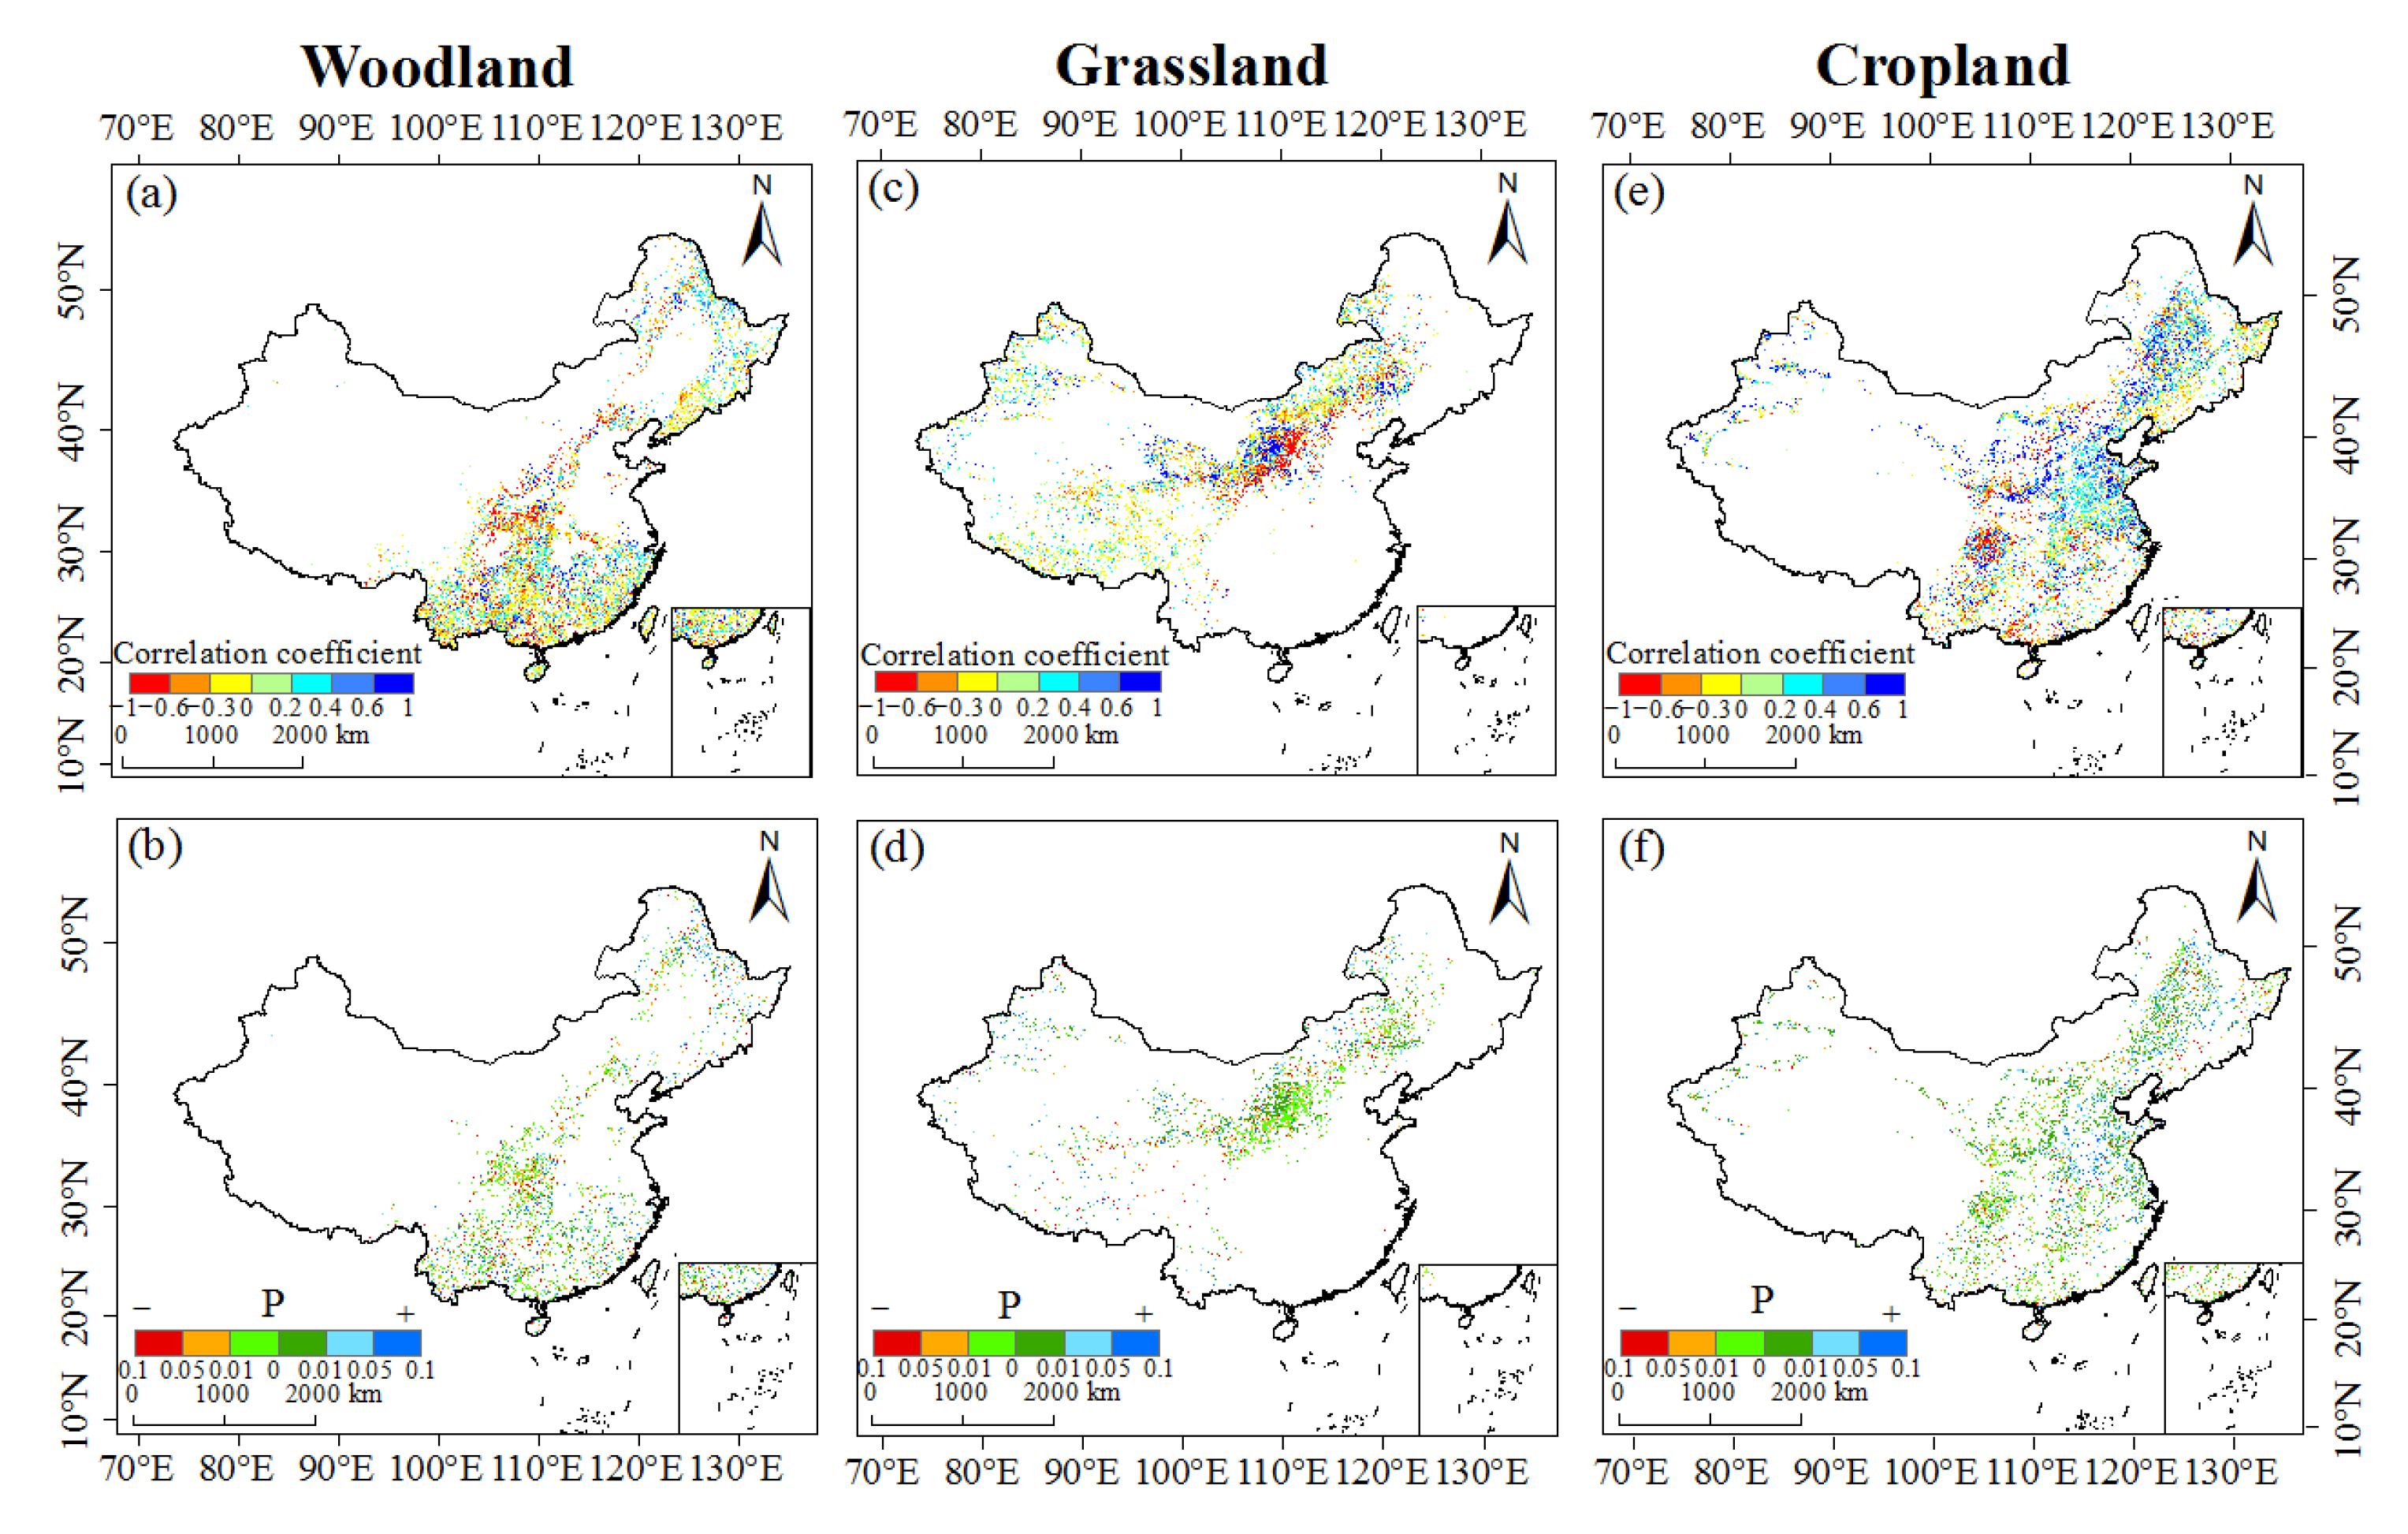
3.2.2. Effects of Human Activities on NPP in Woodlands, Grasslands, and Croplands

The spatial variations in the LDCI in woodlands, grasslands, and croplands from 2001 to 2020 are shown in Figure 4. The LDCI for the woodland varied between 1.66 and 409.40, with an average of 210.18 (Figure 4a). The variation range of LDCI in the grassland was slightly lower than that in woodlands, ranging from 1.61 to 409.00, with an average of 198.29 (Figure 4e). The average LDCI in croplands (280.93) was the highest among the three land cover types, with values ranging from 11.92 to 411.85 (Figure 4i). In the past 20 years, LDCI in woodlands (79.45%) and grasslands (84.13%) showed a decreasing trend (Figure 4b,f). The LDCI in the woodland significantly decreased in 15.30% of the area, whereas 21.12% of the area showed a significantly increasing trend (Figure 4c). The percentage of significantly decreased and significantly increased LDCI in the grassland was 12.87% and 12.93%, respectively (Figure 4g). Of the total cropland area, 48.62% showed an increasing trend in LDCI. 45.27% and 15.55% experienced significant increases and decreases of LDCI in the cropland, respectively (Figure 4j,k). The hot spots of the woodland LDCI trend were in the northeastern and coastal regions of China, while the cold spots were concentrated in the central region (Figure 4d). The cold spots of grassland LDCI trends were also concentrated in the central region and the hot spots were mainly distributed in northwest China (Figure 4h). The northern and central coastal areas were hot spots of LDCI trends in croplands and cold spots were mainly distributed in southern China (Figure 4l).
The areas that exhibited a negative correlation between the LDCI and NPP values in woodlands (51.88%) and grasslands (84.13%) were larger than those with positive correlations (Figure 5a,c). In croplands, the regions exhibiting a positive correlation with LDCI (60.61%) were greater than those exhibiting a negative correlation (39.39%) (Figure 5e). The area of woodlands with a significant negative correlation (22.67%) marginally exceeded that with a significant positive correlation (17.76%) (Figure 5b). The LDCI and NPP values of the grasslands and croplands demonstrated a significant positive correlation in 8.66% and 32.21% of the regions, respectively, which was greater than the regions with significant negative correlation (Figure 5d,f).
Over the past 20 years, the increase in woodlands was mainly caused by the transfer from croplands and grasslands, accounting for 64.11% and 35.43%, respectively, of the overall transfer rate (Figure 6a). The expansion in grasslands mainly resulted from the transfer from unutilized lands (52.14%) and croplands (43.18%) (Figure 6b). The increase in croplands was primarily owing to the transfer from woodlands and grasslands, which accounted for 45.13% and 43.78%, respectively (Figure 6c). Overall, only the woodland area showed an increase over the evaluated 20-year period, whereas grassland and cropland areas decreased. With the background of changes in land cover, woodland, grassland, and cropland NPP values showed an increasing trend of 67.83%, 69.75%, and 86.89%, respectively. The NPP reduction in woodlands was primarily observed in southern China, whereas the decreased NPP in grasslands was mainly observed in western China (Figure 6d–f).

3.3. Contributions of Climate Change and Human Activities on NPP

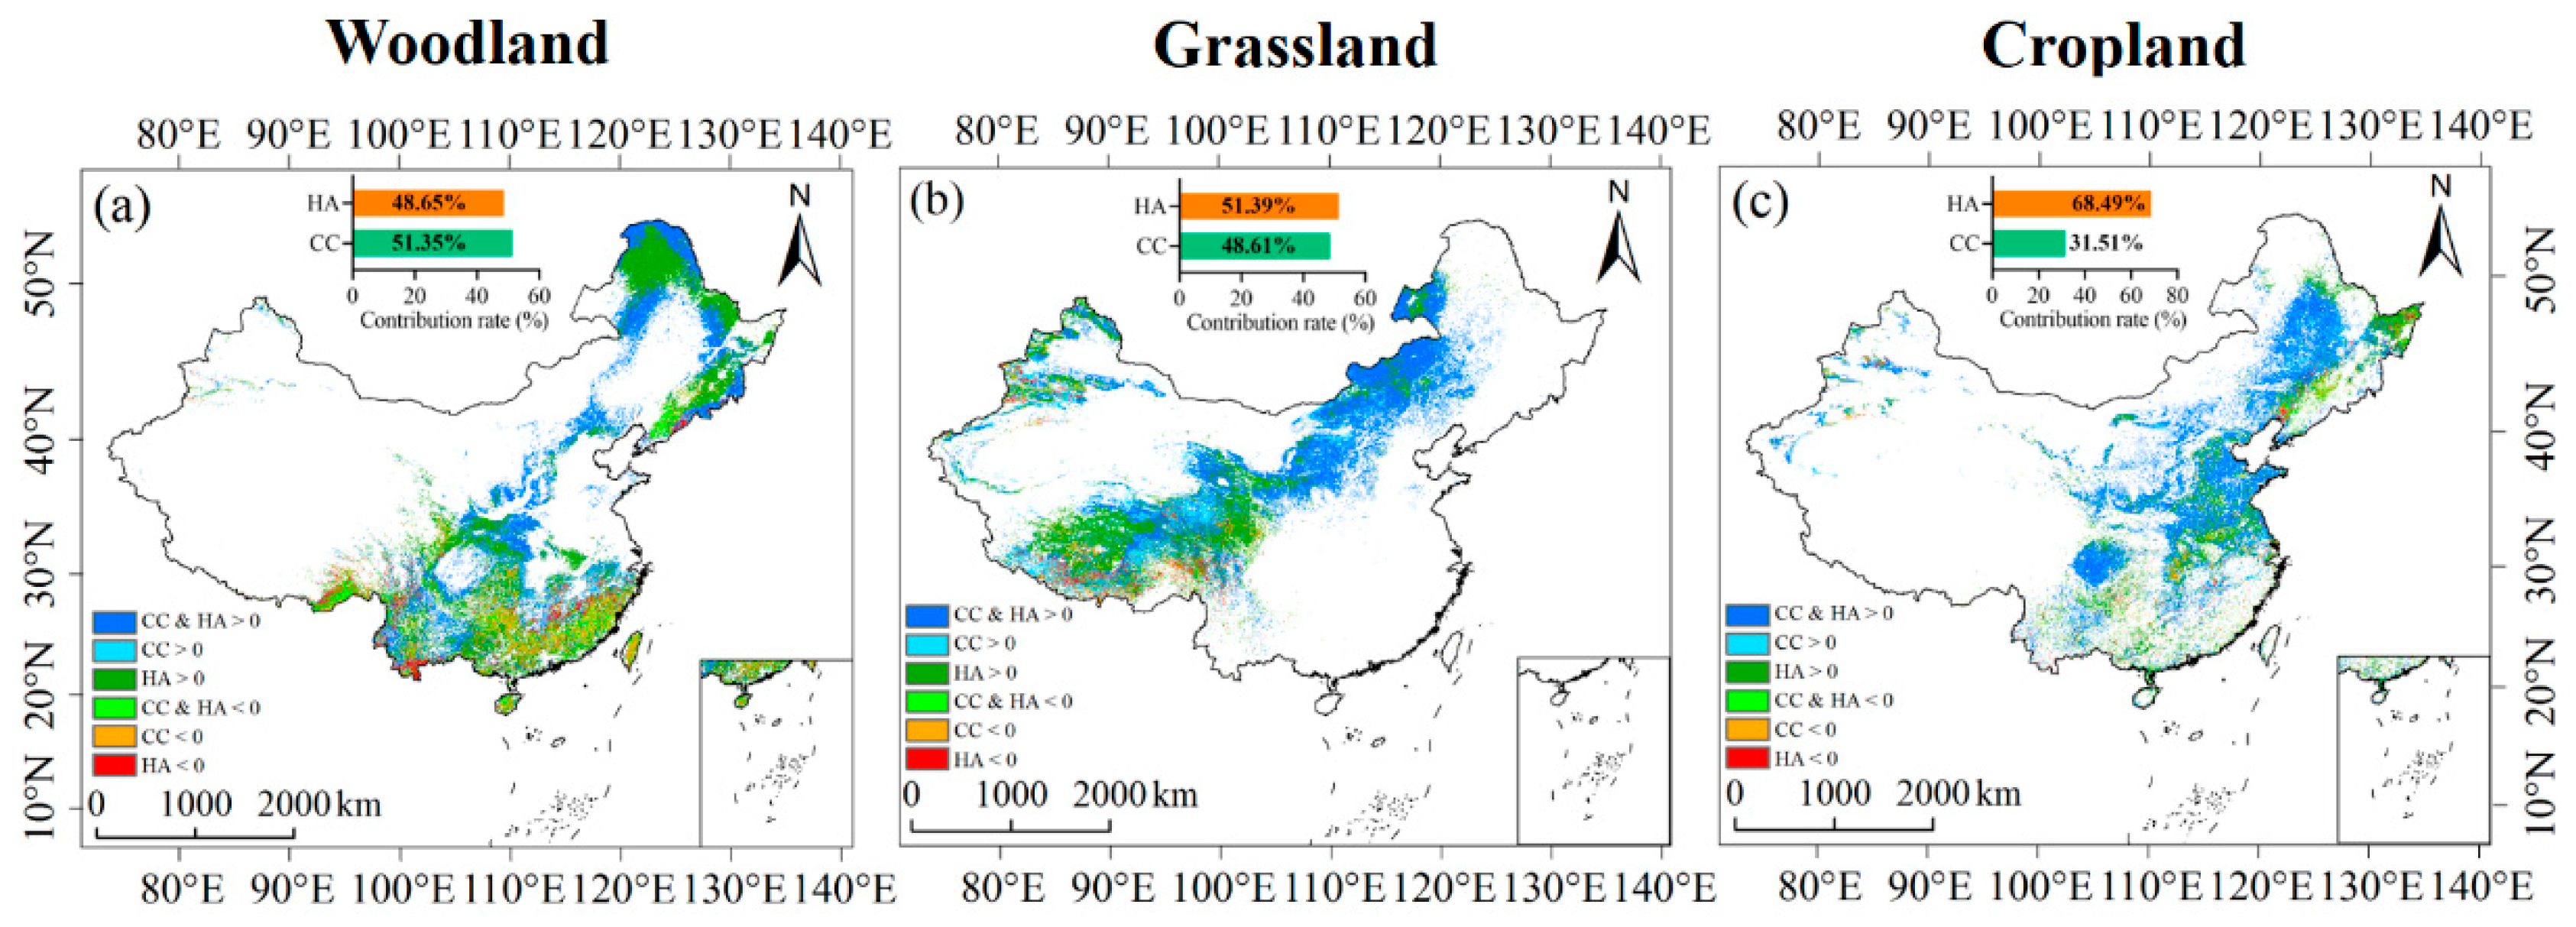
3.3.1. Actual Contributions of Climate Change and Human Activities to NPP

We estimated the actual contributions of climatic factors and human activities to the yearly NPP variation in woodlands, grasslands, and croplands in China between 2001 and 2020 (Figure 7). The average contributions of the climatic factors to vegetation NPP (woodland, grassland, and cropland) in China were in the order of precipitation > soil moisture > air temperature > solar radiation. In woodlands, the contributions of climatic factors to NPP were in the order of precipitation (0.58 g C m−2 a−1) > soil moisture (0.08 g C m−2 a−1) > air temperature (0.001 g C m−2 a−1) > solar radiation (−0.65 g C m−2 a−1) (Figure 7a–d). The mean contributions of climatic factors to NPP in grasslands and croplands were similar, with precipitation having the greatest impact, followed by solar radiation, soil moisture, and temperature (Figure 7a–d). The mean contributions of air temperature, precipitation, solar radiation, and soil moisture to NPP in grasslands were 0.002, 1.16, 0.25, and 0.06 g C m−2 a−1, respectively. In croplands, the average contributions to NPP were 0.002, 0.62, 0.20, and 0.14 g C m−2 a−1 for air temperature, precipitation, solar radiation, and soil moisture, respectively.
The positive contributions of climatic factors to NPP changes in woodlands, grasslands, and croplands accounted for 57.98%, 70.86%, and 73.37%, respectively. Climatic factors contributed more to the NPP of croplands (1.62 g C m−2 a−1) than to that of grasslands (1.05 g C m−2 a−1) or woodlands (0.17 g C m−2 a−1) (Figure 7e). In woodlands, grasslands, and croplands, the mean contributions of human activities to NPP change were 2.05, 0.76, and 1.77 g C m−2 a−1, respectively (Figure 7f). Human activities contributed positively to NPP change across croplands (73.06%), woodlands (71.80%), and grasslands (53.93%).

3.3.2. Relative Contributions of Climate Change and Human Activities to NPP

The NPP of woodlands (42.83%), grasslands (53.49%), and croplands (45.22%) increased because of the positive joint effects of climate change and human activities (Figure 8a–c). The contributions of the negative effect of human activities on NPP variation in woodlands (7.63%) and grasslands (3.75%) were small. NPP values in woodlands (2.10%) were least affected by the negative joint effect of climate change and human activities. In China, the relative contribution rates of climate change and human activities to NPP were 44.96% and 55.04%, respectively. The mean relative contribution rates of climate change were greater for woodlands (51.35%) than for grasslands (48.61%) and croplands (31.51%). Human activities contributed more to NPP than did climate change in grasslands (51.39%) and croplands (68.49%).

4. Discussion

4.1. Variation in NPP in Different Land Cover Types

Similar to the findings of Li et al. [46] on NPP trends from 1982 to 2018, the annual mean NPP demonstrated an increasing trend in China. Previous studies have also demonstrated that the NPP values of woodlands, grasslands, and croplands in China exhibited an increasing trend over the last few decades [1,47]. Woodlands (692.55 g C m−2 a−1) had higher multi-year mean NPP values than did croplands (428.56 g C m−2 a−1) or grasslands (162.49 g C m−2 a−1) (Figure 2). In the regional and global carbon cycles, forest ecosystems sequestered approximately 6.62 × 10² Pg C in 2020, contributing to the slowing down of climate change and the balancing of carbon emissions [48]. From 2003 to 2050, woodland cover in China is expected to increase from 2.19 × 10⁵ ha to 2.97 × 10⁵ ha and the carbon sink of woodland will be 5.52 Pg C [49]. Forest ecosystem productivity and CO2 stabilization are influenced by both biological and abiotic factors that sustainably sequester carbon emissions from energy consumption [50]. Grassland degradation occurs with an increase in extreme weather (droughts, global warming, and extreme rainfall) and it is intensified by human activities [51]. In China, a large amount of grassland (90%) has degraded to varying degrees [52] and this percentage has reached 32.1% in Xinjiang [53]. Implementing ecological projects such as the Grain for Green project and prohibiting grazing can mitigate the problem of grassland degradation, hence causing the NPP increase in grasslands [54]. According to Liu et al. [10], grassland NPP values have been increasing in China. The NPP of croplands is more sensitive to climate change than that of woodlands, and agricultural systems were 88% less productive than natural systems [55]. Liu et al. [56] confirmed that agricultural management measures (such as irrigation) can generally make the NPP of croplands larger than those of woodlands and grasslands in arid and semi-arid areas. In the central cropland area, the conversion from C3 crops (barley and wheat) with low NPP to C4 crops (maize) with high NPP contributed to an increase in NPP [57]. Most of the NPP generated by agroecosystems is consumed by humans, contributing minimally to terrestrial carbon sinks [58].

4.2. Effects of Climate Change on NPP in Different Land Cover Types

The average contributions of climatic factors to NPP were in the order of precipitation > soil moisture > air temperature > solar radiation (Figure 7). Precipitation is a major source of surface soil moisture and influences variations in soil moisture through rainfall intensity and duration [59]. It has a significant effect on surface soil moisture but fluctuates less with deeper soil moisture [60]. Vegetation influences the water availability from precipitation (soil moisture) through processes such as canopy interception, increased precipitation infiltration, and ET [61]. Woodlands have high vegetation coverage rates and intercept precipitation through well-developed root systems and abundant understory communities to achieve water conservation [62]. Agricultural activities (such as tillage, fertilization, and weeding) decreased vegetation cover and root biomass in croplands, resulting in lower soil porosity and making it impossible to drain normally after precipitation to retain higher soil moisture [63]. Soil moisture is crucial for vegetation growth and enhances physiological processes such as respiration and photosynthesis [28]. Because of the strong relationship between water and carbon cycles, a deficiency in soil moisture will likely restrict the amount of vegetation that can act as a carbon sink [64]. Jiang et al. [65] demonstrated that soil moisture significantly affected NPP and determined the overall water availability for evaporation and vegetation. A reduction in soil moisture causes vapor pressure deficit to increase, which reduces vegetation growth and NPP [66]. Hou et al. [67] showed that increased soil moisture in grasslands can promote the growth of shallow-rooted plants, thus increasing the NPP. Zhao et al. [68] concluded the soil moisture content under different types of vegetation cover was in the order of cropland > grassland > woodland, and we found that soil moisture contributed more to the NPP of the croplands than to that of woodlands and grasslands. Our findings demonstrated that soil moisture had an important effect on vegetation NPP. The role of soil moisture should be emphasized when considering the response of vegetation to climate change.
Surface air temperature and vegetation activity are primarily determined by solar radiation. Stronger solar radiation is associated with higher air temperatures [69]. Sufficient solar radiation can promote plant photosynthesis, thereby affecting vegetation growth and hydrothermal conditions to improve vegetation NPP [70]. Higher air temperatures in spring and autumn can increase the NPP of vegetation by extending the growing season [71]. The present study found that climatic factors negatively affected woodland NPP by 57.03%, primarily owing to the adverse effects of solar radiation (Figure 7). The negative contribution of solar radiation was mainly distributed in southern China and the coastal areas, where air temperatures were generally higher. When solar radiation exceeds a specific threshold, strong light results in the closure of stomata, which weakens or stops photosynthesis, thus affecting the light use efficiency by plants, the absorption efficiency of nutrients, and reducing NPP [72].

4.3. Effects of Human Activities on NPP Variation in Different Land Cover Types

Human activities improve NPP by increasing vegetation cover, whereas excessive human activities accelerate vegetation degradation. Ge et al. [39] reported that from 2001 to 2016, both human activities and climate change promoted NPP in China. The joint effect of climate change and human activities was the primary factor responsible for the increase in NPP in woodlands, grasslands and croplands (Figure 8). Climate change is a significant factor in cropland expansion [73] and increases in cropland NPP in China are typically promoted by human activities. Overall, the contribution of human activities to the increase in NPP was in the order of croplands > woodlands > grasslands (Figure 7).
In 1979, the planted forest area was 1.08 × 10⁸ ha in China [74]. The forest coverage rate has doubled over the past 40 years. China has experienced the largest net global increase in forests over the past decade [48]. In China, the existing forest area is approximately 2.20 × 10⁸ ha, and there is still 0.4 × 10⁸ ha of land suitable for afforestation [75]. Currently, the largest land conservation project in the world is the Grain for Green Project, and our findings showed that the increase in woodlands was mainly caused by the transfer from croplands (Figure 6). The expansion of new woodlands has increased their capacity for carbon sequestration. However, the average annual growth of forests remains below the international level and the average potential of woodlands in China [76]. Organic carbon storage in new woodlands may be affected by climate change, soil type, and site conditions [77]. Therefore, it is worthwhile conducting future studies to determine how to maximize the productivity of woodlands in China.
Grassland degradation has escalated in China at the regional to national scales [10]. Extensive cultivation and overgrazing have led to significant ecological issues including grassland degradation and desertification [78]. Since 2000, the Chinese government has implemented policies such as returning croplands to grasslands, returning grazing lands to grasslands, and establishing artificial grasslands. The Grassland Ecological Compensation Policy has tried to slow down the degradation of grasslands and restore degraded grasslands [79]. The transfer of unutilized lands and croplands was the primary cause of the increase in the grassland area (Figure 6). The establishment of artificial grasslands can significantly increase soil and underground biomass carbon storage, thereby promoting the restoration of grasslands that have been degraded [80]. The Grassland Ecological Compensation Policy of China provides ecological subsidies to herders who maintain grazing rates within the prescribed carrying capacity in grass–animal balance zones and stop grazing in grazing areas. It is the largest ecological compensation program for grasslands worldwide [81]. Wu et al. [23] confirmed that these policies significantly increased the proportion of grassland restoration by controlling stocking rates. The Chinese government has expanded woodland, grassland, and cropland areas through ecological projects to increase vegetation productivity. The appropriate conversion of land cover types within the context of land use transfer deserves further investigation.

4.4. Limitations and Uncertainty

We used residual analysis to calculate the contributions of climate change and human activities to vegetation NPP, ignoring the complex interactions between climate change and human activities. Hence, it was not possible to quantify the specific contributions of human activities (e.g., irrigation, urbanization, and aerosols) to vegetation NPP. However, residual analysis methods have been widely used to quantify the contributions of climate change and human activities. Considering the remaining uncertainties, more reliable methods such as machine learning are needed to quantify the interaction between climate change and human activities, identify and distinguish the impact of different human activities on vegetation, and improve the calculation of factors driving vegetation NPP changes.

5. Conclusions

The highest average values of NPP and LDCI were in woodlands (692.55 g C m−2 a−1) and croplands (280.93), respectively. Except for croplands (39.39%), the correlation between NPP and LDCI values in woodlands and grasslands was negative. Enhanced anthropogenic management of croplands can improve vegetation NPP. Excessive human intervention was detrimental to the increase in woodland NPP values and moderate management measures should be applied to woodlands. In woodlands, the average contribution of climatic factors to NPP was in the order of precipitation > soil moisture > air temperature > solar radiation. The average contributions of climatic factors to NPP for grasslands and croplands were in the order of precipitation > solar radiation > soil moisture > air temperature. Precipitation was the main factor affecting vegetation NPP and the utilization efficiency of vegetation to precipitation can be improved by optimizing management measures. The primary drivers of NPP in woodlands (42.83%), grasslands (53.49%), and croplands (45.22%) were the positive joint effects of climate change and human activities. Except for woodlands (48.65%), the contribution of human activities to NPP was higher than that of climate change, and it was 51.39% for grasslands and 68.49% for croplands. In the future, additional climatic factors (e.g., aridity index) and extreme climate events should be considered when evaluating the contribution of climate change to NPP.

Author Contributions

Conceptualization, Y.W. (Yating Wang) and X.T.; methodology, Y.W. (Yating Wang); software, Y.W. (Yating Wang) and M.Y.; validation, Y.W. (Yating Wang); resources, Y.W. (Yin Wang) and M.Y.; data curation, Y.W. (Yating Wang); writing—original draft preparation, Y.W. (Yating Wang) and X.T.; writing—review and editing, X.T. and J.L.; visualization, Y.W. (Yin Wang); supervision, X.T. and J.L.; project administration, X.T.; funding acquisition, X.T. All authors have read and agreed to the published version of the manuscript.

Funding

This study was sponsored by the National Natural Science Foundation of China (32271875, 31872703).

Data Availability Statement

Data will be made available on request.

Acknowledgments

We also acknowledge the data support from “National Tibetan Plateau Data Center and zenodo”.

Conflicts of Interest

The authors declare that they have no known competing financial interests or personal relationships that could have appeared to influence the work reported in this paper.

References

  1. Ji, Y.; Zhou, G.; Luo, T.; Dan, Y.; Zhou, L.; Lv, X. Variation of net primary productivity and its drivers in China’s forests during 2000–2018. For. Ecosyst. 2020, 7, 1–11. [Google Scholar] [CrossRef]
  2. Riva, F.; Martin, C.J.; Millard, K.; Fahrig, L. Loss of the world’s smallest forests. Glob. Change Biol. 2022, 28, 7164–7166. [Google Scholar] [CrossRef] [PubMed]
  3. Dixon, R.K.; Brown, S.; Houghton, R.A.; Trexier, M.C.; Wisniewski, J. Carbon pools and flux of global forest ecosystems. Science 1994, 263, 185–190. [Google Scholar] [CrossRef] [PubMed]
  4. Zhang, H.; Wang, K.; Zeng, Z.; Du, H.; Zou, Z.; Xu, Y.; Zeng, F. Large-scale patterns in forest growth rates are mainly driven by climatic variables and stand characteristics. For. Ecol. Manag. 2019, 435, 120–127. [Google Scholar] [CrossRef]
  5. Zhou, G.; Wang, Y.; Jiang, Y.; Yang, Z. Estimating biomass and net primary production from forest inventory data: A case study of China’s Larix forests. For. Ecol. Manag. 2002, 169, 149–157. [Google Scholar] [CrossRef]
  6. Yao, Y.; Piao, S.; Wang, T. Future biomass carbon sequestration capacity of Chinese forests. Sci. Bull. 2018, 63, 1108–1117. [Google Scholar] [CrossRef]
  7. Liu, Y.; Yang, Y.; Wang, Q.; Du, X.; Li, J.; Gang, C.; Zhou, W.; Wang, Z. Evaluating the responses of net primary productivity and carbon use efficiency of global grassland to climate variability along an aridity gradient. Sci. Total Environ. 2019, 652, 671–682. [Google Scholar] [CrossRef]
  8. Liu, X.; Xu, Y.Y.; Sun, S.K.; Zhao, X.N.; Wu, P.T.; Wang, Y.B. What is the potential to improve food security by restructuring crops in Northwest China? J. Clean. Prod. 2022, 378, 134620. [Google Scholar] [CrossRef]
  9. Zhou, W.; Yang, H.; Zhou, L.; Chen, Y.; Huang, L.; Ju, W. Dynamics of grassland carbon sequestration and its coupling relation with hydrothermal factor of Inner Mongolia. Ecol. Indic. 2018, 95, 1–11. [Google Scholar] [CrossRef]
  10. Liu, Y.; Zhou, R.; Ren, H.; Zhang, W.; Zhang, Z.; Zhang, Z.; Wen, Z. Evaluating the dynamics of grassland net primary productivity in response to climate change in China. Glob. Ecol. Conserv. 2021, 28, e01574. [Google Scholar] [CrossRef]
  11. Maestrini, B.; Mimić, G.; van Oort, P.A.; Jindo, K.; Brdar, S.; Athanasiadis, I.N.; van Evert, F.K. Mixing process-based and data-driven approaches in yield prediction. Eur. J. Agron. 2022, 139, 126569. [Google Scholar] [CrossRef]
  12. Tao, F.L.; Palosuo, T.; Valkama, E.; Makipaa, R. Cropland soils in China have a large potential for carbon sequestration based it on literature survey. Soil Till. Res. 2019, 186, 70–78. [Google Scholar] [CrossRef]
  13. Ortiz-Bobea, A.; Ault, T.R.; Carrillo, C.M.; Chambers, R.G.; Lobell, D.B. Anthropogenic climate change has slowed global agricultural productivity growth. Nat. Clim. Change 2021, 11, 306–312. [Google Scholar] [CrossRef]
  14. Intergovernmental Panel on Climate Change. Sixth Assessment Report. 2022. Available online: https://www.ipcc.ch/assessment-report/ar6/ (accessed on 24 July 2024).
  15. Walther, G.R.; Post, E.; Convey, P.; Menzel, A.; Parmesan, C.; Beebee, T.J.C.; Fromentin, J.M.; Hoegh, G.O.; Bairlein, F. Ecological responses to recent climate change. Nature 2002, 416, 389–395. [Google Scholar] [CrossRef]
  16. Li, H.; Sun, B.; Wang, H.; Zhou, B.; Ma, X. Characteristics and mechanisms of the severe compound cold-wet event in southern China during February 2022. Environ. Res. Lett. 2023, 18, 114021. [Google Scholar] [CrossRef]
  17. Parra, A.; Greenberg, J. Climate-limited vegetation change in the conterminous United States of America. Glob. Change Biol. 2024, 30, e17204. [Google Scholar] [CrossRef]
  18. Rüger, N.; Condit, R.; Dent, D.H.; DeWalt, S.J.; Hubbell, S.P.; Lichstein, J.W.; Lopez, O.R.; Wirth, C.; Farrior, C.E. Demographic trade-offs predict tropical forest dynamics. Science 2020, 368, 165. [Google Scholar] [CrossRef]
  19. Huang, Y.; Huang, L.; Qiu, C.J.; Ciais, P. Evaluation of effects of heat released from SOC decomposition on soil carbon stock and temperature. Glob. Change Biol. 2024, 30, e17391. [Google Scholar] [CrossRef]
  20. Xu, X.; Jiang, H.; Guan, M.; Wang, L.; Huang, Y.; Jiang, Y.; Wang, A. Vegetation responses to extreme climatic indices in coastal China from 1986 to 2015. Sci. Total Environ. 2020, 744, 140784. [Google Scholar] [CrossRef]
  21. Piedallu, C.; Chéret, V.; Denux, J.P.; Perez, V.; Azcona, J.S.; Seynave, I.; Gégout, J.C. Soil and climate differently impact NDVI patterns according to the season and the stand type. Sci. Total Environ. 2019, 651, 2874–2885. [Google Scholar] [CrossRef]
  22. Kazanski, C.E.; Cowles, J.; Dymond, S.; Clark, A.T.; David, A.S.; Jungers, J.M.; Kendig, A.E.; Riggs, C.E.; Trost, J.; Wei, X.J. Water availability modifies productivity response to biodiversity and nitrogen in long-term grassland experiments. Ecol. Appl. 2021, 31, e02363. [Google Scholar] [CrossRef] [PubMed]
  23. Wu, N.; Liu, A.; Ye, R.; Yu, D.; Du, W.; Chaolumeng, Q.; Liu, G.; Yu, S. Quantitative analysis of relative impacts of climate change and human activities on Xilingol grassland in recent 40 years. Glob. Ecol. Conserv. 2021, 32, e01884. [Google Scholar] [CrossRef]
  24. Sun, J.; Yan, Y.; Zhang, B.; Liu, W.; Dou, S.; Wang, X.; Huang, J.; Chen, D.; Wang, C.; Han, X.; et al. Changes in productivity partitioning induced by precipitation extremes increase inaccuracy of grassland carbon estimation. Glob. Change Biol. 2024, 30, e17404. [Google Scholar] [CrossRef] [PubMed]
  25. Wang, X.; Wang, C.; Wu, J.; Miao, G.; Chen, M.; Chen, S.; Wang, S.; Guo, Z.; Wang, Z.; Wang, B.; et al. Intermediate Aerosol Loading Enhances Photosynthetic Activity of Croplands. Geophys. Res. Lett. 2021, 48, e2020GL091893. [Google Scholar] [CrossRef]
  26. Zhao, M.; Cao, L. Regional response of land hydrology and carbon uptake to different amounts of solar radiation modification. Earth’s Future 2022, 10, e2022EF003288. [Google Scholar] [CrossRef]
  27. Yu, T.; Jiapaer, G.L.; Long, G.; Li, X.; Jing, J.Y.; Liu, Y.; De Maeyer, P.; Van de Voorde, T. Interannual and seasonal relationships between photosynthesis and summer soil moisture in the Ili River basin, Xinjiang, 2000–2018. Sci. Total Environ. 2023, 856, 159191. [Google Scholar] [CrossRef]
  28. Yoo, C.; Na, W.; Chang, K.H.; Song, S.K. Ecohydrological investigation of cloud seeding effect on vegetation activity in the Boryeong Dam Basin, South Korea. Sci. Total Environ. 2024, 940, 173598. [Google Scholar] [CrossRef]
  29. De, J.R.; Schaepman, M.E.; Furrer, R.; De, B.S.; Verburg, P.H. Spatial relationship between climatologies and changes in global vegetation activity. Glob. Change Biol. 2013, 19, 1953–1964. [Google Scholar]
  30. Tong, X.; Brandt, M.; Yue, Y.; Ciais, P.; Jepsen, M.; Penuelas, J.; Wigneron, J.P.; Xiao, X.; Song, X.P.; Horion, S.; et al. Forest management in Southern China generates short term extensive carbon sequestration. Nat. Commun. 2020, 11, 129. [Google Scholar] [CrossRef]
  31. Chen, C.; Park, T.; Wang, X.H.; Piao, S.L.; Xu, B.D.; Chaturvedi, R.K.; Fuchs, R.; Brovkin, V.; Ciais, P.; Fensholt, R.; et al. China and India lead in greening of the world through land-use management. Nat. Sustain. 2019, 2, 122–129. [Google Scholar] [CrossRef]
  32. Liu, J.G.; Li, S.X.; Ouyang, Z.Y.; Tam, C.; Chen, X.D. Ecological and socioeconomic effects of China’s policies for ecosystem services. Proc. Natl. Acad. Sci. USA 2008, 105, 9477–9482. [Google Scholar] [CrossRef] [PubMed]
  33. Chen, Y.Z.; Feng, X.M.; Tian, H.Q.; Wu, X.T.; Gao, Z.; Feng, Y.; Piao, S.L.; Lv, N.; Pan, N.Q.; Fu, B.J. Accelerated increase in vegetation carbon sequestration in China after 2010: A turning point resulting from climate and human interaction. Glob. Change Biol. 2021, 27, 5848–5864. [Google Scholar] [CrossRef] [PubMed]
  34. Cao, S.X.; Xia, C.Q.; Xian, J.L.; Guo, H.; Zheng, H.R. Payoff of the grain for green policy. J. Appl. Ecol. 2020, 57, 1180–1188. [Google Scholar] [CrossRef]
  35. Sun, B.; Li, Z.Y.; Gao, W.T.; Zhang, Y.Y.; Gao, Z.H.; Song, Z.L.; Qin, P.Y.; Tian, X. Identification and assessment of the factors driving vegetation degradation/regeneration in drylands using synthetic high spatiotemporal remote sensing Data-A case study in Zhenglanqi, Inner Mongolia China. Ecol. Indic. 2019, 107, 105614. [Google Scholar] [CrossRef]
  36. Shen, F.; Yang, L.; Zhang, L.; Guo, M.; Huang, H.; Zhou, C. Quantifying the direct effects of long-term dynamic land use intensity on vegetation change and its interacted effects with economic development and climate change in jiangsu, China. J. Environ. Manag. 2023, 325, 116562. [Google Scholar] [CrossRef]
  37. Ma, M.; Wang, Q.; Liu, R.; Zhao, Y.; Zhang, D. Effects of climate change and human activities on vegetation coverage change in northern China considering extreme climate and time-lag and -accumulation effects. Sci. Total Environ. 2023, 860, 160527. [Google Scholar] [CrossRef]
  38. Xie, S.; Mo, X.; Hu, S.; Liu, S. Contributions of climate change, elevated atmospheric CO2 and human activities to ET and GPP trends in the Three-North Region of China. Agric. For. Meteorol. 2020, 295, 108183. [Google Scholar] [CrossRef]
  39. Ge, W.; Deng, L.; Wang, F.; Han, J. Quantifying the contributions of human activities and climate change to vegetation net primary productivity dynamics in China from 2001 to 2016. Sci. Total Environ. 2021, 773, 145648. [Google Scholar] [CrossRef]
  40. Gao, W.; Zheng, C.; Liu, X.; Lu, Y.; Chen, Y.; Wei, Y.; Ma, Y. NDVI-based vegetation dynamics and their responses to climate change and human activities from1982 to 2020: A case study in the Mu Us Sandy Land, China. Ecol. Indic. 2022, 137, 108745. [Google Scholar] [CrossRef]
  41. Peng, S. 1-km Monthly Mean Temperature Dataset for China (1901–2023); National Tibetan Plateau/Third Pole Environment Data Center: Beijing, China, 2019. [Google Scholar]
  42. Peng, S. 1-km Monthly Precipitation Dataset for China (1901–2023); National Tibetan Plateau/Third Pole Environment Data Center: Beijing, China, 2020. [Google Scholar]
  43. Shangguan, W.; Li, Q.; Shi, G. A 1 km Daily Soil Moisture Dataset over China Based on In-Situ Measurement (2000–2022); National Tibetan Plateau/Third Pole Environment Data Center: Beijing, China, 2022. [Google Scholar]
  44. Yang, J.; Huang, X. The 30 m annual land cover datasets and its dynamics in China from 1985 to 2022. Earth Syst. Sci. Data 2023, 13, 3907–3925. [Google Scholar] [CrossRef]
  45. Zhang, X.; Yue, Y.; Tong, X.; Wang, K.; Qi, X.; Deng, C.; Brandt, M. Eco-engineering controls vegetation trends in southwest China karst. Sci. Total Environ. 2021, 770, 145160. [Google Scholar] [CrossRef] [PubMed]
  46. Li, H.; Wu, Y.; Liu, S.; Xiao, J. Regional contributions to interannual variability of net primary production and climatic attributions. Agric. For. Meteorol. 2021, 303, 108384. [Google Scholar] [CrossRef]
  47. Wang, X.; Tan, K.; Chen, B.Z.; Du, P.J. Assessing the spatiotemporal variation and impact factors of net primary productivity in China. Sci. Rep. 2017, 7, 44415. [Google Scholar] [CrossRef] [PubMed]
  48. FAO. Global Forest Resources Assessment 2020: Key Findings; FAO: Rome, Italy, 2020. [Google Scholar]
  49. Qiu, Z.; Feng, Z.; Song, Y.; Li, M.; Zhang, P. Carbon sequestration potential of forest vegetation in China from 2003 to 2050: Predicting forest vegetation growth based on climate and the environment. J. Clean. Prod. 2020, 252, 119715. [Google Scholar] [CrossRef]
  50. Gao, J.; Ji, Y.; Zhang, X. Net primary productivity exhibits a stronger climatic response in planted versus natural forests. Ecol. Manag. 2023, 529, 120722. [Google Scholar] [CrossRef]
  51. Liu, Y.; Yang, P.; Zhang, Z.; Zhang, W.; Wang, Z.; Zhang, Z.; Ren, H.; Zhou, R.; Wen, Z.; Hu, T. Diverse responses of grassland dynamics to climatic and anthropogenic factors across the different time scale in China. Ecol. Indic. 2021, 132, 108341. [Google Scholar] [CrossRef]
  52. Zhang, M.; Zhang, F.; Guo, L.; Dong, P.; Cheng, C.; Kumar, P.; Johnson, B.A.; Chan, N.W.; Shi, J. Contributions of climate change and human activities to grassland degradation and improvement from 2001 to 2020 in Zhaosu County. China. J. Environ. Manag. 2023, 348, 119465. [Google Scholar] [CrossRef]
  53. Zhou, W.; Yang, H.; Huang, L.; Chen, C.; Lin, X.; Hu, Z.; Li, J. Grassland degradation remote sensing monitoring and driving factors quantitative assessment in China from 1982 to 2010. Ecol. Indic. 2017, 83, 303–313. [Google Scholar] [CrossRef]
  54. Liu, Y.; Jun, Z.; Zhang, C.; Xiao, B.; Liu, L.; Cao, Y. Spatial and temporal variations of vegetation net primary productivity and its responses to climate change in Shandong Province from 2000 to 2015. Chin. J. Ecol. 2019, 690, 27–39. [Google Scholar]
  55. Smith, W.K.; Cleveland, C.C.; Reed, S.C.; Running, S.W. Agricultural conversion without external water and nutrient inputs reduces terrestrial vegetation productivity. Geopyhs. Res. Lett. 2014, 41, 449–455. [Google Scholar] [CrossRef]
  56. Liu, Y.Q.; Song, W.; Deng, X.Z. Changes in crop type distribution in Zhangye City of the Heihe River Basin, China. Appl. Geogr. 2016, 76, 22–36. [Google Scholar] [CrossRef]
  57. Xiao, X.; Li, X.; Jiang, T.; Tan, M.; Hu, M.; Liu, Y.; Zeng, W. Response of net primary production to land use and climate changes in the middle-reaches of the Heihe River basin. Ecol. Evol. 2019, 9, 4651–4666. [Google Scholar] [CrossRef] [PubMed]
  58. Haberl, H.; Erb, K.H.; Krausmann, F.; Gaube, V.; Bondeau, A.; Plutzar, C.; Gingrich, S.; Lucht, W.; Fischer-Kowalski, M. Quantifying and mapping the human appropriation of net primary production in earth’s terrestrial ecosystems. Proc. Natl. Acad. Sci. USA 2007, 104, 12942–12947. [Google Scholar] [CrossRef] [PubMed]
  59. Ji, X.; Thompson, A.; Lin, J.S.; Jiang, F.S.; Ge, H.L.; Yu, M.M.; Huang, Y.H. Modeling spatial distribution of rainfall infiltration amounts in South China using cellular automata and its relationship with the occurrence of collapsing gullies. Catena 2020, 194, 104676. [Google Scholar] [CrossRef]
  60. Zhang, X.; Zhao, W.; Wang, L.; Liu, Y.; Liu, Y.; Feng, Q. Relationship between soil water content and soil particle size on typical slopes of the Loess Plateau during a drought year. Sci. Total Environ. 2019, 648, 943–954. [Google Scholar] [CrossRef]
  61. Zhang, J.; Duan, L.; Liu, T.; Chen, Z.; Wang, Y.; Li, M.; Zhou, Y. Experimental analysis of soil moisture response to rainfall in a typical grassland hillslope under different vegetation treatments. Environ. Res. 2022, 213, 113608. [Google Scholar] [CrossRef]
  62. Shi, P.; Li, P.; Li, Z.N.; Sun, J.M.; Wang, D.J.; Min, Z.Q. Effects of grass vegetation coverage and position on runoff and sediment yields on the slope of Loess Plateau, China. Agric. Water Manag. 2021, 259, 107231. [Google Scholar] [CrossRef]
  63. Sun, W.; Zhao, X.; Gao, X.; Shi, W.; Ling, Q.; Siddique, K.H.M. Impacts of land use conversion on the response of soil respiration to precipitation in drylands: A case study with four-yearlong observations. Agric. For. Meteorol. 2021, 304–305, 108426. [Google Scholar] [CrossRef]
  64. Ahlström, A.; Raupach, M.R.; Schurgers, G.; Smith, B.; Arneth, A.; Jung, M.; Reichstein, M.; Canadell, J.G.; Friedlingstein, P.; Jain, A.K.; et al. The Dominant Role of Semi-Arid Ecosystems in the Trend and Variability of the Land CO2 Sink. Science 2015, 348, 895–899. [Google Scholar] [CrossRef]
  65. Jiang, Y.; Hou, W.J.; Gao, J.B.; Wu, S.H. Refined revealing the chain path of multiple ecosystem services under diverse environmental factor gradients. Sci. Total Environ. 2023, 865, 161187. [Google Scholar] [CrossRef]
  66. Yuan, W.; Zheng, Y.; Piao, S.; Ciais, P.; Lombardozzi, D.; Wang, Y.; Ryu, Y.; Chen, G.; Dong, W.; Hu, Z.; et al. Increased atmospheric vapor pressure deficit reduces global vegetation growth. Sci. Adv. 2019, 5, eaax1396. [Google Scholar] [CrossRef] [PubMed]
  67. Hou, Q.Q.; Yang, H.; Wu, J.S.; Yu, X.J. Carbon budget response to climate change varies with grassland type in Qilian Mountains, China. Glob. Ecol. Conserv. 2023, 47, e02670. [Google Scholar] [CrossRef]
  68. Zhao, C.; Jia, X.; Zhu, Y. Long-term temporal variations of soil water content under different vegetation types in the Loess Plateau, China. Catena 2017, 158, 55–62. [Google Scholar] [CrossRef]
  69. Li, S.; He, S. The Variation of Net Primary Productivity and Underlying Mechanisms Vary under Different Drought Stress in Central Asia from 1990 to 2020. Agric. For. Meteorol. 2022, 314, 108767. [Google Scholar] [CrossRef]
  70. Guo, D.; Song, X.; Hu, R.; Cai, S.; Zhu, X.; Hao, Y. Grassland type-dependent spatiotemporal characteristics of productivity in Inner Mongolia and its response to climate factors. Sci. Total Environ. 2021, 775, 145644. [Google Scholar] [CrossRef]
  71. Shen, M.G.; Wang, S.P.; Jiang, N.; Sun, J.P.; Cao, R.Y.; Ling, X.F.; Fang, B.; Zhang, L.; Zhang, L.H.; Xu, X.Y.; et al. Plant phenology changes and drivers on the Qinghai–Tibetan Plateau. Nat. Rev. Earth Environ. 2022, 3, 633–651. [Google Scholar] [CrossRef]
  72. Chen, B.; Jiapaer, G.; Yu, T.; Zhang, L.; Tu, H.; Liang, H.; Lin, K.; Ju, T.; Ling, Q. The role of climatic factor timing on grassland net primary productivity in Altay, Xinjiang. Ecol. Indic. 2023, 157, 111243. [Google Scholar] [CrossRef]
  73. Zaveri, E.; Russ, J.; Damania, R. Rainfall anomalies are a significant driver of cropland expansion. Proc. Natl. Acad. Sci. USA 2020, 117, 10225–10233. [Google Scholar] [CrossRef]
  74. National Forestry and Grassland Administration. China Forestry and Grassland Statistical Yearbook 2019; China Forestry Publishing House: Beijing, China, 2020. [Google Scholar]
  75. Ke, S.; Zhang, Z.; Wang, Y. China’s forest carbon sinks and mitigation potential from carbon sequestration trading perspective. Ecol. Indic. 2023, 148, 110054. [Google Scholar] [CrossRef]
  76. Ke, S.; Qiao, D.; Yuan, W.; He, Y. Broadening the scope of forest transition inquiry: What does China’s experience suggest? For. Policy Econ. 2020, 118, 102240. [Google Scholar] [CrossRef]
  77. Wang, X.G.; Zhou, M.H.; Li, T.; Ke, Y.; Zhu, B. Land use change effects on ecosystem carbon budget in the Sichuan Basin of Southwest China: Conversion of cropland to forest ecosystem. Sci. Total Environ. 2017, 609, 556–562. [Google Scholar] [CrossRef] [PubMed]
  78. Yang, W.S.; Liu, Y.; Zhao, J.; Chang, X.; Wiesmeier, M.; Sun, J.; Lopez-Vicente, M.; Garcia-Ruiz, R.; Gomez, J.A.; Zhou, H.; et al. SOC changes were more sensitive in alpine grasslands than in temperate grasslands during grassland transformation in China: A meta-analysis. J. Clean. Prod. 2021, 308, 127430. [Google Scholar] [CrossRef]
  79. Li, P.; Bennett, J. Understanding herders’ stocking rate decisions in response to policy initiatives. Sci. Total Environ. 2019, 672, 141–149. [Google Scholar] [CrossRef] [PubMed]
  80. Deng, L.; Zhu, G.Y.; Tang, Z.S.; Shangguan, Z.P. Global patterns of the effects of land-use changes on soil carbon stocks. Glob. Ecol. Conserv. 2016, 5, 127–138. [Google Scholar] [CrossRef]
  81. Hou, L.; Xia, F.; Chen, Q.; Huang, J.; He, Y.; Rose, N.; Rozelle, S. Grassland ecological compensation policy in China improves grassland quality and increases herders’ income. Nat. Commun. 2021, 12, 4683. [Google Scholar] [CrossRef]
Figure 1. Distribution of woodlands, grasslands, and croplands in China in 2020.
Remotesensing 17 01724 g001
Figure 2. Spatial distribution, Sen’s trend, Mann–Kendall (MK) test, and hot/cold spots of net primary productivity (NPP) in woodlands (ad), grasslands (eh), and croplands (il). SD, significant degradation; NSD, no significant degradation; NSI, no significant improvement; SI, significant improvement.
Remotesensing 17 01724 g002
Figure 3. Partial correlation analysis and significance tests of net primary productivity (NPP) with air temperature (a,e,i), precipitation (b,f,j), solar radiation (c,g,k), and soil moisture (d,h,l) in woodlands, grasslands, and croplands. r > 0 and r < 0 indicate positive and negative correlation coefficients (r), respectively.
Remotesensing 17 01724 g003
Figure 4. Spatial distribution, Sen’s trend, Mann–Kendall (MK) test, and hot/cold spots of land use degree comprehensive index (LDCI) in woodlands (ad), grasslands (eh), and croplands (il). SD, significant degradation; NSD, no significant degradation; NSI, no significant improvement; SI, significant improvement.
Remotesensing 17 01724 g004
Figure 5. Distribution of spatial correlation coefficients (r) and significance values (P) for net primary productivity (NPP) with land use degree comprehensive index (LDCI) in woodlands (a,b), grasslands (c,d), and croplands (e,f).
Remotesensing 17 01724 g005
Figure 6. Spatial shifts of different land cover types (ac) to woodlands, grasslands, and croplands, and the changes in net primary productivity (df) (NPP).
Remotesensing 17 01724 g006
Figure 7. Contributions of air temperature (a), precipitation (b), solar radiation (c), soil moisture (d), climate change (e), and human activities (f) to the yearly change in net primary productivity (NPP) in woodlands, grasslands, and croplands. The black line refers to the average value.
Remotesensing 17 01724 g007
Figure 8. Dominant factor of vegetation (woodlands, grasslands, and croplands) net primary productivity (NPP) changes (ac), and the relative contribution rates of climate change (CC) and human activities (HA) to NPP change from 2001 to 2020. CC and HA > 0, climate change and human activities increase NPP; CC > 0, climate change increases NPP; HA > 0, human activities increase NPP; CC and HA < 0, climate change and human activities decrease NPP; CC < 0, climate change decreases NPP; HA < 0, human activities decrease NPP.
Remotesensing 17 01724 g008
Table 1. Criteria for identifying and calculating the contributions of drivers affecting NPP change.
CNPPDriving FactorsDivision Criteria of Driving
Factors
Relative Contribution Rate (%)
CCCCHACCHA
>0CC and HA>0>0 C CC C NPP × 100 C HA C NPP × 100
CC>0<01000
HA<0>00100
<0CC and HA<0<0 C CC C NPP × 100 C HA C NPP × 100
CC<0>01000
HA>0<00100
Note: NPP, net primary productivity; CNPP, combined contribution of climate change (CC) and human activities (HA) to NPP change; CCC, contribution of CC to NPP change; CHA, contribution of HA to NPP change.
Disclaimer/Publisher’s Note: The statements, opinions and data contained in all publications are solely those of the individual author(s) and contributor(s) and not of MDPI and/or the editor(s). MDPI and/or the editor(s) disclaim responsibility for any injury to people or property resulting from any ideas, methods, instructions or products referred to in the content.

