Article

Analysis of Tropospheric NO2 Observation Using Pandora and MAX-DOAS Instrument in Xianghe, North China

1
National Meteorological Information Center, China Meteorological Administration, Beijing 100081, China
2
Carbon Neutrality Research Center (CNRC), Institute of Atmospheric Physics, Chinese Academy of Sciences, Beijing 100029, China
3
Key Laboratory of Middle Atmosphere and Global Environment Observation (LAGEO), Institute of Atmospheric Physics, Chinese Academy of Sciences, Beijing 100029, China
4
Key Laboratory of Atmospheric Environment and Extreme Meteorology, Institute of Atmospheric Physics, Chinese Academy of Sciences, Beijing 100029, China
5
Air Quality Research Division, Environment and Climate Change Canada, Toronto, ON M3H 5T4, Canada
6
School of Information Engineering, Nanyang Institute of Technology, Nanyang 473004, China
7
University of Chinese Academy of Sciences, Beijing 100049, China
*
Author to whom correspondence should be addressed.
Remote Sens. 2025, 17(10), 1695; https://doi.org/10.3390/rs17101695
Submission received: 11 April 2025 / Revised: 5 May 2025 / Accepted: 7 May 2025 / Published: 12 May 2025

Abstract

:
This work presents a comprehensive investigation of tropospheric NO2 measurements using a portable ground-based Pandora spectrometer, incorporating an independently designed and implemented calibration and retrieval process (P-CAR v1.0). We designed and optimized a region-specific algorithm for retrieving tropospheric NO2 column densities in China. The measurement process began with establishing a spectral calibration system for processing the Pandora’s raw observations, followed by enhancing the differential optical absorption spectroscopy (DOAS) algorithm to retrieve both the slant column densities (SCDs) and tropospheric vertical column densities (VCDs) of NO2. To validate our retrieval products, comparative analyses were conducted against co-located MAX-DOAS measurements. The results demonstrate excellent agreement between Pandora-retrieved tropospheric NO2 and MAX-DOAS observations, with correlation coefficients exceeding 0.96 for both hourly and daily mean VCDs and fitting slopes greater than 0.90. Furthermore, the validation extended to multi-satellite observations from the Ozone Monitoring Instrument (OMI) and TROPOspheric Monitoring Instrument (TROPOMI), exhibiting pronounced consistency, as evidenced by the correlation coefficients all surpassing 0.90 for the hourly mean values. These findings confirm the high accuracy and reliability of NO2 retrievals from the portable Pandora instrument, significantly boosting its potential for atmospheric monitoring and application.

1. Introduction

Nitrogen dioxide (NO2) serves as a crucial trace gas in the atmosphere, actively participating in various atmospheric chemical reactions. It acts as an important precursor for tropospheric ozone (O3) and peroxyacyl nitrates through photochemical processes and serves as a major source of nitrous acid (HONO) [1]. As an air pollutant, high concentrations of NO2 are toxic, causing respiratory system damage and posing severe health risks to humans, while its impact on air quality cannot be overlooked [2,3,4]. Accurate monitoring of atmospheric NO2 concentrations and their spatial distributions is essential for understanding its role in atmospheric chemical processes and provides critical evidence for developing effective measures to prevent and control atmospheric pollution.
There are various approaches for NO2 column detection based on remote sensing, including shipborne, aircraft, and space-based and ground-based observations. Among them, ground-based observation serves as one of the essential ways for investigating NO2 concentration characteristics and formation mechanisms, offering continuous and higher precision measurements of gas concentrations. Meanwhile, it provides effective validation for satellite remote sensing and model estimations [5,6,7,8,9,10,11]. Differential optical absorption spectroscopy (DOAS) technology using scattered light (e.g., zenith-sky DOAS and multi-axis DOAS) and direct sun (DS-DOAS) measurements have proven to be among the most effective methods for observing various trace gas components over the past few decades [12,13]. The multi-axis differential optical absorption spectroscopy (MAX-DOAS) technique offers enhanced spatial representation through its capability to observe scattered solar radiation in multiple viewing directions [14,15,16]. Solar scattered light at different solar zenith angles traverses distinct atmospheric paths and distances, and the gas absorption features in the detected spectra are closely related to various atmospheric constituents at different altitudes. These characteristics enable MAX-DOAS observations to retrieve both tropospheric NO2 vertical column densities (VCDs) and vertical profile information. With the aid of the MAX-DOAS technique, numerous studies have successfully applied MAX-DOAS for retrieving NO2, as well as other atmospheric species [9,16,17,18,19,20,21].
Research and application of portable Pandora spectrometers started relatively late compared to the MAX-DOAS instrument, with their initial applications focused on direct solar radiation measurements [22,23]. While ground-based MAX-DOAS instruments were developed many years ago and have mature technology, portable Pandora instruments, despite their slightly lower spectral observation accuracy, still face challenges related to scattered light retrieval algorithms. Additionally, their official products continue to undergo updates and improvements. However, compared to large conventional MAX-DOAS instruments (such as the one utilized in this study), portable Pandora spectrometers offer advantages such as small size, portability, and cost-effectiveness [24,25,26]. Especially in recent years, with the addition of various observation modes, such as multi-axis scattered light, twilight, and moonlight, they have demonstrated versatility in fulfilling diverse observation tasks and facilitating field experiments [26]. Consequently, Pandora instruments have been increasingly deployed for routine atmospheric composition monitoring worldwide. To date, more than 250 stations have been established globally, forming the Pandonia Global Network (PGN, https://www.pandonia-global-network.org/, last access: 28 November 2024) for operational observations of trace gases, including NO2, formaldehyde (HCHO), and O3. In 2008, Brinksma et al. [22] employed a direct solar irradiance measurement from the first Pandora (No. 1) instrument to observe total NO2 VCDs in polluted regions of the Netherlands and then compared the results with contemporaneous Ozone Monitoring Instrument (OMI) products. The results show correlation coefficients (R) of 0.68 (OMI-L2) and 0.66 (OMI-L4) between Pandora-retrieved and OMI total NO2 VCD products, marking the first practical application of Pandora. Subsequently, Herman et al. [23] conducted a comparison between two new and independently developed spectrometer systems, Pandora and MFDOAS, both using DS-DOAS technology, which demonstrated high consistency in total NO2 VCDs retrievals. The accuracy for NO2 VCD reached about 0.01 DU (1 DU = 2.7 × 10¹⁶ molecules/cm2) under clear sky conditions and 0.1 DU under general conditions, meeting the requirement for tracking diurnal NO2 variations. Zhao et al. [27] developed a new NO2 retrieval algorithm for zenith-sky measurements to extend Pandora NO2 observation to cloudy conditions. In addition, Pandora has been increasingly applied for the observation and inversion of various trace gases [28,29,30], as well as satellite validation [31,32,33,34,35,36].
To date, there are nearly ten Pandora observation stations in China. However, the lack of official algorithms and supporting software has hindered the synchronized retrieval of related products and their subsequent applications. Therefore, implementing Pandora retrieval algorithms specific to the Chinese region and generating corresponding atmospheric pollution gas products are of great significance for expanding the potential applications of Pandora spectrometers. In this study, we utilized the Pandora (No. 161) observations from the Xianghe Observatory (39.8°N, 117.0°E), a rural station located to the southeast of Beijing, China. Based on Pandora’s raw spectral observations, we independently established a Pandora spectral calibration system. Subsequently, a DOAS algorithm for retrieving NO2 tropospheric VCD was designed and optimized specifically for regional conditions in China. Finally, comparative evaluation experiments were conducted with a co-located ground-based MAX-DOAS instrument and multi-satellite observations to validate our retrieval results.

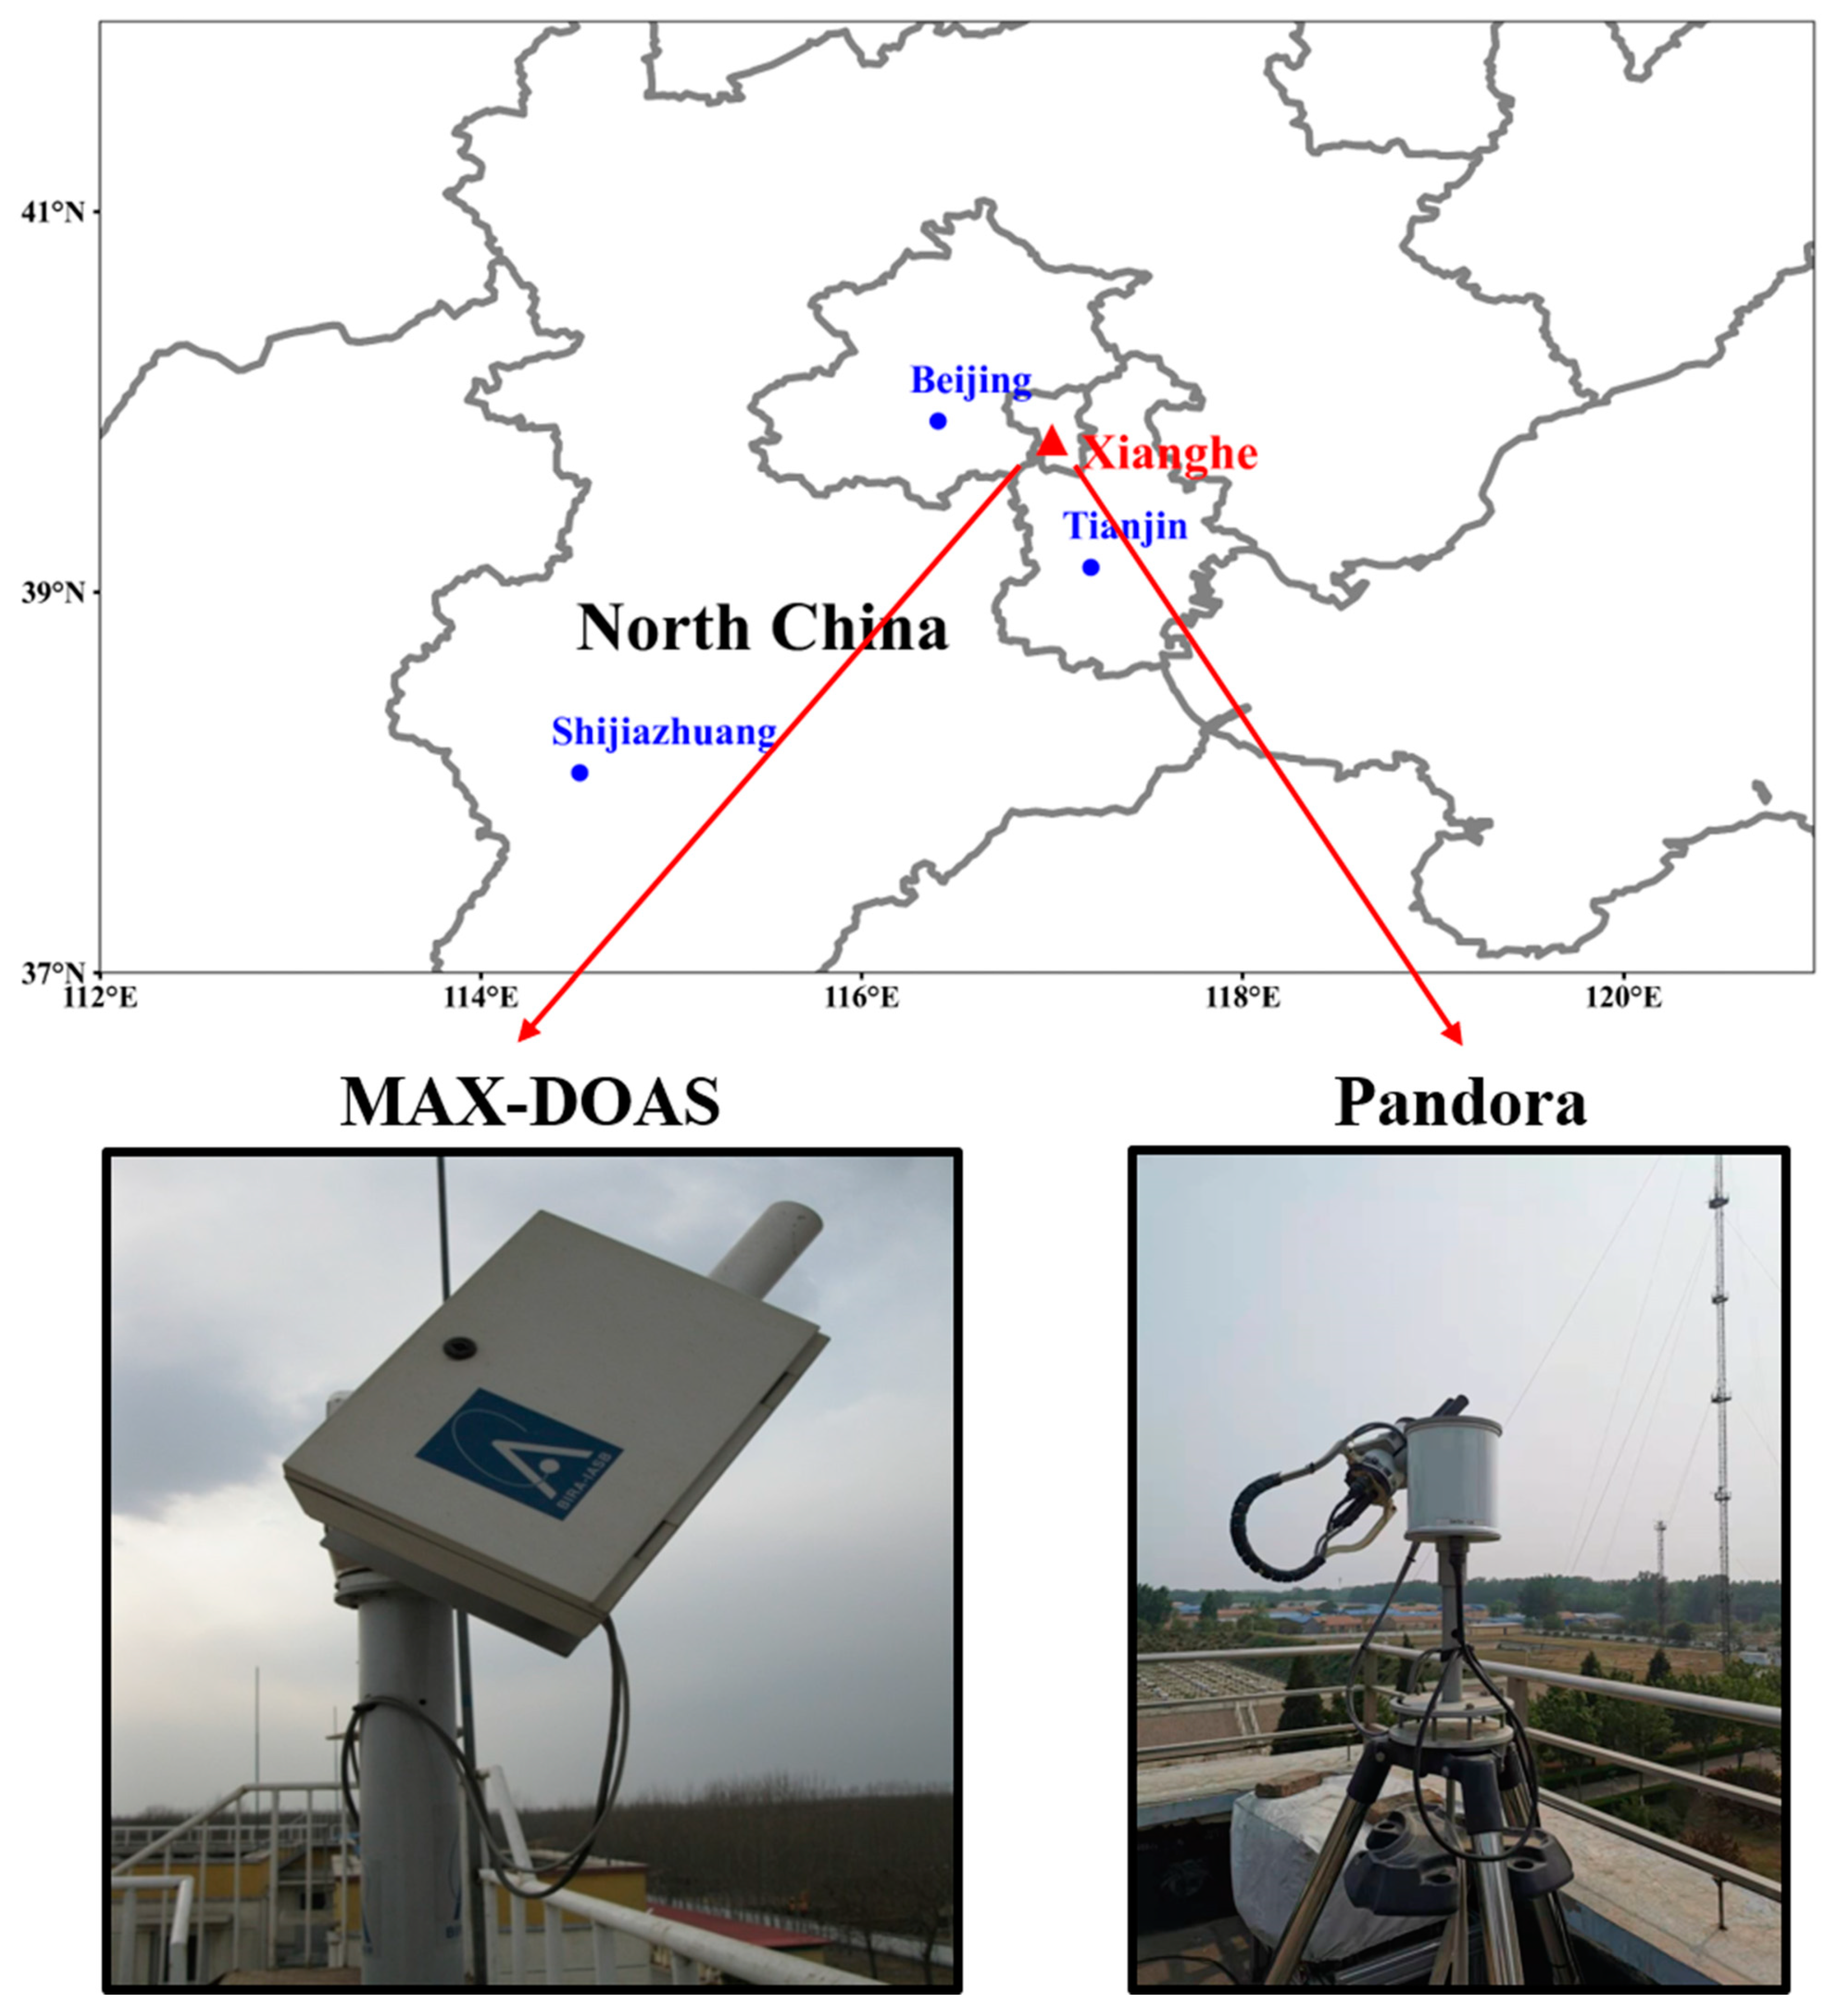
2. Instrumental and Satellite Data

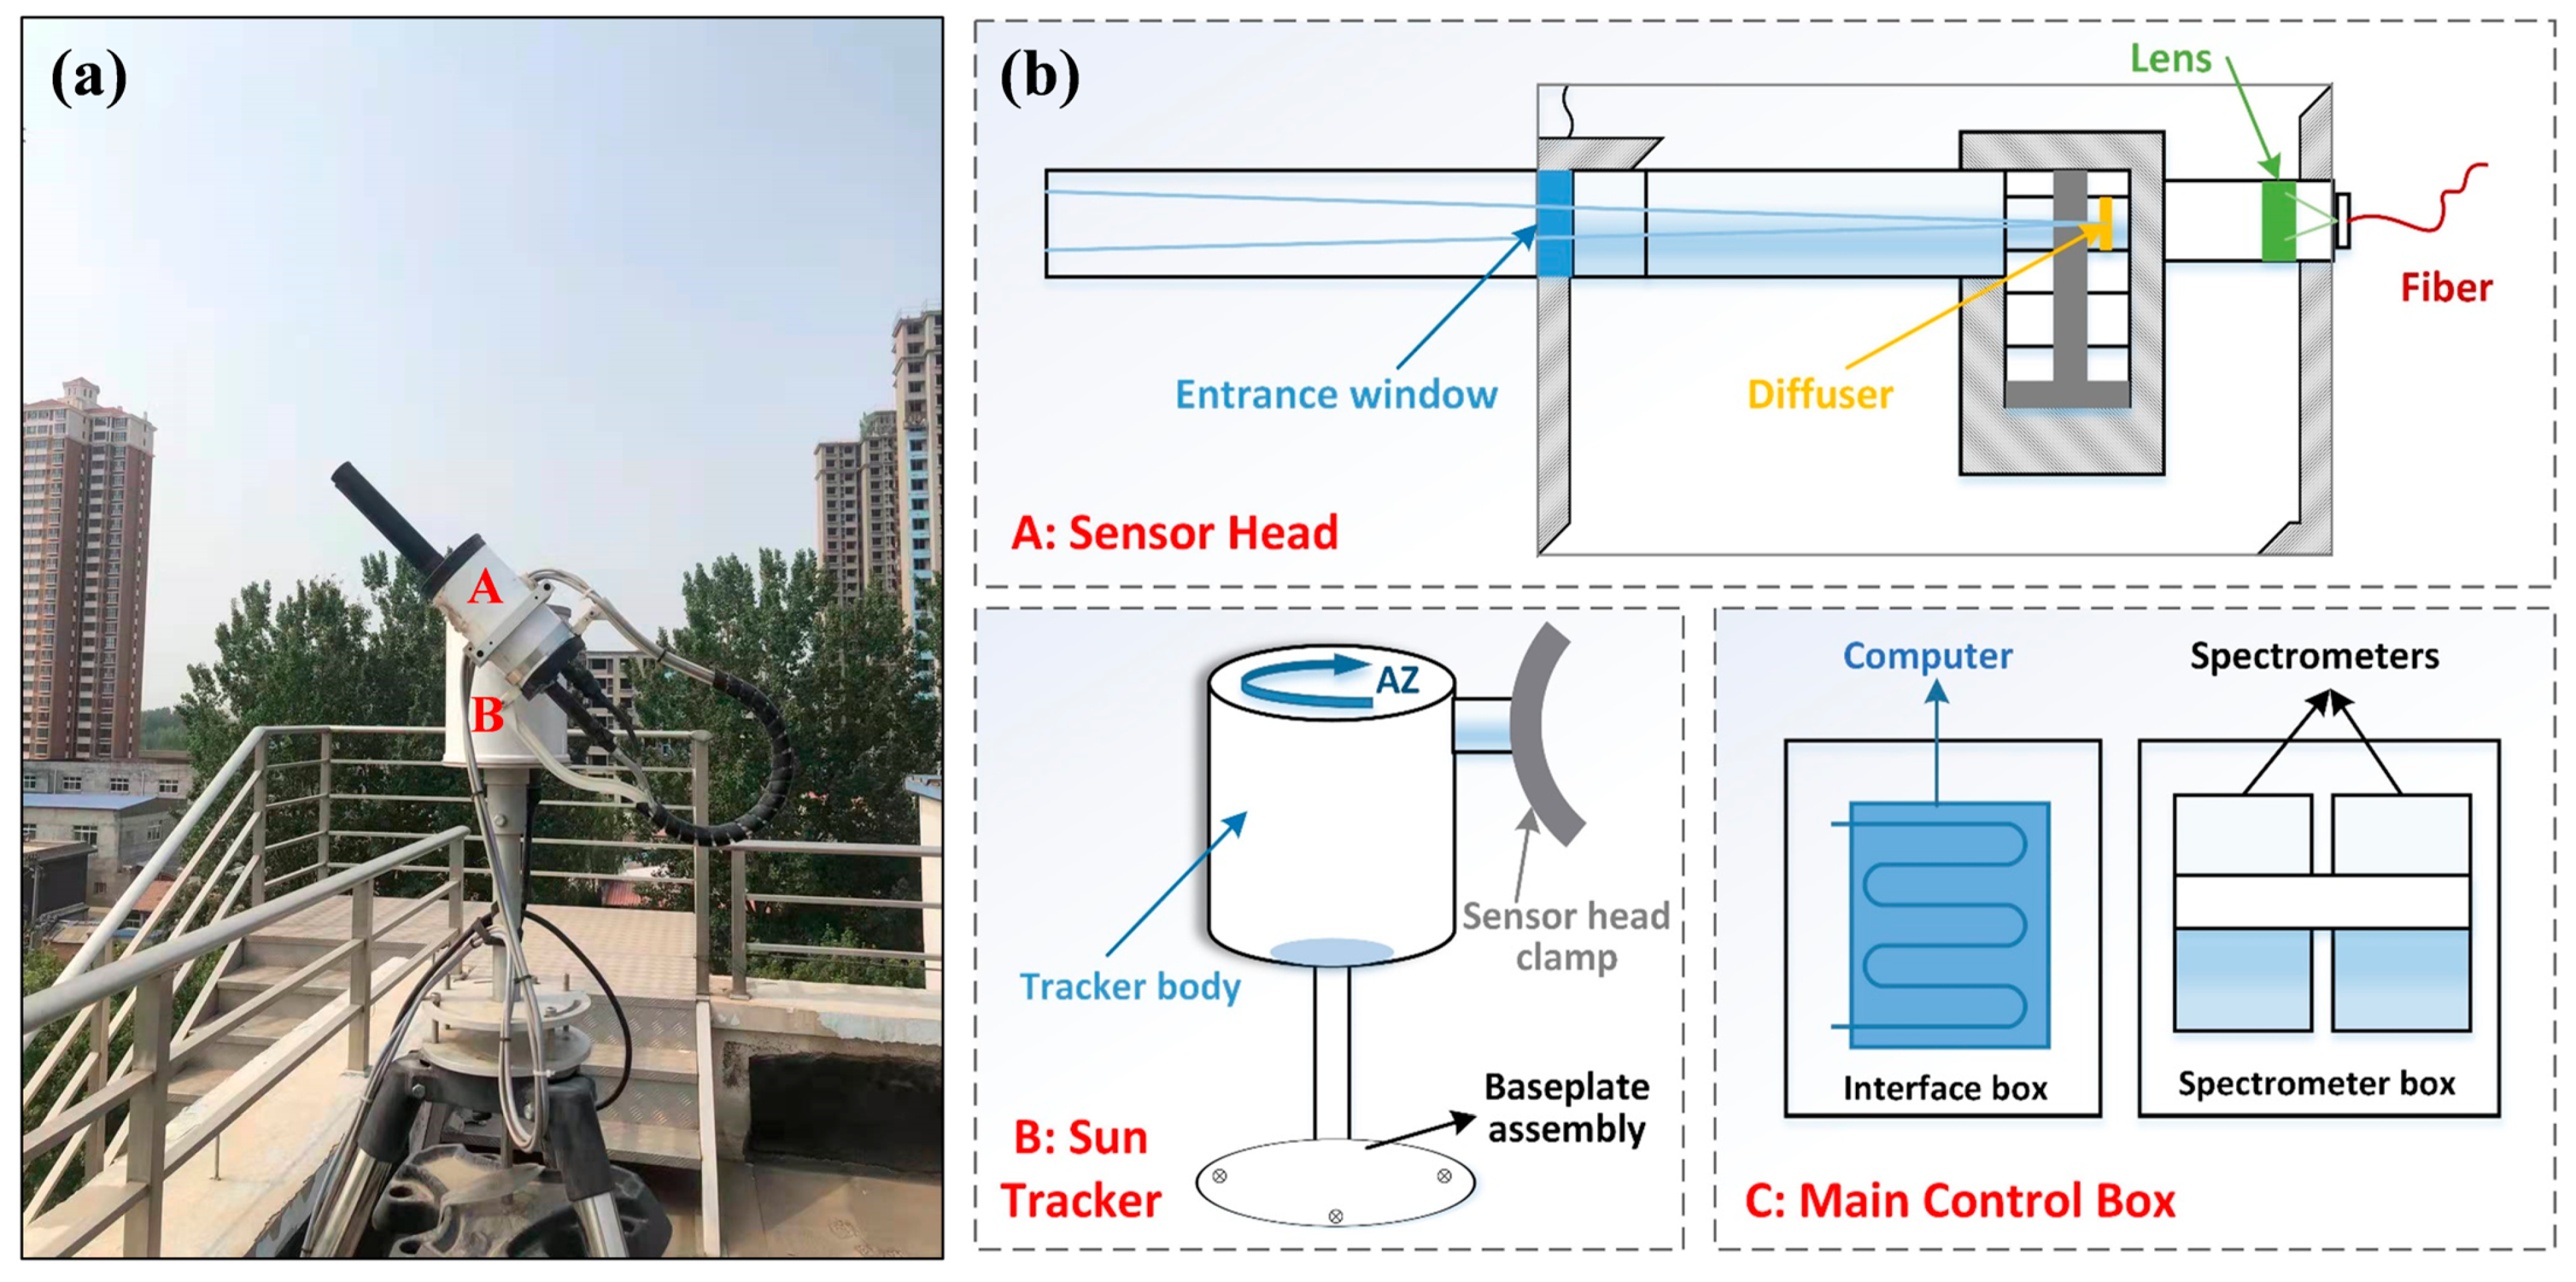
2.1. Pandora Spectrometer

The portable Pandora is a sun-viewing instrument covering both ultraviolet (UV) and visible (VIS) ranges. The instrument supports multiple observation modes, including direct-sun, zenith-sky, and off-axis measurements, with a complete measurement cycle of approximately 80 s, which includes 20 s dark-current determinations after each spectral observation. The Pandora (No. 161) used in this study was manufactured by SciGlob Instruments and Services (Columbia, MD, USA) and operated at the Xianghe site in October 2019. This instrument integrates two spectrometers: one covering the UV–VIS region (290–380 nm with a UV340 bandpass filter and 280–525 nm without a filter) and another for the VIS to near-infrared (NIR) region (400–930 nm).
The Pandora system consists of three main components: an optical sensor system, a computer-controlled solar tracker, and a control box, which enables continuous observations of both direct and scattered sunlight (see Figure 1). The instrument is housed in weather-resistant containers that maintain a stable temperature of approximately 20 °C. Under clear-sky conditions, the integration time for spectral measurement is about 2 ms. The final spectrum is derived from averaging multiple measurements (up to 4000 measurements) within a 2 s window to achieve high signal-to-noise ratio (SNR) and precision (<0.01 DU) [29]. More detailed technical specifications can be found in Herman et al. [23].
For comparison purposes, a MAX-DOAS instrument was co-located at the Xianghe Observatory. The locations of the Pandora and MAX-DOAS instruments at the Xianghe station in North China are illustrated in Figure 2. This MAX-DOAS instrument, designed and assembled by the Royal Belgian Institute for Space Aeronomy (BIRA-IASB), enables the observations of both scattered and direct sunlight. Detailed specifications of this instrument can be found in Wang et al. [19] and Clémer et al. [24]. The key characteristics of the Pandora and MAX-DOAS instruments are summarized in Table 1.

2.2. OMI and TROPOMI NO2 Product

OMI is a push-broom UV–VIS spectrometer, which was launched on 15 July 2004 aboard NASA’s EOS-Aura spacecraft. The Aura satellite orbits in a near-polar, sun-synchronous path, crossing the equator at approximately 13:45 local time. The OMI instrument is a contribution of the Netherlands’s Agency for Aerospace Programs (NIVR) in collaboration with the Finnish Meteorological Institute (FMI) to the Aura mission. OMI provides nadir measurements with a spatial resolution of approximately 13 × 24 km2. In this study, we utilized the Level 2 (L2) orbital datasets of OMI NO2 (OMNO2, Version 003), obtained from the NASA team, as satellite-based validation data to complement the Pandora ground-based retrievals. The reliability and accuracy of OMI’s NO2 products has been extensively supported by numerous scholarly research studies [6,7,37,38,39,40]. Further details regarding the OMNO2 product, including its retrieval methodology and quality assurance protocols, are comprehensively documented in the official README guidance document [41].
The TROPOspheric Monitoring Instrument (TROPOMI), a hyperspectral imaging spectrometer onboard the Sentinel-5 Precursor (S5P) satellite, launched on 13 October 2017, operates in a sun-synchronous low earth orbit at nearly 13:30 local time. The mission of S5P, commissioned and funded by the European Space Agency (ESA) and the Netherlands Space Office (NSO), is carried out by the TROPOMI Mission Performance Center (MPC) consortium. With an expansive swath width of 2600 km, TROPOMI enables near-daily global coverage, making it a powerful tool for atmospheric monitoring. In this research, the TROPOMI products used offline (OFFL) version L2 NO2 orbit data (specifically tropospheric NO2 VCDs) for comparative analysis with Pandora observations. Prior to 6 August 2019, the spatial resolution of the TROPOMI NO2 measurements at nadir was 3.5 × 7 km2, which was subsequently enhanced to 3.5 × 5.5 km2 thereafter. The TROPOMI NO2 inversion algorithm was developed by the Royal Netherlands Meteorological Institute (KNMI), building on the heritage of the NO2 DOMINO (Dutch OMI NO2) algorithm and the QA4ECV community approach, with significant improvements incorporated. Further details can be found in the S5P NO2 Algorithm Theoretical Basis Document (ATBD) [42], and comprehensive technical specifications of the TROPOMI NO2 product are available on the official TROPOMI science website (https://www.tropomi.eu/data-products/n/nitrogen-dioxide/, last access: 11 February 2025). Currently, the reliability and accuracy of TROPOMI’s NO2 products have been extensively validated and are well-documented in a growing body of scientific literature [10,11,34,35,43,44].
The preprocessing for NO2 products from OMI and TROPOMI was conducted following the methodology outlined in Wang et al. [10]. In filtering the OMI NO2 data, we selected pixels that met the criteria of solar zenith angle (SZA) less than 75° and effective cloud fraction (CF) below 0.3, ensuring optimal data quality and reliability. Similarly, for the TROPOMI NO2 data, rigorous selection criteria were applied, requiring a quality assurance value (qa_value)—a key indicator of retrieval status and data quality—to be no less than 0.75. Additionally, the SZA was maintained below 75°, consistent with the filtering criteria applied to the OMI data.

3. Methodology

In this study, we designed a data acquisition and calibration system for Pandora’s spectral observations, obtaining Pandora L1-level data. Based on the DOAS method and geometric approximation approach, we retrieved tropospheric NO2 VCDs, establishing a complete workflow from L0-level observed spectra to tropospheric NO2 VCDs with optimized parameterization schemes. Figure 3 illustrates the complete schematic diagram of the spectral calibration and retrieval method employed in this study. Detailed methodological descriptions are provided in the following sections.

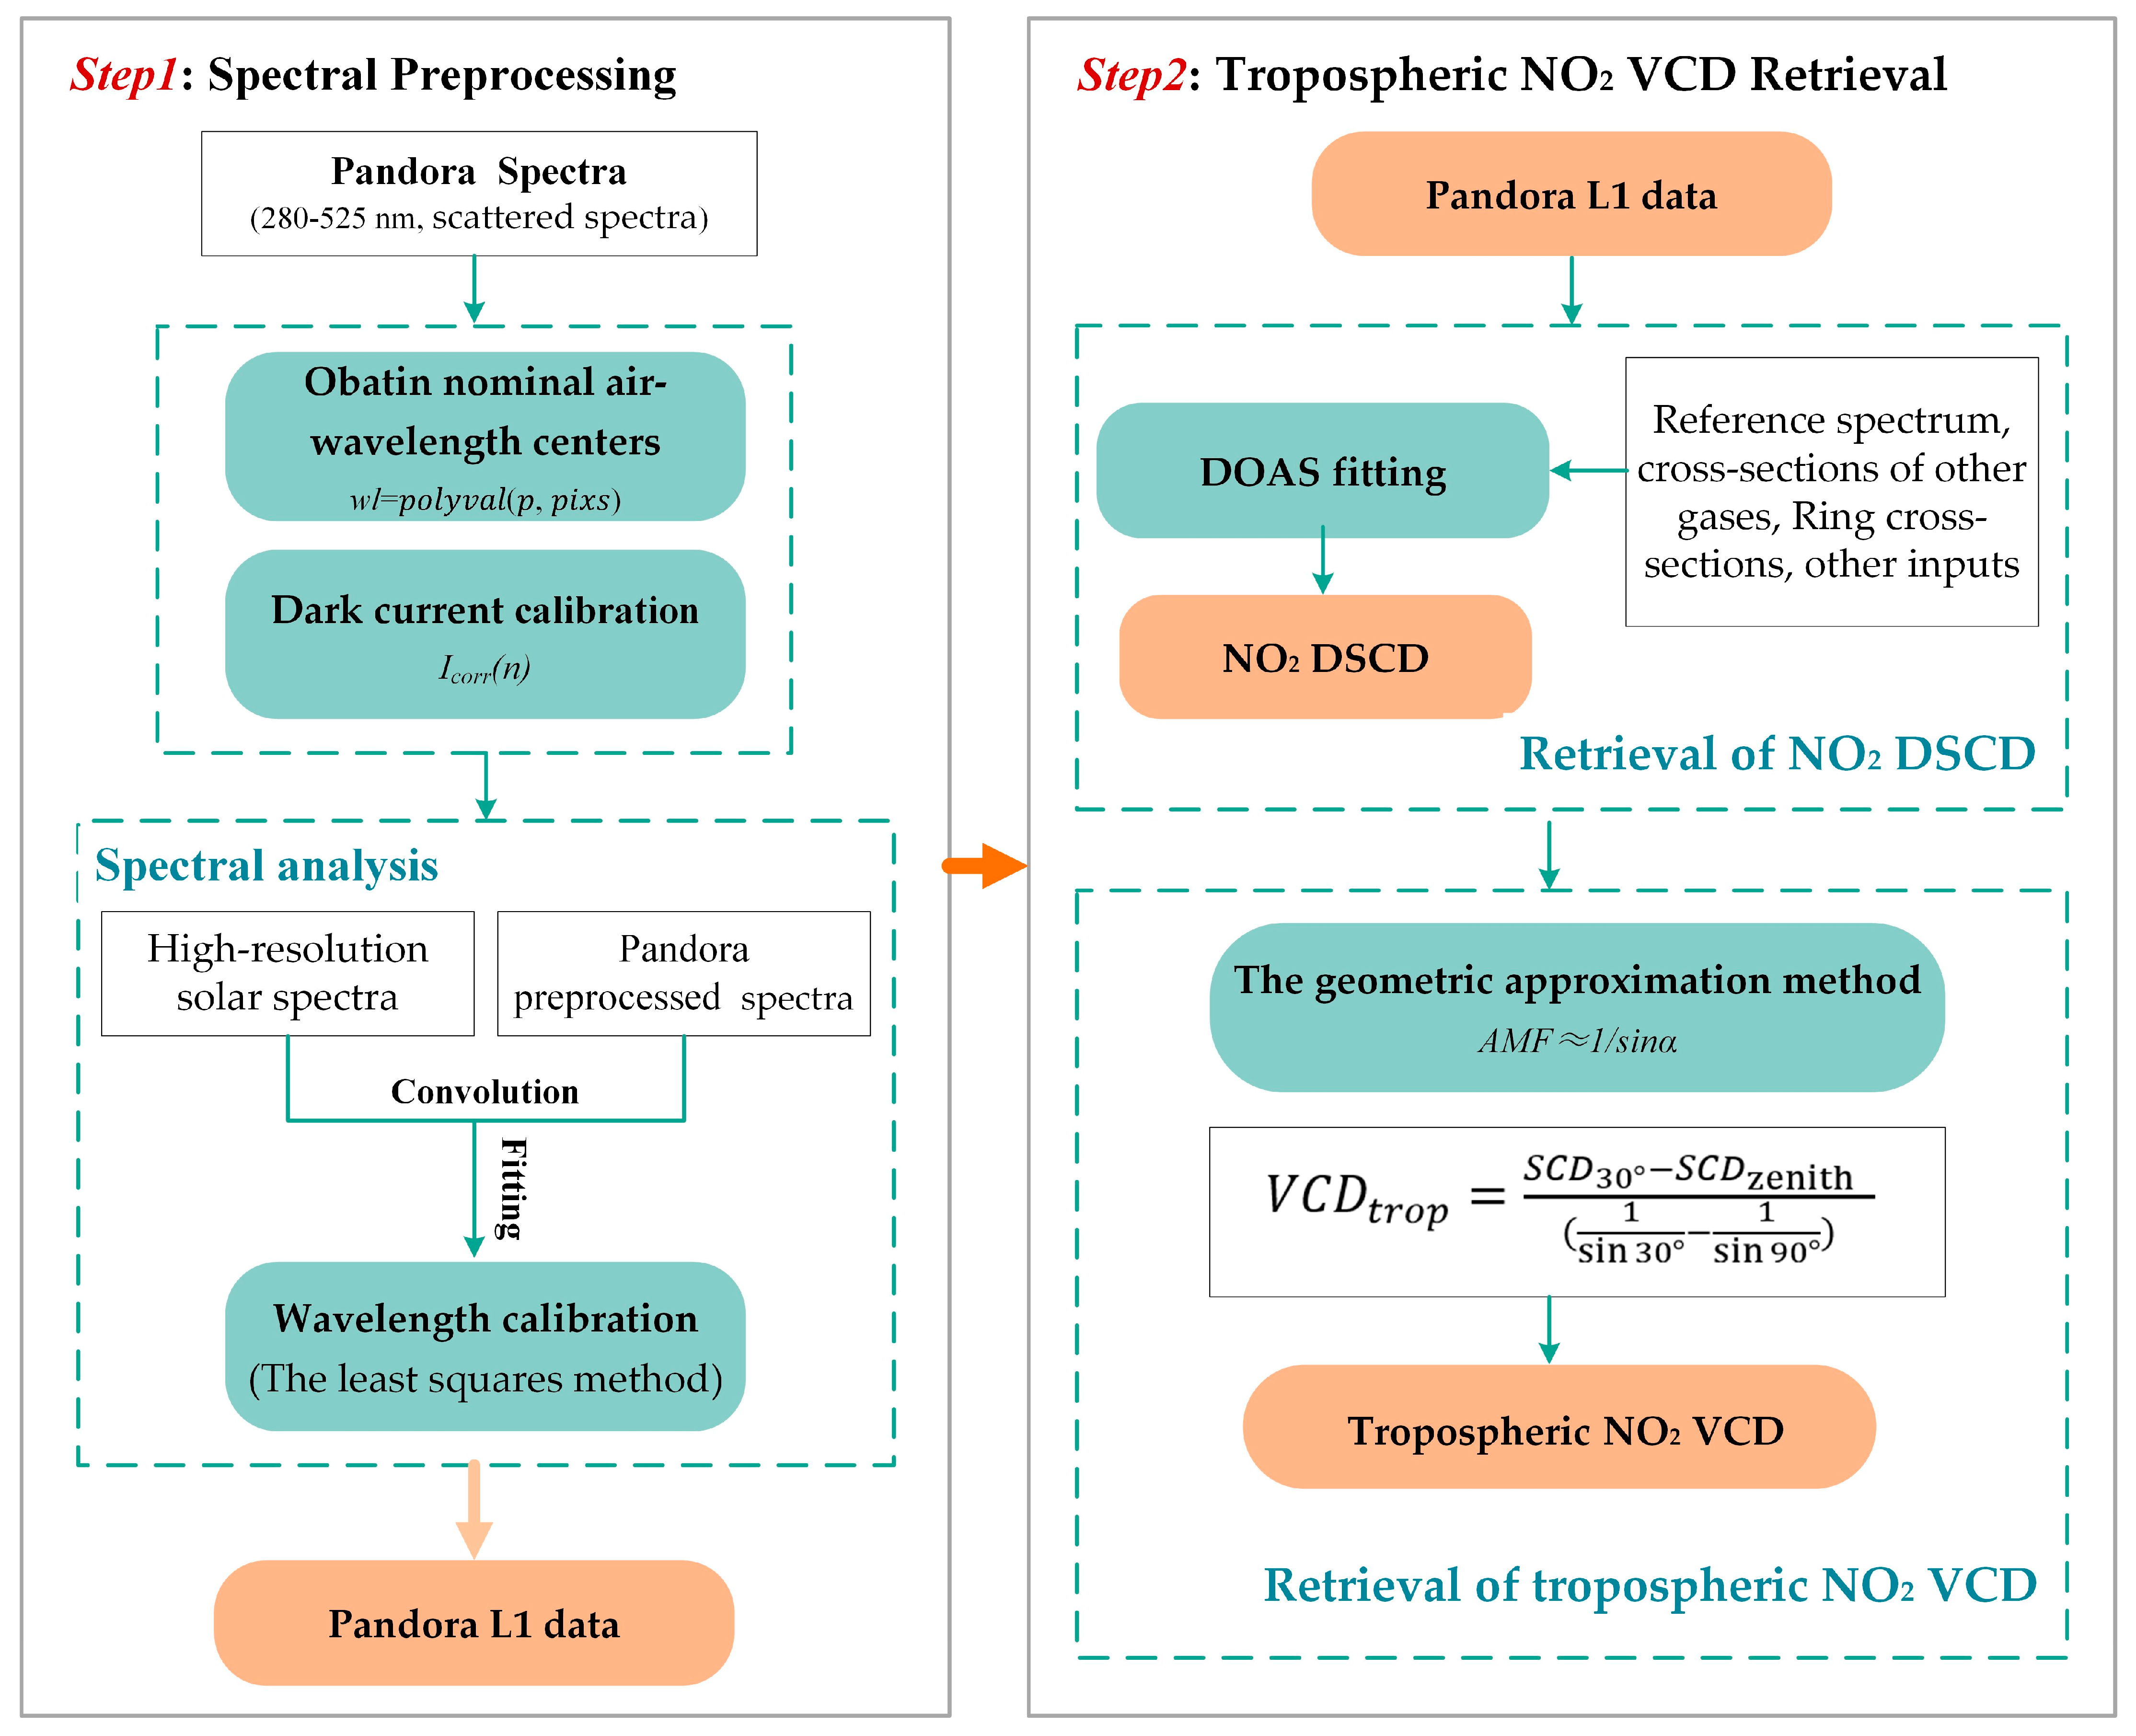
3.1. Spectral Preprocessing for Pandora Observations

3.1.1. Spectral Preprocessing

To minimize the effects of solar Fraunhofer absorption lines, the Ring effect, and instrumental systematic errors on the original observation spectrum (L0-level data), a series of preprocessing steps were applied to the Pandora raw L0 data. These preprocessing procedures, including wavelength calibration and dark current (DC) correction, were implemented to generate L1-level data.
During the spectral recording process, the wavelength range is discretized into multiple pixels by the photoelectric converter. Each Pandora record consists of 2052 pixels. However, the 2049th pixel is a dead pixel, and the 2050th to 2052nd pixels are blind pixels. Therefore, these pixels were removed during preprocessing, retaining 2048 effective pixels for analysis. Then, using initial dispersion polynomial coefficients and a simple polynomial equation, the mapping relationship between pixel numbers and their corresponding center wavelengths is established. To obtain the nominal air-wavelength centers of the Pandora unit, the polynomials are usually evaluated on the “scaled pixels”. The scaling method is defined by Equation (1).
p i x s = 3.46 × ( p i x n p i x 0.5 )
where p i x s represents a scaled data point, n p i x denotes the total number of pixels, and p i x refers to the effective pixel numbers for the 1st, 2nd, …, n p i x -th pixels.
Subsequently, a polynomial fit is applied to convert scaled pixel positions to their corresponding wavelength centers, as described by the following equation:
w l = a · p i x s 3 + b · p i x s 2 + c · p i x s + d
where   w l denotes the nominal air-wavelength center;   p i x s represents the scaled-pixel; and a , b , c , and d are the coefficients of the dispersion polynomial, determined through laboratory measurements during the factory calibration of this Pandora unit.
It is important to note that in the discretization process of digital spectra, discrepancies may arise between the wavelengths corresponding to the intensities and the pixel positions. Consequently, wavelength calibration of the observed spectrum is essential before proceeding with spectral fitting.

3.1.2. Dark Current Calibration

In the absence of incident light, the charge-coupled device (CCD) typically generates a background current due to thermal excitation, referred to as dark current, which contributes to system noise. Consequently, it is crucial to mitigate the influence of instrumental noise before using the observed spectra for retrieving specific atmospheric constituents.
DC correction is an indispensable preprocessing step that involves subtracting dark current signals from the observed signals. The Pandora spectrometer can measure the background dark signal by positioning its filterwheels to block light from entering the system. For DC correction, the dark current signal is normalized by the integration time weight and then subtracted from the observed signal, as follows:
I c o r r n = I n t i n t , m e a s u r e t i n t , d a r k × I d a r k ( n )
where I c o r r ( n ) is the corrected spectral intensity for the n -th pixel, and I n and I d a r k ( n ) represent the original and DC spectral intensities of the n -th pixel, respectively. The parameters t i n t , m e a s u r e and t i n t , d a r k denote the integration times of the original light intensity observation and the DC spectrum measurement, respectively.
Figure 4 presents the dark current spectrum observed by Pandora (Figure 4a) and compares the spectra before and after DC correction (Figure 4b).

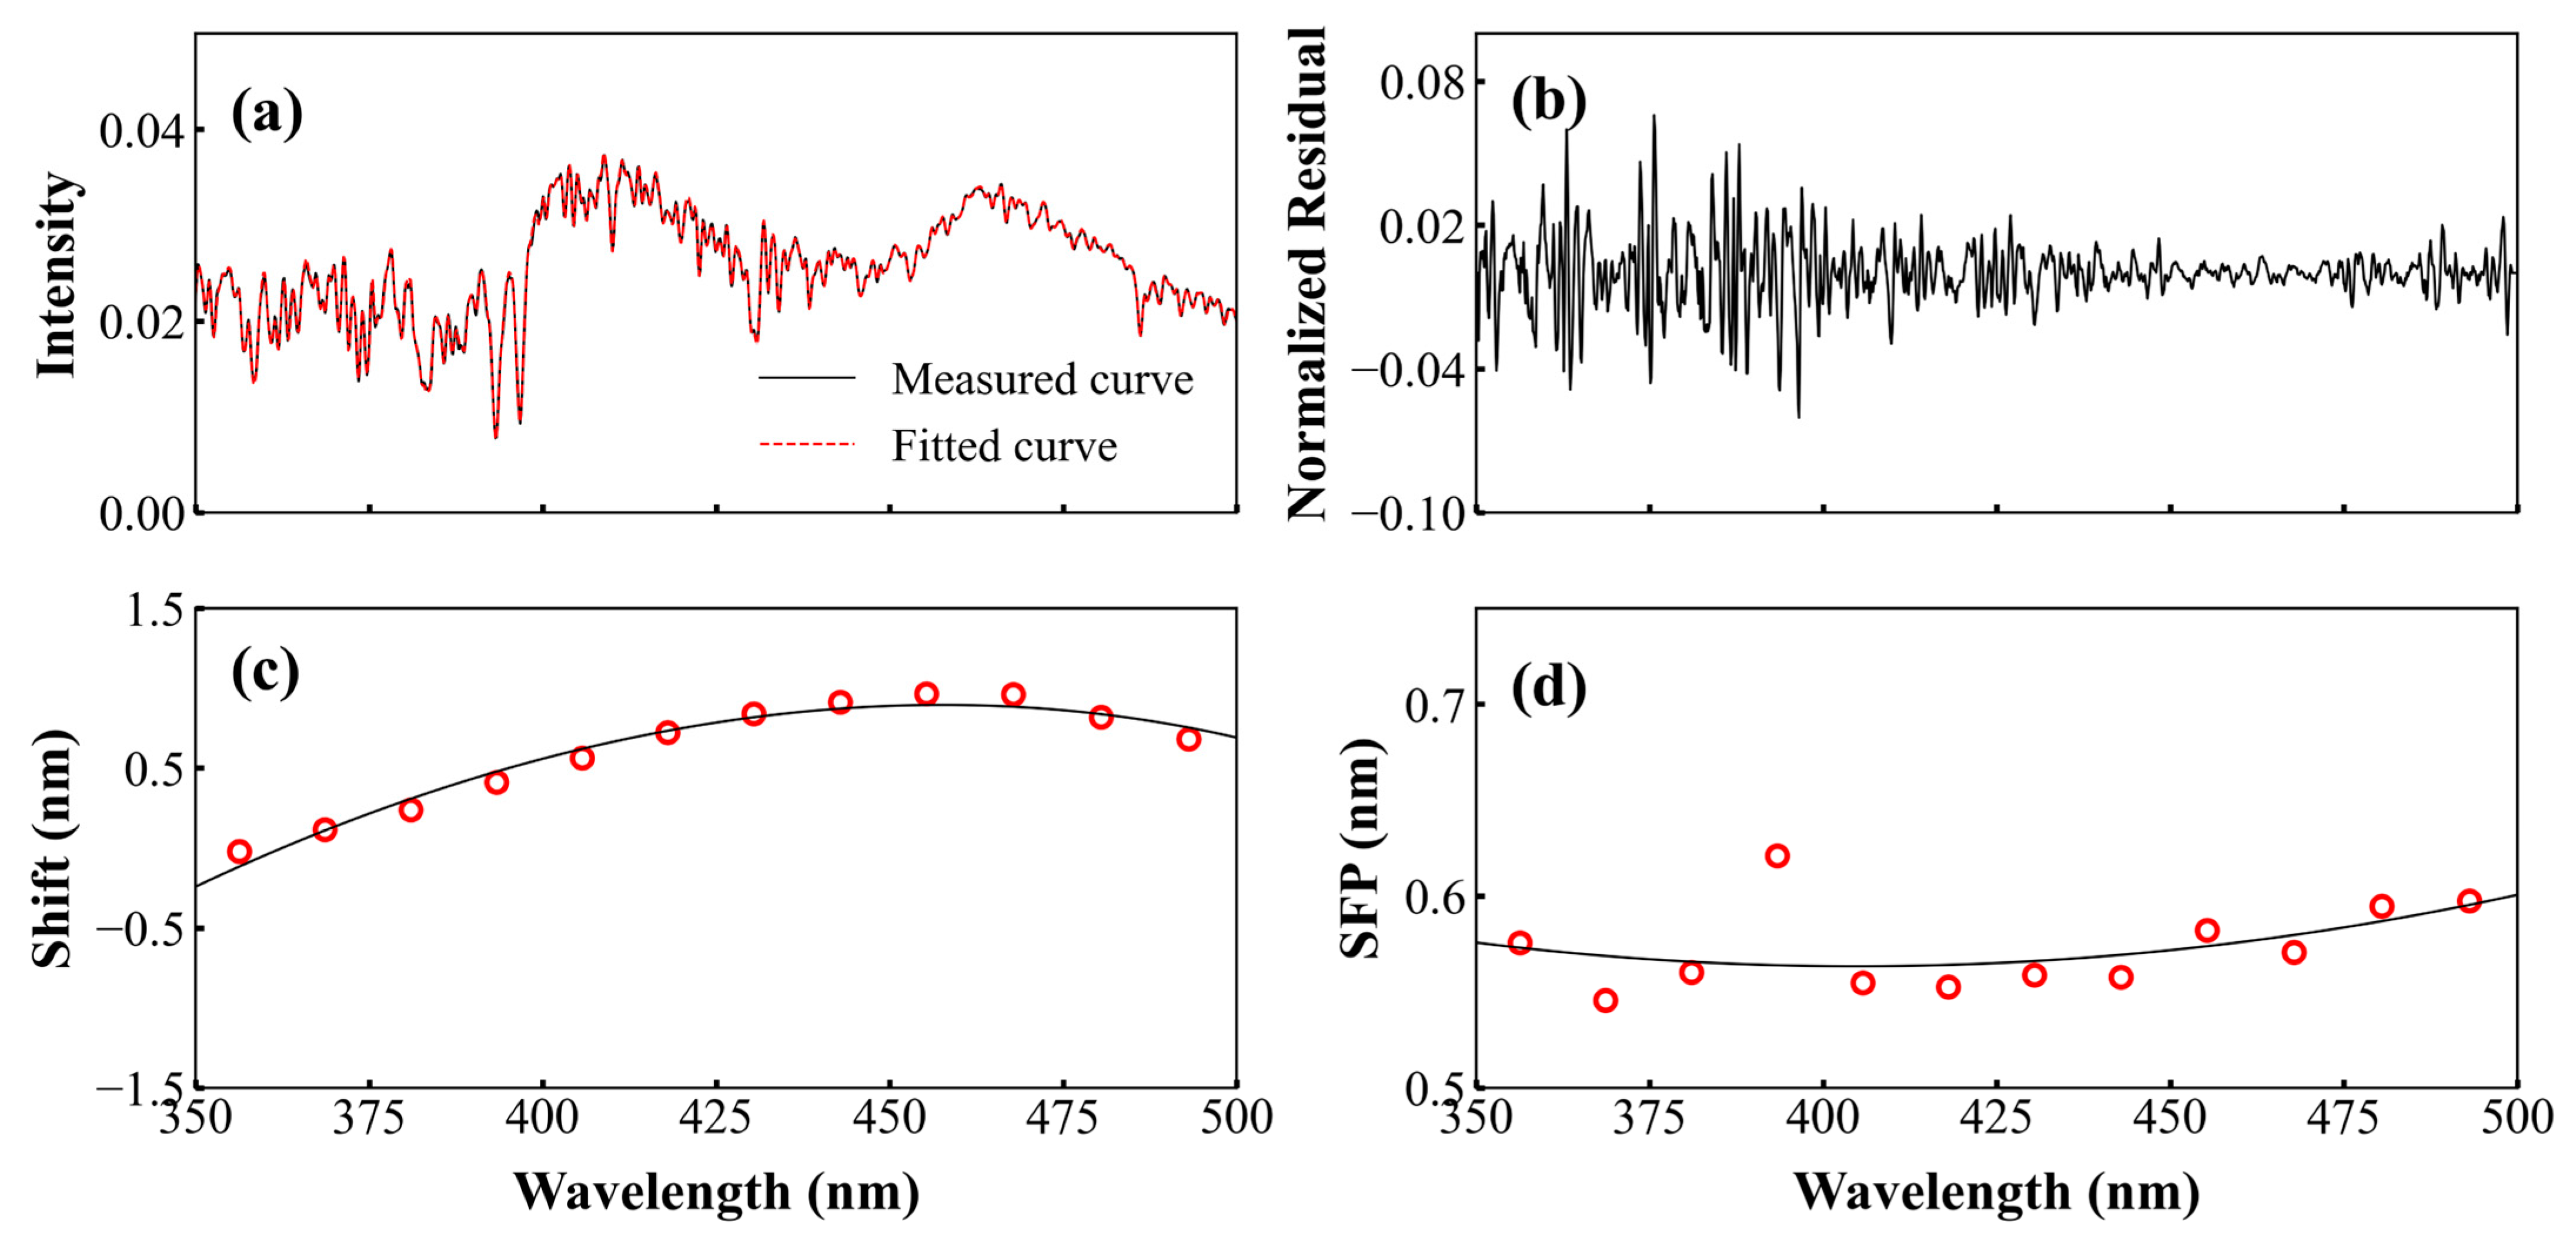
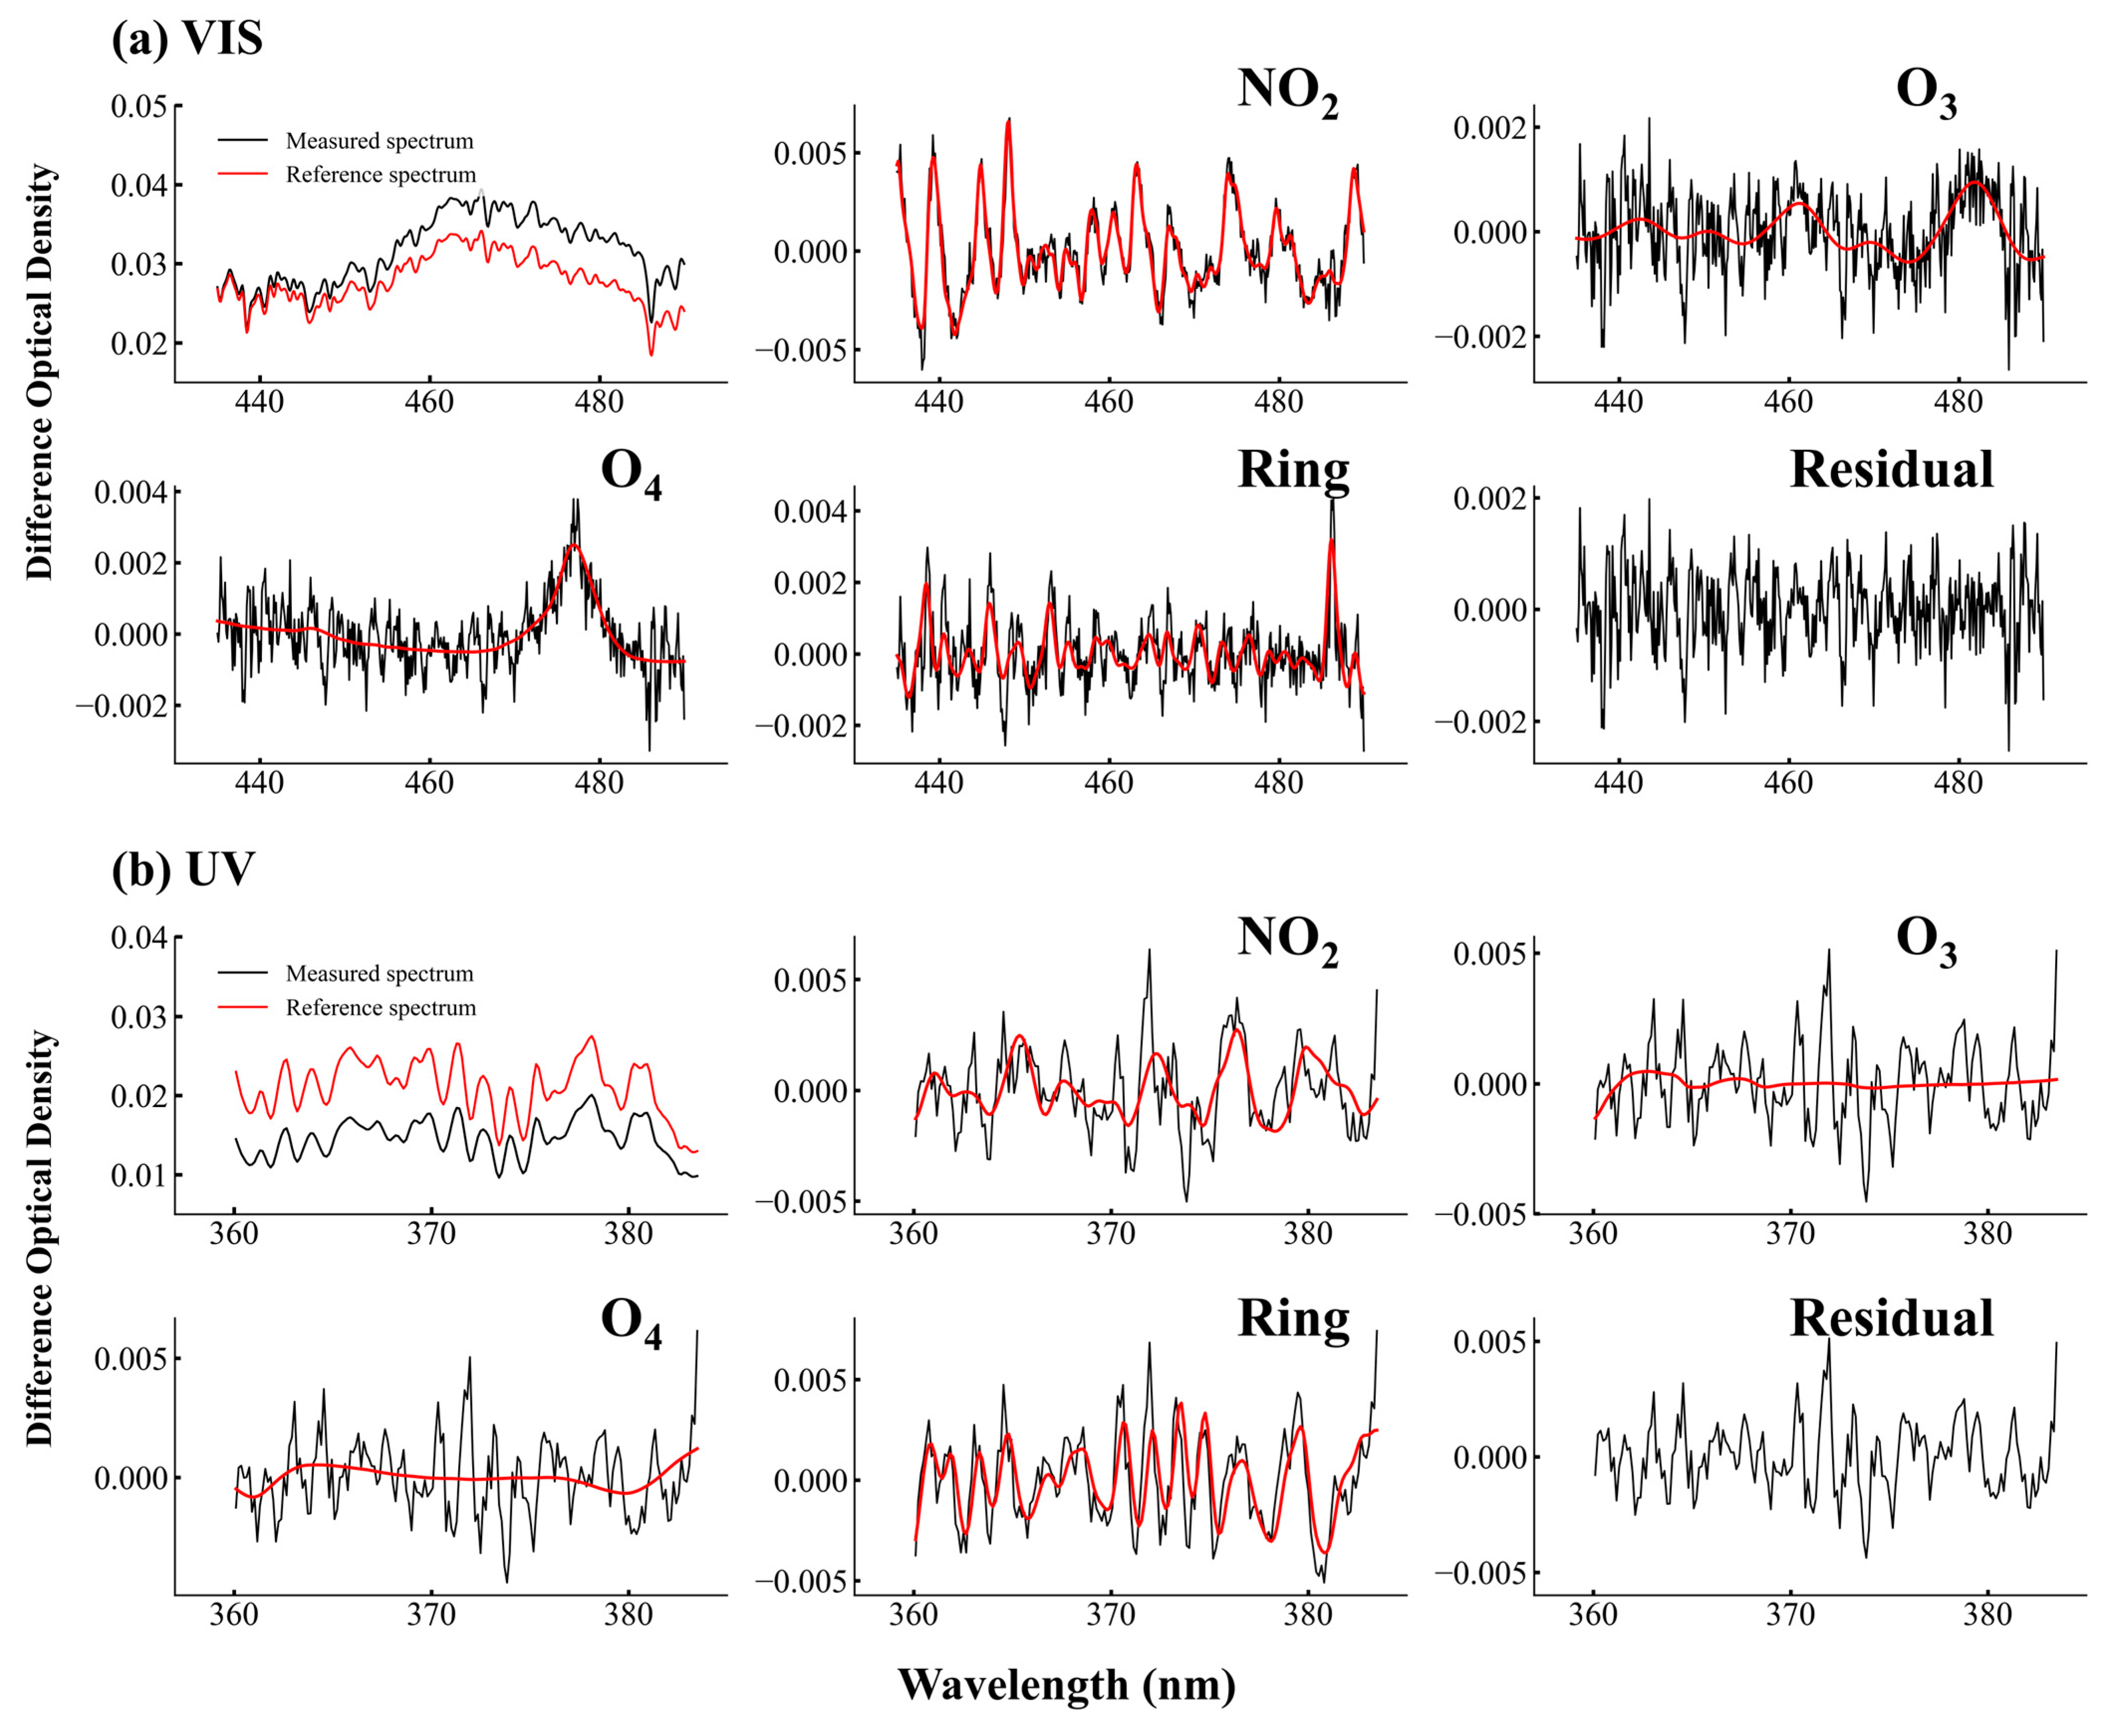
3.1.3. Spectral Analysis

In order to minimize the deviation between the observed and standard spectra, wavelength calibration must be performed prior to spectral fitting. In this study, we used QDOAS v3.4 software to process the Pandora L1-level spectra. The high-resolution solar observation spectra [45] were used as the reference for wavelength calibration. Due to the instrumental resolution limitations, both the standard solar spectrum and the Pandora observation spectrum were convolved with the instrument’s slit function to achieve uniform resolution. In this work, we employed the Gaussian function line as the slit function for the Pandora instrument.
The spectrometer wavelength is divided into N sub-intervals. Here, N is chosen to be 12. Within each sub-interval, the solar reference spectrum and the Pandora reference spectrum are shifted, compressed, and stretched according to the following equation:
λ = a + b λ λ 0 + c ( λ λ 0 ) 2
where λ represents the calibrated wavelength, λ 0 denotes the central wavelength of each sub-interval, a signifies the offset in the fitting, and b and c represent the stretching parameters of the first and second fittings, respectively.
These parameters are determined using the least squares method when the standard solar spectrum and the observed spectrum are most closely matched within the same sub-interval. Subsequently, the nonlinear least squares fitting method is employed to derive a fitting function applicable to the entire observation band range of the spectrometer, establishing the actual wavelengths corresponding to the observed spectrum, as illustrated in Figure 5.
Figure 5a displays the observed spectrum (black line) and its complete fit to the solar spectrum (red line), demonstrating good agreement between the calibrated observed spectrum and the reference solar spectrum. The normalized residuals R n o r m of the fit, defined by Equation (5), are shown in Figure 5b. As is evident from the figure, the fitted normalized residuals exhibit a small magnitude, and the spectral shifts (Figure 5c) are consistently minimal across all the wavelength sub-intervals, confirming the effectiveness of the spectral calibration. Additionally, Figure 5d illustrates the wavelength-dependent variation of the full width at half maximum (FWHM) of the Gaussian line shape for the slit function parameter (SFP).
R n o r m = P · I 0 · e S j c j I a
where I represents the measured spectrum, I 0 is the reference spectrum (here, the high-resolution solar observation spectrum), P signifies the fitted polynomial, S j is the absorption cross section for absorber species j , c j is the corresponding fitted concentration, and a represents the offset parameters in the fitting.

3.2. Inversion Algorithm and Tropospheric NO2 Retrieval

3.2.1. Retrieval of NO2 Slant Column Densities

Using the preprocessed Pandora L1-level scattered sunlight spectra, the DOAS technique is used to retrieve NO2 differential slant column density (DSCD). Through the spectral fitting process, the DSCD of trace gases (Equation (6)) is obtained, representing the difference between the observed spectral slant column density S C D j and the reference spectral slant column density S C D j , F R S . This difference is influenced by factors such as the atmospheric distribution of the absorbing gases, light transmission processes, and instrumental observation technique.
D S C D = S C D j S C D j , F R S
For the off-axis MAX-DOAS observation mode, different elevation angle measurements are obtained within an observation sequence. Specifically, the DSCD can be expressed as the deviation between the measured spectrum and the reference spectrum at a given elevation angle α:
D S C D α = S C D α S C D F R S
In most cases, the zenith direction ( α = 90 ° ) in each scan sequence is used as the background reference spectrum [14].
To minimize systematic uncertainties in NO2 measurements, it is imperative to select the optimal spectral band for NO2 retrieval. This band is chosen to maximize target gas absorption while simultaneously minimizing interference from other gases within the same spectral range.
Given that NO2 exhibits characteristic absorption bands in both UV and VIS regions, we performed inversions of NO2 DSCD using Pandora L1 data at various observation angles. Through sensitivity testing, we identified 435–490 nm and 360–383.5 nm as the optimal spectral bands for NO2 retrieval in the VIS and UV regions, respectively. The detailed configurations for the NO2 DSCD inversion are listed in Table 2. For the Fraunhofer reference spectrum, we selected the zenith observation spectrum at solar noon, when the SZA reaches its minimum.
Figure 6 demonstrates a typical DOAS spectral fitting example in both the UV and VIS ranges for measurements taken at 10:49 Local Standard Time (LST) on 15 February 2020. The first subplots in Figure 6a,b show the measured spectrum (black line) and reference spectrum (red line). The final subplot displays the fitting residual, which represents the remaining quantity after spectral fitting. A smaller residual indicates better fitting quality and, consequently, lower inversion error. The remaining subplots illustrate the observed and fitted spectra for different components. The NO2 DSCD retrieval results in the VIS and UV bands are 3.08 × 10¹⁶ molec/cm2 and 3.61 × 10¹⁶ molec/cm2, respectively, with fitting errors below 2% and 12%. In this case, the VIS band retrieval exhibits smaller fitting residues and better NO2 fitting qualities, indicating more reliable inversion results.
Figure 7 presents the inversion results of NO2 DSCDs from Pandora observations in both VIS and UV bands on 17 January 2020 (Figure 7a,b) and 23 February 2020 (Figure 7c,d). The observations on 17 January 2020 were conducted under hazy conditions, while those on 23 February 2020 were performed under clear-sky conditions. The retrieval results for both days exhibit similar magnitudes and diurnal variation characteristics across different observation angles. In both the VIS and UV bands, the NO2 DSCDs demonstrate consistent retrieval features, although the UV band retrievals exhibit relatively higher uncertainties under the current retrieval scheme.
At each observation angle, the diurnal variation of NO2 DSCD tends to follow a V-shaped or U-shaped pattern, with higher concentrations in the morning and evening and lower concentrations around noon. This pattern can be attributed to the stable atmospheric stratification during nighttime, which facilitates pollutant accumulation, leading to elevated NO2 concentrations in the early morning [31]. As observation angles increase, the NO2 DSCD values decrease, which results from the shortened light path of scattered radiation reaching the instrument at higher elevation angles, consequently reducing the integrated concentration along the path. These angle-dependent variations in the DSCD measurements are significant, with the UV band retrievals showing relatively higher uncertainties compared to the VIS band.

3.2.2. Retrieval of NO2 Vertical Column Densities

To convert tropospheric DSCDs to VCDs, a scaling factor, the atmospheric mass factor (AMF), should be introduced, as in Equation (8) [14].
V C D t r o p = S C D α S C D F R S A M F α A M F F R S
where α represents the elevation angle, and F R S here is selected from zenith observations at solar noon, when the SZA reaches its minimum.
When the gas component is primarily concentrated below the scattering height (e.g., within the boundary layer), the AMF can be approximated using the geometric approximation method [14] as A M F 1 / sin α . In this study, an observation angle of 30° was selected for calculating the tropospheric NO2 VCD, and the zenith direction (α = 90°) at solar noon was used as the background reference spectrum. Then, Equation (8) can be expressed as follows:
V C D t r o p = S C D 30 ° S C D z e n i t h   ( 1 sin 30 ° 1 sin 90 ° ) = S C D 30 ° S C D z e n i t h
Numerous studies [8,22,52] have demonstrated that the equation above can effectively approximate the tropospheric NO2 VCDs, indicating that the geometric approximation method is reliable.
Figure 8a,b present the NO2 VCD retrieval results in the VIS and UV bands at selected time periods. The NO2 VCD exhibits similar variation patterns in both bands, with the VIS band retrievals showing slightly lower values than the UV band results. Figure 8c compares the quality-controlled NO2 VCD results from both bands throughout the entire observation period from 8 November 2019 to 31 March 2020. For quality control, we excluded data points with a SZA greater than 75°, negative VCD values, and those with excessively high errors in the NO2 DSCD retrieval results. Only simultaneous retrievals with valid VCD results in both bands were retained for comparative analysis. The scatter plot reveals high consistency between the VIS and UV band retrievals, with a correlation coefficient (R) of 0.97 and a slope of 0.98. While the UV band NO2 VCD values are slightly higher than those from the VIS band, the difference remains below 10%.

4. Results

4.1. Comparison Experiment Between Ground-Based Pandora and MAX-DOAS

A comparative experiment was conducted at the Xianghe station to evaluate the portable Pandora instrument against co-located MAX-DOAS measurements. Comprehensive analyses of the observational data were performed to assess the measurement capabilities of the Pandora instrument and validate its applicability.

4.1.1. Experimental Scheme

We analyzed stable observational data from both instruments over a two-month period, from 1 February 2020 to 31 March 2020, during which both Pandora and MAX-DOAS maintained consistent measurement performance and achieved nearly continuous daily observations, ensuring sufficient data availability for reliable collocation analysis. The comparison experiment was designed according to the following criteria:
(1) To minimize errors from different inversion methodologies, we applied an identical spectral processing technique and a geometric approximation inversion method for retrieving tropospheric NO2 VCD, with both inversions utilizing the VIS spectral range.
(2) The azimuth angle was fixed towards the north direction to minimize interference from direct solar radiation during the observations.
(3) For each instrument, the reference spectrum was selected from the daily zenith observation at solar noon, mitigating the impact of non-synchronized measurements on tropospheric NO2 temporal variations.
(4) Spectra with a SZA greater than 75° were excluded to ensure sufficient signal-to-noise ratio.
(5) Hourly averages were calculated from periods with valid inversion results and subsequently aggregated into daily averages. Time matching was implemented to reduce errors arising from non-synchronous observation times and limited inversion data points.

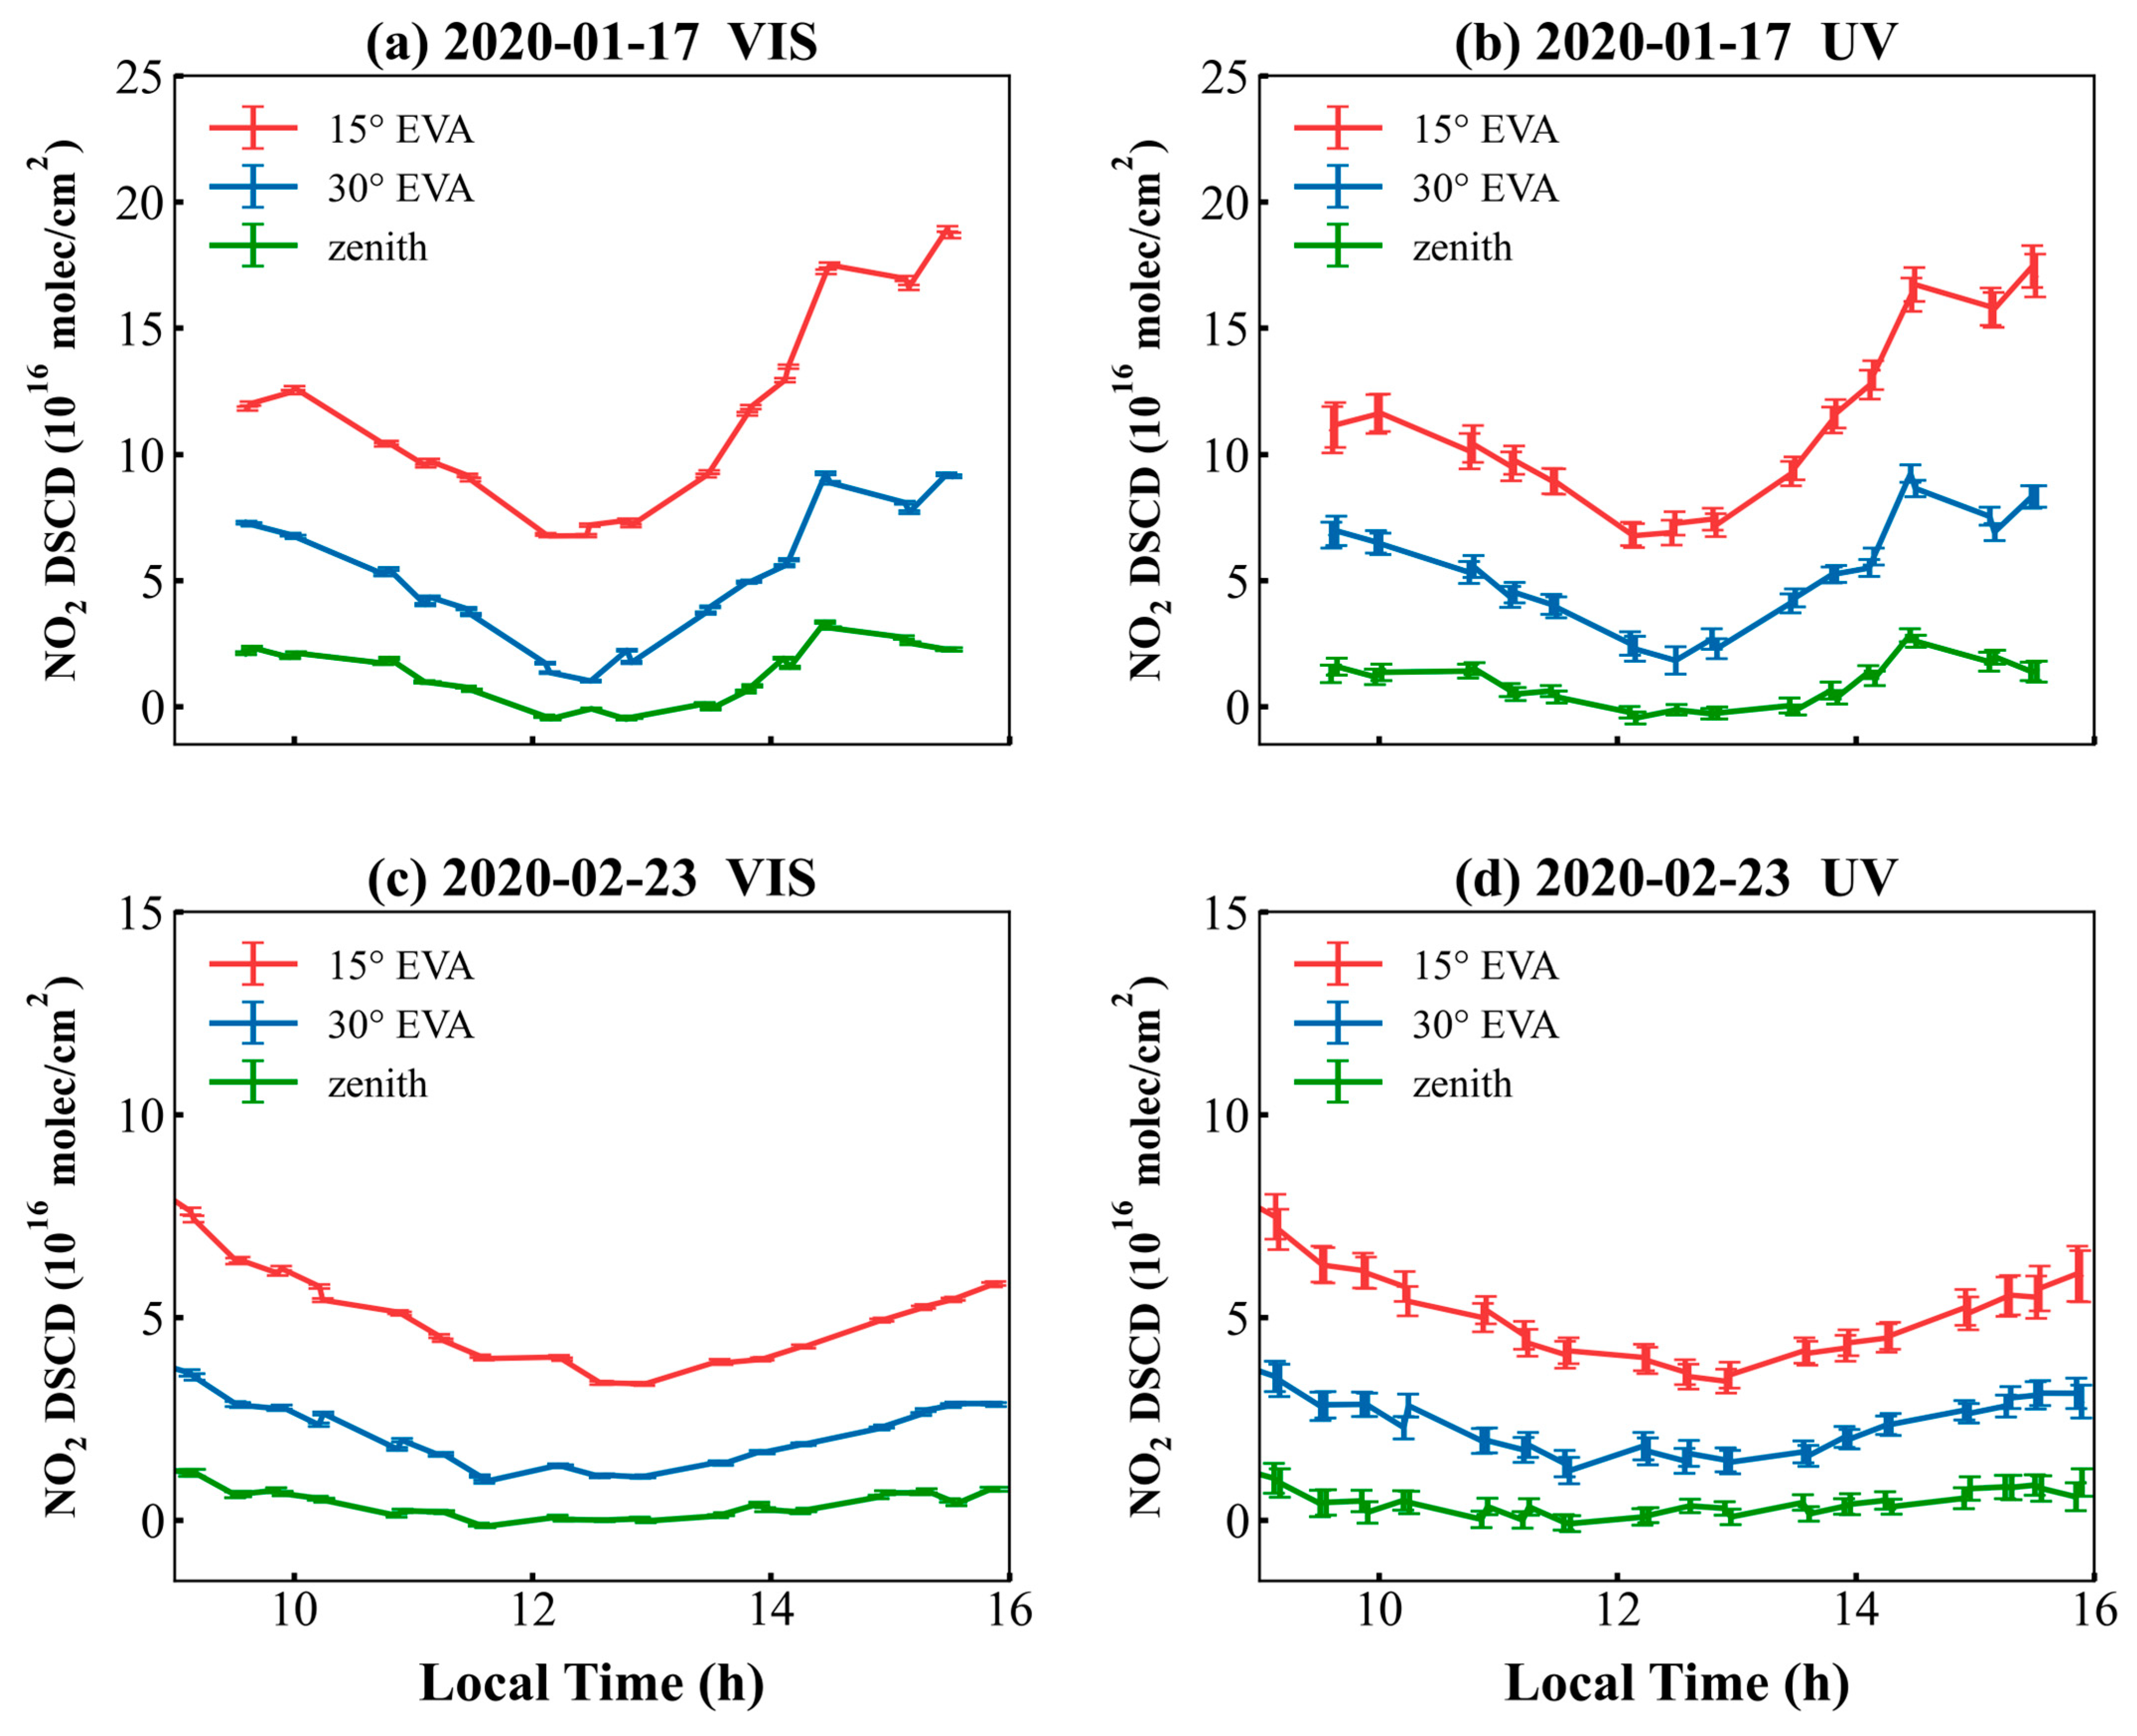
4.1.2. Comparative Analysis of NO2 Differential Slant Column Densities

Figure 9 presents the retrieved NO2 DSCDs from both instruments during the two case study periods (Figure 9a,b), along with the statistical results of the hourly-averaged NO2 DSCDs (Figure 9c). While minor discrepancies exist between the Pandora and MAX-DOAS NO2 DSCDs retrievals, the overall agreement is good. To ensure the reliability of the statistical analysis between the two instruments, we retained only those data points with NO2 DSCDs greater than 0 for further analysis, as illustrated in Figure 9c. Particularly, at the observation angles of 30° (red dots) and 90° (blue dots) in Figure 9c, the NO2 DSCD values demonstrate high consistency, with tightly clustered scatter points. The correlation coefficients reach 0.93 and 0.88 for 30° and 90° measurements, respectively. Notably, the Pandora-derived DSCD values are generally lower than those from the MAX-DOAS measurements. At a 30° elevation angle, Pandora shows approximately 10% lower values compared to MAX-DOAS, whereas at 90° (zenith), this systematic bias increases to about 15%.
These biases could be attributed to several factors, such as differences in instrumental precision, varying weather conditions during observations, and the influence of stray light in the measurement process. Due to differences in instrumental characteristics, such as scanning speed and spectral range, achieving truly simultaneous observations between the two instruments is inherently challenging. To mitigate the impact of this non-strict synchronization, we applied 1 h averaging to the DSCD retrievals. While this approach reduces the influence of temporal mismatches to some extent, residual systematic errors caused by imperfect synchronization between the instruments may still persist. Additionally, during data processing, we did not exclude cloud-screened retrievals. As demonstrated in Herman et al. [23], implementing cloud filtering for Pandora data can effectively reduce the DOAS-fitting root mean square (rms) by approximately 0.5%. In comparison with the ground-based MFDOAS instrument, this approach has been shown to reduce the systematic error in SCD to around 1%. Furthermore, the influence of weather conditions was not accounted for in this study. Particularly under polluted events with high aerosol concentrations, aerosols can significantly alter the light path, thereby impacting the observed trace gas absorptions [24]. Reed et al. [53] conducted a detailed investigation into the effects of clouds and aerosols on NO2 column retrievals. They found that small, passing cumulus clouds (whether coinciding with a high cloud fraction > 0.2 or not) and low aerosol layers, which cause significant backscatter near the ground, can significantly affect the comparisons of total column NO2 retrievals. These factors resulted in differences of up to ±65% between the Pandora and OMI retrievals of the total column NO2. In summary, these issues collectively contribute to the discrepancies in the retrieval results between the different instruments to some extent.

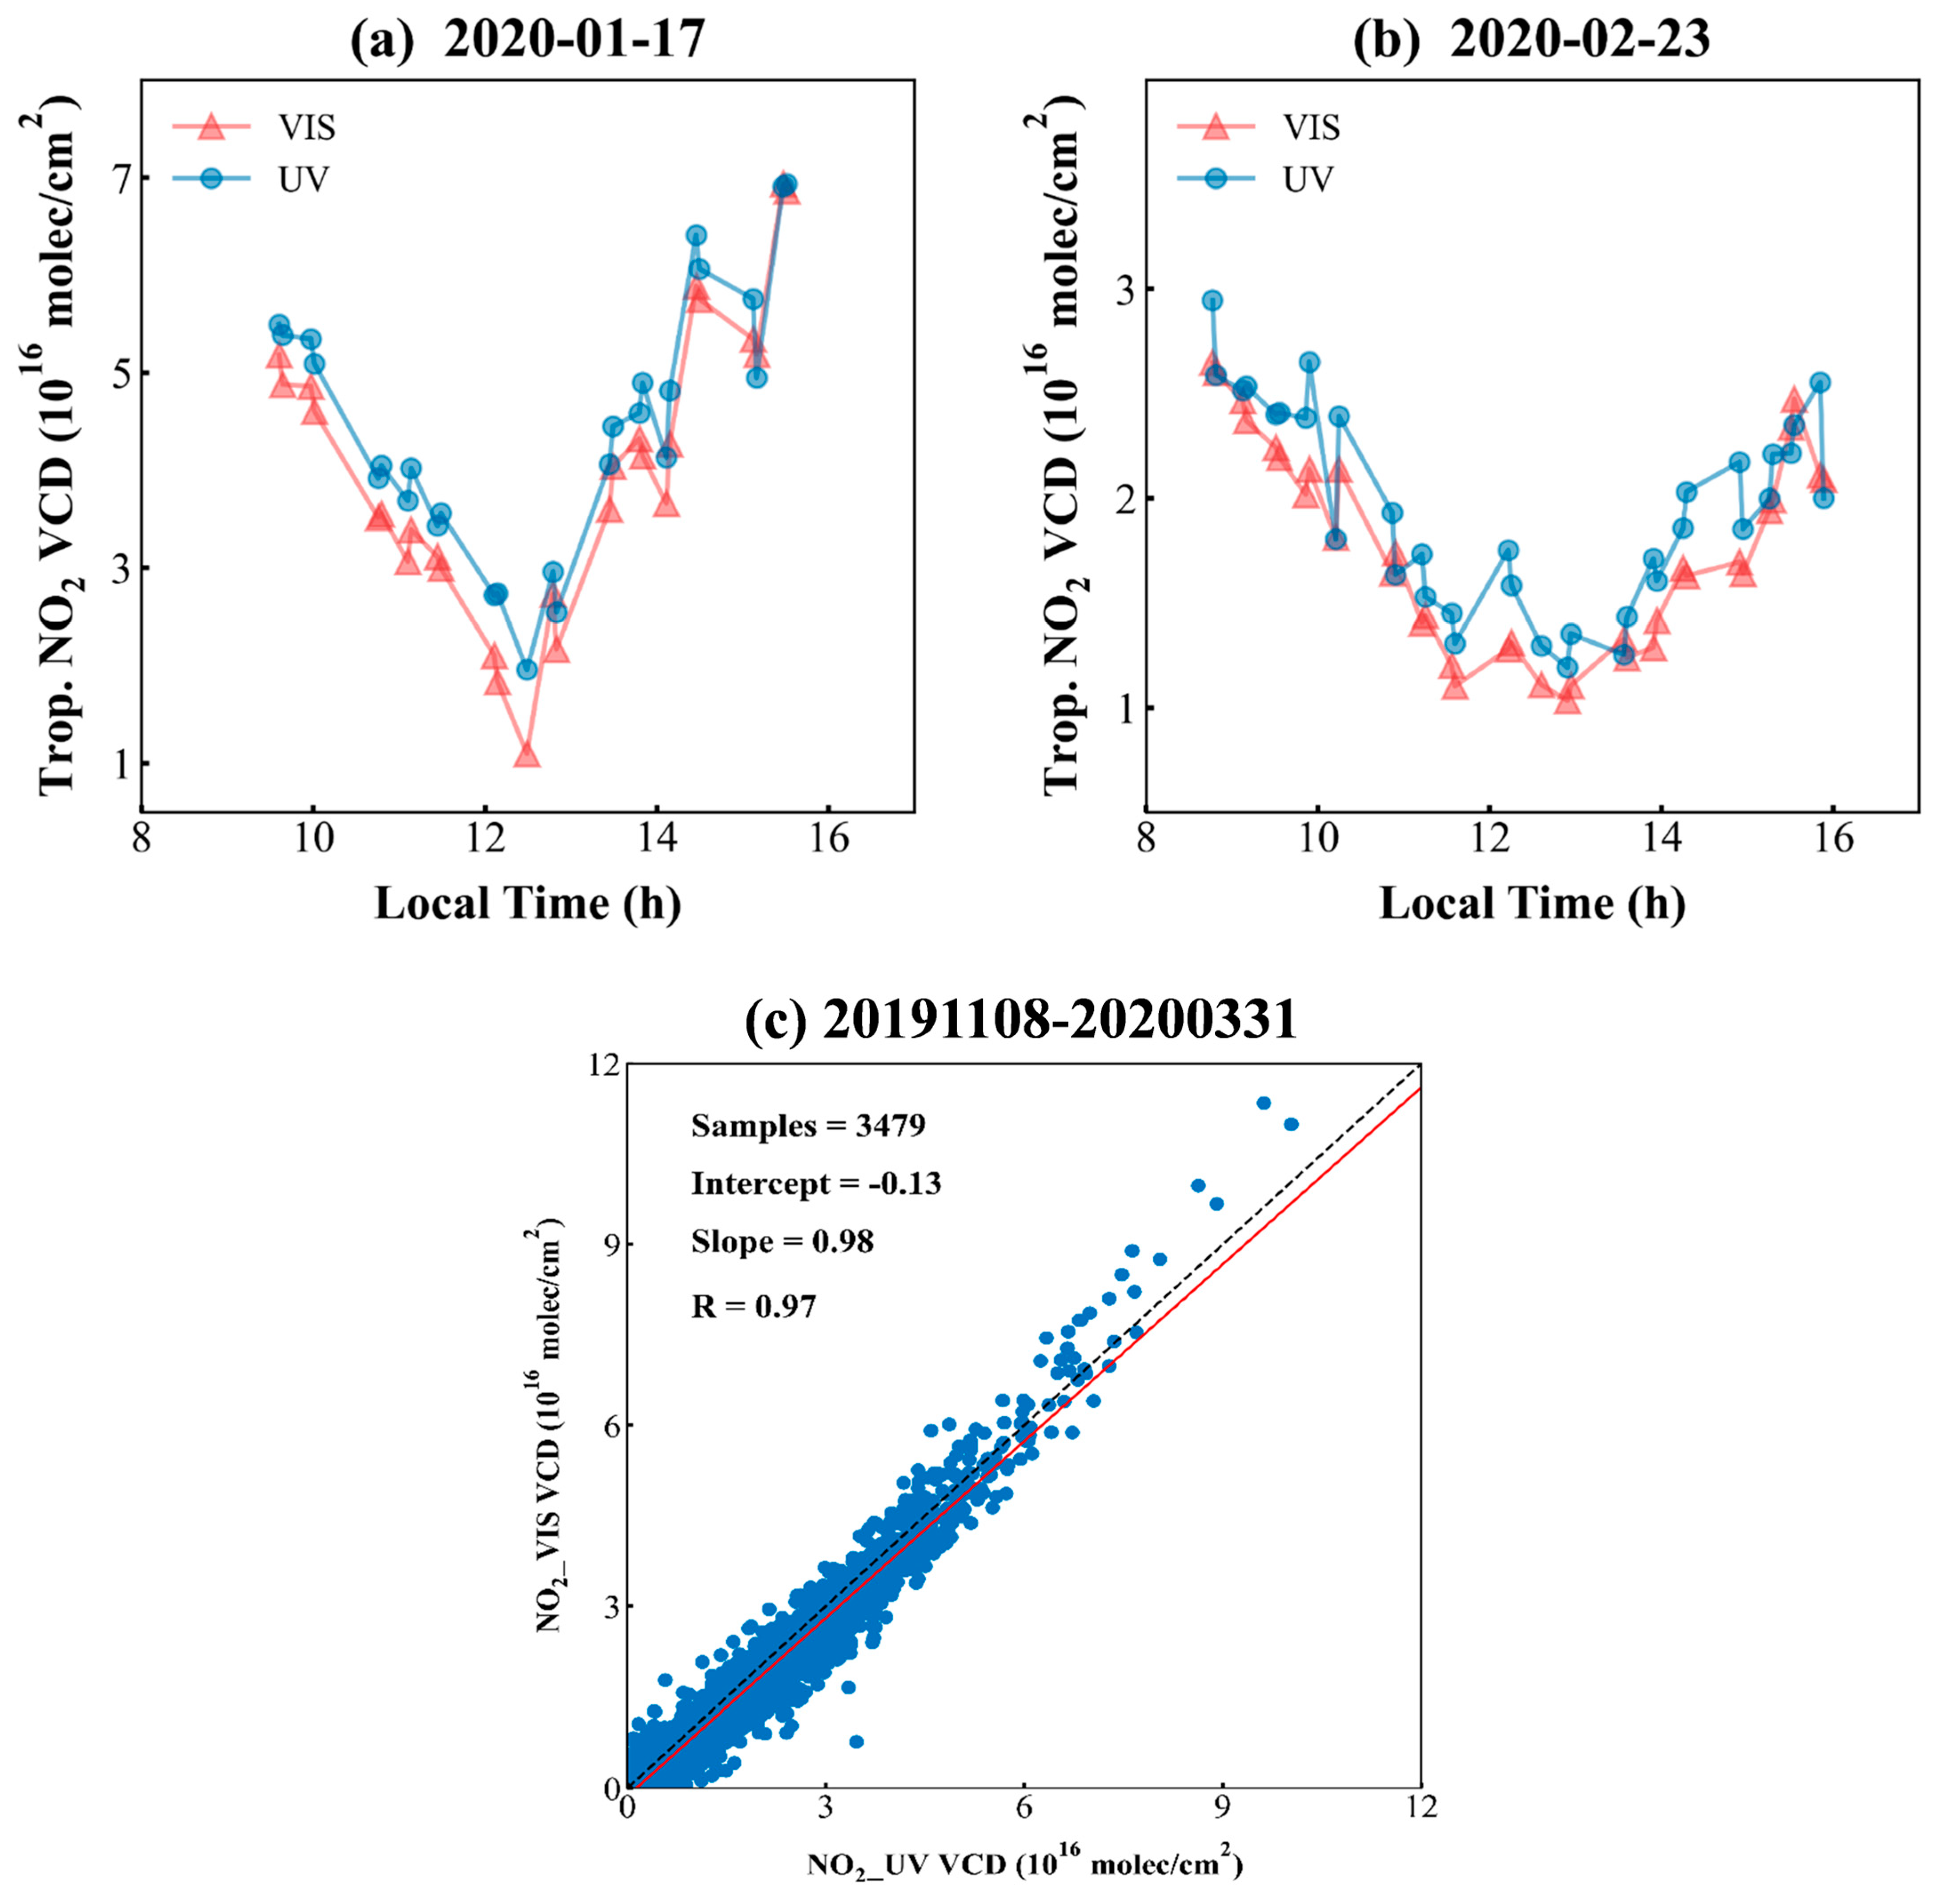
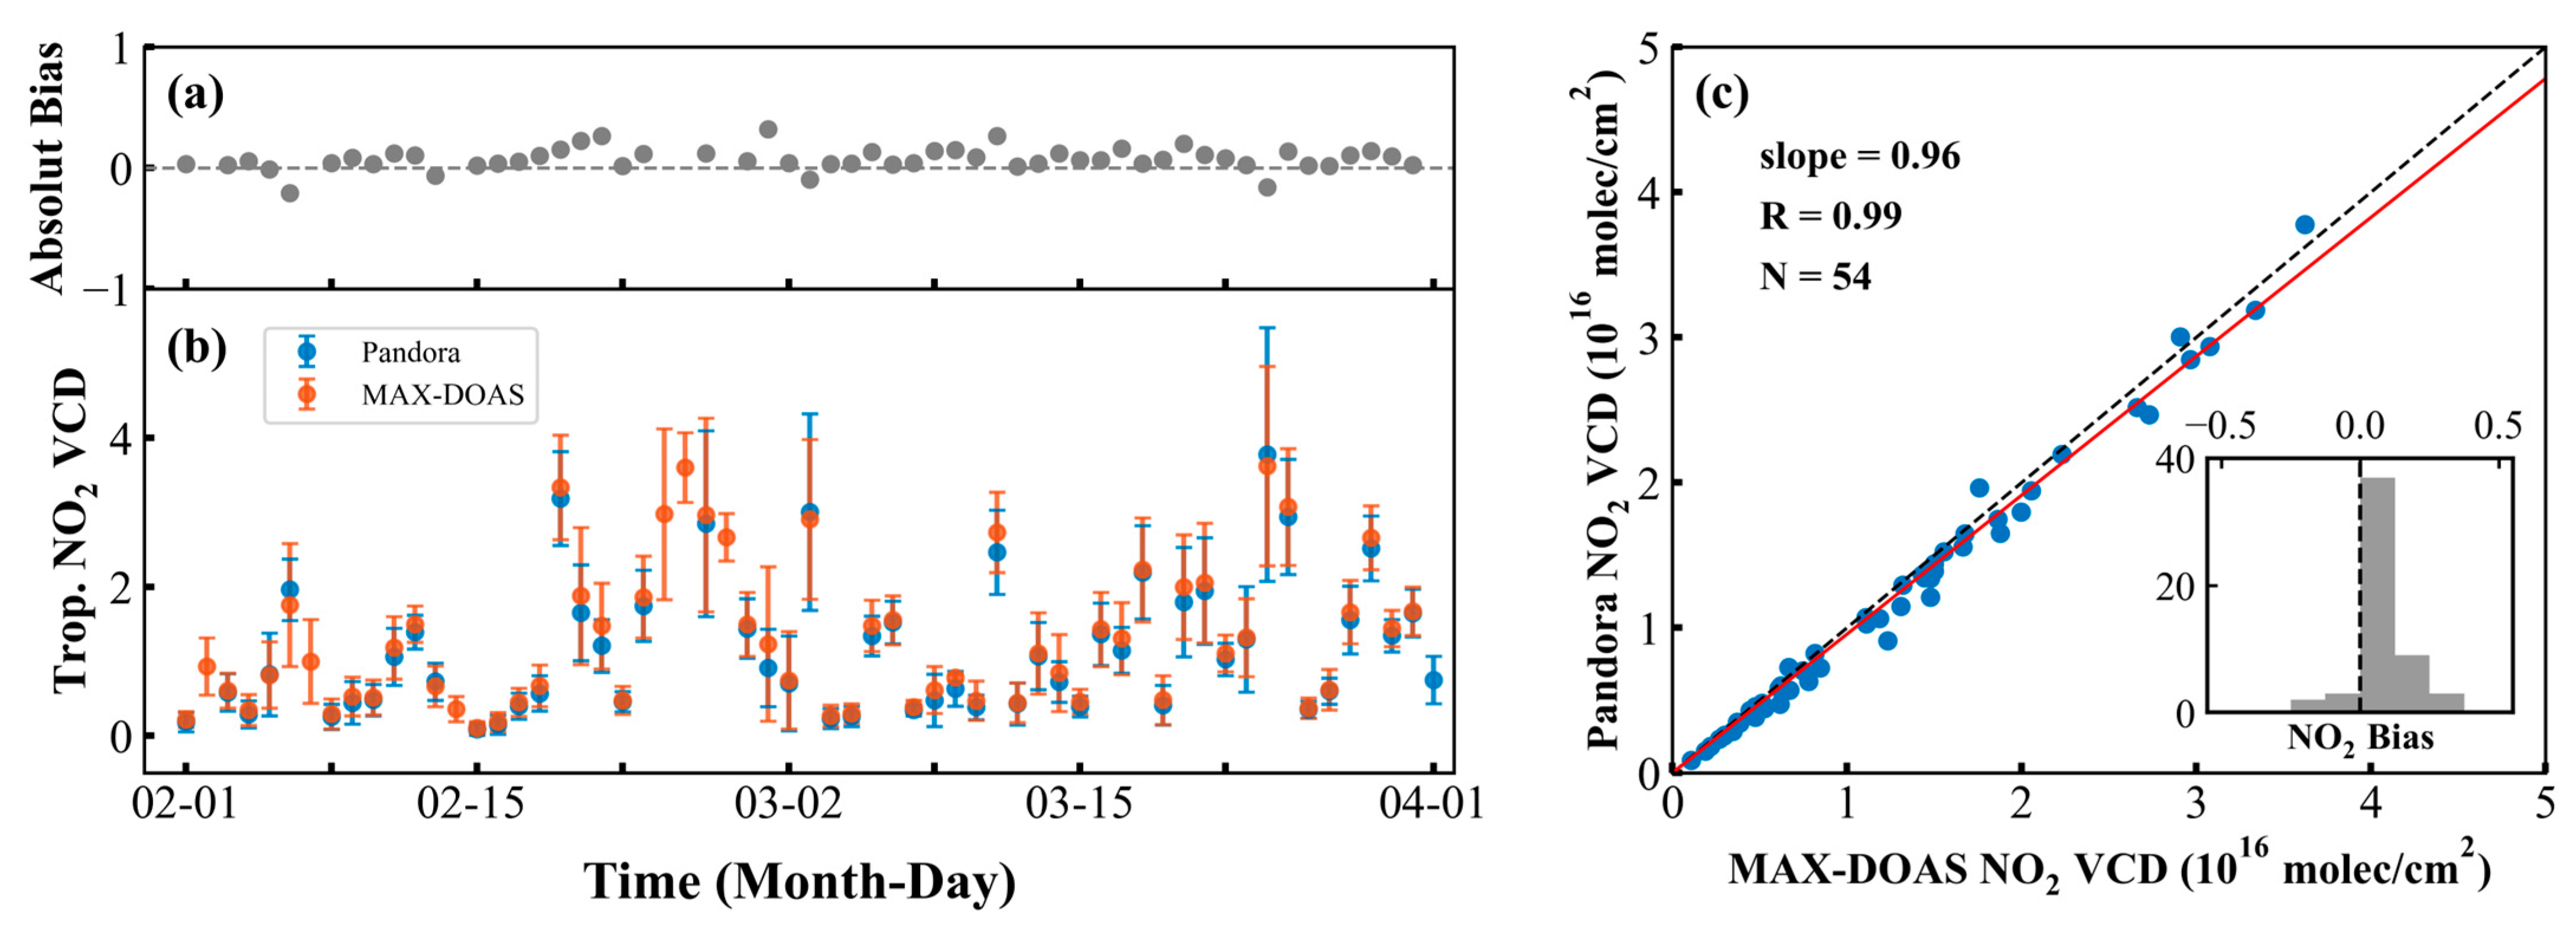
4.1.3. Comparative Analysis of NO2 Vertical Column Densities

Based on the geometric approximation method, we independently retrieved NO2 VCDs from both the Pandora and MAX-DOAS measurements at the Xianghe station. Figure 10 displays the time series of the tropospheric NO2 VCD inversion results from Pandora (blue dots) and MAX-DOAS (red dots) during the study period. Day-by-day comparisons revealed excellent agreement between Pandora’s NO2 VCD results and those from MAX-DOAS. This demonstrates that Pandora successfully captures not only the peak and low NO2 concentrations but also accurately reproduces the diurnal variation patterns, thereby attesting to the high reliability of its inversion outcomes.
To examine the temporal characteristics of the Pandora measurements, we conducted diurnal variation analyses for both instruments. The daily averages are displayed in Figure 11. Specifically, Figure 11a illustrates the absolute differences in NO2 VCD between Pandora and MAX-DOAS, Figure 11b compares the daily mean NO2 concentrations from both instruments with error bars depicting the standard deviation, and Figure 11c shows the correlation between the two instruments’ daily mean values and includes an inset histogram showing the frequency distribution of their absolute differences. As is evident from Figure 11a,b, the daily mean NO2 concentrations from Pandora show good agreement with the MAX-DOAS measurements, with the absolute differences falling within ±0.5 × 10¹⁶ molec/cm2. These results confirm that Pandora’s NO2 retrievals are highly consistent with MAX-DOAS measurements in both magnitude and temporal variation patterns.

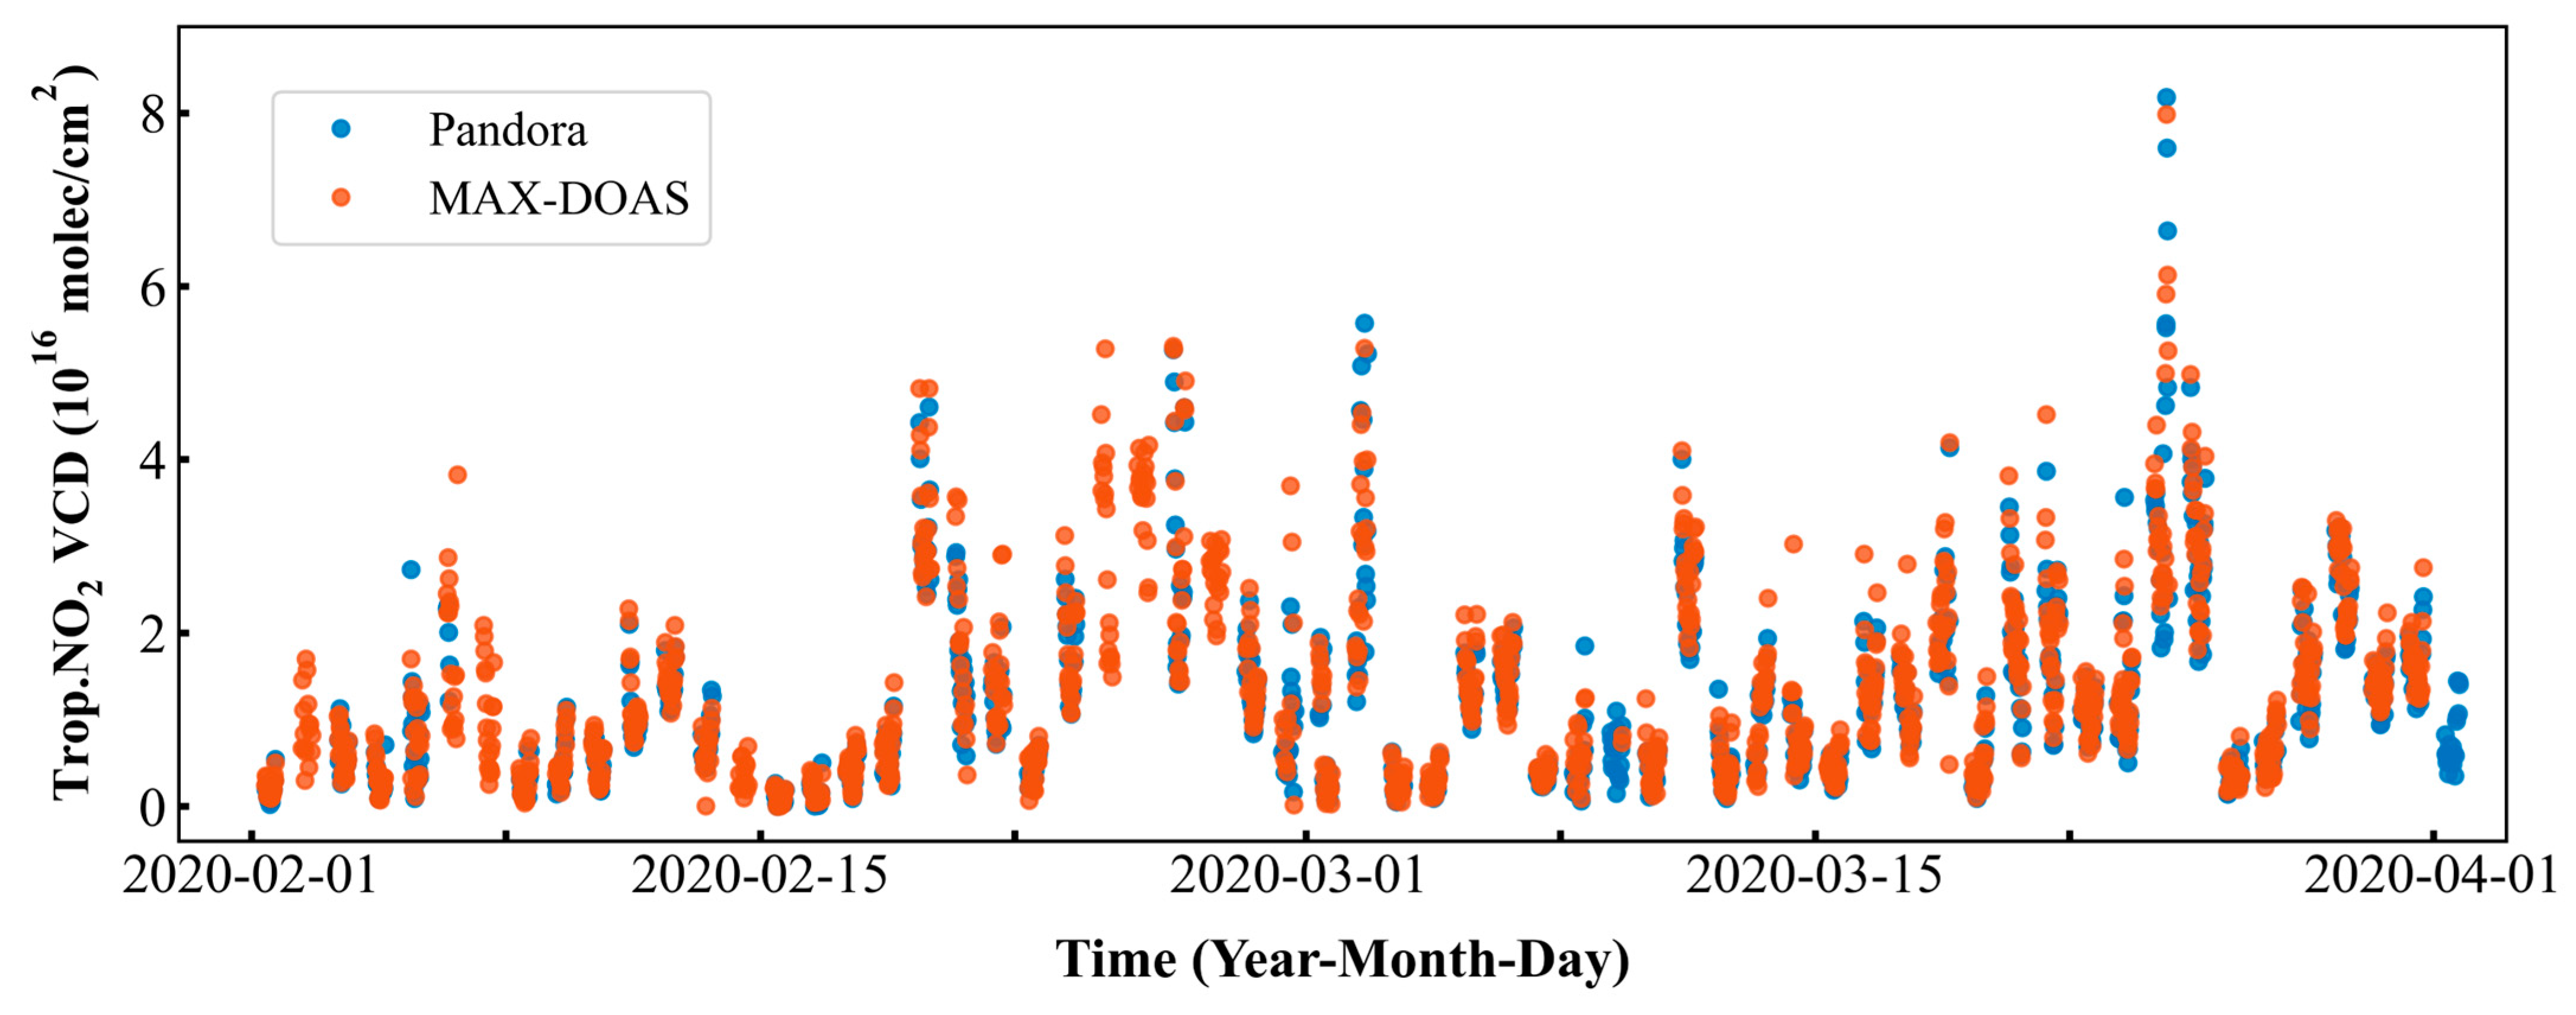
4.2. Comparison Between the Ground-Based Pandora and Satellite Observations

To further evaluate the retrieval performance of the Pandora, a comprehensive comparison was conducted with satellite-derived NO2 observations from OMI and TROPOMI, thereby assessing the applicability and reliability of Pandora for atmospheric monitoring. To minimize potential discrepancies arising from spatial and temporal mismatches, the analysis was restricted to satellite observations within a 25 km radius centered at the Xianghe observatory, coinciding with concurrent measurements from the Pandora spectrometer and MAX-DOAS instrument during the period extending from 8 November 2019 to 31 March 2020. Additionally, Pandora and MAX-DOAS NO2 retrievals were temporally averaged over a one-hour window (13:00–14:00 LST) to align with the overpass times of the satellites.
Figure 12a,b present correlation analyses comparing hourly-averaged tropospheric NO2 VCDs between ground-based observations and coincident from OMI and TROPOMI, considering only temporally collocated data across all the measurement platforms. Overall, both OMI and TROPOMI exhibit high consistency with Pandora, as indicated by R values of 0.96 and 0.91, respectively. Notably, the intercomparison reveals systematic differences between the measurement platforms: the OMI NO2 VCDs show positive biases of 10–20% relative to both Pandora (slope = 1.19) and MAX-DOAS (slope = 1.08), while TROPOMI NO2 demonstrates a consistent underestimation of approximately 20% relative to Pandora. This finding differs from some previous studies reporting a 20–40% underestimation of tropospheric NO2 VCDs by OMI relative to ground-based instruments [10,54,55]. This discrepancy may potentially arise from the limited number of qualified Pandora and MAX-DOAS observations available for spatiotemporal collocation in this study, combined with OMI’s coarse spatial resolution. Notably, under wintertime high-NO2 conditions, retrieval uncertainties from both satellite and ground-based instruments tend to increase [44], potentially amplifying discrepancies in averaged concentrations. Future investigations should prioritize evaluating Pandora’s retrieval performance by quantifying contributions from both random and systematic errors. Random errors primarily originate from measurement noise and spectral fitting procedures, directly impacting the SCD precision. More significantly, systematic errors arise from uncertainties in key model parameters, including cloud properties, surface albedo, a priori profile configurations, and aerosol distributions, which collectively affect the tropospheric AMF accuracy [56]. Crucially, all these error sources exhibit distinct spatiotemporal characteristics that must be accounted for in uncertainty quantification.
Despite these biases, the retrieved NO2 concentrations from ground-based Pandora instrument demonstrate a high overall correlation with the satellite observations, underscoring the reliability and applicability of Pandora for atmospheric NO2 monitoring.

5. Discussion

This study represents the first attempt to utilize Pandora Level 0 data, successfully establishing a complete methodological framework from raw spectral to tropospheric NO2 retrieval applications in China. Nevertheless, we acknowledge that the processing workflow developed in this study requires substantial refinement and systematic evaluation to enhance its robustness and broader applicability.
Within Pandora’s spectral data acquisition and calibration system, the current calibration methodology requires further optimization, particularly for the UV spectral range. It is well-established that UV band calibration presents greater technical challenges compared to the visible spectrum, primarily due to its heightened susceptibility to stray light interference and other confounding factors [57]. Stray light constitutes undesired electromagnetic radiation detected outside the nominal wavelength range during spectroscopic measurements [58]. Previous studies have demonstrated that the pronounced irradiance gradient in the UV-B spectral range (280–315 nm) induces substantial spectral stray light effects in optical measurements. It induces significant overestimation of short-wavelength irradiance measurements while concurrently depressing retrieved total ozone and sulfur dioxide column densities [59]. This instrumental artifact also inevitably affects other atmospheric parameters, such as ozone vertical profiles and aerosol optical depth [60,61]. To address these effects, Savastiouk et al. [62] developed a new physically-based stray light correction method (PHYCS) for Brewer spectrophotometers, which directly corrects raw count rates at the primary data reduction stage. Validation demonstrates that the PHYCS maintains correction-induced uncertainties below 1%, even at extreme ozone SCDs of 2000 DU. Further enhancement of spectral calibration accuracy requires comprehensive instrument characterization procedures, such as temperature calibration and non-linearity correction [63,64]. These refinements contribute to enhance measurement precision for ground-based spectroscopic applications.
In the current tropospheric NO2 VCD retrieval framework, a geometric approximation approach has been utilized. However, this experimental configuration does not adequately account for the impacts of clouds, aerosols, or varying meteorological conditions on the NO2 retrieval results. Numerous studies have demonstrated that scattering effects from clouds and aerosols can alter the light path in ground-based measurements, thereby introducing significant retrieval errors [23,24,53]. Moreover, AMF calculations based on geometric approximation exhibit statistically significant discrepancies compared to realistic atmospheric AMF values, resulting in non-negligible uncertainties in the final retrieval results. Wang et al. [65] systematically investigated the limitations of the geometric approximation method, revealing that the discrepancies in ground-based VCD retrievals between this method and the profile integration approach primarily stem from inherent deficiencies of the geometric approximation under conditions of elevated aerosol loading. Furthermore, a systematic evaluation of meteorological influences on MAX-DOAS retrievals revealed two critical findings: (1) vertical profile inversions of trace gases are rendered ineffective during fog episodes or under optically dense cloud cover, and (2) NO2 concentrations exhibit significant wind-speed dependence, showing a marked decrease under high wind speeds, unequivocally indicating the predominance of local emission dispersion over regional transport mechanisms [65].
To advance current capabilities, future work will implement sophisticated radiative transfer models to compute NO2 AMFs under realistic atmospheric scenarios. Through optimal estimation inversion techniques, we aim to simultaneously retrieve NO2 column densities and vertical profiles, thereby facilitating comprehensive evaluation of error contributions from aerosols and other parameters to enhance retrieval precision.

6. Conclusions

This study presents observational and retrieval research using a portable ground-based Pandora spectrometer deployed at the Xianghe station. We designed a data acquisition and calibration system (P-CAR v1.0) for the instrument’s spectral observations, enabling the retrieval of NO2 column densities. Additionally, we conducted comparative analyses with a co-located MAX-DOAS instrument and satellite observations to validate our retrieval results. The principal findings and conclusions are as follows:
(1) Based on Pandora’s raw spectral measurements, we established a comprehensive spectral data acquisition and calibration system. This system facilitates the conversion of raw scattered spectral data (L0) to calibrated spectral data (L1). Notably, it is applicable and compatible with the spectral reading and calibration requirements across different Pandora instrument models.
(2) The inversion process from Pandora L1 spectral data to NO2 SCD has been successfully implemented. Through a series of rigorous sensitivity tests, the optimal parameter configuration for NO2 inversion has been determined. Using a geometric approximation approach, the tropospheric NO2 VCD was retrieved. The results obtained from the visible (VIS) and ultraviolet (UV) spectral regions exhibit a strong correlation coefficient of 0.97.
(3) The NO2 retrievals from Pandora demonstrate excellent consistency with the MAX-DOAS measurements, with correlation coefficients exceeding 0.96 for both the hourly and daily mean NO2 concentrations. The fitting slopes consistently exceed 0.90, indicating that both instruments’ inversion results accurately capture the diurnal variation patterns of NO2. Similarly, Pandora exhibits strong consistency when compared against satellite data from TROPOMI and OMI, achieving R values of 0.96 and 0.91, respectively, at the hourly scale. These underscore the high reliability of Pandora’s NO2 retrievals.

Author Contributions

Conceptualization, C.W. and T.W.; methodology, C.W. and X.Z.; software, C.W., T.W. and Z.C.; validation, C.W. and W.W.; data curation, T.W. and Z.C.; writing—original draft preparation, C.W.; writing—review and editing, T.W., Z.C., Y.L. and P.W. All authors have read and agreed to the published version of the manuscript.

Funding

This work was supported by the National Natural Science Foundation of China (Grant Nos. 42293321, 42090033, and 42405197), the Youth Science and Technology Fund Project of the National Meteorological Information Center (Grant No. NMICQJ11-202403), the Natural Science Foundation of Henan Province (Grant No. 232300420451), and the Key Innovation Team of National Meteorological Information Center for Analysis of Real-time Ocean Data (Grant No. NMIC-2024-ZD05).

Data Availability Statement

The TROPOMI NO2 data are publicly available at ESA Copernicus Open Access Hub: https://dataspace.copernicus.eu/, accessed on 10 May 2025. The OMI NO2 data are publicly available at https://disc.gsfc.nasa.gov/, accessed on 12 February 2025. The ground-based data presented in this study are available on request from the corresponding author.

Acknowledgments

We sincerely thank the staff at the Xianghe station for their long-term maintenance of the instruments. Additionally, we acknowledge the TROPOMI and OMI science teams for making TROPOMI and OMI Level 2 data publicly available and would like to thank the BIRA-IASB for providing free access to the QDOAS software. We gratefully acknowledge the constructive comments from the reviewers and the editorial team, which have significantly improved the quality of this manuscript.

Conflicts of Interest

The authors declare no conflicts of interest.

References

  1. Yang, D.; Hakkarainen, J.; Liu, Y.; Ialongo, I.; Cai, Z.; Tamminen, J. Detection of Anthropogenic CO2 Emission Signatures with TanSat CO2 and with Copernicus Sentinel-5 Precursor (S5P) NO2 Measurements: First Results. Adv. Atmos. Sci. 2023, 40, 1–5. [Google Scholar] [CrossRef] [PubMed]
  2. Luvsan, M.E. The patterns and health risks of NO2 and SO2 pollution in Mongolia. In Proceedings of the World Congress on Risk, Sydney, Australia, 17–20 July 2012. [Google Scholar]
  3. Costa, S.; Ferreira, J.; Silveira, C.; Costa, C.; Lopes, D.; Relvas, H.; Borrego, C.; Roebeling, P.; Miranda, A.I.; Paulo Teixeira, J. Integrating Health on Air Quality Assessment-Review Report on Health Risks of Two Major European Outdoor Air Pollutants: PM and NO2. J. Toxicol. Environ. Health Part B Crit. Rev. 2014, 17, 307–340. [Google Scholar] [CrossRef] [PubMed]
  4. Averett, N. Exercising in Polluted Areas: Study Suggests Benefits Outweigh the Health Risks of NO2 Exposure. Environ. Health Perspect. 2015, 123, A158. [Google Scholar] [CrossRef]
  5. Heue, K.P.; Richter, A.; Bruns, M.; Burrows, J.P.; Platt, U.; Pundt, I.; Wang, P.; Wagner, T. Validation of SCIAMACHY tropospheric NO2-columns with AMAXDOAS measurements. Atmos. Chem. Phys. Discuss. 2004, 4, 1039–1051. [Google Scholar] [CrossRef]
  6. Irie, H.; Kanaya, Y.; Akimoto, H.; Tanimoto, H.; Bucsela, E.J. Validation of OMI tropospheric NO2 column data using MAX-DOAS measurements deep inside the North China Plain in June 2006: Mount Tai Experiment 2006. Atmos. Chem. Phys. 2008, 8, 6577–6586. [Google Scholar] [CrossRef]
  7. Wenig, M.O.; Cede, A.M.; Bucsela, E.J.; Celarier, E.A.; Boersma, K.F.; Veefkind, J.P.; Brinksma, E.J.; Gleason, J.F.; Herman, J.R. Validation of OMI tropospheric NO2 column densities using direct-Sun mode Brewer measurements at NASA Goddard Space Flight Center. J. Geophys. Res. 2008, 113, D16S45. [Google Scholar] [CrossRef]
  8. Jin, J.; Ma, J.; Lin, W.; Zhao, H.; Shaiganfar, R.; Beirle, S.; Wagner, T. MAX-DOAS measurements and satellite validation of tropospheric NO2 and SO2 vertical column densities at a rural site of North China. Atmos. Environ. 2016, 133, 12–25. [Google Scholar] [CrossRef]
  9. Dimitropoulou, E.; Hendrick, F.; Pinardi, G.; Friedrich, M.M.; Roozendael, M.V. Validation of TROPOMI tropospheric NO2 columns using dual-scan multi-axis differential optical absorption spectroscopy (MAX-DOAS) measurements in Uccle, Brussels. Atmos. Meas. Tech. 2020, 13, 5165–5191. [Google Scholar] [CrossRef]
  10. Wang, C.; Wang, T.; Wang, P.; Wang, W. Assessment of the Performance of TROPOMI NO2 and SO2 Data Products in the North China Plain: Comparison, Correction and Application. Remote Sens. 2022, 14, 214. [Google Scholar] [CrossRef]
  11. Lange, K.; Richter, A.; Schnhardt, A.; Meier, A.; Bsch, T.; Seyler, A.; Krause, K.U.; Behrens, L.; Wittrock, F.; Merlaud, A. Validation of Sentinel-5P TROPOMI tropospheric NO2 products by comparison with NO2 measurements from airborne imaging DOAS, ground-based stationary DOAS, and mobile car DOAS measurements during the S5P-VAL-DE-Ruhr campaign. Atmos. Meas. Tech. 2023, 16, 1357–1389. [Google Scholar] [CrossRef]
  12. Brewer, A.W.; Mcelroy, C.T.; Kerr, J.B. Nitrogen Dioxide Concentrations in the Atmosphere. Nature 1973, 246, 129–133. [Google Scholar] [CrossRef]
  13. Noxon, J.F. Nitrogen Dioxide in the Stratosphere and Troposphere Measured by Ground-Based Absorption Spectroscopy. Science 1975, 189, 547–549. [Google Scholar] [CrossRef]
  14. Hönninger, G.; Von Friedeburg, C.; Platt, U. Multi axis differential optical absorption spectroscopy (MAX-DOAS). Atmos. Chem. Phys. 2003, 4, 231–254. [Google Scholar] [CrossRef]
  15. Ibrahim, O.; Platt, U.; Shaiganfar, R.; Wagner, T. Mobile MAX-DOAS observations of tropospheric trace gases. Atmos. Meas. Tech. 2010, 3, 129–140. [Google Scholar]
  16. Vlemmix, T.; Piters, A.J.M.; Stammes, P.; Wang, P.; Levelt, P.F. Retrieval of tropospheric NO2 using the MAX-DOAS method combined with relative intensity measurements for aerosol correction. Atmos. Meas. Tech. 2010, 3, 1287–1305. [Google Scholar] [CrossRef]
  17. Leser, H.; Honninger, G.; Platt, U. MAX-DOAS measurements of BrO and NO2 in the marine boundary layer. Geophys. Res. Lett. 2003, 30, 101029. [Google Scholar] [CrossRef]
  18. Ma, J.Z.; Beirle, S.; Jin, J.L.; Shaiganfar, R.; Yan, P.; Wagner, T. Tropospheric NO2 vertical column densities over Beijing: Results of the first three years of ground-based MAX-DOAS measurements (2008–2011) and satellite validation. Atmos. Chem. Phys. 2013, 13, 1547–1567. [Google Scholar] [CrossRef]
  19. Wang, T.; Hendrick, F.; Wang, P.; Tang, G.; Clémer, K.; Yu, H.; Fayt, C.; Hermans, C.; Gielen, C.; Müller, J.F.; et al. Evaluation of tropospheric SO2 retrieved from MAX-DOAS measurements in Xianghe, China. Atmos. Chem. Phys. 2014, 14, 11149–11164. [Google Scholar] [CrossRef]
  20. Kang, Y.; Tang, G.; Li, Q.; Liu, B.; Cao, J.; Hu, Q.; Wang, Y. Evaluation and Evolution of MAX-DOAS-observed Vertical NO2 Profiles in Urban Beijing. Adv. Atmos. Sci. 2021, 38, 1188–1196. [Google Scholar] [CrossRef]
  21. Tian, X.; Chen, M.; Xie, P.; Xu, J.; Li, A.; Ren, B.; Zhang, T.; Fan, G.; Wang, Z.; Zheng, J.; et al. Evaluation of MAX-DOAS Profile Retrievals under Different Vertical Resolutions of Aerosol and NO2 Profiles and Elevation Angles. Remote Sens. 2023, 15, 5431. [Google Scholar] [CrossRef]
  22. Brinksma, E.J.; Pinardi, G.; Volten, H.; Braak, R.; Levelt, P.F. The 2005 and 2006 DANDELIONS NO2 and aerosol intercomparison campaigns. J. Geophys. Res. Atmos. 2008, 113, 762–770. [Google Scholar] [CrossRef]
  23. Herman, J.; Cede, A.; Spinei, E.; Mount, G.; Tzortziou, M.; Abuhassan, N. NO2 column amounts from ground-based Pandora and MFDOAS spectrometers using the direct-sun DOAS technique: Intercomparisons and application to OMI validation. J. Geophys. Res. Atmos. 2009, 114, D13307. [Google Scholar] [CrossRef]
  24. Clémer, K.; Roozendael, M.V.; Fayt, C.; Hendrick, F.; Mazière, M.D. Multiple wavelength retrieval of tropospheric aerosol optical properties from MAXDOAS measurements in Beijing. Atmos. Meas. Tech. 2010, 3, 863–878. [Google Scholar] [CrossRef]
  25. Piters, A.J.M.; Boersma, K.F.; Kroon, M.; Hains, J.C.; Van Roozendael, M.; Wittrock, F.; Abuhassan, N.; Adams, C.; Akrami, M.; Allaart, M.A.F.; et al. The Cabauw Intercomparison campaign for Nitrogen Dioxide measuring Instruments (CINDI): Design, execution, and early results. Atmos. Meas. Tech. 2012, 5, 457–485. [Google Scholar] [CrossRef]
  26. Tzortziou, M.; Herman, J.R.; Cede, A.; Loughner, C.P.; Abuhassan, N.; Naik, S. Spatial and temporal variability of ozone and nitrogen dioxide over a major urban estuarine ecosystem. J. Atmos. Chem. 2015, 72, 287–309. [Google Scholar] [CrossRef]
  27. Zhao, X.; Fioletov, V.; Strong, K.; Cede, A.; Davies, J. Accuracy, precision, and temperature dependence of Pandora total ozone measurements estimated from a comparison with the Brewer triad in Toronto. Atmos. Meas. Tech. 2016, 9, 5747–5761. [Google Scholar] [CrossRef]
  28. Chong, H.; Lee, H.; Koo, J.H.; Kim, J.; Jeong, U.; Kim, W.; Kim, S.W.; Herman, J.R.; Abuhassan, N.K.; Ahn, J.Y. Regional characteristics of NO2 column densities from Pandora observations during the MAPS-Seoul campaign. Aerosol Air Qual. Res. 2018, 18, 2207–2219. [Google Scholar] [CrossRef]
  29. Herman, J.; Spinei, E.; Fried, A.; Kim, J.; Segal-Rozenhaimer, M. NO2 and HCHO measurements in Korea from 2012 to 2016 from Pandora Spectrometer Instruments compared with OMI retrievals and with aircraft measurements during the KORUS-AQ campaign. Atmos. Meas. Tech. Discuss. 2018, 11, 4583–4603. [Google Scholar] [CrossRef]
  30. Thompson, A.M.; Stauffer, R.M.; Boyle, T.P.; Kollonige, D.E.; Miyazaki, K.; Tzortziou, M.; Herman, J.R.; Abuhassan, N.; Jordan, C.E.; Lamb, B.T. Comparison of Near-Surface NO2 Pollution With Pandora Total Column NO2 During the Korea-United States Ocean Color (KORUS OC) Campaign. J. Geophys. Res. Atmos. 2019, 124, 13560–13575. [Google Scholar] [CrossRef]
  31. Ialongo, I.; Herman, J.; Krotkov, N.; Lamsal, L.; Tamminen, J. Comparison of OMI NO2 observations and their seasonal and weekly cycles with ground-based measurements in Helsinki. Atmos. Meas. Tech. 2016, 9, 5203–5212. [Google Scholar] [CrossRef]
  32. Herman, J.; Abuhassan, N.; Kim, J.; Kim, J.; Tzortziou, M. Underestimation of column NO2 amounts from the OMI satellite compared to diurnally varying ground-based retrievals from multiple PANDORA spectrometer instruments. Atmos. Meas. Tech. 2019, 12, 5593–5612. [Google Scholar] [CrossRef]
  33. Judd, L.M.; Al-Saadi, J.A.; Janz, S.J.; Kowalewski, M.G.; Williams, D. Evaluating the impact of spatial resolution on tropospheric NO2 column comparisons within urban areas using high-resolution airborne data. Atmos. Meas. Tech. 2019, 12, 6091–6111. [Google Scholar] [CrossRef] [PubMed]
  34. Judd, L.M.; Al-Saadi, J.A.; Szykman, J.J.; Valin, L.C.; Janz, S.J.; Kowalewski, M.G.; Eskes, H.J.; Veefkind, J.P.; Cede, A.; Mueller, M. Evaluating Sentinel-5P TROPOMI tropospheric NO2 column densities with airborne and Pandora spectrometers near New York City and Long Island Sound. Atmos. Meas. Tech. 2020, 13, 6113–6140. [Google Scholar] [CrossRef] [PubMed]
  35. Zhao, X.; Griffin, D.; Fioletov, V.; Mclinden, C.; Lee, S.C. Assessment of the quality of TROPOMI high-spatial-resolution NO2 data products in the Greater Toronto Area. Atmos. Meas. Tech. 2020, 13, 2131–2159. [Google Scholar] [CrossRef]
  36. Park, J.U.; Park, J.S.; Diaz, D.S.; Gebetsberger, M.; Müller, M.; Shalaby, L.; Tiefengraber, M.; Kim, H.; Park, S.S.; Song, C.K. Spatiotemporal inhomogeneity of total column NO2 in a polluted urban area inferred from TROPOMI and Pandora intercomparisons. GIScience Remote Sens. 2022, 59, 354–373. [Google Scholar] [CrossRef]
  37. Huijnen, V.; Eskes, H.J.; Poupkou, A.; Elbern, H.; Zerefos, C. Comparison of OMI NO2 tropospheric columns with an ensemble of global and European regional air quality models. Atmos. Chem. Phys. 2010, 9, 3273–3296. [Google Scholar] [CrossRef]
  38. Zheng, F.; Yu, T.; Cheng, T.; Gu, X.; Guo, H. Intercomparison of tropospheric nitrogen dioxide retrieved from Ozone Monitoring Instrument over China. Atmos. Pollut. Res. 2014, 5, 686–695. [Google Scholar] [CrossRef]
  39. Krotkov, N.A.; Lamsal, L.N.; Celarier, E.A.; Swartz, W.H.; Marchenko, S.V.; Bucsela, E.J.; Chan, K.L.; Wenig, M.; Zara, M. The version 3 OMI NO2 standard product. Atmos. Meas. Tech. 2017, 10, 3133–3149. [Google Scholar] [CrossRef]
  40. Choi, S.; Lamsal, L.N.; Follette-Cook, M.; Joiner, J.; Herman, J.R. Assessment of NO2 observations during DISCOVER-AQ and KORUS-AQ field campaigns. Atmos. Meas. Tech. 2020, 13, 2523–2546. [Google Scholar] [CrossRef]
  41. OMNO2 Product Guidance Document. Available online: https://aura.gesdisc.eosdis.nasa.gov/data/Aura_OMI_Level2/OMNO2.003/doc/README.OMNO2.pdf (accessed on 11 February 2025).
  42. TROPOMI ATBD of the Total and Tropospheric NO2 Data Products. Available online: https://sentiwiki.copernicus.eu/__attachments/1673595/S5P-KNMI-L2-0005-RP%20-%20Sentinel-5P%20TROPOMI%20ATBD%20NO2%20data%20products%202024%20-%202.8.0.pdf?inst-v=11c8ff02-71eb-449c-ab75-3b9180f56695 (accessed on 24 March 2025).
  43. Griffin, D.; Zhao, X.; Mclinden, C.A.; Boersma, K.F.; Bourassa, A.; Dammers, E.; Degenstein, D.A.; Eskes, H.; Fehr, L.; Fioletov, V. High-Resolution Mapping of Nitrogen Dioxide With TROPOMI: First Results and Validation Over the Canadian Oil Sands. Geophys. Res. Lett. 2018, 46, 1049–1060. [Google Scholar] [CrossRef]
  44. Wang, C.; Wang, T.; Wang, P.; Rakitin, V. Comparison and Validation of TROPOMI and OMI NO2 Observations over China. Atmosphere 2020, 11, 636. [Google Scholar] [CrossRef]
  45. Chance, K.; Kurucz, R.L. An improved high-resolution solar reference spectrum for earth’s atmosphere measurements in the ultraviolet, visible, and near infrared. J. Quant. Spectrosc. Radiat. Transf. 2010, 111, 1289–1295. [Google Scholar] [CrossRef]
  46. Vandaele, A.C.; Hermans, C.; Simon, P.C.; Carleer, M.; Colin, R.; Fally, S.; Mérienne, M.F.; Jenouvrier, A.; Coquart, B. Measurements of the NO2 absorption cross-section from 42,000 cm−1 to 10,000 cm−1 (238–1000 nm) at 220 K and 294 K. J. Quant. Spectrosc. Radiat. Transf. 1998, 59, 171–184. [Google Scholar] [CrossRef]
  47. Bogumil, K.; Orphal, J.; Homann, T.; Voigt, S.; Spietz, P.; Fleischmann, O.C.; Vogel, A.; Hartmann, M.; Kromminga, H.; Bovensmann, H. Measurements of molecular absorption spectra with the SCIAMACHY pre-flight model: Instrument characterization and reference data for atmospheric remote-sensing in the 230–2380 nm region. J. Photochem. Photobiol. A Chem. 2003, 157, 167–184. [Google Scholar] [CrossRef]
  48. Hermans, C.; Vandaele, A.C.; Fally, S.; Carleer, M.; Merienne, M.F. Absorption Cross-section of the Collision-Induced Bands of Oxygen from the UV to the NIR. In Weakly Interacting Molecular Pairs: Unconventional Absorbers of Radiation in the Atmosphere; Springer: Dordrecht, The Netherlands, 2003. [Google Scholar]
  49. Rothman, L.S.; Barbe, A.; Benner, D.C.; Brown, L.R.; Camy-Peyret, C.; Carleer, M.R.; Chance, K.; Clerbaux, C.; Dana, V.; Devi, V.M. The HITRAN molecular spectroscopic database: Edition of 2000 including updates through 2001. J. Quant. Spectrosc. Radiat. Transf. 2003, 82, 5–44. [Google Scholar] [CrossRef]
  50. Fleischmann, O.C.; Hartmann, M.; Burrows, J.P.; Orphal, J. New ultraviolet absorption cross-sections of BrO at atmospheric temperatures measured by time-windowing Fourier transform spectroscopy. J. Photochem. Photobiol. A Chem. 2004, 168, 117–132. [Google Scholar] [CrossRef]
  51. Meller, R.; Moortgat, G.K. Temperature dependence of the absorption cross sections of formaldehyde between 223 and 323 K in the wavelength range 225–375 nm. J. Geophys. Res. Atmos. 2000, 105, 7089–7101. [Google Scholar] [CrossRef]
  52. Shaiganfar, R.; Beirle, S.; Sharma, M.; Chauhan, A.; Singh, R.P.; Wagner, T. Estimation of NOx emissions from Delhi using Car MAX-DOAS observations and comparison with OMI satellite data. Atmos. Chem. Phys. 2011, 11, 10871–10887. [Google Scholar] [CrossRef]
  53. Reed, A.J.; Thompson, A.M.; Kollonige, D.E.; Martins, D.K.; Tzortziou, M.A.; Herman, J.R.; Berkoff, T.A.; Abuhassan, N.K.; Cede, A. Effects of local meteorology and aerosols on ozone and nitrogen dioxide retrievals from OMI and pandora spectrometers in Maryland, USA during DISCOVER-AQ 2011. J. Atmos. Chem. 2015, 72, 455–482. [Google Scholar] [CrossRef]
  54. Chan, K.L.; Wiegner, M.; Alberti, C.; Wenig, M. MAX-DOAS measurements of tropospheric NO2 and HCHO in Munich and the comparison to OMI and TROPOMI satellite observations. Atmos. Meas. Tech. 2020, 13, 4499–4520. [Google Scholar] [CrossRef]
  55. Verhoelst, T.; Compernolle, S.; Pinardi, G.; Lambert, J.C.; Zehner, C. Ground-based validation of the Copernicus Sentinel-5P TROPOMI NO2 measurements with the NDACC ZSL-DOAS, MAX-DOAS and Pandonia global networks. Atmos. Meas. Tech. 2021, 14, 481–510. [Google Scholar] [CrossRef]
  56. Boersma, K.F.; Eskes, H.J.; Brinksma, E.J. Error analysis for tropospheric NO2 retrieval from space. J. Geophys. Res. Atmos. 2004, 109. [Google Scholar] [CrossRef]
  57. Platt, U. Differential Optical Absorption Spectroscopy: Principles and Applications; Springer: Berlin/Heidelberg, Germany, 2004. [Google Scholar]
  58. Josefsson, W.A.P. Focused sun observations using a Brewer ozone spectrophotometer. J. Geophys. Res. 1992, 97, 15813–15817. [Google Scholar] [CrossRef]
  59. Redondas, A.; Evans, R.; Stuebi, R.; Köhler, U.; Weber, M. Evaluation of the use of five laboratory-determined ozone absorption cross sections in Brewer and Dobson retrieval algorithms. Atmos. Chem. Phys. 2014, 14, 1635–1648. [Google Scholar] [CrossRef]
  60. Arola, A.; Koskela, T. On the sources of bias in aerosol optical depth retrieval in the UV range. J. Geophys. Res. Atmos. 2004, 109. [Google Scholar] [CrossRef]
  61. Hrabcak, P. Comparison of the optical depth of total ozone and atmospheric aerosols in Poprad-Ganovce, Slovakia. Atmos. Chem. Phys. 2018, 18, 7739–7755. [Google Scholar] [CrossRef]
  62. Savastiouk, V.; Diémoz, H.; Mcelroy, C.T. A physically based correction for stray light in Brewer spectrophotometer data analysis. Atmos. Meas. Tech. 2023, 16, 4785–4806. [Google Scholar] [CrossRef]
  63. Moeini, O.; Vaziri, Z.; Mcelroy, C.T.; Tarasick, D.W.; Evans, R.D.; Petropavlovskikh, I.; Feng, K.H. The Effect of Instrumental Stray Light on Brewer and Dobson Total Ozone Measurements. Atmos. Meas. Tech. Discuss. 2018, 12, 327–343. [Google Scholar] [CrossRef]
  64. Zanjani, Z.V.; Moeini, O.; Mcelroy, T.; Barton, D.; Savastiouk, V. A calibration procedure which accounts for non-linearity in single-monochromator Brewer ozone spectrophotometer measurements. Atmos. Meas. Tech. 2019, 12, 271–279. [Google Scholar] [CrossRef]
  65. Wang, Y.; Lampel, J.; Xie, P.; Beirle, S.; Wagner, T. Ground-based MAX-DOAS observations of tropospheric aerosols, NO2, SO2 and HCHO in Wuxi, China, from 2011 to 2014. Atmos. Chem. Phys. 2017, 17, 2189–2215. [Google Scholar] [CrossRef]
Figure 1. (a) The exterior view and (b) the schematics of the portable Pandora spectrometer.
Remotesensing 17 01695 g001
Figure 2. Locations of the Pandora and MAX-DOAS observations at the Xianghe station in North China.
Remotesensing 17 01695 g002
Figure 3. Schematic diagram of the methodology. The left column outlines the spectral preprocessing pipeline, including key steps, such as dark current calibration, wavelength calibration, and other essential process. The right column denotes the method of tropospheric NO2 vertical column densities retrieval, illustrating the DOAS fitting process and the geometric approximation method.
Remotesensing 17 01695 g003
Figure 4. (a) Dark current spectrum observed on 18 January 2020 at 03:16 (UTC), and (b) dark current calibration results.
Remotesensing 17 01695 g004
Figure 5. Wavelength calibration results for 15 January 2020, at 11:12 (LST): (a) spectra before and after calibration; (b) fitting residuals; (c) offsets; (d) slit function parameters.
Remotesensing 17 01695 g005
Figure 6. Example of Pandora spectral inversion results of NO2 in (a) VIS band and (b) UV band at 10:49 on 15 February 2020 (LST). The NO2 DSCDs in the VIS and UV band are 3.08 × 10¹⁶ and 3.61 × 10¹⁶ molec/cm2, respectively, and the residuals are 7.03 × 10⁻⁴ and 1.53 × 10⁻³, respectively. The black line represents the actual spectrum, and the red line represents the fitted spectrum (or reference spectrum).
Remotesensing 17 01695 g006
Figure 7. NO2 DSCDs in VIS and UV bands retrieved from Pandora observation in different viewing angles on 17 January 2020 and 23 February 2020 with associated errors.
Remotesensing 17 01695 g007
Figure 8. NO2 VCDs in VIS and UV bands retrieved from Pandora observation on (a) 17 January 2020 and (b) 23 February 2020. (c) Scatter plot of NO2 column densities retrieved from VIS and UV bands from 8 November 2019 to 31 March 2020.
Remotesensing 17 01695 g008
Figure 9. NO2 DSCD comparison at 30° and zenith derived from Pandora and MAX-DOAS on (a) 11 March 2020 and (b) 30 March 2020. (c) Comparison of 1 h average value of NO2 DSCD of each instrument at 30° (red dots) and 90° (blue dots) observation angles from February to March 2020 (unit: 1016 molec/cm2).
Remotesensing 17 01695 g009
Figure 10. Time series of tropospheric NO2 VCDs derived by Pandora and MAX-DOAS at Xianghe station from 1 February to 31 March 2020 (unit: 1016 molec/cm2).
Remotesensing 17 01695 g010
Figure 11. (a) Daily average absolute bias of tropospheric NO2 VCDs; (b) daily average data; and (c) linear regression, as well as statistical chart of absolute difference between Pandora and MAX-DOAS daily NO2 VCDs at Xianghe station from February to March 2020 (unit: 1016 molec/cm2).
Remotesensing 17 01695 g011
Figure 12. Scatter diagram of collocated hourly-average tropospheric NO2 VCDs derived from ground-based measurements with (a) OMI and (b) TROPOMI satellite retrieval from 8 November 2019 to 31 March 2020. The red and blue regression lines represent the Pandora and MAX-DOAS, respectively (unit: 1016 molec/cm2).
Remotesensing 17 01695 g012
Table 1. Comparison of features between Pandora and MAX-DOAS in the UV–VIS band.
CharacteristicsPandoraMAX-DOAS
Wavelength interval290–380 nm (UV)300–390 nm (UV)
280–525 nm (UV–VIS)400–720 nm (VIS)
Spectral resolution (UV–VIS)0.6 nm0.4 nm (UV)
0.9 nm (VIS)
Array size (pixels)20482048 × 512
1340 × 100
Detector typeCCDCCD
Sky FOV1.5°0.8°
Elevation viewing angles1, 2, 15, 30, 90°2, 4, 6, 8, 10, 12, 15, 30, 90°
Azimuth angleNorth (0°)North (0°)
Table 2. Parameter settings used for NO2 DSCDs retrieved from Pandora.
ParameterDescriptionNO2
VISUV
Wavelength range 435–490 nm360–383.5 nm
Polynomial degree 55
Reference spectrum Zenith spectrum at solar noonZenith spectrum at solar noon
NO2220 K [46], 294 K [46]1
O3223 K [47], 243 K [47]
O4296 K [48]
H2O298 K [49]×
BrO223 K [50]× 2
HCHO293 K [51]×
RingQDOAS Ring tool
1 √ denotes that the cross-section of this gas was applied in the inversion. 2 × denotes that the cross-section of this gas was not applied in the inversion.
Disclaimer/Publisher’s Note: The statements, opinions and data contained in all publications are solely those of the individual author(s) and contributor(s) and not of MDPI and/or the editor(s). MDPI and/or the editor(s) disclaim responsibility for any injury to people or property resulting from any ideas, methods, instructions or products referred to in the content.

