Communication

Tropospheric NO2 Column over Tibet Plateau According to Geostationary Environment Monitoring Spectrometer: Spatial, Seasonal, and Diurnal Variations

1
School of Environmental Science and Engineering, Southern University of Science and Technology, Shenzhen 518055, China
2
State Key Joint Laboratory for Environmental Simulation and Pollution Control, College of Environmental Sciences and Engineering, Peking University, Beijing 100871, China
3
Department of Atmospheric Science, Yonsei University, Seoul 03722, Republic of Korea
4
Division of Earth Environmental System Science, Pukyong National University, Busan 48513, Republic of Korea
5
Division of Atomic Molecular and Physics, Center for Astrophysics | Harvard & Smithsonian, Cambridge, MA 02138, USA
6
National Institute of Environmental Research, Seoul 22689, Republic of Korea
7
Guangdong Provincial Observation and Research Station for Coastal Atmosphere and Climate of the Greater Bay Area, Southern University of Science and Technology, Shenzhen 518055, China
8
Shenzhen Key Laboratory of Precision Measurement and Early Warning Technology for Urban Environmental Health Risks, School of Environmental Science and Engineering, Southern University of Science and Technology, Shenzhen 518055, China
*
Author to whom correspondence should be addressed.
Remote Sens. 2025, 17(10), 1690; https://doi.org/10.3390/rs17101690
Submission received: 7 April 2025 / Revised: 4 May 2025 / Accepted: 9 May 2025 / Published: 12 May 2025
(This article belongs to the Section Atmospheric Remote Sensing)

Abstract

:
Nitrogen oxides (NOx) are key precursors of tropospheric ozone and particulate matter. The sparse local observations make it challenging to understand NOx cycling across the Tibetan Plateau (TP), which plays a crucial role in regional and global atmospheric processes. Here, we utilized Geostationary Environment Monitoring Spectrometer (GEMS) data to examine the tropospheric NO2 vertical column density (ΩNO2) spatiotemporal variability over TP, a pristine environment marked with natural sources. GEMS observations revealed that the ΩNO2 over TP is generally low compared with surrounding regions with significant surface emissions, such as India and the Sichuan basin. A spatial decreasing trend of ΩNO2 is observed from the south and center to the north over Tibet. Unlike the surrounding regions, the TP exhibits opposing seasonal patterns and a negative correlation between the surface NO2 and ΩNO2. In the Lhasa and Nam Co areas within Xizang, the highest ΩNO2 in spring contrasts with the lowest surface concentration. Diurnally, a midday increase in ΩNO2 in the warm season reflects some external sources affecting the remote area. Trajectory analysis suggests strong convection lifted air mass from India and Southeast Asia into the upper troposphere over the TP. These findings highlight the mixing interplay of nonlocal and local NOx sources in shaping NO2 variability in a high-altitude environment. Future research should explore these transport mechanisms and their implications for atmospheric chemistry and climate dynamics over the TP.

1. Introduction

Nitrogen oxides (NOx = NO + NO2) are pivotal in tropospheric chemistry by driving ozone (O3) formation through NO2 photolysis and serving as precursors to secondary aerosols that affect air quality and radiative forcing [1]. They also influence the atmospheric oxidative capacity via reactions involving nitrous acid (HONO) and free radicals [2]. Thus, spatial–temporal NO2 variations help us understand daily NOx cycles and environmental effects, particularly in regions where observations are scarce. Here, we analyzed year-round hourly tropospheric NO2 vertical column density (ΩNO2) variations over the Tibetan Plateau (TP) using Geostationary Environment Monitoring Spectrometer (GEMS) data, the first geostationary satellite for trace gases over Asia.
While urban NOx emissions from transportation and industrial activities are well characterized, natural sources—such as soil microbial processes, lightning, and stratosphere-troposphere exchange—prevail in remote areas yet remain inadequately constrained [3,4,5]. Multiple studies point to previously unrecognized NOx sources in unique regions, such as polar environments and the Tibetan Plateau. Deviations from the typical U-shaped NO2 diurnal cycle in the marine boundary layer suggest an unidentified daytime source, resulting in a 28–80% underestimation of O3 production [6]. The HNO3 photolysis in snowpack releases NOx, potentially affecting cirrus cloud chemistry [7,8], while sea ice emissions dominate NOx budgets in the Atlantic Southern Ocean [9]. Beyond NOx, elevated HONO mixing ratios further complicate this picture, potentially enhancing OH levels and serving as an intermediate tracer of the external cycling of reactive nitrogen in remote atmospheres [10]. Notably, neglecting this external cycling in low-NOx environments results in a 41% underestimation of OH concentrations [11]. These discoveries reveal deficiencies in current atmospheric chemistry models, underscoring the need to integrate these novel natural mechanisms.
The TP, often termed the “Third Pole”, offers a distinct high-altitude setting to explore these natural processes. Its extreme meteorological conditions—intense solar radiation, low atmospheric pressure, cold-dry winters, and monsoon-influenced warm-wet summers—create a unique chemical environment [12]. Natural NOx emissions arise from soil microbial activity, amplified during the wet summers [13], alongside contributions from lakes and lightning-induced NOx (LNOx) linked to local and South Asian transport shape a distinctive chemical environment [14,15]. Given its significance in global climate dynamics, the plateau merits detailed investigation, particularly given the scarcity of current observations [16].
Satellites have been mapping atmospheric NO2 concentrations since the 1990s, but with too coarse spatial–temporal resolution to resolve pristine regions such as TP. The advent of satellite technology, notably the Geostationary Environment Monitoring Spectrometer (GEMS) launched in 2020, rectified this problem [17]. Cross-validation with ground-based differential optical absorption spectroscopy (DOAS) and in situ measurements underscored GEMS’ robustness in revealing NO2 dynamics [18,19]. Studies leveraging GEMS have demonstrated its capability to resolve NO2 emission patterns and regional transport dynamics over East Asia, with Park [20] showing that GEMS-informed adjustments to NOx emission inventories reduced the model’s underestimation of surface NO2 concentrations from 13.05 to 4.54% in China. Yang [21] showed that diurnal variations over urban centers like Seoul and Beijing are predominantly driven by anthropogenic sources, as validated by GEOS-Chem simulations. Similarly, Edwards [22] quantified NO2 tropospheric column variations exceeding 50% in polluted environments like Northeast Asia, highlighting the role of transport and photochemistry in shaping hourly patterns. High-resolution hourly satellite data are ideally suited to address the limited observations in remote areas [23,24].
Here, we utilized GEMS observations to study ΩNO2 spatiotemporal distributions across the TP, disentangling natural and anthropogenic contributions by contrasting remote (e.g., Nam Co) and urban-influenced regions in Lhasa. Identifying and exploring the unique mechanismsarenecessary for characterizing external cycling across low-NOx atmospheres. This study elucidates critical gaps in high-altitude atmospheric chemistry, offering insights into air quality and global tropospheric composition.

2. Materials and Methods

2.1. GEMS NO2 Observations

The Geostationary Environment Monitoring Spectrometer (GEMS), launched in February 2020 aboard the GEO-KOMPSAT-2B satellite, is the first geostationary instrument to monitor the atmospheric composition over Asia [17]. It can capture ~8 hourly observations across East and Southeast Asia (5°S–45°N, 75–145°E), including the Tibetan Plateau, with a full imaging cycle completed every 30 min and data transmitted within the subsequent 30 min. The hourly temporal resolution enables the capture of NO2 diurnal variability, critical for analyzing short-lived chemical processes over the Tibetan Plateau. The nominal spatial resolution is 3.5 × 7.7 km (Seoul, Republic of Korea), sufficient to resolve regional NO2 gradients.
Three steps mainly comprise the GEMS NO2 retrieval algorithm. The NO2 slant column density (SCD) is retrieved in the irradiance reference spectrum range of 432–450 nm wavelength using the multi-axis differential optical absorption spectroscopy (DOAS) spectral fitting method. Then, the NO2 SCD is converted to the total NO2 vertical column density (VCD) using the NO2 air mass factor (AMF), which is calculated from the scattering weight and shape factor of NO2 at each layer. The scatter weight is derived from a look-up table that contains pre-calculated values as a function of geometric angles [25], and the shape factor is calculated from the NO2 vertical profile derived from the Goddard Earth Observation System coupled with the Chemistry model (GEOS-Chem). Third, the VCD columns are separated into tropospheric and stratospheric NO2 via the stratosphere-troposphere separation scheme (STS) [26].
Validation studies of Level 2 GEMS tropospheric NO2VCD against ground-based instruments, Pandora, Multi-Axis Differential Optical Absorption Spectroscopy (MAX-DOAS), and TROPOMI or other satellite products report correlation coefficients ranging from 0.62 to 0.87 across East Asia and similar seasonal or diurnal variation, indicating a reasonable level of data accuracy [19,22,27,28,29,30,31]. Discrepancies arise from incorrect vertical coordinates in NO2 profiles used for air mass factor (AMF) computations, with varying AMFs contributing to differences across analyses [30]. Retrieval errors primarily from AMF uncertainties and spectral fitting are estimated at 15–20% in polluted areas. Some analyses based on deep learning or mixed research products can improve the accuracy [29,30]. The correlation coefficient between MAX-DOAS and GEMS can be 0.73, with lower averaged relative deviations of −13% in Lhasa [32]. Zhang [33] obtained a better correlation of spatial–temporal variation between the POMINO-GEMS data and MAX-DOAS in the three rivers source region in TP, and an increasing trend of tropospheric NO2 VCDs is exhibited from noon to the afternoon.
In this study, we utilized the Level 2 (L2) GEMS tropospheric NO2 VCD product (v3.0) from 2023 to 2024 filtered to include only observations with cloud fractions <0.3, final algorithm flags ≤ 1, solar zenith angles < 70°, and Viewing Zenith Angle < 70° to ensure retrieval accuracy and reliability for capturing NO2 spatiotemporal patterns [34].

2.2. China National Environmental Monitoring Center Surface NO2

China National Environmental Monitoring Centre (CNEMC) is a public institution that monitors the national environment, and it has incorporated more than 2100 air quality monitoring stations across China since its establishment in 1980. The trace gases include SO2, NO2, O3, and CO with hourly and daily means. Here, hourly NO2 measurements from four CNEMC stations from January 2023 to December 2024 were selected to represent mean surface NO2 variation in urban areas of Lhasa, ensuring comprehensive coverage of the local NO2 source. There are no CNEMC stations near the remote Nam Co areas. This dataset can complement satellite-derived NO2 observations, enabling a detailed investigation of surface NO2 contributions to the urban regional NOx cycle in Lhasa.

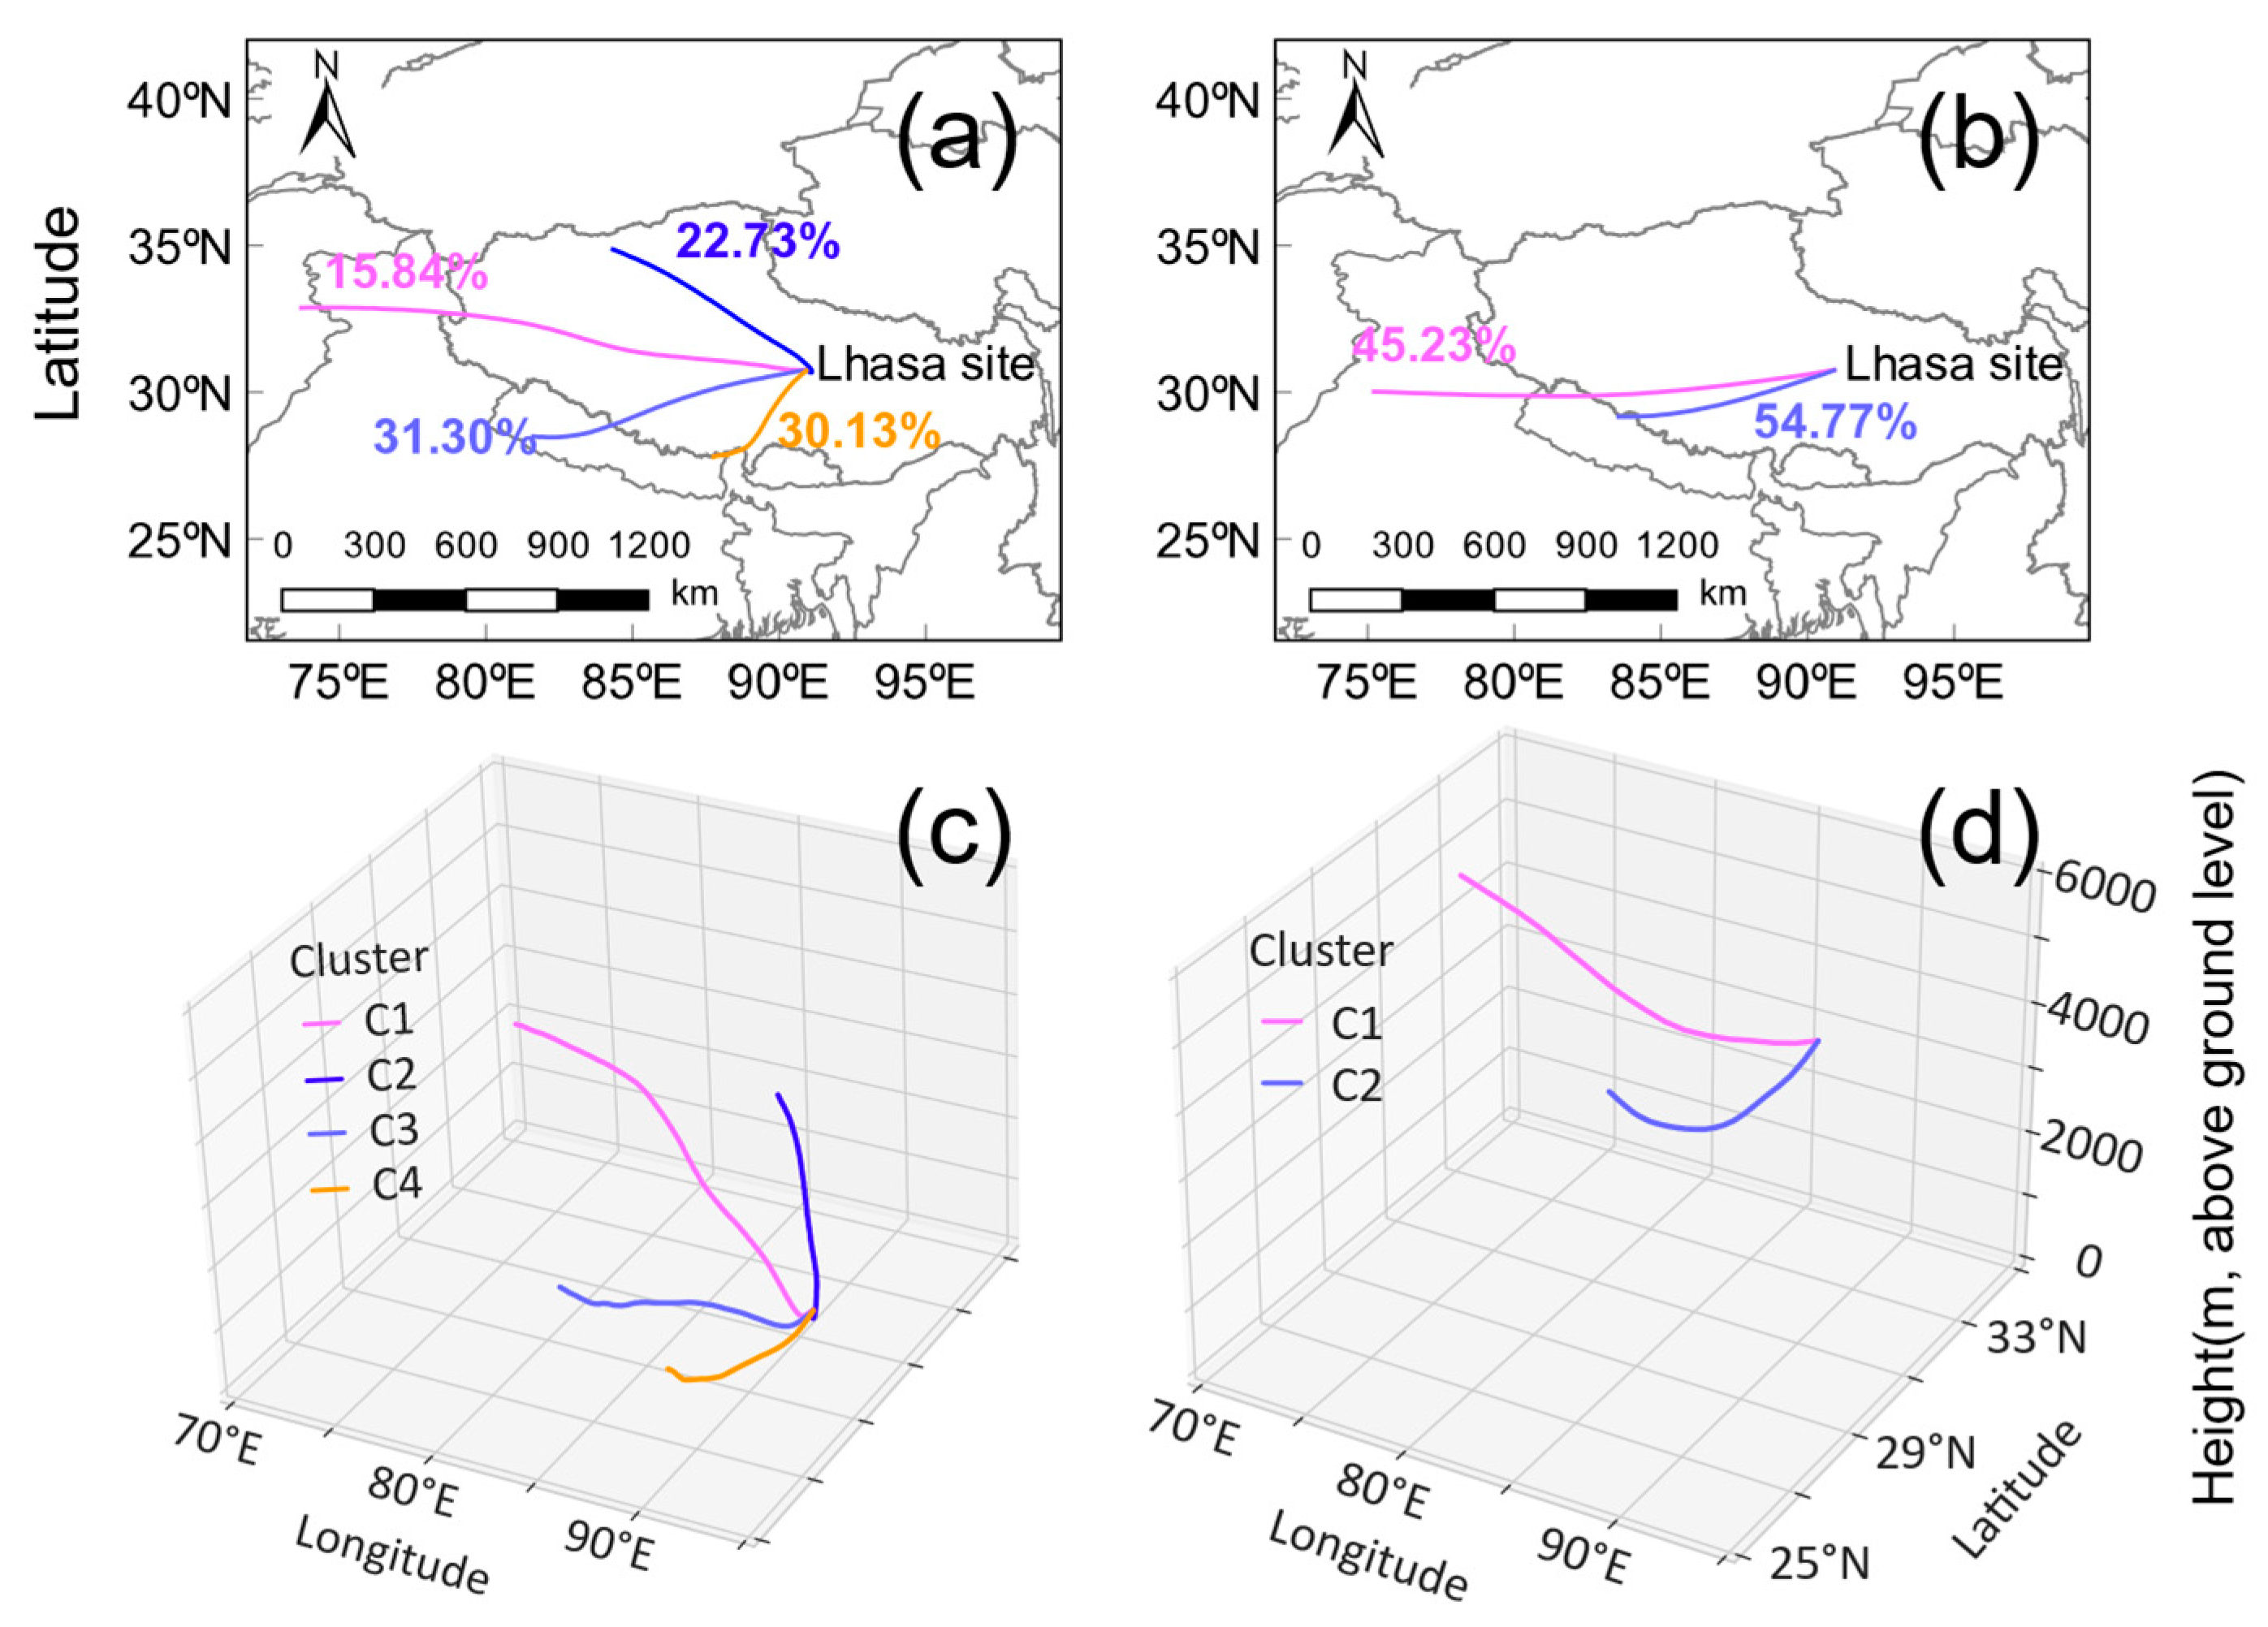
2.3. Lagrangian Trajectory Model

We conducted backward trajectories analysis to investigate the effect of long-range transport on tropospheric NO2 VCD variability over the Tibetan Plateau. The lifetime of longer-lived NOx in the upper troposphere can be several days [35]. We employed the Hybrid Single-Particle Lagrangian Integrated Trajectory (HYSPLIT) model from the National Oceanic and Atmospheric Administration Air Resources Laboratory (NOAA ARL), driven by meteorological datasets from the Global Data Assimilation System (GDAS), with 1° × 1° spatial resolution and three-hourly temporal intervals [36]. In addition, 72 h backward trajectories were calculated for the spring of 2023, with the 500 m AGL receptor height chosen to represent well-mixed lower tropospheric air over the plateau’s complex terrain. The resulting trajectories were imported into Meteoinfomap (v3.9.10) software for clustering and visualization, facilitating the identification of potential NO2 source regions [37].

3. Results

3.1. Spatial Variations of Tropospheric NO2 Vertical Column Density

Seasonal variations of NO2 concentrations over the TP were observed by GEMS. An example of GEMS daytime retrievals of the tropospheric NO2 column densities (ΩNO2) over the TP in winter 2023 (Feb) is shown in Figure 1. Lower satellite retrieval frequencies also constrain observations during this period due to reduced solar elevation angles and increased cloud cover. With barely any local anthropogenic emissions, ΩNO2 is remarkably lower than in surrounding areas such as the Sichuan and Indian regions. Summer observations benefit from higher retrieval frequencies under prolonged daylight hours. ΩNO2 is elevated during summer across the TP, while surrounding regions exhibit lower levels than in winter. This phenomenon underscores the unneglected natural emissions in the background areas [15,38].
Situated in the southeastern TP, Xizang lies adjacent to the Himalayas at an average elevation of approximately 4 km, where minimal anthropogenic emissions make it an ideal pristine background region. In both seasons, the spatial distribution of ΩNO2 in Xizang reveals significantly lower concentrations and a decreasing concentration from the southeast to the northwest. Elevated concentrations in eastern Tibet reflect transport from the Sichuan Basin, while Lhasa consistently exhibits higher ΩNO2 due to localized urban emissions (Figure 2). During summer, ΩNO2 across the region is generally elevated (0.77 × 10¹⁵ molecules cm⁻2, 0.53 × 10¹⁵ molecules cm⁻2 in winter), consistent with enhanced natural emissions under monsoon-driven conditions.

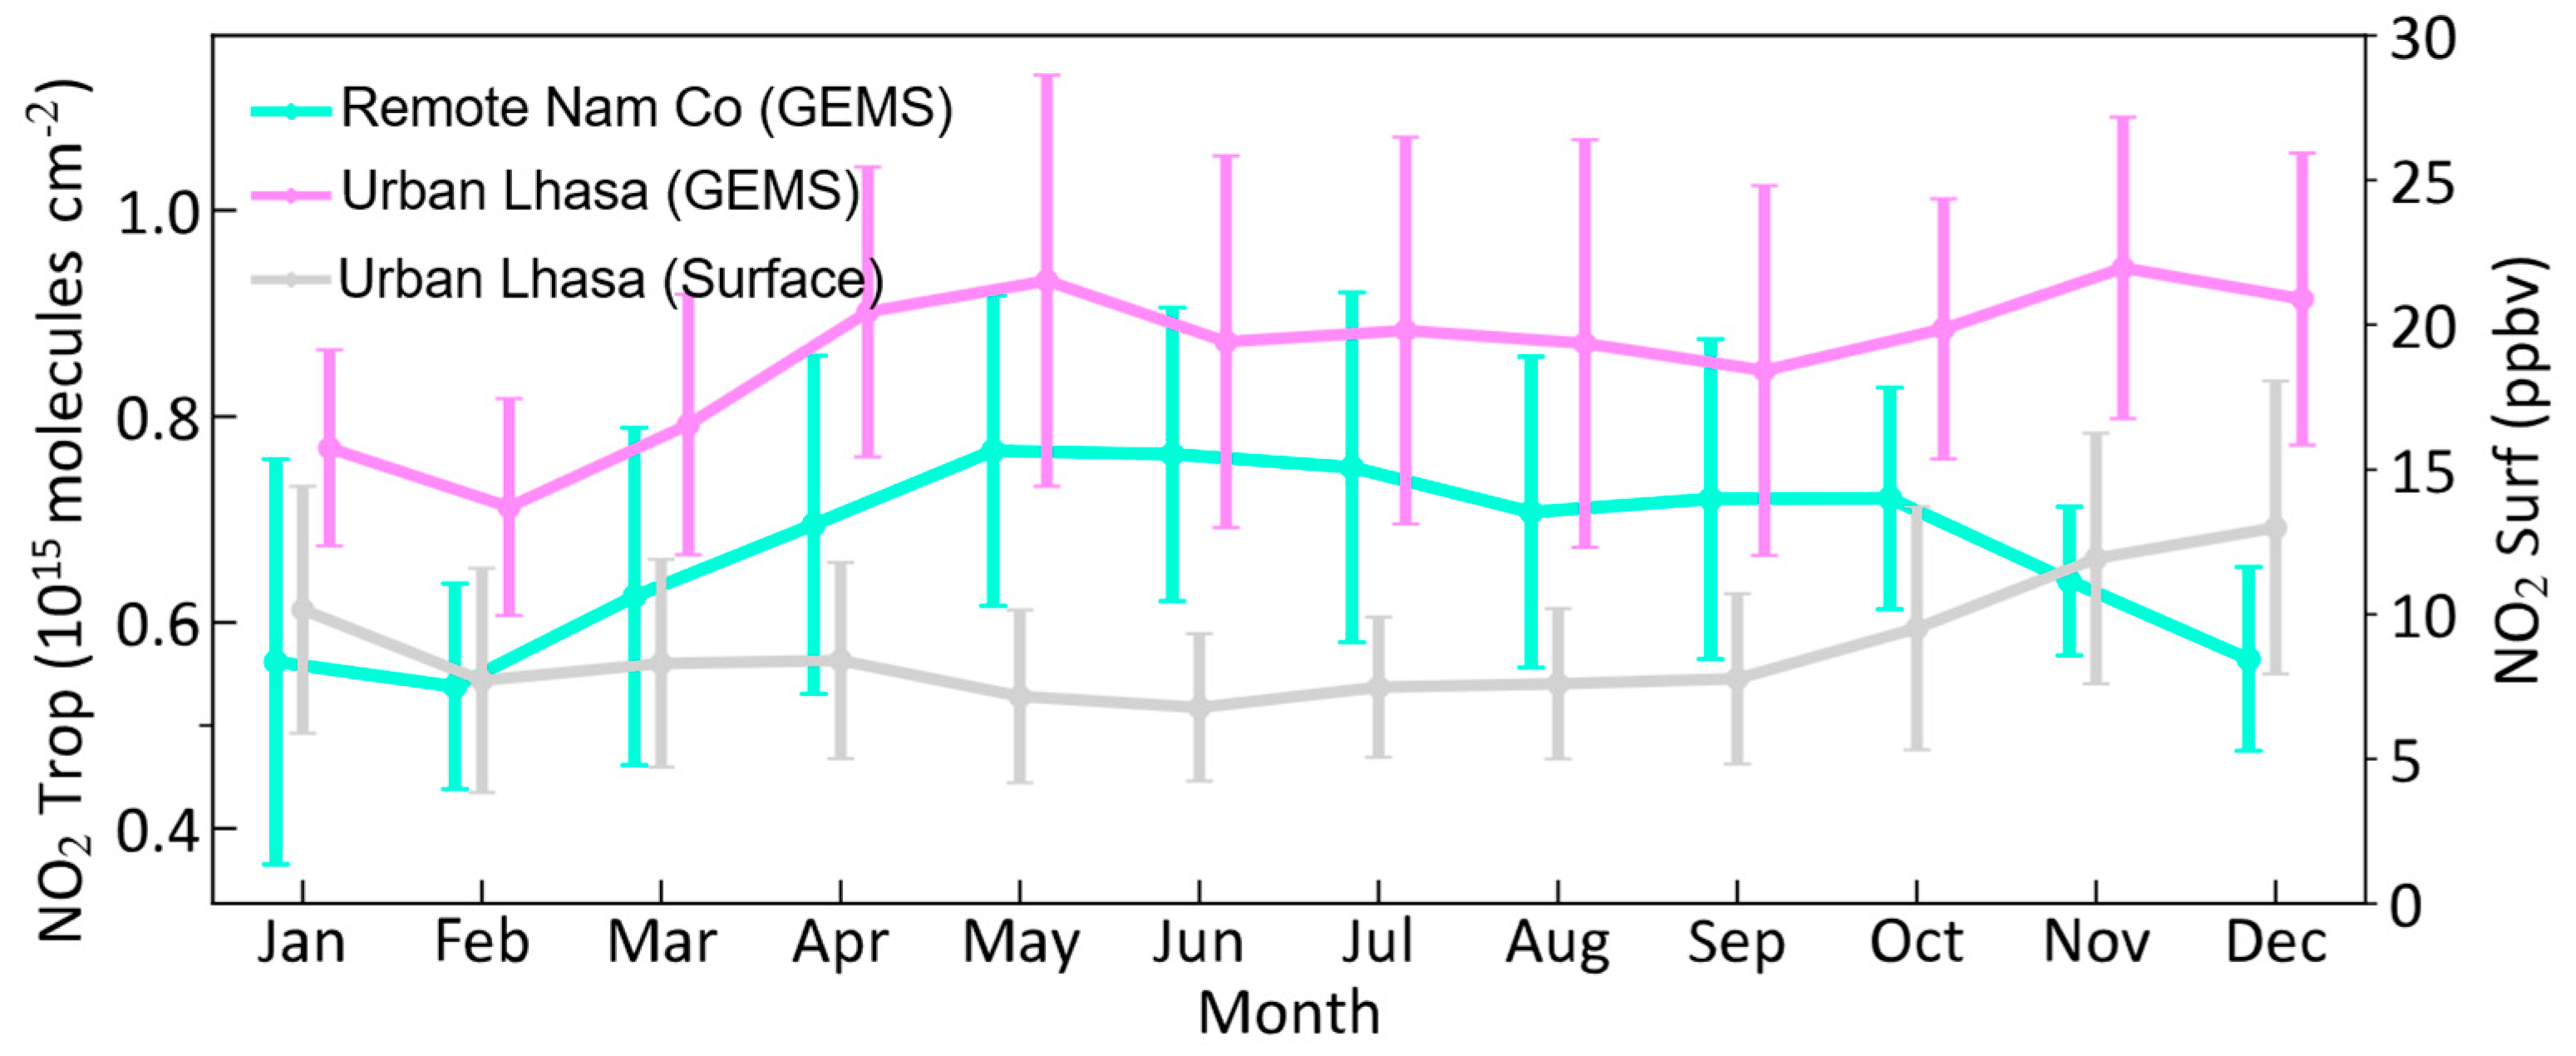
3.2. Seasonal Variations of Tropospheric NO2 Vertical Column Density and Surface NO2 Concentration

To further investigate the overall seasonal patterns, we compare the anthropogenic area in Lhasa (29.67°N, 91.12°E) with a pristine background area in the Nam Co, located approximately 100 km north across the city (30.77°N, 90.99°E). The anthropogenic influence in Lhasa is evident in Figure 2. Monthly time-averaged variations in the ΩNO2 from the GEMS are shown in Figure 3 from 2023–2024.
In Lhasa, ΩNO2 exhibits substantially higher concentrations (8.6 × 10¹⁴ ± 1.5 × 10¹⁴ molecules cm⁻2) and reduced levels in Nam Co (6.7 × 10¹⁴ molecules cm⁻2). The averaged ΩNO2 over Lhasa exhibited a significant peak in May (9.3 × 10¹⁴ ± 1.4 × 10¹⁴ molecules cm⁻2) and a secondary peak in December (9.4 × 10¹⁴ ± 1.5 × 10¹⁴ molecules cm⁻2), reflecting the dominant influence of localized anthropogenic sources in winter. The pristine Nam Co region shows one peak value in May (7.7 × 10¹⁴ ± 1.5 × 10¹⁴ molecules cm⁻2).
In contrast to the columns, surface NO2 data from urban sites in the Lhasa area, operated by the CNEMC in urban areas, exhibited lower levels in spring (8.00 ± 3.32 ppbv) and summer (7.30 ± 2.52 ppbv) compared with winter. This seasonal pattern is typical for locally polluted areas. These contrasting trends of a tropospheric NO2 VCD alongside decreasing surface NO2 from spring to summer indicate that local emissions are not the primary driver in these background regions during warm seasons.
The divergence of the elevated ΩNO2 pattern from spring to summer is mainly driven by nonlocal anthropogenic sources. The elevated summer NO2 at Nam Co aligns with findings from Wang [10], who identified an unexplained NOx source at the Nam Co station, potentially linked to the enhanced biogenic emissions, particularly soil NOx release, that peaked during the warm, moist monsoon season [13]. Additionally, lightning-induced NOx from frequent convective storms, prevalent in summer, contributes to the tropospheric NO2 burden [40,41,42,43]. The plateau’s unique geographic position facilitates monsoon-driven transport of Southeast Asian air masses, further enriching NO2 levels during this period [44,45].

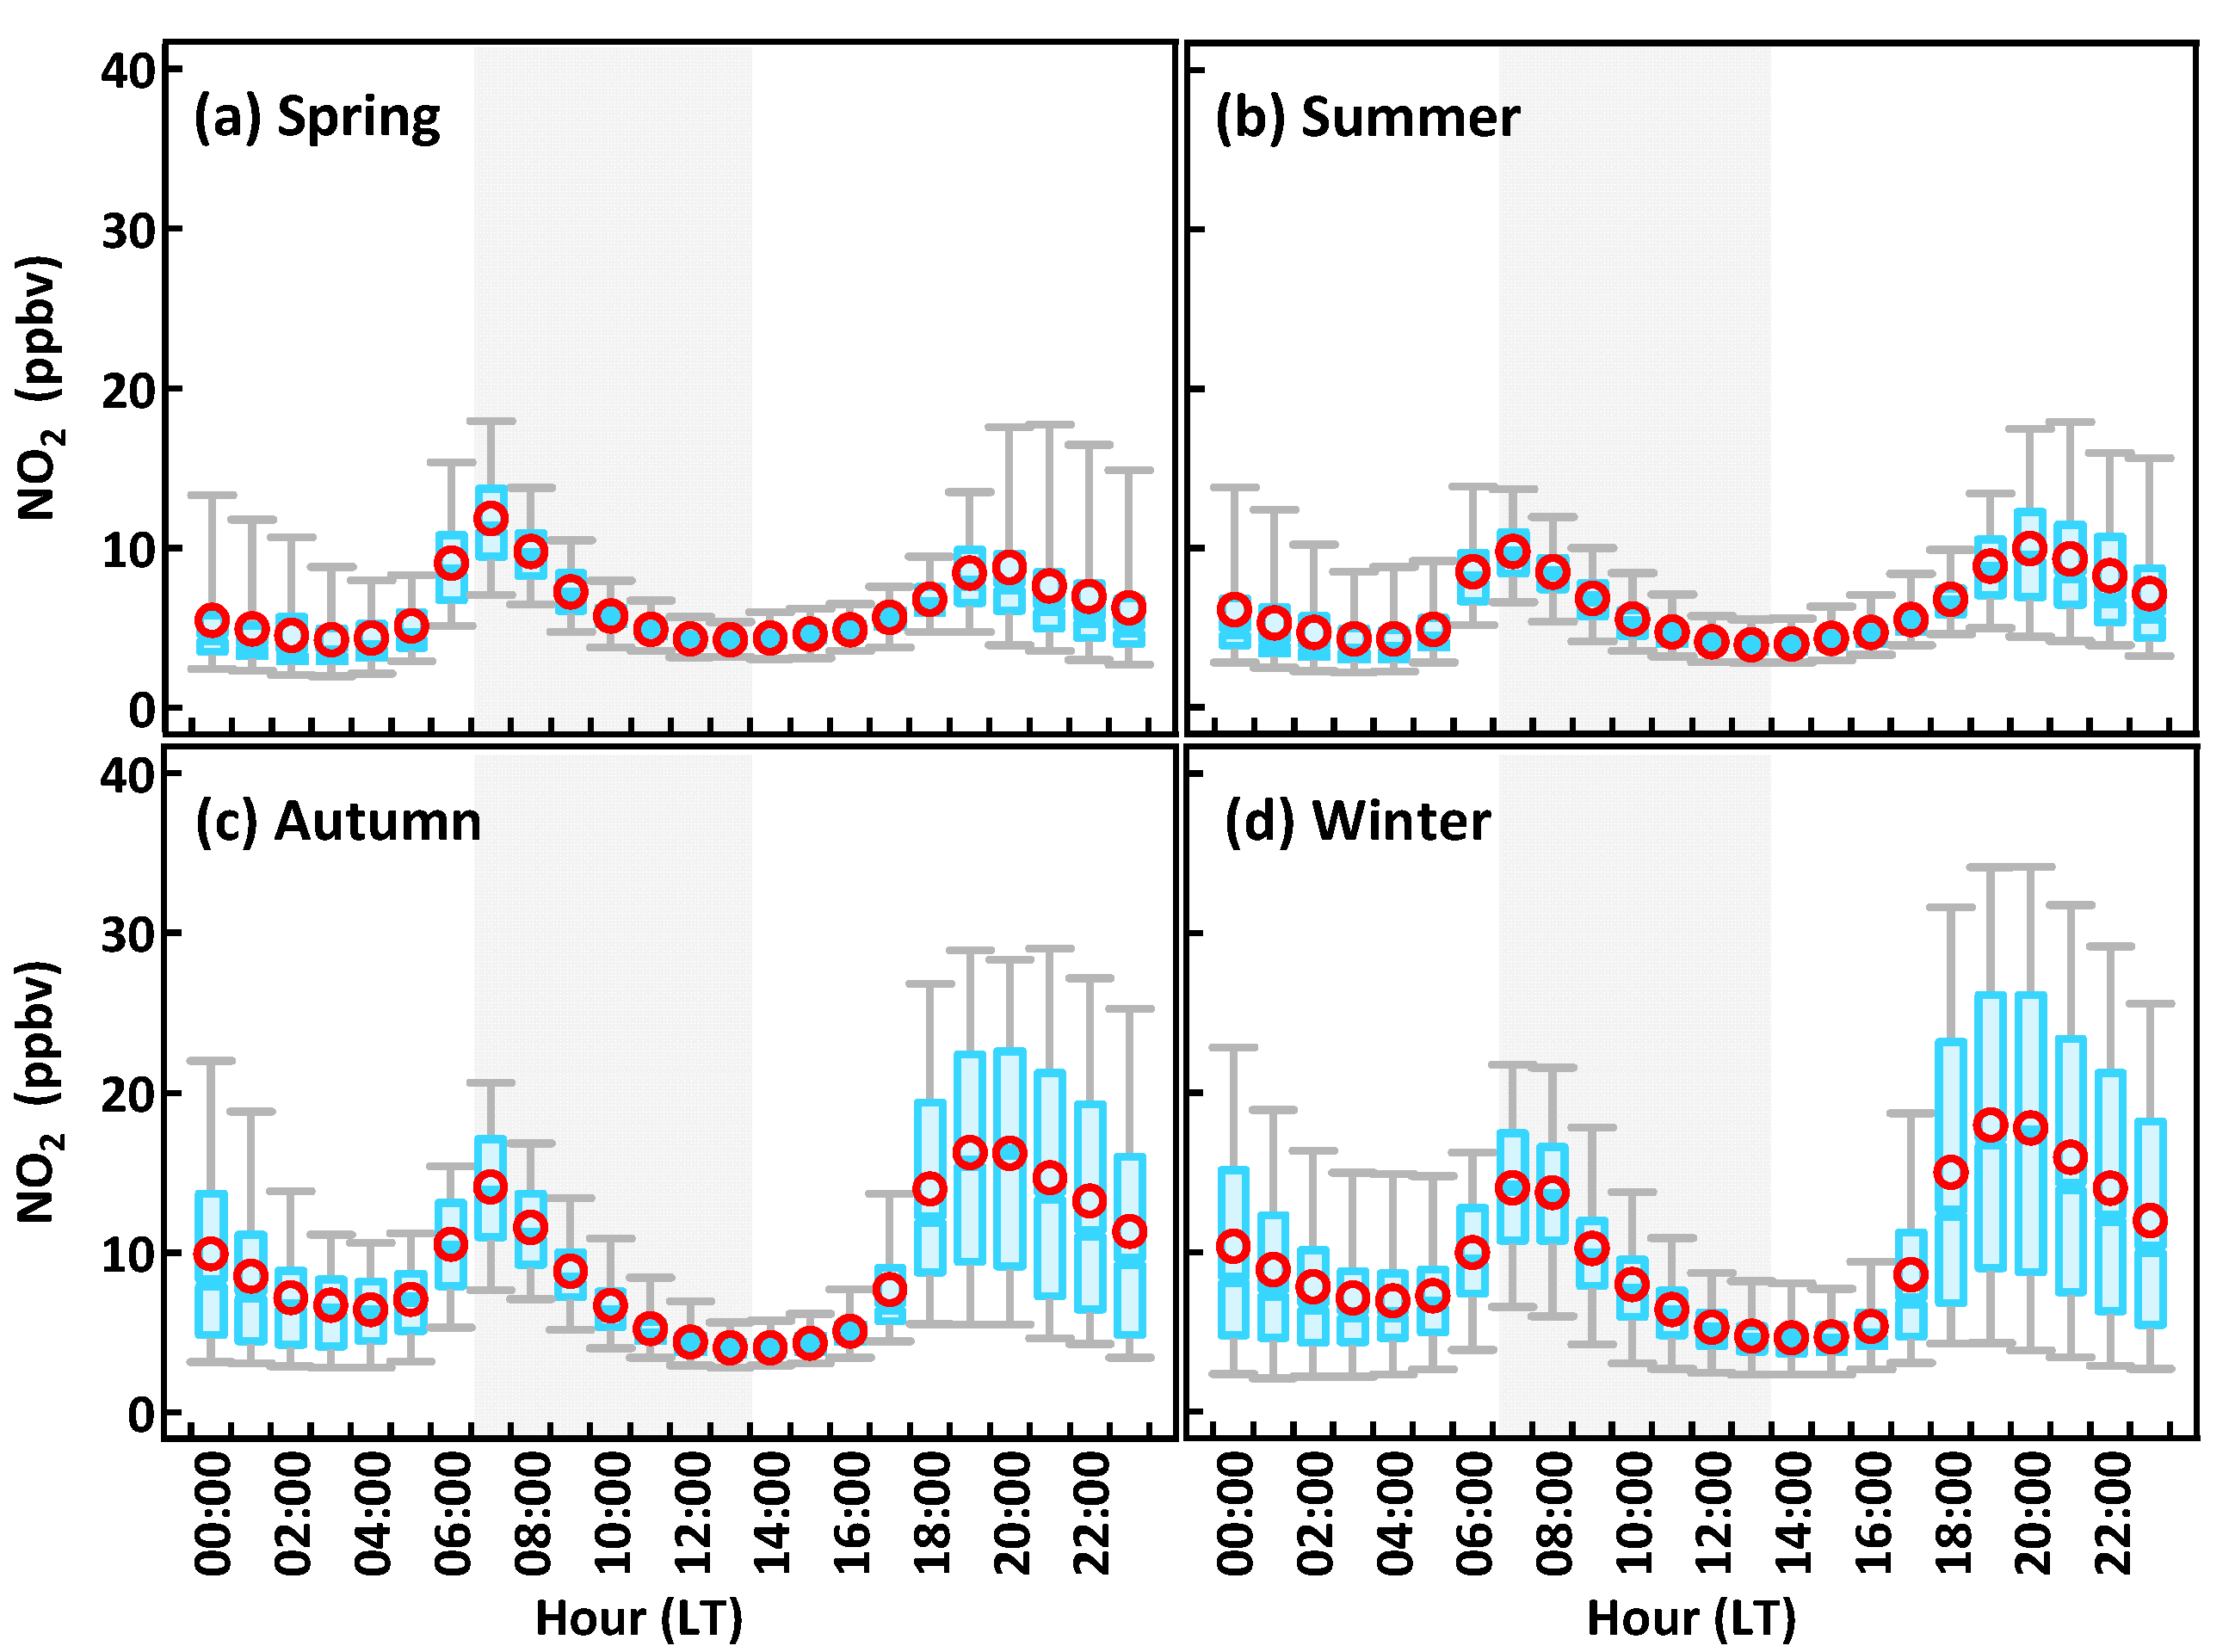
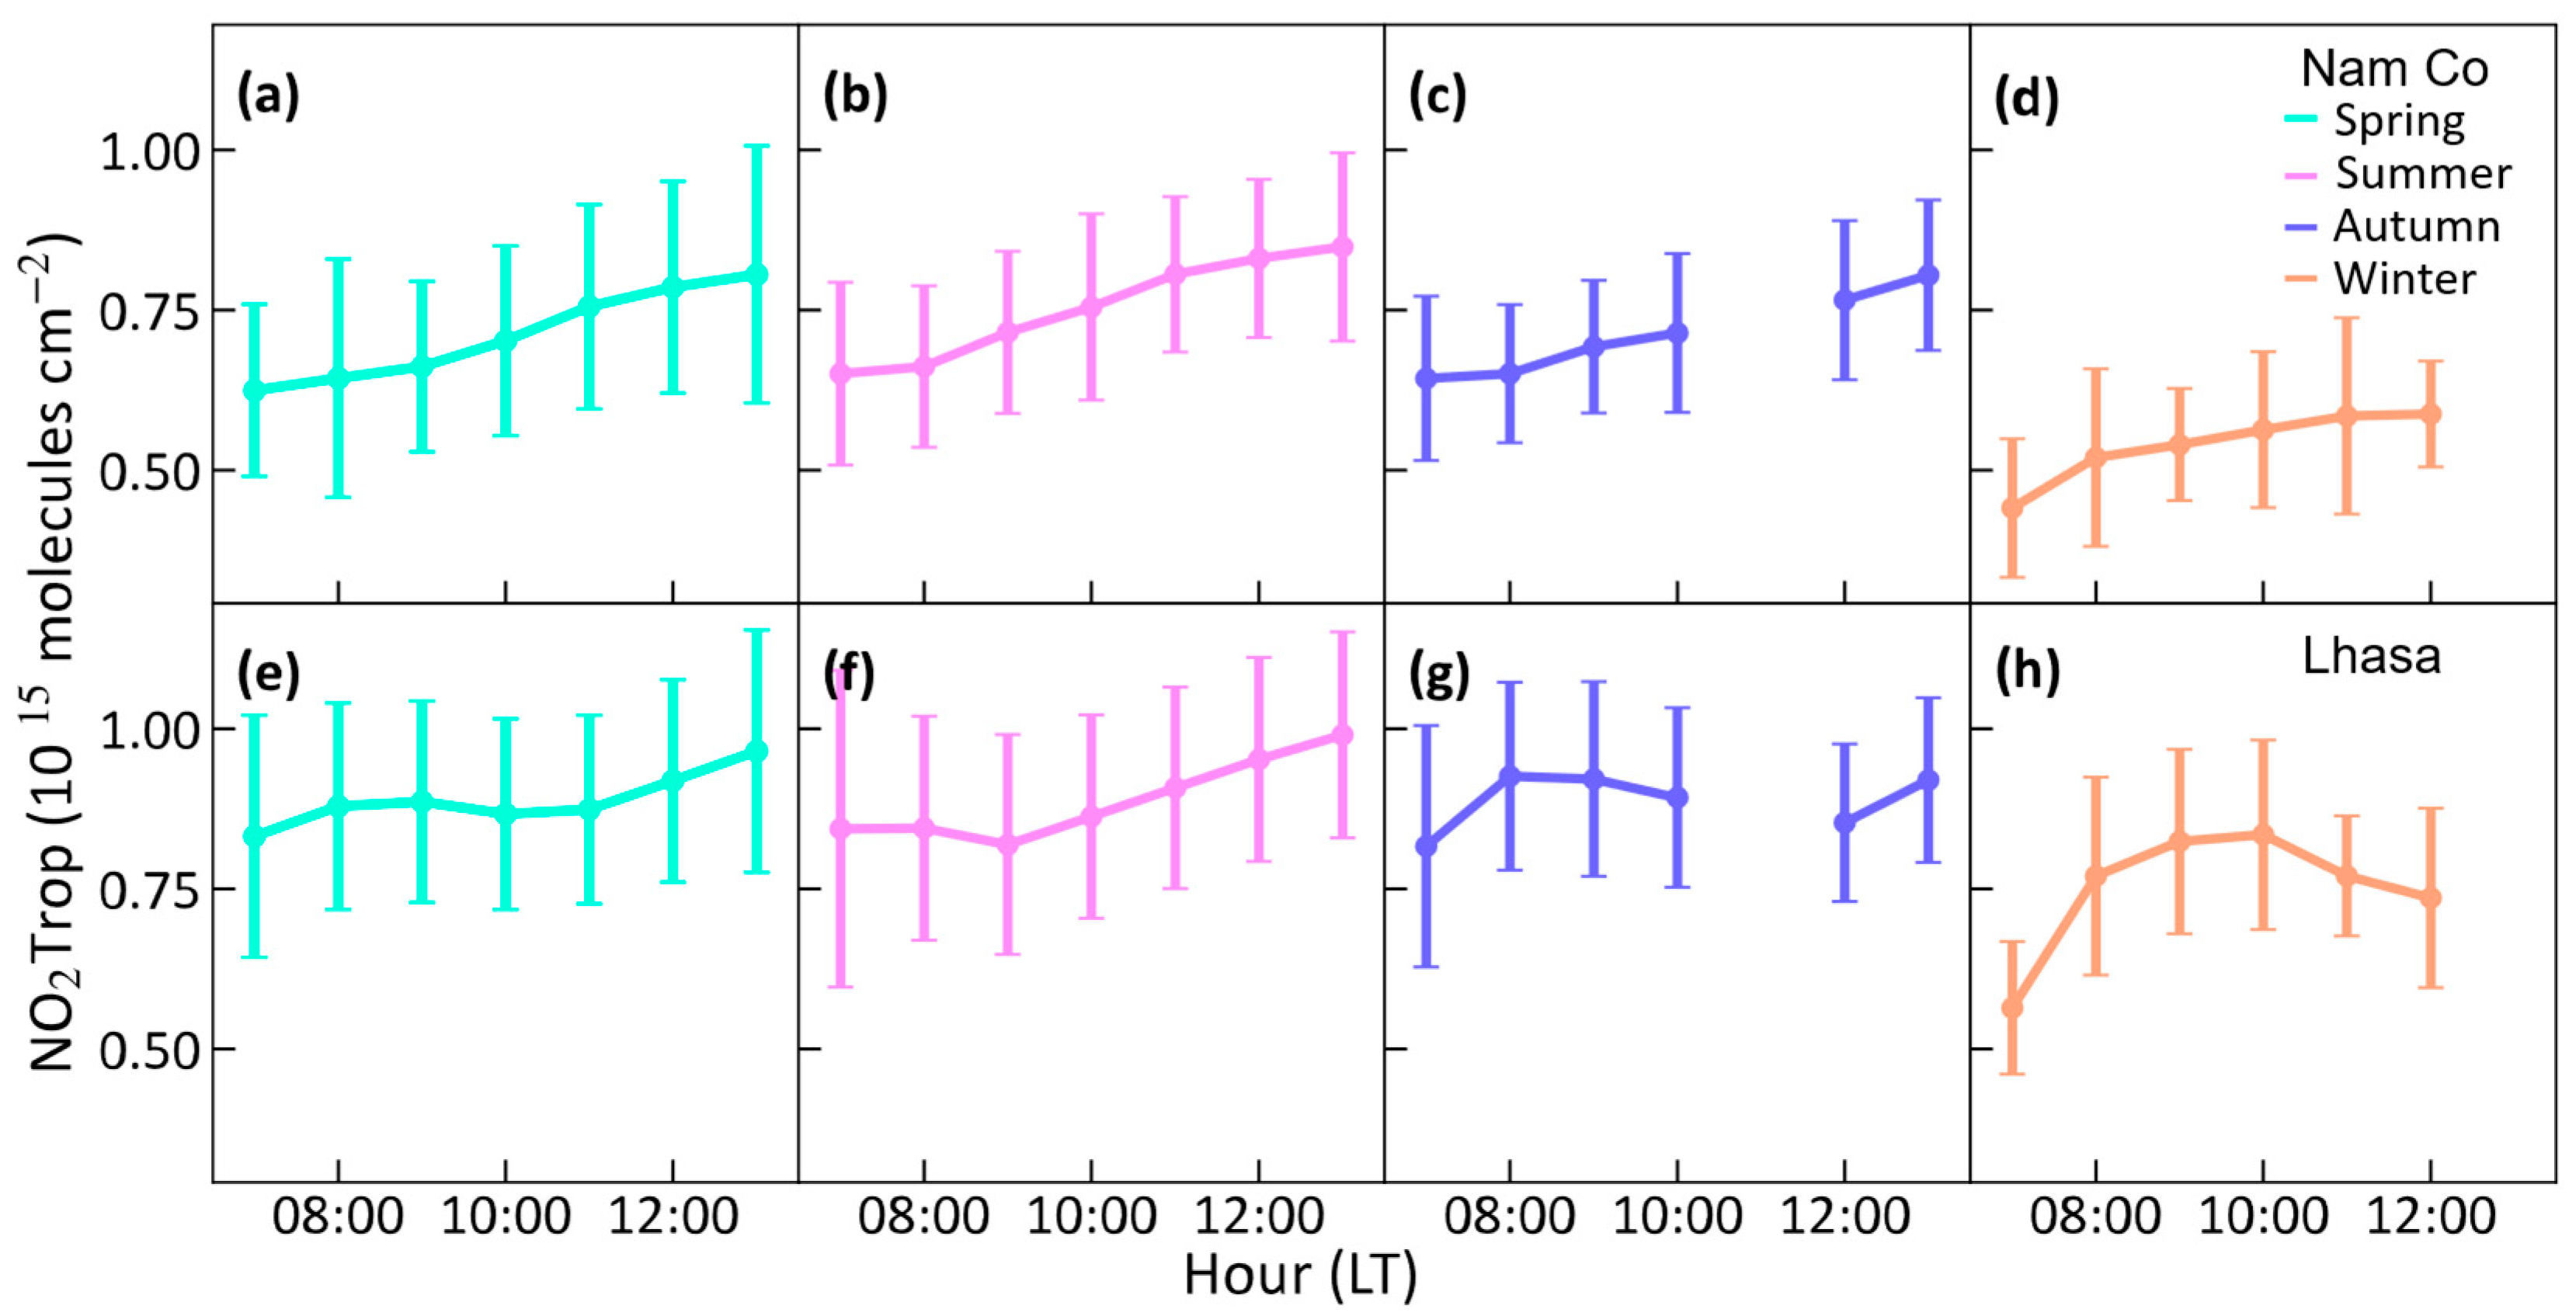
3.3. Diurnal Variations of Tropospheric NO2 Vertical Column Density and Surface NO2 Concentration

To further analyze the relationship between surface and column density, we examined surface NO2 data diurnal change at urban sites in the Lhasa area (Figure 4). At Lhasa, surface NO2 levels exhibit a bi-peak pattern, aligning with typical urban diurnal cycles. Concentrations decrease between 07:00 and 13:00 local time (LT) due to intense photochemical loss and higher planetary boundary layer heights, indicating that local emissions are the primary driver of surface NO2 variability. Limited observational data in the Nam Co region constrain a comprehensive analysis of surface NO2 diurnal patterns in pristine areas.
Diurnal variations in ΩNO2 derived from GEMS observations provide insight into controlling factors of NO2 dynamics across the TP. Figure 5a–d displays monthly mean diurnal ΩNO2 over the Nam Co region (30.77°N, 90.96°E) for the four seasons. In spring (6.25 to 8.06 × 10¹⁴ molecules cm⁻2) and summer (6.51 to 8.49 × 10¹⁴ molecules cm⁻2), ΩNO2 exhibits a clear increase from 07:00 to 13:00 LT. Autumn shows a similar but lower-amplitude pattern, peaking at 8.04 × 10¹⁴ molecules cm⁻2. In contrast, winter shows no discernible daytime increase, with ΩNO2 remaining relatively stable (~5.39 × 10¹⁴ molecules cm⁻2).
A similar pattern can be observed from Lhasa (Figure 5e–h), though with significantly higher ΩNO2 driven by traffic and heating emissions. Notably, in winter, Lhasa exhibits a distinct daytime increase, with ΩNO2 rising sharply from 07:00 to 08:00 LT due to peak anthropogenic activity, then declining between 10:00 and 12:00 LT. However, despite elevated surface NO2 in winter, the CNO2 at this urban site remains the lowest of all seasons. This discrepancy suggests that chemical destruction and local anthropogenic emissions are not the primary determinants of seasonal ΩNO2 variations over most of the TP and that surface NO2 and the ΩNO2 over the TP are often controlled by distinct processes.

4. Discussion

Transport processes play a critical role in shaping the atmospheric composition of vertical and spatial distribution over the TP [15,47,48]. The TP’s high-altitude anticyclonic circulation, coupled with the influence of the Indian monsoon and its proximity to East Asia and South Asia—the two largest anthropogenic emission regions in Asia—significantly modulates its atmospheric composition. During summer, the Indian monsoon drives active and deep convection over northern India and the southern slopes of the Himalayas, a process capable of lifting pollutants into the mid-to-upper troposphere, including LNOx [48,49]. Longer lifetimes persisting for days are observed in the higher troposphere [35].
Transport source contribution analyses were conducted to quantify the potential source contribution of NO2 in spring based on the nearest national monitoring station observation data. Approximately 22.73% of the NOx originates from northwestern Tibet, associated with northerly winds typically traveling at higher altitudes (~1700 m above the ground, AGL). Elevated ΩNO2 in spring to summer is associated with upward motion along with southwesterly winds outside the southern border of the TP, C1 (~3 km AGL) from North India and C3 from Nepal (~1200 m AGL), as shown in Figure 6a,c. The remaining 30.13% sources likely involve low-altitude air masses arising from southern Tibet (Figure 6c, C4 from 300–500 m) due to regional recirculation. These transport patterns align with the seasonal variations observed in Section 3.2, particularly during the summer monsoon, when southern inflows peak.
To further explore upper-level sources, we conduct back trajectory analysis at higher altitudes (4 km AGL). The results indicate that longer-range air masses predominantly originate from India, consistent with deep convective lofting (5–6 km, AGL), while near trajectories stem from Nepal (Figure 6b,d). This suggests that ΩNO2 over the plateau is significantly influenced by transport. The interplay of surface-level regional sources and upper-level monsoon-driven inputs underscores the complexity of NOx dynamics in this high-altitude environment, corroborating findings by Yang [21] on the transport role in NO2 variability over East Asia.
Our work demonstrates the capability of GEMS satellite observations to detect and quantify NOx distributions over pristine regions, such as the TP. Using the L2 NO2VCD (v3.0) product, we mapped the spatial and temporal distribution, focusing on the pristine Nam Co and urban areas in Lhasa. The results illustrate that ΩNO2 is additionally affected by emissions from distant sources that get transported into the upper levels of the atmosphere, and the natural source from the daily increasing trend.
A key challenge of this analysis is the lack of observational validation for the vertical distribution of NO2 column concentrations in this region. This gap could be addressed by ground-based data records in future studies, enabling a more robust quantification of vertical transport processes and source contributions. Additionally, seasonal variations in circulation patterns can alter transport pathways and significant source regions of NO2 and other trace gases in the TP troposphere, significantly affecting the distribution and variability of atmospheric pollution over the TP and its neighboring areas. Our findings align with previous studies emphasizing the role of atmospheric transport in shaping NO2 variability over high-altitude areas.

5. Conclusions

This study delved into the spatial–temporal variations of the tropospheric NO2 vertical column density over the TP by utilizing surface and satellite observations in 2023–2024 while also analyzing the impacts of transport processes on NO2. Surface NO2 in urban Lhasa revealed the highest level in winter and the lowest level in summer, and local emission patterns primarily controlled the diurnal changes. Conversely, averaged ΩNO2 over Lhasa exhibited an opposite seasonality, peaking in the warm season except for the higher value in winter. In addition, similar seasonal cycles were observed in Nam Co. The increasing diurnal difference from the urban normal cycle means there are strong natural emissions and a significant impact of transport on controlling the NO2 distribution within the troposphere. In spring and summer, the west and southwest NO2-rich air mass controls the transport over TP. Future studies should prioritize vertical profiling to elucidate further the patterns and mechanisms governing ΩNO2 over the TP.

Author Contributions

Conceptualization, X.Z., C.Y. and L.Z.; methodology, X.Z. and L.Z.; software, X.Z., Y.L., J.L., P.Z.; validation, X.Z., W.F. and X.W.; formal analysis, X.Z., Z.Y. and J.Z.; investigation, X.Z.; resources, J.K., H.L., J.P., Y.J., and H.H.; data curation, X.Z., W.F.; writing—original draft preparation, X.Z. and L.Z.; writing—review and editing, X.Z., L.Z., J.P., and S.L.; visualization, X.Z., X.L., Y.C., and X.W.; supervision, L.Z.; project administration, L.Z.; funding acquisition, L.Z. All authors have read and agreed to the published version of the manuscript.

Funding

This work is funded by the National Key Research and Development Program of China (2023YFC3706205), Shenzhen Key Laboratory of Precision Measurement and Early Warning Technology for Urban Environmental Health Risks (ZDSYS20220606100604008), Major Talent Project of Guangdong Province (2021QN020924), Shenzhen Science and Technology Program (KQTD20210811090048025, JCYJ20220530115404009), and High-level University Special Fund (G030290001). This work is supported by the Center for Computational Science and Engineering at the Southern University of Science and Technology.

Data Availability Statement

GEMS NO2 Version 3 data can be requested from the Korean Environmental Satellite Center (https://nesc.nier.go.kr/). Surface NO2 data are accessed from the China National Environmental Monitoring Centre (https://www.cnemc.cn/en/).

Conflicts of Interest

The authors declare no conflicts of interest.

References

  1. Crutzen, P.J. The role of NO and NO2 in the chemistry of the troposphere and stratosphere. Annu. Rev. Earth Planet. Sci. 1979, 7, 443–472. [Google Scholar] [CrossRef]
  2. Seinfeld, J.H.; Pandis, S.N. Atmospheric Chemistry and Physics: From Air Pollution to Climate Change; John Wiley & Sons: Hoboken, NJ, USA, 2016. [Google Scholar]
  3. Galbally, I.; Roy, C. Loss of fixed nitrogen from soils by nitric oxide exhalation. Nature 1978, 275, 734–735. [Google Scholar] [CrossRef]
  4. Noxon, J.F. Tropospheric NO2. J. Geophys. Res. Ocean. 1978, 83, 3051–3057. [Google Scholar] [CrossRef]
  5. Hill, R.D.; Rinker, R.G.; Wilson, H.D.B. Atmospheric Nitrogen Fixation by Lightning. J. Atmos. Sci. 1980, 37, 179–192. [Google Scholar] [CrossRef]
  6. Wang, Y.; Zhu, Y.; Ye, C.; Zhou, X.; Elshorbany, Y.; Hayden, M.; Peters, A.J. Observational evidence of unknown NOx source and its perturbation of oxidative capacity in Bermuda’s marine boundary layer. J. Geophys. Res. Atmos. 2023, 128, e2023JD039582. [Google Scholar] [CrossRef]
  7. Honrath, R.; Peterson, M.C.; Guo, S.; Dibb, J.E.; Shepson, P.; Campbell, B. Evidence of NOx production within or upon ice particles in the Greenland snowpack. Geophys. Res. Lett. 1999, 26, 695–698. [Google Scholar] [CrossRef]
  8. Barbero, A.; Savarino, J.; Grilli, R.; Blouzon, C.; Picard, G.; Frey, M.; Huang, Y.; Caillon, N. New Estimation of the NOx Snow-Source on the Antarctic Plateau. J. Geophys. Res. Atmos. 2021, 126, e2021JD035062. [Google Scholar] [CrossRef]
  9. Burger, J.; Joyce, E.; Hastings, M.; Spence, K.; Altieri, K. A seasonal analysis of aerosol NO3 sources and NOx oxidation pathways in the Southern Ocean marine boundary layer. Atmos. Chem. Phys. 2023, 23, 5605–5622. [Google Scholar] [CrossRef]
  10. Wang, J.; Zhang, Y.; Zhang, C.; Wang, Y.; Zhou, J.; Whalley, L.K.; Slater, E.J.; Dyson, J.E.; Xu, W.; Cheng, P. Validating HONO as an intermediate tracer of the external cycling of reactive nitrogen in the background atmosphere. Environ. Sci. Technol. 2023, 57, 5474–5484. [Google Scholar] [CrossRef]
  11. Ye, C.; Zhou, X.; Zhang, Y.; Wang, Y.; Wang, J.; Zhang, C.; Woodward-Massey, R.; Cantrell, C.; Mauldin, R.L.; Campos, T.; et al. Synthesizing evidence for the external cycling of NOx in high-to low-NOx atmospheres. Nat. Commun. 2023, 14, 7995. [Google Scholar] [CrossRef]
  12. Qiu, J. China: The third pole. Nature 2008, 454, 393–396. [Google Scholar] [CrossRef] [PubMed]
  13. Davidson, E.A.; Kingerlee, W. A global inventory of nitric oxide emissions from soils. Nutr. Cycl. Agroecosyst. 1997, 48, 37–50. [Google Scholar] [CrossRef]
  14. Kong, H.; Lin, J.; Zhang, Y.; Li, C.; Xu, C.; Shen, L.; Liu, X.; Yang, K.; Su, H.; Xu, W. High natural nitric oxide emissions from lakes on Tibetan Plateau under rapid warming. Nat. Geosci. 2023, 16, 474–477. [Google Scholar] [CrossRef]
  15. Liu, Z.; Guo, F.; Zhang, Y.; Wu, Z.; Lu, X.; Deng, J.; Chen, K.; Wang, Q.; He, M. Impact of Lightning-Induced Nitrogen Oxides Over and Around the Tibetan Plateau on the Tibetan Plateau Ozone Valley. J. Geophys. Res. Atmos. 2024, 129, e2023JD039575. [Google Scholar] [CrossRef]
  16. Zhao, P.; Xu, X.; Chen, F.; Guo, X.; Zheng, X.; Liu, L.; Hong, Y.; Li, Y.; La, Z.; Peng, H. The third atmospheric scientific experiment for understanding the earth–atmosphere coupled system over the Tibetan Plateau and its effects. Bull. Am. Meteorol. Soc. 2018, 99, 757–776. [Google Scholar] [CrossRef]
  17. Kim, J.; Jeong, U.; Ahn, M.-H.; Kim, J.H.; Park, R.J.; Lee, H.; Song, C.H.; Choi, Y.-S.; Lee, K.-H.; Yoo, J.-M. New era of air quality monitoring from space: Geostationary Environment Monitoring Spectrometer (GEMS). Bull. Am. Meteorol. Soc. 2020, 101, E1–E22. [Google Scholar] [CrossRef]
  18. Li, Y.; Xing, C.; Peng, H.; Song, Y.; Zhang, C.; Xue, J.; Niu, X.; Liu, C. Long-term observations of NO2 using GEMS in China: Validations and regional transport. Sci. Total Environ. 2023, 904, 166762. [Google Scholar] [CrossRef]
  19. Lange, K.; Richter, A.; Bösch, T.; Zilker, B.; Latsch, M.; Behrens, L.K.; Okafor, C.M.; Bösch, H.; Burrows, J.P.; Merlaud, A. Validation of GEMS tropospheric NO2 columns and their diurnal variation with ground-based DOAS measurements. Atmos. Meas. Tech. 2024, 17, 6315–6344. [Google Scholar] [CrossRef]
  20. Park, J.; Choi, Y.; Jung, J.; Lee, K.; Yeganeh, A.K. First top-down diurnal adjustment to NOx emissions inventory in Asia informed by the Geostationary Environment Monitoring Spectrometer (GEMS) tropospheric NO2 columns. Sci. Rep. 2024, 14, 24338. [Google Scholar] [CrossRef]
  21. Yang, L.H.; Jacob, D.J.; Dang, R.; Oak, Y.J.; Lin, H.; Kim, J.; Zhai, S.; Colombi, N.K.; Pendergrass, D.C.; Beaudry, E. Interpreting Geostationary Environment Monitoring Spectrometer (GEMS) geostationary satellite observations of the diurnal variation in nitrogen dioxide (NO2) over East Asia. Atmos. Chem. Phys. 2024, 24, 7027–7039. [Google Scholar] [CrossRef]
  22. Edwards, D.P.; Martínez-Alonso, S.; Jo, D.S.; Ortega, I.; Emmons, L.K.; Orlando, J.J.; Worden, H.M.; Kim, J.; Lee, H.; Park, J. Quantifying the diurnal variation in atmospheric NO2 from Geostationary Environment Monitoring Spectrometer (GEMS) observations. Atmos. Chem. Phys. 2024, 24, 8943–8961. [Google Scholar] [CrossRef]
  23. Beirle, S.; Platt, U.; Glasow, R.; Wenig, M.; Wagner, T. Estimate of nitrogen oxide emissions from shipping by satellite remote sensing. Geophys. Res. Lett. 2004, 31, L18102. [Google Scholar] [CrossRef]
  24. Beirle, S.; Platt, U.; Wenig, M.; Wagner, T. NOx production by lightning estimated with GOME. Adv. Space Res. 2004, 34, 793–797. [Google Scholar] [CrossRef]
  25. Spurr, R.; Christi, M. On the generation of atmospheric property Jacobians from the (V) LIDORT linearized radiative transfer models. J. Quant. Spectrosc. Radiat. Transf. 2014, 142, 109–115. [Google Scholar] [CrossRef]
  26. Bucsela, E.; Krotkov, N.; Celarier, E.; Lamsal, L.; Swartz, W.; Bhartia, P.; Boersma, K.; Veefkind, J.; Gleason, J.; Pickering, K. A new stratospheric and tropospheric NO2 retrieval algorithm for nadir-viewing satellite instruments: Applications to OMI. Atmos. Meas. Tech. 2013, 6, 2607–2626. [Google Scholar] [CrossRef]
  27. Kim, S.; Kim, D.; Hong, H.; Chang, L.S.; Lee, H.; Kim, D.R.; Kim, D.; Yu, J.A.; Lee, D.; Jeong, U.; et al. First-time comparison between NO2 vertical columns from Geostationary Environmental Monitoring Spectrometer (GEMS) and Pandora measurements. Atmos. Meas. Tech. 2023, 16, 3959–3972. [Google Scholar] [CrossRef]
  28. Yang, Q.; Kim, J.; Cho, Y.; Lee, W.-J.; Lee, D.-W.; Yuan, Q.; Wang, F.; Zhou, C.; Zhang, X.; Xiao, X.; et al. A synchronized estimation of hourly surface concentrations of six criteria air pollutants with GEMS data. NPJ Clim. Atmos. Sci. 2023, 6, 94. [Google Scholar] [CrossRef]
  29. Ghahremanloo, M.; Choi, Y.; Singh, D. Deep learning bias correction of GEMS tropospheric NO2: A comparative validation of NO2 from GEMS and TROPOMI using Pandora observations. Environ. Int. 2024, 190, 108818. [Google Scholar] [CrossRef]
  30. Oak, Y.J.; Jacob, D.J.; Balasus, N.; Yang, L.H.; Chong, H.; Park, J.; Lee, H.; Lee, G.T.; Ha, E.S.; Park, R.J. A bias-corrected GEMS geostationary satellite product for nitrogen dioxide using machine learning to enforce consistency with the TROPOMI satellite instrument. Atmos. Meas. Tech. 2024, 17, 5147–5159. [Google Scholar] [CrossRef]
  31. Bae, K.; Song, C.K.; Van Roozendael, M.; Richter, A.; Wagner, T.; Merlaud, A.; Pinardi, G.; Friedrich, M.M.; Fayt, C.; Dimitropoulou, E.; et al. Validation of GEMS operational v2.0 total column NO2 and HCHO during the GMAP/SIJAQ campaign. Sci. Total Environ. 2025, 974, 179190. [Google Scholar] [CrossRef]
  32. Cheng, S.; Pu, G.; Ma, J.; Hong, H.; Du, J.; Yudron, T.; Wagner, T. Retrieval of Tropospheric NO2 Vertical Column Densities from Ground-Based MAX-DOAS Measurements in Lhasa, a City on the Tibetan Plateau. Remote Sens. 2023, 15, 4689. [Google Scholar] [CrossRef]
  33. Zhang, Y.; Lin, J.; Kim, J.; Lee, H.; Park, J.; Hong, H.; Van Roozendael, M.; Hendrick, F.; Wang, T.; Wang, P. A research product for tropospheric NO2 columns from Geostationary Environment Monitoring Spectrometer based on Peking University OMI NO2 algorithm. Atmos. Meas. Tech. 2023, 16, 4643–4665. [Google Scholar] [CrossRef]
  34. Lee, H.; Park, J.; Hyunkee, H. Geostationary Environment Monitoring Spectrometer (GEMS) User’s Guide-Nitrogen Dioxide; The National Institute of Environmental Research: Incheon, Republic of Korea, 2020. [Google Scholar]
  35. Schumann, U.; Huntrieser, H. The global lightning-induced nitrogen oxides source. Atmos. Chem. Phys. 2007, 7, 3823–3907. [Google Scholar] [CrossRef]
  36. Draxler, R.R.; Hess, G. An overview of the HYSPLIT_4 modelling system for trajectories. Aust. Meteorol. Mag. 1998, 47, 295–308. [Google Scholar]
  37. Wang, Y.Q. MeteoInfo: GIS software for meteorological data visualization and analysis. Meteorol. Appl. 2014, 21, 360–368. [Google Scholar] [CrossRef]
  38. Li, M.; Mao, J.; Chen, S.; Bian, J.; Bai, Z.; Wang, X.; Chen, W.; Yu, P. Significant contribution of lightning NOx to summertime surface O3 on the Tibetan Plateau. Sci. Total Environ. 2022, 829, 154639. [Google Scholar] [CrossRef]
  39. Zhu, L.; Jacob, D.J.; Keutsch, F.N.; Mickley, L.J.; Scheffe, R.; Strum, M.; González Abad, G.; Chance, K.; Yang, K.; Rappenglück, B.; et al. Formaldehyde (HCHO) As a Hazardous Air Pollutant: Mapping Surface Air Concentrations from Satellite and Inferring Cancer Risks in the United States. Environ. Sci. Technol. 2017, 51, 5650–5657. [Google Scholar] [CrossRef]
  40. Penner, J.E.; Bergmann, D.; Walton, J.J.; Kinnison, D.E.; Prather, M.J.; Rotman, D.A.; Price, C.G.; Pickering, K.E.; Baughcum, S.L. An evaluation of upper troposphere NO x with two models. J. Geophys. Res. 1998, 103, 22097–22113. [Google Scholar] [CrossRef]
  41. Tie, X.; Zhang, R.; Brasseur, G.P.; Emmons, L.K.; Lei, W. Effects of lightning on reactive nitrogen and nitrogen reservoir species in the troposphere. J. Geophys. Res. 2001, 106, 3167–3178. [Google Scholar] [CrossRef]
  42. Labrador, L.; Kuhlmann, R.v.; Lawrence, M.G. The effects of lightning-produced NOx and its vertical distribution on atmospheric chemistry: Sensitivity simulations with MATCH-MPIC. Atmos. Chem. Phys. 2004, 5, 1815–1834. [Google Scholar] [CrossRef]
  43. Boersma, K.F.; Eskes, H.J.; Meijer, E.W.; Kelder, H.M. Estimates of lightning NOx production from GOME satellite observations. Atmos. Chem. Phys. 2005, 5, 2311–2331. [Google Scholar] [CrossRef]
  44. Xu, W.; Bian, Y.; Lin, W.; Zhang, Y.; Wang, Y.; Ma, Z.; Zhang, X.; Zhang, G.; Ye, C.; Xu, X. O3 and PAN in southern Tibetan Plateau determined by distinct physical and chemical processes. Atmos. Chem. Phys. 2023, 23, 7635–7652. [Google Scholar] [CrossRef]
  45. Xu, X.; Zhang, H.; Lin, W.; Wang, Y.; Xu, W.; Jia, S. First simultaneous measurements of peroxyacetyl nitrate (PAN) and ozone at Nam Co in the central Tibetan Plateau: Impacts from the PBL evolution and transport processes. Atmos. Chem. Phys. 2018, 18, 5199–5217. [Google Scholar] [CrossRef]
  46. Wu, C.; Yu, J.Z. Evaluation of linear regression techniques for atmospheric applications: The importance of appropriate weighting. Atmos. Meas. Tech. 2018, 11, 1233–1250. [Google Scholar] [CrossRef]
  47. Rai, M.; Kang, S.; Yang, J.; Chen, X.; Hu, Y.; Rupakheti, D. Tracing atmospheric anthropogenic black carbon and its potential radiative response over Pan-third Pole region: A synoptic-scale analysis using WRF-chem. J. Geophys. Res. Atmos. 2022, 127, e2021JD035772. [Google Scholar] [CrossRef]
  48. Zhang, X.; Xu, W.; Song, X.; Duan, X.; Peng, X.; Lin, W.; Zhao, G.; Zhang, G.; Xu, X.; Jin, J. Cross-Regional Horizontal and Vertical Transport Pathways of Carbon Monoxide and Its Impact on Air Pollution in the Tibetan Plateau. J. Geophys. Res. Atmos. 2025, 130, e2024JD041859. [Google Scholar] [CrossRef]
  49. Qie, X.; Wu, X.; Yuan, T.; Bian, J.; Lu, D. Comprehensive Pattern of Deep Convective Systems over the Tibetan Plateau–South Asian Monsoon Region Based on TRMM Data. J. Clim. 2014, 27, 6612–6626. [Google Scholar] [CrossRef]
Figure 1. Hourly tropospheric NO2 vertical column density over the Tibetan Plateau for selected months in 2023. (a,b) show February (winter) and June (summer), respectively, in UTC + 6 h. White areas indicate missing data due to nighttime conditions or cloud cover.
Remotesensing 17 01690 g001
Figure 2. Spatial distribution of monthly mean tropospheric NO2 vertical column density over the Tibetan Plateau. (a,b) show distributions for February and June (2023), respectively. The Nam Co site represents remote regions, while Lhasa denotes the urban area. GEMS observations are gridded to 0.1° × 0.1° using the oversamplingapproach described in Zhu et al. [39].
Remotesensing 17 01690 g002
Figure 3. Monthly variation of tropospheric NO2 vertical column density and surface NO2 concentrations around urban Lhasa and the remote Nam Co region in 2023−2024. The left y−axis shows tropospheric NO2 vertical column density derived from the regional GEMS data. The right y−axis shows mean surface NO2 concentrations from urban Lhasa monitoring stations. Circles represent monthly mean values, with error bars indicating standard deviations.
Remotesensing 17 01690 g003
Figure 4. The diurnal variations of surface NO2 concentration during the four seasons obtained from urban Lhasa monitoring stations from two years (2023–2024). GEMS retrievals are indicated by the shaded hours. The red circles represent hourly average concentrations. The line inside the box indicates the hourly median concentration. Upper and lower boundaries of the box represent the 75th and the 25th percentiles; the whiskers above and below each box represent the 95th and 5th percentiles. These figures are designed using the Igor-based toolkit “Histbox” described in Wu et al. [46].
Remotesensing 17 01690 g004
Figure 5. Hourly variation of tropospheric NO2 vertical column density around Nam Co and urban Lhasa regions. Panels (ad) show Nam Co, and panels (eh) show urban Lhasa across spring, summer, autumn, and winter, respectively. Circles represent hourly mean tropospheric NO2 column concentrations, with error bars indicating standard deviations.
Remotesensing 17 01690 g005
Figure 6. Backward trajectories of air masses arriving at an urban Lhasa monitoring station during spring 2023. (a,b) show 72 h backward trajectories at 500 m and 24 h backward trajectories at 4 km above ground level, respectively. (c,d) show the trajectory height profile corresponding to 500 m and 4 km, respectively.
Remotesensing 17 01690 g006
Disclaimer/Publisher’s Note: The statements, opinions and data contained in all publications are solely those of the individual author(s) and contributor(s) and not of MDPI and/or the editor(s). MDPI and/or the editor(s) disclaim responsibility for any injury to people or property resulting from any ideas, methods, instructions or products referred to in the content.

