1. Introduction
Frequency-modulated continuous-wave (FMCW) laser radar (Ladar) combines electronic frequency modulation, optical coherence, and radar signal processing, which makes it a technology with growing research and promising application interest [
1]. Compared with traditional pulse Ladar, which measures optical time-of-flight (ToF) for distance measurement, FMCW Ladar uses optical heterodyne detection to establish a connection between target distance and signal frequency, enabling high-precision ranging. Due to the continuous-wave system, it can work at a lower power [
2]. FMCW Ladar provides more continuous ground observations and an enhanced detection of faint targets compared to pulsed systems. However, system structure change also introduces problems, primarily frequency modulation nonlinearity and platform vibration. Nonlinearity leads to main-lobe widening, side-lobe elevation, peak distortion, and positional shifts [
3], all of which degrade the ranging accuracy and point cloud quality. Additionally, Ladar works in the infrared band, and the short wavelength amplifies the influence of the Doppler effect, causing large frequency deviation from the small platform vibration, further affecting range accuracy and distorting point cloud targets [
4]. Since FMCW Ladar has a large bandwidth and works on a moving platform, these issues usually co-exist. When FMCW Ladar generates a point cloud, each period represents a laser footprint and there are no repeated observations. There is no azimuth concept in synthetic aperture radar (SAR) or long-dwell observation in frequency scanning interferometry (FSI). Thus, the problem is summarized as the compensation for frequency modulation nonlinearity and platform vibration in one period.
Only a few of the existing literatures discuss the simultaneous compensation of the two errors. Wang et al. use second-order SST to extract the time–frequency variation curve and derives range expression for joint vibration-nonlinearity disturbance. Nonlinearity is extracted from a reference signal and directly compensated, while the particle filter is used to compensate for high-order vibration [
5]. Although this method achieves simultaneous compensation, it is not accurate to directly compensate for nonlinearity extracted from the reference signal into the target dechirp signal, and the particle filter’s vibration tracking is highly sensitive to phase noise. Song et al. unify the nonlinearity and vibration into a polynomial model, jointly analyzing them and compensating coefficients step-by-step using discrete polynomial transformation [
6]. However, this method suffers from error accumulation, limiting its effectiveness. Zhang et al. use equal-phase interval resampling to compensate for nonlinearity and use symmetrical triangle wave modulation to compensate for vibration. This method is a simple combination of the two compensation methods, which has a requirement of reference signal delay and only models the vibration at a constant speed [
7].
Among the methods for compensating frequency modulation nonlinearity, in addition to hardware improvement methods, data processing methods such as residual video-phase (RVP) filtering and equal-phase interval resampling are widely used. The RVP filter method is particularly notable for its ability to compensate multi-target echoes with unknown time delays by making the nonlinear phase independent of target delay, enabling a uniform compensation [
8]. However, its application requires a reference signal with a known small delay to estimate a transmitted signal’s nonlinearity. Since the estimation relies on first-order Taylor expansion, smaller delay results better the compensation. A number of improvements to the RVP filter method have been proposed. Yang et al. introduce a comb notch filter applied to the reference signal. The nonlinear phase is generated by reference target and its harmonics, leading to a more accurate transmitted nonlinearity estimation [
9]. Wang et al. combine the RVP filter with wavelet synchro-squeezing transforms (WSST). Compared with using Hilbert transform (HT) to extract the phase, WSST can reduce phase-noise influence due to its energy aggregation characteristic, robustly extract the time–frequency curve, and improve nonlinearity estimation accuracy [
10]. Li et al. estimate transmitted nonlinearity by using two strong echo signals with known delays as reference signals, combined with the phase gradient autofocus (PGA) method and remove nonlinearity using an RVP filter [
11]. Chu et al. model nonlinearity as a sum of polynomial and sinusoidal components. After estimating transmitted nonlinearity, the coefficients of the polynomial and sinusoidal models are estimated, followed by the RVP filter [
12]. While the method is very accurate in deriving the model, the RVP method itself does not heavily rely on specific model coefficients. From these improvements, it can be seen that the RVP filter method is the core of de-nonlinearity and their improvement strategies are mostly based on a more accurate transmitted nonlinearity estimation. The core requirement is a reference signal with a known time delay.
The equal-phase interval resampling method uses a reference signal with a known time delay to resample the target signal by replacing the equal time axis with an equal phase axis. The purpose is to convert the high-order phase of the original signal with respect to time into a linear expression with respect to phase, ensuring that its first-order derivative is still the point frequency, thereby eliminating the effects of nonlinearity [
13]. Many improvements have been proposed to enhance this method: Ahn et al. use HT to extract the phase from a reference signal with a known time delay, and removes nonlinearity by equal-phase interval resampling [
14]. While straightforward, this method is limited by phase noise, which reduces the accuracy of the extracted phase. Lin et al. reduce the equal-phase interval from π to a shorter value, avoiding the limitation that the reference fiber delay must exceed twice the actual target distance [
15]. Zhang et al. also propose a similar method, dividing multiple equal phase points based on the phase zero crossing point [
16]. However, shorter interval increase the susceptibility to phase noise. Zheng et al. consider the reference signal with multiple peaks, applying complementary ensemble empirical mode decomposition (CEEMD) to separate the reference target into a single intrinsic mode function (IMF), then extracts the phase and performs equal-phase interval resampling [
17]. In another method, Zheng et al. use multiple synchrosqueezing transform (MSST) to extract a nonlinear phase from a reference signal and compensate it with equal-phase interval resampling [
18]. However, this method still requires a reference signal with a known delay greater than twice the target delay. Wang et al. use the variational nonlinear chirp mode decomposition method for time–frequency analysis, where the time–frequency curves are demodulated by polynomial and multi-sinusoidal matching, and then used equal-phase interval resampling to remove nonlinearity. This method is too complicated in modeling and still requires reference signal assistance [
19]. Hu et al. also use polynomials to model nonlinearity, and use multiple reference signals with different delays to estimate polynomial coefficients for resampling to compensate. This method uses too many reference signals with specific delays, which is inconvenient to operate in practice [
20]. Dai et al. derive formulas and perform equal-phase interval resampling for moving targets, reducing the impact of Doppler frequency on resampling [
21].
In addition to these two mainstream methods, alternative methods have been proposed. Qi et al. adjust the estimated reference signal nonlinearity by the ratio of actual distance to reference distance and compensate for it in the actual signal [
22]. This method requires an estimated target distance and relies on HT to extract target nonlinearity, which assumes a high signal-to-noise ratio. Similarly, You et al. have a comparable method but introduce an additional step: using absorbing material to measure the transmitted signal leakage and then compensating it to make the extracted phase more accurate [
23]. Hao et al. use a high-order ambiguity function method to compensate for frequency-modulated nonlinearity and use chirp-Z transform to improve frequency accuracy. However, this method has the problem of error accumulation [
24].
For vibration compensation, Wang et al. use WSST to extract a time–frequency curve within one period, modeling vibration as a combination of constant speed and disturbance components. The disturbance is compensated by averaging the positive and negative time–frequency curves, while symmetrical triangular modulation is used to eliminate the constant speed component [
25]. In another approach, Wang et al. model vibration as constant acceleration, and firstly estimate and compensate for acceleration through the segmented interference method, then use the symmetrical triangular wave to compensate for constant speed [
26]. Huang et al. use the modulation form of a point frequency signal and linear frequency modulation signal. The point frequency measures Doppler frequency, which is then compensated into a dechirp signal to estimate distance [
27]. Zhang et al. apply sliding FFT to analyze the frequency change caused by vibration within one period [
28], but this method requires longer observation periods and neglects phase-noise effects. For multi-period scenarios, Jia et al. employ a time-varying Kalman filter [
29], while Deng et al. combine a cascaded unscented Kalman filter with a particle filter [
30] to estimate and compensate for velocity and acceleration changes based on time–frequency variations. Wang et al. arrange multi-period observation signals into a matrix and use two-dimensional FFT to estimate and compensate for velocity, decoupling it from distance [
31]. These methods rely on long dwell times and multiple periods, which is difficult to apply to one period.
Due to the system characteristics of the FMCW Ladar we developed, it operates in a three-dimensional mode with a short period, and the reference signal’s sampling rate is only one-sixth of an echo dechirp signal. This makes it seriously affected by phase noise. It is necessary to construct an auxiliary reference signal for compensation. This paper utilizes an optical prism dechirp signal as an auxiliary signal due to its strong energy. Due to the platform’s vibration, the optical prism signal also contains Doppler frequency. Symmetrical triangle wave modulation is firstly used to roughly estimate the vibration speed and distance [
32]. MSST is then employed to extract a nonlinear phase for each frequency modulation direction [
33], and the transmitted nonlinearity is estimated by two-step integration. Under specific constraints, appropriate extrapolation is applied to estimate the transmitted nonlinearity over the whole symmetrical triangular modulation period. An ideal signal with transmitted nonlinearity is constructed at a higher sampling rate, with a delay time longer than the ranging distance. This signal is mixed with the Doppler frequency from the estimation to create an internal calibration signal. The internal calibration signal is used to resample the actual signal at an equal-phase interval. Subsequently, the high-order ambiguity function (HAF) [
24] method is applied to remove the non-constant-speed vibration and residual nonlinear phase. Finally, the compensated positive and negative dechirp signals are used to remove the Doppler frequency caused by constant speed, and the target distance is accurately obtained. The effectiveness of the proposed method is demonstrated through simulation and airborne FMCW Ladar three-dimensional imaging data. The conclusions are summarized.
The rest of this paper is structured as follows. In
Section 2, we introduce the signal acquisition method and derive the coupling equation of vibration and frequency modulation nonlinearity, the basic principles and characteristics of MSST, equal-phase interval resampling, HAF, and form the algorithm flow. In
Section 3, we use a simulation to verify the effectiveness of the proposed method and compare it with the simple equal-phase interval resampling and HAF methods to highlight its superiority, and we also apply it to actual data for verification. Finally, the conclusion is drawn in
Section 4.
2. Method and Theory
2.1. The Process of Obtaining an Ideal Signal
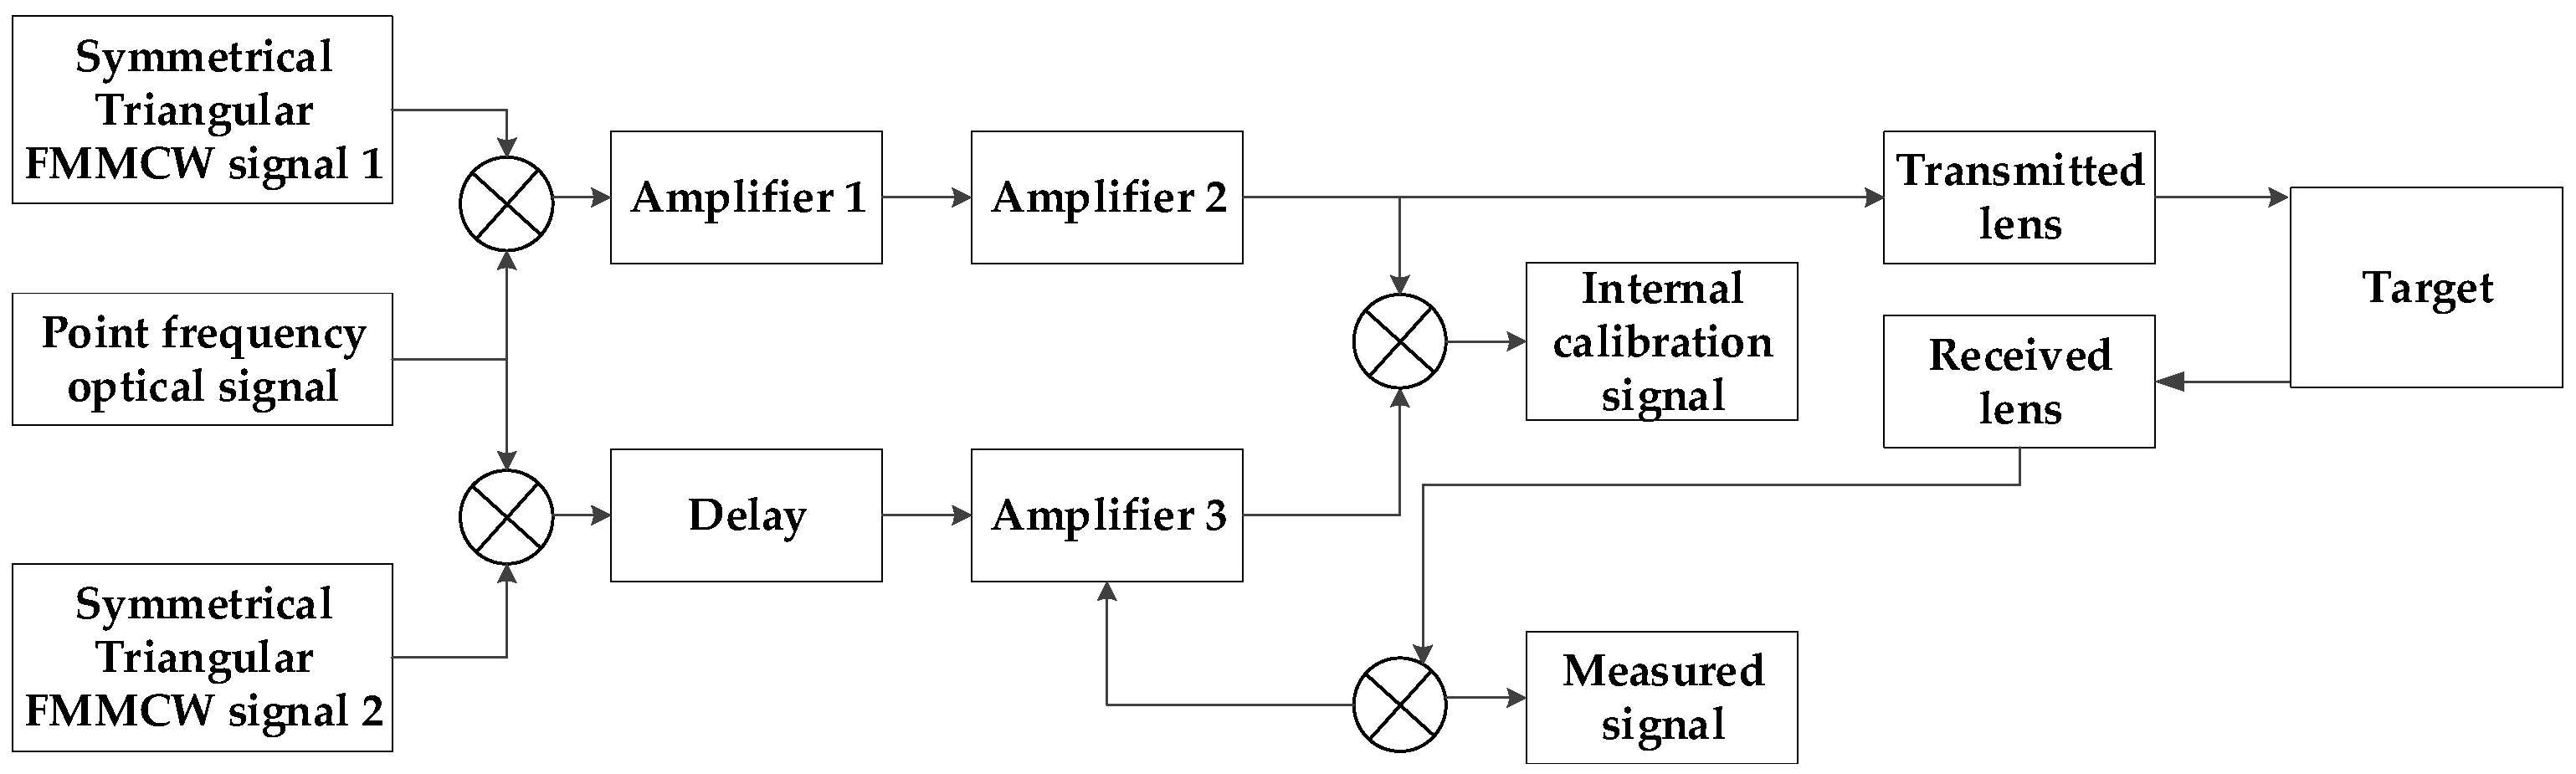
Due to the long working range of the FMCW Ladar system, the echo delay time typically exceeds the signal period. Unlike general systems, where the reference signal is a delayed version of the transmitted signal, both the echo and reference signals are mixed with the transmitted signal. From
Figure 1, we use two identical modulations to generate the transmitted and reference signals, respectively. The delay method uses a digital delay to allow for a flexible adjustment based on the working distance. To ensure the target dechirp signal frequency remains within the system’s sampling rate, the echo signal is mixed with the reference signal to form the measurement signal, while the transmitted signal is mixed with the reference signal to create the internal calibration signal.
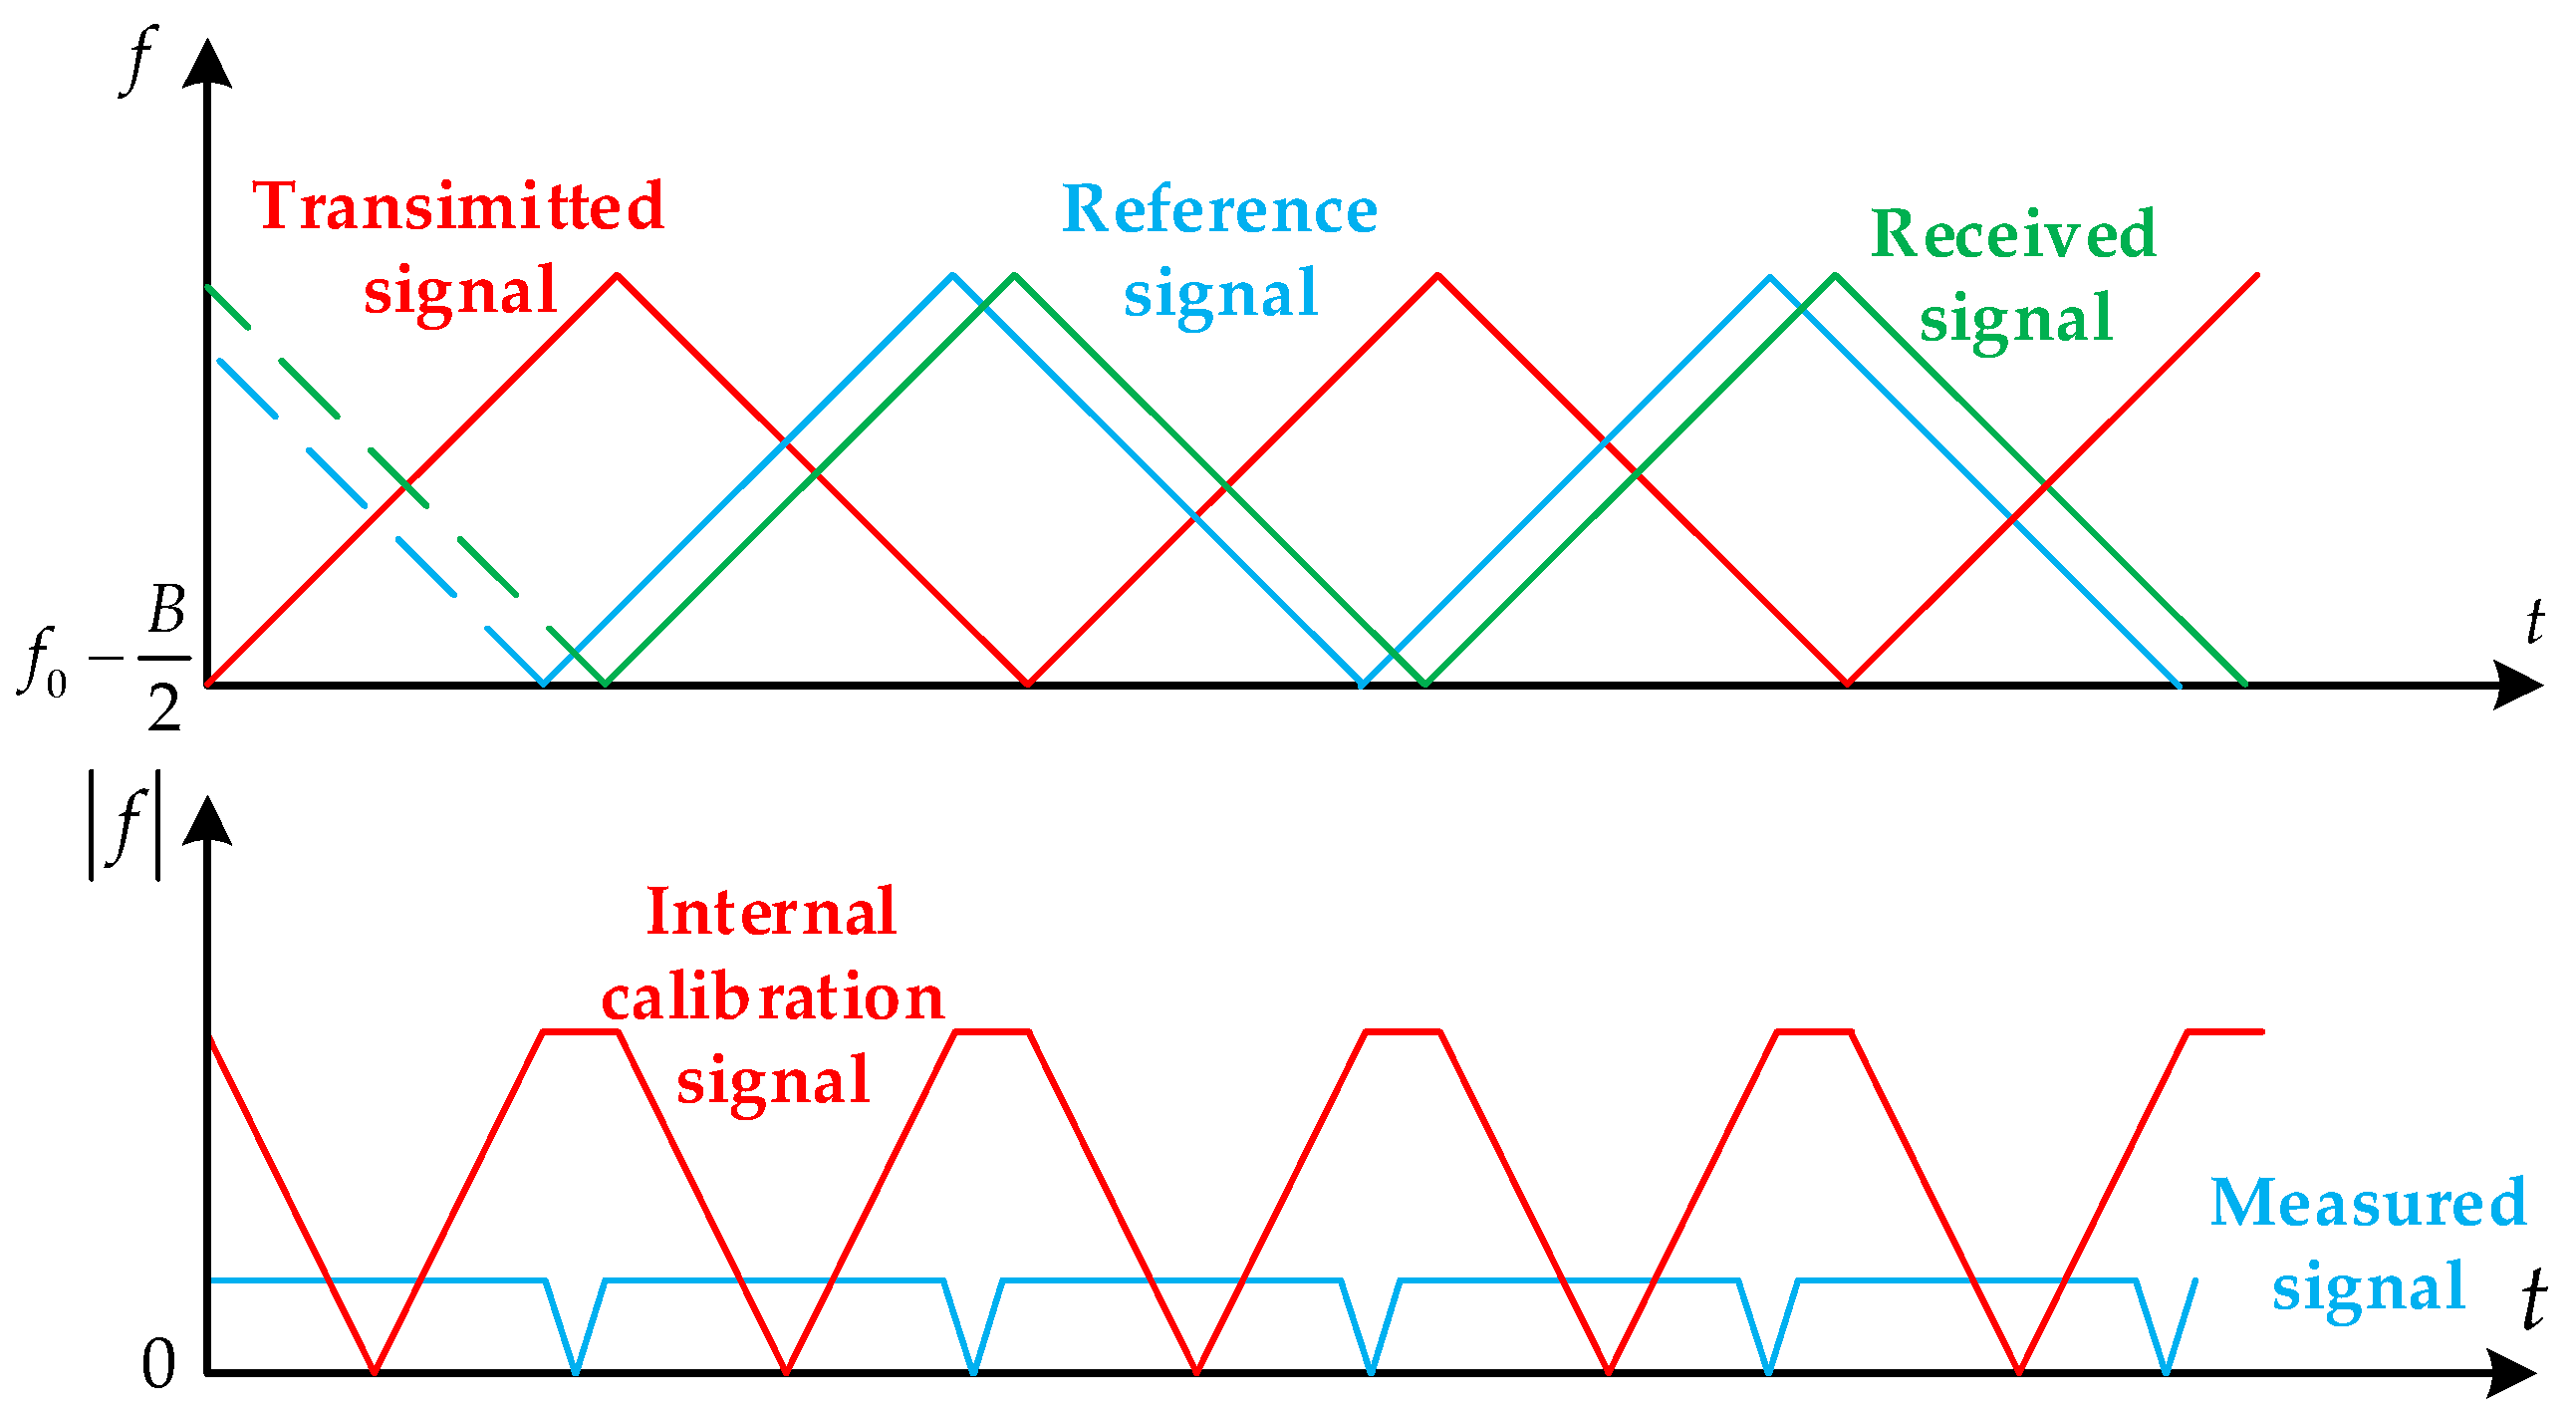
The Ladar transmits a symmetrical triangular FMCW signal, which is modulated into an optical signal and split into two channels. One channel is mixed with the reference signal and sampled as an internal calibration signal. The other channel is reflected by the target, collected by the receiving lens, and mixed with the reference signal as a measurement signal.
Figure 2 shows a schematic diagram of the frequency mixing.
The ideal symmetrical triangular FMCW transmitted signal is (ignoring the amplitude representation) as follows:
where
and
correspond to the positive and negative frequency modulation of the transmitted signal, respectively,
is the carrier frequency,
B is the bandwidth,
K is the modulation frequency rate, and
T is the signal period.
The echo signal with target distance
R and the reference signal with reference distance
can be derived from the transmitted signal (only the positive frequency modulation part is shown here. The derivation process of the negative portion is the same):
where
represents the target echo with distance
R of the positive received part,
represents the reference signal with delayed distance
of the positive received part, and
c is the speed of light.
Therefore, the internal calibration signal and measurement signal can be expressed as follows:
where
represents the measurement signal,
represents the internal calibration signal, and * represents the conjugate. At this point, analyzing the frequency of the measurement signal and internal calibration signal, that is, the first-order term in the expression with respect to time, can be derived as follows:
where
represents the frequency of the positive dechirp part in the measurement signal, and
represents the frequency of the positive dechirp part in the internal calibration signal. According to the above equation, the target distance can be calculated as follows:
At this point, the target distance can be calculated using only the positive dechirp signal. The above analysis assumes a static target and linear frequency modulation.
2.2. The Impact of Vibration Coupled with Nonlinearity in FMCW Ladar Ranging
The radar signal will be subjected to nonlinearity when it is linearly modulated and transmits through the electrical device. This introduces a nonlinear phase term in the transmitted signal compared to the ideal signal, as follows:
where
represents the transmitted signal with the nonlinear phase, and
represents the nonlinear phase. The echo signal and the reference signal will also contain a time-delay term of the nonlinear phase:
where
represents the echo signal with nonlinear phase,
represents the reference signal with the nonlinear phase, and
and
are the time delays of the echo signal and reference signal, respectively. It can be derived that the influence of nonlinearity on the measurement signal and internal calibration signal is as follows:
where
represents a nonlinear term in the measured signal, which contains quadratic or higher-order components. Due to these terms, the frequency of the measured signal is no longer a constant, but a time-varying value. This results in main-lobe widening, side-lobe elevation, and potential inaccuracies in measured values after pulse compression.
The above analysis focuses on the effect of nonlinear phase on the signal. However, in practice, vibration is always present. Since Ladar works in the laser band with a short wavelength, even a small movement introduces a large Doppler frequency. In the previous analysis,
R is considered as a constant. Under vibration conditions,
R is a time-varying value
, and
also becomes a time-varying value
. At this point, the time-varying distance of the target can be expressed as follows:
where
is the initial distance between the target and Ladar at the beginning of the period,
is the vibration speed, which is also a time-varying value, and
is the time differential. The time delay
caused by distance is considered into Equation (8),
is still a constant, and then
changes to the following:
where it can be seen from the change of the nonlinear phase term that the influence of nonlinearity and vibration is coupled with each other. When
and
are uniformly modeled with polynomials, the formula below follows:
where
is the coefficient of each order polynomial of the nonlinear phase,
is the initial velocity of the vibration at the beginning of the period,
a is the acceleration of the vibration. The acceleration is also a time-varying value, but it can be approximated as a constant, if a short measurement period is considered, that is, the vibration is modeled as a uniformly accelerated motion within a period. At this time, the
expression can be changed to the following:
The frequency of
is expressed as follows:
From Equation (4), the ideal dechirp frequency should be point frequency. However, when considering both vibration and nonlinearity, the frequency includes a constant term, a Doppler frequency term, a term related to the initial distance and velocity, and higher-order phase components. This results in a highly complex expression. Under polynomial modeling, the effects of vibration and nonlinearity become coupled, doubling the order of the polynomial expression. Due to the limited sampling frequency resolution of FMCW Ladar, the expression can be simplified for analysis. By ignoring the
term in the denominator of each order polynomial coefficient, the simplified frequency expression becomes the following:
where the phase of the nonlinearity and vibration coupled part only discards the terms higher than the third-order
t, though it is not fully expanded. From Equation (14), it is evident that the expression still includes terms ranging from constants to higher-order terms of
t. Analyzing the frequency expression, the constant terms consist of the Doppler frequency and the initial range difference. The coupled part also contains terms such as
, which causes the frequency shift and the approximate nonlinear phase when only a stationary target is considered. Among the first-order terms, since the denominator contains more
c and is multiplied by a smaller
t, this makes their contribution smaller than the constant term. Similarly, the higher order terms have even less impact. These terms primarily affect the peak shape and increase the side lobes.
2.3. Multiple Synchro-Squeezing Transform
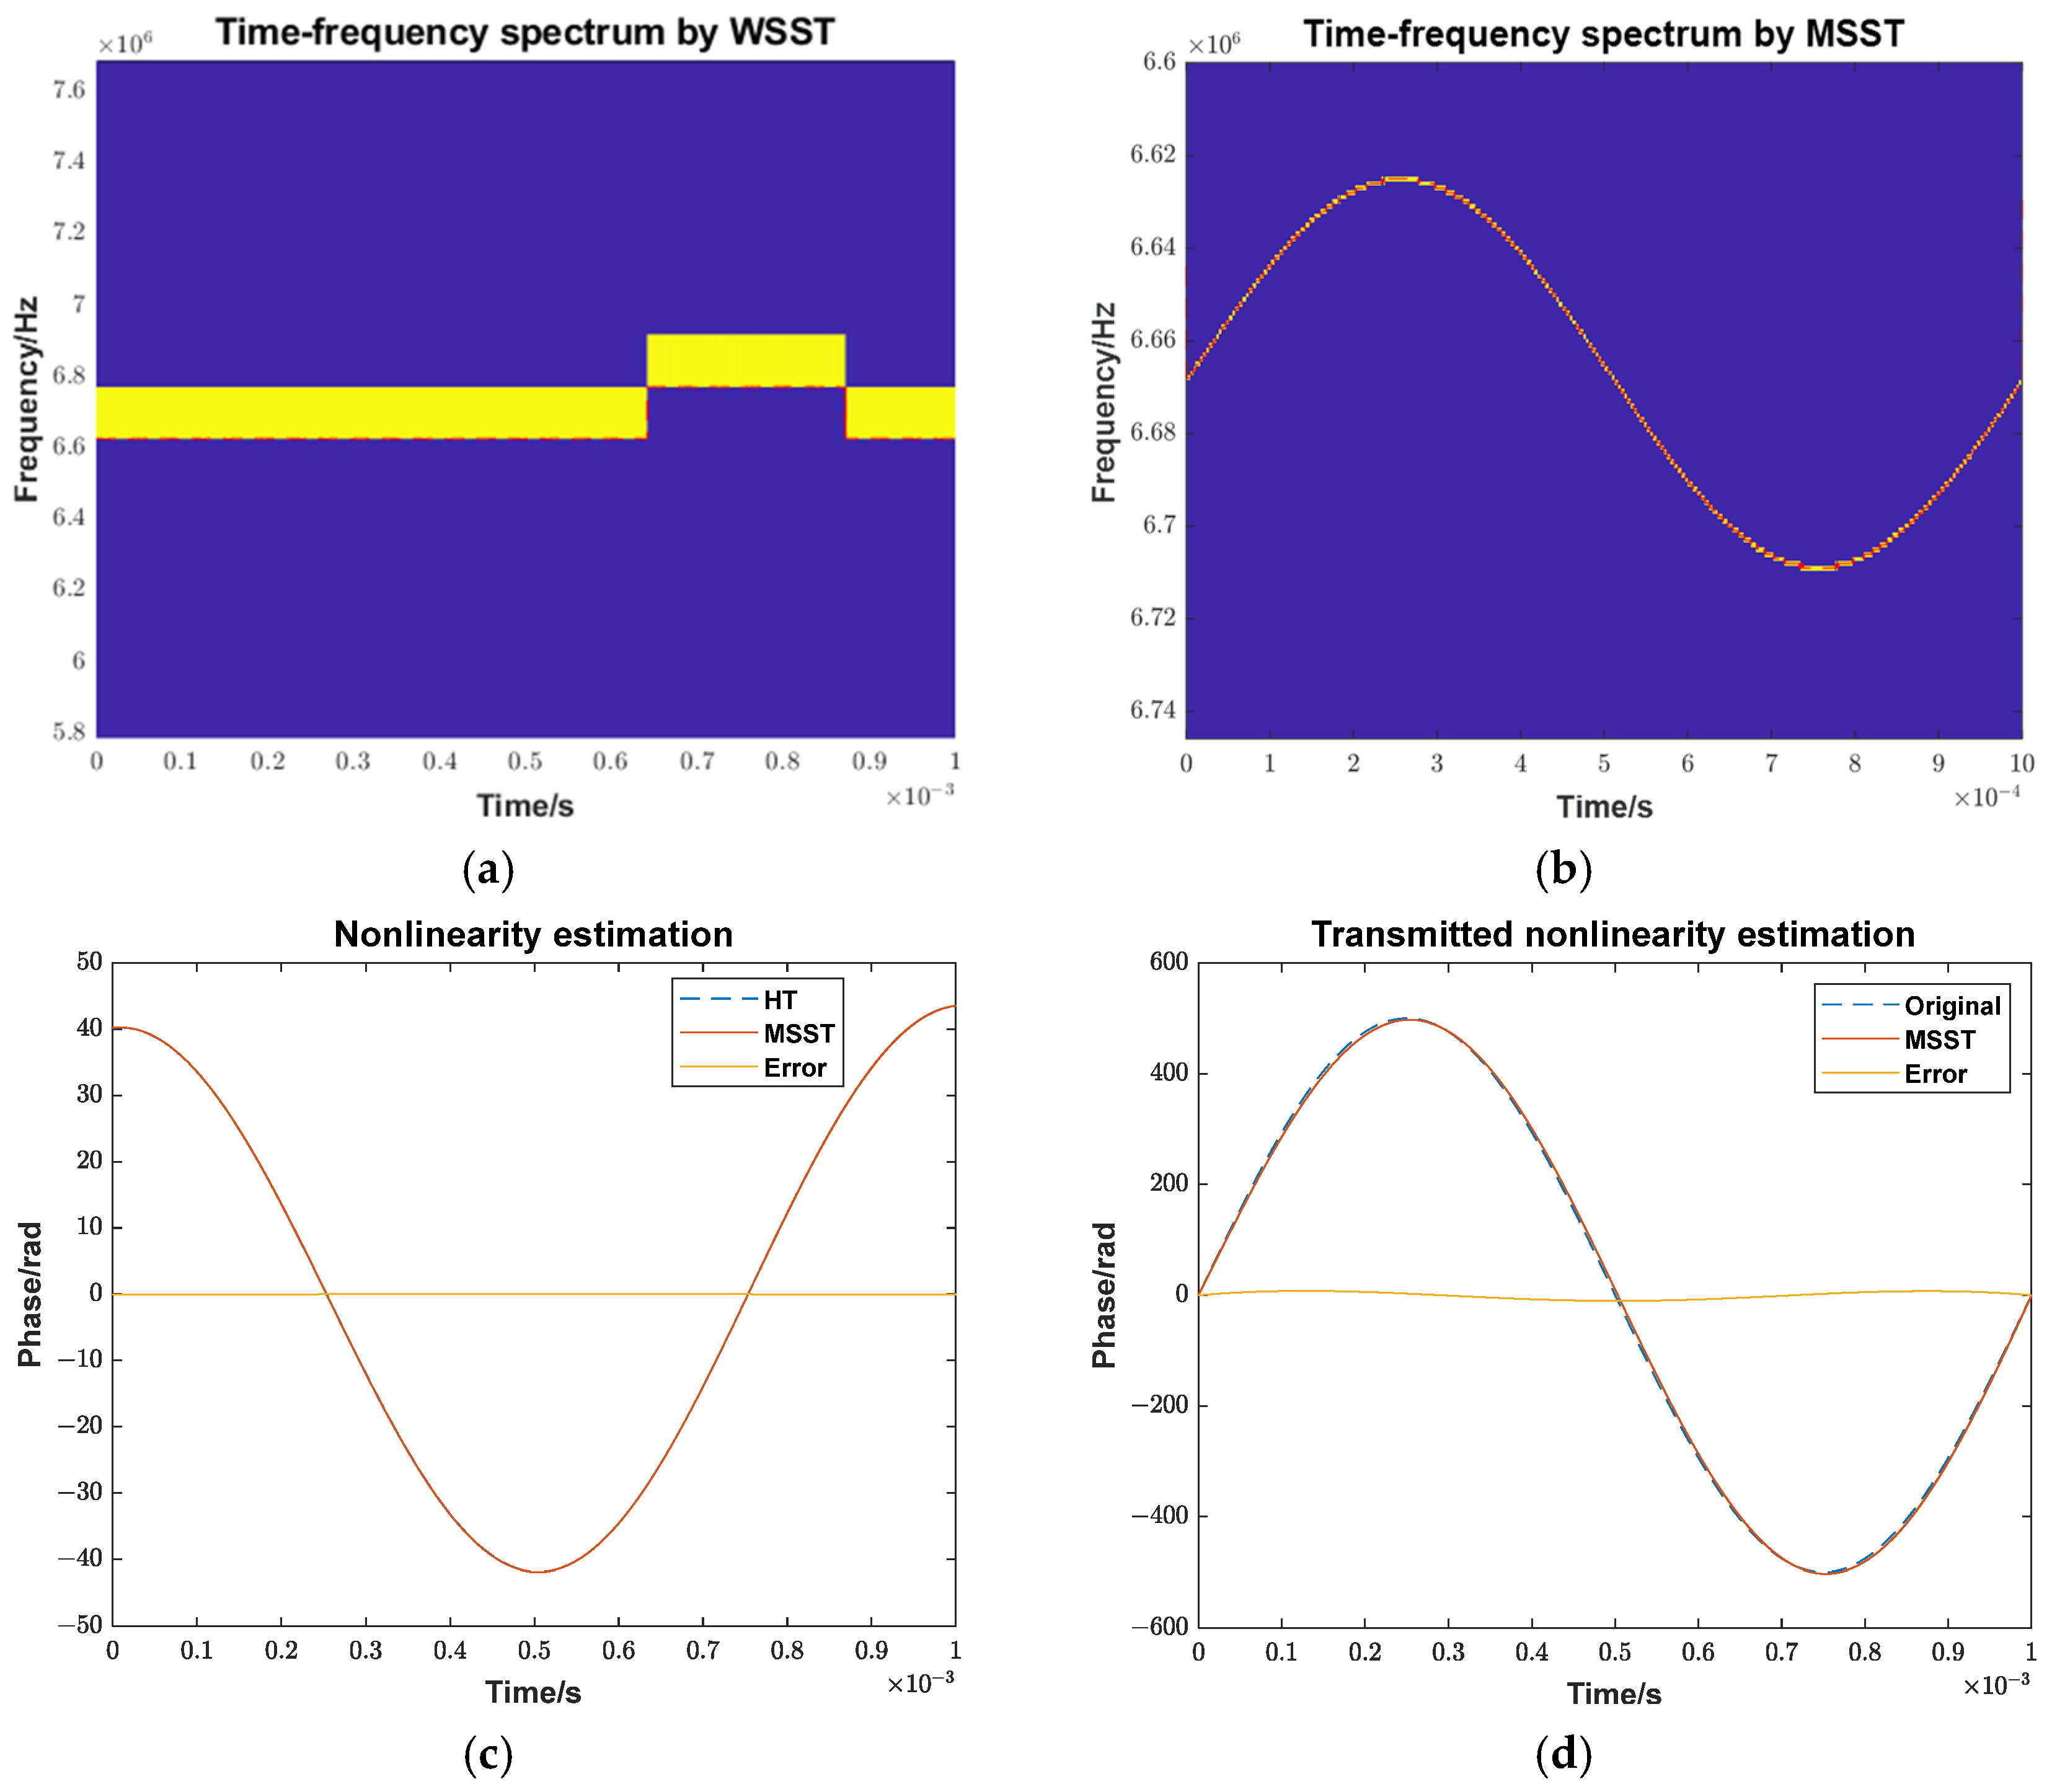
To compensate for frequency modulation nonlinearity, the nonlinear phase of the internal calibration signal must be analyzed, because it does not contain the phase change caused by vibration. However, due to the inevitable presence of phase noise in the actual signals, the nonlinear phase extracted directly via HT is not smooth and is unsuitable for constructing a reference signal. This paper proposes to use MSST, which is an improvement of synchrosqueezing transform (SST). SST improves time–frequency resolution over the short-time Fourier transform (STFT) by rearranging the signal energy in the time–frequency domain [
34]. MSST performs SST iteratively to achieve a better energy concentration. Compared with the second-order SST and higher-order SST, MSST requires only a single STFT computation, offering a lower computational cost while ensuring accurate signal reconstruction.
MSST operates within the STFT framework. Firstly, the STFT of the full-period optical prism signal is expressed as follows:
where
represents the transformed time–frequency matrix,
represents the compact support window, and
is the angular frequency. The phase of
can be expressed by Equation (14) as follows:
Equation (15) can be derived as follows:
where
represents Fourier transform. We can calculate the partial derivative of Equation (17) with respect to
t:
The estimation of the instantaneous angular frequency can be derived as follows:
For weakly time-varying signals, this estimation provides a good approximation of the signal’s intermediate frequency. SST employs a frequency rearrangement operator to converge the extended time–frequency coefficients, expressed as follows:
Through SST, the energy of the time–frequency matrix is concentrated around the estimated intermediate frequency. MSST extends this process by iteratively repeating the synchronous compression step, achieving further refinement, as follows:
Performing SST again on the basis of SST is equivalent to a new estimation of frequency to redistribute the energy of STFT. Thus, the core improvement of MSST over SST lies in its multiple frequency estimates.
Here, the previous phase Equation (16) is expanded using Taylor series:
Inserting this into Equation (15) and defining the Gaussian window function as
, the time–frequency representation after STFT can be derived as follows:
Inserting it into the angular frequency estimation Equation (19), we receive the following formula:
Then, the frequency after the twice-frequency estimation can be expressed as follows:
According to the above derivation, the frequency and SST after multiple rearrangements can be expressed as follows:
where
N represents the number of rearrangements. Through iterative rearrangements, the frequency estimation continuously converges to the intermediate frequency, resulting in a more concentrated time–frequency energy distribution for the target. The time–frequency curve is extracted by ridge detection more accurately.
2.4. Equal-Phase Interval Resampling
From Equation (3), for ideal linear frequency modulation and a stationary target, the signal phase is a linear function of time. Under equal-time interval sampling, the phase changes uniformly, allowing direct spectrum analysis via FFT. However, when frequency modulation nonlinearity and vibration are modeled as polynomial functions, the signal phase becomes a polynomial function of time. In this case, equal-time interval sampling results in non-uniform phase changes, and direct FFT analysis will introduce problems such as main-lobe widening and side-lobe elevation, which degrades the target peak shape. The signal is transformed from Equations (12) and (14):
where
represents constant phases,
represents the delay corresponding to the initial distance, and
is expressed as follows:
where
represents the corresponding coefficients of each order polynomial. In this case, the phase of the signal is collapsed to
as a function of the independent variable. The Doppler frequency is considered when simplifying the expression of first-order phase coefficient. If the signal is resampled at an equal-phase interval about
, instead of equal-time intervals, the influence of high-order terms is eliminated during FFT analysis. This resampling process removes the interference of a polynomial phase, improving peak shape.
2.5. High-Order Ambiguity Function
Since the vibration of the target cannot be completely equivalent to a constant speed, the effect of high-order phase terms may still remain after equal-phase interval resampling. In this case, the signal is expressed as follows:
where
represents the resampled signal, and
represents the coefficient of polynomial phase. By segmenting the signal into equal interval and alternately conjugating and multiplying them, a single-frequency signal can be obtained as follows:
where
represents the ambiguity operator, and
represents the delay of each interval. Equation (30) is the result of the alternating conjugate multiplication of N-order signals, and its frequency is as follows:
The frequency of the ambiguity function can be analyzed using FFT. Combining with this relationship, high-order polynomial terms can be compensated step-by-step until only the first-order phase term remains. Subsequently, the symmetrical triangular wave modulation is utilized to compensate for the Doppler frequency caused by constant speed.
Theoretically, the HAF method can directly compensate for both vibration and nonlinearity. However, it suffers from the accumulation of errors in polynomial coefficient estimation and requires a high signal-to-noise ratio. Therefore, the primary compensation method remains equal-phase interval resampling, with the HAF method applied for residual compensation.
2.6. Proposed Method
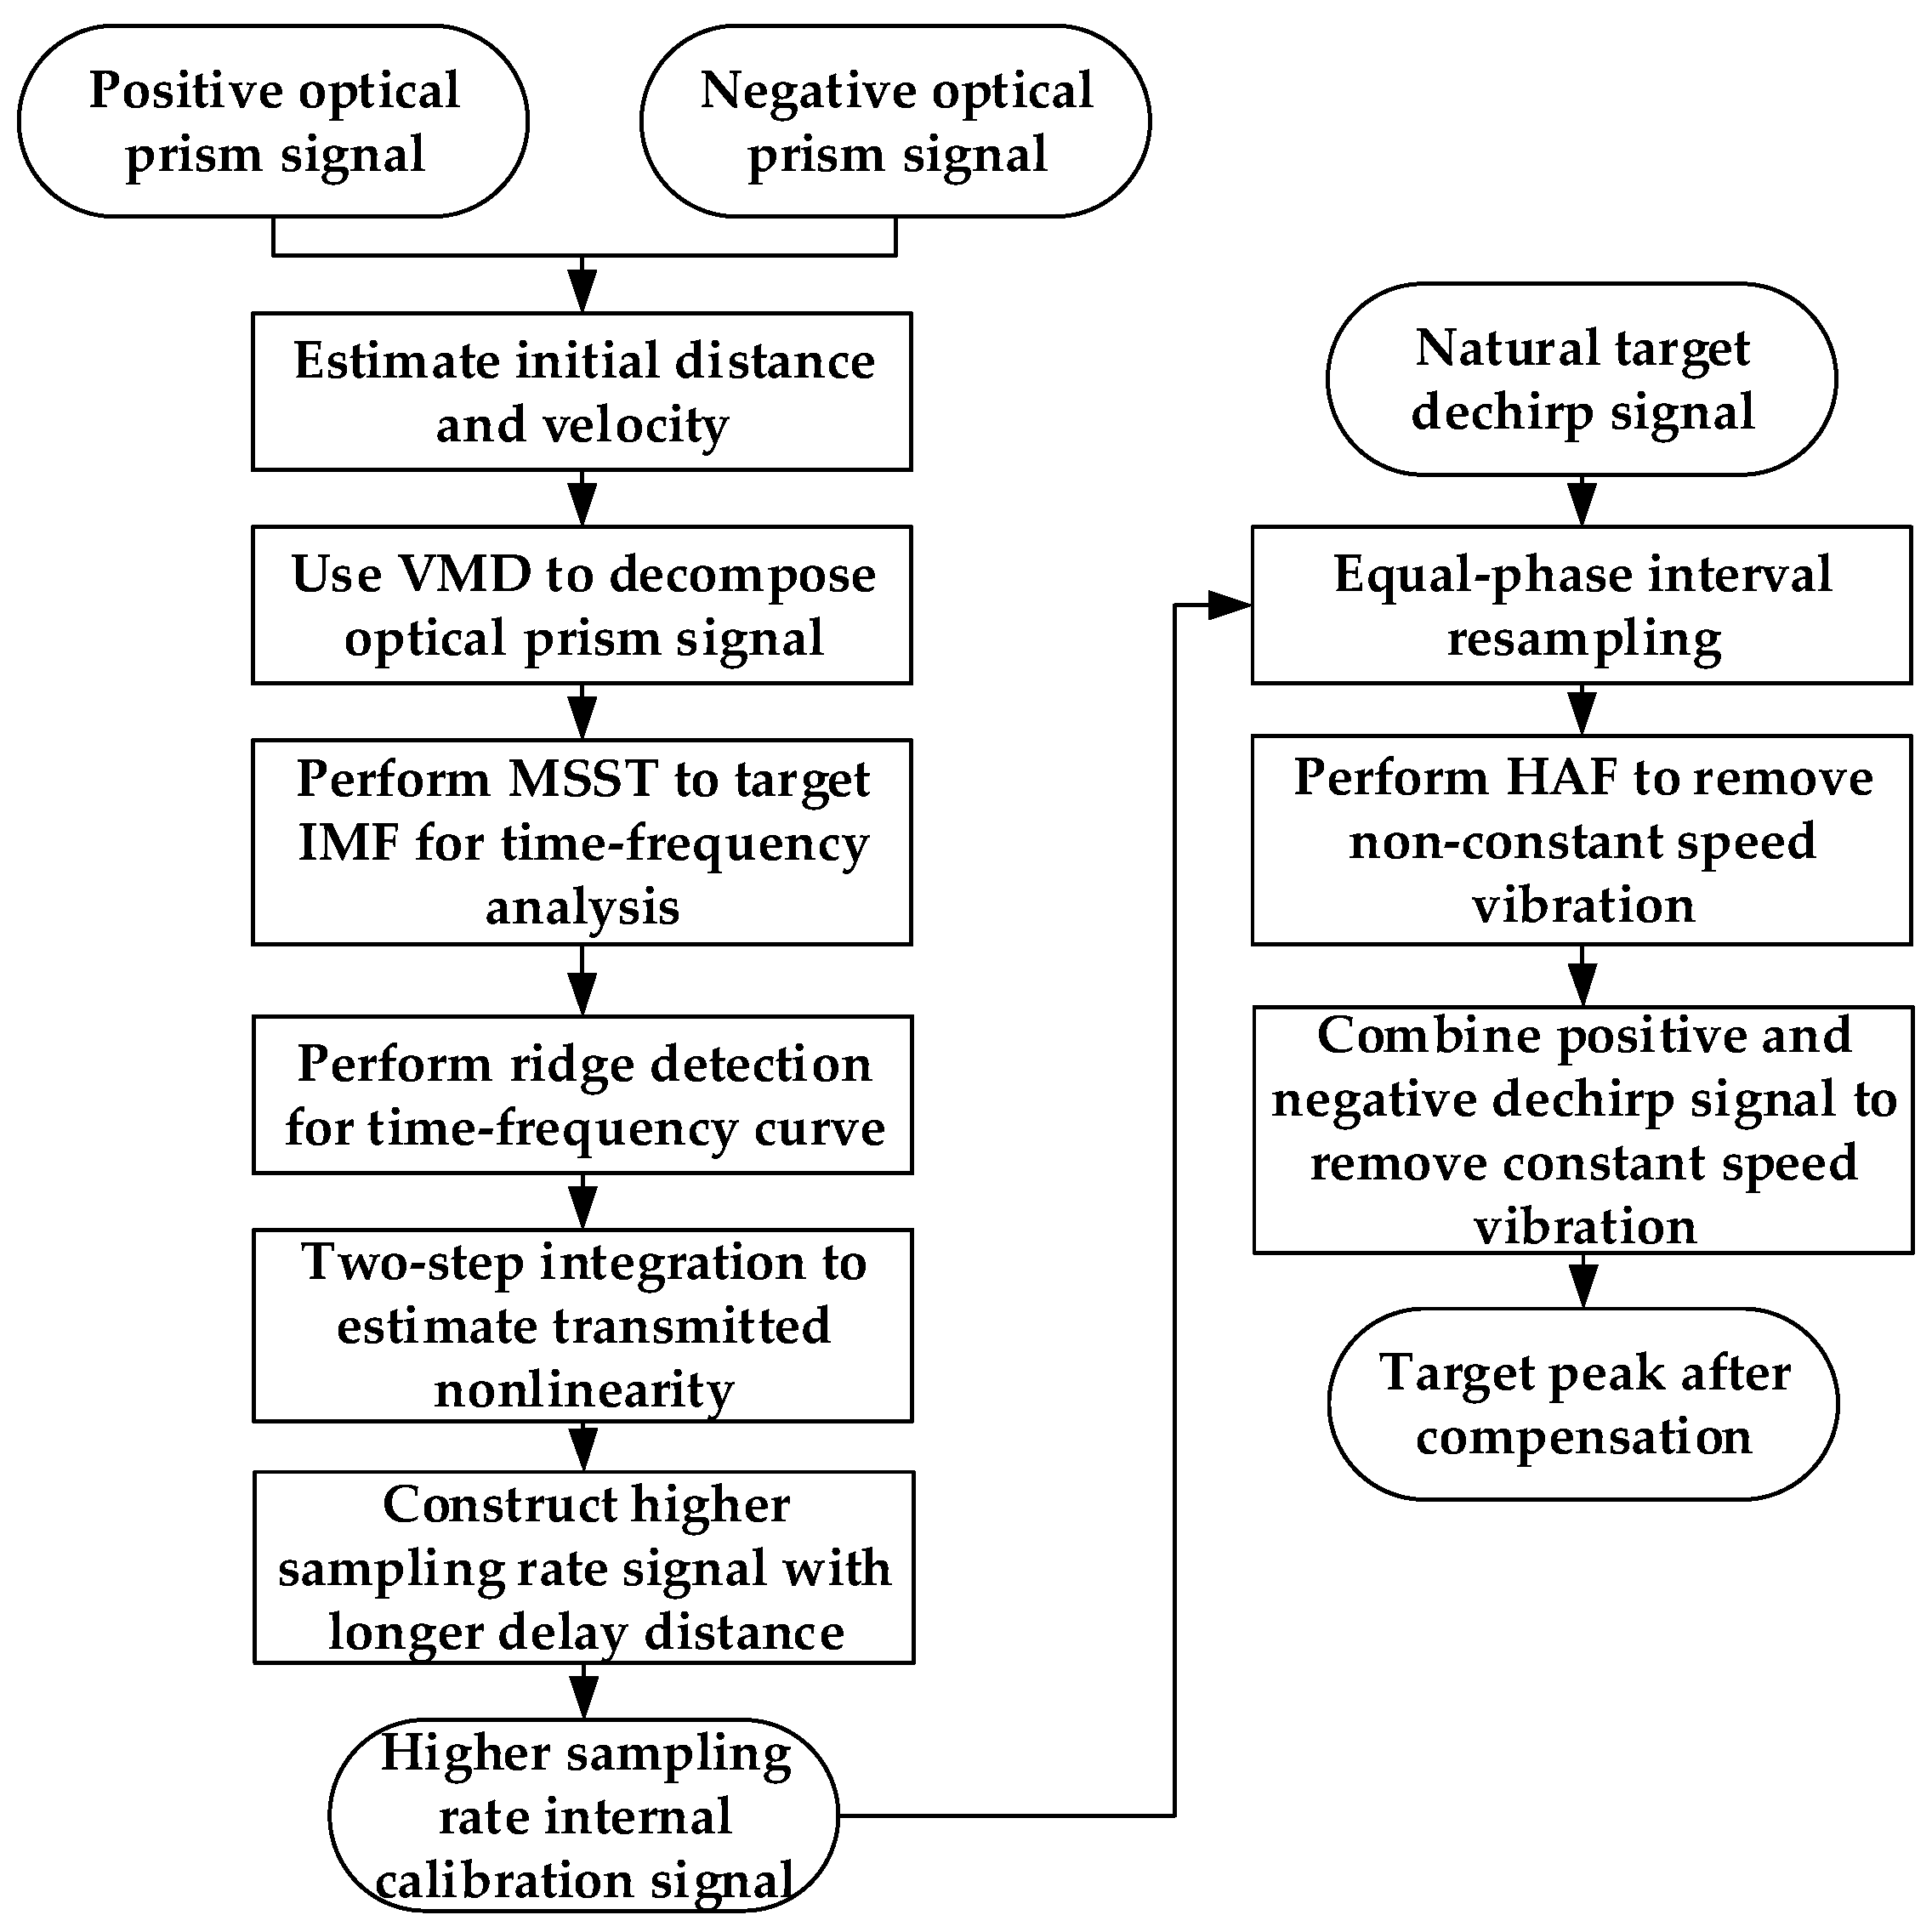
The proposed method for the simultaneous compensation of frequency modulation nonlinearity and vibration is implemented as
Figure 3:
(a) Preliminary Estimation: Select the optical prism actual signal, which has a high signal-to-noise ratio, and perform FFT to preliminarily estimate the target distance and constant speed of vibration.
(b) Signal Decomposition: Apply variational mode decomposition (VMD) [
35] to the positive and negative dechirp signals to extract the intrinsic mode function (IMF) of the optical prism signal, eliminating noise and harmonics interference.
(c) Time–Frequency Analysis: Perform MSST on the optical prism signals’ IMFs and extract the time–frequency variation curve using ridge detection. The ideal frequency is a point frequency, and the Doppler frequency from constant speed is also a point frequency. The remaining variations represent frequency modulation nonlinearity, the non-constant speed term of vibration, and phase noise.
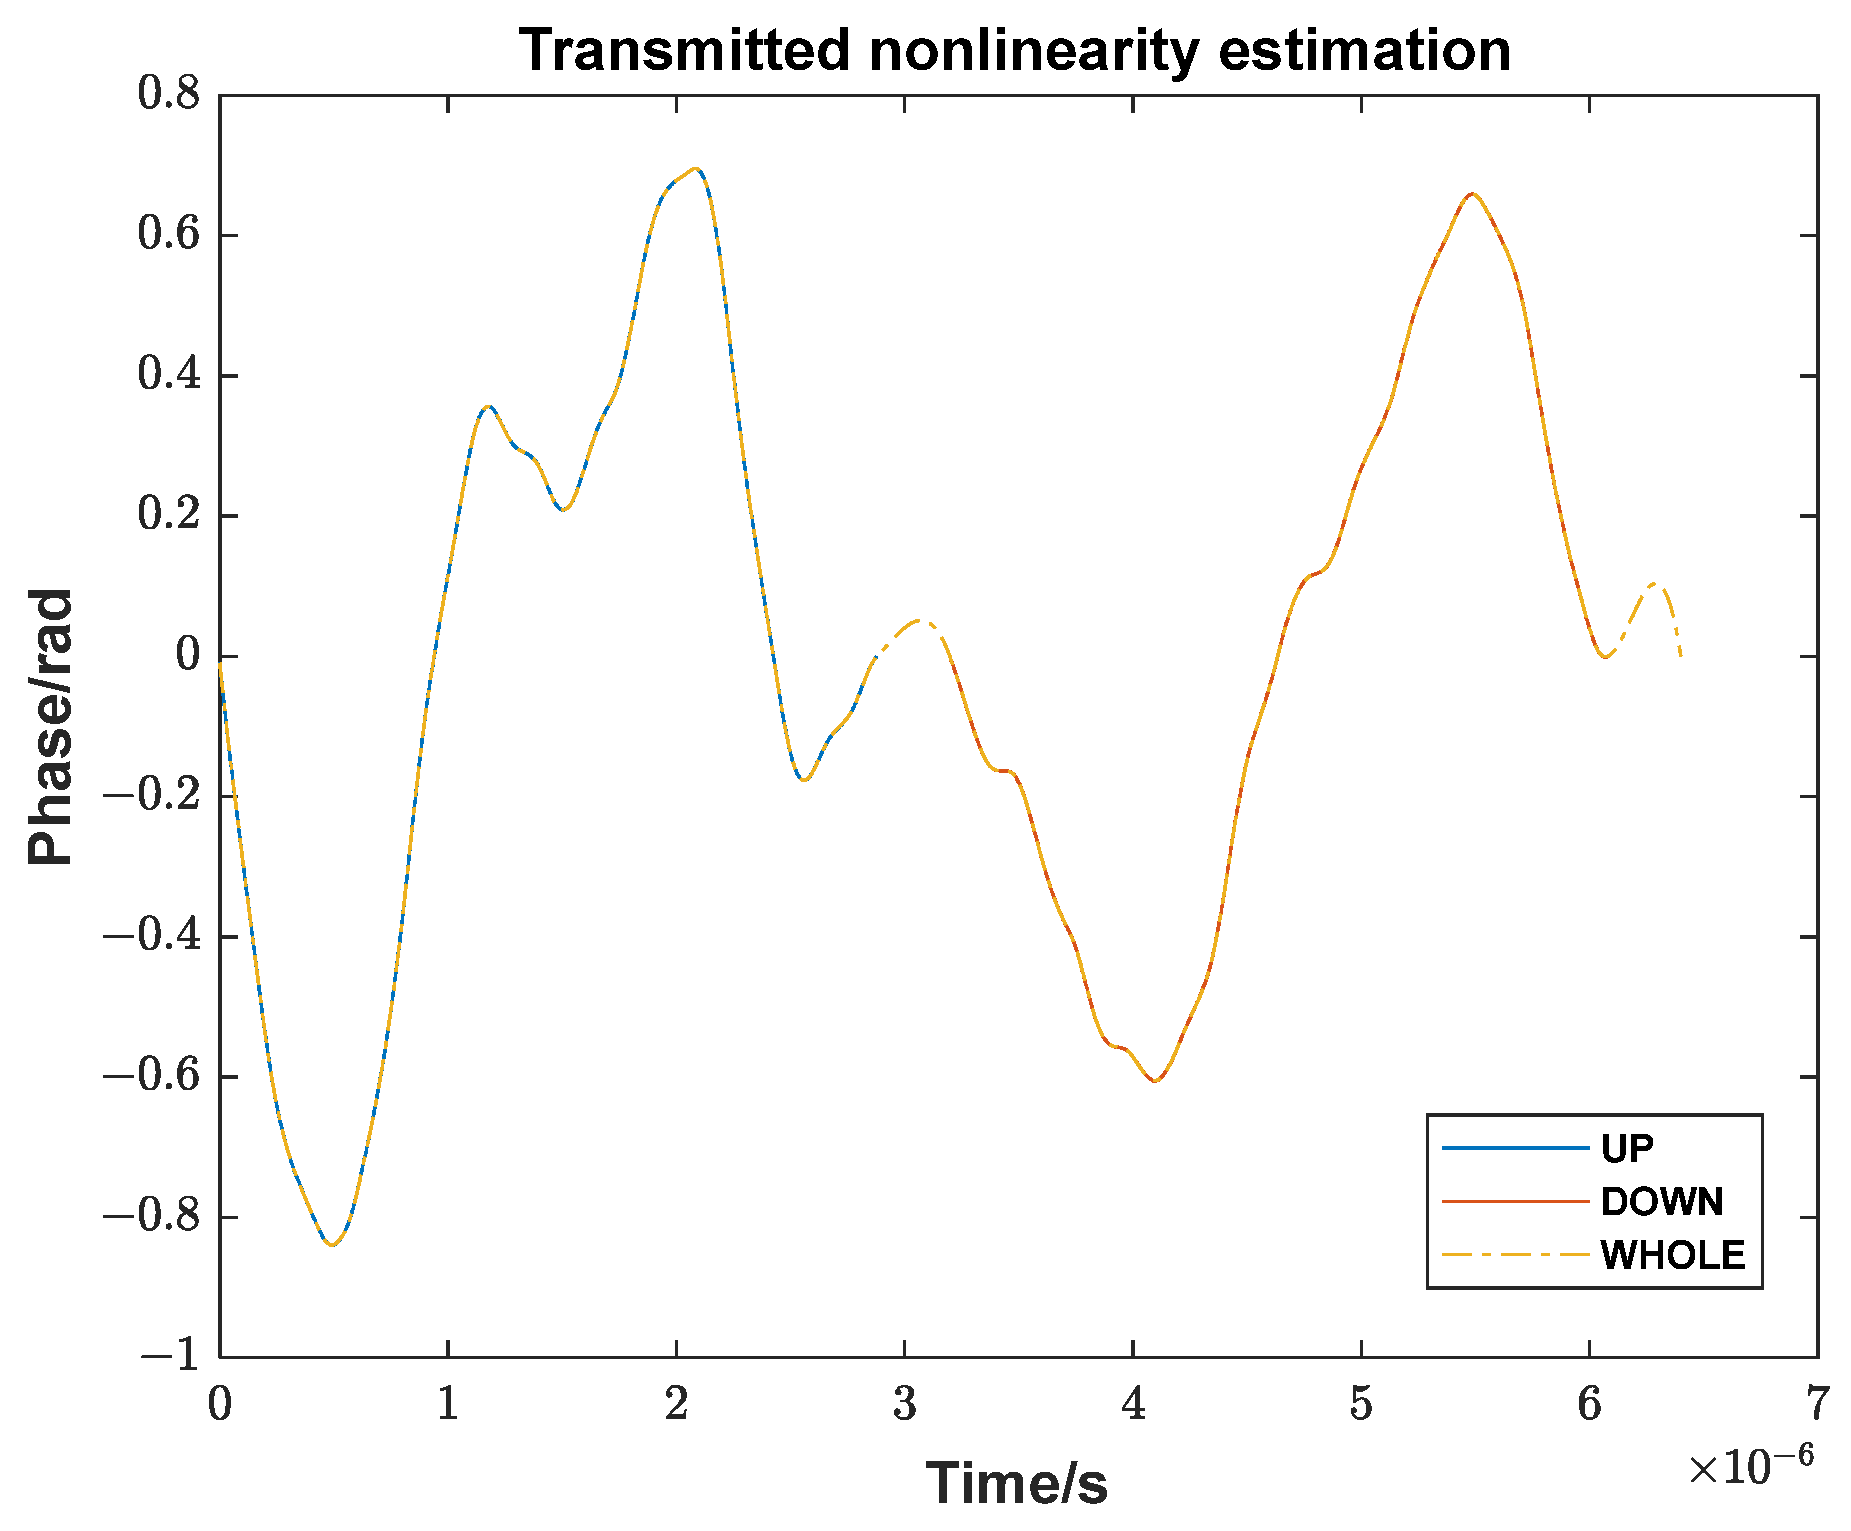
(d) Nonlinear Phase Extraction: Integrate the time–frequency curve and remove the linear trend to obtain the nonlinear phase in the optical prism signal. Estimate the transmitted signal nonlinearity based on first-order Taylor series expansion with preliminary prism distance. The small delay of the optical prism echo relative to the period justifies the use of first-order approximation.
(e) Signal Alignment and Construction: Cyclically shift the transmitted nonlinearity estimation to align with the reference delay signal period. Construct an ideal transmitted signal at a higher sampling rate, adding the estimated nonlinearity. Generate an echo signal with a delay greater than the maximum range of the actual signal, adding nonlinearity corresponding to the delay cycle shift. Mix the two signals and add the Doppler frequency from the estimated speed.
(f) Resampling: Taking the constructed internal calibration signal as a reference, interpolate the time points corresponding to its equal-phase points, and resample the actual signal at these time points.
(g) Residual Compensation: Apply the HAF method to compensate for residual polynomial phase errors. Average the positive and negative frequency modulation peaks to remove the Doppler frequency influence caused by the constant speed.
4. Discussion
Here, we discuss the reasons for designing the internal calibration path in the actual system while not utilizing its data. As previously mentioned, the low sampling rate and uncalibrated internal delay make the data inconvenient to use. Furthermore, the reference signal delay of 20.7 µs designed according to the actual working distance is equivalent to three times the signal period (6.4 µs) plus 1.5 µs, which is too large to estimate transmitted nonlinearity. However, it has been verified that the nonlinearity remains consistent across each period under zero-delay conditions, which is a prerequisite for analysis. Under these conditions, the proposed method is applied, and the target signal is compensated based on the actual internal calibration signal.
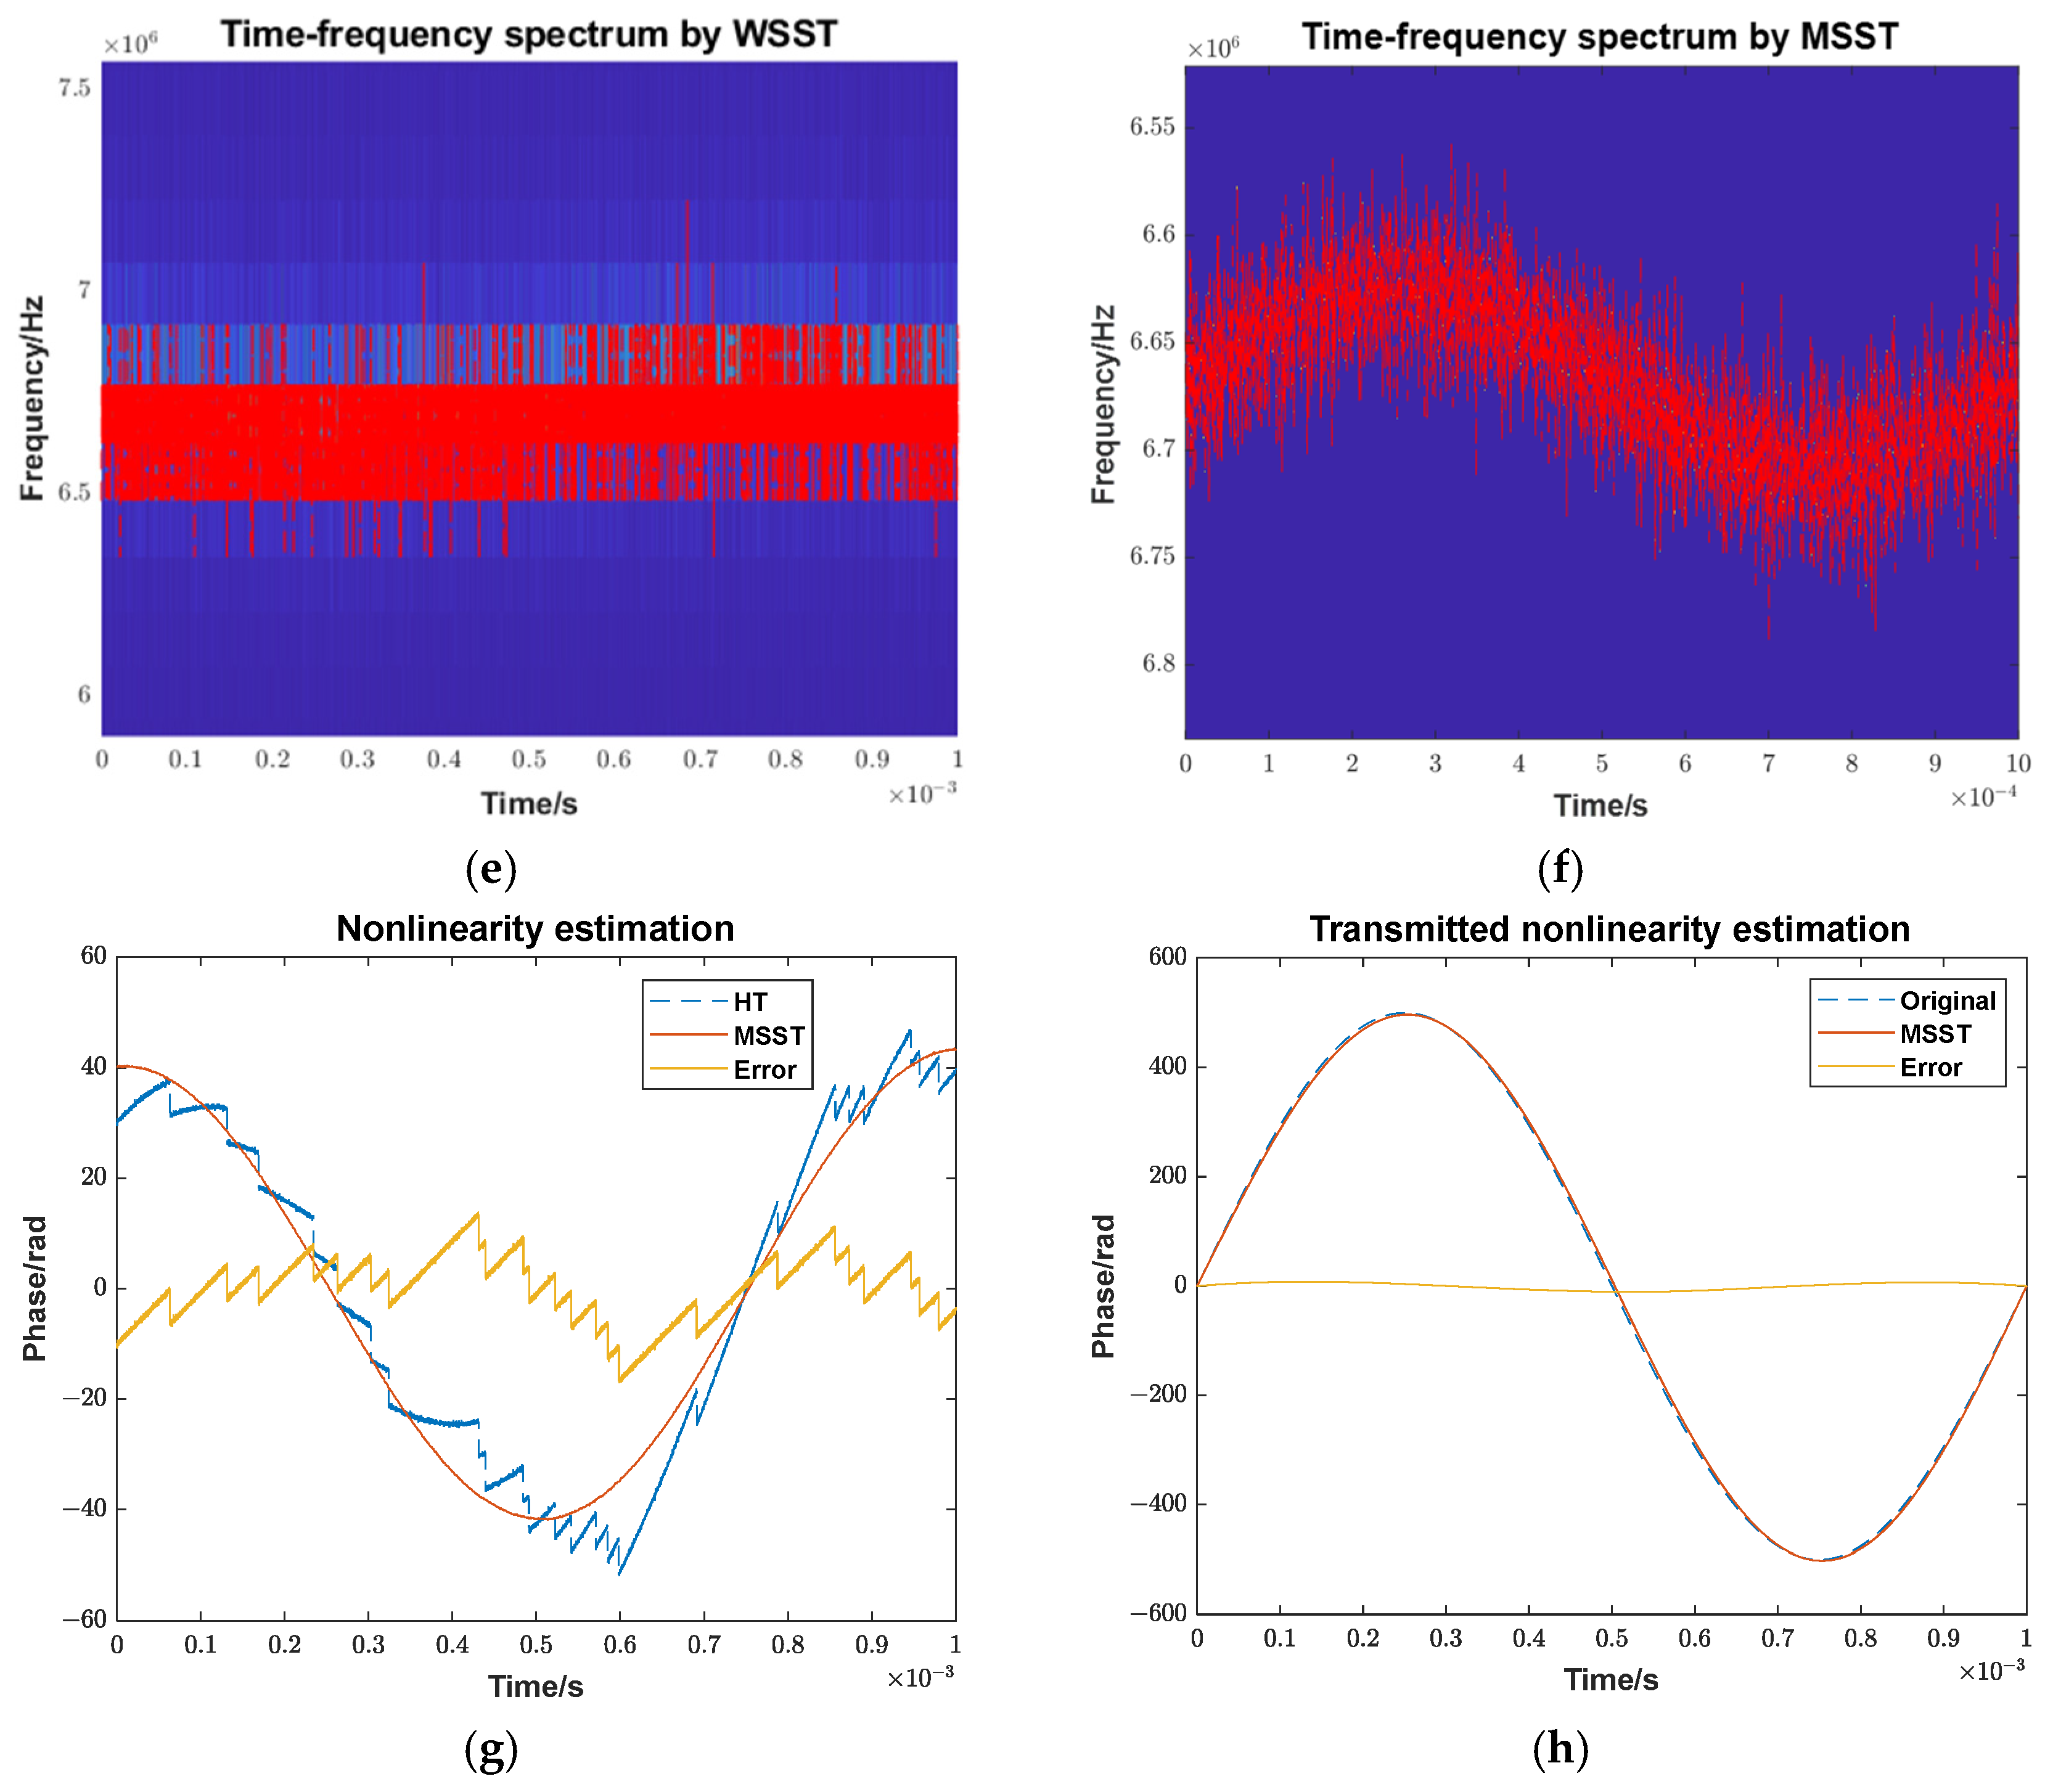
Firstly, from
Figure 13, the effect of the MSST time–frequency analysis for estimating nonlinearity remains applicable. However, unlike the optical prism nonlinearity discussed earlier, the results here show no similarity.
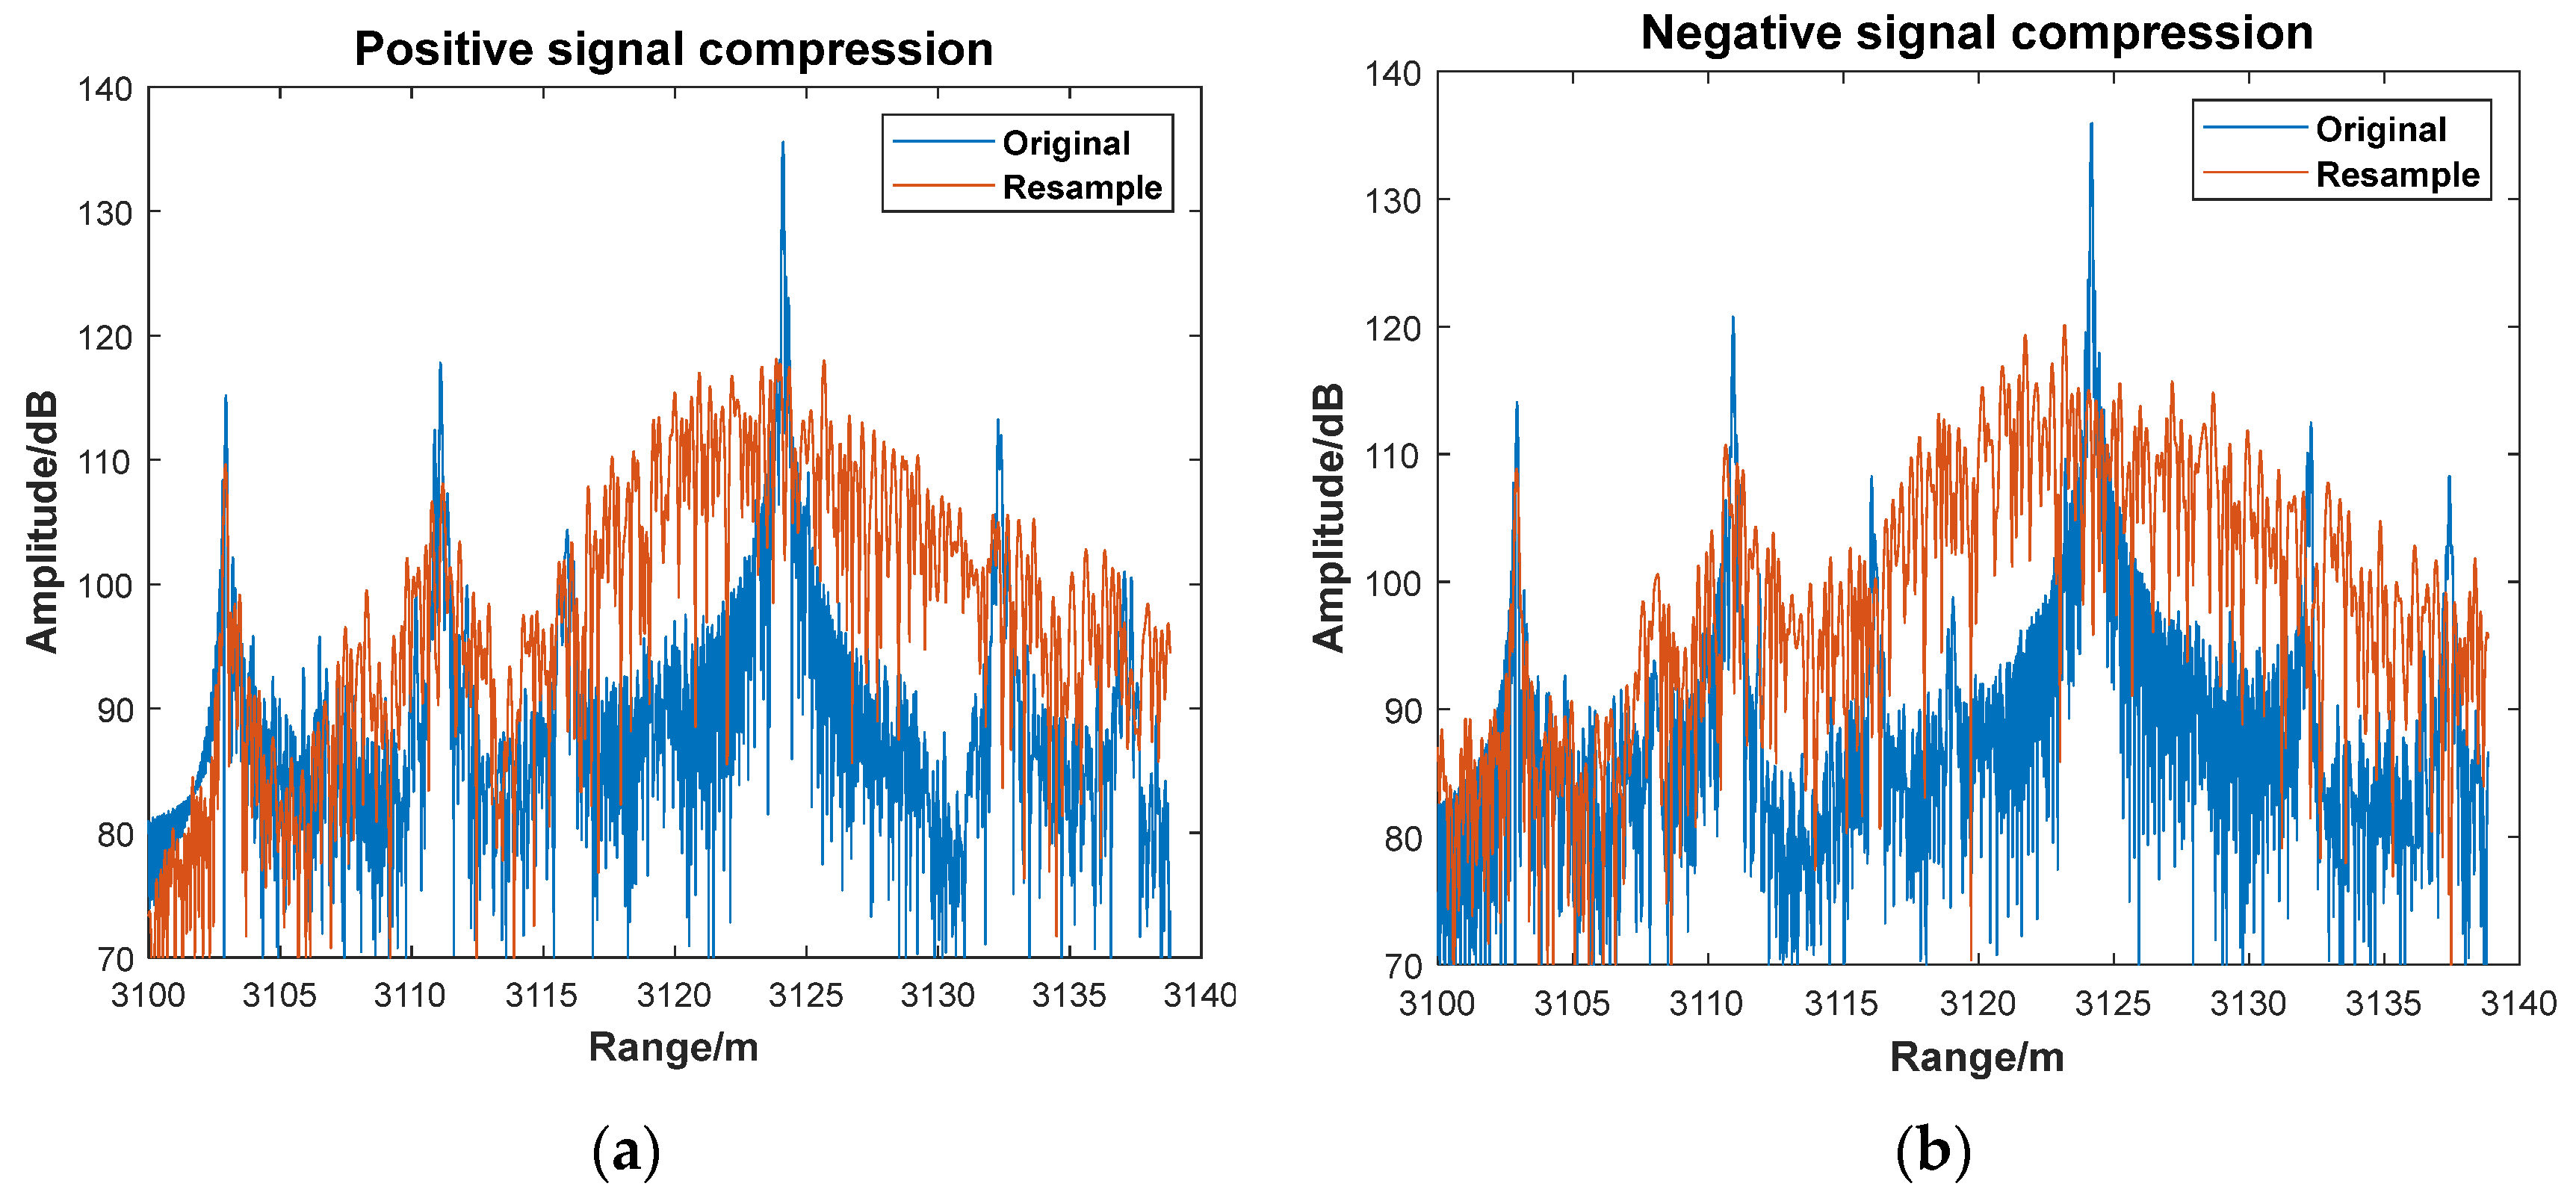
Next, the internal calibration signal is directly used for resampling tests. Due to the limited number of points in the internal calibration signal, the phase curve obtained by integrating the time–frequency curve has a small range. If the phase interval is used as the equal-phase interval, the resulting signal contains only a few dozen points, significantly fewer than the original signal. Therefore, the phase interval is reduced to , increasing the number of sampling points.
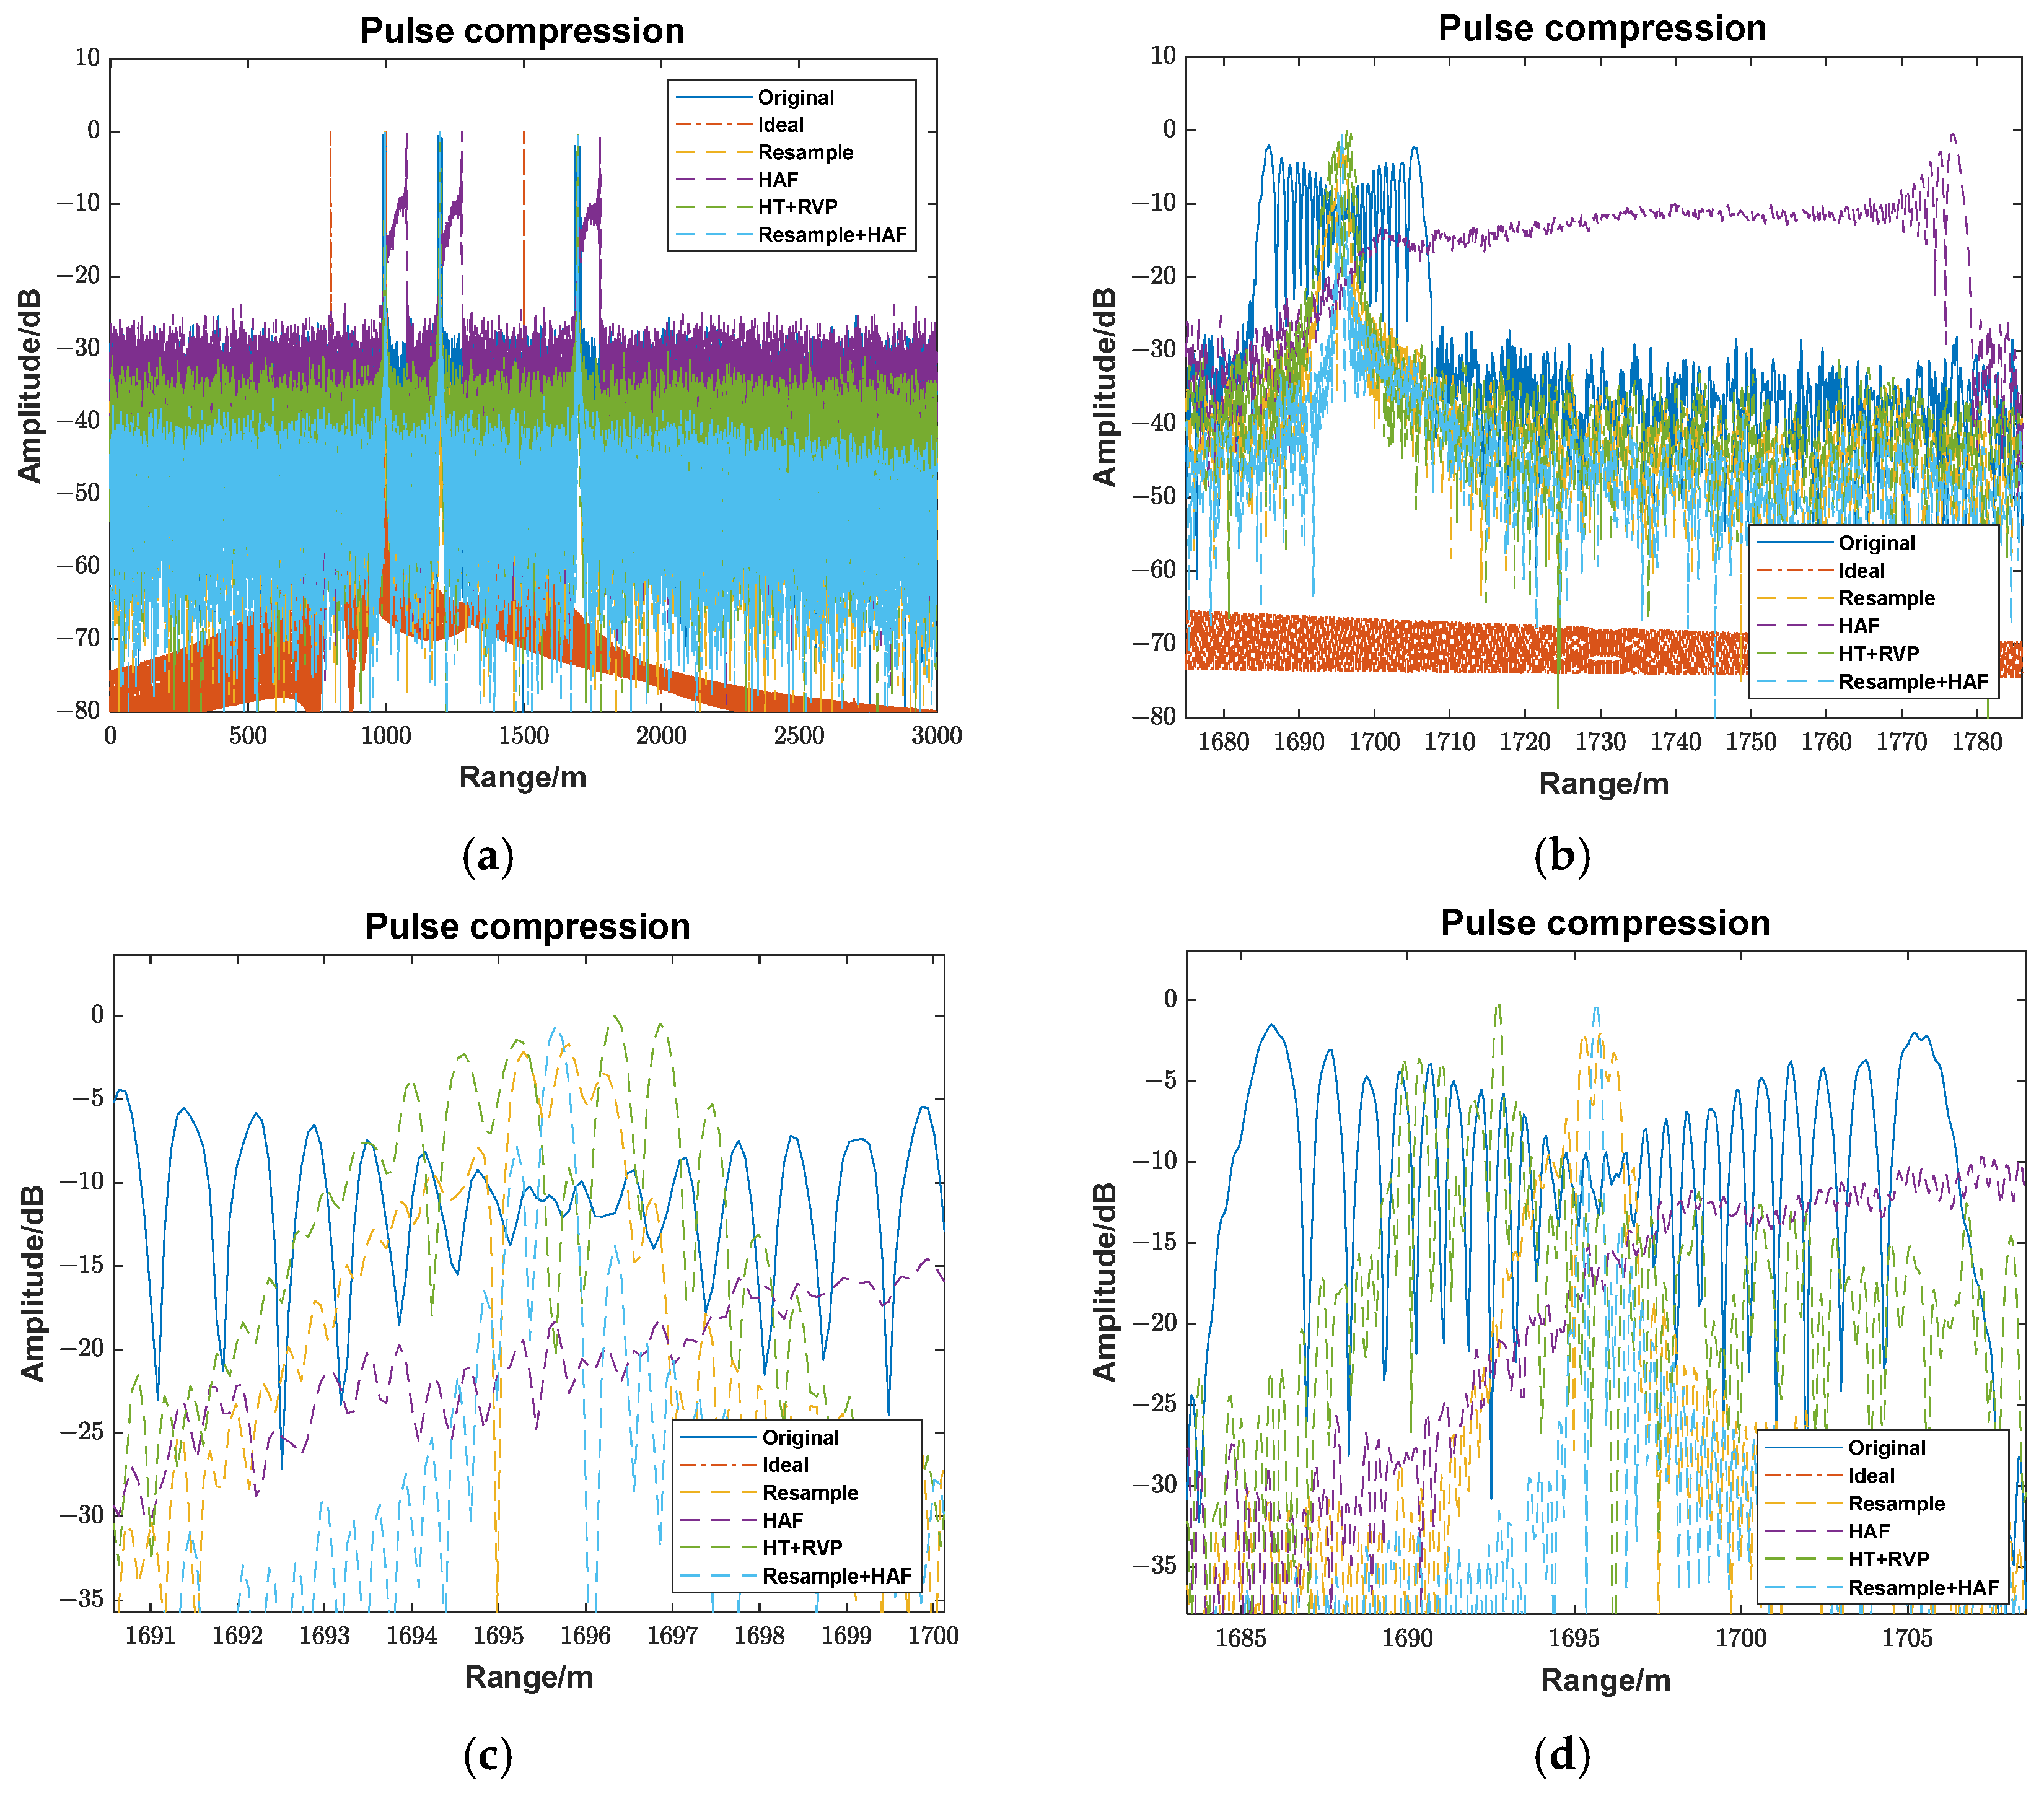
As shown in
Figure 14, equal-phase interval resampling significantly deteriorates the signal spectrum, making the target peak unrecognizable. Although the internal calibration signal with a 1.5 µs delay satisfies the Nyquist theorem, the operation fails primarily due to the measured signal’s sampling rate being six times higher than that of the internal calibration signal. Moreover, simply reducing the resampling interval further exacerbates the susceptibility to phase noise, preventing correct resampling. Another important issue lies in the system’s signal structure. As described in
Section 2, the internal calibration signal’s nonlinearity is
, while the measured signal’s nonlinearity is
. This is different from the nonlinearity expression for the measured and internal calibration signal described in most of the literatures, leading to errors when directly applying their methods. In this study, the constructed transmitted and reference delay signal is equivalent to the auxiliary signal in the literature. This ensures a time alignment between the internal calibration signal and measured signal at the reference signal’s start time, so the compensation method can be directly applied.


 ,
, 


