Abstract
Interferometric Synthetic Aperture Radar (InSAR) technology has emerged as a vital tool for monitoring surface deformation due to its high accuracy and spatial resolution. With the rapid economic development of Nanchang, extensive infrastructure development and construction activities have significantly altered the urban landscape. Underground excavation and groundwater extraction in the region are potential contributors to surface deformation. This study utilized Sentinel-1 satellite data, acquired between September 2018 and May 2023, and applied the Permanent Scatterer Interferometric Synthetic Aperture Radar (PS-InSAR) technique to monitor surface deformation in Nanchang’s urban area. The findings revealed that surface deformation rates in the study area range from −10 mm/a to 6 mm/a, with the majority of regions remaining relatively stable. Approximately 99.9% of the monitored points exhibited deformation rates within −5 mm/a to 5 mm/a. However, four significant subsidence zones were identified along the Gan River and its downstream regions, with a maximum subsidence rate reaching 9.7 mm/a. Historical satellite imagery comparisons indicated that certain subsidence areas are potentially associated with construction activities. Further analysis integrating subsidence data, monthly precipitation, and groundwater depth revealed a negative correlation between surface deformation in Region A and rainfall, with subsidence trends aligning with groundwater level fluctuations. However, such a correlation was not evident in the other three regions. Additionally, water level data from the Xingzi Station of Poyang Lake showed that only Region A’s subsidence trend closely corresponds with water level variations. We conducted a detailed analysis of the spatial distribution of soil types in Nanchang and found that the soil types in areas of surface deformation are primarily Semi-hydromorphic Soils and Anthropogenic Soils. These soils exhibit high compressibility, making them prone to compaction and significantly influencing surface deformation. This study concludes that localized surface deformation in Nanchang is primarily driven by urban construction activities and the compaction of artificial fill soils, while precipitation also has an impact in certain areas.
1. Introduction
Surface deformation is a geological hazard resulting from the consolidation and compression of loose underground strata, typically triggered by natural processes or human activities. This phenomenon causes extensive damage to the natural environment and poses significant threats to human life and economic activities [1]. As a progressive and slow-moving geological disaster, subsidence is both irreversible and challenging to mitigate once it occurs. Subsidence areas are often located in low-lying wetlands and coastal plains with extremely limited elevation resources. These regions are typically economically developed, exacerbating the severity of geological hazards. In China, the earliest documented observations of surface deformation disasters date back to the 1920s in the urban areas of Shanghai and Tianjin, with additional cases reported by the 1960s [2,3]. By the end of 2012, the subsidence area in the Beijing Plain had expanded to 4273 square kilometers, with severe subsidence rates of 30 to 60 mm/a and a maximum cumulative subsidence of 1302 mm [4]. Globally, many cities have experienced the adverse effects of surface deformation, including Jakarta, Indonesia [5]; Hanoi, Vietnam [6,7]; Kobe, Japan [8]; and Houston, USA [9].
Traditional leveling and GPS techniques are inefficient and inadequate for monitoring large-scale surface deformation [10]. Current methods for measuring surface deformation primarily include instrument-based measurements, geodetic leveling, GPS observation networks, and InSAR technology. Gabriel et al. (1989) first applied the Differential InSAR (D-InSAR) method to derive surface deformation information in California’s Imperial Valley, USA [11]. Compared to traditional monitoring methods, D-InSAR provides a broader monitoring range, higher spatial resolution, and a non-contact approach, addressing many limitations of conventional techniques. However, D-InSAR technology is affected by temporal and spatial decorrelation and atmospheric delays, which significantly reduce its accuracy and applicability [12]. To overcome these challenges, advanced time-series InSAR techniques, such as PS-InSAR and Short Baseline Subset InSAR (SBAS-InSAR), have been developed. Ferretti et al. (2001) introduced the PS method for high-precision monitoring of surface deformation, particularly in urban areas or environments with stable scatterers [13]. Similarly, Berardino et al. (2002) proposed the SBAS-InSAR method, which uses interferograms with shorter temporal and spatial baselines to mitigate decorrelation effects and improve coherence and temporal resolution [14].
In recent years, Multi-Temporal InSAR (MT-InSAR) methods have significantly improved deformation monitoring accuracy by analyzing time-series stable points using multiple SAR images of the same area. This approach effectively reduces measurement errors caused by atmospheric delays, achieving deformation monitoring precision at the centimeter to millimeter scale. Compared to traditional methods, MT-InSAR provides extensive and high-precision deformation information particularly in urban areas [15]. Commonly used MT-InSAR technologies include PS-InSAR and SBAS-InSAR. The PS-InSAR method selects stable and strong backscatter points as observation targets, ensuring good coherence and stability even over long temporal or spatial baselines. On the other hand, SBAS-InSAR, a time-series InSAR method based on multiple master images, uses interferograms with shorter temporal and spatial baselines to extract surface deformation information. This approach addresses poor coherence issues associated with the single-master image limitation in PS-InSAR and reduces the required amount of SAR data [16]. SBAS-InSAR is more suitable for mountainous and complex terrain areas, while PS-InSAR is better suited for monitoring urban surface deformation. Recently, MT-InSAR technology has been widely applied by domestic and international researchers for surface deformation monitoring in numerous cities and regions, and even applied it to mapping the total electron content of the ionosphere [17]. PS-InSAR and SBAS-InSAR methods have been widely used in various areas [18,19,20,21,22,23,24,25,26,27].
Nanchang is located on the southwestern shore of Poyang Lake. The city’s eastern region features the alluvial plains of the Gan-Fu River, characterized by flat terrain, while the western region comprises mid-to-low hills and hilly areas. Rapid economic development over recent decades has led to surface subsidence issues, making subsidence monitoring, particularly using InSAR technology, a critical research focus. For example, Fan et al. (2019) demonstrated the use of D-InSAR technology to monitor subsidence in Nanchang [28]. Gu et al. (2019) reported no significant deformation in Nanchang’s urban districts from 2014 to 2018, though minor surface deformation was observed near Nanchang West Railway Station and the Shanghai–Kunming High-Speed Railway [29]. Mo et al. (2020) found that the annual average deformation rate in Nanchang’s main urban area ranged from −3 to 3 mm/a between 2016 and 2018 [30]. Gao et al. (2023) used Sentinel-1A data from 2015 to 2021 with the SBAS-InSAR method and reported that while Nanchang City’s surface was generally stable, several significant subsidence funnels were identified [31].
Despite these studies demonstrating the applicability of InSAR technology in monitoring land subsidence in Nanchang, the factors influencing surface deformation remain inconclusive. Nanchang has been undergoing rapid urbanization in recent years, including ongoing infrastructure projects such as metro and bridge construction. It remains unclear whether these activities influence surface deformation, and other potential influencing factors in the study area also warrant further exploration. In this study, we utilized 95 C-band Sentinel-1A images, from September 2018 to May 2023 and applied PS-InSAR methods based on the Sentinel Application Platform (SNAP) and Stanford Method for Persistent Scatterers (StaMPS) to monitor surface deformation in Nanchang. We analyzed the spatial and temporal distribution characteristics of surface deformation in the city, compared the identified subsidence areas with historical images, and referenced previous studies to explore potential factors inducing subsidence.
2. Materials and Methods
2.1. Study Area
Nanchang (115°27′~116°35′, 28°10′~29°11′) is located in the eastern part of China, in the north-central region of Jiangxi Province, downstream of the Ganjiang and Fuhe Rivers, and on the southwestern shore of Poyang Lake. Spanning an area of 7195 km2, it serves as a key central city in the middle and lower reaches of the Yangtze River and a core city in the Poyang Lake Ecological Economic Zone. This study focuses on the main urban area of Nanchang, delineated by the Nanchang Ring Expressway (Figure 1).
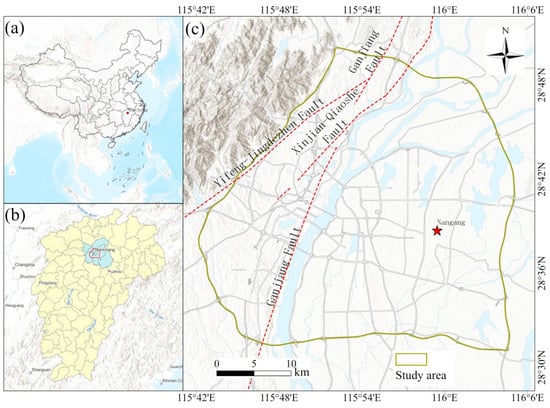
Figure 1.
(a) Map of China, highlighting Nanchang’s location. (b) Map of Jiangxi Province, indicating where Nanchang is situated. (c) Map of Nanchang, showing its geographic features.
The region of Nanchang is predominantly defined by the Poyang Lake Plain, which is geographically divided by the Ganjiang River. The northwest is characterized by tectonic erosion hills and mountainous landforms, while the southeast features river erosion and depositional plains with a dense water network. Nanchang has a subtropical humid climate, with an average annual temperature of 17~17.7 °C. The city receives substantial rainfall, averaging 1600–1700 mm annually (http://baike.baidu.com/item/nanchang, accessed on 2 October 2024). Rainfall from April to June constitutes 51.3% of the annual total, while precipitation from November to January accounts for 9.6% [32].
2.2. Dataset
Sentinel-1 (https://dataspace.copernicus.eu, accessed on 19 September 2024) is an Earth observation satellite from the European Space Agency’s Copernicus Program, also known as the Global Monitoring for Environment and Security (GMES) (https://en.wikipedia.org/wiki/Copernicus_Programme, accessed on 19 September 2024), launched on 3 April 2014. The mission comprises two satellites equipped with C-band Synthetic Aperture Radar (SAR) and features a 12-day revisit period. Sentinel-1 supports four imaging modes and various polarization modes, providing all-weather, day-and-night radar imagery for land and ocean applications. In this study, 95 Sentinel-1A Single Look Complex (SLC) images, captured between September 2018 and May 2023, were utilized. The selected images were acquired from ascending orbits in VV + VH polarization and interferometric wide swath mode, with VV polarization data used for analysis. The spatial resolution of these images is 5 m (range) by 20 m (azimuth). These images were used to obtain surface deformation information for the study area. The relevant parameters are summarized in Table 1.

Table 1.
Parameters of Sentinel-1A data.
The Precise Orbit Determination (POD) data provided by the European Space Agency (ESA) are utilized for orbit correction. These data represent the most accurate orbit information available but become accessible only 21 days after the Global Navigation Satellite System (GNSS) downlink. Each file covers 26 h (24 h of the day plus one hour before and after) and achieves a positioning accuracy of better than 5 cm. Additionally, the Shuttle Radar Topography Mission 1 (SRTM1) data, with a 30 m resolution, jointly produced by the National Aeronautics and Space Administration (NASA) and the National Imagery and Mapping Agency (NIMA), is employed to remove the topographic phase, enhancing the reliability of the measurement results.
The Generic Atmospheric Correction Online Service for InSAR (GACOS) data are utilized for atmospheric phase removal. GACOS uses the Iterative Tropospheric Decomposition (ITD) model [33,34,35] to separate the stratified and turbulent signals from the total tropospheric delay, generating high spatial resolution zenith total delay maps for correcting InSAR measurements and other applications.
2.3. PS-InSAR and Data Processing
2.3.1. PS InSAR Technique
In 2000, Ferretti et al. (2001) introduced the Permanent Scatterers InSAR (PS-InSAR) technique, which identifies pixels minimally affected by decorrelation in long-term interferometric images [13]. Using stable phase information from these points, a deformation model can be constructed to eliminate error phases and calculate deformation in the monitored area. Hooper et al. (2007) further improved the PS-InSAR technique and proposed the StaMPS method [36]. This method selects PS points based on an amplitude deviation threshold, ensuring reduced susceptibility to temporal and spatial decorrelation [37]. It also effectively mitigates atmospheric effects, making it well suited for urban areas with numerous artificial structures.
Using N + 1 images covering the study area, the optimal master image is selected considering temporal and spatial baselines as well as Doppler centroid frequency differences. The remaining images are used as slave images. All slave images are co-registered with the master image and processed for interferometry using an external DEM to remove the topographic phase, producing N differential interferograms. Figure 2 illustrates the technical workflow of the PS-InSAR process.
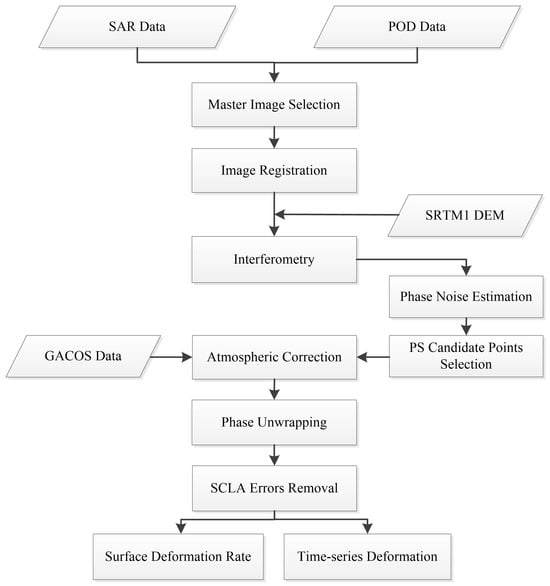
Figure 2.
PS-InSAR technical workflow.
When selecting PS points, the amplitude deviation index proposed by Ferretti et al. (2001) is used [13]. This index is employed to evaluate the phase noise level of the pixels.
where and represent the standard deviation and mean of the amplitude of the N interferograms, respectively. An amplitude threshold is set, and when is below this threshold, the point is selected as a PS candidate. The interferometric phase for each pixel in the differential interferogram is given by
where represents the interferometric phase, denotes the residual topographic phase, indicates the deformation phase, refers to the orbital error phase, is the atmospheric phase, represents the noise phase, and denotes phase wrapping. The selected PS points are then analyzed for phase stability based on the temporal correlation of the phases to filter out the optimal PS points. Temporal correlation can be expressed as follows:
where represents the number of interferograms, is the phase of the target at point x in the i-th interferogram after the removal of the flat-earth phase and topographic phase correction, denotes the average value of , and represents the estimated value of the residual phase.
After the PS points are selected, their noise standard deviation is calculated, and spatially uncorrelated geometric errors in the wrapped phase are removed. The GACOS atmospheric data are then applied to correct for atmospheric errors. Subsequently, the wrapped phase of the PS points is unwrapped. Finally, atmospheric, orbital, and other spatially correlated errors are eliminated from the unwrapped phase to derive the temporal deformation results.
2.3.2. SNAP-StaMPS Data Processing
The data processing for surface deformation monitoring involves the use of ESA’s SNAP software (https://step.esa.int, version SNAP 9.0.0, accessed on 17 July 2024) for data preprocessing and interferometric processing of SAR images, and StaMPS software (https://github.com/dbekaert/StaMPS, version StaMPS/MTI 4.0b6, Beta version, June 2018, accessed on 19 September 2024) for time-series analysis of the interferometric results. Figure 3 presents the generated spatiotemporal baseline map.
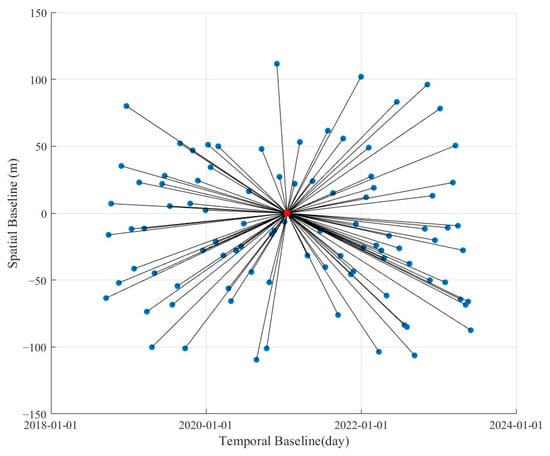
Figure 3.
Temporal and spatial baseline diagram, with the central image being the master image and the others being the slave images.
The preprocessing of SAR data in SNAP software involves seven steps: (1) segmentation, (2) orbit correction, (3) image registration, (4) spectral diversity enhancement [38], (5) stripping removal, (6) clipping, and (7) interferogram generation.
The time-series analysis using StaMPS software includes the following steps: (1) Selection of PS Candidate Points: An amplitude deviation threshold of 0.4 is applied to extract candidate PS points. (2) Removal of Spatially Uncorrelated Look Angle Errors and Atmospheric Phase Errors: The noise standard deviation of each interferogram is calculated and used as a weight to remove spatially uncorrelated look angle errors from the wrapped phase of selected PS pixels. Atmospheric correction is performed using GACOS data to eliminate atmospheric delay phases. (3) Phase Unwrapping: The wrapped phase of selected PS pixels is unwrapped using a 3D unwrapping method. (4) Error Phase Removal: Spatially correlated look angle error phases are removed. The atmospheric phase and orbit error phases of the master image are estimated and removed. A second phase unwrapping is performed to remove additional spatially correlated errors from the unwrapped results. This process produces the deformation phases of the study area over the monitoring period, ultimately generating the time-series InSAR deformation results. For detailed operations and parameters used in the time-series analysis, refer to the StaMPS manual (https://github.com/dbekaert/StaMPS/blob/master/Manual/StaMPS_Manual.pdf, accessed on 19 September 2024).
3. Results
This study used the PS-InSAR technique to obtain surface subsidence information in the satellite line-of-sight (LOS) direction in Nanchang City from September 2018 to May 2023 (Figure 4). Positive values indicate movement toward the satellite (uplift), while negative values indicate movement away from the satellite (subsidence). Figure 4 presents the distribution statistics of subsidence rates for all PS points. A total of 722,047 PS points were obtained, with deformation rates in the urban area of Nanchang in the range of [−10, 6] mm/a. Among these, 98.7% of the rates fall within the range of −3 to 3 mm/a, indicating stability across most of the study area. These results are consistent with actual conditions. However, significant subsidence is observed in certain regions, primarily along the Ganjiang River and its downstream areas. In the southern part of the city, subsidence is concentrated along both banks of the Ganjiang River in Xihu District and Honggutan District. In the northern part, subsidence is primarily located near Yangzizhou and its downstream areas.
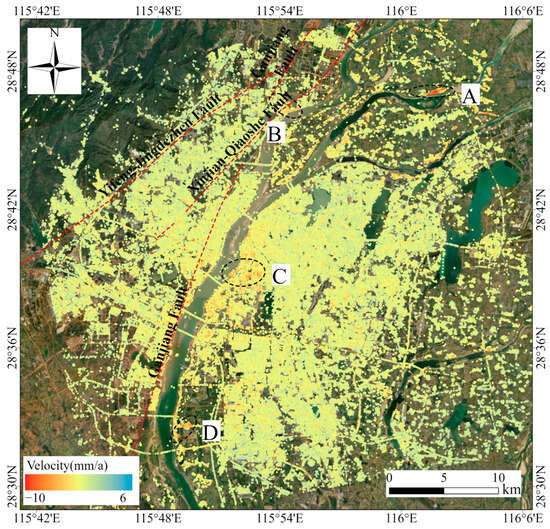
Figure 4.
Surface deformation rate map of Nanchang City along the satellite line of sight from 2018 to 2023. Area A is located in Zhongxu Village, Nanchang County; Area B is situated along the shoreline of Xiazhuang Lake in Xinjian District; Area C is located Along Jiangzhong Avenue in Xihu District and at Sunshine Lighting Plaza; Area D is near the Shiqi Resettlement Housing in Nanchang County.
Based on the analysis of the annual average deformation rate map of Nanchang, four subsidence zones were identified within the study area. Four subsidence zones were identified within the study area: Zhongxu Village in Nanchang County (Zone A), Xiazhuang Lake in Xinjian District (Zone B), Along Jiangzhong Avenue and Sunshine Lighting Plaza in Xihu District (Zone C), and Shiqi Resettlement Housing in Nanchang County (Zone D). The specific locations are shown in Figure 4. A time-series analysis was conducted for these zones to examine subsidence characteristics, focusing on points with an annual deformation rate of ≥5 mm/a. Since 99.9% of the deformation points have rates within the range of −5 to 5 mm/a, the study area is generally considered stable. However, points with subsidence rates of ≥5 mm/a are rare and were selected for detailed analysis due to their potential association with geological hazards or engineering risks. This targeted analysis aims to identify the impacts of natural factors (e.g., soil compaction) and human activities (e.g., excessive groundwater extraction and construction). The findings provide a scientific basis for geological hazard risk assessment, engineering safety monitoring, and environmental management.
3.1. Reliability Assessment
Based on the research results, no significant surface deformation phenomena were observed in the urban area of Nanchang. To estimate the accuracy of the obtained subsidence rates, we calculated the mean and standard deviation of the results. The standard deviation of the deformation rate at the monitoring points can be used to assess the accuracy of the deformation results [39]. The relevant formula is as follows:
where represents the mean deformation rate of all the monitoring points, is the number of monitoring points, is the deformation rate of point , and is the standard deviation of the deformation rate for all the monitoring points. The deformation rate distribution of the monitoring points is shown in Figure 5. The mean deformation rate of the monitoring points is 0 mm/a, with a standard deviation of 0.93 mm/a. After calculation, the deformation rate results for Nanchang’s urban area do not follow a normal distribution. The subsidence rate of surface deformation may be influenced by various factors such as geological structure, groundwater level changes, and human activities, which can cause the data distribution of subsidence rates to deviate from normality. We read the relevant literature and found that Mo et al. (2020) applied PS-InSAR and SBAS-InSAR methods to derive surface deformation results for Nanchang between January 2016 and July 2018, with annual deformation rates concentrated within the range of [−3, 3] mm/a [30]. Gao et al. (2023) used Sentinel-1 data from 2015 to 2021 and the SBAS-InSAR method and concluded that Nanchang’s ground surface was generally stable, with 98.5% of observation points showing deformation rates below 2 mm/a. Excluding a few points, their subsidence rates primarily ranged from [−5, 5] mm/a [31]. Similarly, our results indicate that 99.9% of the subsidence rates also fall within the range of [−5, 5] mm/a. While he reported a standard deviation of 0.53 mm/a for their observation points, our study yielded a slightly higher standard deviation of 0.93 mm/a, showing only minor differences between the two datasets. Although publicly accessible GNSS and leveling data were unavailable for verifying actual surface deformation errors, the standard deviation of our results and their consistency with previous studies indicate that the findings are reasonable and suggest that the surface in the study area is relatively stable.
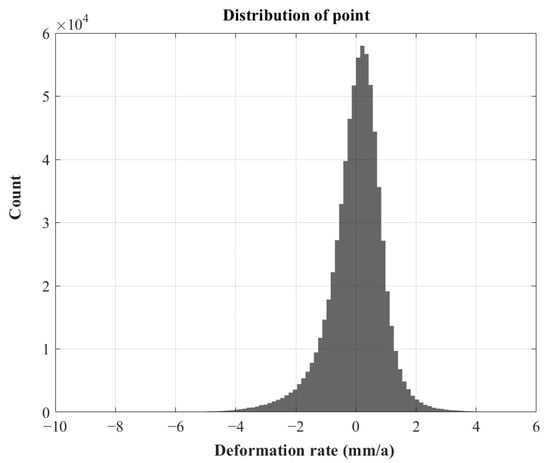
Figure 5.
Surface deformation rate distribution.
3.2. Surface Deformation Analysis Along the Ganjiang River
The left image in Figure 6 shows Region A, located in Zhongxu Village, Nanchang County, in the northeastern part of Nanchang City, on the lower alluvial plain of the Ganjiang River. To the south of the village, across the road, lies the sedimentary mudflat of a Ganjiang tributary. PS points in this area are primarily distributed over village buildings. Time-series results indicate that, during the early monitoring stages, all three subsidence points exhibited a slight uplift. However, starting in July 2019, the points began to subside more rapidly. On 27 April 2020, and 26 June 2020, significant changes were observed, with the maximum cumulative subsidence at point P2 reaching 47.1 mm and cumulative subsidence at points P1 and P3 exceeding 30 mm. The phase unwrapping results suggest that these two images may have been affected by noise, which in turn impacted the subsidence results. However, remote sensing imagery from 27 April 2020 shows no significant changes in housing construction, while fluctuations in the extent of the nearby sedimentary mudflat were attributed to seasonal variations and rainfall. We hypothesize that subsidence in Region A may be related to the loose characteristics of the underground soil layers and precipitation.
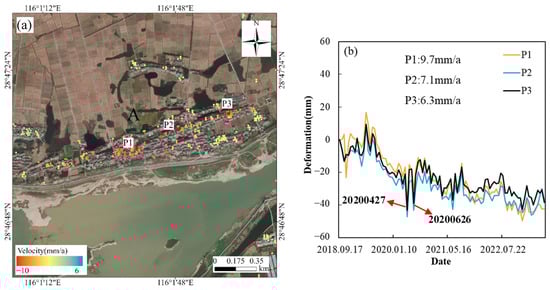
Figure 6.
Left (a) is the distribution map of Area A, and right (b) is the time-series subsidence line chart of three points in Area A.
Region B, located along the shore of Xiazhuang Lake in Xinjian District, exhibits higher subsidence rates primarily distributed along the western and southern roads of the lake (Figure 7). The maximum subsidence rate in this area is 5.8 mm/a. Figure 7b presents the time-series deformation of three monitoring points in Region B. Point P4, located on County Road Y227 on the western shore of Xiazhuang Lake, has an annual subsidence rate of 5.8 mm/a, with a maximum cumulative subsidence of 27.9 mm recorded in July 2022. Points P5 and P6, situated on the southern road of Xiazhuang Lake, have annual subsidence rates of 5.7 mm/a and 5.4 mm/a, respectively. The Huihua Industrial Company near Point P6 also exhibits some subsidence points (marked as 2 in Figure 8a–c). The subsidence rates of P5 and P6 were significantly higher between 2018 and 2021 but slowed during 2022 and 2023. Additionally, subsidence points are observed near Baojie Machinery Company and Aonong Huazhong Technology Park (marked as 1 in Figure 8a–c), with rates ranging from 3 to 4 mm/a. The Aonong Central China Science and Technology Park began construction in September 2016 and was completed in 2018, while the Baojie Machinery Company was completed in 2017. Remote sensing images in Figure 8a–c reveal that this area originally consisted of small lakes, which were later filled in for construction. The excavation and backfilling of soil layers may have contributed to minor surface deformation.
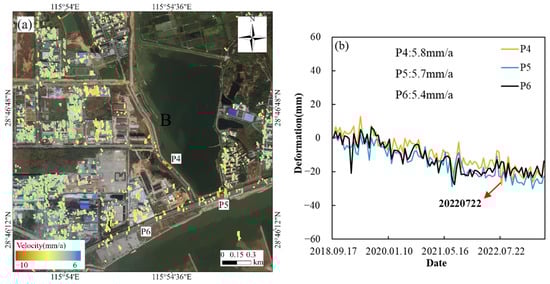
Figure 7.
Left (a) is the distribution map of Area B, and right (b) is the time-series subsidence line chart of three points in Area B.
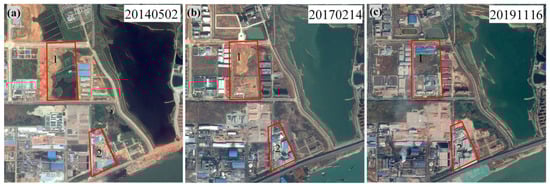
Figure 8.
(a–c) show the Google Earth images of Region B. (a) represents 2 May 2014, (b) represents 14 February 2017, and (c) represents 16 November 2019. Label 1 indicates the location of Baojie Machinery Company and Aonong Central China Science and Technology Park, Label 2 represents the location of Huihua Industrial Company.
Region C is located along the Binjiang Walkway on Jiangzhong Avenue in Donghu District, Nanchang City, on the eastern bank of the Ganjiang River (Figure 9). The subsidence area is primarily distributed Along Jiangzhong Avenue and nearby residential communities along the Ganjiang River. Point P7, situated at the Sunshine Lighting Plaza in Xihu District, has an annual subsidence rate of 6.8 mm/a. During the monitoring period, the subsidence rate from 2018 to 2021 was higher compared to 2022 and 2023, when the area remained relatively stable. Subsidence points P8 and P9 are located in Chaoyang Jiangtan Park. According to project reports, the park was completed in September 2020. Remote sensing imagery shows that the Oupengwan project, situated on the east side of Jiangzhong Avenue (highlighted in Figure 10a–c), began construction in 2020 and was largely completed by August 2022. Nearby streets may have been affected by the development of the park and the project. Apart from sudden rapid subsidence at P8 in October 2018 and October 2019, the subsidence trends at P8 and P9 were generally consistent. The subsidence rate of P8 was 6 mm/a, slightly higher than that of P9, which was 5 mm/a.
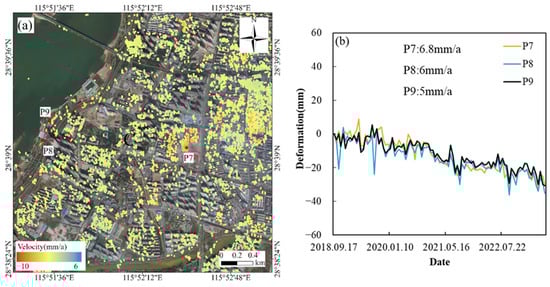
Figure 9.
Left (a) is the distribution map of Area C, and right (b) is the time-series subsidence line chart of three points in Area C.
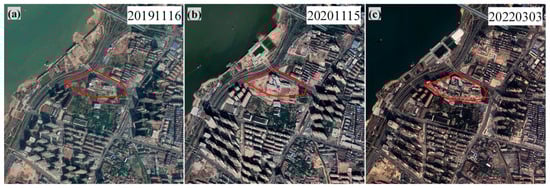
Figure 10.
(a–c) show the Google Earth images of Region C. (a) represents 16 November 2019, (b) represents 15 November 2020, and (c) represents 3 March 2022. The red polygon indicates the location of the Oupengwan project.
Region D is located near the Shiqi Resettlement Housing in Dongxin Township, where most subsidence points are concentrated around residential buildings (Figure 11). Field observations reveal cracks on Fushan Avenue, south of points P11 and P12. Prior to construction, this area was farmland, with P11 situated in a low-lying area characterized by high soil compressibility. The construction of houses in this region may have contributed to minor surface subsidence. The Shijing-jiangshang residential area, located north of P11 (marked as 1 in Figure 12a–c), commenced construction in 2018. Significant subsidence was observed at the three monitoring points in Figure 11 during July 2019 and August 2021, with P10 accumulating a total subsidence of 40 mm by August 2021. On the eastern and southern sides of the building at P10 (marked as 3 in Figure 12a–c), substantial subsidence was detected, with a maximum rate of 7 mm/a. This area originally contained a lake that was filled with soil prior to construction. The severe subsidence observed in this region aligns with the location of the former lake, suggesting that the subsidence was caused by the compression of the filled soil and the construction of buildings.
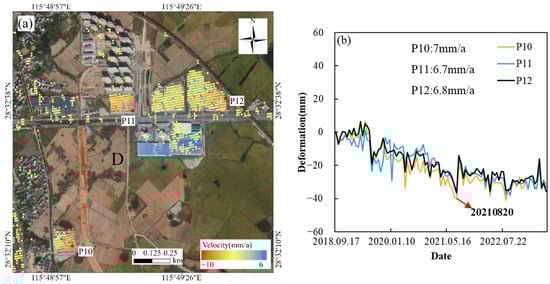
Figure 11.
Left (a) is the distribution map of Area D, and right (b) is the time-series subsidence line chart of three points in Area D.
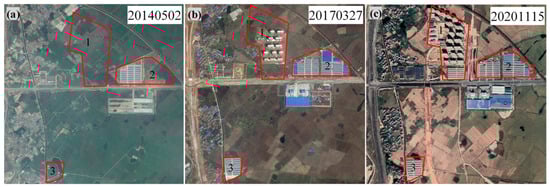
Figure 12.
(a–c) show the Google Earth images of Region D. (a) represents 2 May 2014, (b) represents 27 March 2017, and (c) represents 15 November 2020. Labels 1, 2, and 3 mark the areas of subsidence corresponding to the three points in Region D.
4. Discussion
This study monitored surface deformation in the main urban area of Nanchang from September 2018 to May 2023, producing the results discussed above. Surface deformation is generally influenced by multiple factors. The following analysis examines geological conditions, precipitation, and groundwater level changes, compares the findings with previous studies, and addresses potential uncertainties.
4.1. Causes of Surface Deformation
Nanchang is located in the alluvial plain of the Gan River’s lower reaches, featuring a general elevation gradient from northwest to southeast, transitioning from low mountains and hills to undulating terrain and flat plains. This region displays a layered geomorphological feature. The Gan River acts as a geographical boundary, with the northern area characterized by tectonic erosion and low hills, and the eastern area consisting of river-eroded and accumulated plains [40]. Geologically, the main faults in the Nanchang area include the Yifeng–Jingdezhen Fault, the Xinjian–Qiaoshe Fault, and the Ganjiang Fault. No historical records of destructive earthquakes exist for this region, and no significant surface deformation related to fault zones has been observed in recent years. Subsidence Region B is located along the Xinjian–Qiaoshe Fault Zone; however, the subsidence points in this area are primarily distributed along roads, lakeside paths, and industrial buildings, indicating that the fault zone is not the primary cause of subsidence. As shown in Figure 4, subsidence is evident along the Ganjiang River in Honggutan District, with points near the National Fitness Center metro station and west of the Nanchang Ping An Financial Center exhibiting annual rates of 3–5 mm/a. In recent years, Honggutan District has experienced extensive urban development. For example, the Mingyuan Center project, located adjacent to the National Fitness Center metro station, was completed in 2022, while the Nanchang Ping An Financial Center and Jiangshui Yunzhu projects to the north began construction in September 2021 and 2022, respectively. The Ping An Financial Center, with an estimated height of 375 m, required a deep foundation, and the extensive soil excavation may have affected the stability of surrounding roads. Furthermore, except for Region A, subsidence in the other three regions is closely associated with building construction and infrastructure development. Artificial fill is widely distributed across Nanchang’s urban areas. The main locations of artificial fill are in Honggutan New District, the old city area, and the low-lying areas surrounding Qingshan Lake, Xianshi Lake, and Aixi Lake. These fills consist of materials such as household, construction, and industrial waste, along with clay, gravel, and fine sand [41]. Artificial fill is a highly compressible soil layer, and the minor surface deformation along the Ganjiang River in Honggutan District may be influenced by the compaction of these soil layers.
We obtained a spatial distribution map of soil types in the Nanchang area (https://www.resdc.cn, accessed on 1 January 2025) (Figure 13), identifying four primary soil categories: Entisols, Semi-hydromorphic Soils, Anthropogenic Soils, and Ferric-Alumina Soils. Other areas are classified as urban zones, lakes and reservoirs, rivers, sandbars, and islands. Semi-hydromorphic Soils refer to soils with moisture conditions between wet and dry, primarily distributed along the Gan River and at its confluence with Poyang Lake, predominantly comprising tidal soils and wet tidal soils. Anthropogenic Soils, formed under the direct or indirect influence of human activities such as land reclamation, construction, mining, and agriculture, exhibit unique characteristics compared to natural soils. These soils often contain mixed materials such as artificial fill, construction debris, or other foreign substances. These soils are the most extensive in Nanchang, predominantly found in urban and rural areas, with paddy soils being the dominant subtype. Ferric-Alumina Soils, rich in iron (Fe) and aluminum (Al), are primarily located in the Meiling area and Jinxian County, with red soils as the main subtype. Entisols, representing the initial stages of soil development, are mainly distributed in the southwestern part of Nanchang’s urban area and account for a smaller proportion.
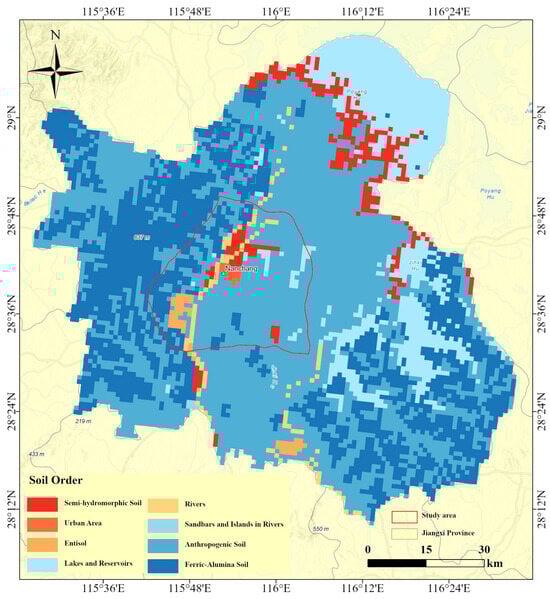
Figure 13.
Spatial distribution map of soil types in the Nanchang area.
Our study reveals that surface deformation regions are primarily distributed along the Gan River, predominantly on Semi-hydromorphic Soils and Anthropogenic Soils. Semi-hydromorphic Soils, typically found in humid lowlands, have a high clay content, making them highly compressible. Their rich moisture content and high porosity make them prone to seasonal water level fluctuations, resulting in subsidence and compaction. As highlighted in Zhang’s study, artificial fill is extensively distributed across Nanchang’s urban areas, particularly in low-lying zones such as the Honggutan New District, the old city area, and the vicinities of Qingshan Lake, Xianshi Lake, and Aixi Lake. These fills comprise materials such as household waste, construction debris, industrial residues, clay gravel, and fine sand. In the Chaoyang Farm–Shierzhong area, the artificial fill thickness typically ranges from 3.0 to 5.0 m, while in areas such as the old city sections on both sides of the Laofu River, Bayi Bridge, and the Honggutan New District, the fill thickness generally exceeds 5.0 m. Due to their recent deposition, heterogeneous composition, and high compressibility, these fills are highly susceptible to deformation [41]. Our results indicate that Region C lies within the Chaoyang Farm–Shierzhong area, while minor surface deformation is also observed along the Gan River in Honggutan New District. This suggests that the observed surface deformation may be related to the artificial fill in these areas. The compressibility of Anthropogenic Soils is influenced by factors such as composition, moisture content, particle structure, and external pressure, and is primarily determined by the characteristics of the fill materials. Therefore, we infer that surface deformation in the study area is likely caused by urban construction activities and the compaction of Semi-hydromorphic Soils and Anthropogenic Soils.
4.2. Precipitation and Groundwater Level Changes
Rainfall may also influence surface deformation in the urban areas of Nanchang City. To examine the relationship between surface deformation and rainfall, GPM monthly cumulative precipitation data from September 2018 to May 2023 were analyzed for the four regions (https://disc.gsfc.nasa.gov, accessed on 1 January 2025). Figure 14 illustrates the correlation between typical deformation regions and monthly cumulative precipitation, with panels (a) to (d) corresponding to Regions A to D, respectively. The figure indicates that rainfall in Nanchang City is primarily concentrated between March and June, while winter months experience significantly less precipitation. The results suggest that surface deformation in Region A is somewhat influenced by rainfall. For example, during August to November 2019, lower precipitation coincided with an accelerated deformation rate. This phenomenon was also observed during the winter seasons of 2020 to 2022. Conversely, months with higher rainfall were associated with ground uplift. These patterns are particularly evident in Region A but are less pronounced in Regions B, C, and D, suggesting that the influence of rainfall on surface deformation may be incidental. Compared to the other regions, Region A, located furthest downstream along the Ganjiang River, appears to be more geographically susceptible to the effects of rainfall.
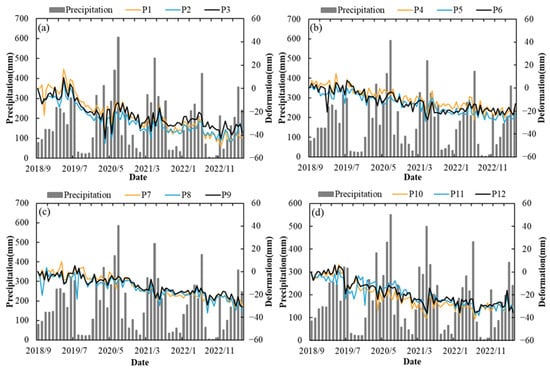
Figure 14.
(a–d) Relationship between subsidence at various points and monthly cumulative precipitation. (a) subsidence-precipitation relationship in Region A, (b) subsidence-precipitation relationship in Region B, (c) subsidence-precipitation relationship in Region C, (d) subsidence-precipitation relationship in Region D.
Additionally, due to the long-term over-extraction of groundwater, Nanchang experienced a regional subsidence funnel centered around intensive pumping wells in the mid-1960s. The groundwater subsidence in the study area initially formed three major central funnels: Jiangfang, Hongdu, and Ammonia Plant, with the current major funnel centered around Nanchang Steel [42]. This subsidence is primarily attributed to large-scale groundwater extraction by Jiangmen Ammonia Company (Jiangmen, China) and Fangda Special Steel Technology Co., Ltd. (Nanchang, China), combined with groundwater extraction from village wells near Nanchang Steel and Youlan Interchange [32]. However, our study did not detect significant surface deformation near Nanchang Steel, likely due to the government’s enhanced groundwater management efforts, including groundwater recharge and regulated extraction.
Rainfall directly influences groundwater levels. Monthly average groundwater depth data for the Poyang Lake Plain region, spanning from July 2020 to May 2023 (data prior to July 2020 are unavailable), were obtained from the Ministry of Water Resources’ Groundwater Dynamics Monthly Report. Groundwater depth is defined as the vertical distance from the groundwater surface to the ground. Figure 15a–d illustrate the correlation between rainfall and groundwater depth in Regions A, B, C, and D, respectively. As shown in the figure, the variation in average groundwater depth follows a ‘wave-like’ pattern, with shallower depths in summer and deeper depths in winter. This pattern reflects the seasonal changes in the Poyang Lake Plain region, where groundwater levels rise during the wet summer season and decline during the dry winter season. The figure also indicates that changes in groundwater depth are directly affected by rainfall: increased rainfall results in shallower groundwater depths, while reduced rainfall leads to deeper depths. Additionally, there is a noticeable lag in the response of groundwater depth changes to rainfall variations. An analysis of subsidence and rainfall data for Region A shows that subsidence variations align with changes in average groundwater depth, indicating a positive correlation. However, such a relationship does not exist in Regions B, C, and D. These findings suggest that surface deformation in certain areas may be influenced by rainfall and is consistent with trends in groundwater level changes.
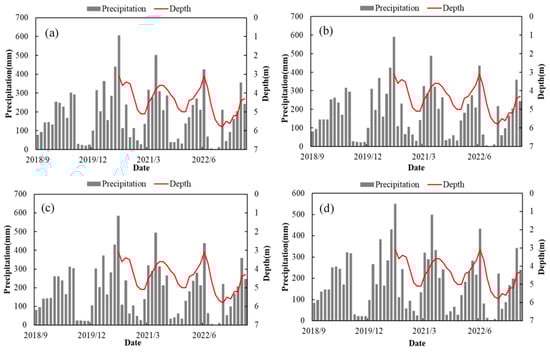
Figure 15.
(a–d) Relationship between precipitation in four regions and the average depth to groundwater in the Poyang Lake Plain. (a) precipitation-groundwater depth relationship in Region A, (b) precipitation-groundwater depth relationship in Region B, (c) precipitation-groundwater depth relationship in Region C, (d) precipitation-groundwater depth relationship in Region D.
4.3. The Relationship Between Subsidence and the Water Level of Poyang Lake
The study area is located in the southwest of Poyang Lake, a seasonal lake whose water level fluctuates between flood and dry periods. To explore the relationship between Poyang Lake’s water level and subsidence data, we used water level data from the Xingzi station on Poyang Lake, which overlaps with the monitoring period of this study (September 2018 to May 2023, with missing data for 2019). Figure 16 illustrates the relationship between the water level at Xingzi station and the subsidence data we obtained, with (a) to (d) corresponding to regions A to D, respectively. As shown in panel (a), the subsidence trends at three points generally align with water level trends: when the water level rises, uplift occurs at the monitoring points, and when the water level drops, subsidence is observed. However, in panels (b) and (d), only a few specific time points seem to correlate with water level changes. For the majority of the time, the subsidence data show no significant relationship with the water level. Figure (c) also shows no apparent correlation between the two. We further analyzed the relationship between precipitation and water level data, finding a positive correlation between the Poyang Lake water level and precipitation, which suggests that groundwater level changes follow a similar trend to the variations in the lake’s water level. In the earlier analysis, we noted that surface deformation in Region A is more sensitive to precipitation. Additionally, we observed a strong relationship between surface deformation and the water level in this area, which may be attributed to its geographic proximity to Poyang Lake.
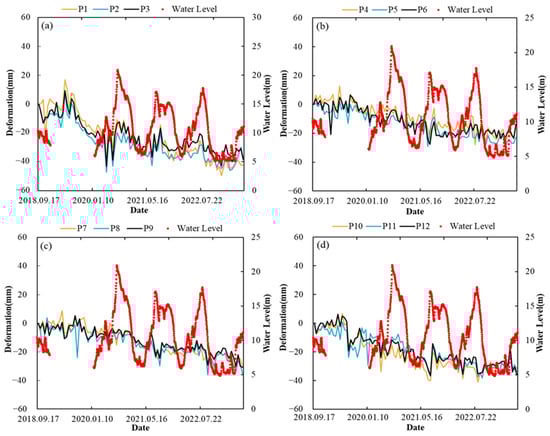
Figure 16.
(a–d) Relationship between water level of Xingzi Station and the subsidence at various points. (a) subsidence-water level relationship in Region A, (b) subsidence- water level relationship in Region B, (c) subsidence- water level relationship in Region C, (d) subsidence- water level relationship in Region D.
4.4. Comparison with Previous Studies
This study utilized 95 Sentinel-1A images covering the period from September 2018 to May 2023 and employed the PS-InSAR method to monitor surface deformation in Nanchang. The results reveal that the surface deformation rate in the urban area of Nanchang is in the range of [−10, 6] mm/a, with the majority of regions remaining relatively stable within the range of [−3, 3] mm/a. Our findings show that the locations of P8 in subsidence area C align closely with the geographic locations of region B reported by Gao et al. (2023) [31]. Furthermore, about 98.7% of our PS points fall within a deformation rate of [−3, 3] mm/a, suggesting the reliability of our results. Xiong et al. (2021) observed that from 2018 to 2020, the surface in Nanchang was overall stable, with approximately 94% of monitoring points having an annual subsidence rate within [−5, 5] mm/a [43]. Our study shows that 99.9% of monitoring points fall within this range, suggesting that surface stability in Nanchang has slightly improved from 2018 to 2023 compared to previous years. Hu et al. (2022) found that surface deformation is influenced by precipitation, with areas experiencing greater deformation being more sensitive to changes in precipitation [44]. In our study, surface deformation in Region A was found to be negatively correlated with precipitation. Additionally, time-series data for each monitoring point provided a clearer illustration of this relationship, compared to the use of averaged time-series data. However, such a correlation does not exist in Regions B, C, and D. Xia et al. (2020) found that rainfall is highly sensitive to the occurrence of land subsidence, with the magnitude of deformation exhibiting a positive correlation with rainfall [45]. This correlation may be linked to the selected monitoring sites, which were primarily located in forested and mountainous areas where surface deformation is more likely to be positively influenced by precipitation.
4.5. Uncertainties
The spatial resolution of Sentinel-1 data is lower compared to higher-resolution satellites, which can lead to errors in the precise identification of Persistent Scatterer (PS) points. The spatial and temporal resolution limitations of InSAR technology may hinder the detection of all surface deformation details, especially for rapidly changing surface activities, where temporal resolution is a particular constraint. Additionally, residual errors persist in the time-series processing even after atmospheric and orbital corrections, which impact the accuracy of deformation measurements [46,47]. Furthermore, during phase unwrapping, areas with low coherence, such as those covered by vegetation or water bodies, increase phase data uncertainty and affect the accuracy of phase unwrapping. Random noise also impacts the accuracy of phase unwrapping, particularly in cases with low signal-to-noise ratios. Moreover, due to the lack of ground-truth GPS and leveling data, the surface deformation results obtained using the PS-InSAR method cannot be validated directly. However, the results are consistent with previous studies within the data range, indicating their reliability. Future research will consider incorporating higher-resolution satellite data and employing more appropriate atmospheric correction methods to further enhance the reliability of the results. We acknowledge that it is difficult to accurately assess real changes on the ground based solely on a few years of research data. Our analysis is only intended to reflect the research results themselves and should be considered as a reference.
Based on the findings of this study, we propose the following recommendations. Our research suggests that urban construction is a primary factor contributing to surface deformation in Nanchang. Therefore, geological conditions and subsidence risks should be thoroughly considered during urban planning and construction. It is essential to adopt rational building designs and construction methods to minimize the impact on surface deformation.
5. Conclusions
This study presents the methods and results of monitoring urban surface deformation in Nanchang, Jiangxi Province, using Sentinel-1A data collected from September 2018 to May 2023. By comparing the findings with previous studies and historical satellite imagery, we confirm the reliability of the PS-InSAR technique for monitoring surface deformation in Nanchang’s central urban area. The results demonstrate that PS-InSAR effectively captures long-term surface deformation trends and reveals the spatial distribution of deformation fields in the study area. Using 95 Sentinel-1 images, we extracted surface deformation data for Nanchang’s urban area. Approximately 99.9% of the monitored points showed deformation rates within the range of [−5, 5] mm/a, indicating overall stability. Four regions exhibited notable surface deformation, primarily located along the Gan River and in areas with recent urban construction activity. A comparison with Google satellite imagery identified three subsidence areas potentially linked to construction activities. We further analyzed the monthly average precipitation and subsidence data in the study area. A negative correlation between precipitation and surface deformation was observed only in Region A, while no significant correlation was found in the other regions. As precipitation affects groundwater levels, we examined groundwater depth data for the Poyang Lake Plain region. The results indicate that higher precipitation leads to shallower groundwater depths, and lower precipitation results in deeper groundwater levels. This suggests that surface deformation in Region A corresponds to fluctuations in groundwater levels, whereas no significant relationship was observed in the other regions. Additionally, water level data from the Poyang Lake Xingzi station revealed that the subsidence trend in Region A closely aligns with the water level trend, likely due to its proximity to Poyang Lake. We conducted a detailed analysis of the spatial distribution of soil types in Nanchang and found that the soil types in areas of surface deformation are primarily Semi-hydromorphic Soils and Anthropogenic Soils. These soils exhibit high compressibility, making them prone to compaction and significantly influencing surface deformation. In recent years, the surface deformation rate in Nanchang’s urban area has remained relatively low, indicating overall stability. This study concludes that localized surface deformation in Nanchang is primarily driven by urban construction activities and the compaction of artificial fill soils, with precipitation also influencing surface deformation in certain areas.
Author Contributions
Conceptualization, M.Z. and J.P.; methodology, M.Z., J.P., and P.M.; software, M.Z.; validation, M.Z.; formal analysis, M.Z., J.P., and P.M.; investigation, M.Z.; resources, J.P.; data curation, M.Z.; writing—original draft preparation, M.Z.; writing—review and editing, J.P.; visualization, M.Z. and J.P.; supervision, J.P.; project administration, J.P.; funding acquisition, J.P. and H.L. All authors have read and agreed to the published version of the manuscript.
Funding
This research was funded by the National Key R&D Program of China (grant number 2021YFB3900400) and the National Natural Science Foundation of China (grant number 42330108).
Data Availability Statement
The data presented in the study are available on request from the first and corresponding author.
Conflicts of Interest
The authors declare no conflicts of interest.
References
- Lyu, M.; Ke, Y.; Guo, L.; Li, X.; Zhu, L.; Gong, H.; Constantinos, C. Change in Regional Land Subsidence in Beijing after South-to-North Water Diversion Project Observed Using Satellite Radar Interferometry. GISci. Remote Sens. 2020, 57, 140–156. [Google Scholar] [CrossRef]
- Yin, Y.; Zhang, Z.; Zhang, K. Land Subsidence and Countermeasures for Its Prevention in China. Chin. J. Geol. Hazard Control 2005, 16, 2729. [Google Scholar]
- Xue, Y.Q. Land Subsidence China and its Problems. Quat. Sci. 2003, 23, 585–593. [Google Scholar]
- Jia, S.M.; Tian, F.; Liu, M.K.; Yang, Y. The Risk Assessment Method and Standard on the Construction Land Subsidence in Beijing Area. Urban Geol. 2012, 7, 7–11. [Google Scholar]
- Chaussard, E.; Amelung, F.; Abidin, H.; Hong, S.-H. Sinking Cities in Indonesia: ALOS PALSAR Detects Rapid Sub-sidence Due to Groundwater and Gas Extraction. Remote Sens. Environ. 2013, 128, 150–161. [Google Scholar] [CrossRef]
- Bui, L.K.; Le, P.V.; Dao, P.D.; Long, N.Q.; Pham, H.V.; Tran, H.H.; Xie, L. Recent Land Deformation Detected by Sentinel-1A InSAR Data (2016–2020) over Hanoi, Vietnam, and the Relationship with Groundwater Level Change. GISci. Remote Sens. 2021, 58, 161–179. [Google Scholar] [CrossRef]
- Le, T.; Chang, C.P.; Nguyen, X.; Yhokha, A. TerraSAR-X Data for High-Precision Land Subsidence Monitoring: A Case Study in the Historical Centre of Hanoi, Vietnam. Remote Sens. 2016, 8, 338. [Google Scholar] [CrossRef]
- Itoh, Y.; Takemura, K.; Ishiyama, T.; Tanaka, Y.; Iwaki, H. Basin Formation at a Contractional Bend of a Large Transcurrent Fault: Plio-Pleistocene Subsidence of the Kobe and Northern Osaka Basins, Japan. Tectonophysics 2000, 321, 327–341. [Google Scholar] [CrossRef]
- Liu, Y.; Wang, G.; Yu, X.; Wang, K. Sentinel-1 InSAR and GPS-Integrated Long-Term and Seasonal Subsidence Monitoring in Houston, Texas, USA. Remote Sens. 2022, 14, 6184. [Google Scholar] [CrossRef]
- Zhang, J.; Gong, L.; Jiang, W. Application of PS InSAR Technology in Long-term Slow Crustal Deformation Monitoring. Int. Seismol. Dyn. 2006, 6, 1–6. [Google Scholar]
- Gabriel, A.K.; Goldstein, R.M.; Zebker, H.A. Mapping Small Elevation Changes over Large Areas: Differential Radar Interferometry. J. Geophys. Res. 1989, 94, 9183–9191. [Google Scholar] [CrossRef]
- Zebker, H.A.; Villasenor, J. Decorrelation in Interferometric Radar Echoes. IEEE Trans. Geosci. Remote Sens. 1992, 30, 950–959. [Google Scholar] [CrossRef]
- Ferretti, A.; Prati, C.; Rocca, F. Permanent Scatterers in SAR Interferometry. IEEE Trans. Geosci. Remote Sens. 2001, 39, 8–20. [Google Scholar] [CrossRef]
- Berardino, P.; Fornaro, G.; Lanari, R.; Sansosti, E. A New Algorithm for Surface Deformation Monitoring Based on Small Baseline Differential SAR Interferograms. IEEE Trans. Geosci. Remote Sens. 2002, 40, 2375–2383. [Google Scholar] [CrossRef]
- Lin, H.; Ma, P.; Wang, W. Urban Infrastructure Health Monitoring with Spaceborne Multi-Temporal Synthetic Aper-ture Radar Interferometry. Acta Geod. Et Cartogr. Sin. 2017, 46, 1421. [Google Scholar]
- Zhu, J.J.; Li, Z.W.; Hu, J. Research Progress and Methods of InSAR for Deformation Monitoring. Acta Ge-Odaetica Et Cartogr. Sin. 2017, 46, 1717. [Google Scholar]
- Mao, W.; Ma, P.; Tang, J. Mapping High Spatial Resolution Ionospheric Total Electron Content by Integrating Time Series InSAR with International Reference Ionosphere Model. ISPRS J. Photogramm. Remote. Sens. 2024, 214, 153–166. [Google Scholar] [CrossRef]
- Wu, J.; Hu, F. Monitoring Ground Subsidence Along the Shanghai Maglev Zone Using TerraSAR-X Images. IEEE Geosci. Remote Sens. Lett. 2017, 14, 117–121. [Google Scholar] [CrossRef]
- Wu, Z.; Yang, S.B.; Ding, Z.F.; Zhang, X.L.; Zhang, B.C.; Lu, L. Two Decades of Settlement of Hong Kong International Airport Measured with Multi-Temporal InSAR. Remote Sens. Environ. Interdiscip. J. 2020, 248, 111976. [Google Scholar] [CrossRef]
- Wu, H.A.; Zhang, Y.H.; Luo, G.F.; Kang, Y.K.; Zhu, Y.M. Monitoring ground subsidence in areas covered by dense vegetation using TerraSAR-X images: A case study of Hangzhou. Int. Arch. Photogramm. Remote Sens. Spat. Inf. Sci. 2016, XLI-B7, 55–59. [Google Scholar] [CrossRef]
- Liu, X.; Zhao, C.; Zhang, Q.; Yang, C.; Zhang, J. Characterizing and Monitoring Ground Settlement of Marine Reclamation Land of Xiamen New Airport, China with Sentinel-1 SAR Datasets. Remote Sens. 2019, 11, 585. [Google Scholar] [CrossRef]
- Colesanti, C.; Ferretti, A.; Novali, F.; Prati, C.; Rocca, F. Sar Monitoring of Progressive and Seasonal Ground Defor-mation Using the Permanent Scatterers Technique. IEEE Trans. Geosci. Remote Sens. 2003, 41, 1685–1701. [Google Scholar] [CrossRef]
- Chaussard, E.; Wdowinski, S.; Cabral-Cano, E.; Amelung, F. Land Subsidence in Central Mexico Detected by ALOS InSAR Time-Series. Remote Sens. Environ. 2014, 140, 94–106. [Google Scholar] [CrossRef]
- Cigna, F.; Tapete, D. Present-Day Land Subsidence Rates, Surface Faulting Hazard and Risk in Mexico City with 2014–2020 Sentinel-1 IW InSAR-ScienceDirect. Remote Sens. Environ. 2021, 253, 112161. [Google Scholar] [CrossRef]
- Tiwari, A.; Dwivedi, R.; Dikshit, O.; Singh, A.K. A Study on Measuring Surface Deformation of the L’Aquila Region Using the StaMPS Technique. Int. J. Remote Sens. 2016, 37, 819–830. [Google Scholar] [CrossRef]
- Foroughnia, F.; Nemati, S.; Maghsoudi, Y.; Perissin, D. An Iterative PS-InSAR Method for the Analysis of Large Spatio-Temporal Baseline Data Stacks for Land Subsidence Estimation. Int. J. Appl. Earth Obs. Geoinf. 2019, 74, 248–258. [Google Scholar] [CrossRef]
- Ma, P.; Wu, Z.; Zhang, Z.; Au, F.T.K. SAR-Transformer-Based Decomposition and Geophysical Interpretation of InSAR Time-Series Deformations for the Hong Kong-Zhuhai-Macao Bridge. Remote Sens. Environ. 2024, 302, 113962. [Google Scholar] [CrossRef]
- Fan, J.L.; Liu, F.P.; Tu, L.P. Study on Surface Deformation Monitoring of Nanchang Based on D-InSAR Technology. Miner. Resour. Geol. 2019, 33, 546. [Google Scholar]
- Gu, H.; Chen, J.; Li, T. Application of PS-InSAR in Surface Deformation Monitoring in Nanchang. Jiangxi Sci. 2019, 37, 49–54. [Google Scholar] [CrossRef]
- Mo, Y.; Zhu, Y.F.; Jiang, L.M. Land Subsidence Monitoring of Nanchang Area Based on Sentinel-1A Using Time Series InSAR Technology. J. Geod. Geodyn. 2020, 40, 270–275. [Google Scholar]
- Gao, H.; Xiong, L.; Chen, J.; Lin, H.; Feng, G. Surface deformation of Nanchang, China 2015–2021 Retrieved via Mul-ti-Temporal InSAR Based on Long- and Short-Time Baseline Net. Remote Sens. 2023, 15, 3253. [Google Scholar] [CrossRef]
- Zheng, F.W.; Liu, X.; Huang, C.; Yuan, Z.H.; Huang, Y.J.; Fang, Z. Hydrogeological Features of Water Supply in City Center of Nanchang City. J. Nanchang Inst. Technol. 2018, 37, 12–16. [Google Scholar]
- Yu, C.; Li, Z.; Penna, N.T.; Crippa, P. Generic Atmospheric Correction Model for Interferometric Synthetic Aperture Radar Observations. J. Geophys. Res. Solid Earth 2018, 123, 9202–9222. [Google Scholar] [CrossRef]
- Yu, C.; Li, Z.; Penna, N.T. Interferometric Synthetic Aperture Radar Atmospheric Correction Using a GPS-Based Iterative Tropospheric Decomposition Model. Remote Sens. Environ. 2018, 204, 109–121. [Google Scholar] [CrossRef]
- Yu, C.; Penna, N.T.; Li, Z. Generation of Real-Time Mode High-Resolution Water Vapor Fields from GPS Observations. J. Geophys. Res. Atmos. 2017, 122, 2008–2025. [Google Scholar] [CrossRef]
- Hooper, A.; Segall, P.; Zebker, H. Persistent Scatterer Interferometric Synthetic Aperture Radar for Crustal Deformation Analysis, with Application to Volcán Alcedo, Galápagos. J. Geophys. Res. Solid Earth 2007, 112, B7. [Google Scholar] [CrossRef]
- Li, D.R. Progress of Permanent Scatterer Interferometry. Editor. Board Geomat. Inf. Sci. Wuhan Univ. 2004, 29, 664–668. [Google Scholar]
- Yagüe-Martínez, N.; Prats-Iraola, P.; Gonzalez, F.R.; Brcic, R.; Shau, R.; Geudtner, D.; Eineder, M.; Bamler, R. Interferometric Processing of Sentinel-1 TOPS Data. IEEE Trans. Geosci. Remote Sens. 2016, 54, 2220–2234. [Google Scholar] [CrossRef]
- Dong, S.; Samsonov, S.; Yin, H.; Ye, S.; Cao, Y. Time-Series Analysis of Subsidence Associated with Rapid Urbanization in Shanghai, China Measured with SBAS InSAR Method. Environ. Earth Sci. 2014, 72, 677–691. [Google Scholar]
- Du, H.; Chen, H.; Cao, B. Higher Education Test Materials: Geomorphology and Quaternary Geology; Geological Publishing House: Beijing, China, 1981. [Google Scholar]
- Zhang, Y.Z.; Li, Y.M.; Yang, Y.G.; Wang, D.Y. Quality Evaluation on Geological Environment for the Construction Land in Nanchang, Jiangxi Province. Geol. Surv. Res. 2007, 30, 62–69. [Google Scholar]
- Lan, Y.Y.; Chen, J.M.; Wang, J.X.; Wu, W.J.; Wang, T. Analysis of Dynamic Characteristics and Influencing Factors of Groundwater in Nanchang City. J. Nanchang Inst. Technol. 2017, 36, 32–36. [Google Scholar]
- Xiong, J.; Xiao, R.; He, X. Land Surface Deformation in Nanchang, China 2018–2020 Revealed by Multi-Temporal InSAR. Nat. Hazards Res. 2021, 1, 187–195. [Google Scholar] [CrossRef]
- Hu, B.; Chen, B.; Na, J.; Yao, J.; Zhang, Z.; Du, X. Urban Surface Deformation Management: Assessing Dangerous Subsidence Areas through Regional Surface Deformation, Natural Factors, and Human Activities. Sustainability 2022, 14, 10487. [Google Scholar] [CrossRef]
- Xia, Y.; Chen, Z.; Zhang, Y. InSAR Monitoring of Land Subsidence and Analysis of Influencing Factors in Nanchang City. Sci. Surv. Mapp. 2020, 45, 115–122. [Google Scholar]
- Zebker, H. Accuracy of a Model-Free Algorithm for Temporal Insar Tropospheric Correction. Remote Sens. 2021, 13, 409. [Google Scholar] [CrossRef]
- Hu, H.; Fu, H.; Zhu, J.; Liu, Z.; Wu, K.; Zeng, D.; Wan, A.; Wang, F. Automatic Correction of Time-Varying Orbit Errors for Single-Baseline Single-Polarization InSAR Data Based on Block Adjustment Model. Remote Sens. 2024, 16, 3578. [Google Scholar] [CrossRef]
Disclaimer/Publisher’s Note: The statements, opinions and data contained in all publications are solely those of the individual author(s) and contributor(s) and not of MDPI and/or the editor(s). MDPI and/or the editor(s) disclaim responsibility for any injury to people or property resulting from any ideas, methods, instructions or products referred to in the content. |
© 2025 by the authors. Licensee MDPI, Basel, Switzerland. This article is an open access article distributed under the terms and conditions of the Creative Commons Attribution (CC BY) license (https://creativecommons.org/licenses/by/4.0/).