Article

Confidence-Aware Ship Classification Using Contour Features in SAR Images

by
Al Adil Al Hinai
and
Raffaella Guida
*
Surrey Space Centre, University of Surrey, Guildford GU2 7XH, UK
*
Author to whom correspondence should be addressed.
Remote Sens. 2025, 17(1), 127; https://doi.org/10.3390/rs17010127
Submission received: 22 September 2024 / Revised: 28 December 2024 / Accepted: 31 December 2024 / Published: 2 January 2025

Abstract

:
In this paper, a novel set of 13 handcrafted features derived from the contours of ships in synthetic aperture radar (SAR) images is introduced for ship classification. Additionally, the information entropy is presented as a valuable metric for quantifying the confidence (or uncertainty) associated with classification predictions. Two segmentation methods for the contour extraction were investigated: a classical approach using the watershed algorithm and a U-Net architecture. The features were tested using a support vector machine (SVM) on the OpenSARShip and FUSAR-Ship datasets, demonstrating improved results compared to existing handcrafted features in the literature. Alongside the SVM, a random forest (RF) and a Gaussian process classifier (GPC) were used to examine the effect of entropy derivation from different classifiers while assessing feature robustness. The results show that when aggregating predictions of an ensemble, techniques such as entropy-weighted averaging are shown to produce higher accuracies than methods like majority voting. It is also found that the aggregation of individual entropies within an ensemble leads to a normal distribution, effectively minimizing outliers. This characteristic was utilized to model the entropy distributions, from which confidence levels were established based on Gaussian parameters. Predictions were then assigned to one of three confidence levels (high, moderate, or low), with the Gaussian-based approach showing superior correlation with classification accuracy compared to other methods.

1. Introduction

Conventional maritime surveillance methods, hindered by their limited coverage and vulnerability to weather conditions, have necessitated the incorporation of advanced technologies [1]. Synthetic aperture radar (SAR) stands out as a key advancement in this area, providing consistent monitoring capabilities regardless of weather or time of day [2]. Among SAR’s various uses, ship classification has become particularly important. This importance is attributed to several application areas gaining momentum, including maritime security and environmental monitoring [3]. In scenarios involving the search for ’dark vessels’, which are those not transmitting automatic identification system (AIS) signals, the ability to identify the type of vessel is crucial [4]. It helps narrow down the pool of potential targets within a specific area, therefore reducing the time and resources required for further tracking and surveillance. With regard to environmental monitoring, classification plays a critical role in regulatory enforcement [5]. For example, it aids in identifying fishing ships that are illegally present in marine protected areas [6] or in monitoring oil tankers to prevent potential oil spills [7].
The initial research into ship classification using SAR images primarily relied on handcrafted features, which are manually designed attributes that exploit differences between ship classes based on expert domain knowledge [8]. However, with SAR data becoming increasingly available, there has been a notable shift toward the use of deep learning for tackling classification challenges. These advanced models possess the inherent ability to extract features automatically, and when trained on extensive datasets, they demonstrate superior performance compared to traditional methods [9]. Despite this shift, handcrafted features remain valuable. They provide robustness in situations where data are scarce or where deep-learning models are overly complex for the given task. Additionally, the contribution of each feature to the classification process is traceable, and each feature is clearly defined and directly linked to a physical property [10]. In contrast to the more abstract and opaque nature of deep learning, the transparency and interpretability of handcrafted features align well with the critical need for clarity and understanding in maritime surveillance. This has motivated researchers to explore the integration of handcrafted features with deep learning, further signifying their potential. Zhang and Zhang [11] demonstrated the integration of several handcrafted features with convolutional neural networks (CNNs), with a focus on identifying the optimal locations within the network to inject these features and the most effective methods for their combination. Moreover, Zhang et al. [8] introduced a novel deep-learning network that incorporated histogram of gradients (HOG) features, which was shown to improve classification accuracy. Therefore, even within the evolving landscape of deep learning, handcrafted features continue to hold significant relevance and potential for enhancing modern SAR ship classification methods.
Another aspect yet to be fully developed in this field is confidence (or its counterpart, uncertainty) quantification. The concept of confidence estimation in classification problems has been discussed previously [12] but has garnered more attention with the advent of deep learning. This increased focus is largely due to the complex, opaque nature of deep-learning models, thus heightening the need for robust methods of uncertainty estimation. Furthermore, as models are increasingly being deployed in situations where decisions carry high risks, understanding the level of confidence in model predictions becomes imperative [13]. In this context, classifiers that generate a probability distribution over all possible outcomes offer an intuitive way to quantify uncertainty. If these probabilities are accurately calibrated, they serve as reliable indicators of a model’s confidence in its classifications, where a higher probability signifies greater confidence [14]. Despite this capability, many models still default to producing a single deterministic outcome by simply selecting the class with the highest probability. However, a classification with a 0.9 probability carries a different level of confidence compared to one with a 0.5 probability. By reducing outputs to a single class, the potential benefits of utilizing varying levels of confidence are overlooked, representing a missed opportunity in effectively leveraging this crucial information [15].

Contributions

To address the aforementioned limitations, this paper focuses on two key areas. First, recognizing the decline in the development of handcrafted features that could provide valuable insights, this paper introduces a set of 13 innovative handcrafted features derived from the contours of ships specifically designed for classification in SAR images. Second, to tackle the lack of confidence derivation in classification results, the use of entropy, as defined in information theory [16] (see Section 3.3), is proposed as a metric to quantify the confidence associated with probabilistic predictions.
The proposed features are novel as they represent one of the first attempts to derive features directly from ship contours, a method rarely investigated in previous studies. For instance, the perimeter and complexity ratio, while established features are typically applied to the minimum enclosing rectangle (MER) [17,18,19,20]. In this work, these features are instead derived from the contour, offering a new perspective. Moreover, features such as bending energy and concave points inherently depend on the contours for their definition, making them intrinsically novel in this context.
Similarly, while the entropy is well-established in the literature [21], its application to SAR ship classification has been relatively unexplored. This study introduces two novel applications of the entropy in this domain. The first is its use to effectively combine an ensemble of models by prioritizing more confident predictions. The second is a unique approach to categorizing classification predictions into three distinct confidence levels based on entropy, achieved without requiring additional data.
The main contributions of this paper can be summarized as:
  • Introduction of 13 novel handcrafted features based on ship contours for classification in SAR images.
  • Application of the entropy to probabilistic SAR ship classification.
  • Combination of classification models based on the entropy.
  • Association of classification predictions with entropy-derived confidence levels.
The structure of the paper is organized as follows: Section 2 provides a concise review of related works in the literature. Section 3 details the methodology, including contour extraction, the proposed features, and the entropy-based ensembling and confidence level derivation. Section 4 outlines the experimental setup, describing the datasets used, implementation details, and the processes of segmentation, classification, and entropy analysis. Section 5 presents the results of contour extraction, classification, ensembling, and confidence level categorization, accompanied by a discussion of these findings. Finally, Section 6 concludes the paper with final remarks and potential directions for future research.

2. Related Works

2.1. Handcrafted Features

One of the early contributions to ship classification in single-channel (i.e., single polarization) SAR images was made by Margarit and Tabasco [17], who utilized the length, width, and local radar cross-section (LRCS) as features, integrated within a fuzzy logic framework. Following this, Xing et al. [18] adopted sparse representation classification, building a dictionary using features similar to those previously mentioned instead of directly using the image pixels. Zhang et al. [22] employed the width ratio and ship-to-non-ship pixel ratio within the MER of the ship, in addition to analyzing the scattering density. Wang et al. [23] applied hierarchical classification using autocorrelation to identify repetitive hatch covers and containers on bulk carriers and container ships, respectively. Wu et al. [24] utilized kernel density estimation, the mean backscatter coefficient, and three ship structure-based ratios in conjunction with a support vector machine (SVM) to refine the classification accuracy. Lang et al. [19] proposed an integrated approach by wrapping classifier selection within a feature selection framework to optimize the combination of features and classifiers. This approach used 21 features, including Hu moments, alongside five different classifiers such as decision trees, naive Bayes, and SVMs. Lang and Wu [20] introduced the use of naive geometric features (NGFs) with multiple kernel learning at moderate resolutions to enhance feature representation. Building on shape analysis, Zhu et al. [25] improved the shape context method by incorporating pixel intensity into the cost of template matching. Lin et al. [26] introduced MSHOG, a method based on HOG enhanced by manifold learning and integrated into a task-driven dictionary learning framework.
The concept of using ship contours for classification was first introduced by Zhu et al. [27], who proposed a method for classifying naval ships. This approach involved constructing three-dimensional models of ships, projecting them into a two-dimensional plane to match the SAR image perspective, and then comparing the extracted contour with pre-defined templates to find the closest match. The contour approach is particularly adept at detecting geometric distortions that occur in SAR imaging, such as foreshortening, layover, and shadows. These distortions, related to the ship’s superstructure, provide distinctive features for classification as they vary significantly among different types of ships [28]. While the method demonstrated the value of contour analysis, it required extensive preparation to create templates for each ship type and focused only on the geometric aspect. However, in addition to geometric features, the radiometric properties of the ship’s contour itself are believed to hold additional discriminative information [29]. It is hypothesized that the unique superstructures of ships produce distinctive backscatter signals that may dominate over the more consistent scatterings from sea-ship hull interactions, which are similar across different ship classes [30]. If true, these distinctive signals can be utilized to distinguish between different types of ships, enhancing the classification process.

2.2. Confidence Estimation

Most of the recent confidence estimation techniques for classification tasks were designed for CNNs, both due to their prominence and their tendency to overfit, which leads to overconfident results. Such techniques include Bayesian CNNs, dropout as a Bayesian approximation, and ensemble methods [31]. However, the concept of uncertainty estimation can be traced back to non-deep-learning classifiers. Ibrahim et al. [32] explored the impact of addressing uncertainties in land-cover classification using soft classification methods, which showed an increase in the classification results when integrating the uncertainty across all stages of the classification process. Giacco et al. [33] delved into the classification of multi-spectral data using textural features, with a special emphasis on uncertainty in land-cover map outputs, through modifying an SVM to yield soft predictions. Loosvelt et al. [34] employed a random forest (RF) to map vegetation probabilistically using SAR data, which highlighted the critical role of uncertainty assessments in identifying lower confidence areas and patterns affected by agricultural practices.
More specifically, the concept of using information entropy for quantifying uncertainty has also been touched upon. Dehghan and Ghassemian [35] presented the use of entropy for quantifying the uncertainty in multi-spectral data classification, which demonstrated its supremacy over other metrics such as the root-mean-square-error (RMSE). Park and Simoff [36] explored the efficacy of probabilistic multi-label classifiers in predicting multiple responses simultaneously, focusing on the role of normalized entropy in measuring system confidence. By analyzing the correlation between normalized entropy and prediction accuracy across various datasets, the study demonstrates that lower normalized entropy thresholds generally correspond to higher accuracy. Tornetta [37] presented a normalized metric based on the entropy for uncertainty quantification, which was shown to effectively gauge and improve the reliability of predictions in classification tasks, specifically examining the behavior of the Complement Naive Bayes model [38].

3. Methodology

The methodology adopted in this study, illustrated in Figure 1, is structured into three main stages: feature extraction, classification, and confidence derivation. Each stage is explained in detail in the subsections that follow. First, the segmentation models employed for extracting the ships’ contours are introduced. Next, the proposed features derived from these contours are outlined. This is followed by an introduction to entropy, its connection to multiple thresholding, and the evaluation of various ensembling methods. Finally, the process for deriving confidence levels from entropy-based predictions is described.

3.1. Contour Extraction

Segmentation is considered an important component given the features’ reliance on the accuracy of contour extraction. Recognizing this, two segmentation strategies are examined to ensure robust feature derivation and to showcase different approaches stemming from distinct domains. The first is a statistical method known as watershed segmentation, and the second is a deep-learning approach utilizing the U-Net architecture.

3.1.1. Watershed Segmentation

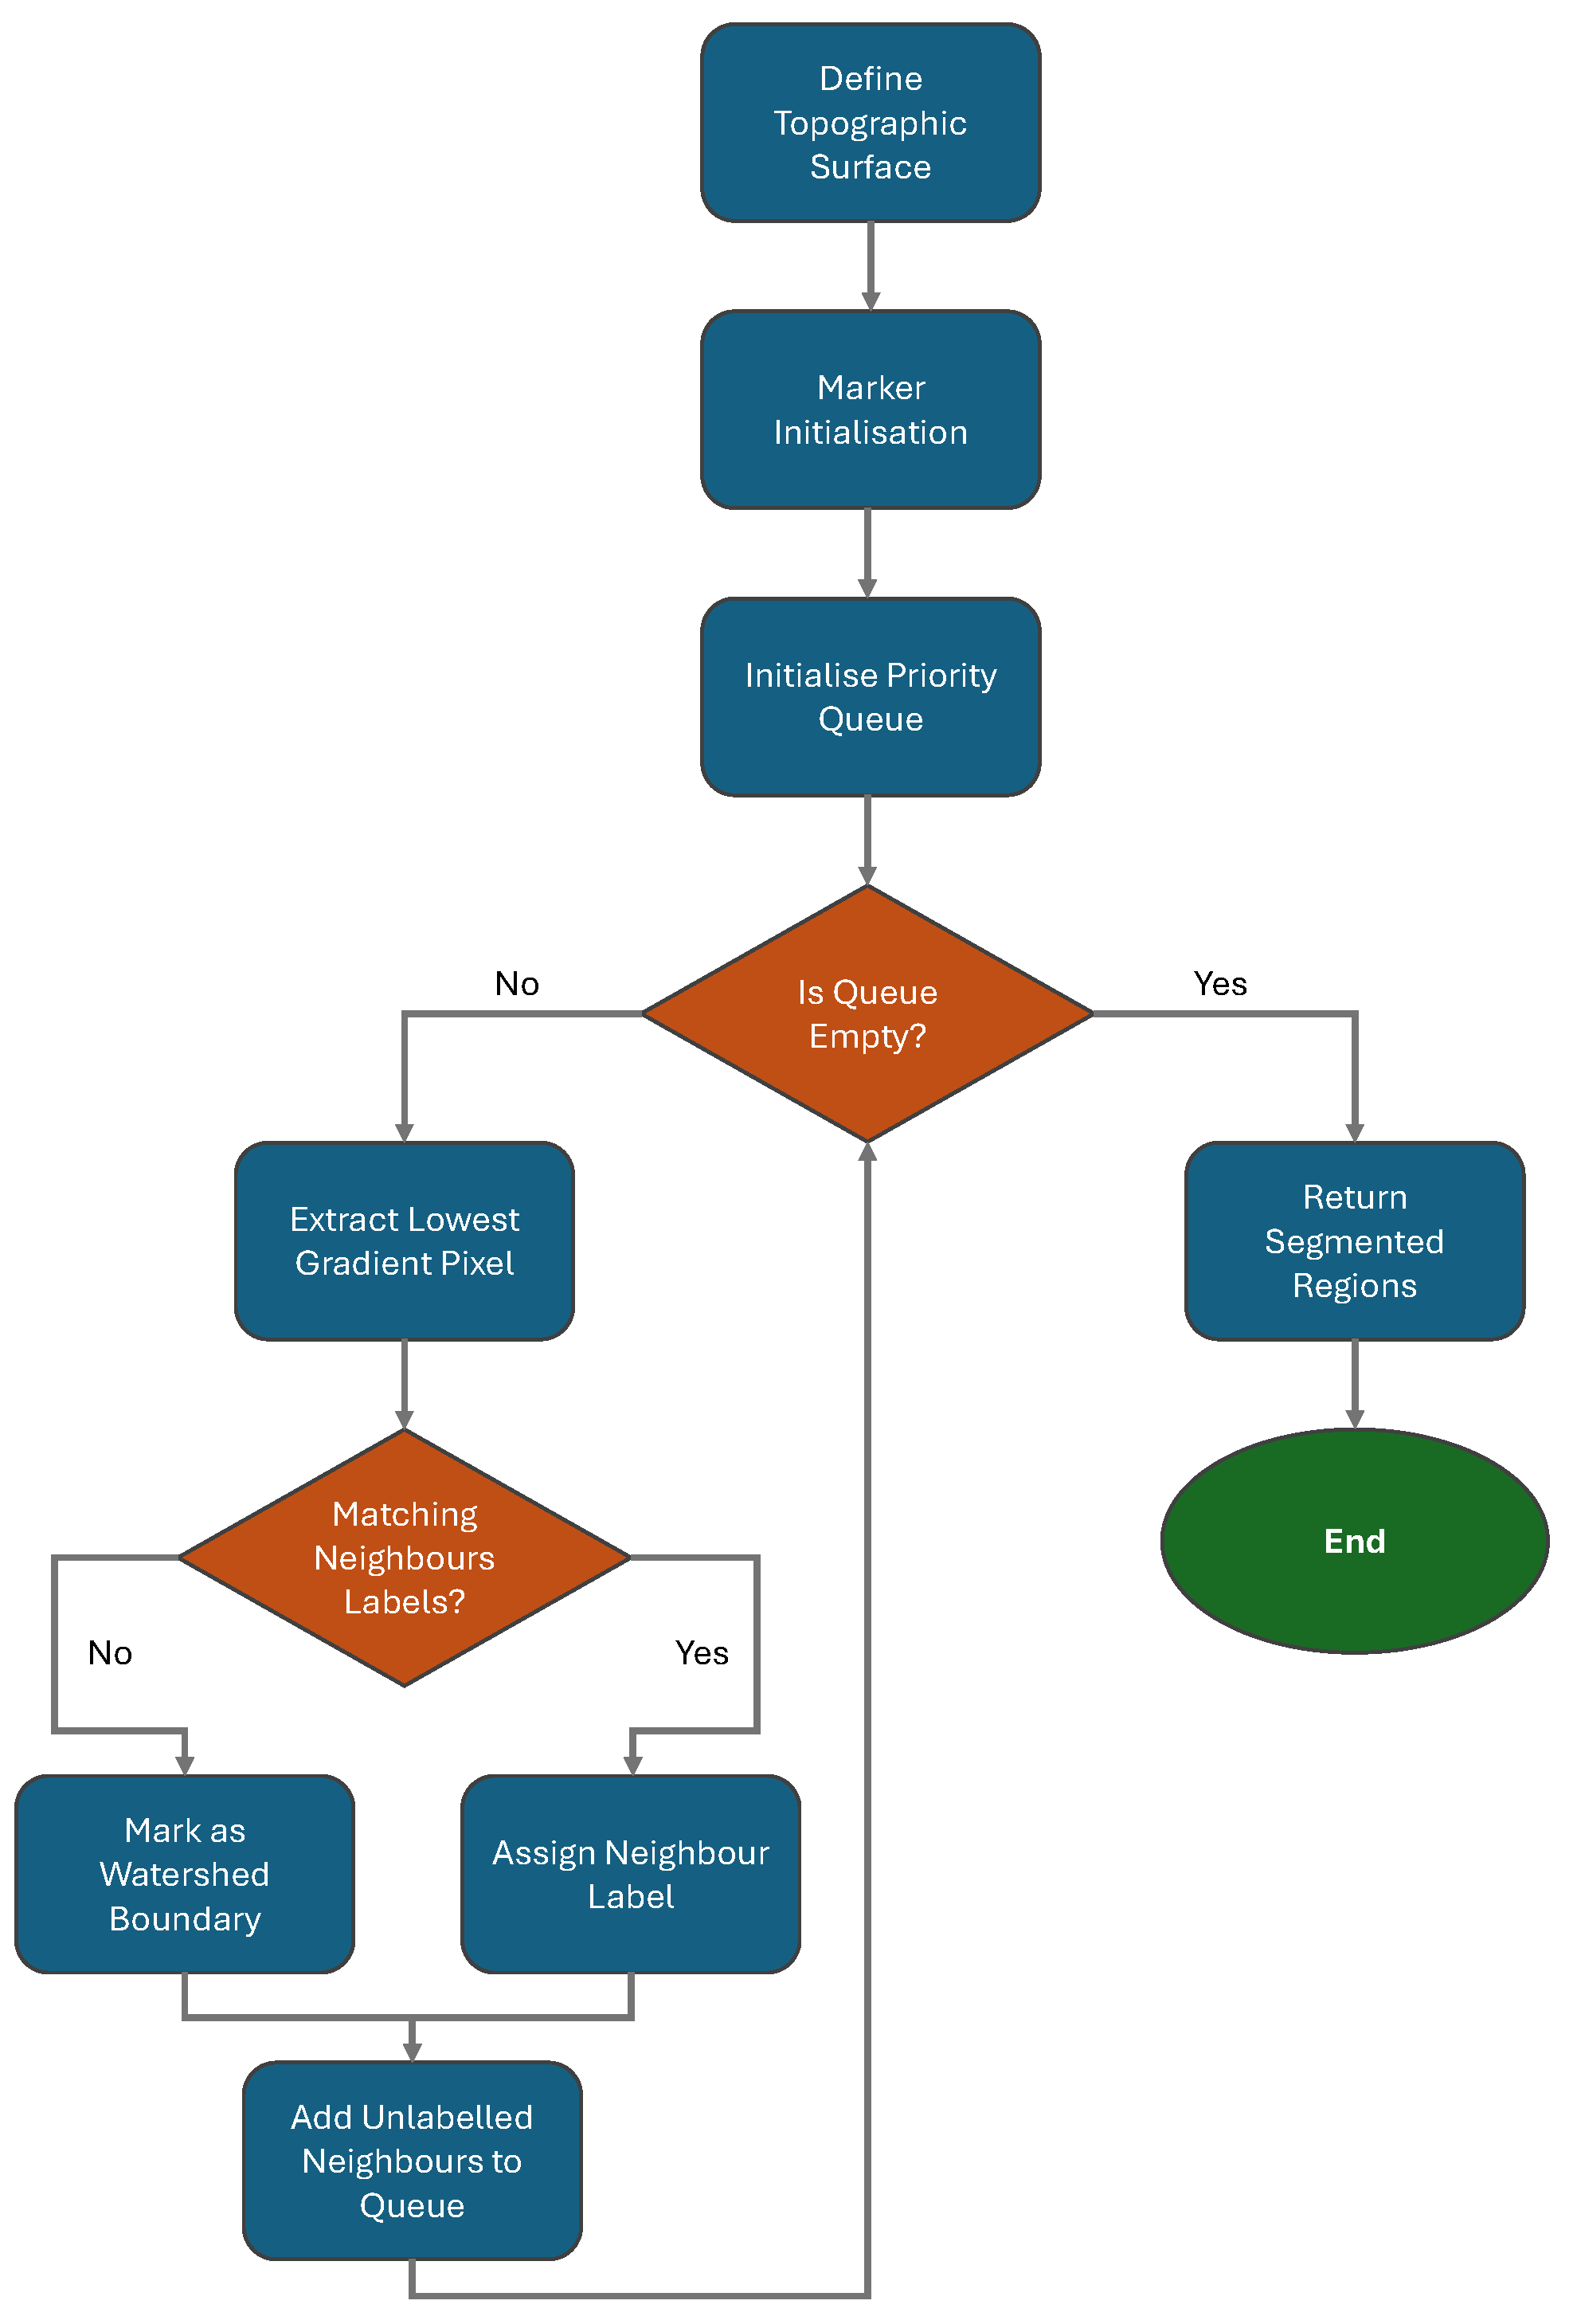
The watershed segmentation algorithm is a powerful tool for image segmentation, particularly effective in separating or distinguishing objects in an image [39]. As highlighted in Figure 2, this technique models the image as a topographic surface, with pixel intensity representing elevation. The segmentation begins by identifying markers, specific regions known to be part of objects or the background. These markers serve as the starting points for the simulated flooding process. As the water level rises, barriers naturally form at the convergence points of different waters, defining distinct regions. Marker selection is crucial for the algorithm’s success, as it directly impacts segmentation accuracy. Markers can be chosen based on prior knowledge, manually, or through automated methods like morphological operations. During the flooding simulation, when basins associated with different markers start to fill and meet, dams are constructed to prevent merging, thus marking boundaries between objects.
One of the key strengths of the watershed algorithm is its ability to accurately segment objects that are close to each other or have irregular shapes. However, it is also known for being sensitive to noise in the image, which can lead to oversegmentation [40]. To mitigate this, it is often combined with preprocessing techniques such as noise reduction and post-processing techniques aimed at merging overly fragmented regions. Despite these challenges, the watershed algorithm remains a popular choice due to its versatility and effectiveness in a wide range of applications. For example, it has been successfully applied in medical imaging for the segmentation of anatomical structures [41], as well as in remote sensing for land-cover classification [42].

3.1.2. U-Net

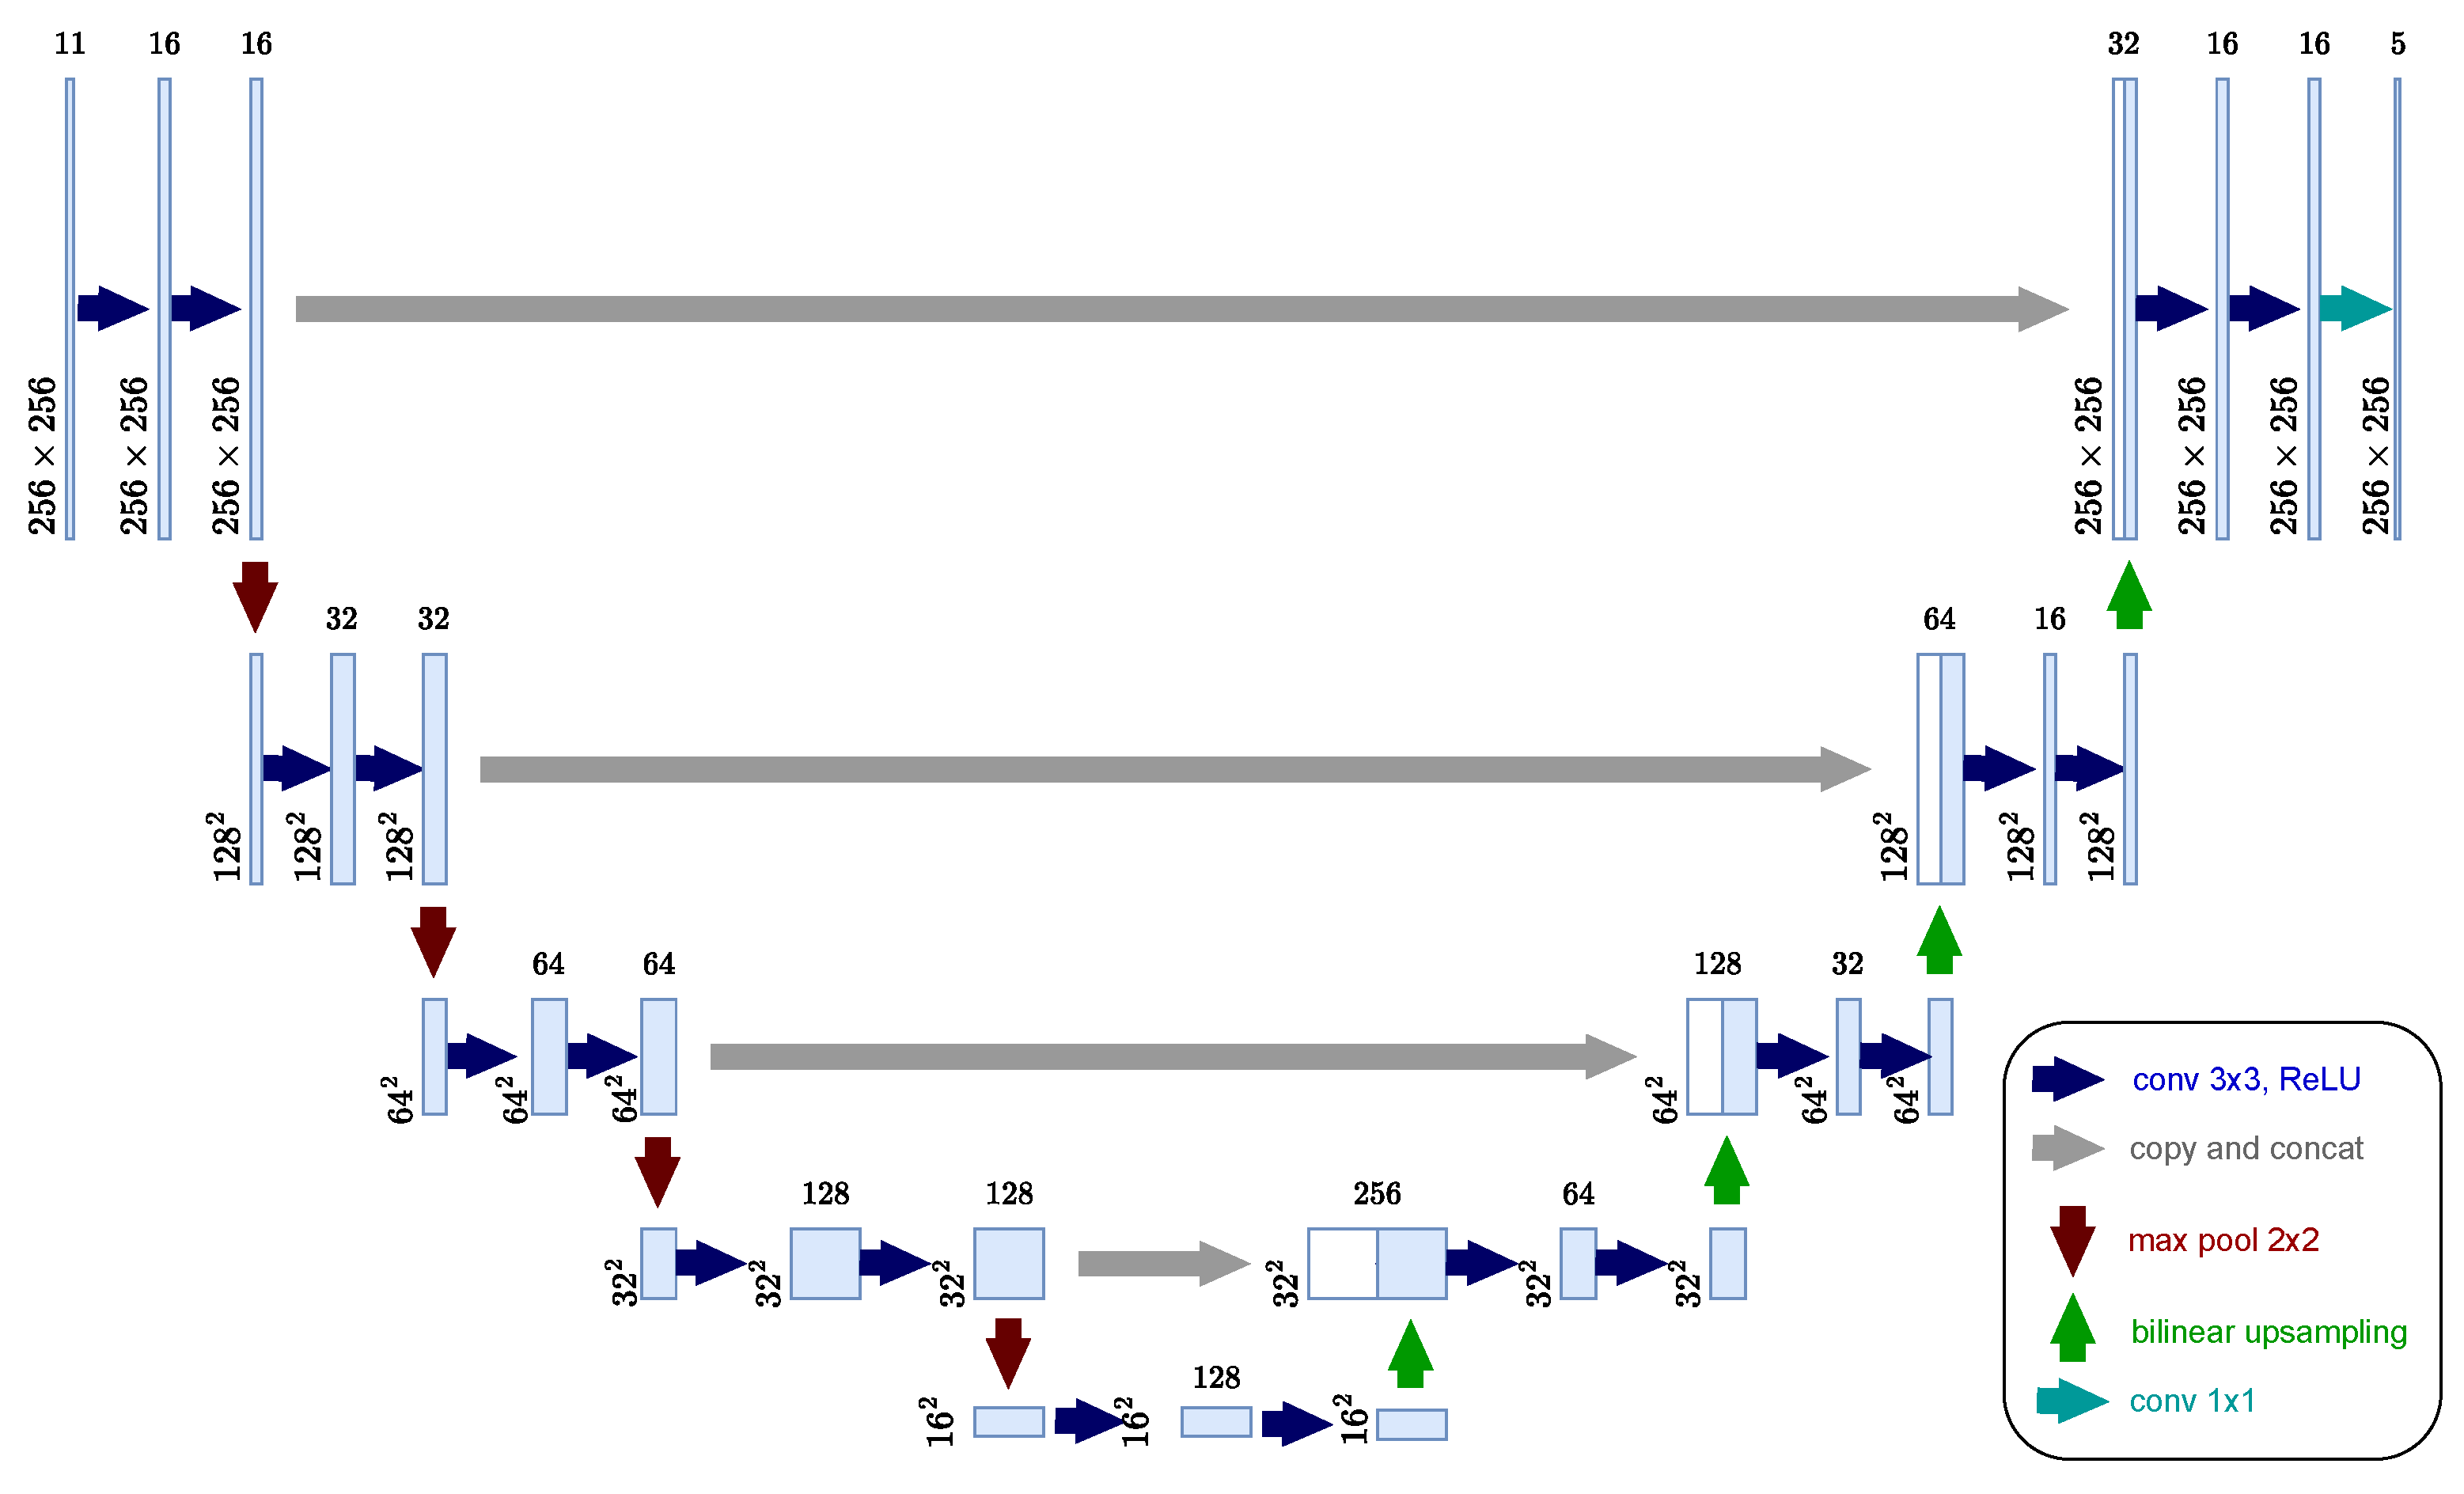
The U-Net model, introduced in 2015, represents a significant advancement in the field of deep learning for image segmentation [43]. U-Net’s design allows it to capture both context and details by combining low-level feature maps with higher-level ones, which ensures the precise localization of segmented objects. This approach has made U-Net popular in remote sensing applications, where it has been used in forest height mapping [44], urban change detection [45], and ship segmentation [46].
U-Net is composed of two main paths: the contraction (downsampling) path and the expansion (upsampling) path. The contraction path follows the typical architecture of a convolutional network, consisting of repeated application of two 3 × 3 convolutions (each followed by a rectified linear unit (ReLU) and a 2 × 2 max pooling operation for downsampling. With each downsampling step, the network doubles the number of feature channels. This part of the network is responsible for capturing the context in the image, allowing the model to understand the background and general shapes. The expansion path, on the other hand, enables precise localization. It consists of upsampling of the feature map followed by a 2 × 2 convolution (“up-convolution”) that halves the number of feature channels, a concatenation with the correspondingly cropped feature map from the contraction path, and two 3 × 3 convolutions, each followed by a ReLU. The U-Net architecture used in this study is presented in Figure 3.

3.2. Proposed Features

Inspired by the unique characteristics observed in the contours of ships within SAR images, a set of 13 novel features has been crafted for ship classification. Recognizing the complementary nature of geometric and radiometric features, as demonstrated in prior studies [2,48], the feature set has been made to include both types. This balanced approach aims to harness the distinct advantages of each feature type, leveraging geometric features for capturing the shape and structure of the ship and radiometric features for utilizing the intensity and texture information. They are defined as:
  • f 1 is the perimeter of the contour, calculated as the sum of the Euclidean distances between successive points along the contour:
    f 1 = i = 1 N c c i + 1 c i
    where c i is a vector ( x i , y i ) , representing the coordinate of the i t h contour point, c represents the norm of vector c , and N c is the total number of contour points. Please note that for a closed contour c N c + 1 = c 1 .
  • f 2 represents the complexity of the contour, determined by the ratio of the contour’s perimeter to the square root of its area A:
    f 2 = f 1 A
  • f 3 quantifies the bending energy, reflecting the curvature present along the contour. This is achieved by averaging the angles between consecutive edges:
    f 3 = 1 N c i = 1 N c arccos v i · v i + 1 v i v i + 1
    where · is the dot product of two vectors, and:
    v i = c i + 1 c i
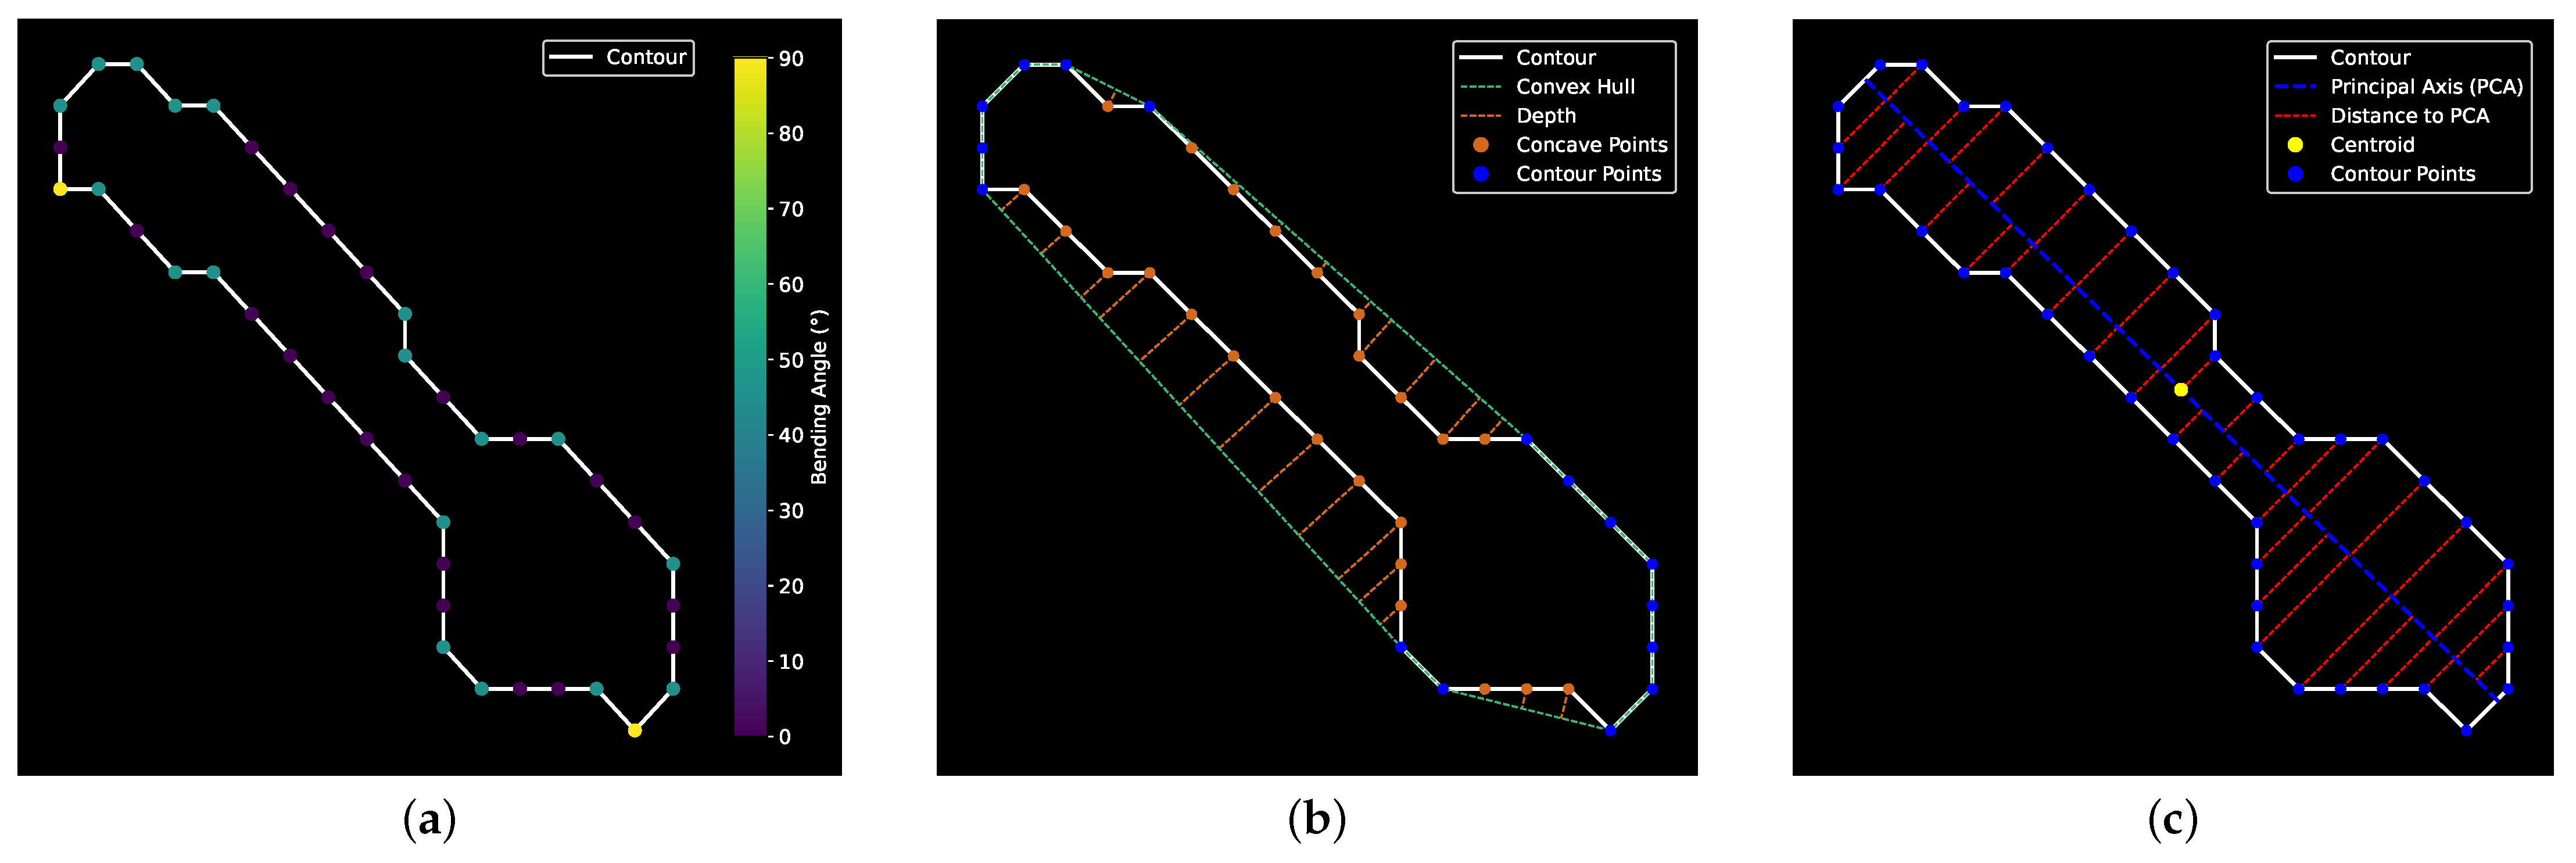
  • f 4 , f 5 , f 6 and f 7 concentrate on the concave points of the contour, specifically the areas where the ship’s shape curves inward. The convex hull, which is the smallest convex shape that entirely encloses the contour, is first identified:
    ConvexHull = { q m | m = 1 , 2 , , M }
    where q m is the m t h point on the convex hull represented as a vector ( x m , y m ) , and M is the total number of convex hull points.
    The depth d i of a point on the contour is defined as the Euclidean distance to the nearest point on the convex hull:
    d i = min q ConvexHull c i q
    Concave points are defined as points on the contour where the depth is strictly greater than zero. f 4 is then defined as the count of these concave points:
    f 4 = | S concave |
    where | · | denotes the cardinality, and:
    S concave = { c i | d i > 0 }
    Accordingly, f 5 , f 6 , and f 7 are the mean, standard deviation, and the sum of their depths, respectively:
    f 5 = 1 f 4 c i S concave d i
    f 6 = 1 f 4 c i S concave ( d i f 5 ) 2
    f 7 = c i S concave d i
  • f 8 , f 9 , and f 10 capture the major direction of variation of the contour by measuring the perpendicular distances to the principal component axis (PCA):
    p i = ( c i g ) · u
    where p i is the perpendicular distance of the ith contour point to the principal axis, u is the principal axis unit vector derived from PCA, and g is the vector to the centroid, calculated as:
    g = 1 N c i = 1 N c c i
    The perpendicular distances are then used to compute three features that capture the distribution of contour points relative to the principal axis: the mean ( f 8 ) represents the average deviation of the points, the standard deviation ( f 9 ) quantifies the variability of these deviations, and the sum ( f 10 ) reflects the total deviation across all points:
    f 8 = 1 N c i = 1 N c p i
    f 9 = 1 N c i = 1 N c ( p i f 8 ) 2
    f 10 = i = 1 N c p i
  • f 11 , f 12 , and f 13 are the radiometric features, defined as the mean, standard deviation, and sum, respectively, of the intensity of the pixels along the contour:
    f 11 = 1 N c i = 1 N c I i
    f 12 = 1 N c i = 1 N c ( I i f 11 ) 2
    f 13 = i = 1 N c I i
    where I i represents the intensity value of the i t h pixel along the contour.
Selected examples of the proposed features are illustrated in Figure 4. To establish their efficacy, the performance of the proposed features is evaluated against a selection of feature sets from the literature, including NGFs, LRCS, Hu moments, and Zernike moments [49]. An SVM was employed as the classification model, chosen for its demonstrated strength in managing high-dimensional spaces and capturing non-linear data relationships. Furthermore, to provide a baseline comparison to deep-learning methods, the performance is also evaluated against a VGG-19 network [11].

3.3. Entropy-Based Ensembling

SAR images often exhibit variability due to extreme pixel intensities caused by strong scatterers, such as ship deckhouses [27]. These extreme intensities can complicate the contour extraction process, which is crucial for deriving shape-based features used in classification tasks. To mitigate this, preprocessing techniques, such as capping intensities at specific percentiles, are commonly applied. However, the optimal capping threshold depends on multiple factors, such as noise levels and sea state conditions. This results in variability in the extracted contour and, consequently, in the features derived from the same sample. Such variability poses challenges in ensuring consistent classification performance, as different thresholds may yield slightly different feature sets for the same underlying samples.
To address this variability, it is proposed that multiple thresholds are applied to the same test sample, generating slightly different contours and feature sets. By combining the resulting feature sets, the inherent variability introduced by preprocessing can be leveraged rather than treated as a limitation. To guide this process effectively, entropy is introduced as a metric to evaluate and integrate the predictions arising from different thresholds.
Entropy in information theory, also called the Shannon entropy, quantifies the amount of uncertainty or randomness in a system [50]. The entropy H of a discrete random variable Z, with possible values { z 1 , z 2 , , z N z } and probability mass function P ( z ) , is defined as:
H ( Z ) = n = 1 N z P ( z n ) log b P ( z n )
where H ( Z ) represents the entropy of Z, P ( z n ) denotes the probability of occurrence of the value z n , N z stands for the number of possible values of Z, and log b is the logarithm to the base b, which for this study is set to the natural logarithm.
In (20), each term P ( z n ) log b P ( z n ) quantifies the amount of information or uncertainty for each possible value of the random variable, and the sum of all these terms gives the total entropy of the distribution. High entropy indicates a high degree of uncertainty, while low entropy suggests predictability. In the context of machine learning, entropy is traditionally used to measure uncertainty in a model’s predictions by analyzing the probabilities assigned to different classes.
In this study, entropy is employed to guide the integration of predictions derived from contours extracted under multiple threshold settings. The proposed method, entropy-weighted averaging, integrates probabilities from multiple classifiers by weighting them according to the certainty of their predictions. Here, multiple classifiers refer to the same base classifier, each applied to the same image but trained on contours extracted at different threshold levels. High-entropy predictions, which indicate greater uncertainty, are assigned lower weights, ensuring that more confident predictions exert a stronger influence on the final classification. The approach ensures that variability in contour extraction contributes positively to the classification process. It is formalized as:
y ^ j H - avg = arg max y k = 1 K w j , k P j , k ( y )
where y ^ j H - avg is the entropy-weighted prediction for the jth sample, P j , k ( y ) is the probability assigned to class y by the kth classifier, K is the total number of classifiers, and w j , k is the corresponding weight, defined as:
w j , k = 1 / H j , k k = 1 K ( 1 / H j , k )
where H j , k is the entropy of the kth classifier for the jth sample. In the denominator, the summation iterates over all K classifiers, denoted by k , to normalize the weights such that they sum to 1.
To validate the effectiveness of the proposed entropy-weighted approach, it is compared against several alternative strategies that utilize the additional contours:
  • Feature Concatenation: This method involves combining all features across different thresholds for each sample:
    F concat = F k F k + 1 F K
    where ∪ represents the union of the sets, and F k is the feature set for the k t h threshold:
    F k = { f 1 , k , f 2 , k , , f 13 , k }
  • Expanded Samples: By considering each feature set from different thresholds for the same samples as distinct entities, the number of samples effectively increases, given by:
    N expanded = N s × K
    where N s is the original number of samples and N expanded is the resulting number of expanded samples.
  • Majority Voting: In this approach, each classifier contributes equally to the final decision, with the predicted class being determined by a simple majority vote among all classifiers:
    y ^ j vote = arg max y k = 1 K δ ( y ^ j , k , y )
    where y ^ j vote is the majority vote prediction for the j t h sample, and δ ( y ^ j , k , y ) is an indicator function, defined as:
    δ ( y ^ j , k , y ) = 1 if y ^ j , k = y , 0 otherwise .
  • Probability Averaging: This method averages the probabilities P j , k assigned to each class by the different classifiers, therefore consolidating the predictions into a single probabilistic outcome for each class:
    y ^ j P - avg = arg max y 1 K k = 1 K P j , k ( y )
  • Minimum-Entropy Selection: This approach identifies the classifier with the lowest entropy in its predictions, k * , for each sample:
    k * = arg min k H j , k
    The prediction of this classifier is selected as the final outcome:
    y ^ j H - min = y ^ j , k *
Alongside the SVM, an RF and a Gaussian process classifier (GPC) were also examined for the ensembles. This choice was motivated by two factors: primarily to analyze entropy measurements derived from each classifier given their distinct approaches to probability calculation, and second to assess the robustness of the feature set across different models. SVM and RF classifiers estimate class probabilities differently. The former does so by converting the output of the decision function into probabilities using Platt scaling, which involves fitting a logistic regression model to the SVM’s scores [51]. RF estimates probabilities based on the proportion of trees that vote for a particular class, offering a more direct interpretation of class likelihoods. GPC, inherently a probabilistic model, directly provides probabilities as part of its output based on the assumption that the data follows a Gaussian process.

3.4. Entropy-Based Confidence Levels

To further leverage entropy-based ensembles, it is proposed that they can be used to derive confidence levels associated with predictions. For a given sample j, the mean entropy H ¯ j is defined as:
H ¯ j = 1 K k = 1 K H j , k
Drawing from the central limit theorem (CLT) [52], it is posited that the distribution of H ¯ j across all samples tends towards a Gaussian. This is predicated on the assumption that the entropies, while derived from models trained on slightly different data representations, are sufficiently independent and identically distributed. The rationale behind this hypothesis is that extreme entropies (indicating either very high or very low certainty) would require uniformity across all classifiers to remain outliers post-aggregation. Conversely, a mix of entropies from the ensemble is statistically more likely to average to a moderate level of uncertainty, centralizing the distribution.
Given the assumption of Gaussianity, confidence levels can be systematically derived using the mean μ and standard deviation σ of the Gaussian distribution, modeled from the histogram of H ¯ j values. These levels are defined as:
  • Ensemble High Confidence, in which predictions present entropy values below one standard deviation from the mean:
    H ¯ j < μ σ
    This threshold is chosen because samples in this range exhibit significantly lower uncertainty than average, indicating that the classifiers within the ensemble are highly certain about their predictions. Statistically, for a Gaussian distribution, approximately 68% of the data lies within one standard deviation of the mean. Thus, samples falling below the threshold defined in (32) are in the lower tail, highlighting particularly confident predictions.
  • Ensemble Moderate Confidence, where predictions possess entropy values in the following range:
    μ σ < H ¯ j < μ
    This range is selected to capture samples that exhibit average or slightly below-average uncertainty. These samples represent predictions where the ensemble of classifiers is generally confident but not to the extent of those classified under high confidence. This classification acknowledges the natural variance in model certainty, categorizing predictions that are reasonably sure but not exceptionally so.
  • Ensemble Low Confidence, in which predictions have entropy values exceeding the mean:
    H ¯ j > μ
    Samples in this category have higher than average entropy, indicating a higher level of uncertainty in the ensemble’s predictions. This classification is critical for identifying instances where the model’s predictions are less reliable, possibly due to conflicting information among the classifiers or inherent complexity in the sample that challenges clear classification.
This method is compared against a direct calculation of the average and standard deviation of the entropies from the optimal single model H j , k opt to evaluate its effectiveness. The classifier k opt represents the model with the best overall performance across the dataset. The average entropy μ opt and standard deviation σ opt of this classifier are calculated as follows:
μ opt = 1 N s j = 1 N s H j , k opt
σ opt = 1 N s j = 1 N s ( H j , k opt μ opt ) 2
These values are then used to define confidence levels for the optimal single model:
Confidence Level ( H j , k opt ) = High Confidence , if H j , k opt < μ opt σ opt Moderate Confidence , if μ opt σ opt H j , k opt < μ opt Low Confidence , if H j , k opt μ opt

4. Experimental Setup

4.1. Datasets

4.1.1. OpenSARShip

OpenSARShip is the first public dataset dedicated to SAR ship classification [53]. It comprises 11,346 ship samples derived from Sentinel-1 imagery in interferometric wide swath (IW) mode. This dataset provides a multi-looked spatial resolution of 20 m by 23 m for ground range detected (GRD) samples and a resolution of 3 m by 23 m for single-look complex (SLC) samples, with availability in both VV and VH polarization. The release of OpenSARShip 2.0 marks a significant expansion, tripling the dataset size to 34,528 ship samples [54]. This version enriches the dataset but also introduces a challenge, as a substantial portion of the imagery features multiple ships and exhibits strong interference, complicating classification tasks.
Focusing on the original OpenSARShip dataset, this study narrows its scope to three critical ship categories: bulk carriers, container ships, and oil tankers. These categories are not only pivotal to the global economy and international trade but also sufficiently represented in the dataset to allow for meaningful analysis [55]. To explore the distinctions between the different products, both the GRD and SLC samples will be investigated. The SLC dataset encompasses 333 bulk carriers, 577 container ships, and 514 tankers, while the GRD dataset includes 817 bulk carriers, 220 container ships, and 460 tankers. The VV-polarized data are selected as it has been demonstrated that co-polarized data are better suited for maritime targets [56].

4.1.2. FUSAR-Ship

Following the introduction of OpenSARShip, the FUSAR-Ship dataset has become a significant resource for the ship classification community due to the high resolution provided. This dataset comprises over 5000 ship samples obtained from Gaofen-3 satellite images in ultrafine stripmap mode, with a spatial resolution of 1.7 m by 1.1 m for range and azimuth, respectively [57]. The samples include co-polarized HH and VV channels but are available exclusively in the GRD format. Similar to OpenSARShip, the FUSAR-Ship dataset organizes ships into 15 categories, with a majority of these classes characterized by a small number of samples.
The selection of the FUSAR-Ship dataset for this study is aimed at examining how resolution impacts classification performance. Two specific subsets of the dataset are employed: one with three categories (bulk carriers, container ships, and tankers) and another with five categories, which additionally include cargo ships and fishing vessels. The distribution of samples across these categories is as follows: 254 for bulk carriers, 43 for container ships, 79 for tankers, 291 for cargo ships, and 388 for fishing vessels.

4.1.3. HRSID

The HRSID dataset emerges as a significant contribution to the field of ship detection and instance segmentation within SAR imagery, comprising 5604 scenes that collectively feature 16,951 ship instances [58]. These images are derived from Sentinel-1 and TerraSAR-X/TanDEM-X platforms, with the majority presenting an average spatial resolution of 3 m across HH, VV, and HV polarization. Notably, the dataset includes detailed polygonal masks that accurately delineate the ships’ contours, in addition to providing the MER of each ship. This feature renders the HRSID dataset particularly valuable for training and evaluating segmentation algorithms due to its precision in capturing the ships’ shapes. Given the study’s focus on ship classification tasks, which necessitate isolated objects, approximately 20% of the HRSID images were excluded, as they primarily depicted ships located at ports or within close proximity to the shore. Consequently, this filtration process resulted in a curated subset of 4483 images from the HRSID dataset that are more relevant and applicable to the research objectives.

4.2. Implementation Details

The implementation of the segmentation algorithms and the subsequent analysis were conducted within a Python programming environment, mainly utilizing Scikit-learn, OpenCV, and TensorFlow. For the training of deep-learning models, a high-performance computing (HPC) cluster was used, equipped with 22 GB of RAM and a GPU with 22 GB of memory. Other computational tasks, including image preprocessing and model evaluations, were carried out on a workstation powered by an Intel Xeon E5-2630 CPU.

4.2.1. Contour Extraction Process

To evaluate the effectiveness of watershed segmentation and the U-Net model, the HRSID dataset was utilized, with several preprocessing steps applied. First, image intensities were normalized by clipping outliers at the 99.9th percentile. This step mitigated the impact of extreme values and ensured a more uniform intensity distribution throughout the dataset. Subsequently, pixel values were normalized to a standard range of 0–255, which aligned with the typical input requirements for many segmentation algorithms. To maintain consistency in image size and optimize processing efficiency, all images were resized to a uniform dimension of 256 × 256 pixels. The dataset was partitioned following a 7:3 train–test split to structure the evaluation process. For the training portion, the data were further divided into 5 separate segments. Due to computational and time constraints, a single segment was selected for validation, while the remaining segments were utilized for training. This resulted in 2560 images for training, 641 for validation, and 1372 for testing.
The U-Net model was trained for 100 epochs, incorporating an early stopping mechanism with the patience of 10 epochs to prevent overfitting. The watershed segmentation’s preprocessing parameters, including the kernel size for morphological opening and the threshold for distance transform, were optimized using the training set. Specifically, the images were binarized through Otsu’s method [59], followed by a morphological opening with a 3 × 3 kernel, iterated twice, to remove noise artifacts. The segmentation accuracy was further refined by calculating the distance transform of each pixel to the nearest background, with subsequent thresholding at 0.7 of its maximum value to delineate the sure foreground regions.
Considering the imbalanced nature of the dataset, with a significantly higher count of sea pixels compared to ship pixels, employing accuracy as a performance metric would not be informative. This is because predicting the entire image as the sea could still result in a high accuracy score despite failing to accurately identify ship areas. Hence, the intersection over union (IoU) [60] and Dice coefficient [61] were utilized to evaluate model performance, offering a detailed assessment of the segmentation accuracy by quantifying the overlap between the predicted segmentation and the actual ship areas. They are defined as:
IoU = | A B | | A B |
Dice = 2 | A B | | A | + | B |
where A represents the set of pixels in the predicted segmentation, B represents the set of pixels in the ground truth segmentation, ∩ denotes the intersection, ∪ denotes the union, and | · | represents the cardinality of the respective set.
While both metrics were used for evaluating the results, the IoU was selected for monitoring to implement early stopping. In addition, to verify that the segmentation performance on the HRSID dataset translated to OpenSARShip and FUSAR-Ship samples, 30 samples from each, balanced across bulk carriers, container ships, and tankers, were manually annotated using CVAT [62]. The trained U-Net model and the watershed segmentation methodology were then applied to the annotated samples.

4.2.2. Classification Process

To address the class imbalance in OpenSARShip and FUSAR-Ship, a stratified sampling method was used, creating a balanced training and validation dataset. Specifically, 70% of the instances from the least represented category were selected for training and validation, aiming to reduce training bias due to class imbalance. The rest formed a holdout test set for evaluating generalization. Table 1 details the sample distribution for OpenSARShip.
For FUSAR-Ship, directly applying this method would have resulted in only about 30 training samples for container ships and tankers, insufficient for effective machine learning model training. Therefore, data augmentation was implemented, artificially increasing the training samples for these categories to 150 through random rotations. This number was chosen to align the training sample size with that in the GRD OpenSARShip dataset, facilitating a more precise comparison. While there are more sophisticated methods to oversample classes, such as the approach proposed by Li et al. [63], random rotations were selected as a reasonable compromise to balance the dataset efficiently, given the main aim of classification. As a consequence, the test set was limited to 13 container ship samples and 29 tanker samples, as detailed in Table 2.
Considering the segmentation task for OpenSARShip and FUSAR-Ship involved images with only a single ship, an additional refinement step was incorporated into both the watershed and U-Net segmentation processes. This is in contrast to the HRSID dataset, where images may contain multiple ships and present a more complex segmentation challenge. If multiple contours were detected, the contour with the highest eccentricity was selected as the most likely candidate for representing the ship. This criterion was based on the assumption that ship contours tend to have a higher eccentricity due to their elongated shape. However, any contour exceeding the dimensions of 500 m by 100 m, surpassing the size of the largest known trade ships, was deemed implausible and thus discarded. This additional refinement step enhanced the segmentation outcome by eliminating unlikely contours and focusing on those that realistically represent ships within the specified size range.
To ensure all features contributed equally to the model, Min–Max normalization was applied for feature scaling. The tuning of the SVM’s hyperparameters was conducted via grid search, exploring the parameter space of ‘C’ with values [1, 10, 100], ‘gamma’ with options [1, 0.1, 0.01], and ‘kernel’ types [‘rbf’, ‘linear’]. This search was paired with five-fold stratified cross-validation, aiming to identify the set of hyperparameters that yielded the highest accuracy across training and validation folds. Once the optimal hyperparameters were identified, the final SVM model was retrained on the entire dataset with these parameters. The model’s performance was subsequently evaluated on the test set.

4.2.3. Entropy Analysis

Five intensity capping percentiles (95, 97, 99, 99.9, and 100) were applied to generate contours for each sample in the OpenSARShip and FUSAR-Ship datasets. To quantify the robustness of individual features, Gaussian noise was iteratively added to the feature values across 10 iterations, generating perturbed datasets. These perturbed datasets were evaluated using the SVM classifier, and the resulting changes in entropy were recorded. The mean and standard deviation of these entropy changes across all samples were calculated, providing a measure of each feature’s sensitivity to noise.
The hyperparameters of the RF and GPC models used in the entropy-based ensembling and confidence derivation were tuned using grid search. For the RF classifier, the ‘n_estimators’ parameter was optimized over the range [10, 100, 1000], while the ‘max_features’ parameter was set to either ‘sqrt’ or ‘log2’. For the GPC, the ‘rbf’ kernel was selected, along with the optimizer ‘fmin_lbfgs_b’ with ‘n_restarts_optimizer’ being set to 5. A similar approach as with the SVM was followed, with five-fold cross-validation and retraining before evaluation on the test set.

5. Results and Discussion

5.1. Contour Extraction Results

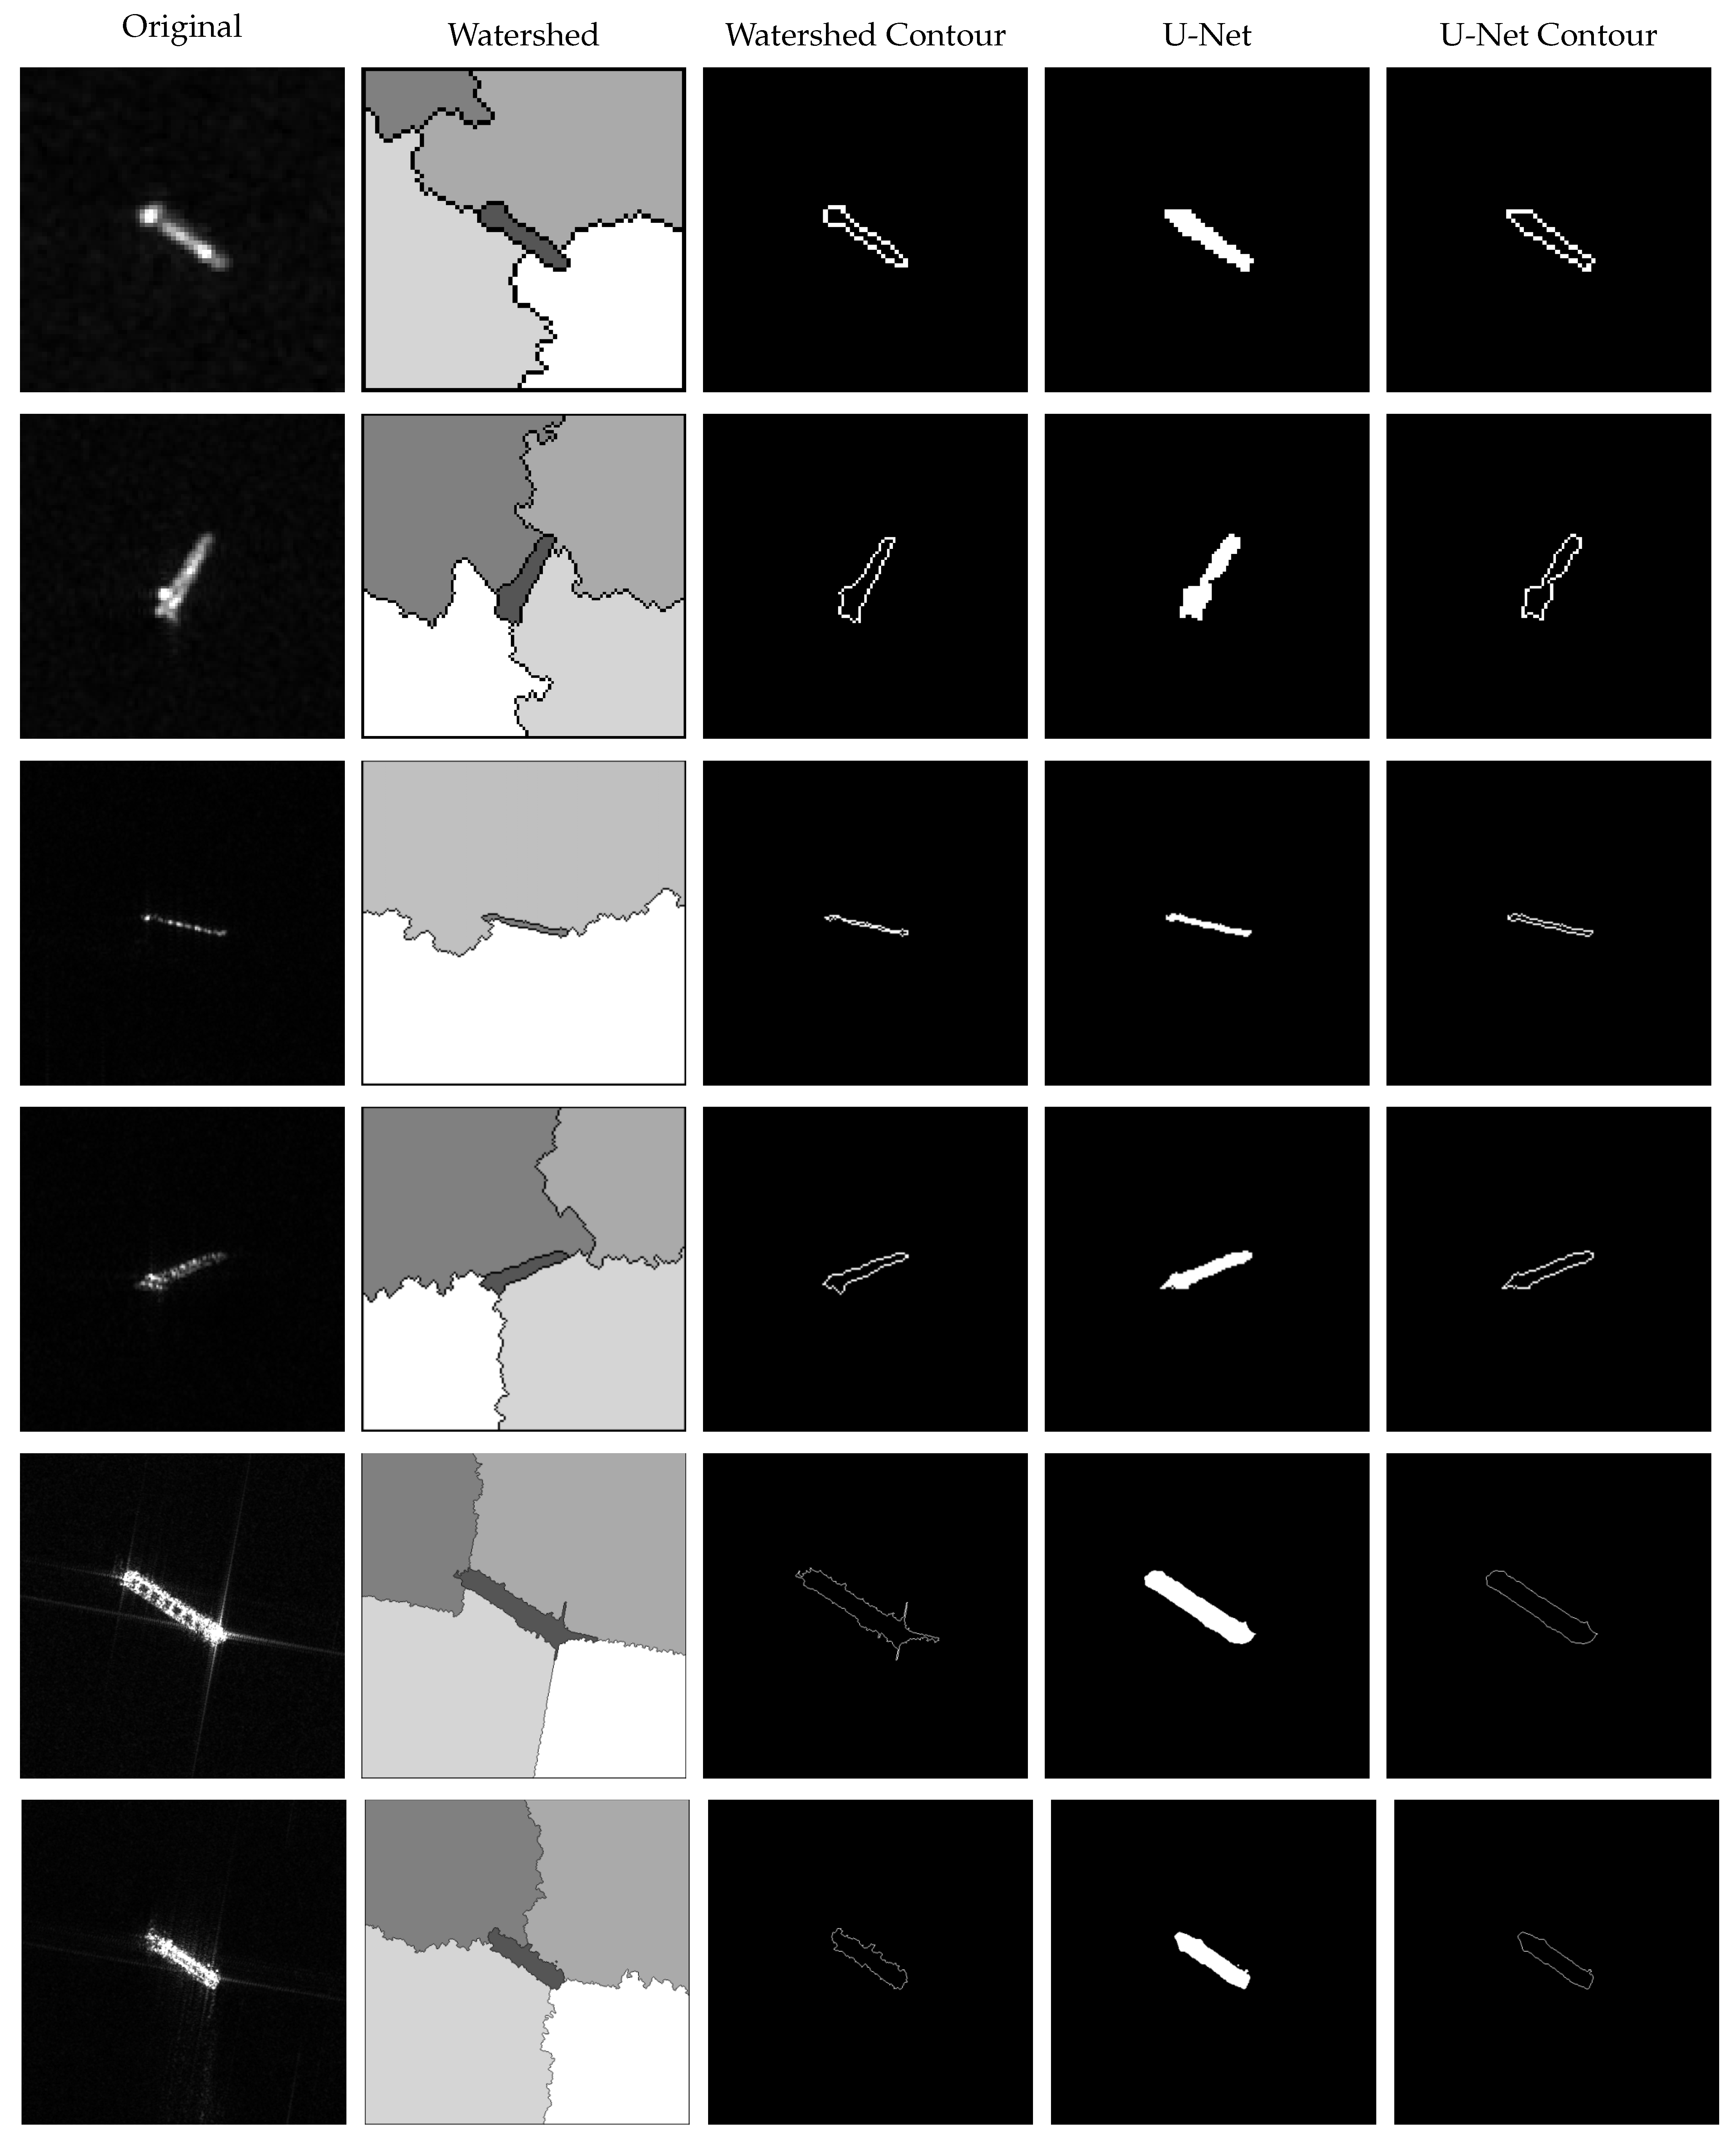
In Table 3, it is observed that U-Net surpasses the watershed segmentation method on the HRSID dataset with a margin of 37% in IoU and 30% in Dice coefficient, respectively. This performance advantage demonstrates U-Net’s effectiveness, particularly in scenarios with ample training data, which is characteristic of deep-learning approaches. In contrast, watershed segmentation is inclined to produce oversegmentation, leading to instances where parts of a ship are incorrectly identified as separate entities or as backgrounds. Additionally, in situations with multiple ships, the watershed method may fail to accurately identify all of them, as illustrated in Figure 5.
The performance comparison on the OpenSARShip GRD samples reveals that watershed segmentation outperforms U-Net, exceeding by more than 7% in both IoU and Dice coefficient metrics. Several factors contribute to this shift in performance dynamics. Primarily, the spatial resolution difference is notable, with HRSID images at 3 m compared to OpenSARShip’s 22 m resolution. Moreover, HRSID scenes often feature multiple ships distributed throughout, whereas OpenSARShip and FUSAR-Ship typically showcase a single, centrally located ship, simplifying the segmentation challenge. For the SLC samples, however, U-Net surpasses watershed by 13% due to the latter’s inclination towards oversegmentation. This issue becomes more prevalent due to the speckle noise in SLC images that is typically reduced in GRD processing through multilooking techniques. The comparison with FUSAR-Ship data aligns U-Net’s performance closer to that observed with HRSID in terms of both IoU and Dice, which is expected considering the similar spatial resolutions shared between the two datasets. The gap between U-Net and watershed narrows to a 9% difference in IoU and approximately 7% in the Dice coefficient, favoring U-Net.
Figure 6 illustrates the contour extraction process across different samples. Notably, in scenarios with minimal noise, such as those presented by the GRD samples, the watershed algorithm closely follows the ship’s outline, while U-Net creates a coarser mask. Furthermore, in the context of FUSAR-Ship samples, the watershed is observed to be more vulnerable to including strong sidelobes as part of the ship, a distortion U-Net effectively mitigates. In summary, the performance gap between the watershed algorithm and U-Net is narrower than initially shown by the HRSID dataset, particularly for tasks focusing on segmenting a single ship. If there were enough training samples available, or if the datasets closely matched in terms of spatial resolution, U-Net would likely perform better than the watershed algorithm. This improvement would be more noticeable with high-quality training masks that closely match the ship contours. Additionally, fine-tuning U-Net with a small number of samples from the target dataset could further boost its performance. However, under conditions of limited training samples or computational power, the watershed algorithm stands out as a practical choice.

5.2. Classification Results

The classification results for the OpenSARShip dataset are presented in Table 4. For the GRD samples, the combination of contour features achieves the best results across all classification metrics compared to handcrafted features mentioned in previous studies. Specifically, the classification accuracy of the watershed algorithm is 3% higher than that of U-Net, consistent with the segmentation task, where it also showed superior performance. Moreover, the radiometric contour features offer an improvement of over 3% in accuracy over the geometric features in both segmentation approaches.
For the SLC samples, the combined contour features continue to outperform, with a 7% increase in accuracy over the next best set of features. Additionally, U-Net’s performance exceeds that of the watershed by 3%, aligning with the segmentation findings presented in Table 3. Within the U-Net outcomes, geometric and radiometric features show a minor difference of 2% in accuracy, indicating a similar impact on classification success. Conversely, a significant 9% difference is observed between these feature types in the watershed results, likely due to the segmentation method rather than the features themselves; otherwise, this disparity would be consistent across both segmentation approaches.
Across both datasets, the optimal contour features achieve an accuracy that is more than 7% higher than the VGG-19 network. This highlights the competitive performance of handcrafted features relative to deep learning, particularly when training samples are limited. Furthermore, when comparing GRD and SLC samples, GRD images show better classification metrics across all feature types, which is likely attributable to their processing. U-Net demonstrates more consistent results, with less than a 4% difference in the combined contour outcomes between datasets versus a 10% difference seen with watershed, suggesting U-Net’s lesser sensitivity to noise compared to watershed segmentation.
Table 5 presents the classification performance on the FUSAR-Ship dataset. Within the three-category set, U-Net’s combined contour features produce the highest accuracy, though NGFs perform better in recall and F1 score by a difference of 10% and 3%, respectively. It is important to highlight that the small sample size for testing in the container and tanker categories means that precision, recall, and F1 scores are significantly impacted by the misclassification of even a single sample due to equal weighting in class averaging. This is further supported by the results of the 5-category set, where the inclusion of the fishing and cargo classes results in the combined contour features achieving the best results across all metrics. Furthermore, the accuracy derived from U-Net surpasses that of the watershed method by nearly 5%. Notably, U-Net’s geometric features outperform its radiometric counterparts by about 5%, a pattern mirrored in the comparison of NGFs with LRCS features. This distinction likely stems from the improved spatial resolution of the dataset, enabling a more precise extraction of geometric features.
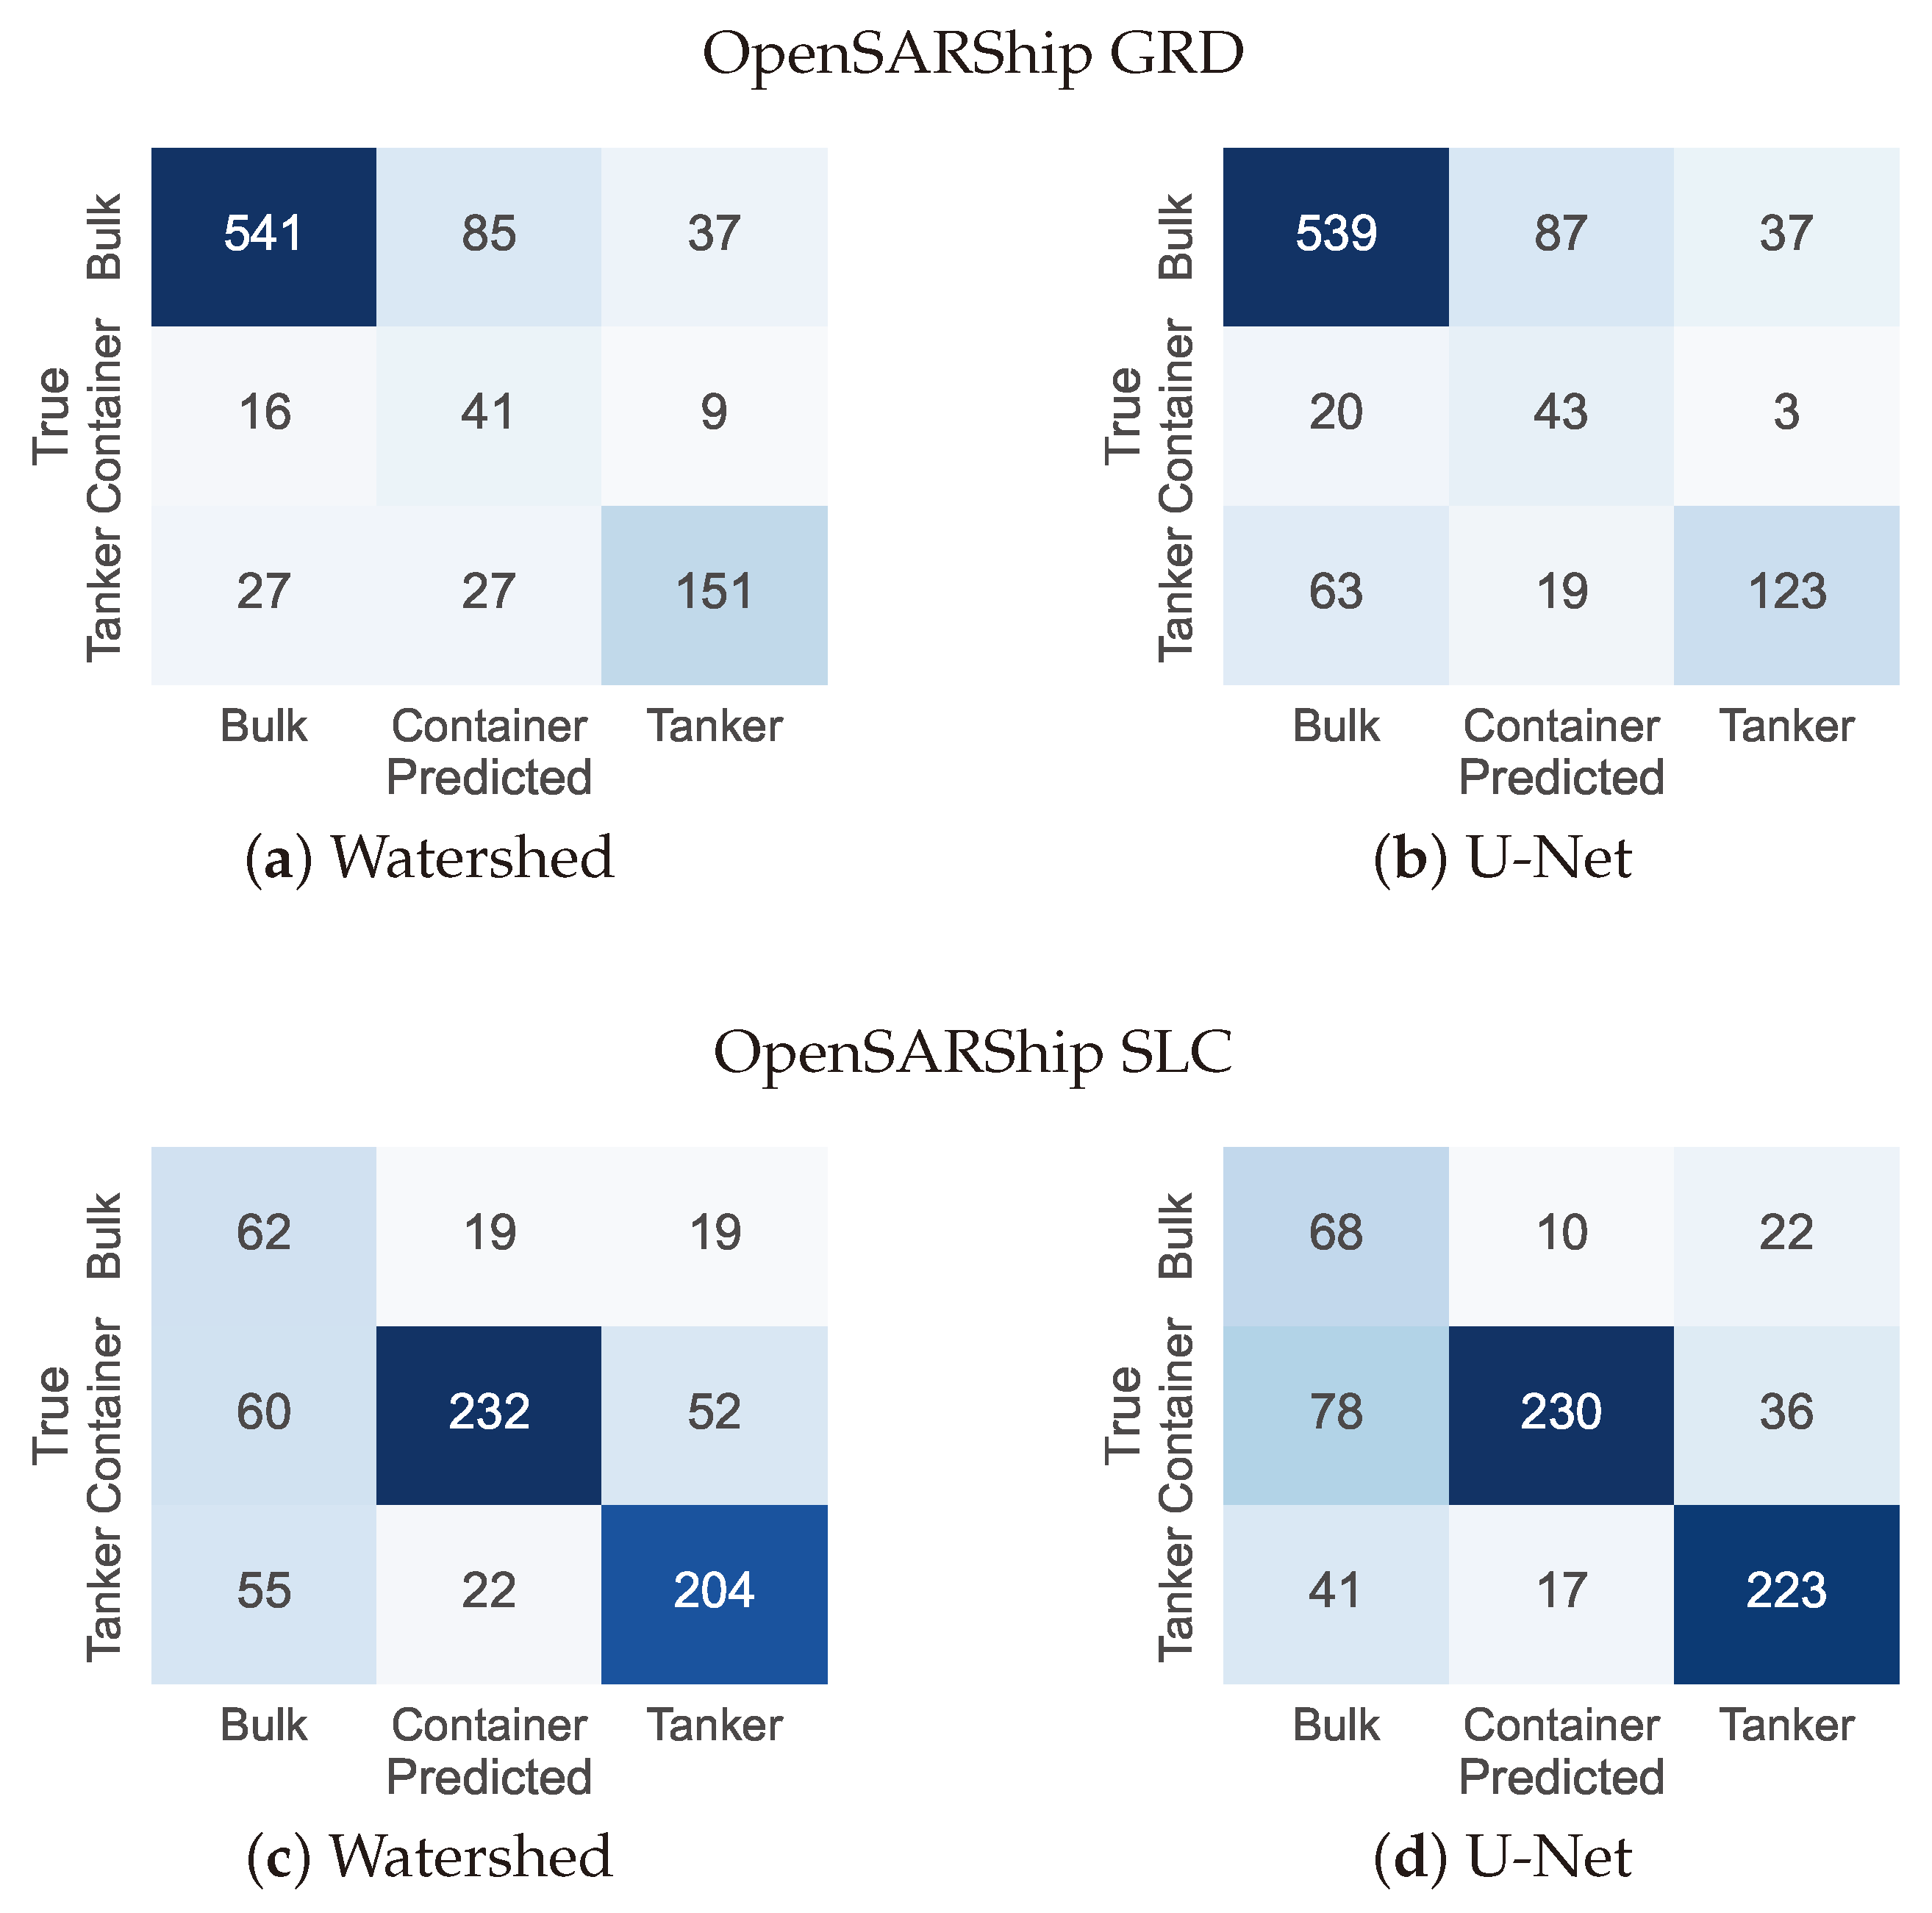
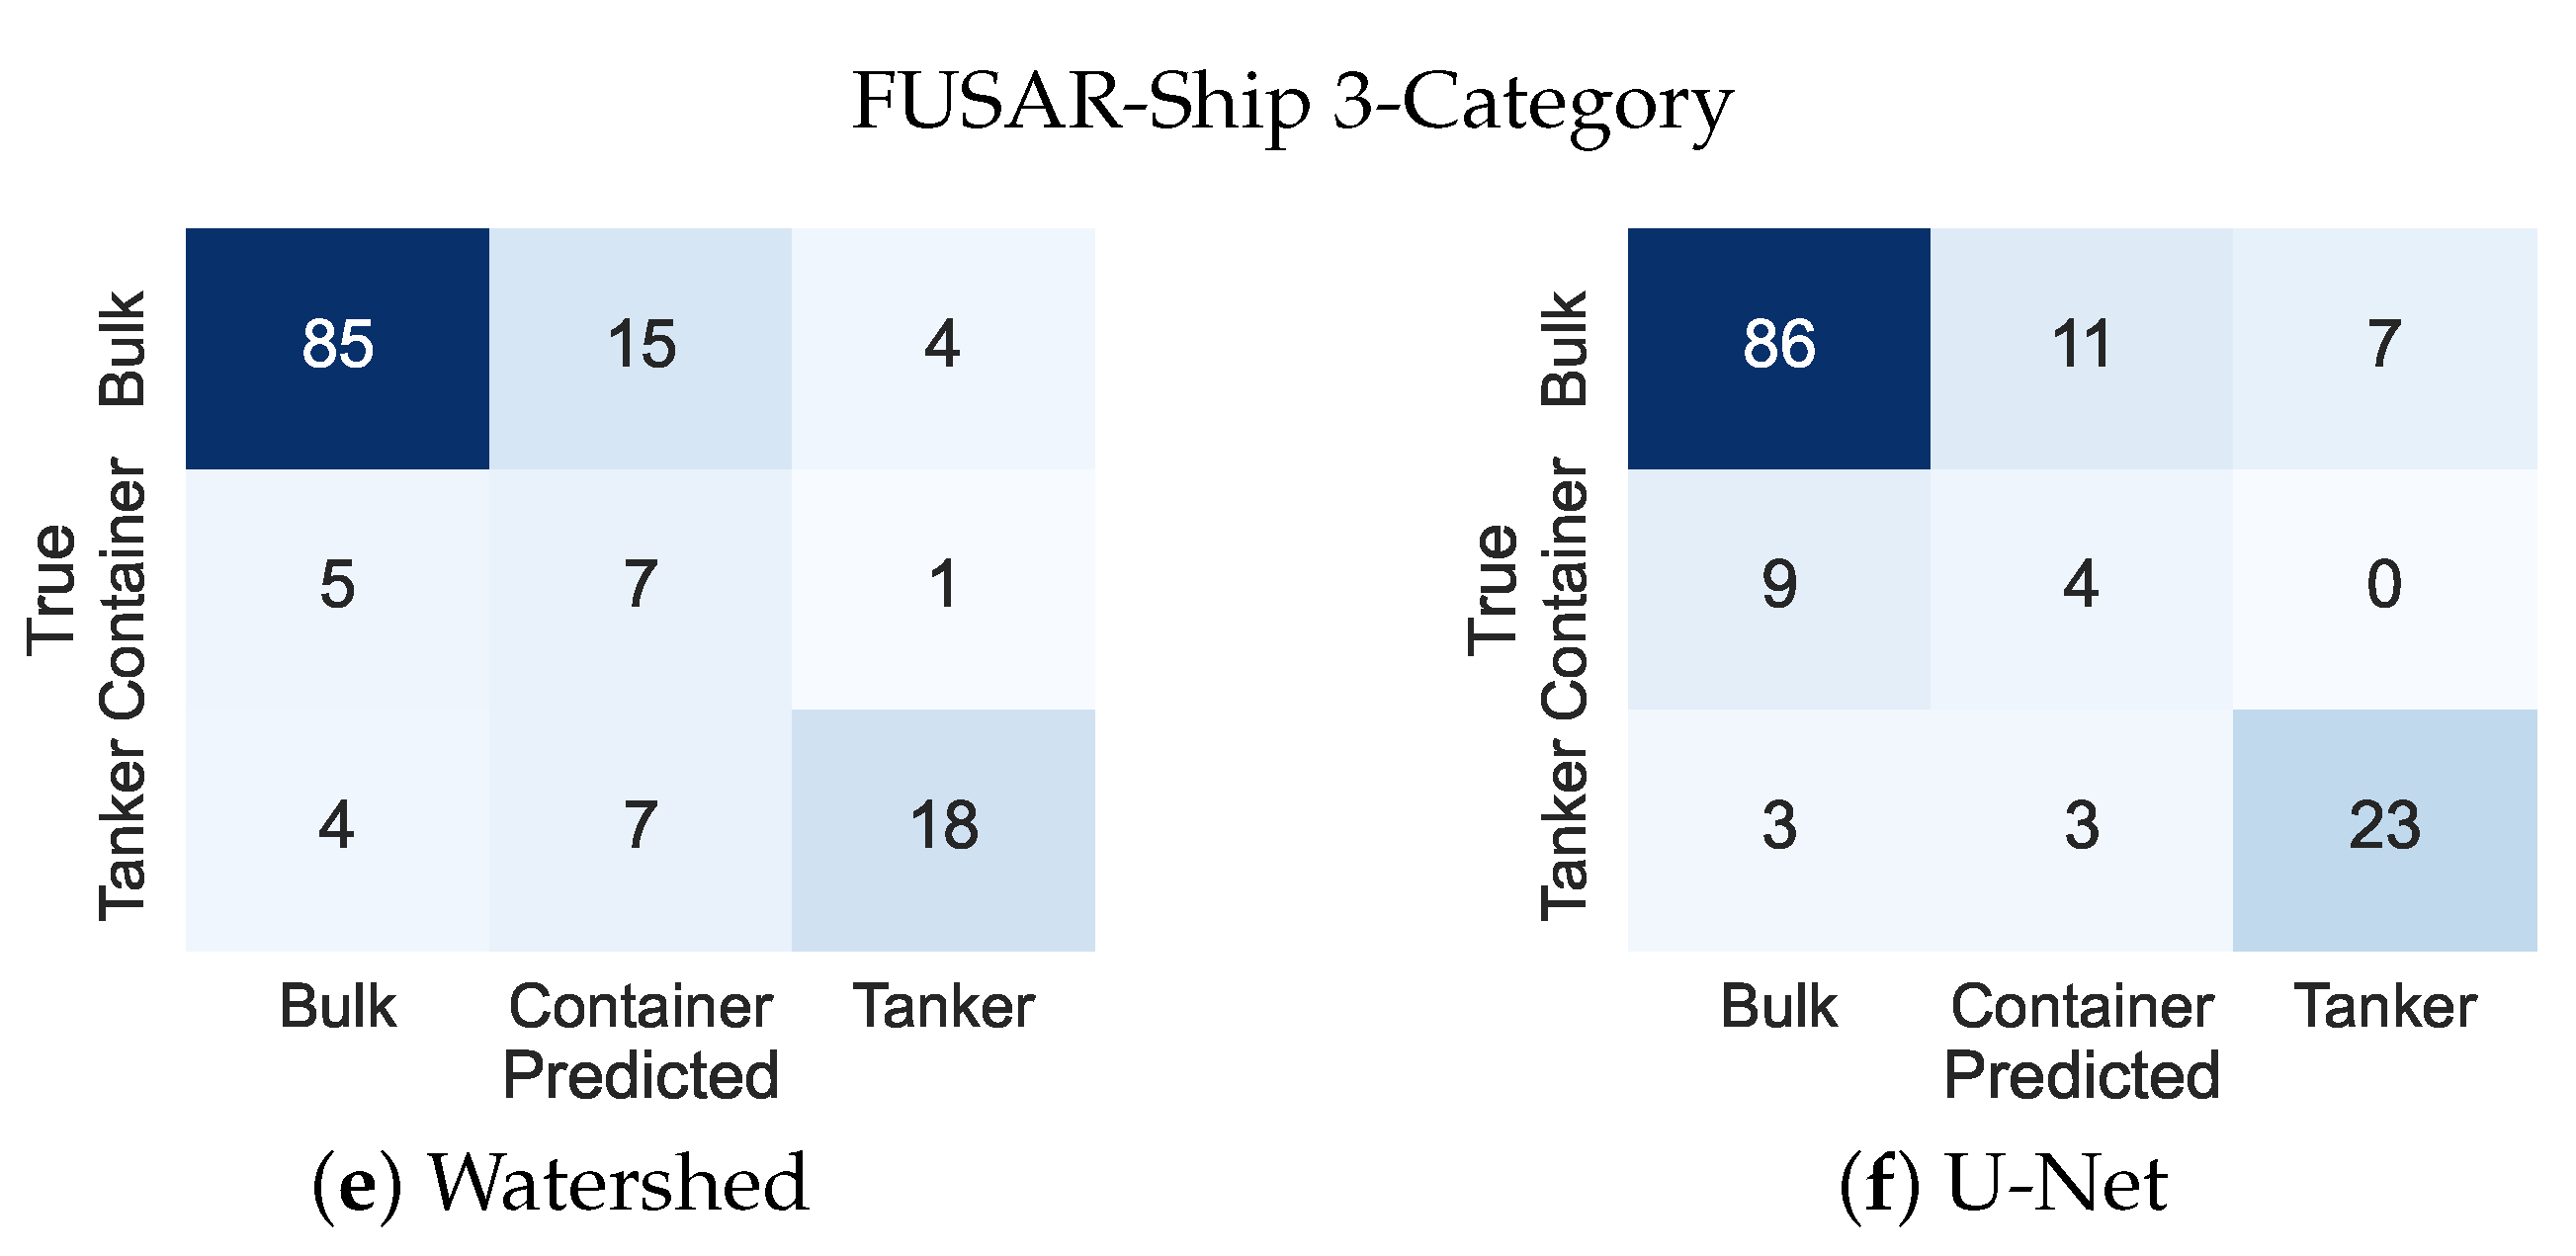
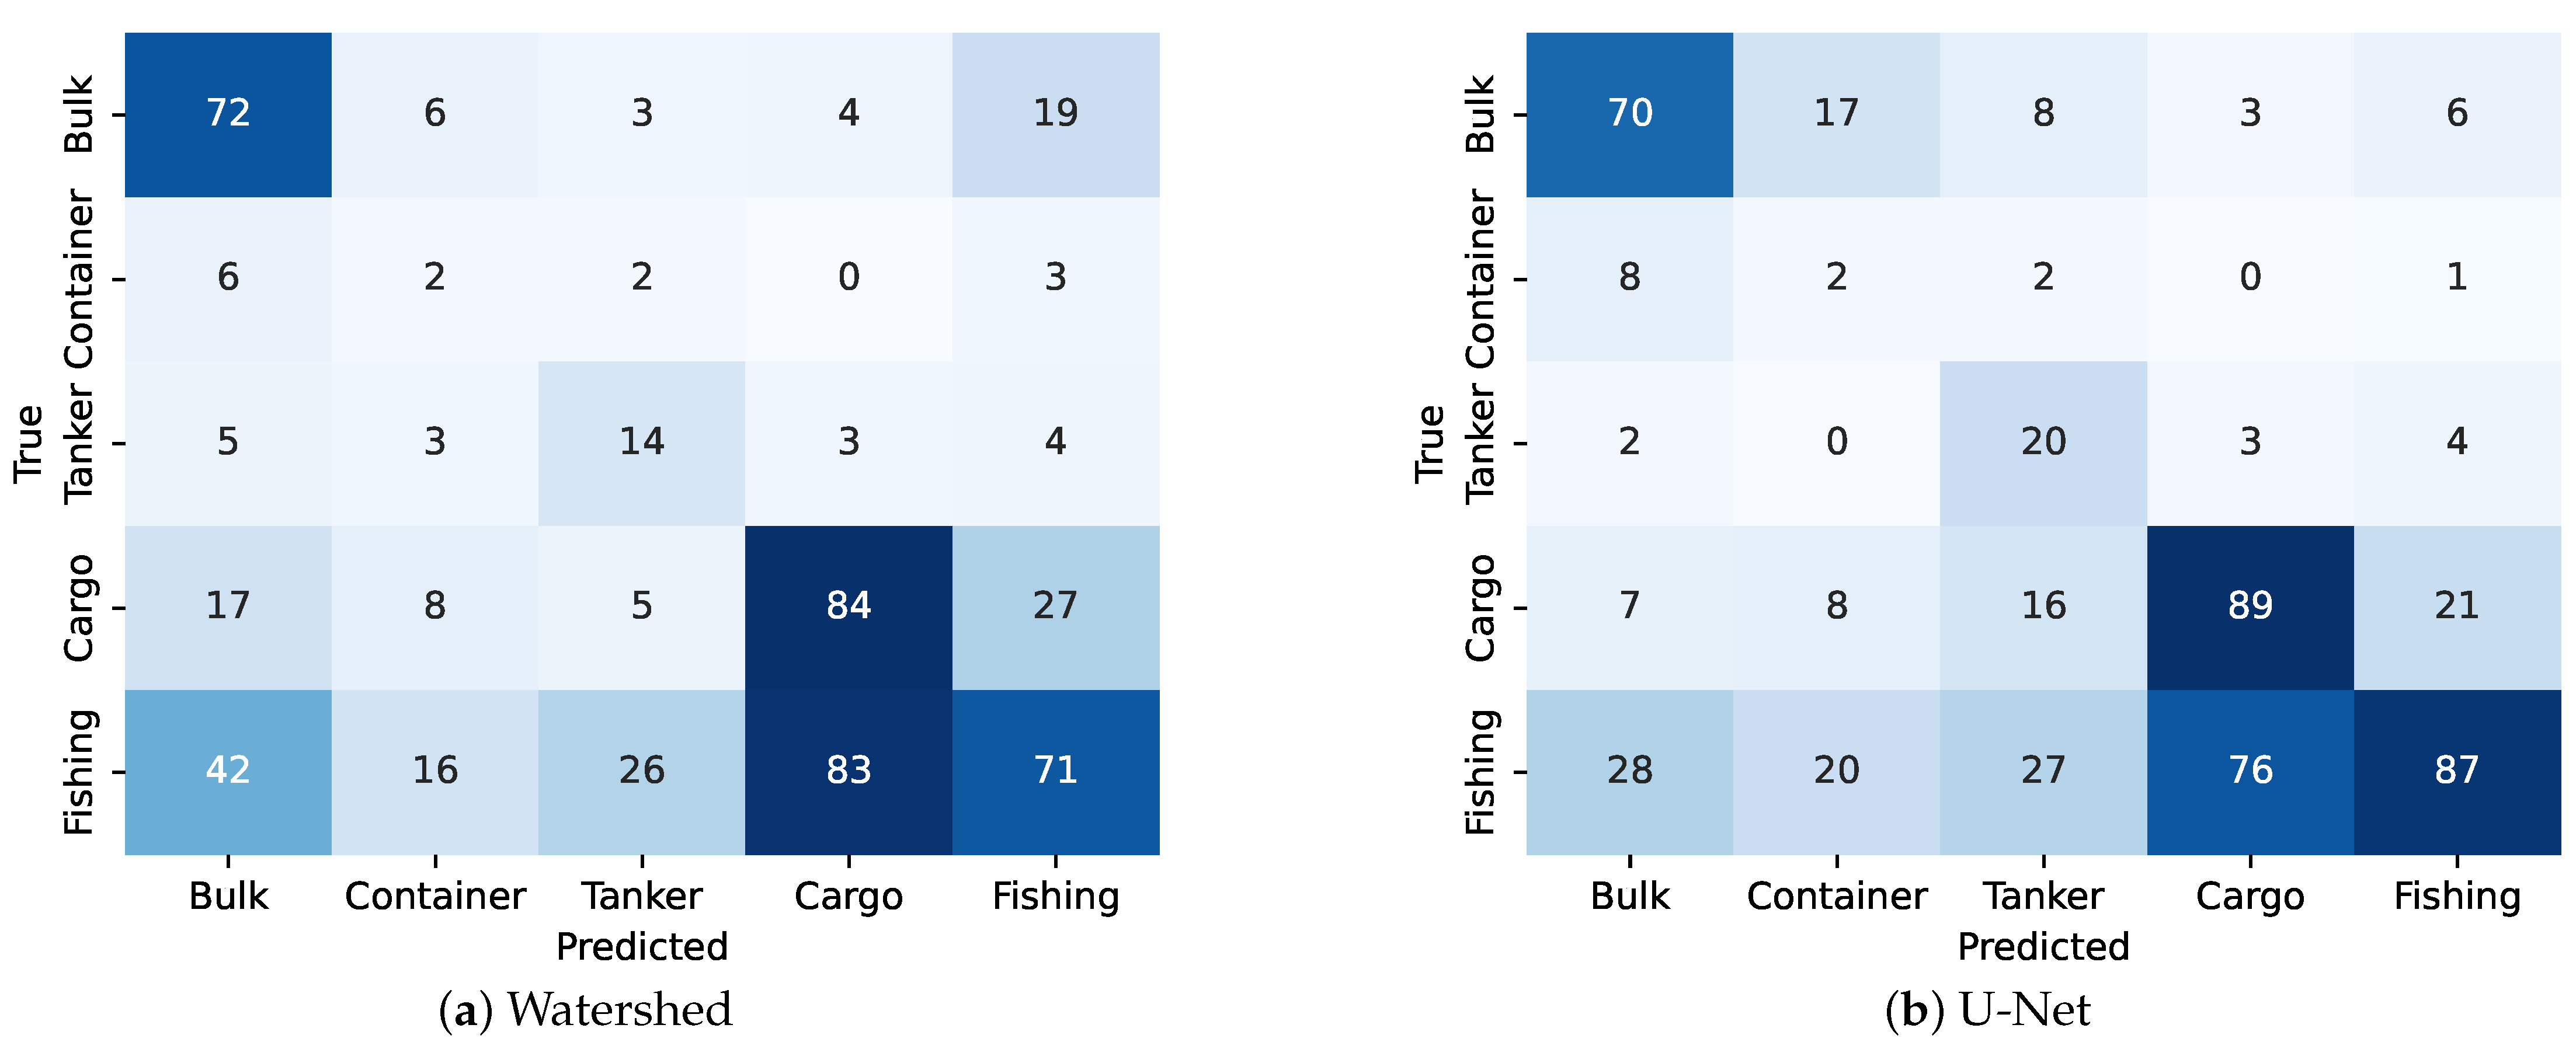
The confusion matrices for the classification outcomes based on the proposed features are displayed in Figure 7 and Figure 8. For the GRD dataset, bulk carriers achieve the highest classification accuracy, while container ships exhibit the lowest. This discrepancy may be attributed to the comparatively smaller sample size of container ships available for testing. A notable factor contributing to U-Net’s reduced performance relative to the watershed is the misclassification of tanker samples as bulk carriers. Conversely, in the SLC dataset, tankers are classified more accurately with U-Net. This is again likely attributed to U-Net’s enhanced robustness against noise and oversegmentation.
Regarding the three-category set of FUSAR-Ship samples, it can be seen that due to the low numbers of container ships, the misclassification of just 3 additional samples drops the class accuracy significantly from 54% with watershed to 31% with U-Net. In the five-category analysis, both segmentation approaches show a high rate of confusion between fishing and cargo ships, indicating a substantial feature overlap between these classes. This suggests that additional, perhaps more granular features or contextual information not captured by the current feature set might be necessary to distinguish effectively between these two ship types.

5.3. Entropy-Based Ensembling Results

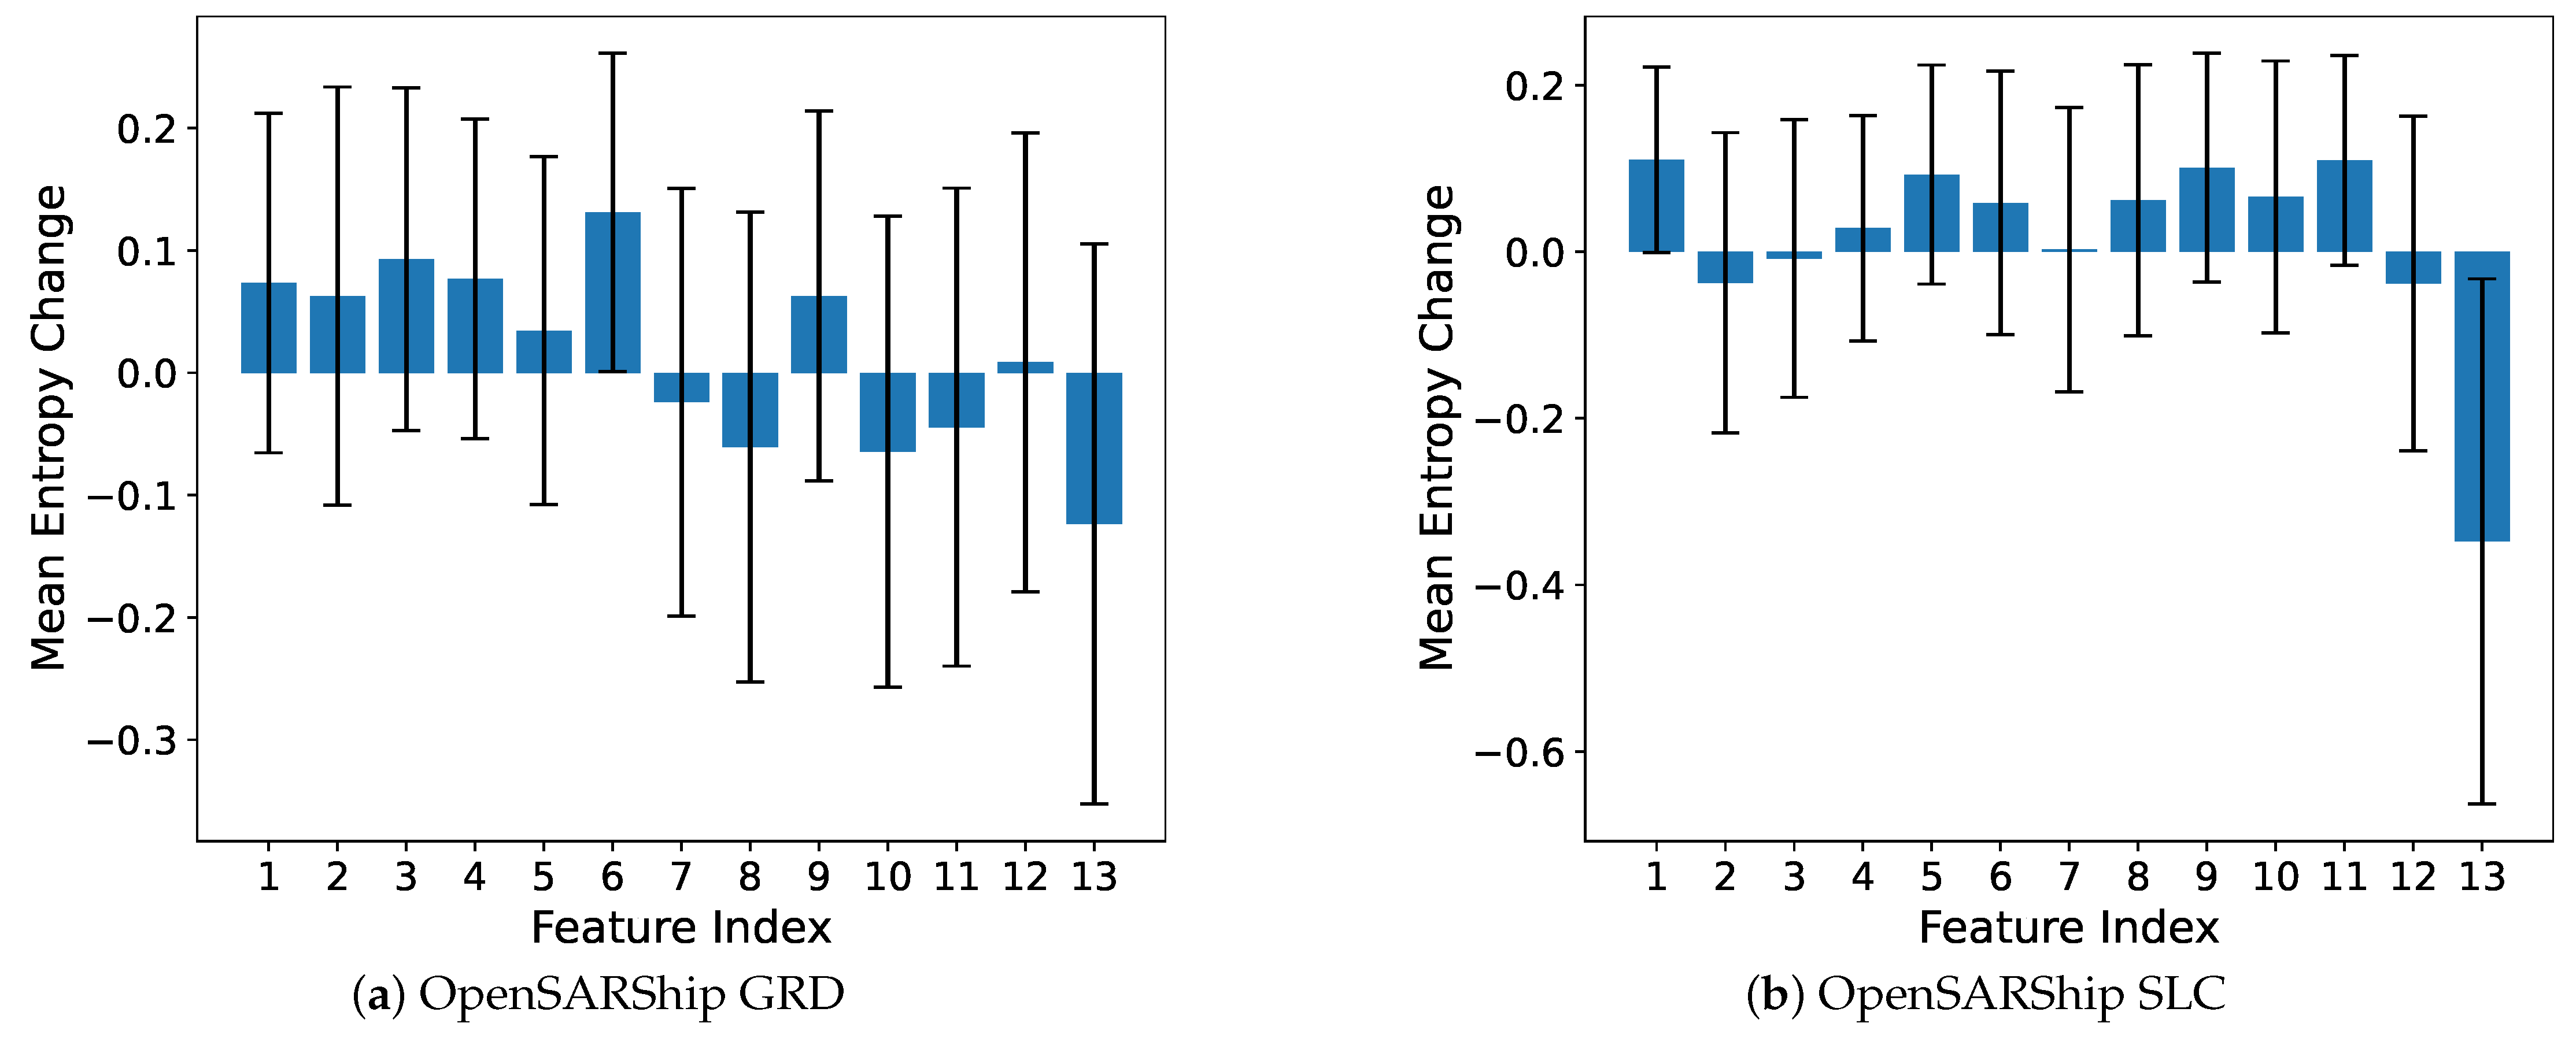
The robustness and sensitivity of each proposed contour feature are examined in Figure 9, which depicts the mean and standard deviation of the entropy change aggregated across all samples, each feature being perturbed by Gaussian noise 10 times. The graph predominantly shows a positive entropy change for the majority of features, indicating that the introduction of noise increases entropy and, consequently, the model’s predictions become more uncertain. This result aligns with expectations, as noise generally introduces uncertainty and complicates accurate sample classification.
In the GRD dataset, feature f 6 exhibits the most significant positive change, highlighting its high sensitivity to noise, whereas f 11 demonstrates the least change, indicating robustness and stability. Conversely, across both datasets, feature f 13 consistently presents the largest negative change, which is counter-intuitive. This unexpected behavior suggests that noise perturbation may, in some cases, clarify the decision boundary or correct misleading original feature values, potentially simplifying the model’s classification task. Such anomalies are noteworthy and merit deeper investigation to understand the underlying causes. On the other hand, features f 7 and f 12 appear stable across both datasets, highlighting their reliability.
This detailed analysis not only sheds light on the interplay between features and entropy but also suggests the potential adaptability of the features to different datasets with varying image characteristics, providing crucial insights for optimizing feature selection and improving model robustness in diverse operational environments.
The results presented in Table 6 demonstrate that the SVM, RF, and GPC models exhibit comparable performance under baseline conditions, with a marginal accuracy difference of around 2%. The introduction of expanded samples and feature concatenation adversely affects the SVM and GPC models, likely due to increased dataset complexity and noise, leading to overfitting and diminished generalization capabilities. In contrast, the RF model, benefiting from its ensemble approach, shows improved performance in the SLC dataset by effectively utilizing the additional data and features. Ensemble methods, such as majority voting, marginally enhance the accuracy of all classifiers by synthesizing insights from various models. Notably, probability averaging yields a 1–3% accuracy boost compared to majority voting by integrating classifier decisions at a more detailed level. The minimum-entropy method, however, shows a decline in accuracy compared to the optimal model in the GRD dataset, but it exhibits an increase in the SLC dataset, suggesting that the latter’s entropy is better calibrated with accuracy. Across both datasets, the entropy-weighted method surpasses most other methods by assigning greater weight to classifications with lower entropy, indicating higher certainty. These findings reveal two key insights: first, the integration of additional contours consistently enhances the performance of all classifiers, and second, entropy-weighted averaging proves to be particularly effective in maximizing classification accuracy by leveraging confidence levels derived from entropy measures.
Additionally, it can be seen that the ensemble combining SVM, RF, and GPC classifiers achieves an accuracy that surpasses the SVM ensemble by 0.6%, yet it remains 0.8% and 1.7% less accurate than the GPC and RF ensembles, respectively. This observation indicates that leveraging diverse contour representations through an ensemble approach leads to a larger performance enhancement compared to merely diversifying the types of classifiers. The superior performance of such an ensemble is largely attributed to the rich variety of information encapsulated within the additional contours, which effectively capture distinct and critical information across varying scales. Furthermore, employing a consistent classifier type across different feature sets ensures that the probabilities are derived uniformly, which means that they are more directly comparable and relevant than would be possible when aggregating predictions from different classifiers, each employing its unique method for probability estimation. The comparative analysis between the probability averaging method and the entropy-weighted approach within the SVM-RF-GPC ensemble further validates this argument. Specifically, the entropy-weighted method, which emphasizes predictions with lower uncertainty, achieves higher accuracy than probability averaging. This outcome demonstrates that entropy, as a measure of prediction certainty, serves as a more reliable metric for aggregating predictions across different classifiers. The entropy-weighted approach, by prioritizing predictions with lower uncertainty, inherently aligns with the intuition that the most confident predictions, regardless of the classifier, contribute more significantly to the ensemble’s overall accuracy. This approach highlights the value of entropy as a unifying metric for ensemble models, especially when integrating insights from classifiers trained on various contour representations.

5.4. Confidence-Aware Classification Results

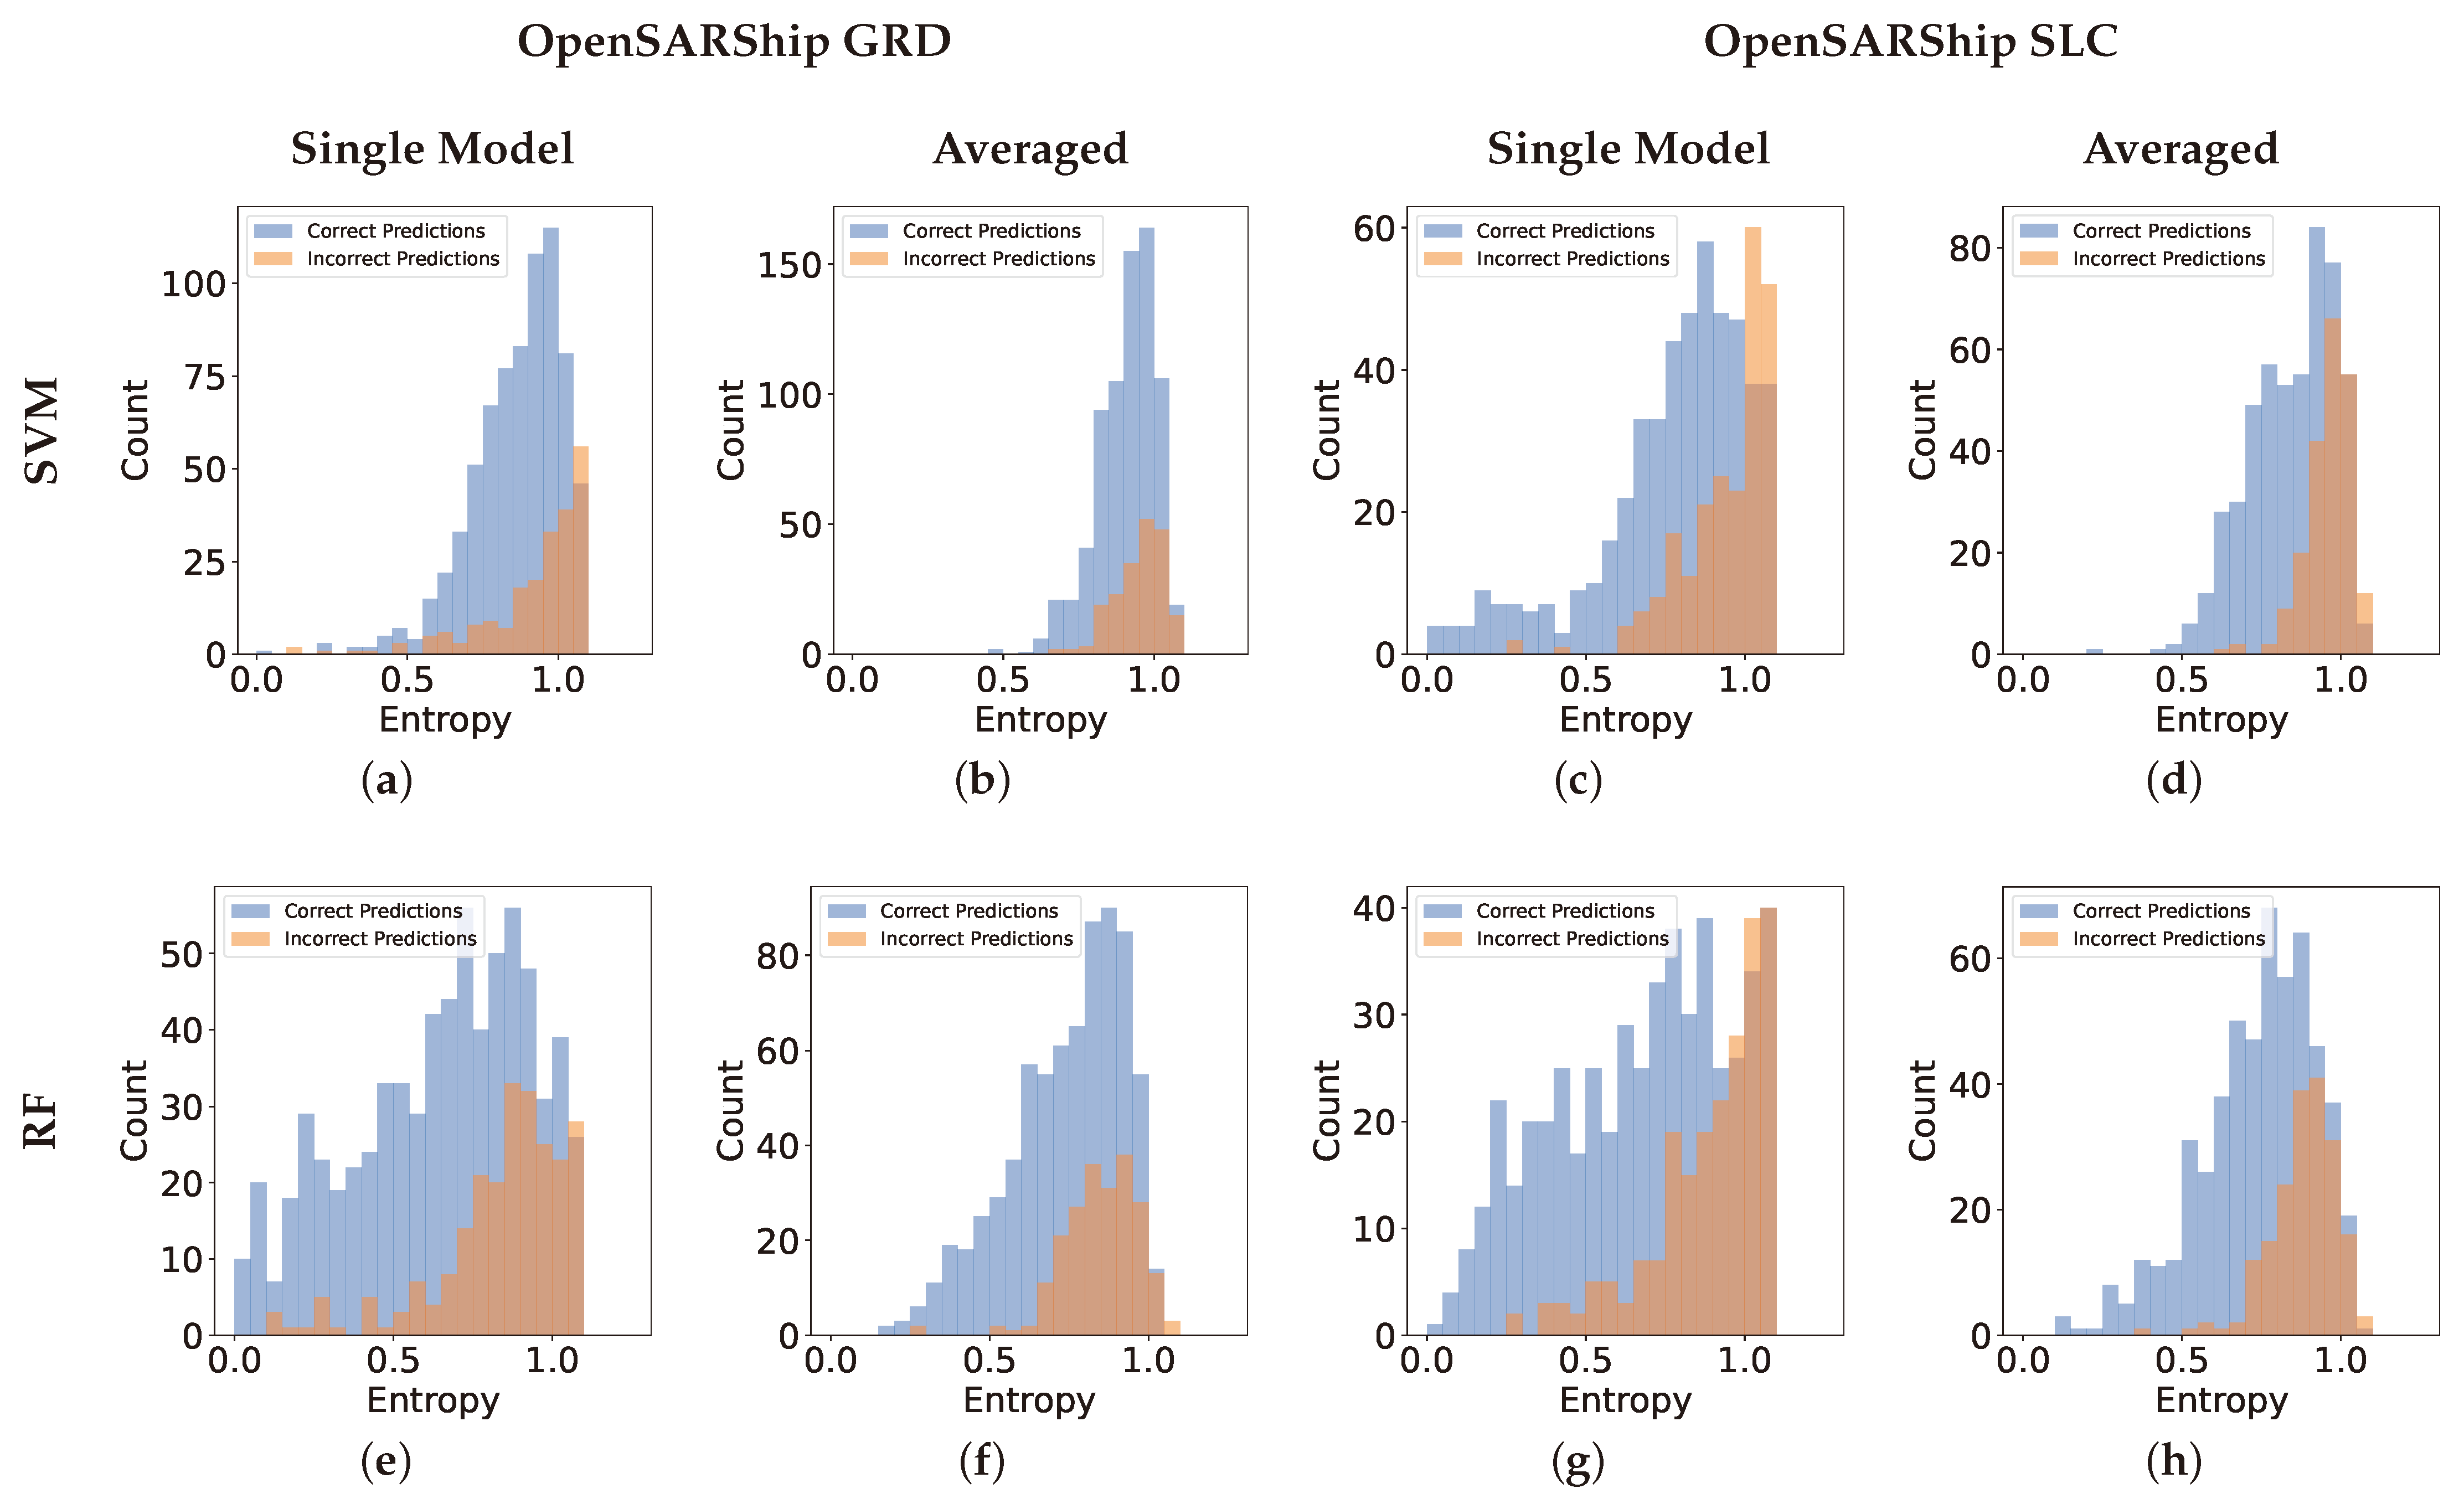
In Figure 10, the histograms of the entropies derived from single classifiers are compared with those of the mean entropy of all five models. Each of these five models represents the same base classifier, trained on contours extracted using one of the five percentiles detailed in Section 4.2.3. It is observed that the entropy distribution for the single classifiers exhibits a linear increase for both the GRD and SLC datasets. Conversely, the mean entropies across the five models appear to follow a Gaussian distribution, which indicates agreement with the CLT hypothesis. Notably, data points at the extreme low and high ends of entropy are reduced, indicating a centralizing trend when aggregating the classifiers. This phenomenon is expected given that for a sample to maintain a low mean entropy, each of the five classifiers must individually report low entropy values. Such consistency typically arises when the features across various capping percentiles are equally discriminative, which is often the case with high-quality samples that accurately capture contour variations at multiple scales. This also implies that the different thresholds are not adversely affecting the contour extraction process, hence pointing to a sample with minimal noise. Conversely, for the mean entropy to remain high, each classifier would need to produce high-entropy values, suggesting that the features across all contours are not discriminative enough. This could signal poor sample quality, potentially due to high noise levels or other artifacts that challenge feature extraction. These insights demonstrate the advantage of employing an ensemble method, where the averaging process across models can mitigate the impact of outliers that may adversely affect single-classifier predictions.
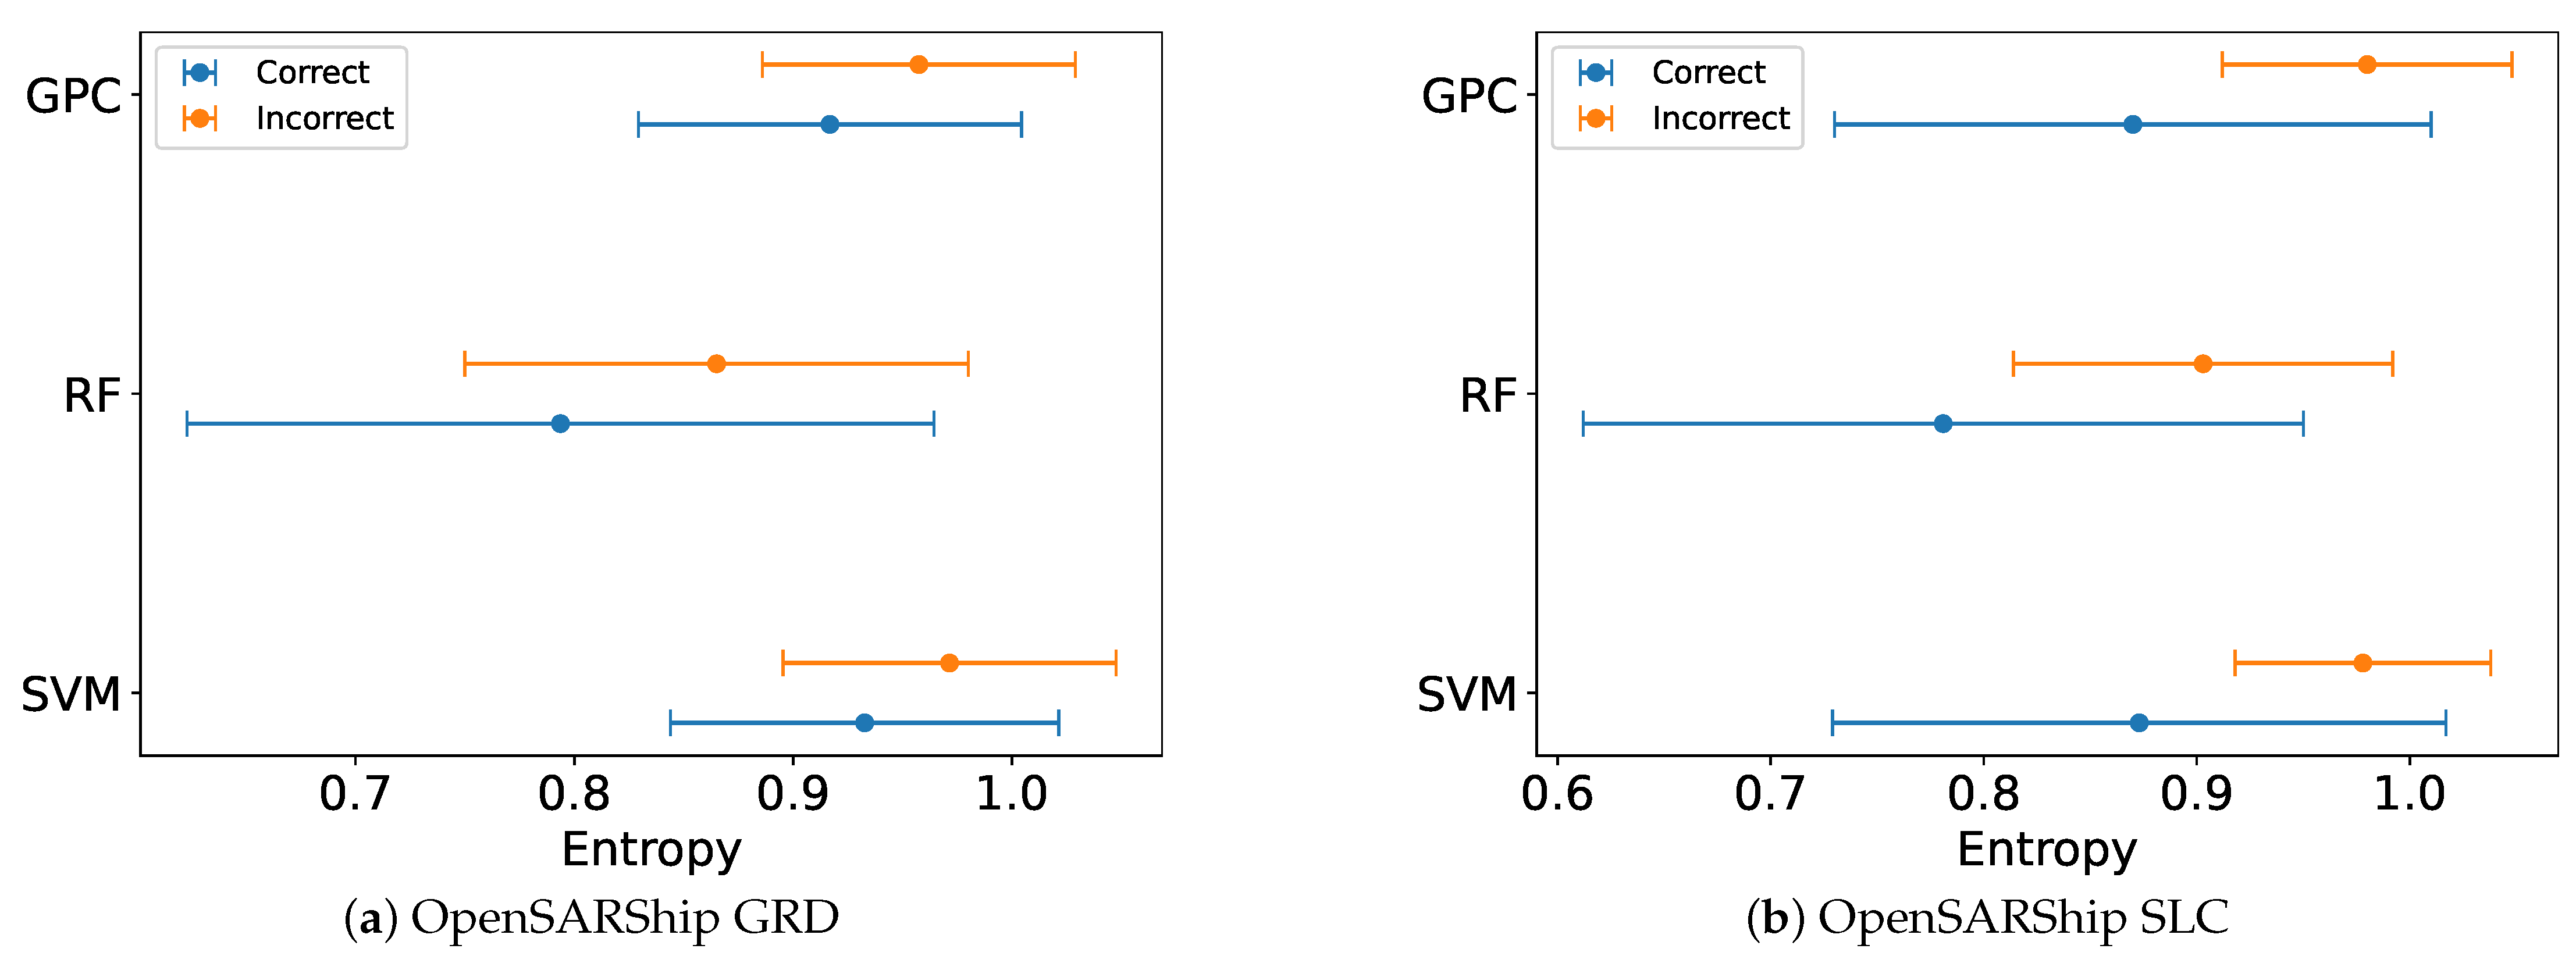
Figure 11 presents the mean and standard deviation of Gaussian distributions fitted to the entropies of correct and incorrect predictions. The RF ensemble’s entropy values are characterized by the lowest mean and the highest standard deviation, indicating a wider spread of prediction certainty. Conversely, the SVM and GPC display higher mean entropies. Notably, the separation between the mean entropies of correct and incorrect predictions is marginally greater for RF than for SVM and GPC, suggesting a more pronounced distinction between correct and incorrect classifications in the RF model. Additionally, the minimal change in mean entropy across different datasets for each classifier indicates that entropy, as a measure of prediction certainty, is robust and yields consistent results for the same classifier even when applied to different data, provided the feature set remains constant.
The process of fitting a Gaussian distribution to the aggregated entropies and segmenting the predictions into three bands of confidence levels is detailed in Table 7. This categorization was conducted without differentiating between correct and incorrect predictions, instead treating the data as a singular set to mimic the real-world scenario where the correctness of future unlabeled test samples is unknown. When the confidence levels derived from individual models are compared to those from the ensemble approach, the ensemble is observed to yield a greater proportion of samples within the high-confidence category. This result is advantageous, assuming that there is a calibration between confidence and accuracy, which seems to be reliably present at the ensemble level for both the GRD and SLC datasets.
Further examination reveals that the ensemble not only boosts the quantity of high-confidence predictions but also enhances the accuracy within this band compared to the individual models. Specifically, in the GRD dataset, the single model’s accuracy is fairly consistent between the high and moderate confidence levels, with a marginal 3% difference for the RF and GPC classifiers. For SVM, a peculiar trend emerges, with the moderate confidence band showing slightly higher accuracy than the high-confidence band. In contrast, with the ensemble model, the accuracy differential widens to about 7% for SVM and GPC and an even more substantial 16% for RF. Significantly, models at the moderate confidence level achieve slightly better accuracy than the ensemble’s general accuracy without considering confidence levels, as reported in Table 6. This improvement suggests a reliable link between entropy and accuracy, given that the moderate confidence level includes entropy values in the range μ σ to μ . This implies that predictions with entropy lower than the average tend to be more accurate. This correlation holds true for the high-confidence level, where lower entropy suggests higher accuracy, and the low-confidence level, where higher entropy suggests lower accuracy. These results support the use of entropy as a valid measure of prediction certainty, highlight the limitations of relying solely on the direct mean and standard deviation of individual models for estimation, and demonstrate the benefits of averaging entropies and analyzing their distribution to enhance prediction confidence and accuracy.
However, an apparent discrepancy in the SVM ensemble’s F1 scores for the OpenSARShip SLC dataset can be noticed, where the Middle confidence level’s F1 score exceeds that of the high-confidence level. This difference seems counter-intuitive compared to the accuracy results, which appropriately show higher values for the high-confidence level. This discrepancy arises from the method used to calculate the F1 score, which assigns equal importance to each class to account for the imbalance in the test set. This effect is further illustrated in Figure 12, showing the distribution of confidence levels across different ship categories. Notably, in the bulk category, a single sample was assigned high confidence but was misclassified. While some misclassifications are expected even at high confidence levels, having only one sample in this category and it being misclassified is statistically rare. This scenario is highlighted as an outlier when comparing it to the consistent F1 scores of other classifiers within the same dataset.
Further analysis of the confidence level distribution by ship category reveals that bulk carriers predominantly fall into the low-confidence level, whereas tankers are more frequently categorized with high confidence. This pattern suggests that bulk carrier samples may possess more noise, or the model’s training data may not sufficiently represent the variability in bulk carriers. This is intriguing because bulk carriers typically have standard superstructures, contrary to container ships, which might exhibit significant variations due to different container configurations. Nonetheless, this type of analysis proves valuable as it directs attention to the classes or areas that warrant priority in addressing. It provides crucial insights into the present condition of the datasets and models, facilitating a focused strategy for improving classification accuracy and model robustness.
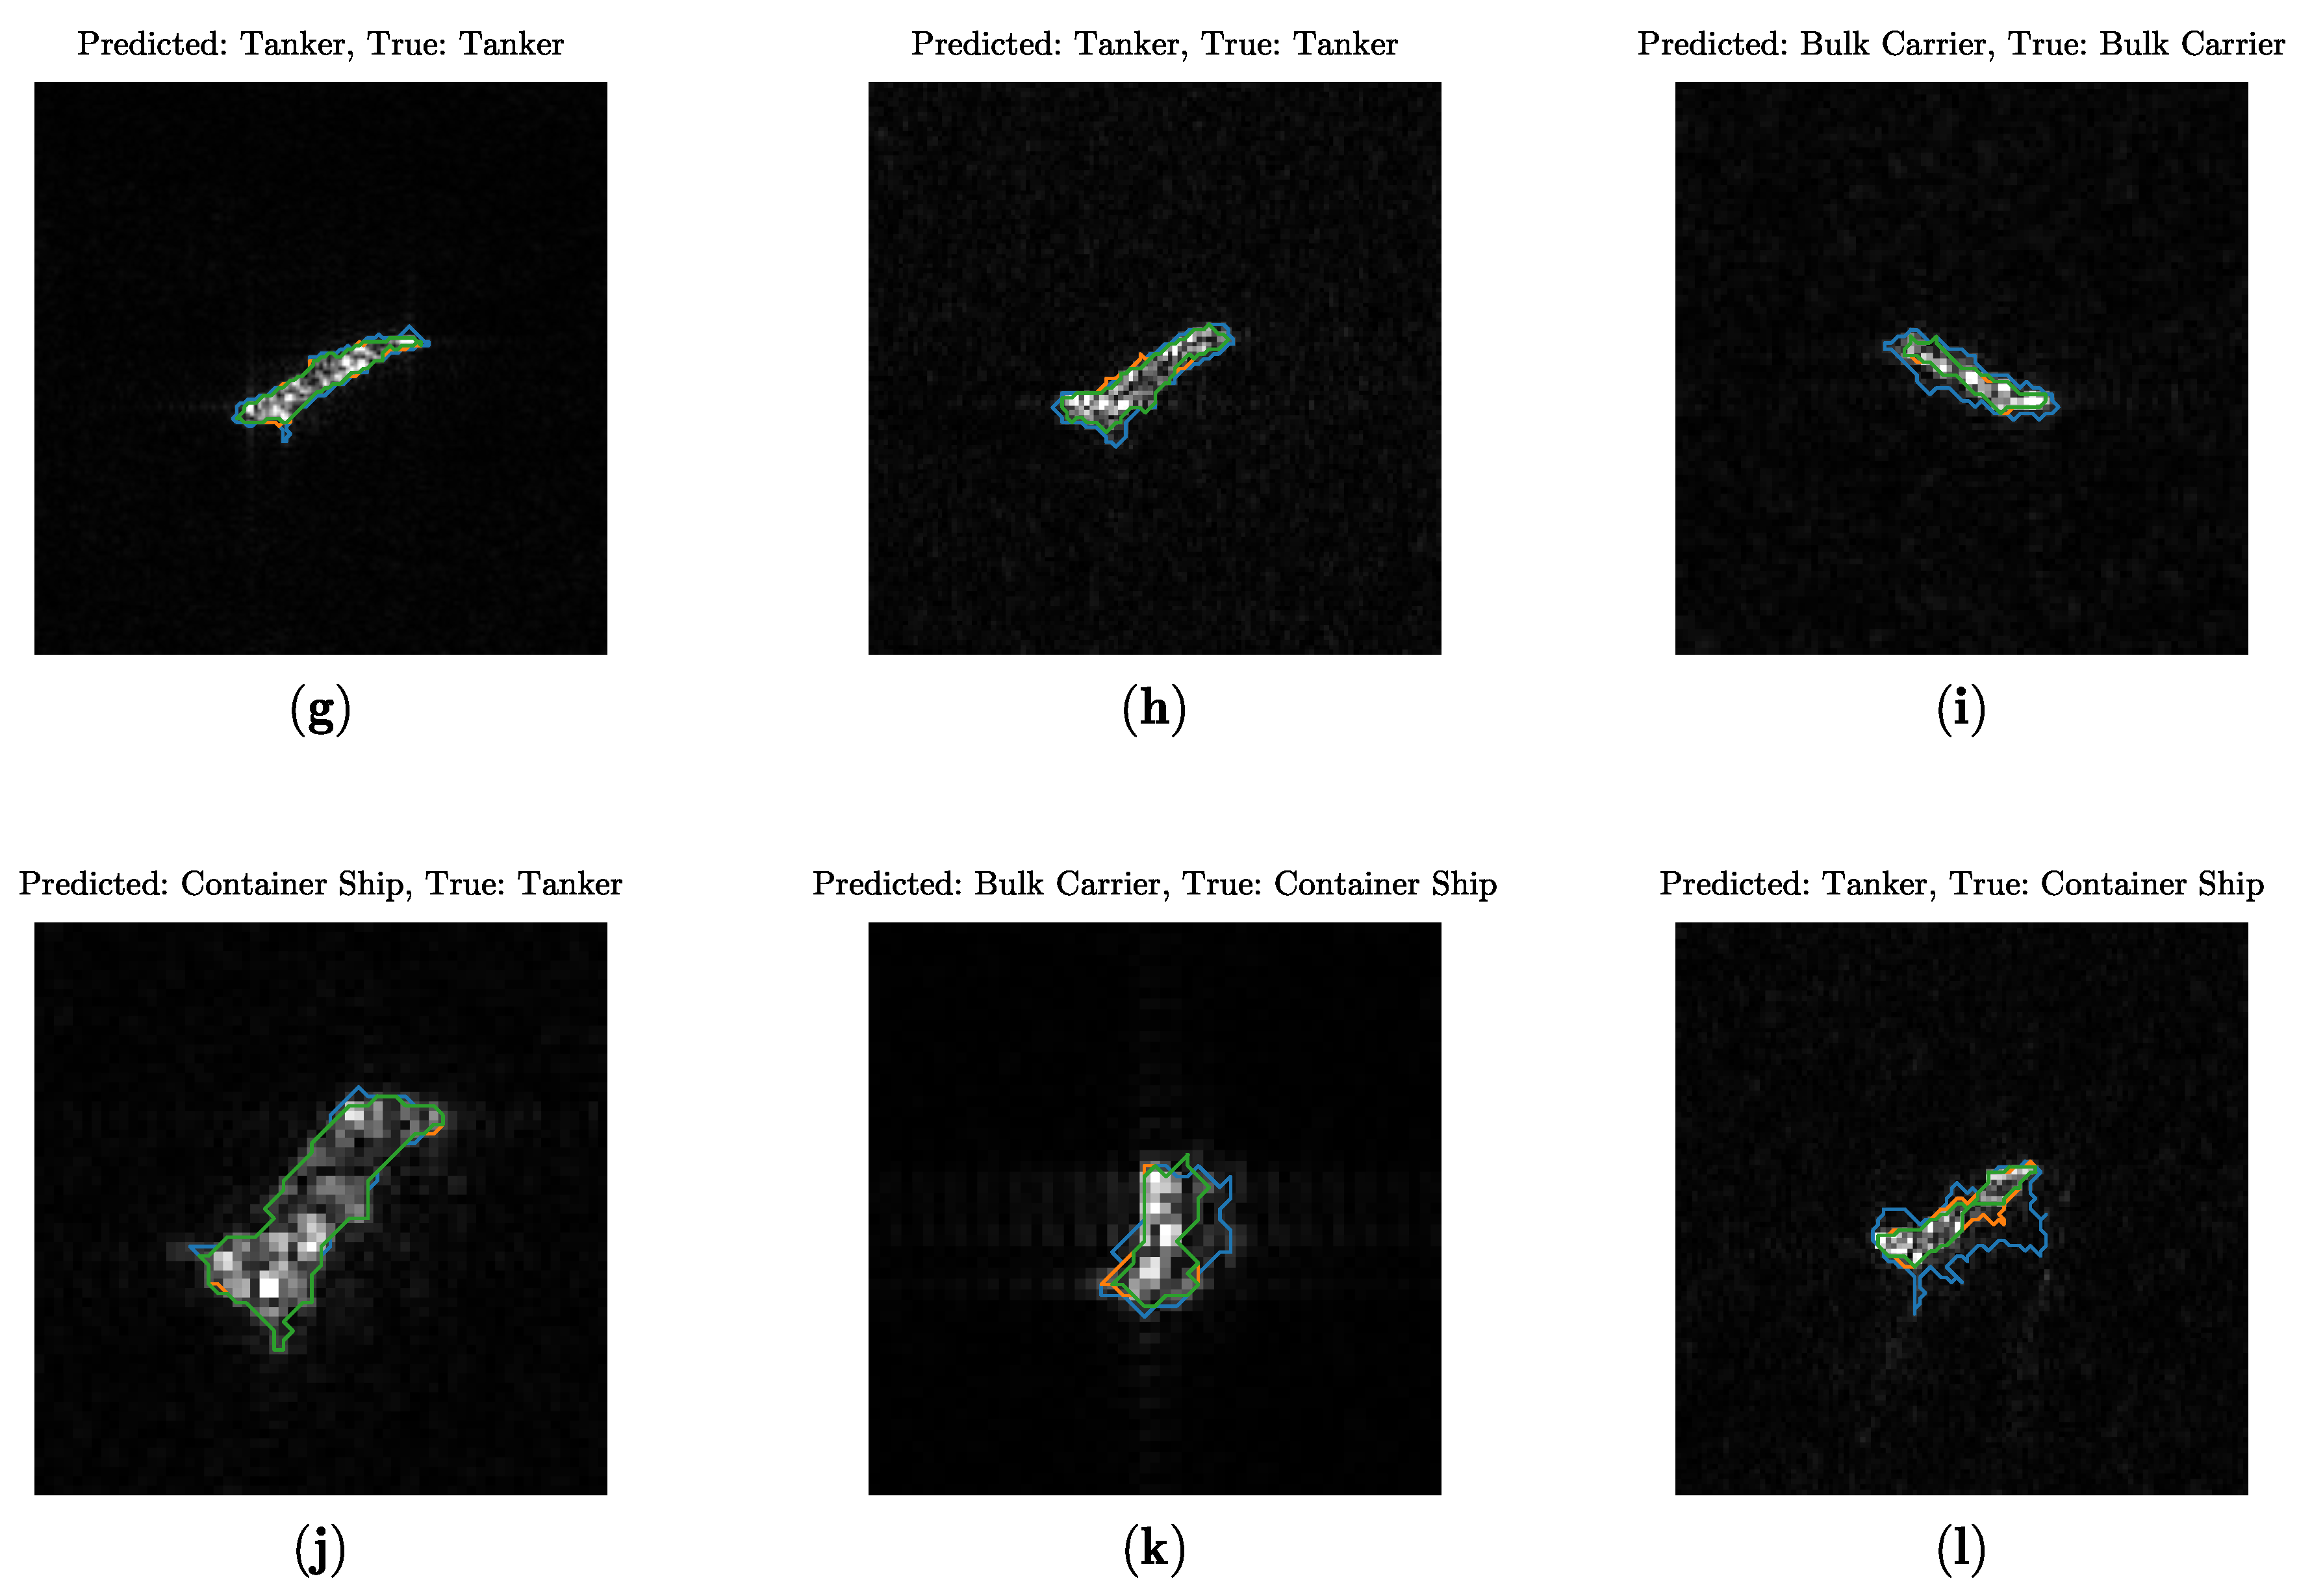
In Figure 13, examples of predictions across the three confidence levels are presented. High-confidence samples display minimal contour variation across the capping percentiles, indicating a relatively noise-free background that facilitates precise contour extraction. Misclassifications within this level are more likely due to the low discriminability of contour features, where the ship’s contours may overlap with those of an incorrect class despite their consistency across thresholds. In the moderate confidence level, correct classifications still exhibit similar contours across percentiles, contributing to model confidence despite potential ambiguity arising from overlapping class features. In contrast, incorrect predictions often display increased contour variability, which can arise from dominant scattering sources, such as the deckhouse, or the presence of strong sidelobes that distort the extracted features. This trend becomes more pronounced in the low-confidence level, where even correctly classified samples display significant contour variability. Background noise, attributable to rough sea conditions, often disrupts contour extraction, leading to inconsistent representations. Additionally, pronounced sidelobes may falsely be included as part of the ship’s contour, further contributing to prediction errors. Overall, these observations suggest a notable correlation between confidence levels and data representation quality.

6. Conclusions

This paper has introduced a novel set of geometric and radiometric contour-based features for SAR ship classification, designed to harness the unique scattering patterns caused by ship superstructures. These features provide a robust solution for classification tasks where interpretability is essential, particularly with limited training datasets, and can be effectively integrated with deep-learning methods to enhance transparency. This paper also demonstrated the application of entropy as a valuable metric to quantify confidence in predictions, highlighting its utility in combining model ensembles and offering insights into specific classes or models that require further investigation. Utilizing entropy and confidence estimation, in general, leads to more informed and trustworthy decisions, which are essential for effective application in real-world scenarios.
With regard to the handcrafted features, the study evaluated two contour segmentation techniques, watershed segmentation and U-Net, using the HRSID dataset. Results indicated that U-Net segmentation delivers superior performance, particularly with adequate training data and when the target dataset closely resembles the source, due to its robustness against noise and oversegmentation. Despite this, watershed segmentation remains a viable alternative, given its efficiency and minimal data requirements. In classification performance, the proposed features achieved superior metrics on the OpenSARShip and FUSAR-Ship datasets compared to existing handcrafted features. Radiometric contour features generally outperformed geometric features, a difference that diminishes as spatial resolution increases. Additionally, the extraction of multiple contours at varying percentiles was shown to enhance accuracy, reaffirming the value of contour-based analysis in capturing the intricacies of ship structures.
In terms of the entropy analysis, entropy-weighted averaging emerged as the most effective method for enhancing classification accuracy when aggregating multiple contours from the same sample. This approach not only underscores the benefits of multiple contours and entropy usage but also shows that averaging entropy approximates a normal distribution, facilitating outlier removal and enabling effective modeling of distributions. The modeled Gaussian parameters were then used to assign confidence levels to predictions, demonstrating greater accuracy and robustness than single contour models. Further analysis revealed disparities in confidence levels across different ship classes, with some (e.g., bulk carriers) predominantly classified with low confidence and others (e.g., tankers) with high confidence. This underscores the utility of entropy in quantifying the reliability of model predictions and guiding targeted improvements in model training and data enhancement.
Looking ahead, the study plans to extend its findings by exploring different data polarization using the VH samples in the OpenSARShip dataset. It will also address other sources of uncertainty beyond contour extraction, such as variability in model parameters and the inherent uncertainty within the data itself. Furthermore, considering the robustness of U-Net against noise, a probabilistic version using Bayesian techniques could offer further improvements in contour accuracy. The feasibility of adapting entropy-based confidence quantification to deep-learning models will also be explored, along with potential alternatives to entropy as a metric. By advancing these areas, this research aims to emphasize the importance of confidence quantification in SAR ship classification, enhancing both the accuracy and the interpretability of models and data in this challenging field.

Author Contributions

Conceptualization, A.A.A.H. and R.G.; methodology, A.A.A.H.; software, A.A.A.H.; validation, A.A.A.H.; formal analysis, A.A.A.H.; data curation, A.A.A.H.; writing—original draft preparation, A.A.A.H.; writing—review and editing, A.A.A.H. and R.G.; supervision, R.G. All authors have read and agreed to the published version of the manuscript.

Funding

This research received no external funding.

Data Availability Statement

No new data were created or analyzed in this study.

Conflicts of Interest

The authors declare no conflict of interest.

References

  1. Margarit, G.; Mallorqui, J.J.; Fabregas, X. Single-Pass Polarimetric SAR Interferometry for Vessel Classification. IEEE Trans. Geosci. Remote Sens. 2007, 45, 3494–3502. [Google Scholar] [CrossRef]
  2. He, J.; Wang, Y.; Liu, H. Ship Classification in Medium-Resolution SAR Images via Densely Connected Triplet CNNs Integrating Fisher Discrimination Regularized Metric Learning. IEEE Trans. Geosci. Remote Sens. 2021, 59, 3022–3039. [Google Scholar] [CrossRef]
  3. Zhang, C.; Zhang, X.; Zhang, J.; Gao, G.; Dai, Y.; Liu, G.; Jia, Y.; Wang, X.; Zhang, Y.; Bao, M. Evaluation and Improvement of Generalization Performance of SAR Ship Recognition Algorithms. IEEE J. Sel. Top. Appl. Earth Obs. Remote Sens. 2022, 15, 9311–9326. [Google Scholar] [CrossRef]
  4. Rodger, M.; Guida, R. Classification-Aided SAR and AIS Data Fusion for Space-Based Maritime Surveillance. Remote Sens. 2021, 13, 104. [Google Scholar] [CrossRef]
  5. Xu, Y.; Lang, H. Ship Classification in SAR Images with Geometric Transfer Metric Learning. IEEE Trans. Geosci. Remote Sens. 2021, 59, 6799–6813. [Google Scholar] [CrossRef]
  6. Snapir, B.; Waine, T.W.; Biermann, L. Maritime Vessel Classification to Monitor Fisheries with SAR: Demonstration in the North Sea. Remote Sens. 2019, 11, 353. [Google Scholar] [CrossRef]
  7. Bentes, C.; Velotto, D.; Tings, B. Ship Classification in TerraSAR-X Images with Convolutional Neural Networks. IEEE J. Ocean. Eng. 2018, 43, 258–266. [Google Scholar] [CrossRef]
  8. Zhang, T.; Zhang, X.; Ke, X.; Liu, C.; Xu, X.; Zhan, X.; Wang, C.; Ahmad, I.; Zhou, Y.; Pan, D.; et al. HOG-ShipCLSNet: A Novel Deep Learning Network with HOG Feature Fusion for SAR Ship Classification. IEEE Trans. Geosci. Remote Sens. 2022, 60, 1–22. [Google Scholar] [CrossRef]
  9. Huang, Z.; Pan, Z.; Lei, B. What, Where, and How to Transfer in SAR Target Recognition Based on Deep CNNs. IEEE Trans. Geosci. Remote Sens. 2020, 58, 2324–2336. [Google Scholar] [CrossRef]
  10. Roscher, R.; Bohn, B.; Duarte, M.F.; Garcke, J. Explainable Machine Learning for Scientific Insights and Discoveries. IEEE Access 2020, 8, 42200–42216. [Google Scholar] [CrossRef]
  11. Zhang, T.; Zhang, X. Injection of Traditional Hand-Crafted Features into Modern CNN-Based Models for SAR Ship Classification: What, Why, Where, and How. Remote Sens. 2021, 13, 2091. [Google Scholar] [CrossRef]
  12. McIver, D.; Friedl, M. Estimating pixel-scale land cover classification confidence using nonparametric machine learning methods. IEEE Trans. Geosci. Remote Sens. 2001, 39, 1959–1968. [Google Scholar] [CrossRef]
  13. Beckler, B.; Pfau, A.; Orescanin, M.; Atchley, S.; Villemez, N.; Joseph, J.E.; Miller, C.W.; Margolina, T. Multilabel Classification of Heterogeneous Underwater Soundscapes with Bayesian Deep Learning. IEEE J. Ocean. Eng. 2022, 47, 1143–1154. [Google Scholar] [CrossRef]
  14. Mehrtash, A.; Wells, W.M.; Tempany, C.M.; Abolmaesumi, P.; Kapur, T. Confidence Calibration and Predictive Uncertainty Estimation for Deep Medical Image Segmentation. IEEE Trans. Med. Imaging 2020, 39, 3868–3878. [Google Scholar] [CrossRef]
  15. Wang, J. Uncertainty Estimation for CNN-based SAR Target Classification. In Proceedings of the 2023 8th International Conference on Intelligent Computing and Signal Processing (ICSP), Xi’an, China, 21–23 April 2023; pp. 523–527. [Google Scholar] [CrossRef]
  16. Yang, G.; Li, H.C.; Yang, W.; Fu, K.; Sun, Y.J.; Emery, W.J. Unsupervised Change Detection of SAR Images Based on Variational Multivariate Gaussian Mixture Model and Shannon Entropy. IEEE Geosci. Remote Sens. Lett. 2019, 16, 826–830. [Google Scholar] [CrossRef]
  17. Margarit, G.; Tabasco, A. Ship Classification in Single-Pol SAR Images Based on Fuzzy Logic. IEEE Trans. Geosci. Remote Sens. 2011, 49, 3129–3138. [Google Scholar] [CrossRef]
  18. Xing, X.; Ji, K.; Zou, H.; Chen, W.; Sun, J. Ship Classification in TerraSAR-X Images with Feature Space Based Sparse Representation. IEEE Geosci. Remote Sens. Lett. 2013, 10, 1562–1566. [Google Scholar] [CrossRef]
  19. Lang, H.; Zhang, J.; Zhang, X.; Meng, J. Ship Classification in SAR Image by Joint Feature and Classifier Selection. IEEE Geosci. Remote Sens. Lett. 2016, 13, 212–216. [Google Scholar] [CrossRef]
  20. Lang, H.; Wu, S. Ship Classification in Moderate-Resolution SAR Image by Naive Geometric Features-Combined Multiple Kernel Learning. IEEE Geosci. Remote Sens. Lett. 2017, 14, 1765–1769. [Google Scholar] [CrossRef]
  21. Gray, R.M. Entropy and Information Theory; Springer Science & Business Media: New York, NY, USA, 2011. [Google Scholar]
  22. Zhang, H.; Tian, X.; Wang, C.; Wu, F.; Zhang, B. Merchant Vessel Classification Based on Scattering Component Analysis for COSMO-SkyMed SAR Images. IEEE Geosci. Remote Sens. Lett. 2013, 10, 1275–1279. [Google Scholar] [CrossRef]
  23. Wang, C.; Zhang, H.; Wu, F.; Jiang, S.; Zhang, B.; Tang, Y. A Novel Hierarchical Ship Classifier for COSMO-SkyMed SAR Data. IEEE Geosci. Remote Sens. Lett. 2014, 11, 484–488. [Google Scholar] [CrossRef]
  24. Wu, F.; Wang, C.; Jiang, S.; Zhang, H.; Zhang, B. Classification of Vessels in Single-Pol COSMO-SkyMed Images Based on Statistical and Structural Features. Remote Sens. 2015, 7, 5511–5533. [Google Scholar] [CrossRef]
  25. Zhu, J.W.; Qiu, X.L.; Pan, Z.X.; Zhang, Y.T.; Lei, B. An Improved Shape Contexts Based Ship Classification in SAR Images. Remote Sens. 2017, 9, 145. [Google Scholar] [CrossRef]
  26. Lin, H.; Song, S.; Yang, J. Ship Classification Based on MSHOG Feature and Task-Driven Dictionary Learning with Structured Incoherent Constraints in SAR Images. Remote Sens. 2018, 10, 190. [Google Scholar] [CrossRef]
  27. Zhu, J.; Qiu, X.; Pan, Z.; Zhang, Y.; Lei, B. Projection Shape Template-Based Ship Target Recognition in TerraSAR-X Images. IEEE Geosci. Remote Sens. Lett. 2017, 14, 222–226. [Google Scholar] [CrossRef]
  28. Al Hinai, A.A.; Guida, R. Ship Classification Using Layover in Sentinel-1 Images. In Proceedings of the IGARSS 2023—2023 IEEE International Geoscience and Remote Sensing Symposium, Pasadena, CA, USA, 16–21 July 2023; pp. 7495–7498. [Google Scholar] [CrossRef]
  29. Knapskog, A.O.; Brovoll, S.; Torvik, B. Characteristics of ships in harbour investigated in simultaneous images from TerraSAR-X and PicoSAR. In Proceedings of the 2010 IEEE Radar Conference, Arlington, VA, USA, 10–14 May 2010; pp. 422–427. [Google Scholar] [CrossRef]
  30. Iervolino, P.; Guida, R.; Whittaker, P. A Model for the Backscattering From a Canonical Ship in SAR Imagery. IEEE J. Sel. Top. Appl. Earth Obs. Remote Sens. 2016, 9, 1163–1175. [Google Scholar] [CrossRef]
  31. Mena, J.; Pujol, O.; Vitrià, J. A Survey on Uncertainty Estimation in Deep Learning Classification Systems from a Bayesian Perspective. ACM Comput. Surv. 2021, 54, 193. [Google Scholar] [CrossRef]
  32. Ibrahim, M.A.; Arora, M.K.; Ghosh, S.K. Estimating and accommodating uncertainty through the soft classification of remote sensing data. Int. J. Remote Sens. 2005, 26, 2995–3007. [Google Scholar] [CrossRef]
  33. Giacco, F.; Thiel, C.; Pugliese, L.; Scarpetta, S.; Marinaro, M. Uncertainty Analysis for the Classification of Multispectral Satellite Images Using SVMs and SOMs. IEEE Trans. Geosci. Remote Sens. 2010, 48, 3769–3779. [Google Scholar] [CrossRef]
  34. Loosvelt, L.; Peters, J.; Skriver, H.; Lievens, H.; Van Coillie, F.M.; De Baets, B.; Verhoest, N.E. Random Forests as a tool for estimating uncertainty at pixel-level in SAR image classification. Int. J. Appl. Earth Obs. Geoinf. 2012, 19, 173–184. [Google Scholar] [CrossRef]
  35. Dehghan, H.; Ghassemian, H. Measurement of uncertainty by the entropy: Application to the classification of MSS data. Int. J. Remote Sens. 2006, 27, 4005–4014. [Google Scholar] [CrossRef]
  36. Park, L.A.F.; Simoff, S. Using Entropy as a Measure of Acceptance for Multi-label Classification. In Proceedings of the Advances in Intelligent Data Analysis XIV, Saint Etienne, France, 22–24 October 2015; Fromont, E., De Bie, T., van Leeuwen, M., Eds.; Springer: Cham, Switzerland, 2015; pp. 217–228. [Google Scholar]
  37. Tornetta, G.N. Entropy Methods for the Confidence Assessment of Probabilistic Classification Models. Statistica 2021, 81, 383–398. [Google Scholar] [CrossRef]
  38. Rennie, J.D.; Shih, L.; Teevan, J.; Karger, D.R. Tackling the poor assumptions of naive bayes text classifiers. In Proceedings of the 20th International Conference on Machine Learning (ICML-03), Washington, DC, USA, 21–24 August 2003; pp. 616–623. [Google Scholar]
  39. Omati, M.; Sahebi, M.R. Change Detection of Polarimetric SAR Images Based on the Integration of Improved Watershed and MRF Segmentation Approaches. IEEE J. Sel. Top. Appl. Earth Obs. Remote Sens. 2018, 11, 4170–4179. [Google Scholar] [CrossRef]
  40. Bai, M.; Urtasun, R. Deep Watershed Transform for Instance Segmentation. In Proceedings of the 2017 IEEE Conference on Computer Vision and Pattern Recognition (CVPR), Honolulu, HI, USA, 21–26 July 2017; pp. 2858–2866. [Google Scholar] [CrossRef]
  41. Dhage, P.; Phegade, M.R.; Shah, S.K. Watershed segmentation brain tumor detection. In Proceedings of the 2015 International Conference on Pervasive Computing (ICPC), Pune, India, 8–10 January 2015; pp. 1–5. [Google Scholar] [CrossRef]
  42. Xue, Y.; Zhao, J.; Zhang, M. A Watershed-Segmentation-Based Improved Algorithm for Extracting Cultivated Land Boundaries. Remote Sens. 2021, 13, 939. [Google Scholar] [CrossRef]
  43. Ronneberger, O.; Fischer, P.; Brox, T. U-Net: Convolutional Networks for Biomedical Image Segmentation. In Proceedings of the Medical Image Computing and Computer-Assisted Intervention—MICCAI 2015, Munich, Germany, 5–9 October 2015; Navab, N., Hornegger, J., Wells, W.M., Frangi, A.F., Eds.; Springer: Cham, Switzerland, 2015; pp. 234–241. [Google Scholar]
  44. Ge, S.; Gu, H.; Su, W.; Praks, J.; Antropov, O. Improved Semisupervised UNet Deep Learning Model for Forest Height Mapping with Satellite SAR and Optical Data. IEEE J. Sel. Top. Appl. Earth Obs. Remote Sens. 2022, 15, 5776–5787. [Google Scholar] [CrossRef]
  45. Li, L.; Wang, C.; Zhang, H.; Zhang, B. Residual Unet for Urban Building Change Detection with Sentinel-1 SAR Data. In Proceedings of the IGARSS 2019—2019 IEEE International Geoscience and Remote Sensing Symposium, Yokohama, Japan, 28 July–2 August 2019; pp. 1498–1501. [Google Scholar] [CrossRef]
  46. Li, J.; Guo, C.; Gou, S.; Chen, Y.; Wang, M.; Chen, J.W. Ship Segmentation on High-Resolution Sar Image by a 3D Dilated Multiscale U-Net. In Proceedings of the IGARSS 2020—2020 IEEE International Geoscience and Remote Sensing Symposium, Waikoloa, HI, USA, 26 September–2 October 2020; pp. 2575–2578. [Google Scholar] [CrossRef]
  47. Leung, K. Neural-Network-Architecture-Diagrams. Available online: https://github.com/kennethleungty/Neural-Network-Architecture-Diagrams (accessed on 30 April 2024).
  48. Salerno, E. Using Low-Resolution SAR Scattering Features for Ship Classification. IEEE Geosci. Remote Sens. Lett. 2022, 19, 1–4. [Google Scholar] [CrossRef]
  49. Bolourchi, P.; Moradi, M.; Demirel, H.; Uysal, S. Improved SAR target recognition by selecting moment methods based on Fisher score. Signal Image Video Process. 2020, 14, 39–47. [Google Scholar] [CrossRef]
  50. Wu, Y.; Zhou, Y.; Saveriades, G.; Agaian, S.; Noonan, J.P.; Natarajan, P. Local Shannon entropy measure with statistical tests for image randomness. Inf. Sci. 2013, 222, 323–342. [Google Scholar] [CrossRef]
  51. Böken, B. On the appropriateness of Platt scaling in classifier calibration. Inf. Syst. 2021, 95, 101641. [Google Scholar] [CrossRef]
  52. Chen, Z.; Lin, T.; Xia, X.; Xu, H.; Ding, S. A synthetic neighborhood generation based ensemble learning for the imbalanced data classification. Appl. Intell. 2018, 48, 2441–2457. [Google Scholar] [CrossRef]
  53. Huang, L.; Liu, B.; Li, B.; Guo, W.; Yu, W.; Zhang, Z.; Yu, W. OpenSARShip: A Dataset Dedicated to Sentinel-1 Ship Interpretation. IEEE J. Sel. Top. Appl. Earth Obs. Remote Sens. 2018, 11, 195–208. [Google Scholar] [CrossRef]
  54. Li, B.; Liu, B.; Huang, L.; Guo, W.; Zhang, Z.; Yu, W. OpenSARShip 2.0: A large-volume dataset for deeper interpretation of ship targets in Sentinel-1 imagery. In Proceedings of the 2017 SAR in Big Data Era: Models, Methods and Applications (BIGSARDATA), Beijing, China, 13–14 November 2017; pp. 1–5. [Google Scholar] [CrossRef]
  55. Al Hinai, A.A.; Guida, R. Investigating the Complex Signal Kurtosis for SAR Ship Classification. In Proceedings of the 2023 8th Asia-Pacific Conference on Synthetic Aperture Radar (APSAR), Bali, Indonesia, 23–27 October 2023; pp. 1–6. [Google Scholar] [CrossRef]
  56. Iervolino, P.; Guida, R. A Novel Ship Detector Based on the Generalized-Likelihood Ratio Test for SAR Imagery. IEEE J. Sel. Top. Appl. Earth Obs. Remote Sens. 2017, 10, 3616–3630. [Google Scholar] [CrossRef]
  57. Hou, X.; Ao, W.; Song, Q.; Lai, J.; Wang, H.; Xu, F. FUSAR-Ship: Building a high-resolution SAR-AIS matchup dataset of Gaofen-3 for ship detection and recognition. Sci. China Inf. Sci. 2020, 63, 1–19. [Google Scholar] [CrossRef]
  58. Wei, S.; Zeng, X.; Qu, Q.; Wang, M.; Su, H.; Shi, J. HRSID: A High-Resolution SAR Images Dataset for Ship Detection and Instance Segmentation. IEEE Access 2020, 8, 120234–120254. [Google Scholar] [CrossRef]
  59. Yu, F.; Sun, W.; Li, J.; Zhao, Y.; Zhang, Y.; Chen, G. An improved Otsu method for oil spill detection from SAR images. Oceanologia 2017, 59, 311–317. [Google Scholar] [CrossRef]
  60. Henry, C.; Azimi, S.M.; Merkle, N. Road Segmentation in SAR Satellite Images with Deep Fully Convolutional Neural Networks. IEEE Geosci. Remote Sens. Lett. 2018, 15, 1867–1871. [Google Scholar] [CrossRef]
  61. Feng, S.; Ji, K.; Ma, X.; Zhang, L.; Kuang, G. Target Region Segmentation in SAR Vehicle Chip Image with ACM Net. IEEE Geosci. Remote Sens. Lett. 2022, 19, 1–5. [Google Scholar] [CrossRef]
  62. CVAT.ai Corporation. Computer Vision Annotation Tool (CVAT); Zenodo: Geneva, Switzerland, 2023. [Google Scholar] [CrossRef]
  63. Li, Y.; Lai, X.; Wang, M.; Zhang, X. C-SASO: A Clustering-Based Size-Adaptive Safer Oversampling Technique for Imbalanced SAR Ship Classification. IEEE Trans. Geosci. Remote Sens. 2022, 60, 1–12. [Google Scholar] [CrossRef]
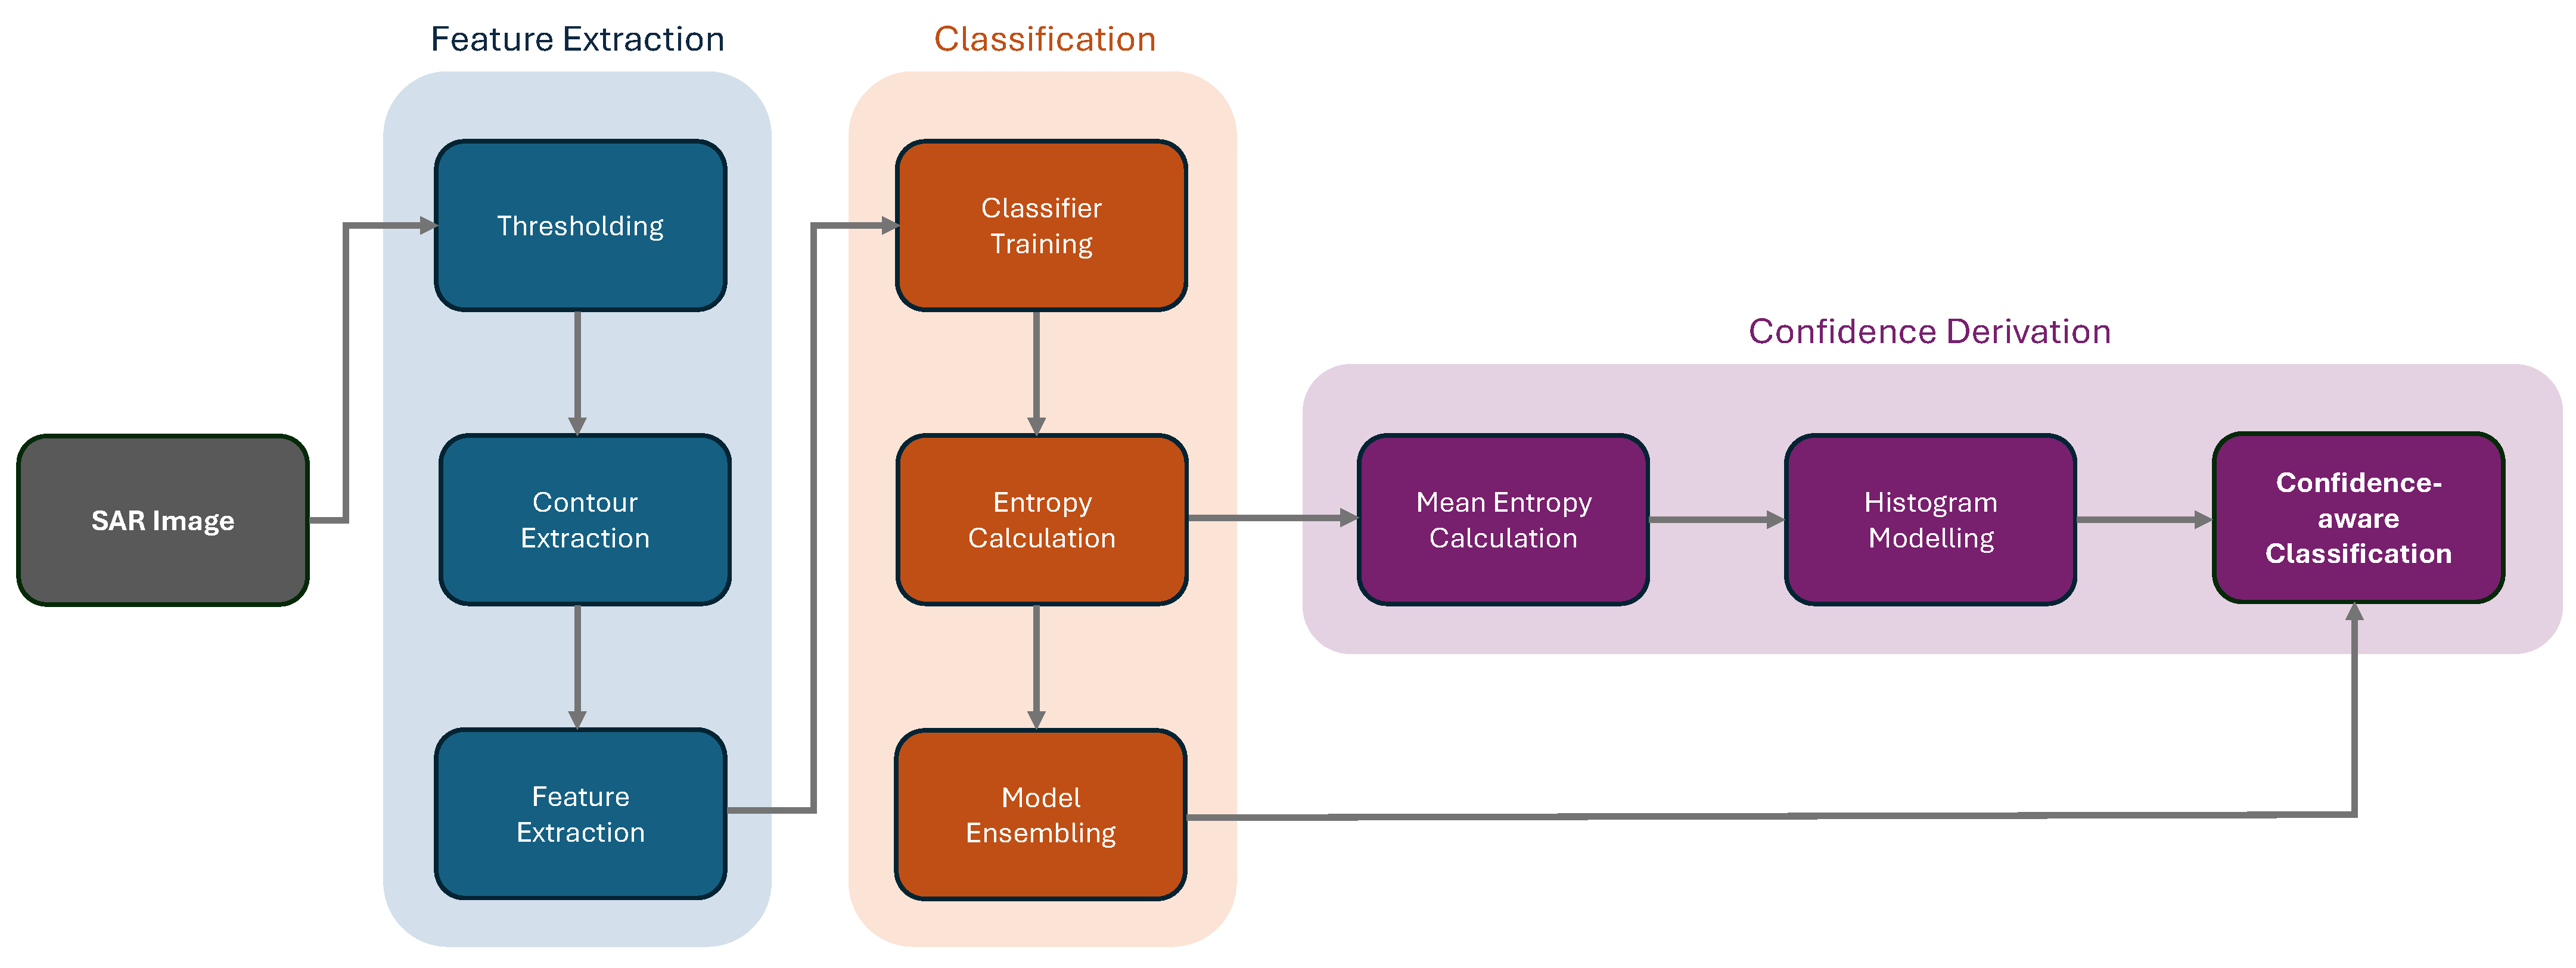
Figure 1. Flowchart illustrating the overall proposed methodology.
Remotesensing 17 00127 g001
Figure 2. Flowchart highlighting the main steps in the watershed segmentation algorithm.
Remotesensing 17 00127 g002
Figure 3. U-Net architecture used in this study [47].
Remotesensing 17 00127 g003
Figure 4. Visualization of selected proposed features on a random ship sample from the OpenSARShip GRD dataset: (a) angles used in the bending energy feature ( f 3 ), (b) concave points and their depths used in features f 4 f 7 , and (c) perpendicular distances to the PCA used in features f 8 f 10 .
Remotesensing 17 00127 g004
Figure 5. Examples of segmentation results on the HRSID dataset using watershed segmentation and U-Net. The first, second, and third columns represent the ground truth, the watershed segmented image, and the U-Net result, respectively. (ac) Instances of successful segmentation by both U-Net and watershed. (df) Case of oversegmentation by watershed, where the top ship is divided into multiple segments. (gi) Scenario where watershed fails to identify a ship located at the bottom-left edge of the image.
Remotesensing 17 00127 g005
Figure 6. Examples of the extracted contours using watershed segmentation and U-Net, alternating each row between a bulk carrier and a container ship, where the samples in Rows 1–2 are from the OpenSARShip GRD dataset, Rows 3–4 are from the OpenSARShip SLC dataset, and Rows 5–6 are from FUSAR-Ship.
Remotesensing 17 00127 g006
Figure 7. Confusion matrices of the SLC and GRD samples from the OpenSARShip dataset, as well as the three-category FUSAR-Ship dataset, using the proposed contour features.
Remotesensing 17 00127 g007aRemotesensing 17 00127 g007b
Figure 8. Confusion matrices from the five-category FUSAR-Ship dataset using the proposed contour features.
Remotesensing 17 00127 g008
Figure 9. Bar graph displaying the 13 proposed features, with each bar representing the mean entropy change across all samples when subjected to Gaussian noise perturbation. Error bars on each bar depict the standard deviation, illustrating the variability of the entropy response to the noise.
Remotesensing 17 00127 g009
Figure 10. Histograms of the entropy of a single model compared to the mean entropy across the ensemble model, where the base classifiers are: (ad) SVM, (eh) RF, and (il) GPC.
Remotesensing 17 00127 g010aRemotesensing 17 00127 g010b
Figure 11. Mean entropy for correct (blue) and incorrect (orange) predictions by SVM, RF, and GPC ensembles, obtained from fitting a Gaussian distribution to the mean entropy histogram, with error bars representing one standard deviation from the mean.
Remotesensing 17 00127 g011
Figure 12. Stacked bar charts illustrating the composition of confidence bands across each class using the ensemble models, where the base classifiers are: (a,b) SVM, (c,d) RF, and (e,f) GPC.
Remotesensing 17 00127 g012
Figure 13. Examples of classified ships across varying confidence levels, with extracted contours overlaid. The first, second, and third columns represent samples classified with high, moderate, and low confidence, respectively. (af) display samples from the OpenSARShip GRD dataset, while (gl) are from the OpenSARShip SLC dataset. The rows alternate between correctly classified and misclassified samples.
Remotesensing 17 00127 g013aRemotesensing 17 00127 g013b
Table 1. Train–test split for the OpenSARShip samples.
OpenSARShip
GRDSLC
TrainTestTrainTest
Bulk carrier154663233100
Container ship15466233344
Tanker154206233281
Table 2. Train–test split for the FUSAR-Ship samples.
FUSAR-Ship
TrainTest
Bulk carrier150104
Container ship15013
Tanker15029
Cargo150141
Fishing150238
Table 3. Segmentation results for the HRSID dataset, along with 30 samples each from OpenSARShip GRD and SLC, and FUSAR-Ship, using both watershed segmentation and U-Net.
DatasetModelIoUDice
HRSIDWatershed43.3%58.7%
U-Net79.8%88.4%
OpenSARShip
GRD
Watershed68.8%81.0%
U-Net61.5%73.1%
OpenSARShip
SLC
Watershed46.8%60.7%
U-Net59.9%73.1%
FUSAR-ShipWatershed61.4%75.2%
U-Net70.7%82.0%
Table 4. Classification results using the OpenSARShip dataset.
OpenSARShip GRDOpenSARShip SLC
FeaturesAccuracyPrecisionRecallF1 ScoreAccuracyPrecisionRecallF1 Score
NGFs58.0%56.7%59.0%52.1%56.8%53.3%53.5%50.7%
LRCS75.5%61.7%68.7%64.2%64.4%57.9%57.9%57.0%
Hu Moments47.8%42.1%48.7%40.2%45.1%44.8%44.3%42.2%
Zernike Moments70.6%60.8%65.9%59.9%47.4%48.3%48.0%45.2%
Watershed
Segmentation
Geometric Contour70.1%59.1%64.8%58.8%53.2%51.0%52.6%49.4%
Radiometric Contour73.6%60.8%68.6%62.0%62.2%59.1%58.8%56.8%
Combined Contour78.5%65.4%72.5%66.4%68.7%64.7%67.3%64.4%
U-Net
Segmentation
Geometric Contour65.8%59.3%62.9%56.5%65.2%63.9%65.7%61.6%
Radiometric Contour69.9%58.2%62.1%57.6%67.3%65.5%67.0%63.4%
Combined Contour75.5%63.7%68.8%63.6%71.9%68.4%71.4%67.8%
VGG-1968.1%56.8%65.5%57.8%64.5%63.7%63.4%60.5%
Note: Bold values indicate the best performance in each metric.
Table 5. Classification results using the FUSAR-Ship dataset.
FUSAR-Ship 3-CategoriesFUSAR-Ship 5-Categories
FeaturesAccuracyPrecisionRecallF1 ScoreAccuracyPrecisionRecallF1 Score
NGFs73.3%62.4%73.8%65.6%39.0%37.3%47.5%34.9%
LRCS75.3%62.8%71.7%65.6%34.7%35.5%49.1%31.8%
Hu Moments56.8%58.7%58.0%54.2%36.8%32.7%42.7%33.9%
Zernike Moments56.2%42.7%46.0%43.2%32.4%27.9%31.9%27.0%
Watershed
Segmentation
Geometric Contour65.8%56.2%56.9%54.3%41.0%39.9%43.0%35.9%
Radiometric Contour74.0%60.3%64.7%61.0%43.2%37.3%46.3%38.2%
Combined Contour75.3%64.3%65.9%62.8%46.3%38.0%44.5%39.0%
U-Net
Segmentation
Geometric Contour64.4%51.5%53.7%51.3%47.0%39.9%43.0%38.9%
Radiometric Contour69.9%57.8%62.4%58.3%42.5%38.4%47.9%37.0%
Combined Contour77.4%62.2%64.3%63.0%51.0%43.5%50.3%43.1%
VGG-1980.3%70.1%73.6%70.3%57.3%58.0%63.6%57.9%
Note: Bold values indicate the best performance in each metric.
Table 6. Classification results across multiple ensemble methods using the OpenSARShip dataset.
OpenSARShip GRDOpenSARShip SLC
Ensemble MethodAccuracyPrecisionRecallF1 ScoreAccuracyPrecisionRecallF1 Score
SVMOptimal Single Model78.5%65.4%72.5%66.4%68.7%64.7%67.3%64.4%
Expanded Samples69.4%55.2%62.4%57.0%62.2%59.2%61.1%58.2%
Feature Concatenation76.6%63.9%73.4%65.7%66.2%63.3%64.3%61.9%
Majority Voting78.7%65.3%74.1%67.3%69.2%67.6%69.7%65.7%
Minimum Entropy73.9%62.2%72.6%63.5%70.3%64.1%65.6%64.3%
Probability Averaging79.6%66.3%74.9%68.1%71.2%68.1%70.5%67.0%
Entropy-Weighted Probabilities80.7%68.0%74.4%69.1%71.2%67.3%69.6%66.6%
RFOptimal Single Model76.3%63.2%72.1%65.2%67.4%63.0%65.3%62.9%
Expanded Samples66.0%55.7%65.8%56.4%67.8%64.6%67.3%64.0%
Feature Concatenation75.3%63.3%74.0%65.0%73.5%69.2%72.0%69.1%
Majority Voting77.0%64.5%74.9%66.5%71.2%68.9%72.0%67.7%
Minimum Entropy74.4%61.7%72.0%63.8%72.6%67.2%69.4%67.4%
Probability Averaging77.5%65.1%74.3%66.5%74.3%69.9%72.8%69.8%
Entropy-Weighted Probabilities79.6%66.3%74.2%67.9%74.1%69.1%71.7%69.2%
GPCOptimal Single Model76.9%63.9%72.6%65.9%69.2%64.5%66.9%64.7%
Expanded Samples67.5%54.7%63.2%56.2%63.5%60.0%61.9%59.3%
Feature Concatenation73.4%61.8%73.1%63.7%67.9%63.8%65.7%63.2%
Majority Voting79.0%66.1%75.1%67.8%70.9%67.4%69.5%66.5%
Minimum Entropy74.1%62.5%73.1%63.7%72.4%66.7%68.7%67.1%
Probability Averaging80.3%67.4%75.8%69.0%72.1%67.5%70.1%67.4%
Entropy-Weighted Probabilities81.8%69.1%75.4%70.3%72.1%67.5%70.1%67.4%
SVM
RF
GPC
Majority Voting79.0%65.4%73.8%67.5%69.8%64.9%67.0%65.0%
Minimum Entropy79.0%65.4%73.5%67.5%71.6%66.8%69.6%67.1%
Probability Averaging78.9%65.2%73.4%67.3%70.6%66.0%68.6%66.1%
Entropy-Weighted Probabilities79.2%65.8%73.5%67.7%71.6%67.0%69.8%67.2%
Note: Bold values indicate the best performance within each ensemble classifier group for the respective metric.
Table 7. Classification results with confidence levels using the OpenSARShip dataset.
OpenSARShip GRDOpenSARShip SLC
ModelConfidence LevelAccuracyPrecisionRecallF1 ScoreNo. of
Samples
AccuracyPrecisionRecallF1 ScoreNo. of
Samples
SVM
Single
High81.4%77.7%81.0%78.7%12995.7%63.2%62.1%62.6%93
Moderate87.7%77.0%84.4%79.8%26180.7%75.8%69.1%70.4%197
Low71.3%51.5%58.2%52.0%54456.8%57.1%58.2%55.1%435
SVM
Ensemble
High87.8%84.1%87.8%85.1%21397.4%65.3%65.3%65.3%191
Moderate81.2%64.0%77.0%65.5%29274.5%67.0%68.4%67.4%243
Low72.5%46.7%50.6%47.1%42951.2%56.7%54.5%51.4%291
RF
Single
High91.3%86.6%91.7%88.5%17393.8%86.9%87.2%87.0%145
Moderate88.9%74.0%86.5%76.5%21783.2%78.2%78.9%78.5%161
Low64.0%49.5%57.0%48.8%54456.3%59.2%61.3%55.9%419
RF
Ensemble
High96.6%95.6%97.4%96.4%23395.5%86.7%87.1%86.9%176
Moderate80.3%58.8%69.8%59.7%29480.1%73.3%78.8%74.1%221
Low67.3%47.0%51.8%47.2%40752.1%53.8%53.4%51.2%328
GPC
Single
High88.5%82.1%85.5%82.4%15690.9%88.3%82.7%85.0%110
Moderate85.5%66.8%79.3%70.9%25581.9%74.6%71.8%72.6%193
Low65.2%48.4%57.2%48.6%52358.3%56.3%57.0%55.4%422
GPC
Ensemble
High90.9%84.4%91.5%86.3%24194.5%77.4%83.5%79.5%165
Moderate83.7%59.5%74.1%63.8%28275.3%69.4%72.1%70.0%299
Low68.1%46.5%50.4%46.5%41151.7%55.8%54.3%51.4%261
Disclaimer/Publisher’s Note: The statements, opinions and data contained in all publications are solely those of the individual author(s) and contributor(s) and not of MDPI and/or the editor(s). MDPI and/or the editor(s) disclaim responsibility for any injury to people or property resulting from any ideas, methods, instructions or products referred to in the content.