Article

A Refined Terrace Extraction Method Based on a Local Optimization Model Using GF-2 Images

1
College of Earth and Environmental Sciences, Lanzhou University, Lanzhou 730000, China
2
Key Laboratory of Western China’s Environmental Systems (Ministry of Education), Lanzhou University, Lanzhou 730000, China
3
Center for Remote Sensing of Ecological Environments in Cold and Arid Regions, Lanzhou University, Lanzhou 730000, China
4
State Key Laboratory of Urban and Regional Ecology, Research Center for Eco-Environmental Sciences, Chinese Academy of Sciences, Beijing 100085, China
5
Gansu Academy of Eco-Environmental Sciences, Lanzhou 730000, China
*
Author to whom correspondence should be addressed.
Remote Sens. 2025, 17(1), 12; https://doi.org/10.3390/rs17010012
Submission received: 12 November 2024 / Revised: 21 December 2024 / Accepted: 22 December 2024 / Published: 24 December 2024
(This article belongs to the Special Issue Cropland and Yield Mapping with Multi-source Remote Sensing)

Abstract

:
Terraces are an important form of surface modification, and their spatial distribution data are of utmost importance for ensuring food and water security. However, the extraction of terrace patches faces challenges due to the complexity of the terrain and limitations in remote sensing (RS) data. Therefore, there is an urgent need for advanced technology models that can accurately extract terraces. High-resolution RS data allows for detailed characterization of terraces by capturing more precise surface features. Moreover, leveraging deep learning (DL) models with local adaptive improvements can further enhance the accuracy of interpretation by exploring latent information. In this study, we employed five models: ResU-Net, U-Net++, RVTransUNet, XDeepLabV3+, and ResPSPNet as DL models to extract fine patch terraces from GF-2 images. We then integrated morphological, textural, and spectral features to optimize the extraction process by addressing issues related to low adhesion and edge segmentation performance. The model structure and loss function were adjusted accordingly to achieve high-quality terrace mapping results. Finally, we utilized multi-source RS data along with terrain elements for correction and optimization to generate a 1 m resolution terrace distribution map in the Zuli River Basin (TDZRB). Evaluation results after correction demonstrate that our approach achieved an OA, F1-Score, and MIoU of 96.67%, 93.94%, and 89.37%, respectively. The total area of terraces in the Zuli River Basin was calculated at 2557 ± 117.96 km2 using EM with our model methodology; this accounts for approximately 41.74% ± 1.93% of the cultivated land area within the Zuli River Basin. Therefore, obtaining accurate information on patch terrace distribution serves as essential foundational data for terrace ecosystem research and government decision-making.

1. Introduction

Terraces refer to horizontal artificial spaces on sloping land, such as hills and mountains, that facilitate or promote agricultural activities [1]. They are primarily found in mountainous and hilly regions [2]. Terraces have been widely adopted as a key management strategy to mitigate climate- or human-induced disasters in fragile landscapes [3,4,5]. Among these strategies, terraces play a pivotal role in mitigating soil and water erosion and land degradation, enhancing food production and restoring vegetation [6,7,8]. In recent years, the Chinese government has actively constructed terraces in mountainous areas, including the Loess Plateau, to combat soil erosion and improve food production [9]. The ZLRB (The Zuli River Basin (ZLRB), situated in the western Loess Plateau of China (104°12′–105°30′E, 35°17′–36°34′N)), represents a region with a significant concentration of terraced fields, rendering it an optimal study area for the detection and analysis of terrace distribution. It is a typical area with a concentrated distribution of terraces in the Loess Hilly Region. However, current statistics regarding the number and extent of terraces are incomplete, while high-precision spatial distribution data are lacking [10]. Therefore, obtaining accurate spatial information on terraces and boundaries of terrace patches becomes an urgent issue that needs a resolution to provide essential data support to decision makers and researchers.
RS technology is commonly employed to acquire land cover/land use change and terrace information [11,12]. Currently, there are several approaches employed to extract terrace information from RS images, including: (1) visual interpretation [13,14,15], (2) methods based on a Fourier transform and gray level co-occurrence matrix analysis [16,17,18], and (3) automated methods based on object classification [19,20,21]. Visual interpretation heavily relies on expert empirical knowledge and spectral information. This method requires high-resolution RS images and can yield prompt results in small and medium scale areas. However, the outcomes of visual interpretation are significantly influenced by the interpreter’s ability, and it requires substantial time when applied over large areas. Fourier transform and gray level co-occurrence matrix analysis primarily utilize texture information to determine characteristics. The extracted features can assist in classification tasks. However, this method is constrained by issues such as high computational complexity and weak generalization ability. For example, Li et al. [16] employed the gray level co-occurrence matrix method to extract terrace texture characteristics and density differences. It should be noted that different classification methods and data sources have achieved good results; however, due to the complexity and spectral differences in vegetation shadows, this method is greatly affected by region specific factors as well as crop types. In refined terrace information extraction, intricate and variable features like texture, shape, and spectrum can easily interfere with extraction results leading to missed classification and misclassification. The automated method based on object classification mainly discerns between terraces and non-terraces by analyzing individual object characteristics. This approach effectively combines multiple features to achieve efficient yet accurate terrace extraction. However, complex parameters along with diverse regions tend to hinder the generalization capability of the method. Zhao et al. [21] proposed an object-based image analysis method for extracting terraces on the Loess Plateau, which integrates the digital elevation model (DEM) and optical information from RS images. Their results demonstrated high accuracy in areas with complex vegetation coverage and varied terrain within Loess hilly gullies. Nevertheless, it is important to highlight that the object-oriented classification method heavily relies on subjective experience when setting thresholds, thereby affecting the extraction outcomes. Consequently, meeting terrace identification requirements across different areas becomes a challenging task.
The conventional methods for extracting terraces are sensitive to environmental changes and lack the capabilities to accurately map large terraces, which pose challenges to ensuring accuracy. In contrast, DL is an end-to-end machine learning method based on artificial neural networks [22,23]. DL image segmentation focuses on the contextual information of images, requiring a small amount of manual intervention while automatically extracting features. It is particularly suitable for complex ground object types and dynamic scenes in the extraction of geographical elements from RS images. Currently, numerous scholars have utilized DL methods to extract terraces [24,25,26,27]. For example, Yu et al. [26] developed an IEU-Net deep transfer learning model based on U-Net, incorporating batch normalization and dropout layers to enhance training speed and prevent overfitting, while employing an edge ignoring strategy to improve the accuracy of terrace extraction. However, the model still encounters issues of omission and incorrect extraction when dealing with small-area terraces, and its generalization ability in complex environments remains unverified. Additionally, Lu et al. [27] successfully extracted terraces on the Chinese Loess Plateau using the UNet++ model and achieving high accuracy. Nevertheless, their study did not accurately segment the boundaries of terrace patches nor compare the results with other models, thus making it difficult to ascertain the optimal performance of DL models on the Loess Plateau. Given the complexity of the terrain and diversity of landform types in this region, further optimization is required for applying these models, specifically for the conditions of the study area. Moreover, there exist various types of DL models with differences between them. Each model possesses unique advantages and applicability in specific tasks and data types. Therefore, it is crucial to reasonably select the appropriate model during practical applications. Due to the intricate and diverse nature of RS data, factors such as ground features, terrain fluctuation, environmental changes, and seasonal characteristics significantly impact the performance of models. Consequently, targeted adjustments and optimizations must be made to existing models to achieve optimal analysis and prediction results. This may involve modifying the model structure, optimizing hyperparameters, implementing corresponding strategies in data preprocessing, and feature selection. Through meticulous refinement efforts like these adjustments, we can fully exploit the potential of DL models in RS applications, thereby enhancing both accuracy and reliability levels within image segmentation outcomes.
The availability of numerous DL models notwithstanding, the technology for extracting terrace patches based on the DL method and high-resolution RS data in the Loess Plateau of China remains inadequate. In this study, we selected ZLRB, a typical area with a concentrated distribution of terraces in the Loess Hilly Region of China, to develop a novel terrace extraction method based on DL and GF-2 images. A pixel-level terrace patch extraction method based on DL and GF-2 images has been developed. The main contributions of this research are summarized as follows:
(1)
By utilizing GF-2 images, this study achieved the precise extraction of terrace patches and incorporated DEM data during both the training and prediction stages phases to improve enhance the accuracy of terrace extraction.
(2)
Five deep learning models—U-Net, U-Net++, TransUNet, DeepLabV3+, and PSPNet were employed as baseline models to extract detailed terrace patches from GF-2 images. Subsequently, local information was then extracted by incorporating morphological, textural, and spectral features, thereby addressing issues of poor adhesion and edge segmentation. The model architecture and loss function were refined to achieve high-quality terrace mapping.
(3)
Multi-source data integration was utilized to evaluate assess model performance through visual inspection, field surveys, and confusion matrix evaluation. Remote sensing data and topographic elements were leveraged for correction and optimization.
(4)
The terrace area was quantified using pixel counting (PC), sample proportion (SP), and error matrix-based model-assisted estimation (EM).
We successfully generated a TDZRB with a 1 m resolution for 2020. The precise delineation of terrace patches and accurate calculation of their respective areas provide indispensable foundational data for assessing regional soil and water conservation benefits as well as ensuring food security.

2. Materials and Methods

2.1. Study Area

The Zuli River Basin (ZLRB) (Figure 1) is situated in the western Loess Plateau (104°12′–105°30′E, 35°17′–36°34′N), covering an area of 10,647 km2. It serves as a primary tributary to the upper reaches of the Yellow River. This region represents a typical Loess Hilly Region terrace area characterized by fragmented terrain and diverse landscapes, with the altitude extending from 1392 m to 2816 m [28]. ZLRB experiences an average annual precipitation of approximately 315 mm, with June to September accounting for 69% of the yearly rainfall; intensive rainfall results in serious soil erosion. Terracing constitutes the principal approach employed for soil and water conservation and land productivity improvement within ZLRB. The basin exhibits a wide distribution of terraces comprising various types, including level terraces (consists of a series of horizontal platforms), zig terraces (platform tilted inwards at an angle of 10–15°), slope-separated terraces (with slopes between adjacent terraces), and slope terraces (terraces sloping with embankments spanning across slopes) built in different periods [29]. The fragmented terrain coupled with diverse terrace types and shapes presents significant challenges in accurately extracting information about these terraces. The terrain of ZLRB is characterized by significant undulations and a diverse range of ground objects, such as water bodies, vegetation, buildings, roads, etc. Additionally, land cover types in this area exhibit a high level of diversity due to terraced landscapes with varying vegetation coverage that possess distinct spectral characteristics [30]. The presence of complex background elements and spectral features pose considerable challenges for terrace extraction; however, obtaining high-precision and high-standard terrace data is crucial. Therefore, this article utilizes GF-2 imagery from the Chinese earth observation satellite as a primary data source and employs a DL semantic segmentation model to enhance the refinement of the terraces in ZLRB.

2.2. Data Source

2.2.1. GF-2 RS Image Sources and Preprocessing

This study utilizes the GF-2 RS image of the ZLRB in 2020, which consists of 54 multispectral images with a spatial resolution of 4 m and panchromatic images with a spatial resolution of 1 m [31]. We endeavored to select cloud-free GF-2 images, and these are merged into multi-band data at a spatial resolution of 1 m using data fusion techniques. Initially, the multispectral image undergoes radiometric calibration, atmospheric correction, and orthorectification processing while the panchromatic image undergoes radiometric calibration and orthorectification processing. Subsequently, the GF-2 multispectral image is fused with the panchromatic image using the NNDiffuse translation sharpening tool. After fusion, the GF-2 image comprises four bands (Figure 1d). The cloud-free area accounts for 99.879% of the ZLRB.

2.2.2. SinoLC-1(LUCC Data) and DEM Data

To improve the efficiency of terrace extraction, we utilized SinoLC-1 data, a 1 m land cover map of China based on a DL framework and open access data, to rectify the extent of the terraces [32]. The SinoLC-1 dataset exhibited an overall accuracy of 73.61% [32], indicating its reliability for comparability between 2020 and 2021. Consequently, we employed SinoLC-1 data as a mask to rectify the extraction outcomes for ZLRB terraces in 2020 (Figure 1c). The SinoLC-1 dataset was downloaded from website: (https://doi.org/10.5281/zenodo.7707461 (accessed on 20 December 2024)).
Unlike regular cultivated land, terraced fields possess rich and distinctive topographic and geomorphic information [33]. Considering that topography plays a crucial role in terrace extraction, it is important to note that GF-2 images only provide two-dimensional plane data (Figure 1d), which may lead to the misclassification of flat fields in certain river valleys as terraces. To address this issue, we incorporated DEM data for topographic characterization using the 2020 BIGMAP–Google Map with a resolution of 4 m (http://www.bigemap.com/ (accessed on 10 December 2024)). Subsequently, terrain correction was applied to the DEM data and sampled to 1 m (Figure 1b).

2.3. Methods

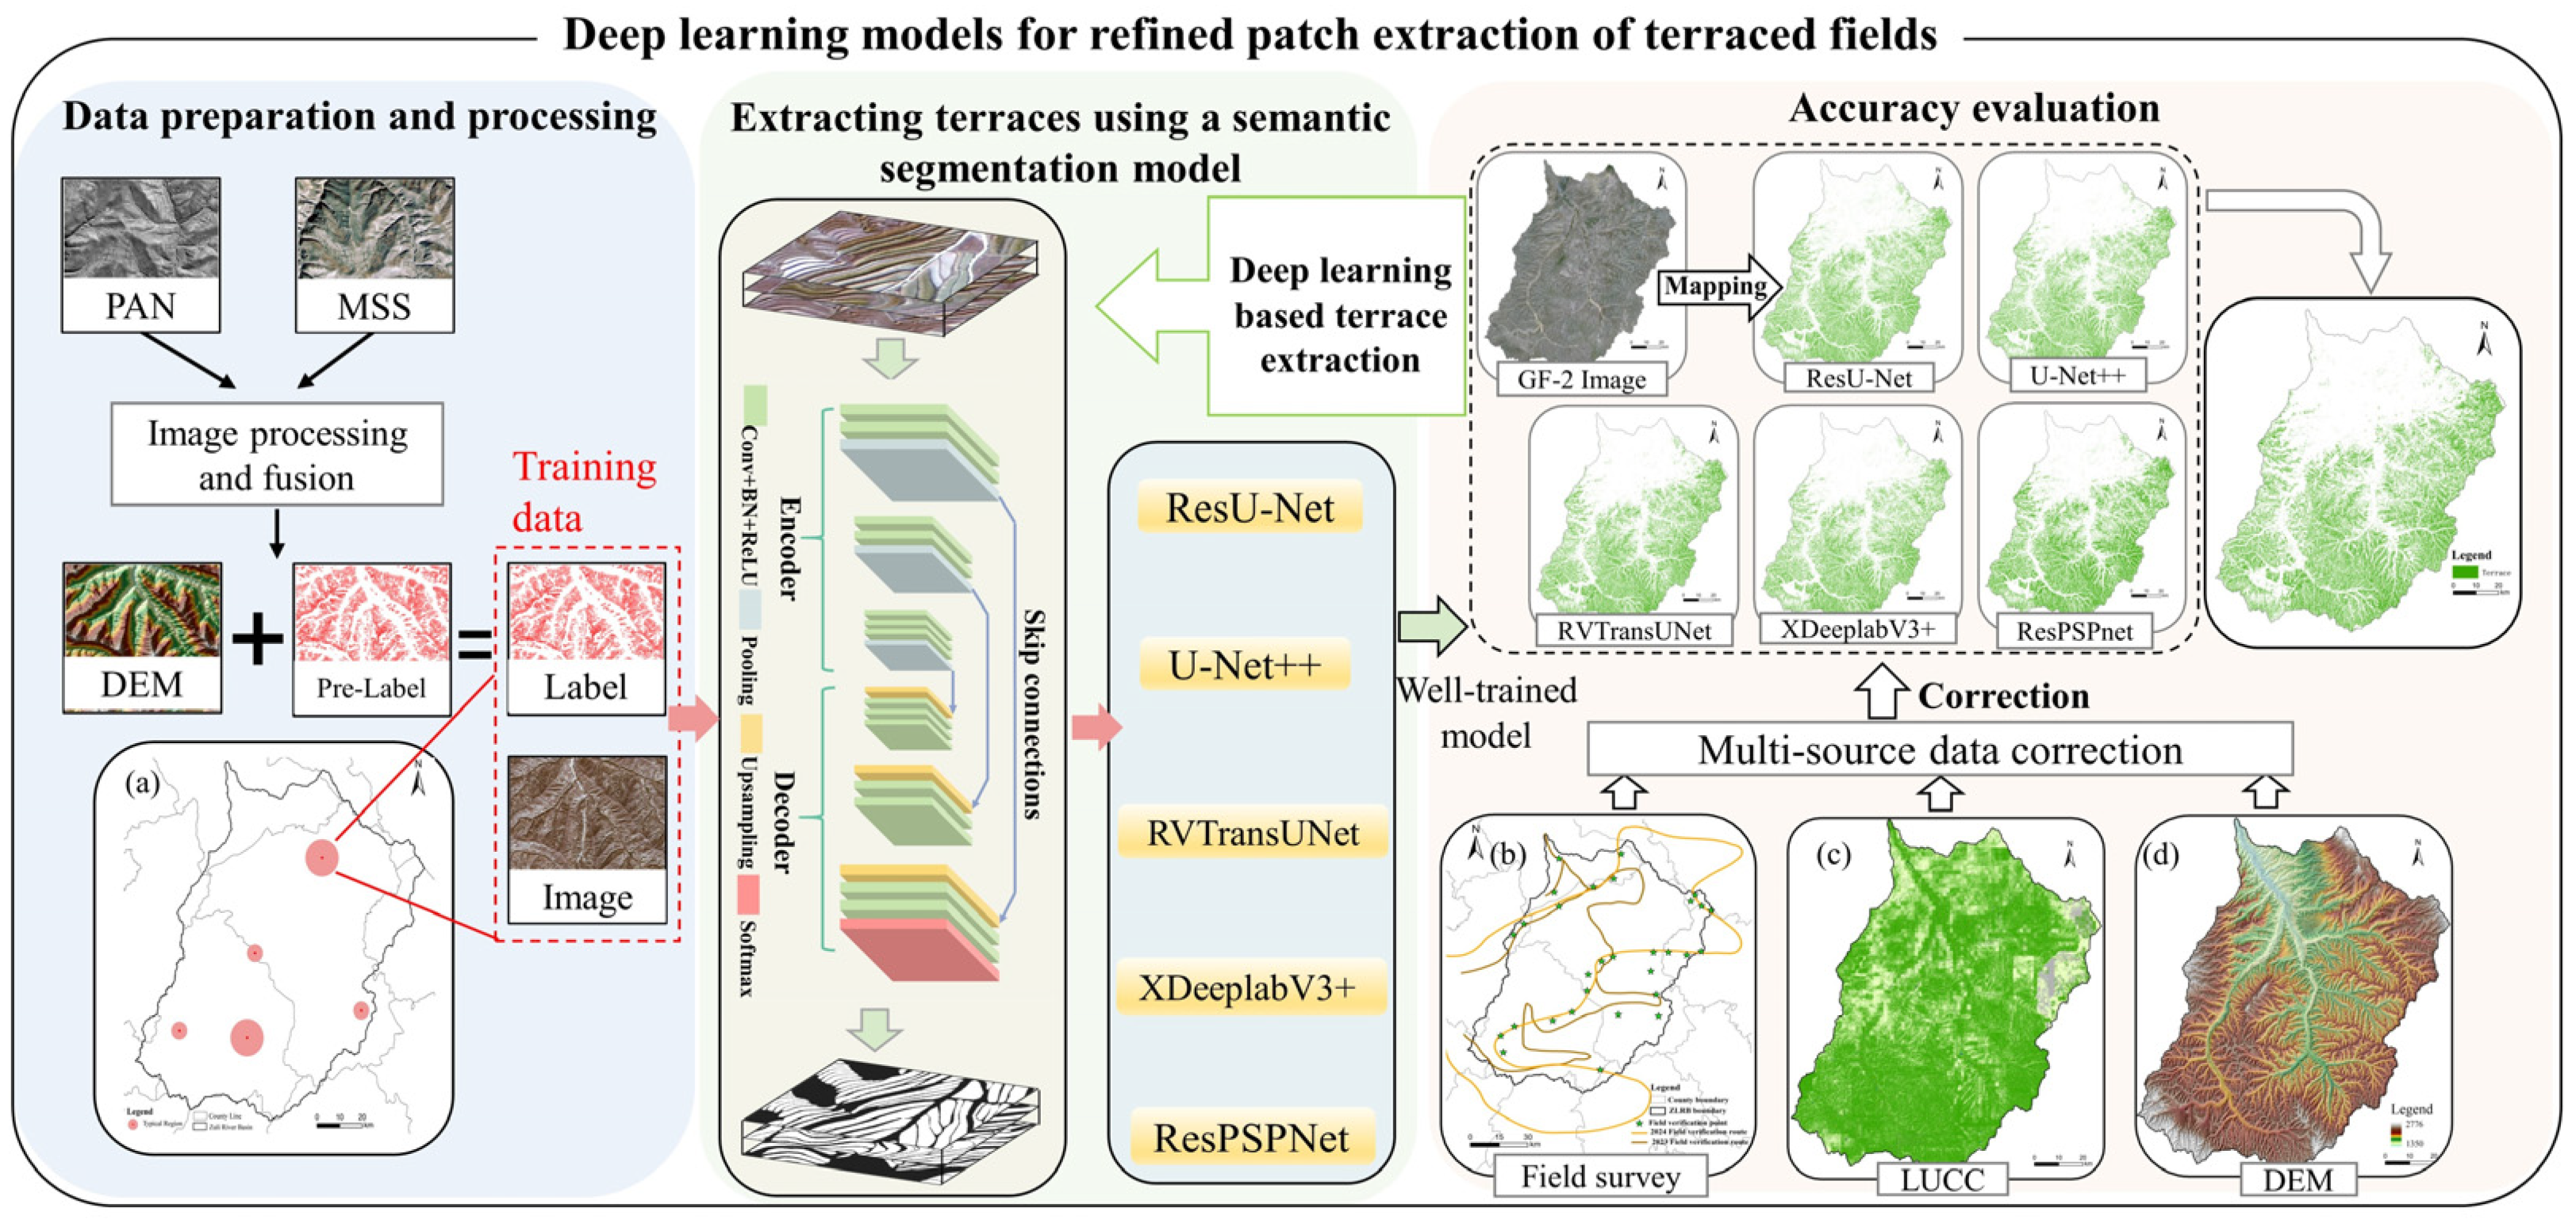
This study developed a comprehensive framework for the fine extraction of terrace information from high-resolution RS images, encompassing the following key components: (1) data preprocessing, (2) dataset construction, (3) development of a robust terrace information extraction model, (4) a rigorous accuracy evaluation, and (5) the iterative refinement of terrace data.

2.3.1. Dataset Construction

The susceptibility of low-resolution RS images to information loss and blurred boundaries can be overcome by utilizing high-resolution images, which provide abundant spatial information for refined analysis. In the ZLRB, there exist numerous fish scale pits (semicircular rainwater retention basins) [29] and terraces with a width of less than 1.5 m that can be accurately extracted using GF-2 images with a resolution of 1 m, thus avoiding extraction errors. Terrace extraction is significantly influenced by the terrain environment, crop growth status, as well as the process of returning farmland to forest and grassland on the terrace surface. Therefore, our objective is to select GF-2 images during the autumn and winter seasons with minimal vegetation occlusion while integrating DEM data into the image as a separate layer for precise terrace extraction.
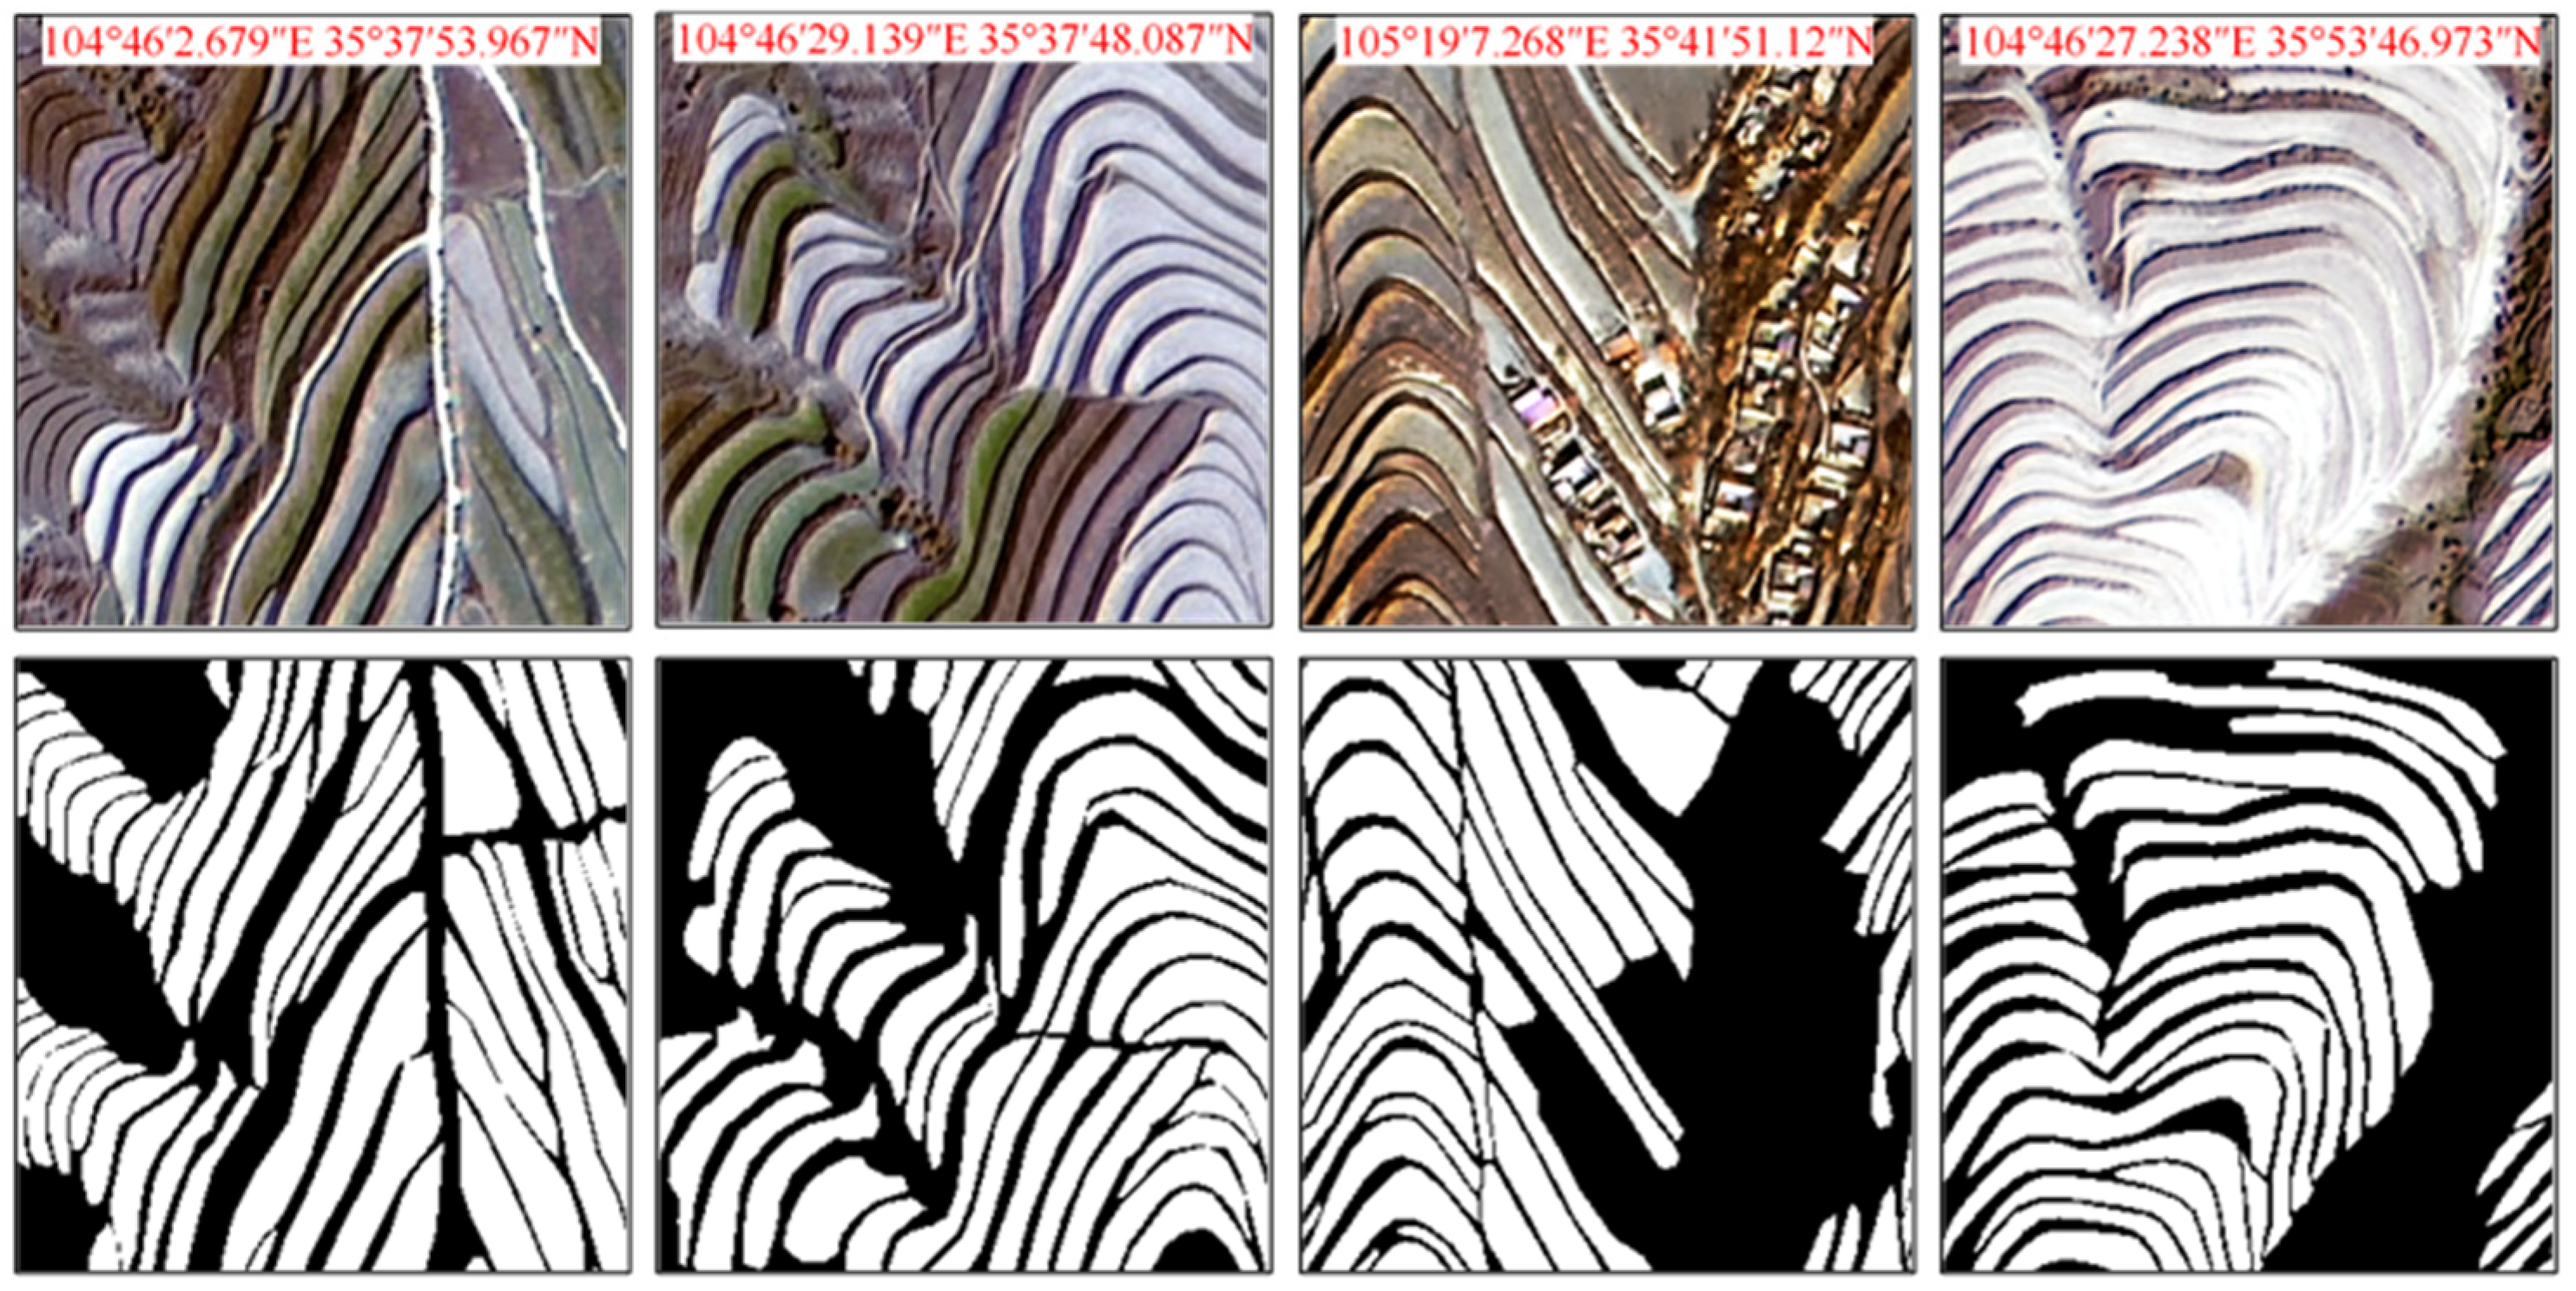
The representativeness, randomness, and quality of the labels have a significant influence on the effectiveness of the model. Initially, we selected 30 representative areas by combining field records and image effects. These areas were then cropped into blocks measuring 256 × 256 pixels. Subsequently, we employed the shuffle method for random selection and identified the 5 most frequently occurring areas as label annotation regions (Figure 2a), covering an area of 288.25 km2. We manually created vector labels for these sample areas using visual interpretation methods. Specifically, terraces marked with white (RGB (255, 255, 255)) were assigned a pixel value of 255, while other parts represented by black color (RGB (0, 0, 0)) were assigned pixel values of 0. The vector labels were then converted into a raster format to complete the annotation process. Next, both images and labels underwent cropping and formatting using an overlapping sliding window method with dimensions set at 256 × 256 pixels. To enhance the universality and robustness of our DL network model further, various image enhancement techniques such as rotation (180°), horizontal and vertical flipping, diagonal mirroring along with pepper-and-salt noise addition, and Gaussian noise were applied. Ultimately, a total of 38,800 images along with their corresponding labels were obtained from this process. Out of these samples, 31,040 images together with their respective labels were used for training purposes, while 7760 images with their corresponding labels served as verification. The GF-2 images along with their corresponding label images are illustrated in Figure 3.

2.3.2. Development of a DL Model for Enhanced Extraction of Terraced Fields

The application of DL semantic segmentation models in RS image segmentation has gained significant popularity in recent years [34,35,36]. This study employed a DL semantic segmentation approach to extract terraces in the Loess Hilly Area, characterized by diverse topography and landscape types. The high-resolution RS images reveal abundant intricate features, posing several challenges for DL semantic segmentation models, including category imbalance, indistinct boundaries, information overload at fine scales, and increased computational complexity. To effectively address these challenges, we have made targeted adjustments to the structures and loss functions of multiple models with the objective of selecting a highly precise and reliable DL model suitable for terrace extraction in the Loess Hilly Area.
  • ResU-Net
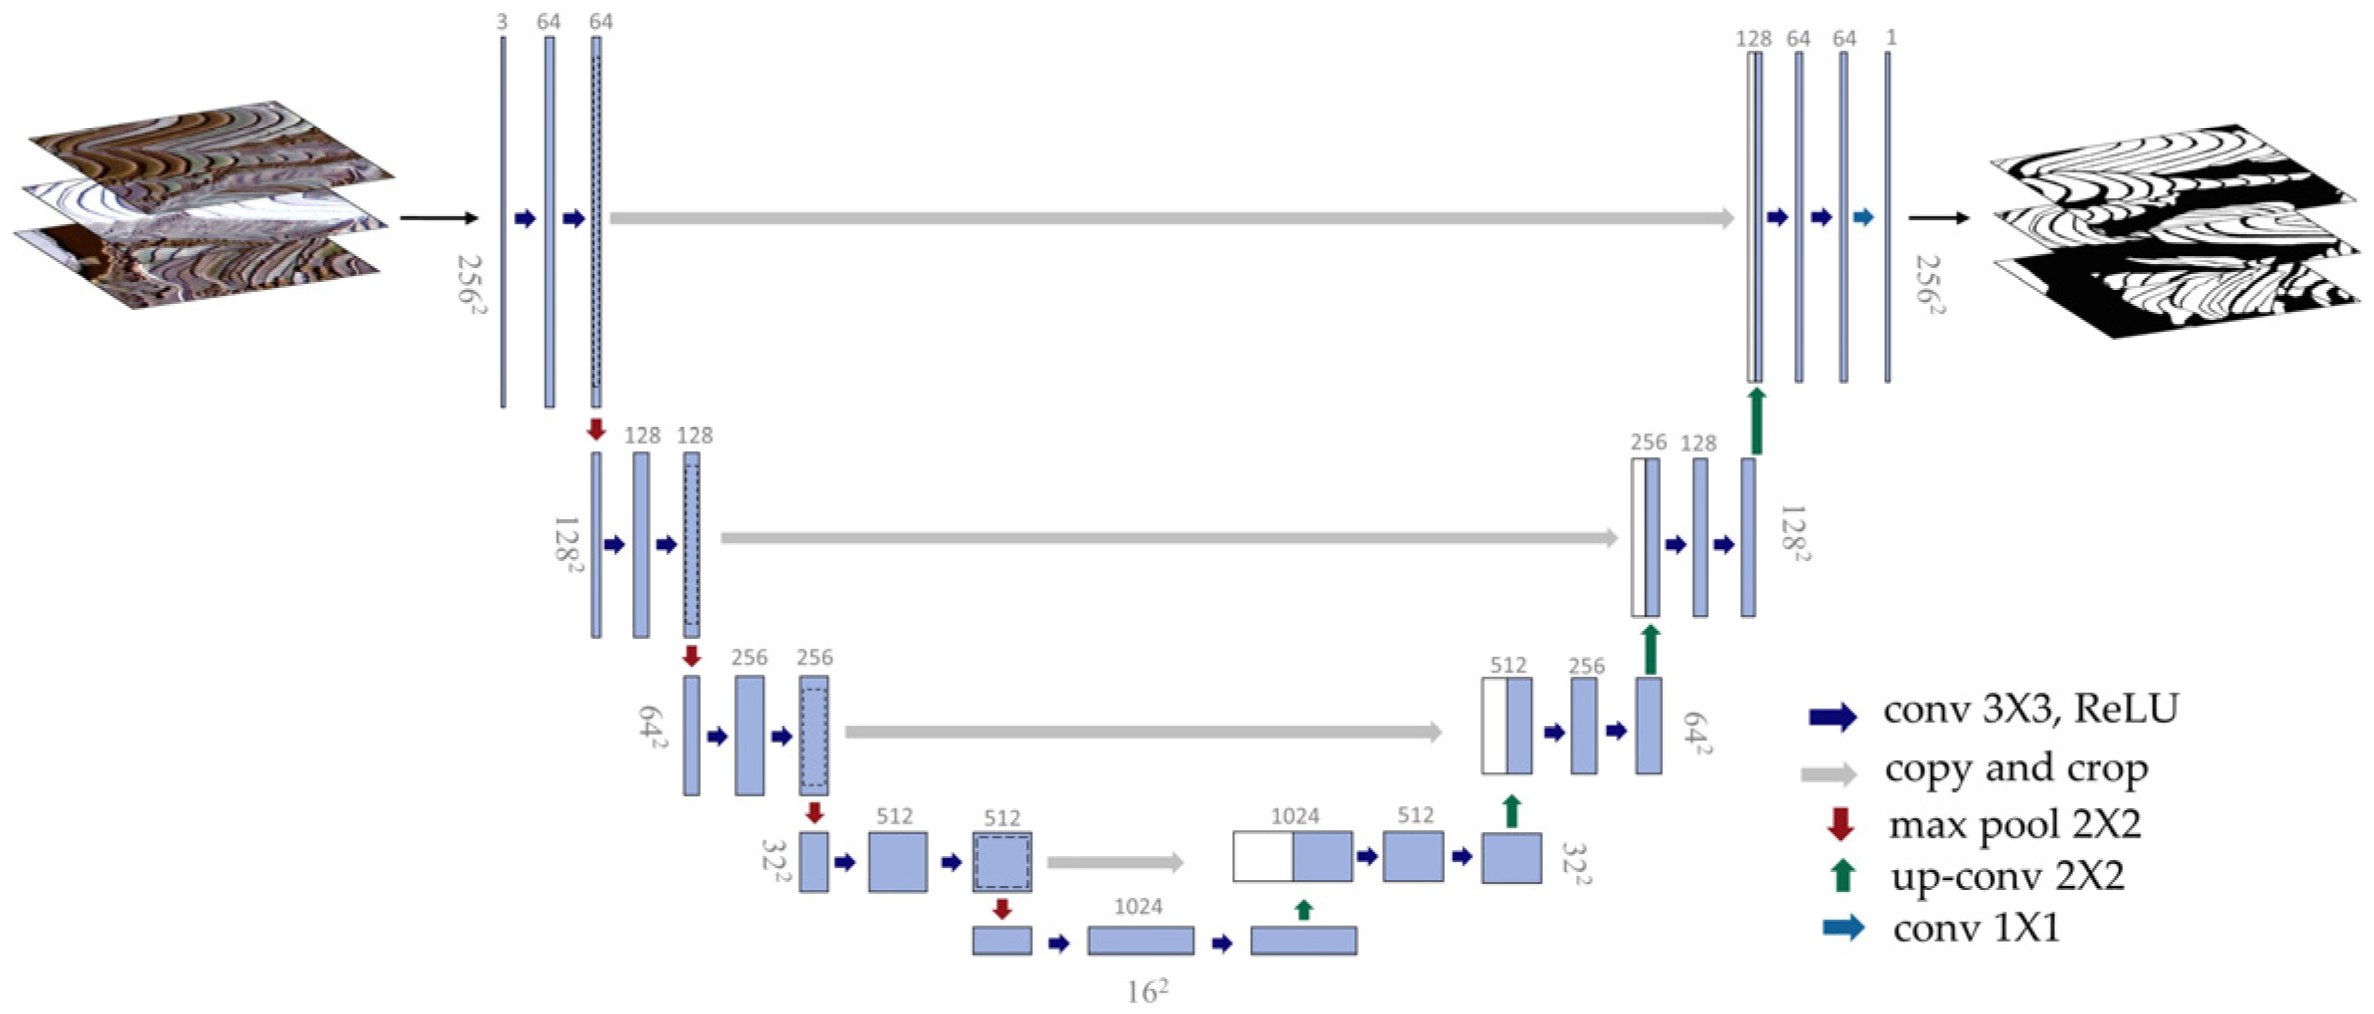
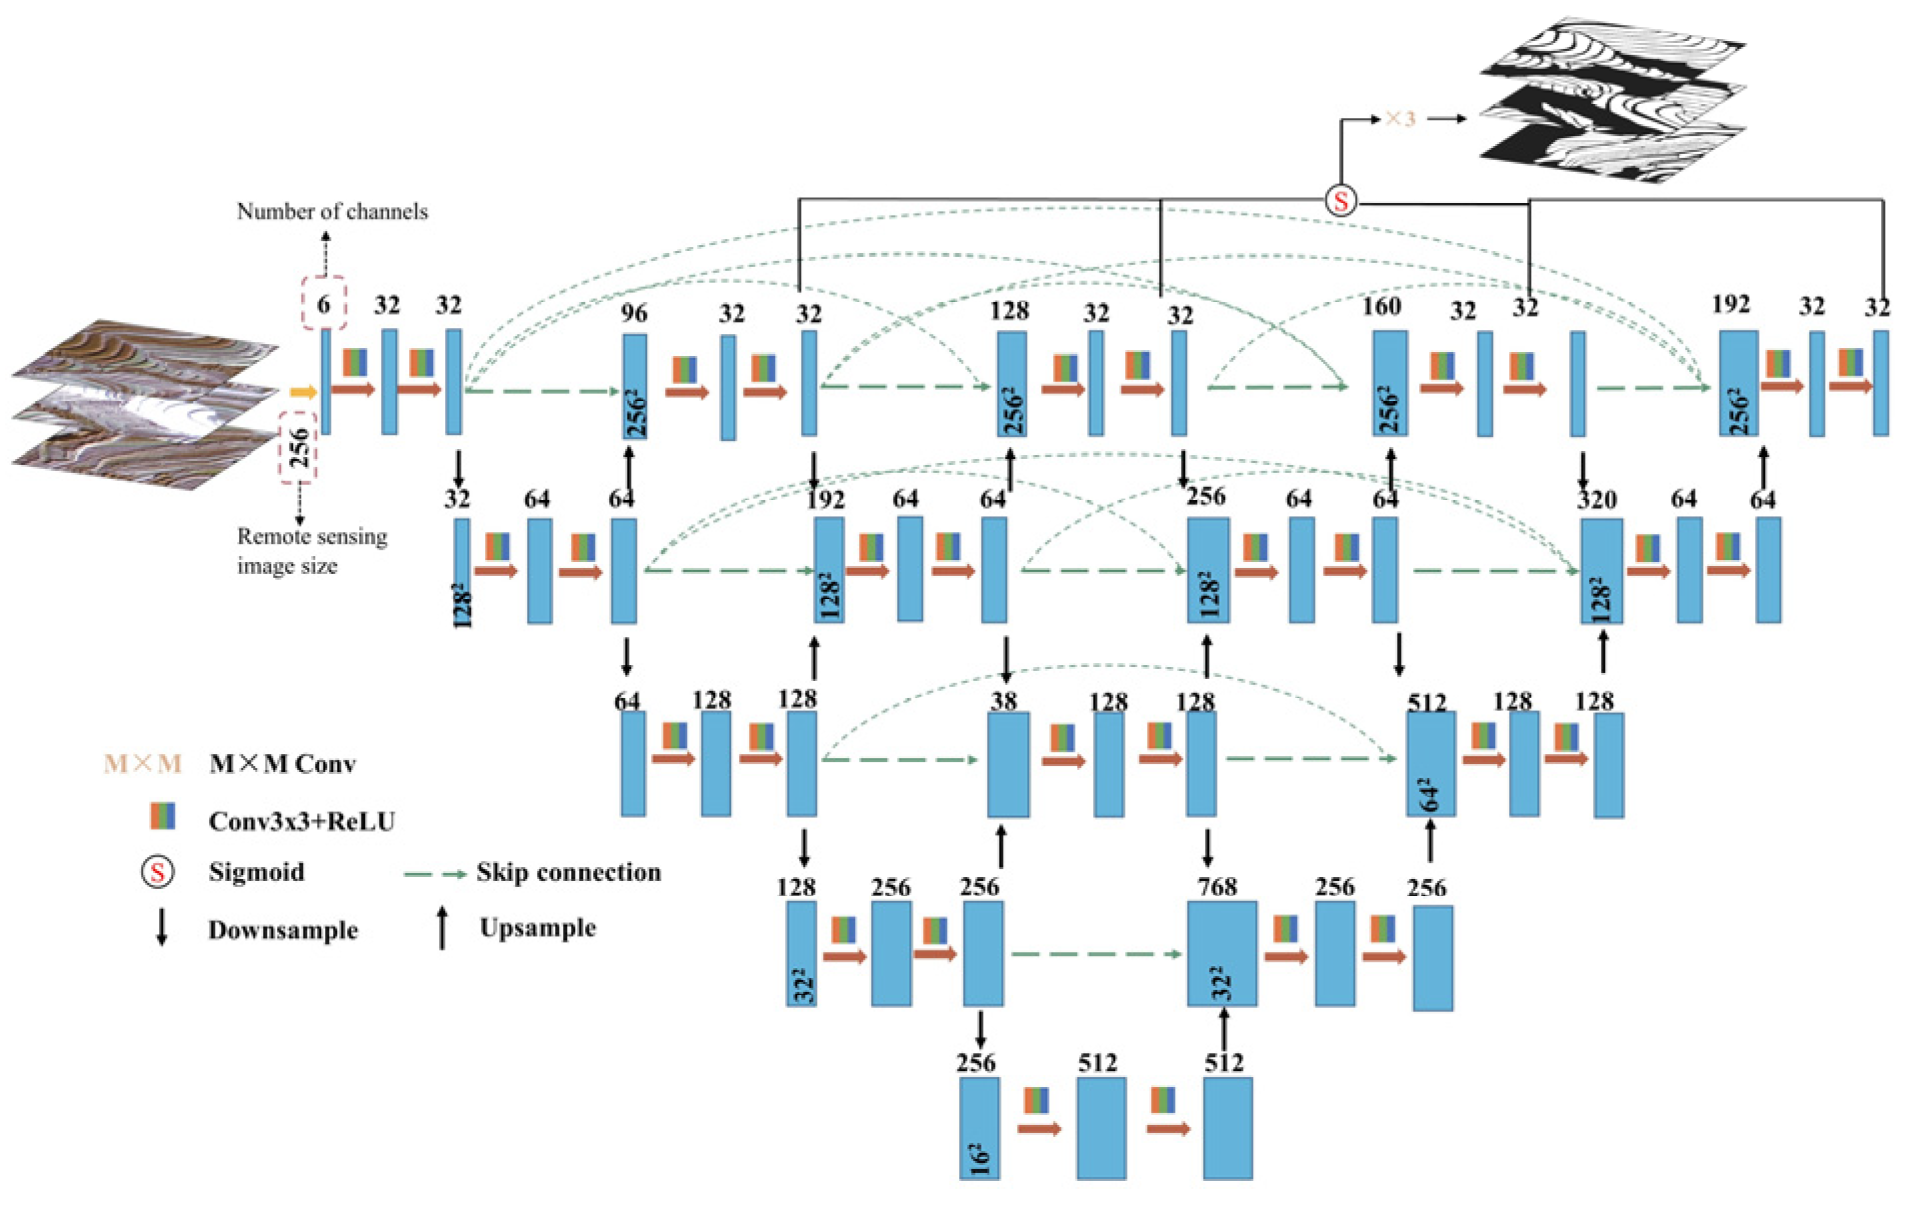
The U-Net network was introduced by Ronneberger et al. at the MICCAI conference [37], and it derives its name from its distinctive “U” shape. The left half of the network serves as the encoder, which is primarily responsible for feature extraction. On the other hand, the right half functions as the decoder, focusing on precise localization tasks.
Compared to other low-resolution images, GF-2 images exhibit high computationally complexity and demand substantial data resources. The terrain of ZLRB is characterized by its intricate and dynamic nature, diverse landscape types, as well as irregular terrace contours. Existing DL models tend to lose significant detail information during the convolution process when extracting complex information from images, resulting in inaccurate identification of small-sized and narrow-shaped terraces. To address these challenges, this study proposes employing U-Net as the fundamental architecture with ResNet50 serving as the encoder within the U-Net network (Figure 4). By leveraging residual connections to overcome gradient vanishing issues and enhancing feature extraction capabilities, ResNet50 effectively captures deeper and more complex features, enabling the precise processing of terrace edges and details. Additionally, utilizing pre-trained ResNet50 weights accelerates model convergence while improving generalization ability.
2.
U-Net++
The U-Net++ network model is a revised version of the traditional U-Net model (Figure 5), proposed by Zhou et al. [38]. Compared to the U-Net network, U-Net++ significantly improves the segmentation performance and robustness of the model through the incorporation of dense skip connections, deep supervision, and improved feature fusion. High-resolution RS images are characterized by intricate details and complex ground features. Given that ZLRB terraces exhibit diverse spectral characteristics and area sizes, leveraging its effective image feature details, capture ability, as well as its stronger expression capability and better small sample learning ability makes the U-Net++ network advantageous in multi-scale feature extraction while better capturing boundary details.
3.
RVTransUNet
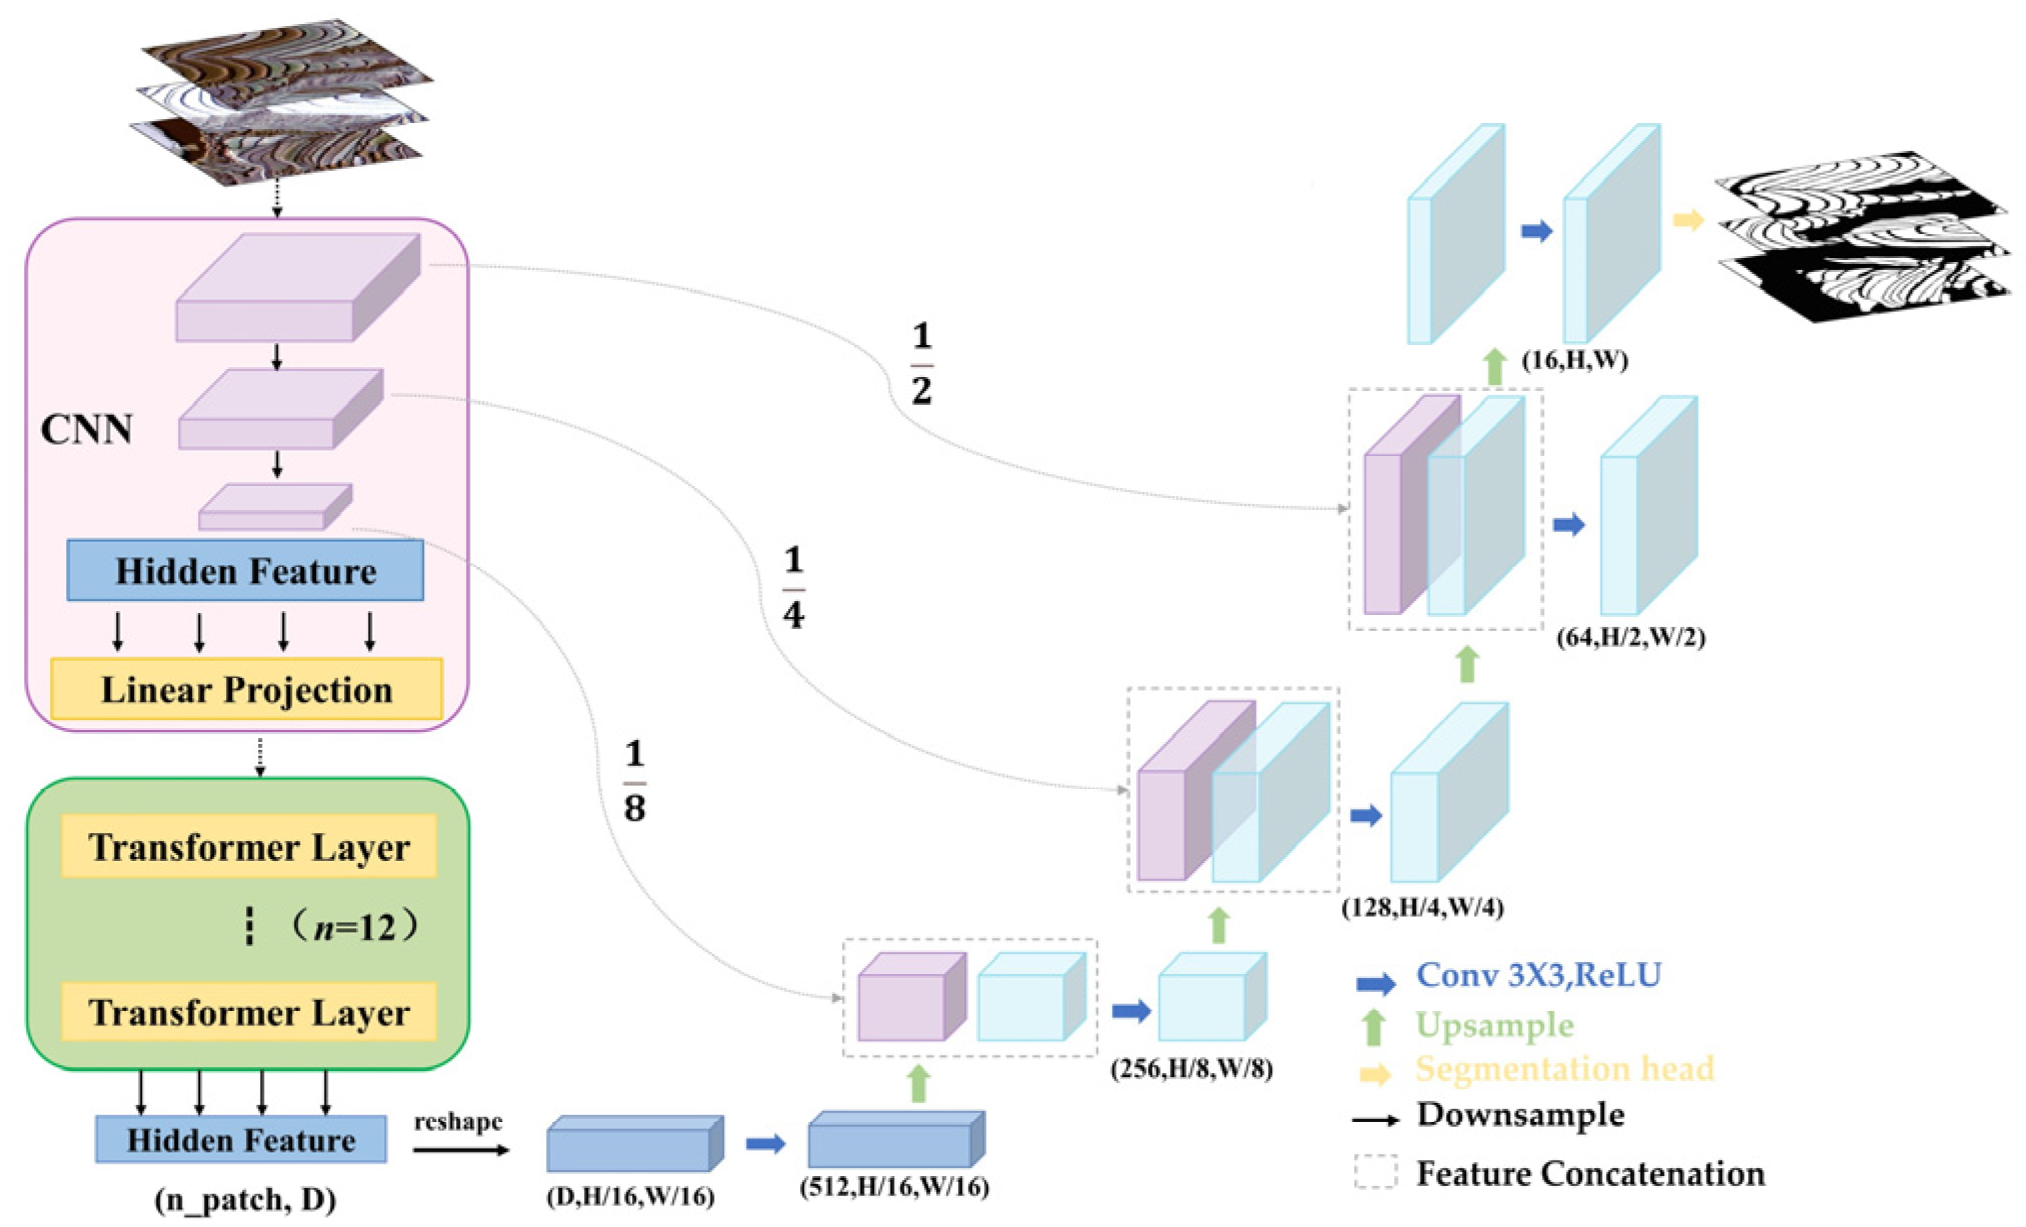
In response to the limitations of the U-Net model in handling long-range dependencies and the limited positioning ability of the Transformer model due to a lack of shallow feature details, Chen et al. proposed the TransUNet model [39]. The TransUnet network architecture on the left consists of an encoder that combines a CNN module and a Transformer model (referred to as TransUnet). In this study, we opted for a hybrid encoder called R50-ViT, which combines the Res-Net-50 network and Vision Transformer (ViT) model with 12 Transformer encoding layers (Figure 6). Both the ResNet-50 network and the ViT model have been pre-trained on their own datasets. The ResNet-50 network extracts feature maps while the ViT model encodes these maps into input sequences. On the right is the decoder. RS images exhibit significant variation in features; even identical targets may possess different spectral features, shapes, and strong mixed pixel characteristics. We adopted R50-ViT as an encoder because ResNet-50 effectively captures local features and details while overcoming complex spatial and spectral information. Meanwhile, ViT allows learning long-distance dependencies throughout the image, thereby capturing more complex global features. By utilizing the R50-ViT encoder, our model exhibits enhanced expressiveness, adaptability, and generalization capabilities.
4.
XDeepLabV3+
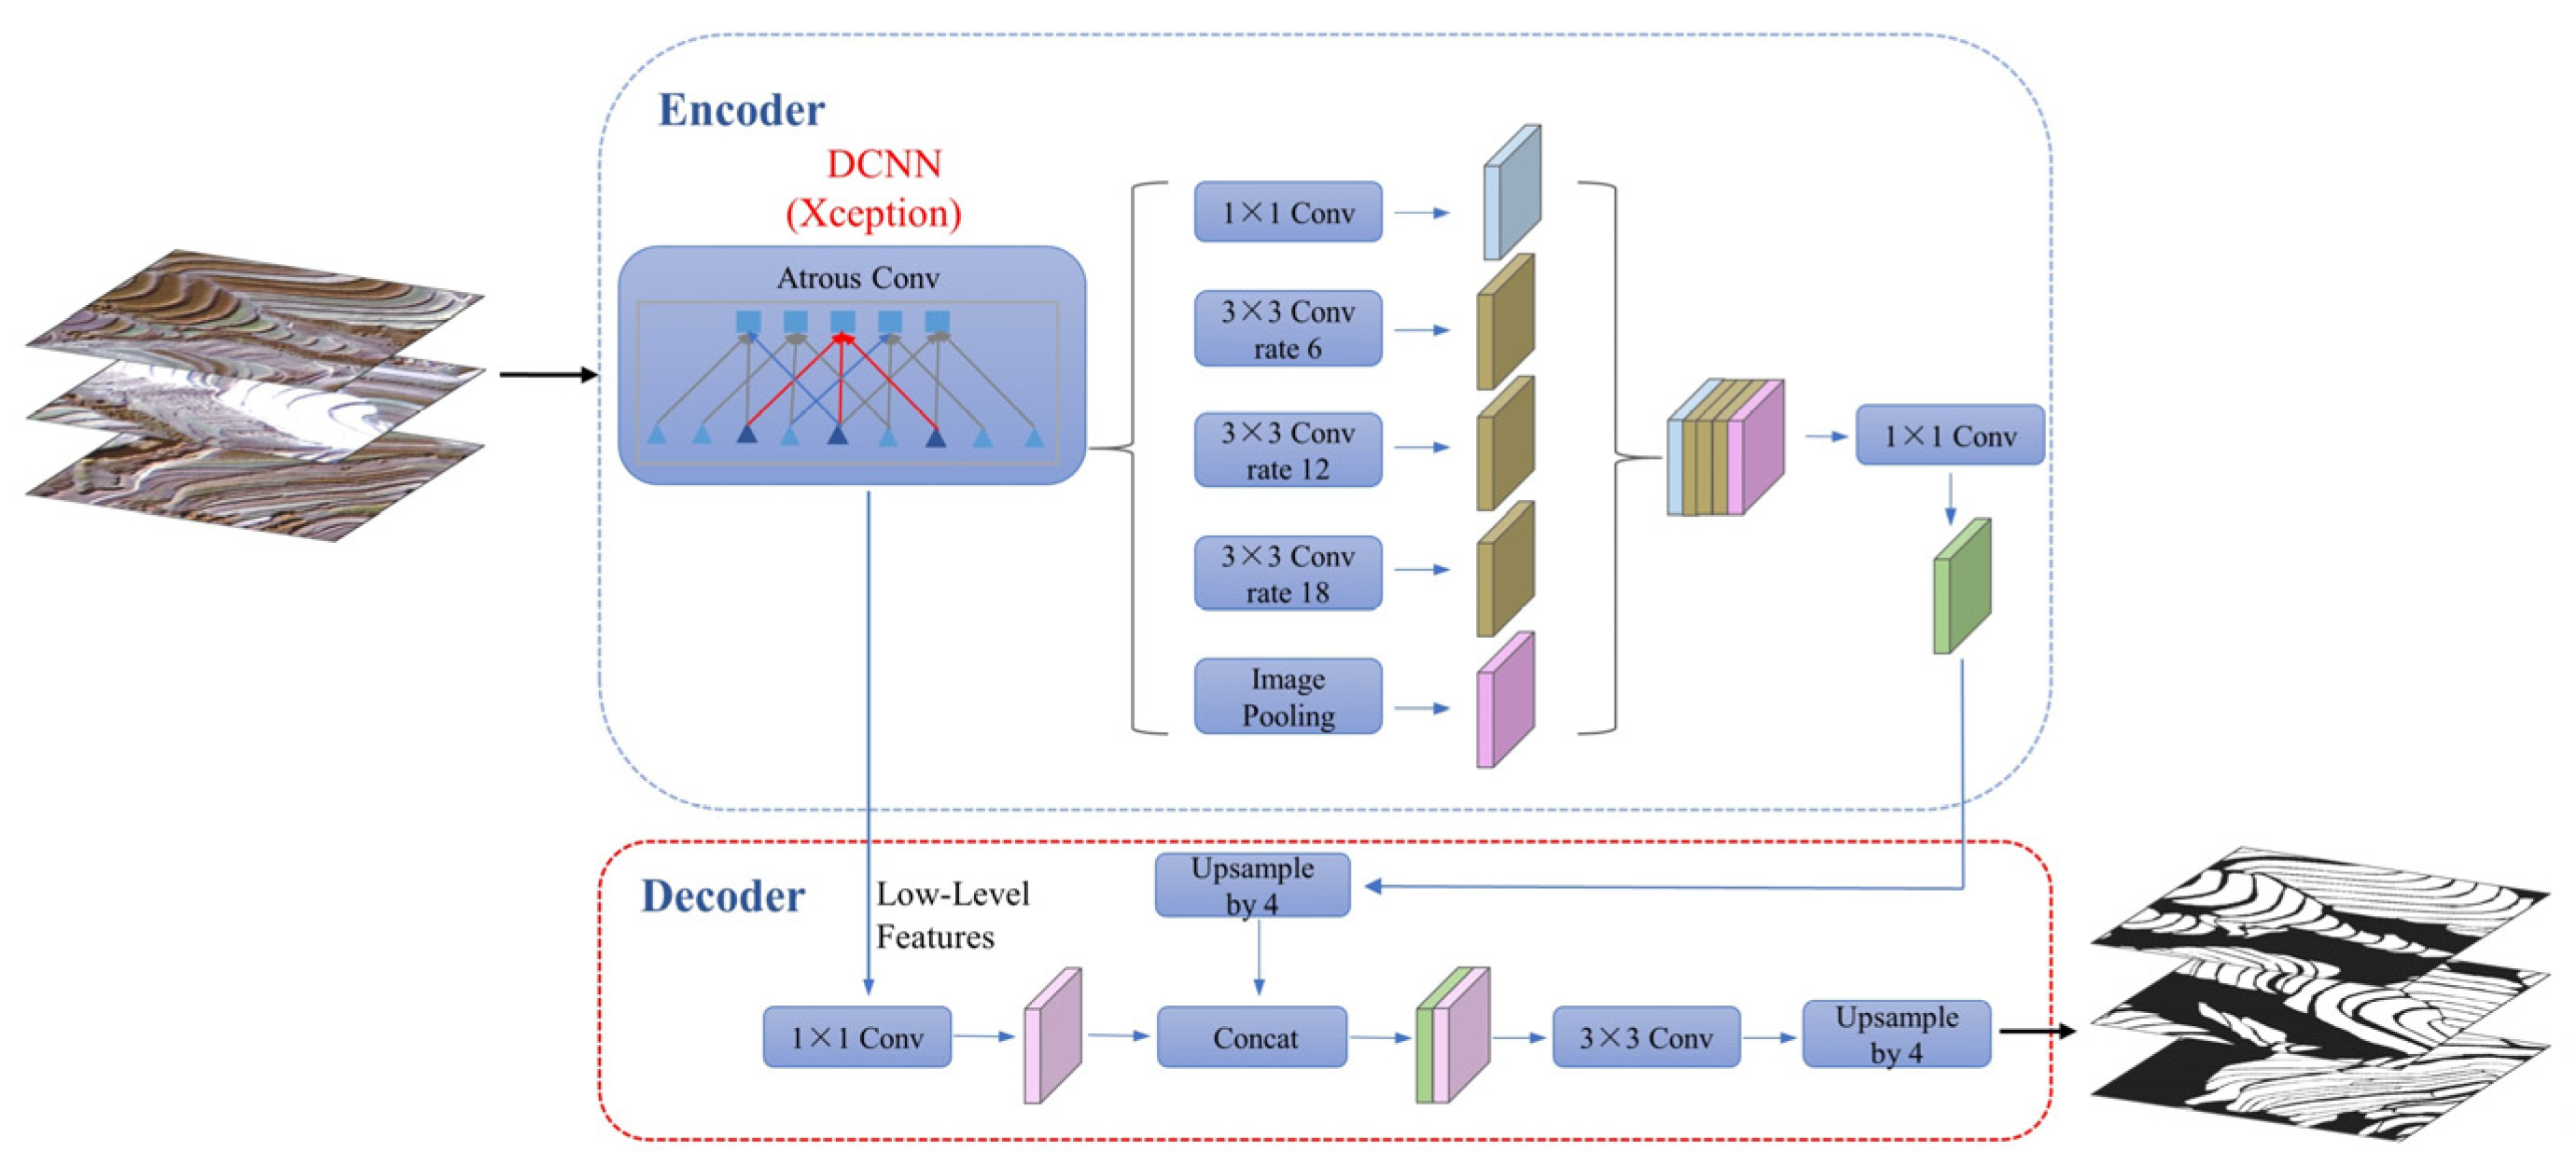
The DeepLabV3+ network has gained widespread adoption in the field of RS image semantic segmentation in recent years [39,40,41,42]. In response to the challenges posed by inaccurate boundary positioning and a lack of effective decoders in DeepLabV3, Google proposed the DeepLabV3+ model [43]. DeepLabV3+ adopts an encoder–decoder structure. Considering that GF-2 images and high-resolution DEM data are l voluminous and detailed, Xception is selected as the backbone network for the DeepLabV3+ model (Figure 7). As the backbone network of DeepLabv3+, Xception effectively addresses various challenges such as efficient feature learning, spatial information capture, multi-scale processing, overfitting risk, migration, and reasoning speed through innovative designs like deep separable convolution. This empowers DeepLabv3+ to achieve outstanding performance in semantic segmentation tasks while maintaining its lightweight and efficient nature.
5.
ResPSPNet
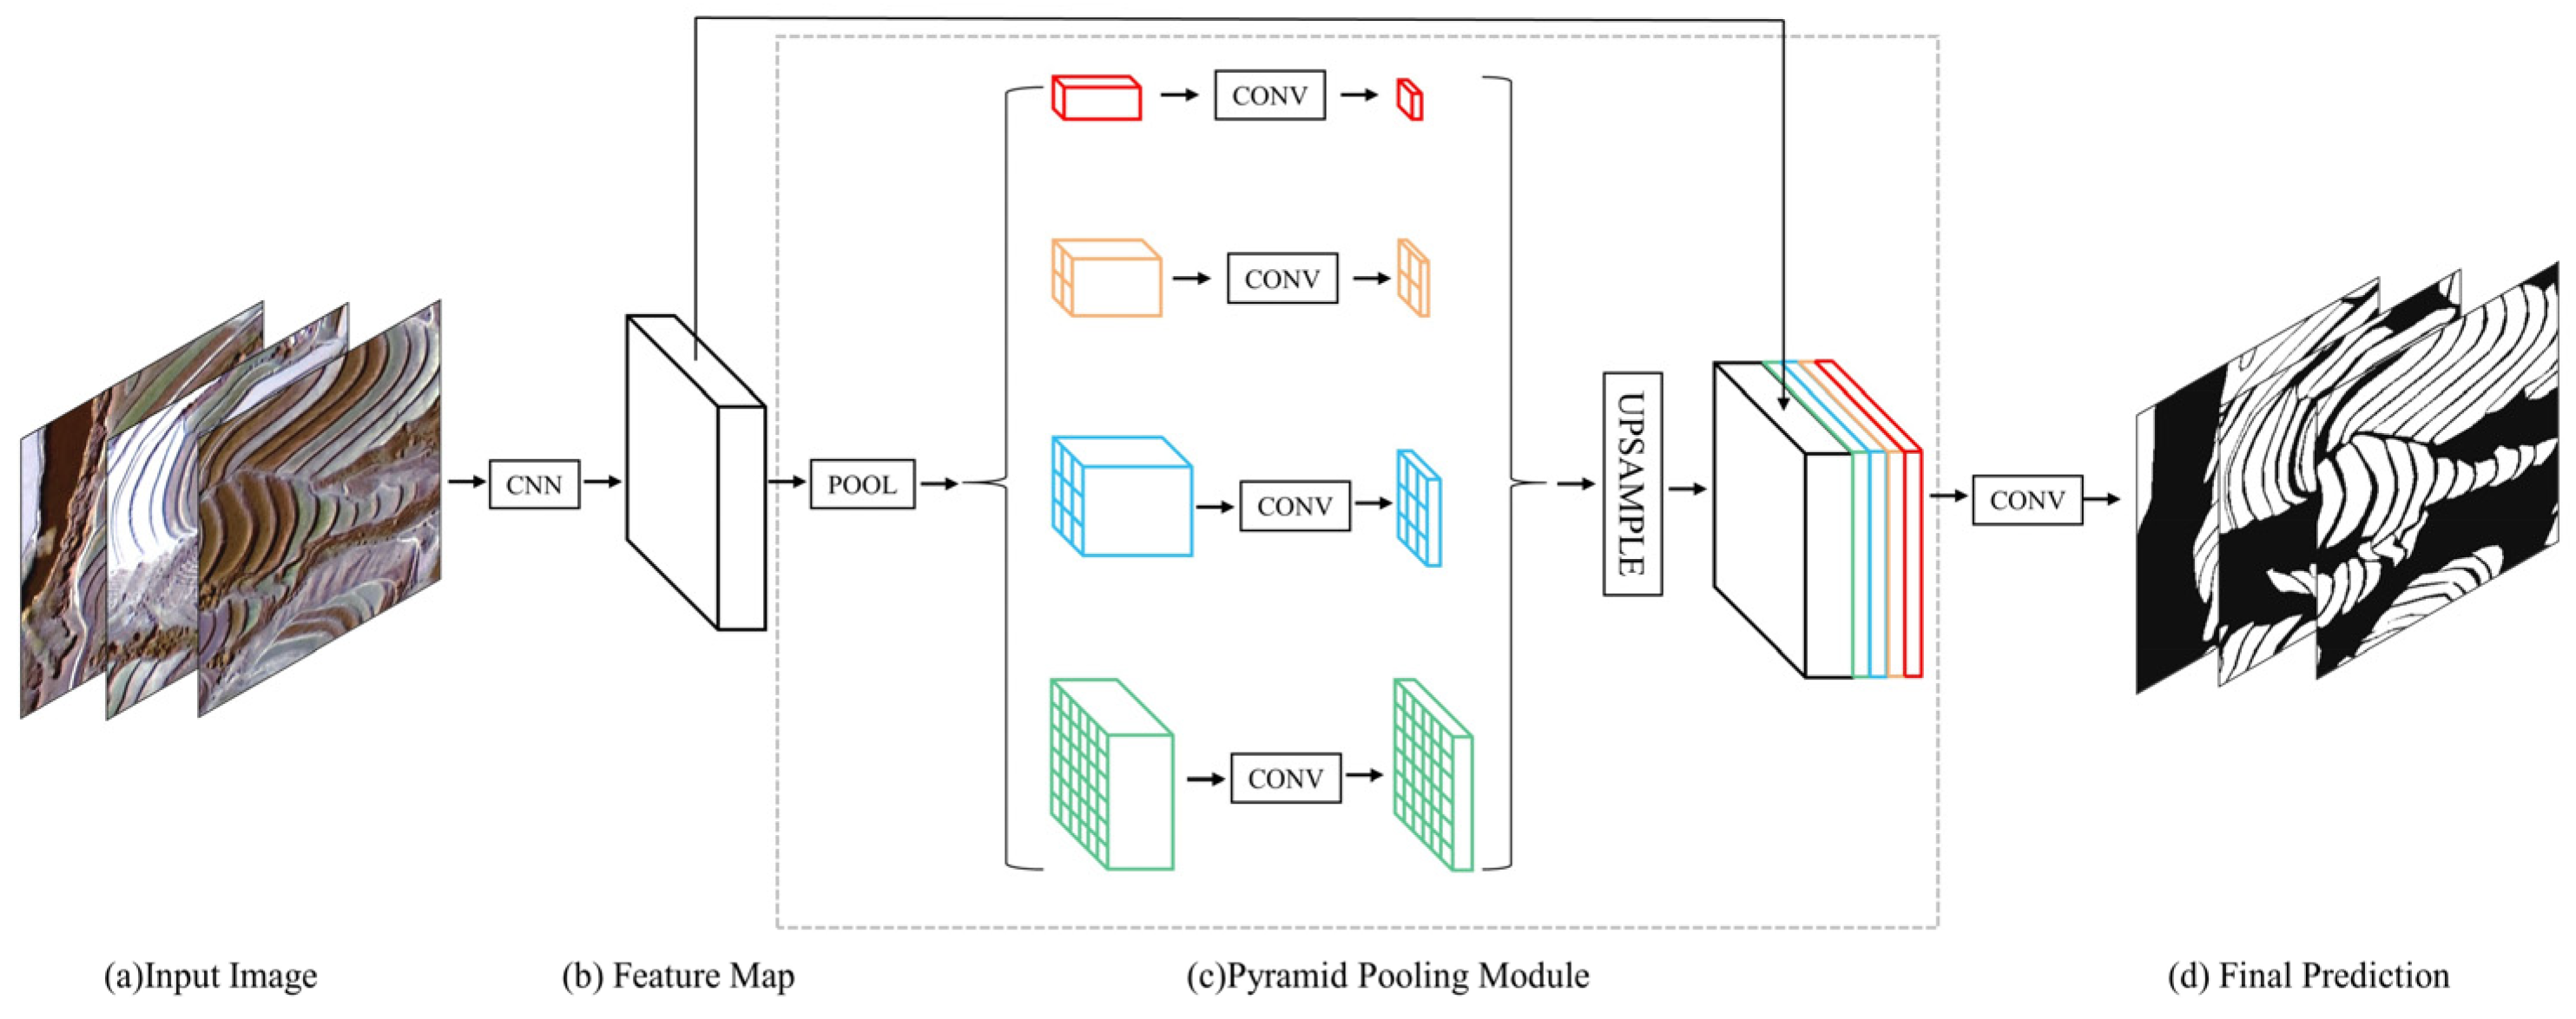
The context-based PSPNet (Pyramid Scene Parsing Network) model was proposed by Zhao et al. [44]. The core idea behind PSPNet is to incorporate more global information into the segmentation layer when discriminating small local targets, to reduce the likelihood of false extraction. However, due to limitations posed by high-resolution RS images such as their large data volume and diverse background detail features, applying the PSPNet model proves relatively complex and has limited effectiveness in recognizing small terraces. In this study, ResNet50 serves as a backbone network for enhancing the performance of the PSPNet model (Figure 8). Firstly, ResNet50 offers relative lightness, which aids in improving processing efficiency for high-resolution images within our model. Secondly, ResNet50 effectively mitigates gradient vanishing issues encountered in deep neural networks, thereby enabling better learning capabilities for complex features within PSPNet models. Additionally, ResNet50’s multi-level network structure facilitates the effective extraction of multi-scale features ranging from local to global scales. Combined with the PSPNet pyramid pooling module, it greatly enhances the model’s ability to segment objects of different sizes and in complex backgrounds.
We have provided a thorough summary of the advantages and disadvantages associated with each model utilized for high-resolution remote sensing image terrace patch extraction, as detailed in Appendix A.
6.
Loss function
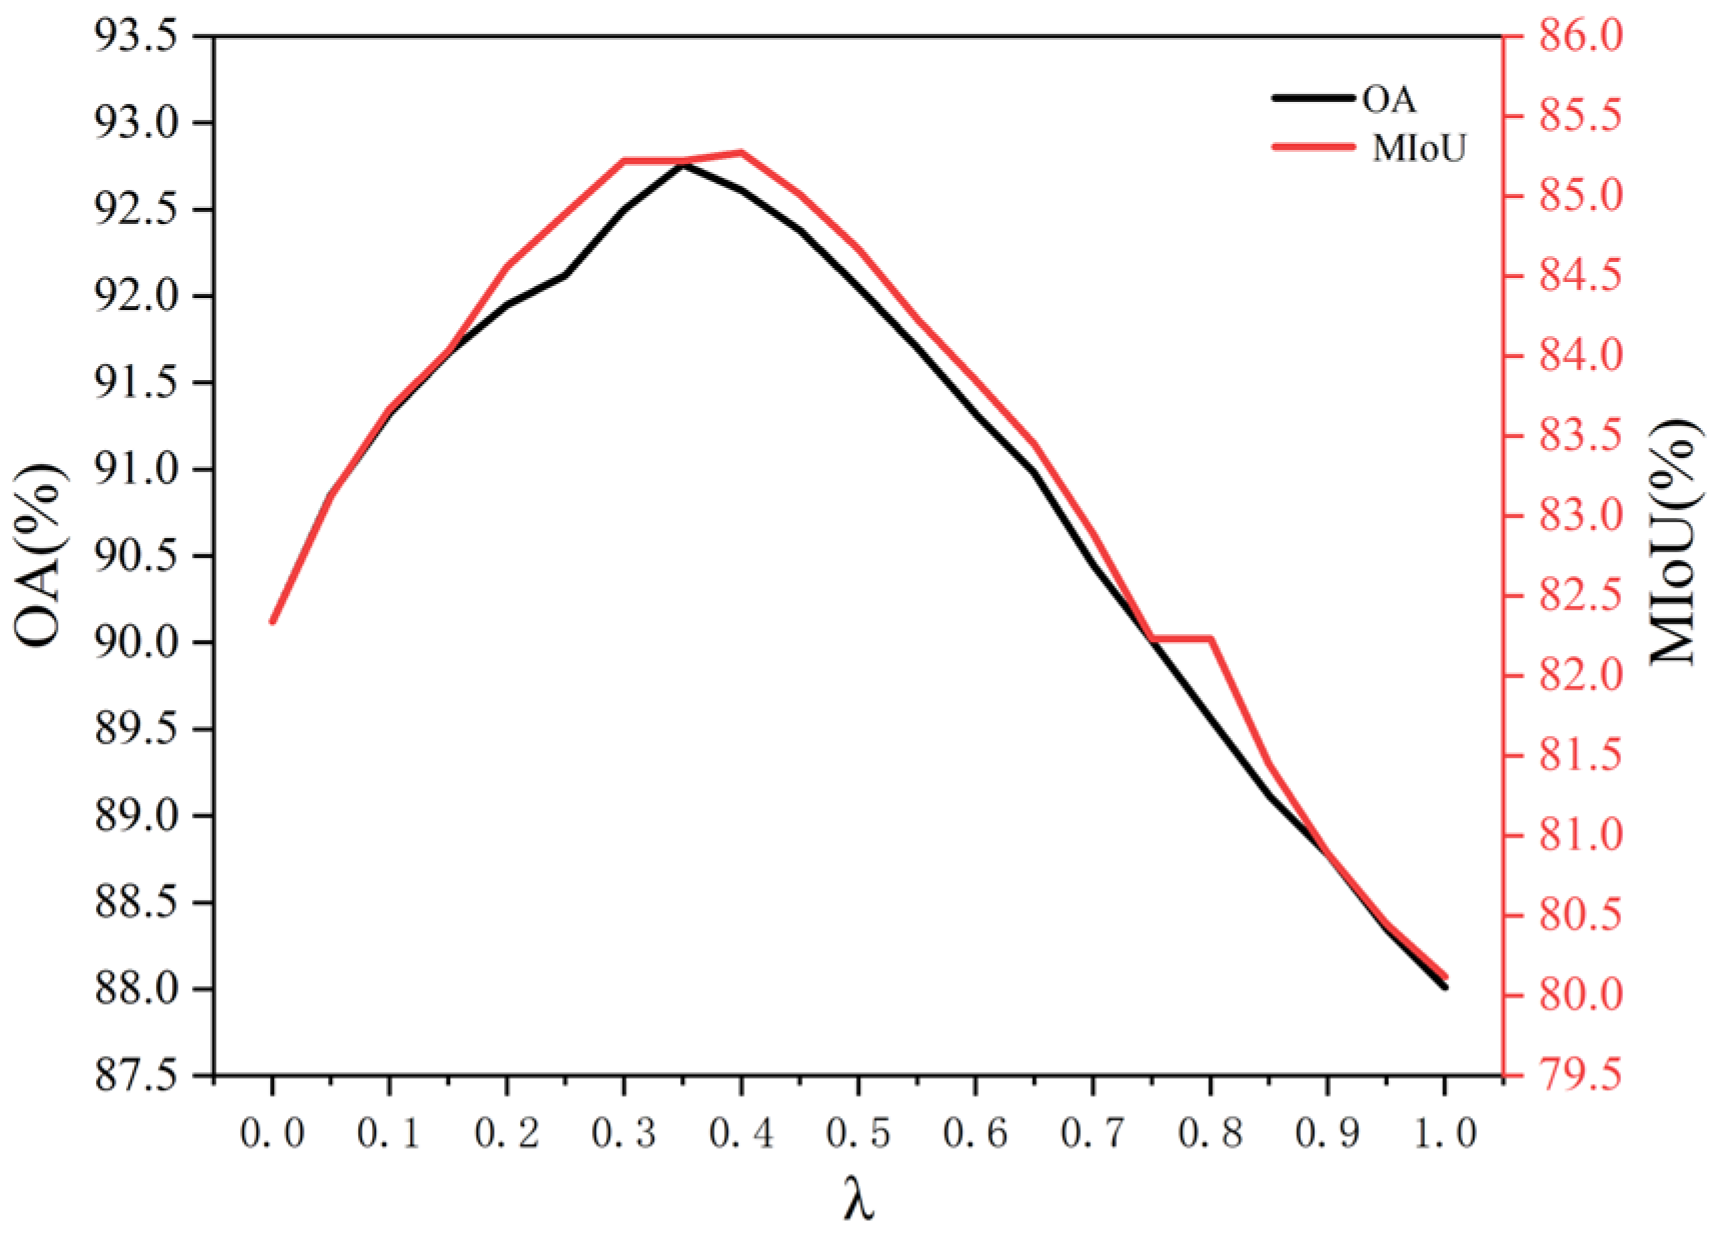
The terraces display intricate shapes and elongated structures, densely distributed throughout the terrain. The topography significantly influences the variations in terrace distribution. To mitigate the impact of a sample imbalance on training results and to enhance network performance, a loss function capable of capturing terrace details and addressing class imbalance is required. In this study, we employ a joint loss function comprising Dice Loss + Cross-Entropy Loss for the ResU-Net, U-Net++, RVTransUNet, XDeepLabV3+, and ResPSPNet models. By optimizing multiple loss functions, the improved model enhances parameters regulation and features expression, thereby increasing extraction accuracy to some extent. We conducted the experiment with a step size of 0.05 within the interval [0,1], separately evaluating the OA and MIoU of the model at various λ values. Sensitivity analyses were carried out using different datasets. For detailed information, please refer to Appendix B and Appendix C. Through multiple experimental comparisons, we determined that the λ value is 0.35, resulting in the following modified loss function:
L = λ L Dice + 1   -   λ L CE
L Dice = 1 2 × Y pred Y g t Y pred + Y g t
L CE = i = 1 M Y g t c log Y pred c
where L Dice is Dice Loss, which measures the similarity between the predicted and true segmentation. L CE is Cross Entropy Loss, which measures the cross entropy between the predicted probability distribution and the true label. λ is a weight parameter between 0 and 1 that is used to balance the relative importance of the two loss functions. Y pred is the segmentation map predicted by the model. Y g t is the true segmentation map. M is the number of categories. Y g t c is the one-hot representation of true label. Y pred c is the model’s predicted probability for the terrace category.

2.3.3. Post-Processing

We utilized the terrain data mentioned in Section 2.2.2 to calculate the slope, which was then overlaid onto SinoLC-1. The TDZRB, extracted by our model, served as a mask for evaluating individual pixels within it. If a pixel belonged to a road, building, water body or had a slope less than 2°, it was adjusted to match the background value; otherwise, its original value is retained [27]. This adjustment adhered to the guideline set forth by the Ministry of Natural Resources of China that areas with terraces below 2° should be corrected to non-terraced regions. Subsequently, we conducted manual correction based on this criterion. The terrace data corrected by SinoLC-1 and DEM were used as masks for overlaying onto GF-2 imagery. These corrections primarily focused on excluding non-terraced areas situated in river valleys and terrace regions while conducting field surveys and checks on controversial zones. The survey route is shown in Figure 2b.

2.3.4. Estimation of Terrace Area

In this study, three methodologies were utilized to estimate the terrace area: (1) pixel counting (PC), (2) sample proportion (SP), and (3) error-matrix-based model-assisted estimation (EM) [45]. The PC method directly quantifies the terrace area by tallying the number of pixels within each terrace. The SP method estimates the terrace area by randomly selecting sample points and calculating their proportional contribution using a combination of terrace distribution maps and test samples. The EM method integrates confusion matrix information to correct classification errors, thereby estimating the terrace area more accurately. A 95% confidence interval was assumed for all estimations. The formula is as follows:
A PC = N t × R 2
A SP = A PC × P t
S p EM = i W i 2 n i k n i 1 n i k n i n i 1
S A EM = A × S p EM
where N t represents the number of pixels classified as terraces, and R is the image resolution. P t represents the correct classification proportion of sample points. About 95% confidence interval is   A EM ± 1.96 × S A EM , where n i k is the sample count at cell (i, k) in the error matrix, W i is the area proportion of the map class i.

2.3.5. DL Model Training

The five models selected for end-to-end training in this study are ResU-Net, U-Net++, RVTransUNet, XDeepLabV3+, and ResPSPNet. The sample set was divided into training samples (31,040) and validation samples (7760) in an 8:2 ratio. Parameters such as input image size, batch size, learning rate, number of iterations, objective function, and gradient descent strategy have a significant impact on model performance [27]. Considering the conditions of the terraced field area, we set the size of each training sample to 256 × 256 pixels. It is crucial to choose an appropriate learning rate, as a value that is too large may lead to divergence, while a value that is too small can slow down the training process or result in a local optimal solution. In this study, a learning rate of 0.0001 was selected. The model essentially stabilized after 80 iterations (Figure 9). We chose to perform 100 iterations with a batch size of 16. Given that GF-2 images contain rich details, which may result in sparse gradients, we choose Adam as the gradient descent strategy. All models utilized the Dice Loss + Cross-Entropy Loss joint loss function as their loss function choice. Other parameters are the default parameters of the model. Table 1 provides information regarding the software environment and hardware configuration used in this study.

2.3.6. DL Model Evaluation

To quantitatively evaluate the accuracy of our proposed method, we input each image from the test set into the trained model for prediction and compared predicted results with the ground truth labels on a pixel-by-pixel basis. Subsequently, an M × M confusion matrix was employed to calculate various evaluation metrics including overall accuracy (OA), mean pixel accuracy (MPA), mean intersection over union (MIOU), precision (Precision), recall (Recall) [46], and F1-Score to assess the effectiveness of terrace extraction by these five models under investigation (refer to Table 2). The primary objective of this study is to extract terraces, hence M = 2. In the confusion matrix, true positives (TP), true negatives (TN), false positives (FP), and false negatives (FN) are included [47]. Specifically, in this study, positive and negative values correspondingly represent terraces and non-terraced areas. Furthermore, our results are also validated using multi-source data such as GF-2 images along with field verification methods.

3. Results

3.1. Comparing Extraction Results of These Five Models

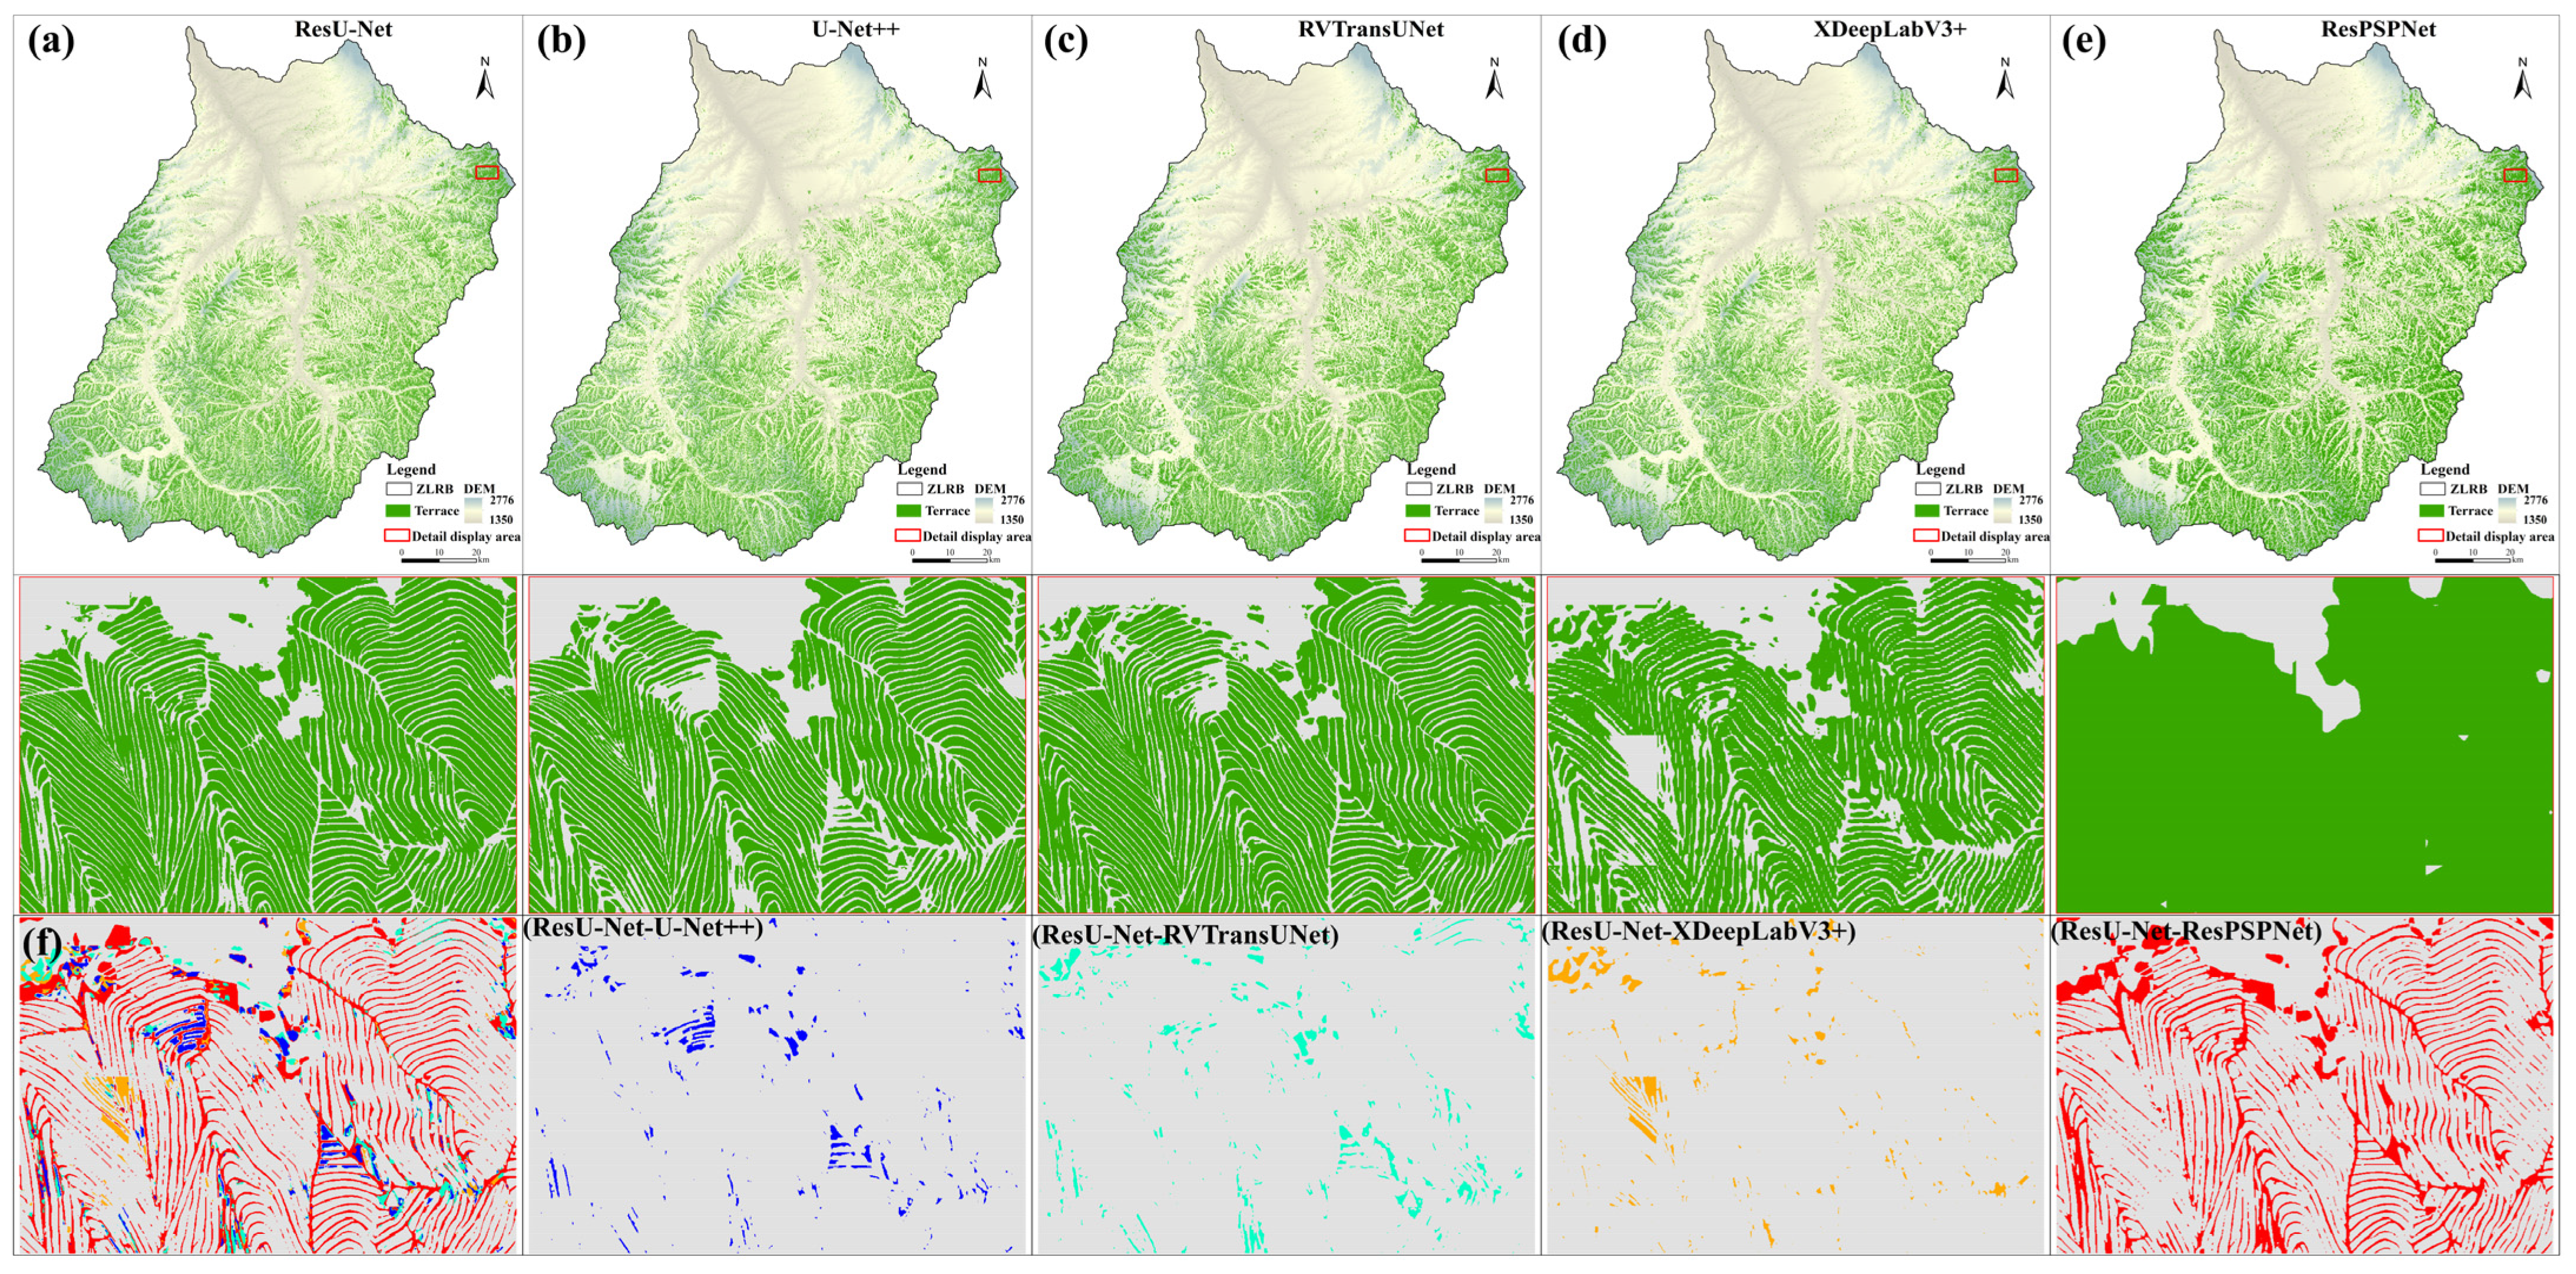
We conducted a comprehensive analysis of the extracted results at full-region scales, revealing that each model successfully identified terraced and non-terraced areas. However, significant disparities were observed in the extraction outcomes among these models. Notably, the ResU-Net model demonstrated exceptional performance not only in mountainous areas within the central and southern parts, but it also outperformed other models in detecting terraced areas in the north. The primary discrepancies among the remaining models lie specifically within the northern region where field investigations have revealed extensive cultivation of watermelons. Due to similar spectral characteristics between watermelon fields and terraced fields, numerous instances of misclassification occurred. Terraces are mainly concentrated in hilly regions with steep topography located in the southern and central parts of the ZLRB, while a few are distributed along its eastern and western sides (Figure 10). The northern part of the ZLRB exhibited fewer distributions of terrace compared to other areas. Compared to alternative models, the ResU-Net model exhibited superior performance in segmentation accuracy, detail preservation, and small terrace capture, as well as edge delineation. In contrast, the XDeepLabV3+ model demonstrated suboptimal edge segmentation and significant adhesion issues, while the ResPSPNet model tended to segment large areas into single contiguous blocks. As shown in Figure 10f, a clear local comparison of each model’s performance is evident. Specifically, when compared to the locally magnified map of the ResU-Net model, the areas segmented by the U-Net++, RVTransUNet, XDeepLabV3+, and ResPSPNet models are increased by 0.011 km2, 0.018 km2, 0.013 km2, and 0.095 km2, respectively.
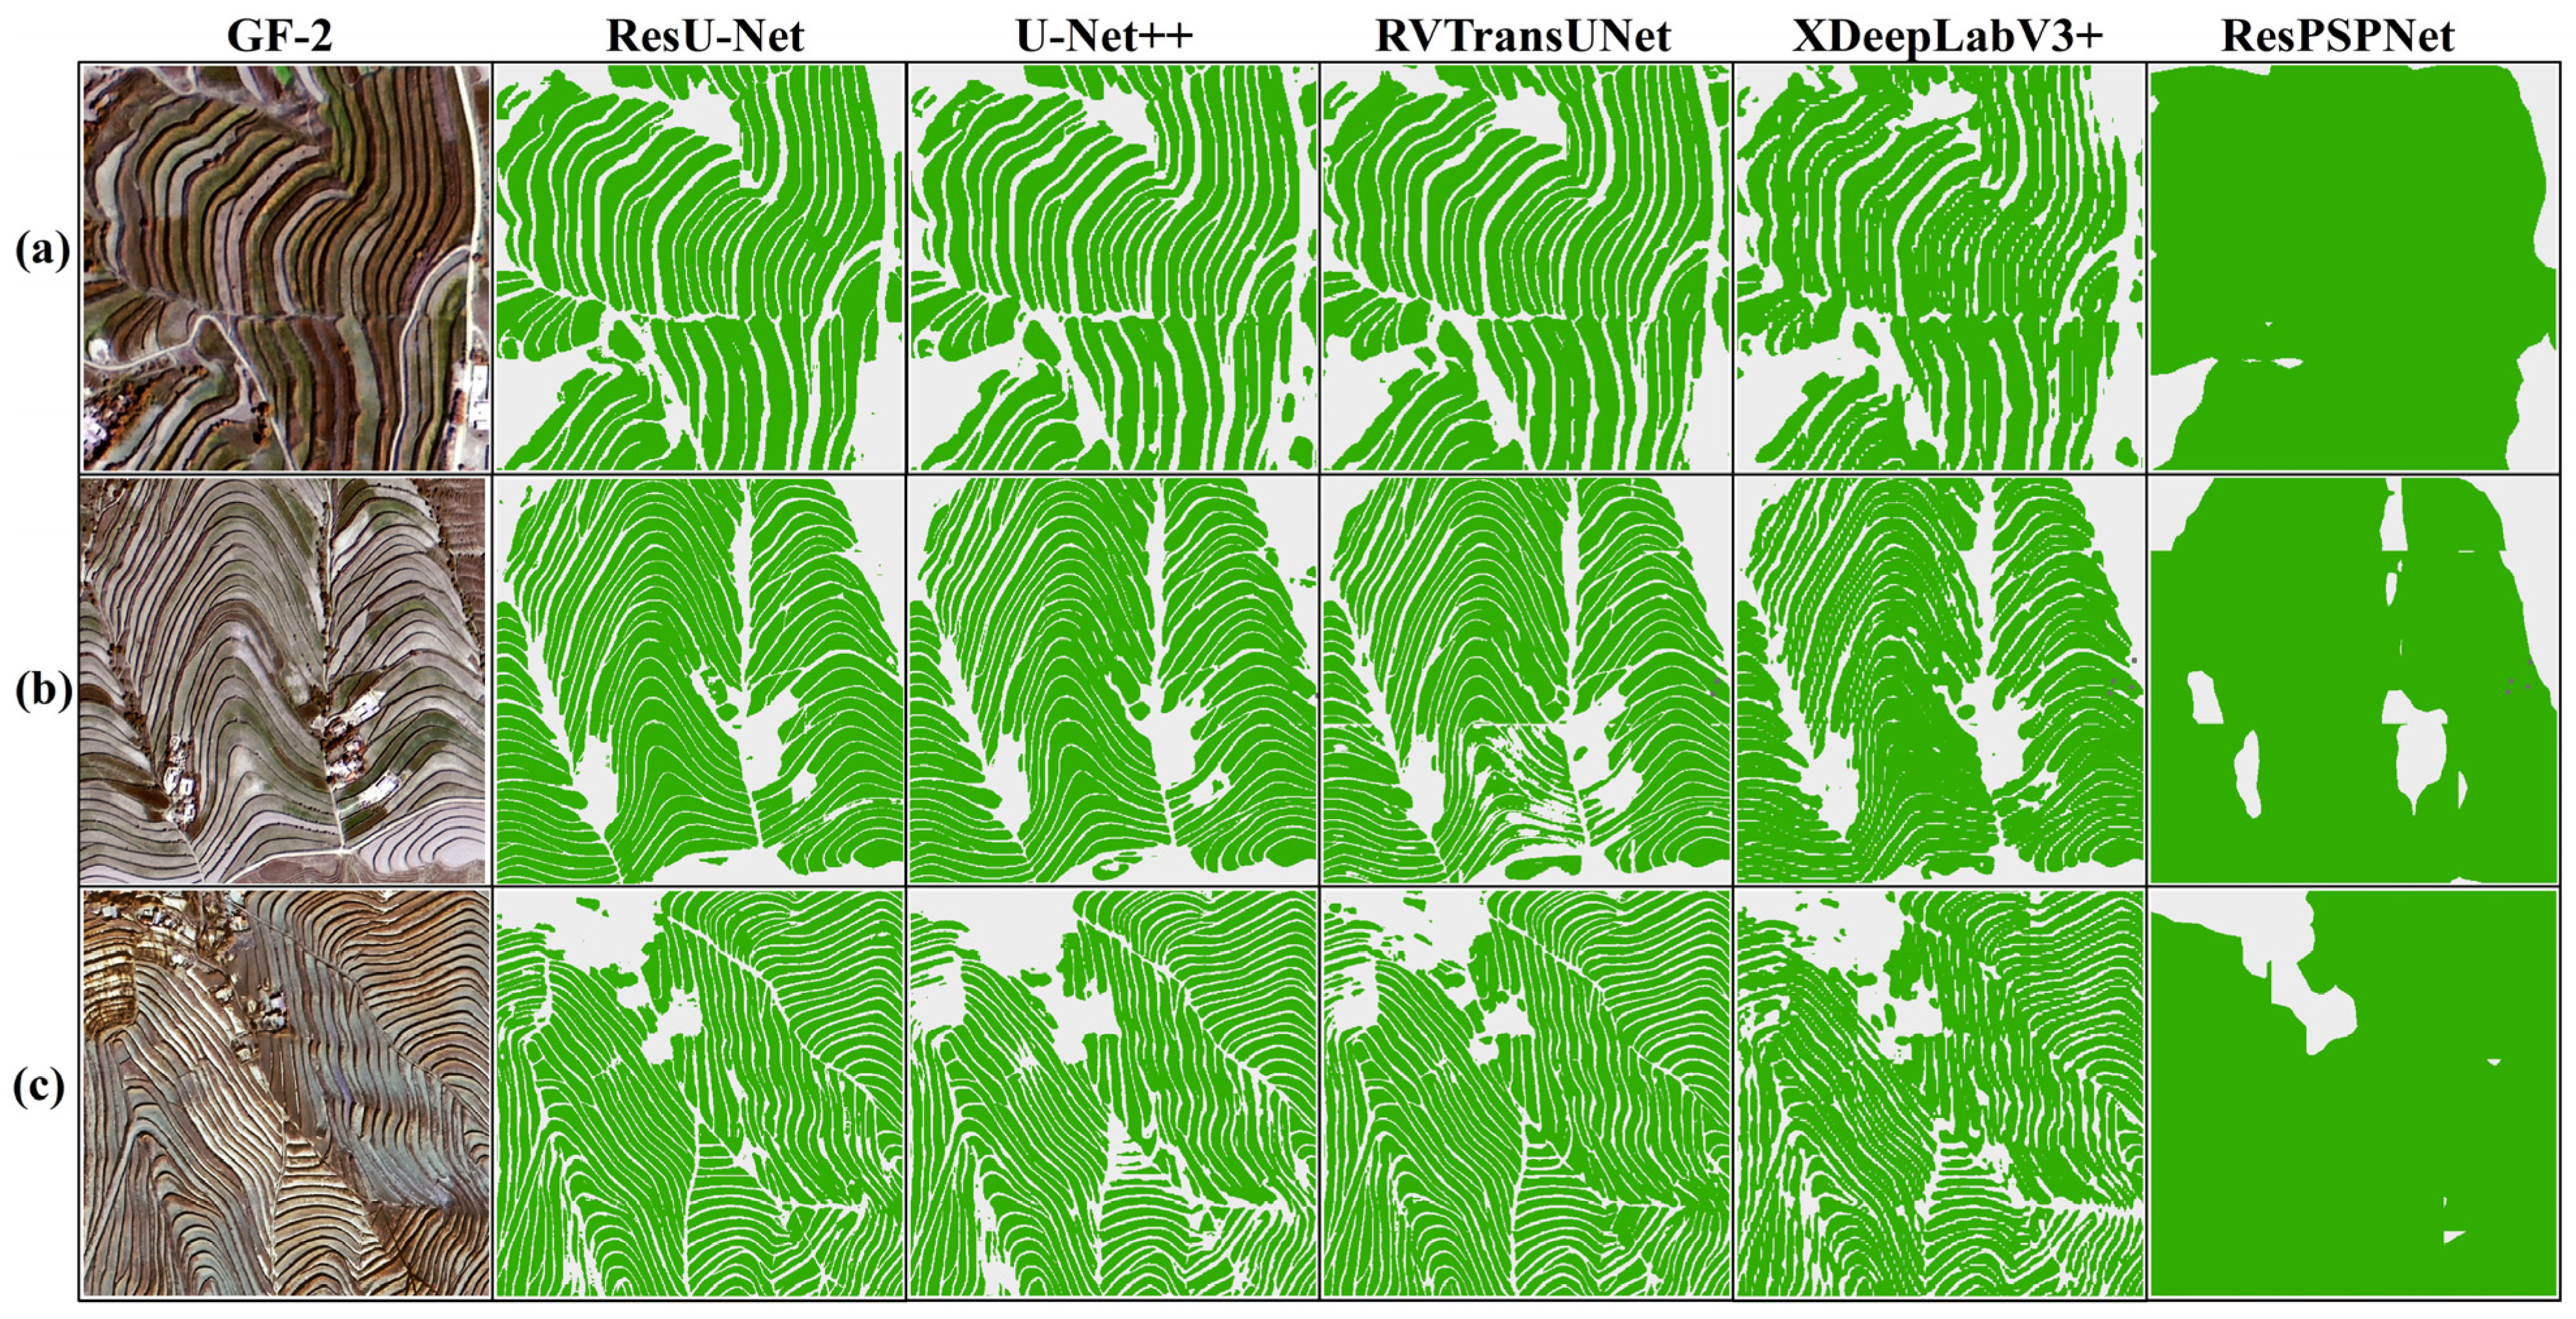
The five models demonstrated high accuracy and effective identification of terraces in most cases. However, topographic and spectral features significantly influence terrace extraction. To verify the extraction performance of the model, we selected three representative areas: terraces with vegetation coverage, terraces with vegetation and bare ground, and terraces consisting solely of bare ground (Figure 11). The results indicate that the ResU-Net model had the best excellence in the extraction of terraces. As a U-Net encoder, ResNet50 extracts multi-scale features through the initial convolutional layer and residual blocks of varying depths. Low-level features capture the edges, textures, and geometries of the terraces, thereby enhancing local information. Mid-level features extract the regional structures and local contours of the terraces, integrating the spatial distribution patterns. High-level features capture global semantic information, thereby enhancing the model’s ability to distinguish terraced fields from the background. By combining Dice loss with Cross-Entropy loss to optimize edge segmentation and leveraging the high-resolution capabilities of GF-2 images, the model achieved precise segmentation of the complex edge morphology and texture of terraces, significantly improving the accuracy and robustness of the segmentation. Conversely, the U-Net++ model exhibited incorrect extraction results in regions with similar spectral characteristics, especially in steep slope areas. The RVTransUNet model displays reduced sensitivity toward spectral features and yielded inaccurate extractions in areas with more complex terrain. The XDeepLabV3+ model failed to segment the boundaries precisely and tended to produce strong adhesion effects, especially when dealing with densely distributed regions featuring narrow spacing between individual terrace patches. The ResPSPNet model demonstrated the least satisfactory performance in the terrace extraction task, mainly attributed to its over-reliance on global information, insufficient local feature extraction, and inadequate edge detail preservation. The pyramid pooling module further compounded this issue by leading to a loss of fine details, which adversely affected segmentation accuracy. As a result, the model tended to produce smoother region segmentations that cover broader areas. Due to the complex spectral characteristics of terraces with vegetation coverage and terraces with vegetation and bare ground, the five models will make errors or omissions when extracting terraces in these two areas. In contrast, bare ground possesses distinct spectral features along clear boundaries without any obstructing vegetation or trees, thus all five models performed optimally when extracting bare ground-based terrace formations.

3.2. Model Accuracy Assessment

To further assess the differences between models, three methods were employed to evaluate the effectiveness of the five models in extracting terraces: (1) cross-checking the accuracy of each step within each model, (2) verifying terrace extraction accuracy pixel by pixel using the model, and (3) conducting field validation.
Evaluating the accuracy of surface features classification products is crucial in testing the efficacy of model extraction [48]. While there is no standard method for evaluating surface feature classification accuracy, confusion matrices are widely considered as the best indicator for this purpose [49]. For verification purposes, we utilized 7760 images and labels collected from Section 2.3.1. In this study, a 2 × 2 confusion matrix was used as a test method, which included calculating OA, MPA, MIoU, Precision, Recall and F1-Score to quantitatively evaluate the terrace extraction efficacy of the five models in this study.
The evaluation results of the terrace extraction accuracy for the five models using six indicators on the validation data are presented in Table 3. These results have undergone a rigorous statistical analysis, employing one-way ANOVA and Duncan’s multiple range test, to determine significant differences in the models’ performances. The analysis reveals that the ResU-Net model achieved the highest values across all six indicators and demonstrated a statistically significant superiority over the other models (p ≤ 0.05). With the exception of MIoU, all other indicators surpassed 90%. Following closely is RVTransUNet, while the ResPSPNet model exhibited comparatively lower performance evaluation indicator values. The difference in OA, MPA, MIoU, Precision, Recall and F1-Score between ResU-Net and ResPSPNet were 10.61%, 10.84%, 17.04%, 11.20%, 11.18%, and 8.93%, respectively. Notably, all five models exhibited an OA higher than 80%, indicating the five models’ value in terrace extraction within the Loess Hilly Region.

3.3. Verification and Correction of Terrace Data

In the post-processing stage of the spatial distribution data of ZLRB terraces, we initially conducted a pixel-by-pixel screening of terrace areas using slope and land cover data. Subsequently, field verification and manual correction were carried out. Our verification route covered Yuzhong County, Anding District, Huining County, Xiji County, Haiyuan County, Pingchuan District, and Jingyuan County—regions with extensive terrace distribution, spanning a total distance of 1250 km Figure 2b. Along this route, we surveyed and sampled controversial and typical areas to encompass all terraces in ZLRB.
Based on the verification results, we manually corrected the spatial distribution map of terraces in ZLRB. We observed that the value of OA, F1-Score, and MIoU in ZLRB terrace maps extracted using the ResU-Net model were 92.76%, 90.50%, and 85.41%, respectively. However, after incorporating terrain data along with land cover data correction (Figure 2c) and manual correction process, OA values increased by 1.98%, 0.83%, and 1.10%, respectively, resulting in a final OA value of 96.67%. Similarly, the F1-Score increased by 1.73%, 0.75%, and 0.96%, respectively, resulting in a final F1-Score value of 93.94%. Moreover, MIoU increased by 2.03%, 0.81%, and 1.12%, respectively, and the final MIoU was 89.37%. After analyzing these findings, we determined that terrain data have significantly impacted terrace mapping, followed by manual correction and land cover data correction.

3.4. Estimation of Terraced Areas in the ZLRB

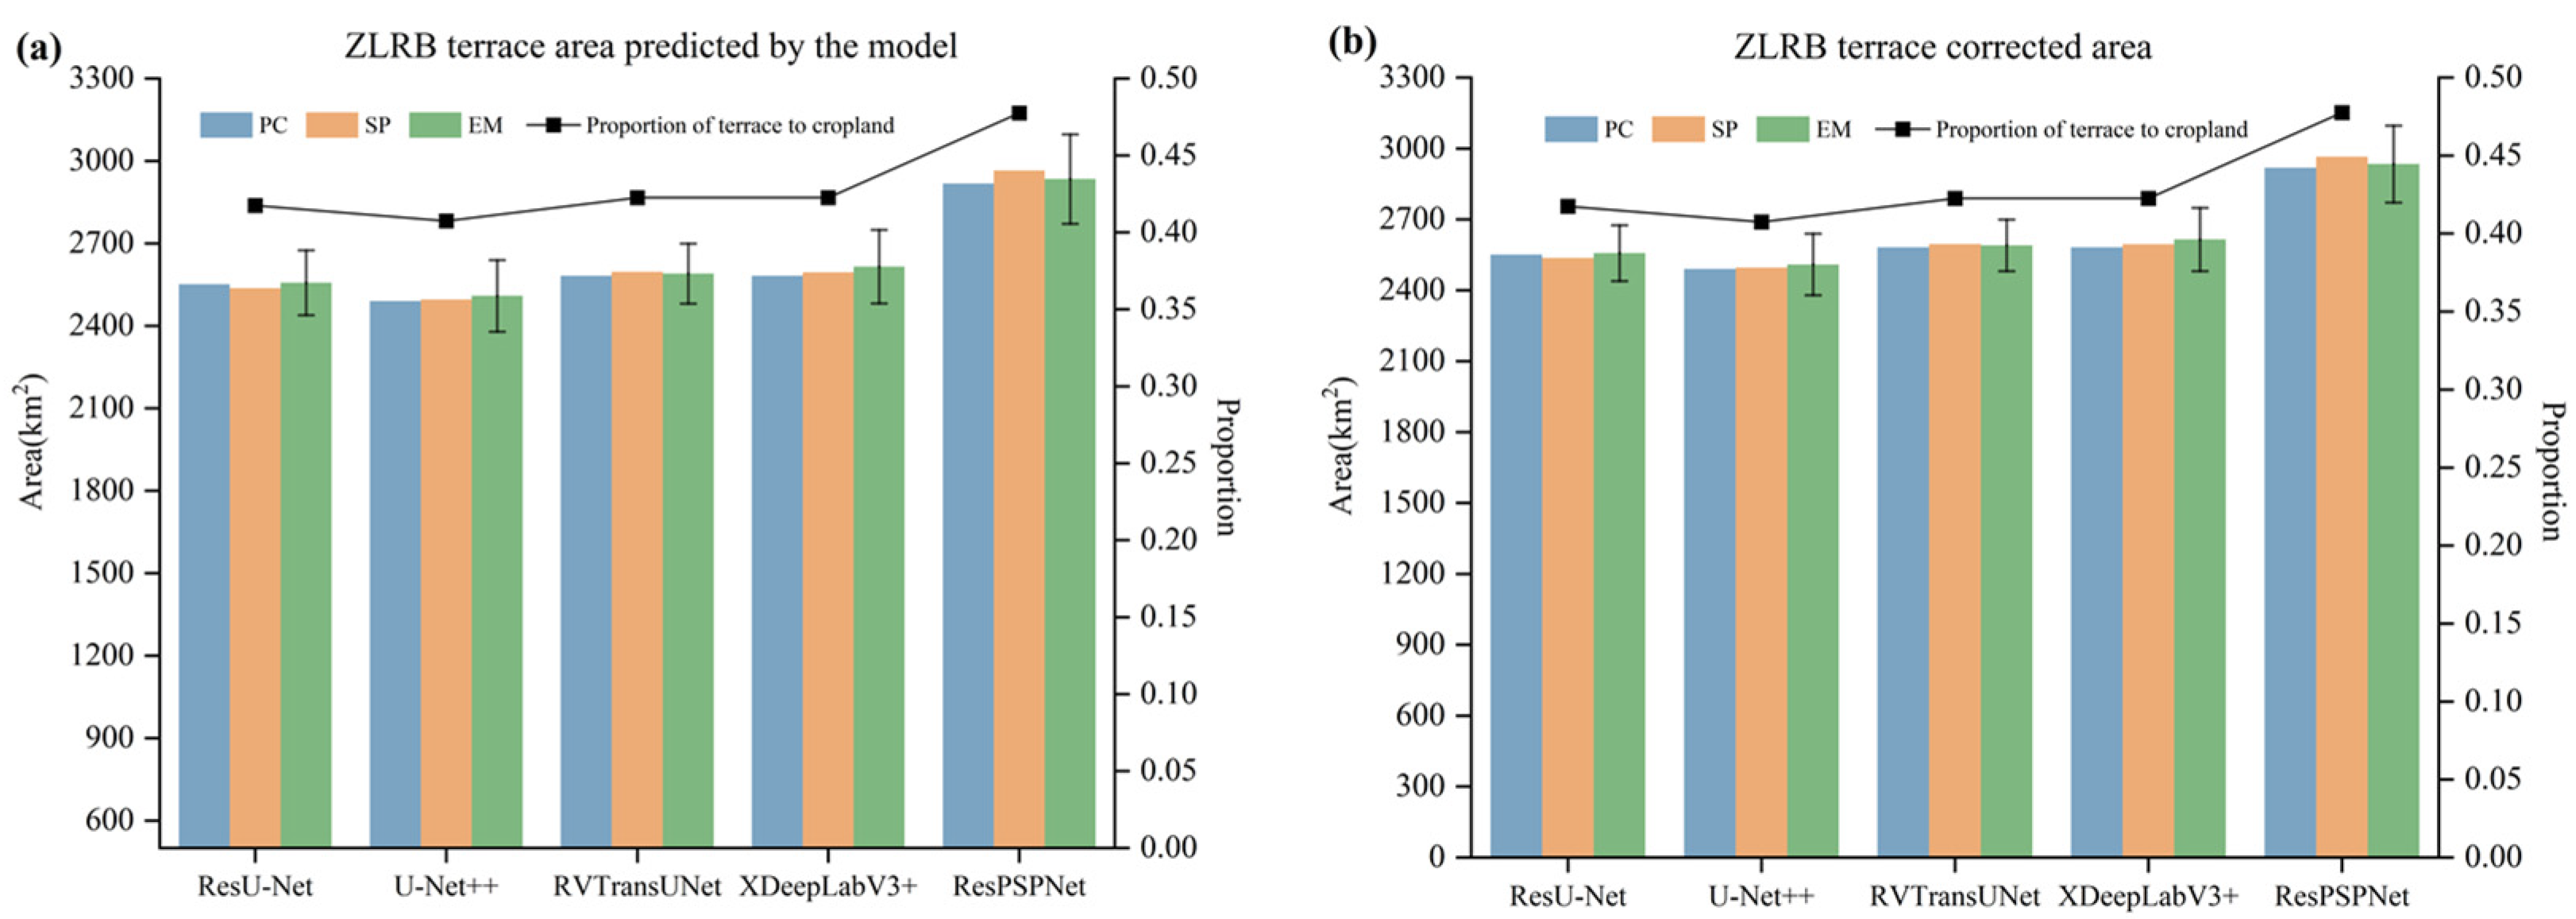
We employed three methodologies proposed by Yu et al. [50] to estimate the area of ZLRB terraces: (1) pixel counting (PC), (2) sample proportion (SP), and (3) error-matrix-based model-assisted estimation (EM) [45,51] (which encompasses detailed calculation steps). We assumed a 95% confidence interval. The results from the five models in these three methods were utilized for estimating the area, as shown in Figure 12a.
As an indicator characterizing overall terraces distribution, area serves as an effective reference for comparing model prediction results. Comparing these five models, we observed relatively consistent estimations of terrace areas using all three methods, which can be considered reliable measures of extraction accuracy. Following accuracy evaluation and field investigation, it was determined that ResU-Net exhibited superior performance. The estimated terrace area using the PC method was 2551 km2, accounting for 23.96% of the ZLRB area and 41.74% of its cultivated land area (about 6111.51 km2). The EM method yielded an estimated terrace area of 2557 ± 117.96 km2, accounting for 24.02% ± 1.11% of the ZLRB area and 41.84% ± 1.93% of its cultivated land area, respectively. Among the five evaluated models, namely ResU-Net, U-Net++, RVTransUNet, and XDeepLabV3+, minor differences were observed in their respective areas due to their high precision in accurately extracting terrace patches. In contrast, ResPSPNet exhibited a larger area, as it encompassed the entire region without precise boundary segmentation, resulting in significant erroneous extractions.
Finally, the corrected results’ area was evaluated using PC, SP, and EM methods. It was observed that the ResU-Net model demonstrated the smallest area difference before and after correction with and an area difference less than 7 km2. This observation further validates that the ResU-Net model yields superior extraction results with high reliability. The extracted data can provide reliable support for subsequent government decision-making as well as studies on terrace ecosystem services.

4. Discussion

4.1. Comparison with Other Terrace Extraction Results

After conducting a comprehensive search for terrace data products in ZLRB, we have identified that currently only two options are available: the China Terraces Map (CTM) [45] and the Terraces Distribution Map of the Loess Plateau (TDMLP) [27]. Consequently, we proceeded to compare these three products by evaluating them through two approaches and analyzing potential sources of uncertainty. Firstly, we compared them based on their data resolution, extraction methods, training datasets, and accuracy. Secondly, we examined the homogeneity and discrepancies among these three terrace data products in ZLRB (Figure 13). Finally, an analysis was conducted to identify any sources of uncertainty while highlighting our advantages with regard to CTM and TDMLP.
The first approach involves comparing the outcomes of spatial point verification. Our data have a spatial resolution of 1 m, TDMLP’s spatial resolution is 1.89 m, and CTM’s is 30 m. Significantly superior to CTM and TDMLP, our data products exhibit remarkable quality. Secondly, both we and TDMLP employ DL techniques for extraction, whereas CTM utilizes random forest methods. We adopt the shuffle method to select the five most frequently occurring areas as label annotation regions while dividing each terrace patch individually. In contrast, TDMLP and CTM label the entire area collectively. In terms of accuracy evaluation, we compare the accuracy of the three models with that of the user and producer. Verification results demonstrate that our user accuracy, producer accuracy, and IoU surpass those of CTM by 13.85%, 20.36%, and 23.25%, respectively. These findings indicate that our refined extraction methodology for terrace patches attests to greater reliability compared to CTM and TDMLP within ZLRB.
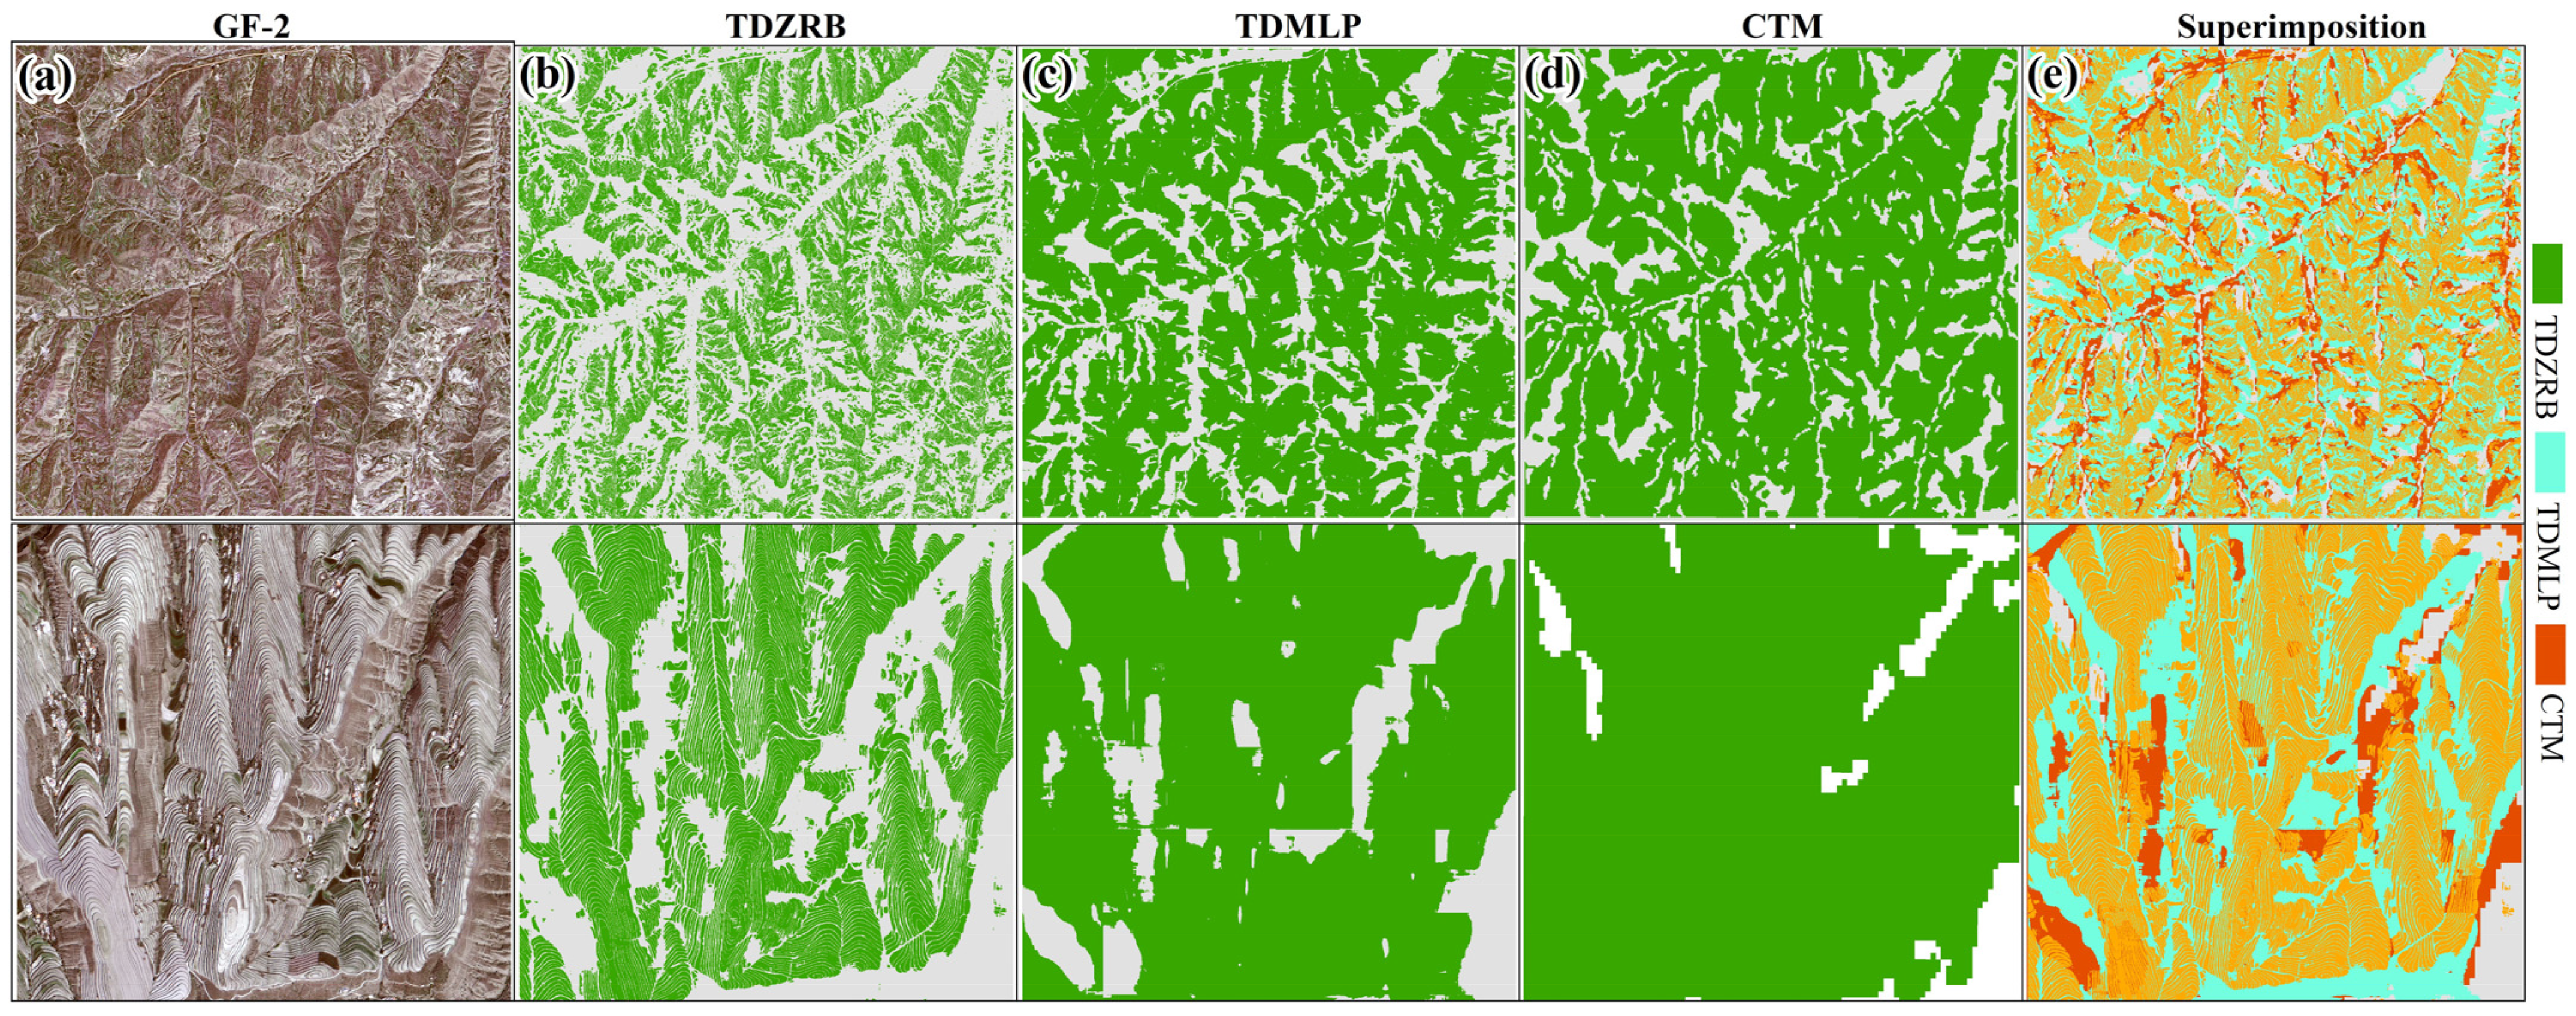
The second approach involves comparing the extraction effects of these three products within ZLRB. In general, the spatial distribution patterns were similar across all three datasets, with notable differences primarily observed in areas located northward along ZLRB. In hilly areas within ZLRB, there were relatively minor disparities in spatial distribution between these three datasets. However, local variations in spatial distribution exhibited substantial discrepancies (Figure 13). In the first row of Figure 13, a comparison is made of the areas encompassed by the three datasets: 4.82 km2 for our dataset, 8.26 km2 for TDMLP, and 8.72 km2 for CTM. Given that TDMLP and CTM are segmented into complete blocks, their respective areas exhibit a degree of similarity. The difference between our terrace patch data and CTM is 3.90 km2, which is clearly illustrated in Figure 13e. The main focus was on extracting terrace patches accurately, while both CTM and TDMLP classified large areas encompassing terraces. As a result, our findings are characterized by enhanced accuracy and refinement compared to alternative approaches.
In terms of misclassification, the primary sources of errors in CTM and TDMLP are mask data, mixed pixels, and classification methods. Firstly, CTM and TDMLP utilize GlobeLand30 farmland data as masks, which exhibit low accuracy in mountainous areas. Additionally, GlobeLand30′s cultivated land data are from 2007 to 2010, while CTM is based on 2018 images. To address this discrepancy, we incorporated SinoLC-1 data for terrace range correction due to the fact that SinoLC-1 is a 1 m land cover map of China from 2021 that aligns well with our timeframe. Moreover, the relatively coarse resolution (30 m) of CTM, leads to an increased uncertainty in terrace extraction due to mixed pixels. The ZLRB terraces are relatively small with most being smaller than 30 m wide. To mitigate this issue, we employed GF-2 images with a higher resolution (1 m), significantly reducing the problem of mixed pixels. Lastly, although CTM utilizes the random forest method for classification purposes, it rarely considers field information beyond the target pixel. On the other hand, TDMLP employs the U-Net++ method, but its performance was found to be inadequate for ZLRB terrace during comparison tests. Consequently, we selected five models and made corresponding adjustments tailored specifically to our problem domain before selecting the best model for extracting terraces.
In summary, our study provides more detailed spatial distribution data on terraces within ZLRB while accurately classifying patch terrace. This will offer robust support for future research focusing on soil and water conservation, increasing food production, vegetation carbon sequestration, and watershed management.

4.2. Error Source Analysis of Terrace Extraction Results

Although the terrace extraction achieved favorable outcomes using high-resolution satellites in this study, there are still numerous uncertainties that exist. These issues may arise from various factors, including limitations of model training data, intricacies of terrain characteristics, and disparities in RS image spectra.
The environment of ZLRB is complex and changeable, which poses a great challenge to our models. The models have a certain degree of error in the process of extracting terraces, mainly in the terraced area and river valley area in the north of ZLRB. The main reasons for the model errors are: (1) the terrain in the river valley and terraced area is complex and changeable, causing the model to inadequately learn their characteristics. (2) Insufficient data quality with limited samples from the river valley area during training. (3) Inadequate generalization ability of the model requiring improvement in training strategies.
The ZLRB encompasses diverse terrains, including terraced areas in northern regions of the basin, hilly regions in the southern, eastern, and western parts, and river valleys such as Guanchuan River, Zuli River, and Dingxixi River within the central area of the basin. These variations in terrain significantly influence terrace structure and distribution patterns, thereby imposing higher demands on the performance of our model in terrace extraction.
Spectral heterogeneity is also an important reason for the mis-extraction of terraces. The landscape within ZLRB exhibits remarkable diversity with different seasons having different spectral characteristics. In particular, in terraces characterized by high vegetation coverage, various types of vegetation exhibit distinct spectral characteristics. It becomes challenging to encompass all these characteristics while selecting samples. Errors arising from spectral heterogeneity are primarily observed in the terraced area located in northern section of the basin where watermelon cultivation predominates alongside stone-covered cultivated land that shares similar spectral attributes with bare ground during the winter months, thus leading to mis-extractions by the model. In addition, due to their varied shapes and patches of varying sizes, terrace extraction becomes even more intricate.

4.3. Limitations and Future Research Directions

Although the proposed terrace extraction model has achieved satisfactory results, our method still has certain limitations. Firstly, the complexity of representing terrace features poses challenges to terrace extraction. Field survey findings indicate that various types of terraces are distributed in ZLRB, each with distinct spectral, shape, and topographic characteristics. Moreover, over 40% of terraces in ZLRB are utilized for cultivation purposes, resulting in diverse changes throughout the year. Additionally, distinguishing between terrace and non-terrace areas can be particularly challenging in river valleys and regions with extensive terracing due to their similar characteristics. The heterogeneity among different types of terraces as well as similarities between terrace and non-terrace areas further exacerbate this difficulty. Previous studies on land object classification have demonstrated that incorporating texture features can enhance model accuracy [52,53,54]. Furthermore, the efficacy of the model in extracting terraces is constrained by the limited number of training samples. To address this limitation, future research in more complex terraced extraction scenarios, it is crucial to maximize the sample size to comprehensively encompass all types, shapes, spectra, and topographic characteristics of the terraced fields. This strategy will help alleviate issues related to misclassification and enhance the generalization capability of the model, which can be compromised by an insufficient sample size. For regions with high vegetation coverage, employing techniques such as data diversity expansion, multi-scale feature extraction, incorporation of vegetation indices (e.g., NDVI and EVI), model integration, and post-processing refinement can significantly improve the segmentation accuracy of models for vegetated terraces while mitigating errors in extraction.
Additionally, the masking effect is constrained by terrain and land cover data limitations. The low-resolution of DEM data and lack of high-resolution options restricts the effectiveness of terrace data correction. Furthermore, errors in land cover data propagate to our terrace data correction procedure, resulting in masking errors caused by missing or incorrect cultivated land. Therefore, rectifying controversial areas may require utilizing high-resolution RS images or conducting field surveys.

5. Conclusions

In this study, we propose a refined terrace extraction algorithm that integrates high-resolution multi-source RS data to construct a locally optimal terrace mapping model. Given the complex terrain and diverse terrace types in the ZLRB region, we applied this algorithm to assess its effectiveness. The results demonstrate that the proposed method achieved high overall accuracy, with OA, MPA, Precision, Recall, F1-Score, and MIoU of 92.76%, 93.10%, 91.51%, 93.80%, 90.50%, and 85.41%, respectively, while also displaying good edge segmentation accuracy. These findings indicate that the semantic segmentation method based on DL is feasible for terrace mapping at a resolution of 1 m in the Loess Hilly Region. Furthermore, the proposed methodology exhibits adaptability to regions characterized by varied topographies and agricultural practices, thereby broadening its applicability beyond the ZLRB. The proposed approach utilizes five state-of-the-art DL models: U-Net, U-Net++, TransUNet, DeepLabV3+, and PSPNet, as initial models. By adapting the model structure and loss function, patch terraces are extracted from GF-2 images while optimizing local information through a combination of morphology, texture, and spectral features. This methodology effectively addresses challenges related to poor adhesion and edge segmentation to achieve high-quality terrace mapping. Based on the model extraction results, we employed pixel masking techniques along with manual correction and field surveys for calibration resulting in an OA of 96.67% for TDZRB. Additionally, using the EM method, we estimate that the terrace area in ZLRB is approximately 2557 ± 117.96 km2, which accounts for 41.84% ± 1.93% of its cultivated land area. By comparing the spatial distribution data of terraces obtained from TDMLP and CTM, we provide a more precise, comprehensive, and higher-resolution depiction of terrace spatial distribution. This initiative will establish a robust data foundation for future ZLRB land degradation monitoring and protection policy formulation, crop planting planning and irrigation management, soil erosion prevention and control measures, ecosystem service assessment research, and the preservation initiatives for terrace culture.

Author Contributions

Conceptualization, G.K.; methodology, G.K. and J.G.; validation, G.K. and B.W.; formal analysis, X.L. and J.S.; writing—original draft preparation, G.K. and J.G.; writing—review and editing, J.G., Y.M., W.W. and J.Z. All authors have read and agreed to the published version of the manuscript.

Funding

This research was funded by the National Natural Science Foundation of China, grant number U21A201345.

Data Availability Statement

The TDZRB with a resolution of 1m can be downloaded from the (https://zenodo.org/records/14533670 (accessed on 20 December 2024)). The GF-2 remote sensing images used in this study will be applied to relevant departments. The land cover data can be downloaded and used at (https://doi.org/10.5281/zenodo.7707461 (accessed on 20 December 2024)) [30], and the DEM data can be downloaded and used at (http://www.bigemap.com/ (accessed on 10 December 2024)).

Acknowledgments

We would like to extend our sincere gratitude to the State Key Laboratory of Urban and Regional Ecology, Research Center for Eco-Environmental Sciences, Chinese Academy of Sciences, as well as the Gansu Academy of Eco-Environmental Sciences, for their invaluable data and technical support.

Conflicts of Interest

The authors declare that they have no conflict of interest.

Appendix A

Table A1. Comparative analysis of the advantages and disadvantages of ResU-Net, U-Net++, RVTransUNet, XDeepLabV3+, and ResPSPNet models.
ModelAdvantagesDisadvantages
ResU-NetIncorporates residual connections, enhancing feature extraction capabilities and enabling precise processing of terrace edges and details.
Utilizes pre-trained weights to accelerate convergence and improve generalization.
Excels at handling small objects and complex terrains, delivering the highest accuracy in terrace extraction.
Requires relatively higher computational resources due to its complex network structure.
U-Net++Introduces dense skip connections and deep supervision, which improve multi-scale feature extraction and boundary detection.
Strong capability in capturing intricate image details.
Slightly less effective in extracting small objects compared to ResU-Net.
Higher training complexity.
RVTransUNetCombines CNN and Transformer modules, effectively capturing both local features and global dependencies.
Demonstrates strong generalization and adaptability to diverse datasets.
Higher computational demands and less effective at preserving small object details and boundaries compared to ResU-Net.
XDeepLabV3+Adopts deep separable convolution for efficient feature learning and multi-scale processing.
Performs well in capturing spatial information in high-resolution images.
Lower boundary localization accuracy and reduced effectiveness in extracting small objects compared to ResU-Net.
ResPSPNetIntegrates multi-scale feature information through pyramid pooling and employs a lightweight structure for improved processing efficiency.
Mitigates gradient vanishing issues for better feature learning.
Prone to losing details of small objects and more susceptible to misclassification in complex backgrounds.

Appendix B

Figure A1. Comparison of OA and MIoU corresponding to different λ values. By comparing the OA and MIoU output of the model, the optimal λ value is obtained.
Remotesensing 17 00012 g0a1

Appendix C

Table A2. Sensitivity analysis of different datasets to λ value.
DatasetOptimal λ ValueOAMIoU
This research dataset0.3592.76%85.41%
Denotes the vegetation area0.3091.23%83.72%
Bare ground0.4090.89%84.12%

References

  1. Petanidou, T.; Kizos, T.; Soulakellis, N. Socioeconomic dimensions of changes in the agricultural landscape of the Mediterranean basin: A case study of the abandonment of cultivation terraces on Nisyros Island, Greece. Environ. Manag. 2008, 41, 250–266. [Google Scholar] [CrossRef]
  2. Ren, W.; Yang, A.; Wang, Y. Spatial Patterns, Drivers, and Sustainable Utilization of Terrace Abandonment in Mountainous Areas of Southwest China. Land 2024, 13, 283. [Google Scholar] [CrossRef]
  3. Deng, C.; Zhang, G.; Liu, Y.; Nie, X.; Li, Z.; Liu, J.; Zhu, D. Advantages and disadvantages of terracing: A comprehensive review. Int. Soil Water Conserv. Res. 2021, 9, 344–359. [Google Scholar] [CrossRef]
  4. Wei, W.; Chen, D.; Wang, L.; Daryanto, S.; Chen, L.; Yu, Y.; Lu, Y.; Feng, T. Global synthesis of the classifications, distributions, benefits and issues of terracing. Earth-Sci. Rev. 2016, 159, 388–403. [Google Scholar] [CrossRef]
  5. Feng, J.; Wei, W.; Pan, D. Effects of rainfall and terracing-vegetation combinations on water erosion in a loess hilly area, China. J. Environ. Manag. 2020, 261, 110247. [Google Scholar] [CrossRef] [PubMed]
  6. Wolka, K.; Mulder, J.; Biazin, B. Effects of soil and water conservation techniques on crop yield, runoff and soil loss in Sub-Saharan Africa: A review. Agric. Water Manag. 2018, 207, 67–79. [Google Scholar] [CrossRef]
  7. Chen, D.; Wei, W.; Daryanto, S.; Tarolli, P. Does terracing enhance soil organic carbon sequestration? A national-scale data analysis in China. Sci. Total Environ. 2020, 721, 137751. [Google Scholar] [CrossRef] [PubMed]
  8. Tarolli, P.; Pijl, A.; Cucchiaro, S.; Wei, W. Slope instabilities in steep cultivation systems: Process classification and opportunities from remote sensing. Land Degrad. Dev. 2021, 32, 1368–1388. [Google Scholar] [CrossRef]
  9. Ministry of Water Resources of the People’s Republic of China. National Soil Erosion Dynamic Monitoring Results for 2020. Available online: http://www.mwr.gov.cn/xw/slyw/202106/t20210608_1521925.html (accessed on 9 December 2024).
  10. Xu, G.; Zhang, T.; Li, Z.; Li, P.; Cheng, Y.; Cheng, S. Temporal and spatial characteristics of soil water content in diverse soil layers on land terraces of the Loess Plateau, China. Catena 2017, 158, 20–29. [Google Scholar] [CrossRef]
  11. Li, Z.; Chen, B.; Wu, S.; Su, M.; Chen, J.M.; Xu, B. Deep learning for urban land use category classification: A review and experimental assessment. Remote Sens. Environ. 2024, 311, 114290. [Google Scholar] [CrossRef]
  12. Mohiuddin, G.; Mund, J.P. Spatiotemporal analysis of land surface temperature in response to land use and land cover changes: A remote sensing approach. Remote Sens. 2024, 16, 1286. [Google Scholar] [CrossRef]
  13. Martínez-Casasnovas, J.A.; Ramos, M.C.; Cots-Folch, R. Influence of the EU CAP on Terrain Morphology and Vineyard Cultivation in the Priorat Region of NE Spain. Land Use Policy 2010, 27, 11–21. [Google Scholar] [CrossRef]
  14. Agnoletti, M.; Cargnello, G.; Gardin, L.; Santoro, A.; Bazzoffi, P.; Sansone, L.; Pezza, L.; Belfiore, N. Traditional landscape and rural development: Comparative study in three terraced areas in northern, central and southern Italy to evaluate the efficacy of GAEC standard 4.4 of cross compliance. Ital. J. Agron. 2011, 6, e16. [Google Scholar] [CrossRef]
  15. Zhao, B.; Ma, N.; Yang, J.; Li, Z.; Wang, Q. Extracting features of soil and water conservation measures from remote sensing images of different resolution levels: Accuracy analysis. Bull. Soil Water Conserv. 2012, 32, 154–157. [Google Scholar]
  16. Li, Y.; Gong, J.; Wang, D.; An, L.; Li, R. Sloping farmland identification using hierarchical classification in the Xi-He region of China. Int. J. Remote Sens. 2013, 34, 545–562. [Google Scholar] [CrossRef]
  17. Luo, L.; Li, F.; Dai, Z.; Yang, X.; Liu, W.; Fang, X. Terrace Extraction Based on Remote Sensing Images and Digital Elevation Model in the Loess Plateau, China. Earth Sci. Inform. 2020, 13, 433–446. [Google Scholar] [CrossRef]
  18. Zhang, Y.; Shi, M.; Zhao, X.; Wang, X.; Luo, Z.; Zhao, Y. Methods for automatic identification and extraction of terraces from high spatial resolution satellite data (China-GF-1). Int. Soil Water Conserv. Res. 2017, 5, 17–25. [Google Scholar] [CrossRef]
  19. Zhang, X.; Liu, L.; Chen, X.; Gao, Y.; Xie, S.; Mi, J. GLC_FCS30: Global land-cover product with fine classification system at 30 m using time-series Landsat imagery, Earth Syst. Sci. Data 2021, 13, 2753–2776. [Google Scholar] [CrossRef]
  20. Eckert, S.; Ghebremicael, S.T.; Hurni, H.; Kohler, T. Identification and classification of structural soil conservation measures based on very high-resolution stereo satellite data. J. Environ. Manag. 2017, 193, 592–606. [Google Scholar] [CrossRef]
  21. Zhao, H.; Fang, X.; Ding, H.; Strobl, J.; Xiong, L.; Na, J.; Tang, G. Extraction of terraces on the Loess Plateau from high-resolution DEMs and imagery utilizing object-based image analysis. ISPRS Int. J. Geo-Inf. 2017, 6, 157. [Google Scholar] [CrossRef]
  22. Sheikh, M.A.A.; Maity, T.; Kole, A. IRU-Net: An efficient end-to-end network for automatic building extraction from remote sensing images. IEEE Access 2022, 10, 37811–37828. [Google Scholar] [CrossRef]
  23. Band, S.S.; Janizadeh, S.; Chandra Pal, S.; Saha, A.; Chakrabortty, R.; Shokri, M.; Mosavi, A. Novel ensemble approach of deep learning neural network (DLNN) model and particle swarm optimization (PSO) algorithm for prediction of gully erosion susceptibility. Sensors 2020, 20, 5609. [Google Scholar] [CrossRef]
  24. Do, H.T.; Raghavan, V.; Yonezawa, G. Pixel-based and object-based terrace extraction using feed-forward deep neural network. ISPRS Ann. Photogramm. Remote Sens. Spat. Inf. Sci. 2019, 4, 1–7. [Google Scholar] [CrossRef]
  25. Huang, F.; Zhang, J.; Zhou, C.; Wang, Y.; Huang, J.; Zhu, L. A deep learning algorithm using a fully connected sparse autoencoder neural network for landslide susceptibility prediction. Landslides 2020, 17, 217–229. [Google Scholar] [CrossRef]
  26. Yu, M.; Rui, X.; Xie, W.; Xu, X.; Wei, W. Research on automatic identification method of terraces on the loess plateau based on deep transfer learning. Remote Sens. 2022, 14, 2446. [Google Scholar] [CrossRef]
  27. Lu, Y.; Li, X.; Xin, L.; Song, H.; Wang, X. Mapping the terraces on the Loess Plateau based on a deep learning-based model at 1.89 m resolution. Sci. Data 2023, 10, 115. [Google Scholar] [CrossRef]
  28. Zhang, F.; Xing, Z.; Zhao, C.; Deng, J.; Yang, B.; Tian, Q.; Rees, H.; Badreldin, N. Characterizing long-term soil and water erosion and their interactions with various conservation practices in the semi-arid Zulihe basin, Dingxi, Gansu, China. Ecol. Eng. 2017, 106, 458–470. [Google Scholar] [CrossRef]
  29. Chen, D.; Wei, W.; Chen, L. Effects of terracing practices on water erosion control in China: A meta-analysis. Earth-Sci. Rev. 2017, 173, 109–121. [Google Scholar] [CrossRef]
  30. Zhao, F.; Xiong, L.Y.; Wang, C.; Wang, H.R.; Wei, H.; Tang, G.A. Terraces mapping by using deep learning approach from remote sensing images and digital elevation models. Trans. GIS 2021, 25, 2438–2454. [Google Scholar] [CrossRef]
  31. Yang, D.; Huang, X. Landscape design and planning methods for plant protection based on deep learning and remote sensing techniques. Crop Prot. 2024, 180, 106620. [Google Scholar] [CrossRef]
  32. Li, Z.; He, W.; Cheng, M.; Hu, J.; Yang, G.; Zhang, H. SinoLC-1: The first 1  m resolution national-scale land-cover map of China created with a deep learning framework and open-access data. Earth Syst. Sci. Data 2023, 15, 4749–4780. [Google Scholar]
  33. Liu, Z.; Chen, G.; Tang, B.; Wen, Q.; Tan, R.; Huang, Y. Regional scale terrace mapping in fragmented mountainous areas using multi-source remote sensing data and sample purification strategy. Sci. Total Environ. 2024, 925, 171366. [Google Scholar] [CrossRef]
  34. Piramanayagam, S.; Saber, E.; Schwartzkopf, W.; Koehler, F.W. Supervised classification of multisensor remotely sensed images using a deep learning framework. Remote Sens. 2018, 10, 1429. [Google Scholar] [CrossRef]
  35. Sun, Y.; Tian, Y.; Xu, Y. Problems of encoder-decoder frameworks for high-resolution remote sensing image segmentation: Structural stereotype and insufficient learning. Neurocomputing 2019, 330, 297–304. [Google Scholar] [CrossRef]
  36. Ma, L.; Liu, Y.; Zhang, X.; Ye, Y.; Yin, G.; Johnson, B.A. Deep learning in remote sensing applications: A meta-analysis and review. ISPRS J. Photogramm. Remote Sens. 2019, 152, 166–177. [Google Scholar] [CrossRef]
  37. Ronneberger, O.; Fischer, P.; Brox, T. U-Net: Convolutional Networks for Biomedical Image Segmentation. In Proceedings of the Medical Image Computing and Computer-Assisted Intervention–MICCAI 2015: 18th International Conference, Munich, Germany, 5–9 October 2015. [Google Scholar]
  38. Zhou, Z.; Siddiquee, M.M.R.; Tajbakhsh, N.; Liang, J. Unet++: Redesigning skip connections to exploit multiscale features in image segmentation. IEEE Trans. Med. Imaging 2019, 39, 1856–1867. [Google Scholar] [CrossRef] [PubMed]
  39. Chen, J.; Lu, Y.; Yu, Q.; Luo, X.; Adeli, E.; Wang, Y.; Lu, L.; Yuille, A.L.; Zhou, Y. TransUNet: Transformers Make Strong Encoders for Medical Image Segmentation. arXiv 2021, arXiv:2102.04306. [Google Scholar]
  40. Li, Z.; Wang, R.; Zhang, W.; Hu, F.; Meng, L. Multiscale features supported DeepLabV3+ optimization scheme for accurate water semantic segmentation. IEEE Access 2019, 7, 155787–155804. [Google Scholar] [CrossRef]
  41. da Cruz, L.B.; Júnior, D.A.D.; Diniz, J.O.B.; Silva, A.C.; de Almeida, J.D.S.; de Paiva, A.C.; Gattass, M. Kidney tumor segmentation from computed tomography images using DeepLabv3+ 2.5 D model. Expert Syst Appl. 2022, 192, 116270. [Google Scholar] [CrossRef]
  42. Du, S.; Du, S.; Liu, B.; Zhang, X. Incorporating DeepLabv3+ and object-based image analysis for semantic segmentation of very high-resolution remote sensing images. Expert Syst. Appl. 2021, 14, 357–378. [Google Scholar] [CrossRef]
  43. Chen, L.-C.; Zhu, Y.; Papandreou, G.; Schroff, F.; Adam, H. Encoder-Decoder with Atrous Separable Convolution for Semantic Image Segmentation. arXiv 2018, arXiv:1802.02611. [Google Scholar]
  44. Zhao, H.; Shi, J.; Qi, X.; Wng, X.; Jia, J. Pyramid scene parsing network. In Proceedings of the IEEE Conference on Computer Vision and Pattern Recognition, Honolulu, HI, USA, 21–26 July 2017; pp. 2881–2890. [Google Scholar]
  45. Cao, B.; Yu, L.; Naipal, V.; Ciais, P.; Li, W.; Zhao, Y.; Wei, W.; Chen, D.; Liu, Z.; Gong, P. A 30-meter terrace mapping in China using Landsat 8 imagery and digital elevation model based on the Google Earth Engine. Earth Syst. Sci. Data Discuss. 2020, 2020, 1–35. [Google Scholar]
  46. Yang, H.; Zhou, C.; Xing, X.; Wu, Y.; Wu, Y. A High-Resolution Remote Sensing Road Extraction Method Based on the Coupling of Global Spatial Features and Fourier Domain Features. Remote Sens. 2024, 16, 3896. [Google Scholar] [CrossRef]
  47. Liang, Z.; Wang, F.; Zhu, J.; Li, P.; Xie, F.; Zhao, Y. Autonomous Extraction Technology for Aquaculture Ponds in Complex Geological Environments Based on Multispectral Feature Fusion of Medium-Resolution Remote Sensing Imagery. Remote Sens. 2024, 16, 4130. [Google Scholar] [CrossRef]
  48. Olofsson, P.; Foody, G.M.; Stehman, S.V.; Woodcock, C.E. Making better use of accuracy data in land change studies: Estimating accuracy and area and quantifying uncertainty using stratified estimation. Remote Sens. Environ. 2013, 129, 122–131. [Google Scholar] [CrossRef]
  49. Gómez, C.; White, J.C.; Wulder, M.A. Optical remotely sensed time series data for land cover classification: A review. ISPRS J. Photogramm. Remote Sens. 2016, 116, 55–72. [Google Scholar] [CrossRef]
  50. Yu, L.; Li, X.; Li, C.; Zhao, Y.; Niu, Z.; Huang, H.; Wang, J.; Cheng, Y.; Lu, H.; Si, Y.; et al. Using a global reference sample set and a cropland map for area estimation in China. Sci. China Earth Sci. 2017, 60, 277–285. [Google Scholar] [CrossRef]
  51. Olofsson, P.; Foody, G.M.; Herold, M.; Stehman, S.V.; Woodcock, C.E.; Wulder, M.A. Good practices for estimating area and assessing accuracy of land change. Remote Sens. Environ. 2014, 148, 42–57. [Google Scholar] [CrossRef]
  52. Liu, X.; Yu, J.; Song, W.; Zhao, X.; Wang, A. Remote sensing image classification algorithm based on texture feature and extreme learning machine. Comput. Mater. Contin. 2020, 65, 1385–1395. [Google Scholar] [CrossRef]
  53. Simon, P.; Uma, V. Deep learning based feature extraction for texture classification. Procedia Comput. Sci. 2020, 171, 1680–1687. [Google Scholar] [CrossRef]
  54. Shen, Q.; Deng, H.; Wen, X.; Chen, Z.; Xu, H. Statistical texture learning method for monitoring abandoned suburban cropland based on high-resolution remote sensing and deep learning. IEEE J. Sel. Top. Appl. Earth Obs. Remote Sens. 2023, 16, 3060–3069. [Google Scholar] [CrossRef]
Figure 1. Location and overview of the ZLRB. (a) the spatial location of the ZLRB, (b) DEM data for the ZLRB, (c) land cover data with a 1 m resolution for the ZLRB (SinoLC-1), and (d) 2020 GF-2 imagery of the ZLRB, (eg) are partial enlarged images.
Remotesensing 17 00012 g001
Figure 2. Flowchart of the terrace refinement extraction based on multi-source data and DL techniques. (a) Specific location map of the ZLRB, (b) Field survey route map for the ZLRB, (c) Land cover data (SinoLC-1) for the ZLRB, and (d) DEM data for the ZLRB.
Remotesensing 17 00012 g002
Figure 3. Selected GF-2 images and their corresponding labels. The first row shows the sample set of GF-2 images, while the second row displays the sample set of real labels associated with these images, which have a size of 256 × 256.
Remotesensing 17 00012 g003
Figure 4. The ResU-Net model employed in this study utilizes U-Net as the fundamental architecture and ResNet50 applied as an encoder for the U-Net network.
Remotesensing 17 00012 g004
Figure 5. The U-Net++ model used in this study improves the segmentation performance and robustness through the utilization of dense jump connections, deep supervision, and improved feature fusion.
Remotesensing 17 00012 g005
Figure 6. The RVTransUNet model used in this study utilizes a fusion of the ResNet-50 network and a ViT model comprising 12 Transformer coding layers to form a hybrid encoder.
Remotesensing 17 00012 g006
Figure 7. The XDeepLabV3+ model used in this study, using Xception as the backbone network for the DeepLabV3+ model.
Remotesensing 17 00012 g007
Figure 8. Comprehensive design of the ResPSPNet model for precise terrace patch extraction.
Remotesensing 17 00012 g008
Figure 9. Model training process diagram. Figure (a) depicts the graph of training loss, while Figure (b) displays the graph of validation loss, and Figure (c) shows the graph of training MIoU. It is evident that the model starts to converge after 30 epochs of training and reaches a stable state after 80 epochs. To ensure accurate experimental results, all five models were trained for 100 epochs.
Remotesensing 17 00012 g009
Figure 10. Five models predict overlapping tiled splicing results. (a) represents the prediction result of the ResU-Net model, (b) displays the prediction result of the U-Net++ model, (c) is the prediction result of the RVTransUNet model, (d) shows the prediction result of the XDeepLabV3+ model, and (e) represents the prediction result of the ResPSPNet model. The second row from left to right shows locally enlarged images depicting the terrace extraction using ResU-Net, U-Net++, RVTransUNet, XDeepLabV3+, and ResPSPNet models. In the third row, (f) there is a superimposed image comparing terrace extraction between ResU-Net and other four models. The remaining four images depict the local comparison of terrace extraction between ResU-Net and U-Net++, ResU-Net and RVTransUNet, ResU-Net and XDeepLabV3+, as well as ResU-Net and ResPSPNet.
Remotesensing 17 00012 g010
Figure 11. Terrace segmentation results of different models in various regions. From left to right, the terrace extraction outcomes of the ResU-Net, U-Net++, RVTransUNet, XDeepLabV3+ and ResPSPNet models are displayed. (a) Denotes the vegetation area, (b) represents the region with both vegetation coverage and bare ground, (c) signifies the bare ground area.
Remotesensing 17 00012 g011
Figure 12. Estimated area of terraced fields before and after correction. (a) Model-predicted ZLRB terrace area, (b) Corrected ZLRB terrace area.
Remotesensing 17 00012 g012
Figure 13. Comparison of terrace data products in ZLRB. We selected two areas for comparison, where column (a) displays the GF-2 image, column (b) presents the spatial distribution map of terraced fields in ZLRB(TDZRB), column (c) is terraces distribution map of the Loess Plateau (TDMLP), column (d) shows the China terraces map (CTM), and column (e) shows we superimposed the three data products for comparison. The areas covered by CTM and TDMLP are larger than ours, while our research products are more detailed.
Remotesensing 17 00012 g013
Table 1. Software environment and hardware configuration details for this study.
ConfigurationVersion
CPU13th Gen Intel(R) Core (TM) i7-13700KF, 3.40 GHz
GPUNVIDIA GeForce RTX 4070
Memory16 GB
SystemMicrosoft Windows 11 Pro for Workstations, 64-bit
LanguagePython 3.11.5
FramePytorch 2.1.1
CUDA23.11.0
ProgrammingPyCharm 2023.2.5 (Professional Edition)
Table 2. Models’ evaluation indicators and corresponding calculation methods.
MetricEquation
OA TP + TN TP + TN + FP + FN
MPA TP TP + FP + TN TN + FN 2
MIOU TP TP + FP + FN + TN TN + FN + FP 2
Precision TP TP + FP
Recall TP TP + FN
F1-Score 2 × Precision × Recall Precision + Recall
Table 3. Accuracy evaluation results of the five models (unit: %).
MethodOAMPAMIoUPrecisionRecallF1-Score
ResU-Net92.76 ± 0.02 a93.1 ± 0.03 a85.41 ± 0.04 a91.51 ± 0.06 a93.8 ± 0.02 a90.5 ± 0.01 a
U-Net++85.48 ± 0.03 d85.95 ± 0.02 d74.48 ± 0.03 d87.15 ± 0.02 c86.8 ± 0.04 d86.25 ± 0.03 d
RVTransUNet90.73 ± 0.03 b90.92 ± 0.03 b81.68 ± 0.04 b88.96 ± 0.03 b91.63 ± 0.03 b89.78 ± 0.02 b
XDeepLabV3+87.41 ± 0.02 c87.63 ± 0.01 c75.88 ± 0.02 c86.77 ± 0.02 d88.31 ± 0.02 c87.08 ± 0.02 c
ResPSPNet82.15 ± 0.02 e82.26 ± 0.03 e68.37 ± 0.04 e80.31 ± 0.03 e82.62 ± 0.03 e81.57 ± 0.04 e
Note: Different letters indicate that there is significant difference (p ≤ 0.05) for one-way ANOVA and Duncan test.
Disclaimer/Publisher’s Note: The statements, opinions and data contained in all publications are solely those of the individual author(s) and contributor(s) and not of MDPI and/or the editor(s). MDPI and/or the editor(s) disclaim responsibility for any injury to people or property resulting from any ideas, methods, instructions or products referred to in the content.