Article

Terrace Extraction Method Based on Remote Sensing and a Novel Deep Learning Framework

by
Yinghai Zhao
1,
Jiawei Zou
2,
Suhong Liu
1,* and
Yun Xie
1
1
Faculty of Geographical Science, Beijing Normal University, Beijing 100875, China
2
Faculty of Arts and Science, Beijing Normal University, Zhuhai 509085, China
*
Author to whom correspondence should be addressed.
Remote Sens. 2024, 16(9), 1649; https://doi.org/10.3390/rs16091649
Submission received: 31 March 2024 / Revised: 29 April 2024 / Accepted: 30 April 2024 / Published: 6 May 2024

Abstract

:
Terraces, farmlands built along hillside contours, are common anthropogenically designed landscapes. Terraces control soil and water loss and improve land productivity; therefore, obtaining their spatial distribution is necessary for soil and water conservation and agricultural production. Spatial information of large-scale terraces can be obtained using satellite images and through deep learning. However, when extracting terraces, accurately segmenting the boundaries of terraces and identifying small terraces in diverse scenarios continues to be challenging. To solve this problem, we combined two deep learning modules, ANB-LN and DFB, to produce a new deep learning framework (NLDF-Net) for terrace extraction using remote sensing images. The model first extracted the features of the terraces through the coding area to obtain abstract semantic features, and then gradually recovered the original size through the decoding area using feature fusion. In addition, we constructed a terrace dataset (the HRT-set) for Guangdong Province and conducted a series of comparative experiments on this dataset using the new framework. The experimental results show that our framework had the best extraction effect compared to those of other deep learning methods. This framework provides a method and reference for extracting ground objects using remote sensing images.

1. Introduction

Terraces are fields built along hillside contours, which are similar in structure to steps and consist of several artificial horizontal and vertical planes [1]. Terraces first appeared in Southeast Asia more than 5000 years ago, and, subsequently, were gradually distributed along the southern and northern coasts of the Mediterranean [2]. Currently, terraces are distributed across numerous countries, including Portugal, Switzerland, Nepal, Indonesia, the Philippines, Peru, China, Japan, and Ethiopia [3]. Terraces, due to their unique design, transform steep slopes into a series of relatively flat, orderly artificial surfaces, thus reducing gradient and slope length. This not only makes the slope more suitable for cultivation, but also disrupts the continuity of the hydrological structure, increasing water storage capacity. This is of great significance for enhancing land productivity and ensuring soil and water conservation [4,5,6,7]. Studies have shown that constructing terraces on sloping land can increase grain production by 44.8% [8,9], reduce runoff by 41.9%, and reduce sediment concentration by 52% [10]. In addition, the reduction in soil erosion and increase in soil moisture content also improve soil conditions, which are beneficial for plant growth, and increase plant diversity and biomass [11]. Studies have shown that the construction of terraces on sloping land can result in an average increase of 32.4% in organic carbon sequestration [12,13]. However, certain studies have highlighted potential problems with terraces, such as the fact that improper design and management of terraces can disrupt the water cycle [10], which not only fails to alleviate soil erosion but can actually exacerbate it [14,15]. In addition, with the rapid changes in economy and society—such as the migration of rural labor and population, urban expansion, and the decline in agriculture—land-use patterns in many regions have shifted, leading to a large number of terraces being abandoned [15,16]. Terraces that are abandoned without timely intervention are prone to soil wall collapses, which not only mar their aesthetic appeal but can also exacerbate soil erosion [6,17]. Therefore, terraces have been widely considered for use worldwide, and the scientific use of terraces is considered an important engineering measure for achieving sustainable slope management and an important integrated land and natural resource management system [3,18,19].
Obtaining accurate terrace ranges and location information is the first prerequisite for terrace mapping, which is important for studying and managing terraces. Field investigation is the simplest and most effective method for studying small-scale terraces [20]; however, it requires considerable manpower and material resources and is not suitable for large-scale terrace mapping. In recent years, with the development of remote sensing image collection and processing technologies, the distribution range of terraces obtained from remote sensing images has been widely used. Historically, visual interpretation has been the primary means to obtain the spatial distribution of terraces [18,21,22,23]. This method, which combines the professional knowledge and experience of interpreters to comprehensively identify terraces, is a convenient and accurate extraction method [24,25]; however, it has low interpretation efficiency, high cost, and is limited in processing large remote sensing image datasets, which encourages the development of automated terrace mapping. With its high degree of automation, machine learning has developed rapidly and achieved remarkable recognition results in large-scale terrace extraction [26,27,28,29,30,31,32,33]. In particular, deep learning has become a research hotspot in the field of remote sensing interpretation, credited to its high recognition accuracy [34,35,36,37,38,39,40]. For example, previous studies extracted the spatial distribution of terraces in China’s Loess Plateau using the improved U-net deep learning model, which provided an important basis for further research on the ecological and economic value of terraces in the region [31,41].
However, terraces are characterized by intra-class feature heterogeneity, interclass feature similarity, and fragmentation. Different types of terraces have different characteristics, and certain non-terraced features are similar to those of terraces; moreover, certain terraces have small areas and are not connected with each other. These characteristics limit the identification accuracy of certain deep learning methods; in other words, the process of distinguishing terraces from other land features and accurately extracting terrace boundaries in a complex terrain environment remains challenging [42]. Therefore, enhancing the precision of deep learning models in extracting terraces is necessary. The Asymmetric Non-local Block (ANB), as an attention mechanism, is divided into two parts: the Asymmetric Pyramid Non-local Block (APNB), and the Asymmetrical Fusion Non-local Block (AFNB). These blocks are commonly used modules for improving the accuracy of deep learning [43,44]. They not only leverage non-local information but also, through pyramid sampling, significantly reduce computational complexity and memory consumption without sacrificing performance [45]. In the ANB, the softmax function is employed for attention distribution. However, owing to the exponential operations utilized by the softmax function, issues of computational overflow and underflow may arise. Moreover, the computational results are highly sensitive to extreme values, which can lead to excessive concentration or dispersion of attention weights [46]. In response to the aforementioned issues, we have replaced the softmax function with a linear function and proposed the Asymmetric Non-local Block with Linear Attention Distribution (ANB-LN). ANB-LN circumvents the need for exponential operations, further reducing computational complexity while maintaining module performance, and enables a more rational distribution of attention. In addition to this method, the feature fusion mechanism is an effective module for enhancing model precision. By merging high-level semantic information with low-level spatial information, it not only improves the robustness of the model but also mitigates the phenomenon of overfitting [47]. Among the common fusion methods, Add and Concat are utilized. Add involves summing the feature values, which increases the information content of the features. Representative models of this approach are DenseNet [48] and U-net [26]. Concat fusion involves concatenating the feature channels, which increases the number of features. A representative model of this approach is ResNet [49]. We have integrated the two fusion methods to propose a new fusion module—the Dual Fusion Module (DFB). This module combines the advantages of both fusion types, enriching the information content and quantity of features. During the decoding phase of the model, it fully utilizes the feature information from the encoded regions, enhancing the robustness and accuracy of the model’s segmentation. To improve the efficacy of deep learning in extracting terraces, this study combined two deep learning modules, ANB-LN and DFB, into a deep learning framework called the non-local linear distribution dual fusion network (NLDF-Net), which was used to extract terraces from remote sensing images using the simplified U-Net model as the baseline. In addition, considering that the terrace in Guangdong Province, China, is characterized by intra-class feature heterogeneity, interclass feature similarity, and fragmented patches [42], we constructed a high-resolution remote sensing image set of terraces (HRT-set) in this area and conducted a series of comparative experiments on the HRT-set dataset.

2. Materials and Methods

2.1. Study Area

Figure 1 shows the spatial location and elevation of study area, and images of classical terraces. The study area was Guangdong Province, a representative province in southern China. The terrain of the province is generally high in the north and low in the south and the geomorphological types are complex and diverse. Mountains and hills are mainly distributed in the north and plains are distributed in the south, with an average elevation range of 70–120 m. Rice and other food crops, such as fruit trees, tea trees, and other cash crops, are generally planted on terraces in the province. Because of special water and heat conditions, some terraces can achieve annual vegetation coverage. In addition, the terraces in the province are characterized by many types, including those with a small area and fragmented distribution; more importantly, the types of ground objects around the terraces are complex, which can allow for the verification of the anti-interference ability of the model.
In deep learning, the quality of the training set has a very important impact on the accuracy of the model; therefore, to ensure the generalization ability of the model, the diversity of terraces in the training set should be ensured. Therefore, we randomly selected 3000 rectangular areas of 5000 × 5000 pixels within Guangdong Province as sampling points for identifying and marking terraces. Labelme (version 5.3.1), an open-source software developed by MIT’s Computer Science and Artificial Intelligence Laboratory (CSAIL), was used to manually extract the terraces from each sampling area. In the second step, the size of the sampling area was considerably larger than that of the input model; therefore, the 3000 sampled images were cut into images of 768 × 768 pixels. Finally, images containing terraces were selected to obtain the HRT set.

2.2. Technical Route

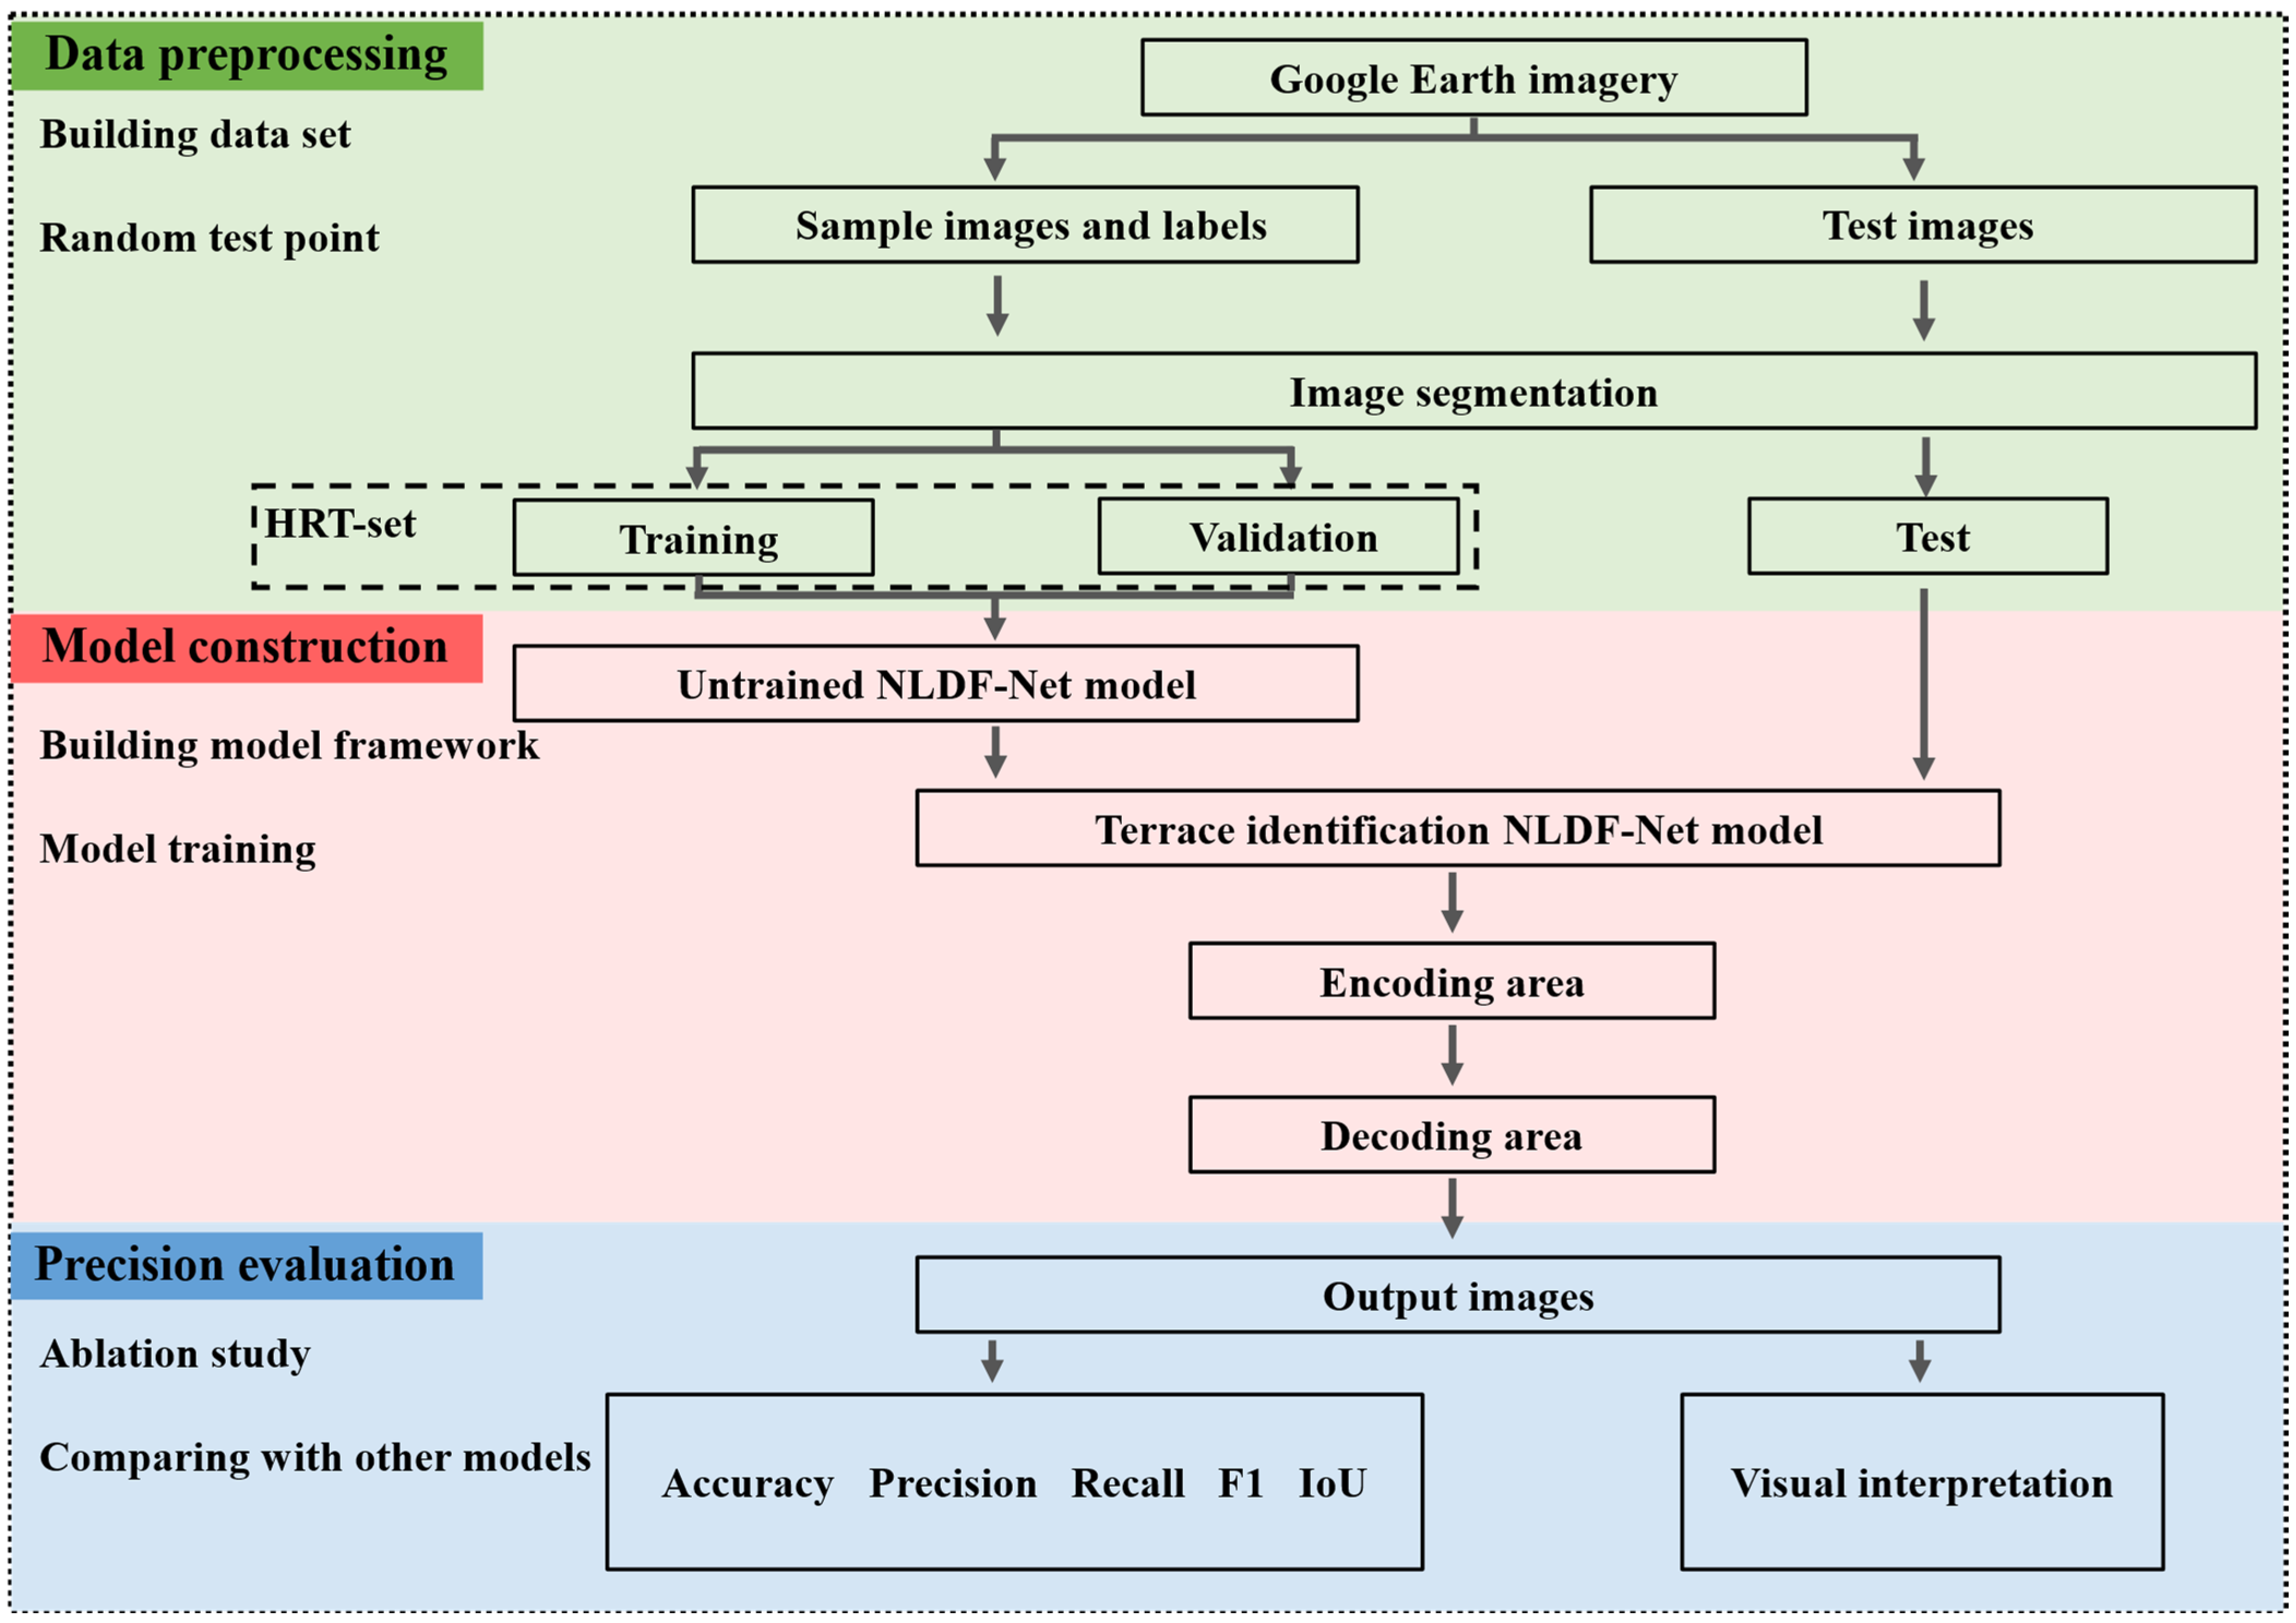
Figure 2 shows the steps of this method. The data in this study were obtained from Google Maps, which holds a range of high-resolution satellite images with different zoom levels [50]. The acquisition time was October to December during the period of 2020–2021, when the crops cultivated on the terraces had been received and were relatively easier to identify. The scale level used was 20, and the spatial resolution under this level was 0.3 m. The unique strip characteristics of the terraces were evident.

2.3. NLDF-Net Construction

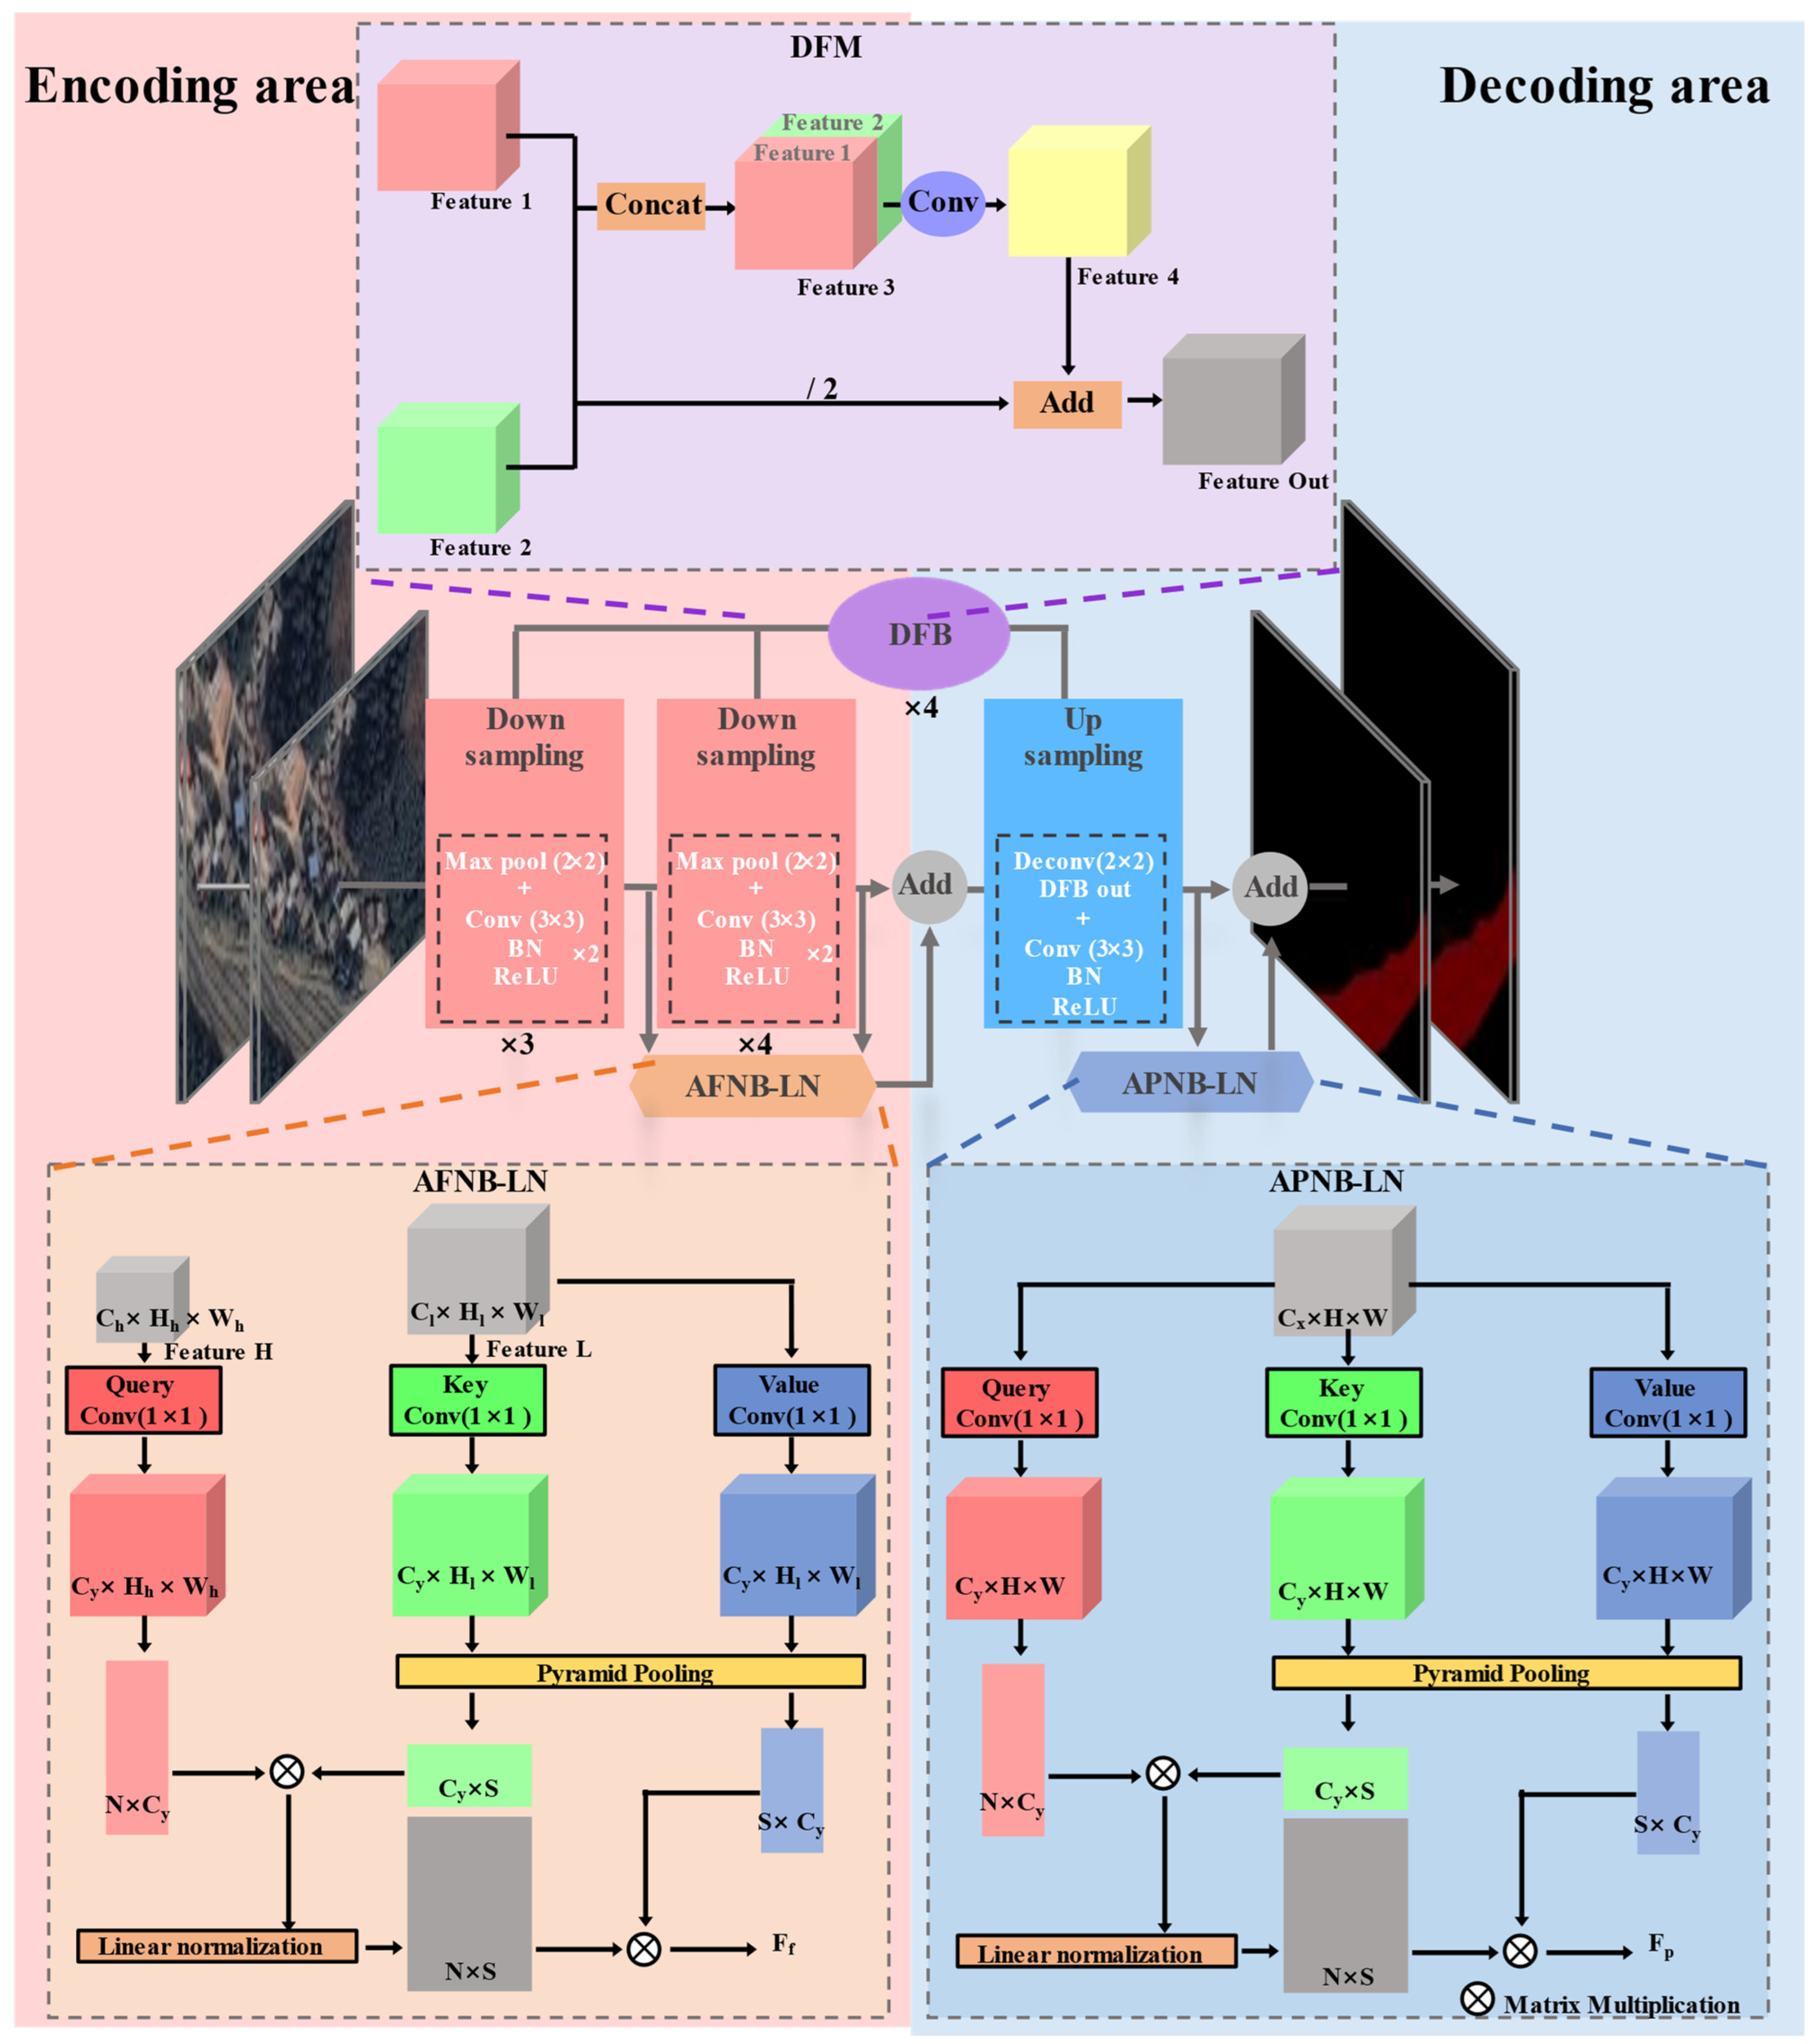
The overall framework of NLDF-Net (Figure 3) mainly included the coding area on the left and the decoding area on the right. Owing to the limitation of computing power, the size of the image was resampled from 768 × 768 to 256 × 256, and a convolution operation was performed to increase the number of feature maps and enrich the features. The feature map groups of the third and fourth downsampling times were input into the AFNB-LN, and the output results of the AFNB-LN and results of the fourth downsampling were summed up and passed into the decoding area. In the decoding region, four upsampling times were performed and the feature maps of the coding and decoder regions were transformed using the DFB after each upsampling; the last upsampling result was input into the APNB-LN, and the input and output of the APNB-LN were added. After the final convolution and resampling, the final output image was a binary image of 768 × 768 pixels. After the model was constructed, the HRT set was used to train the model and identify the optimal parameters. Specific model framework details are presented in the following sections.

2.3.1. Downsampling

Downsampling was the primary step in the coding area. First, the size of the feature map group was reduced to half the original size by a max-pooling operation with a size of 2 × 2, step size of 2, and 0 boundary-filling turns. Another convolution operation was performed with a convolution kernel size of 3 × 3, step size of 1, 0 boundary-filling turns, and double the number of output feature maps (Equation (1)),
O = I + 2 × p k s + 1                              
where O represents the output feature map size, I represents the input feature map size, k represents the convolution kernel size, s represents the step size of the convolution kernel sliding, and p represents the number of boundary-filling turns.
After the convolution operation, a batch normalization (BN) operation was performed, thus reducing gradient disappearance and explosion, preventing overfitting, and expediting the convergent speed of the iterative operation (Equation (2)),
z = x μ σ  
where z is the normalized result, x is the input, μ is the mean, and σ is the variance.
The normalized results were then passed into the activation function, which introduced nonlinear factors to improve the expressiveness of the model. In this model, the ReLU function, which is simple in operation and can improve the model, was used as the activation function. The ReLU activation function was formulated using Equation (3):
f ( x ) = max 0 , x  

2.3.2. Upsampling

Upsampling was the main part of the decoding area. First, a transpose convolution operation was performed, calculated using Equation (4). Upsampling parameters are consistent with Formula (1); upsampling was used to recover the image size, which is widely used in deep learning decoding area operations. After the transposed convolution, the size of the feature map was twice as large as that of the original map and the number of feature maps was half as large as that of the original map, which was fused with the feature map of the corresponding coding region. The fusion result was then subjected to another ordinary convolution operation for feature extraction, and the number of feature maps was reduced to half that of the original.
N = I 1 s 2 p + k  

2.3.3. ANB-LN

AFNB-LN was modified on the basis of APNB-LN, the main difference being that the input was changed from a single input source to two input sources: a high-level feature map group, Fh ∈ RCh×Hh×Wh, and a low-level feature map group, Fl ∈ RCl×Hl×Wl. Using APNB-LN as an example, the feature map group F ∈ RCx×H×W was input into APNB-LN and three 1 × 1 convolution kernels were used for one convolution operation, respectively, to generate the query matrix Q ∈ RCy×H×W, key matrix K ∈ RCy×H×W, and value matrix V ∈ RCy×H×W. Matrices K and V were pyramid-sampled, respectively, and the sizes of different sampling layers of the pyramid set in this model were n × n ∈ {1 × 1, 3 × 3, 6 × 6, 8 × 8}. The sampled results were then reshaped into Kr∈R Cy×S and Vr∈R S×Cy. Qr and Kr represented the matrices multiplied and the results were normalized using linear normalization, as shown in Equation (5). The normalized result was a matrix multiplied by Vr to obtain the output result of the APNB-LN.
f x = x j min ( x ) i = 1 n x i min ( x )  
where xj is a single element of the input vector, x is the input element, and n is the total number of elements in the input vector.

2.3.4. DFM

The two sets of the feature maps, Features 1 and 2, were Concat-fused to obtain Feature 3, whose number of channels was the sum of Features 1 and 2. The Concat fusion result was subjected to a 3 × 3 convolution to restore the number of channels to the original number to obtain Feature 4. Fusion was performed on Feature 4 and the two groups of feature maps were fused (Features 1 and 2) to obtain the double fusion result.

2.4. Experimental Methods

2.4.1. Comparisons with Different Module Combination

To evaluate the effectiveness of DFM and ANB-LN, we conducted a series of comparative experiments that analyzed the effect of each module by controlling the variables and removing different modules from the NLDF-Net. We focused on five experimental groups: No-attention without an attention module, Softmax-attention using Softmax for attention distribution, Add-fusion using only the Add fusion mode, Concat-fusion using only the Concat fusion mode, and our proposed NLDF-Net combining APNB-LN, AFNB-LN, and DFM.

2.4.2. Comparisons with Advanced Deep Learning Models

To verify the performance of the NLDF-Net, we selected several advanced deep learning models for comparison, including:
  • U-Net: The U-shaped structure comprises two parts: encoding and decoding. Each layer of the model had more feature dimensions, enabling it to use diverse and comprehensive features. In addition, information from different levels of feature maps in the encoding stage is utilized by Concat fusion; therefore, accurate prediction results can be obtained with fewer training samples [26]. Although U-Net originated from medical image segmentation, it is widely available in the field of remote sensing because of its excellent performance [51,52].
  • IEU-Net: This model was designed for the extraction of terraces in the Loess Plateau region of China, and is constructed upon the U-Net framework. Specifically, it involves the addition of a dropout layer with a probability of 0.5 following the fourth and fifth sets of convolutional operations [53]. In other words, during each training iteration of the model, 50% of the neurons are randomly dropped out, a method that effectively prevents overfitting. Additionally, batch normalization (BN) is applied after each convolutional layer [54]. As previously mentioned, the inclusion of batch normalization (BN) enhances the training speed of the model. In a previous study, this model achieved high accuracy in extracting terraces from the Loess Plateau region of China [41].
  • Pyramid Scene Parsing Network (PSP-Net): By introducing a pyramid pooling module, the model aggregates the context of different regions so that it can use global information to improve its accuracy [28]. In addition, an auxiliary loss function (AR) is proposed; that is, two loss functions are propagated together, and different weights are used to jointly optimize the parameters, which is conducive to the rapid convergence of the model. This model yielded excellent results in the ImageNet scene-parsing challenge.
  • D-LinkNet: LinkNet is used as the backbone network, and an additional dilated convolution layer is added to the central part of the network. The dilated convolution layer fully uses the information from the deepest feature map of the coding layer while expanding the receptive field using convolutions with different expansion rates [55]. This method performed well in the DeepGlobe road extraction challenge based on remote sensing images, and has therefore been widely used in extracting other ground objects [56].

2.4.3. Precision Evaluation

An accuracy evaluation was used to compare the predicted results of the model with the actual results to judge the model’s accuracy. Specifically, the effectiveness of the model for terrace recognition was quantitatively evaluated with respect to five evaluation factors: overall accuracy (OA), precision, recall, F1 score (F1), and intersection over union (IoU) [57,58], where OA represents the proportion of correct classification results in the total classification results, precision represents the proportion of correct results in the terrace prediction results, recall represents the missed detection rate of the terrace prediction results, F1 is the harmonic mean of the precision and recall rates, and IoU represents the degree of coincidence between the predicted and true results. The indices were calculated using Equations (6)–(10):
O A = T P + T N T P + T N + F N + F P  
P r e c i s i o n = T P T P + F P  
R e c a l l = T P T P + F N  
F 1 = 2 × P r e c i s i o n × R e c a l l P r e c i s i o n + R e c a l l  
I o U = T P T P + F P + F N  

2.4.4. Model Training Details

We conducted five repeated experiments by fixing different random seed parameters and training set assignments, and the final results were presented as average values. Furthermore, considering the significant disparity in the proportion of terraced and non-terraced pixels in the sample, F1 and IoU were better representations of model performance, and we selected these two indicators for t-test based on this rationale. The experimental platform used a GPU (NVIDIA GeForce 3090) and a Windows 10 Professional 64-bit operating system. The programming languages used were Python version 3.11.5, CUDA version 12.1, and PyTorch Library version 2.1.2. The epoch, batch size, and initial learning rate were 100, 8, and 1 × 10⁻⁴, respectively, when the learning rate decay strategy was implemented; specifically, the learning rate became one-tenth of the original after every 25 iterations. The loss value, calculated from the loss function, was used to quantify the gap between the predicted value and the true value, and the model kept reducing the loss value during training to make the predicted result close to the real value. This training used the cross-entropy loss function as the loss function, shown in Equation (11),
L = i = 1 N [ y i · log p i + 1 y i · log ( 1 p i ) ]  
where yi denotes the label value of pixel i, which is 1 for terraces and 0 for non-terraces, and pi represents the probability that pixel i is predicted to be 1.

3. Results

3.1. HRT-Set Result

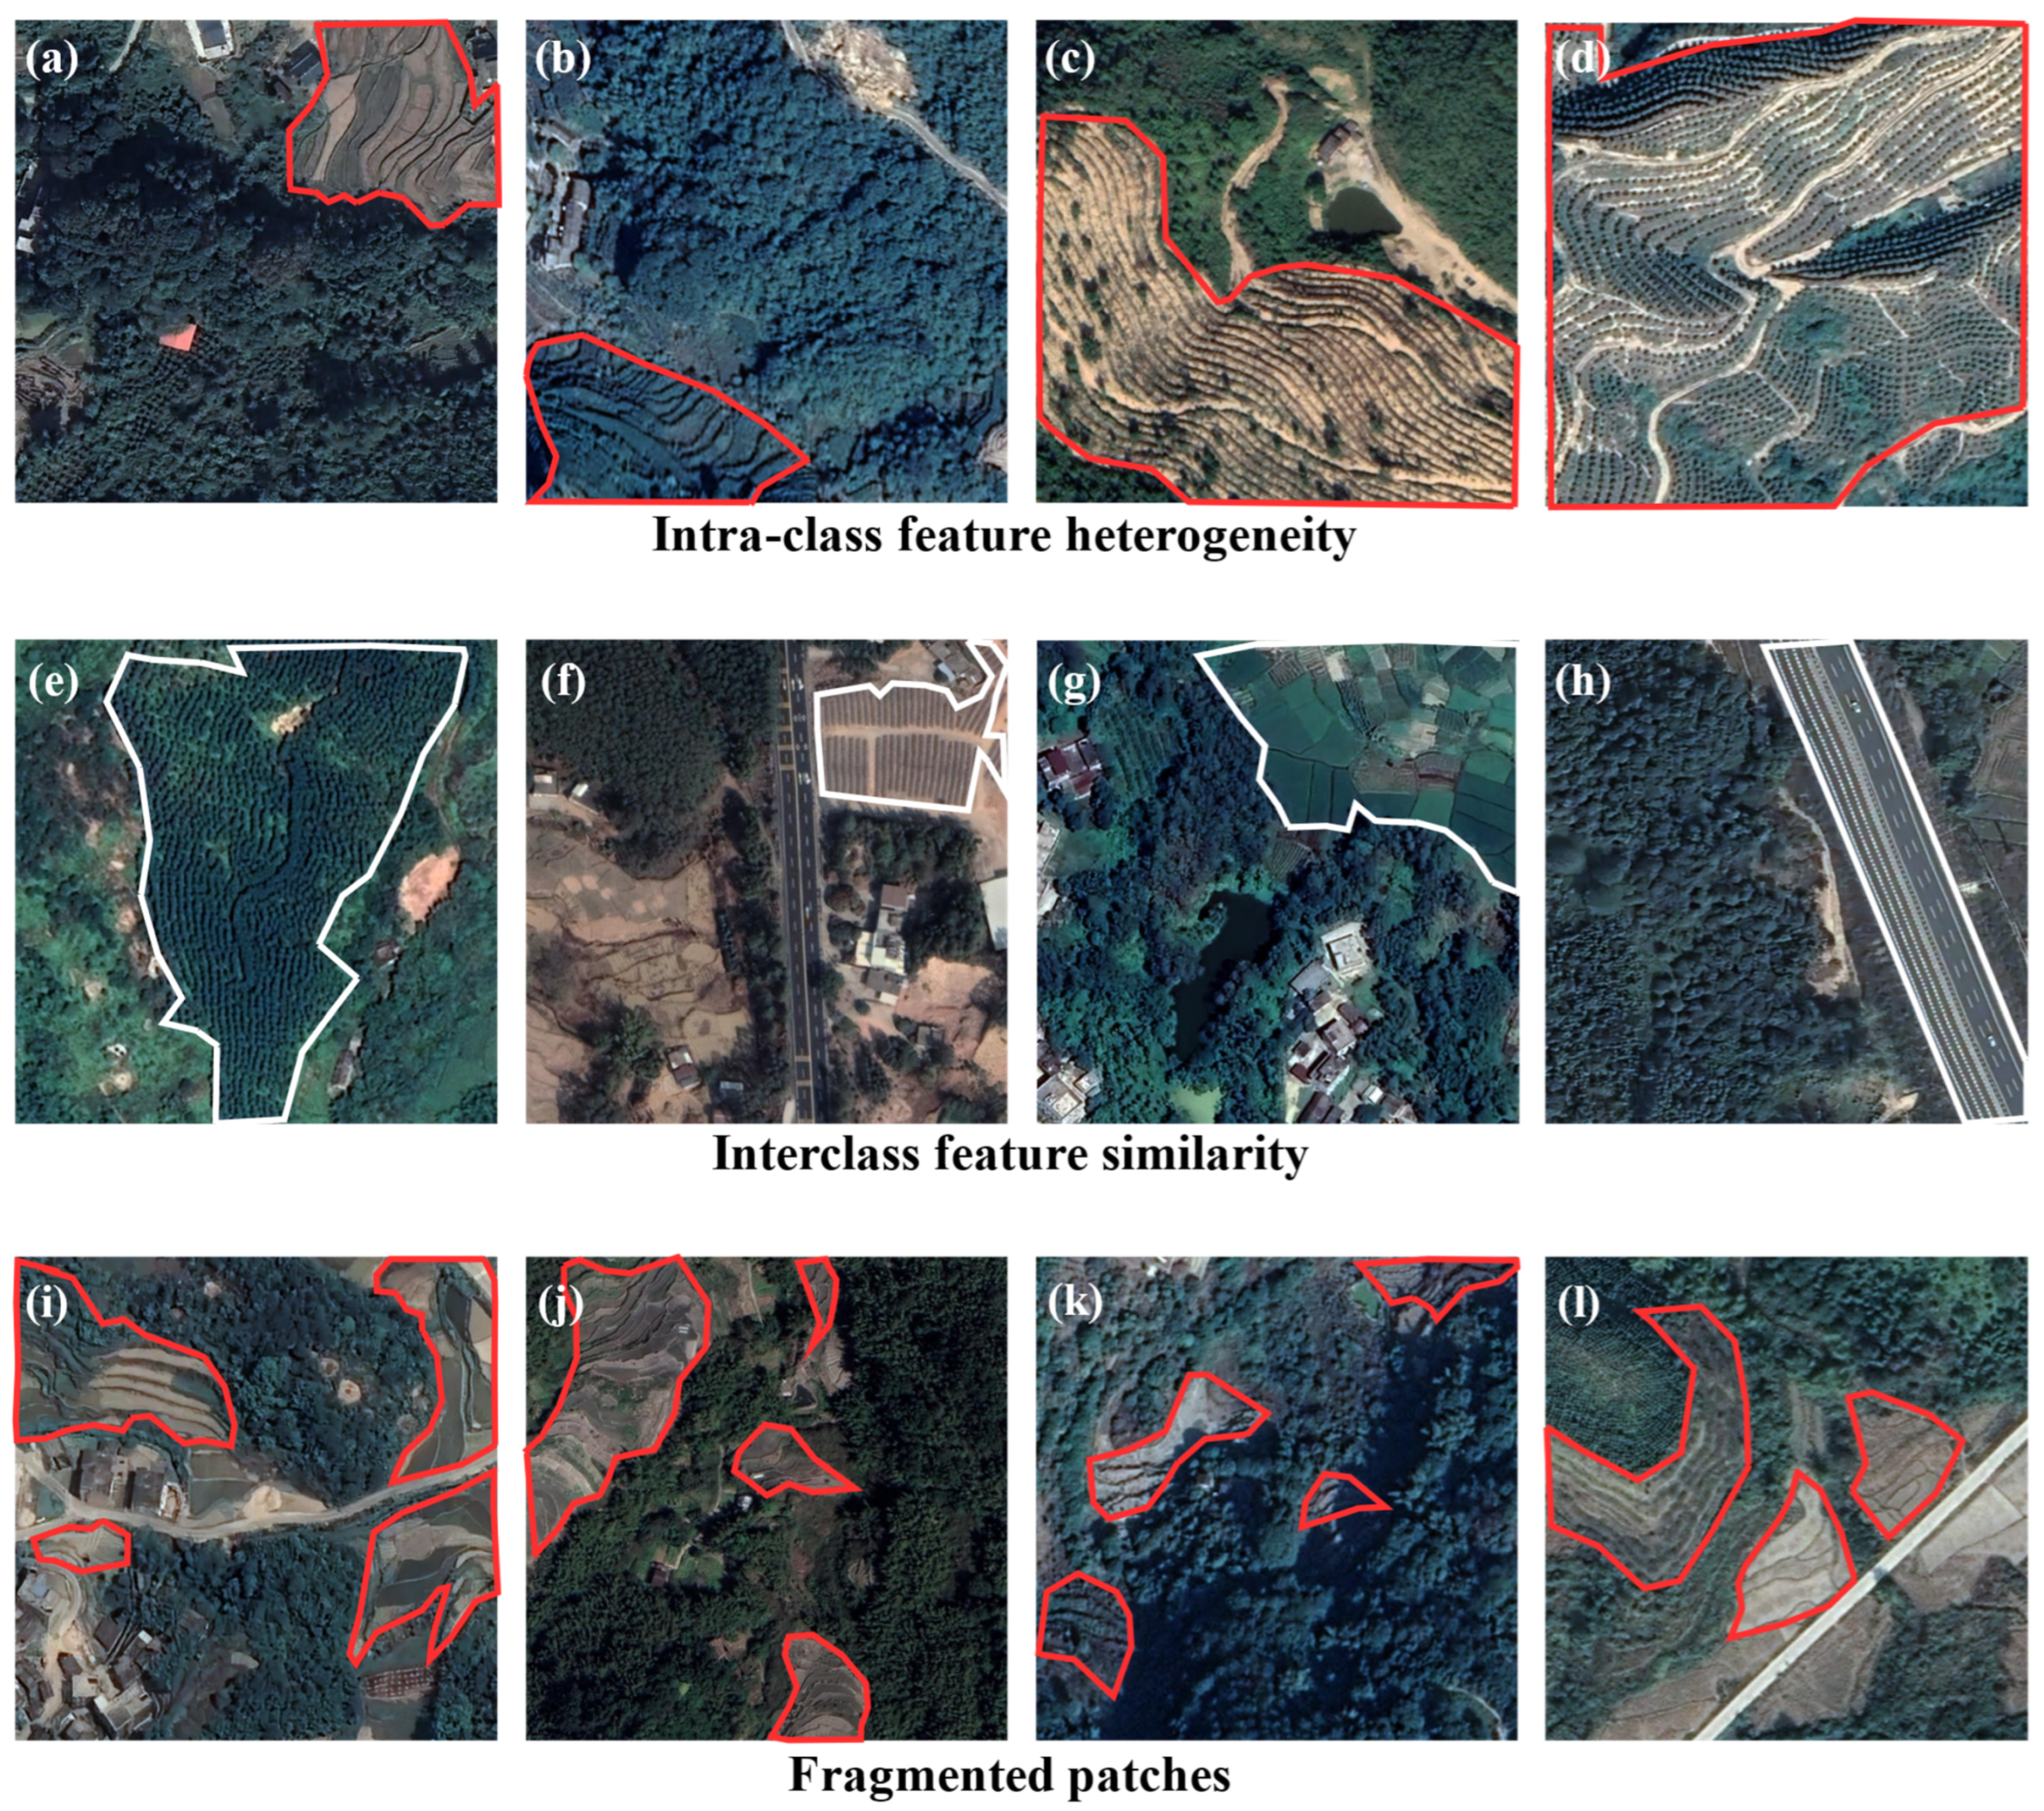
After labeling, segmentation, and screening, 3939 terrace sample datasets were obtained. In addition, 500 images of interference ground objects were added during training, some of which are shown in Figure 4. The first row of images of terraces shows the intra-class feature heterogeneity of terraces, these different types of terraces maintain the characteristics of strip distribution as a whole, and the main difference between the bare land and planting stages is reflected in the vegetation coverage, which is higher in the latter than in the former. The planting area of the shrub terraces is larger than that of the rice terraces. The second row reflects the interclass feature similarity of the terraces; these features have striped distribution characteristics similar to terraces and are widely present in the extraction of terraces, which helps improve the robustness of the model to extract terraces and meet the requirements of the actual situation. The third row shows the characteristics of the fragmented distribution of the terraces. As seen in the figure, some terraces are small and disconnected, with obvious fragmentation. The main reason for this is that some hillsides have large ups and downs, which complicate the building of terraces in pieces.

3.2. Comparisons with Different Module Combination

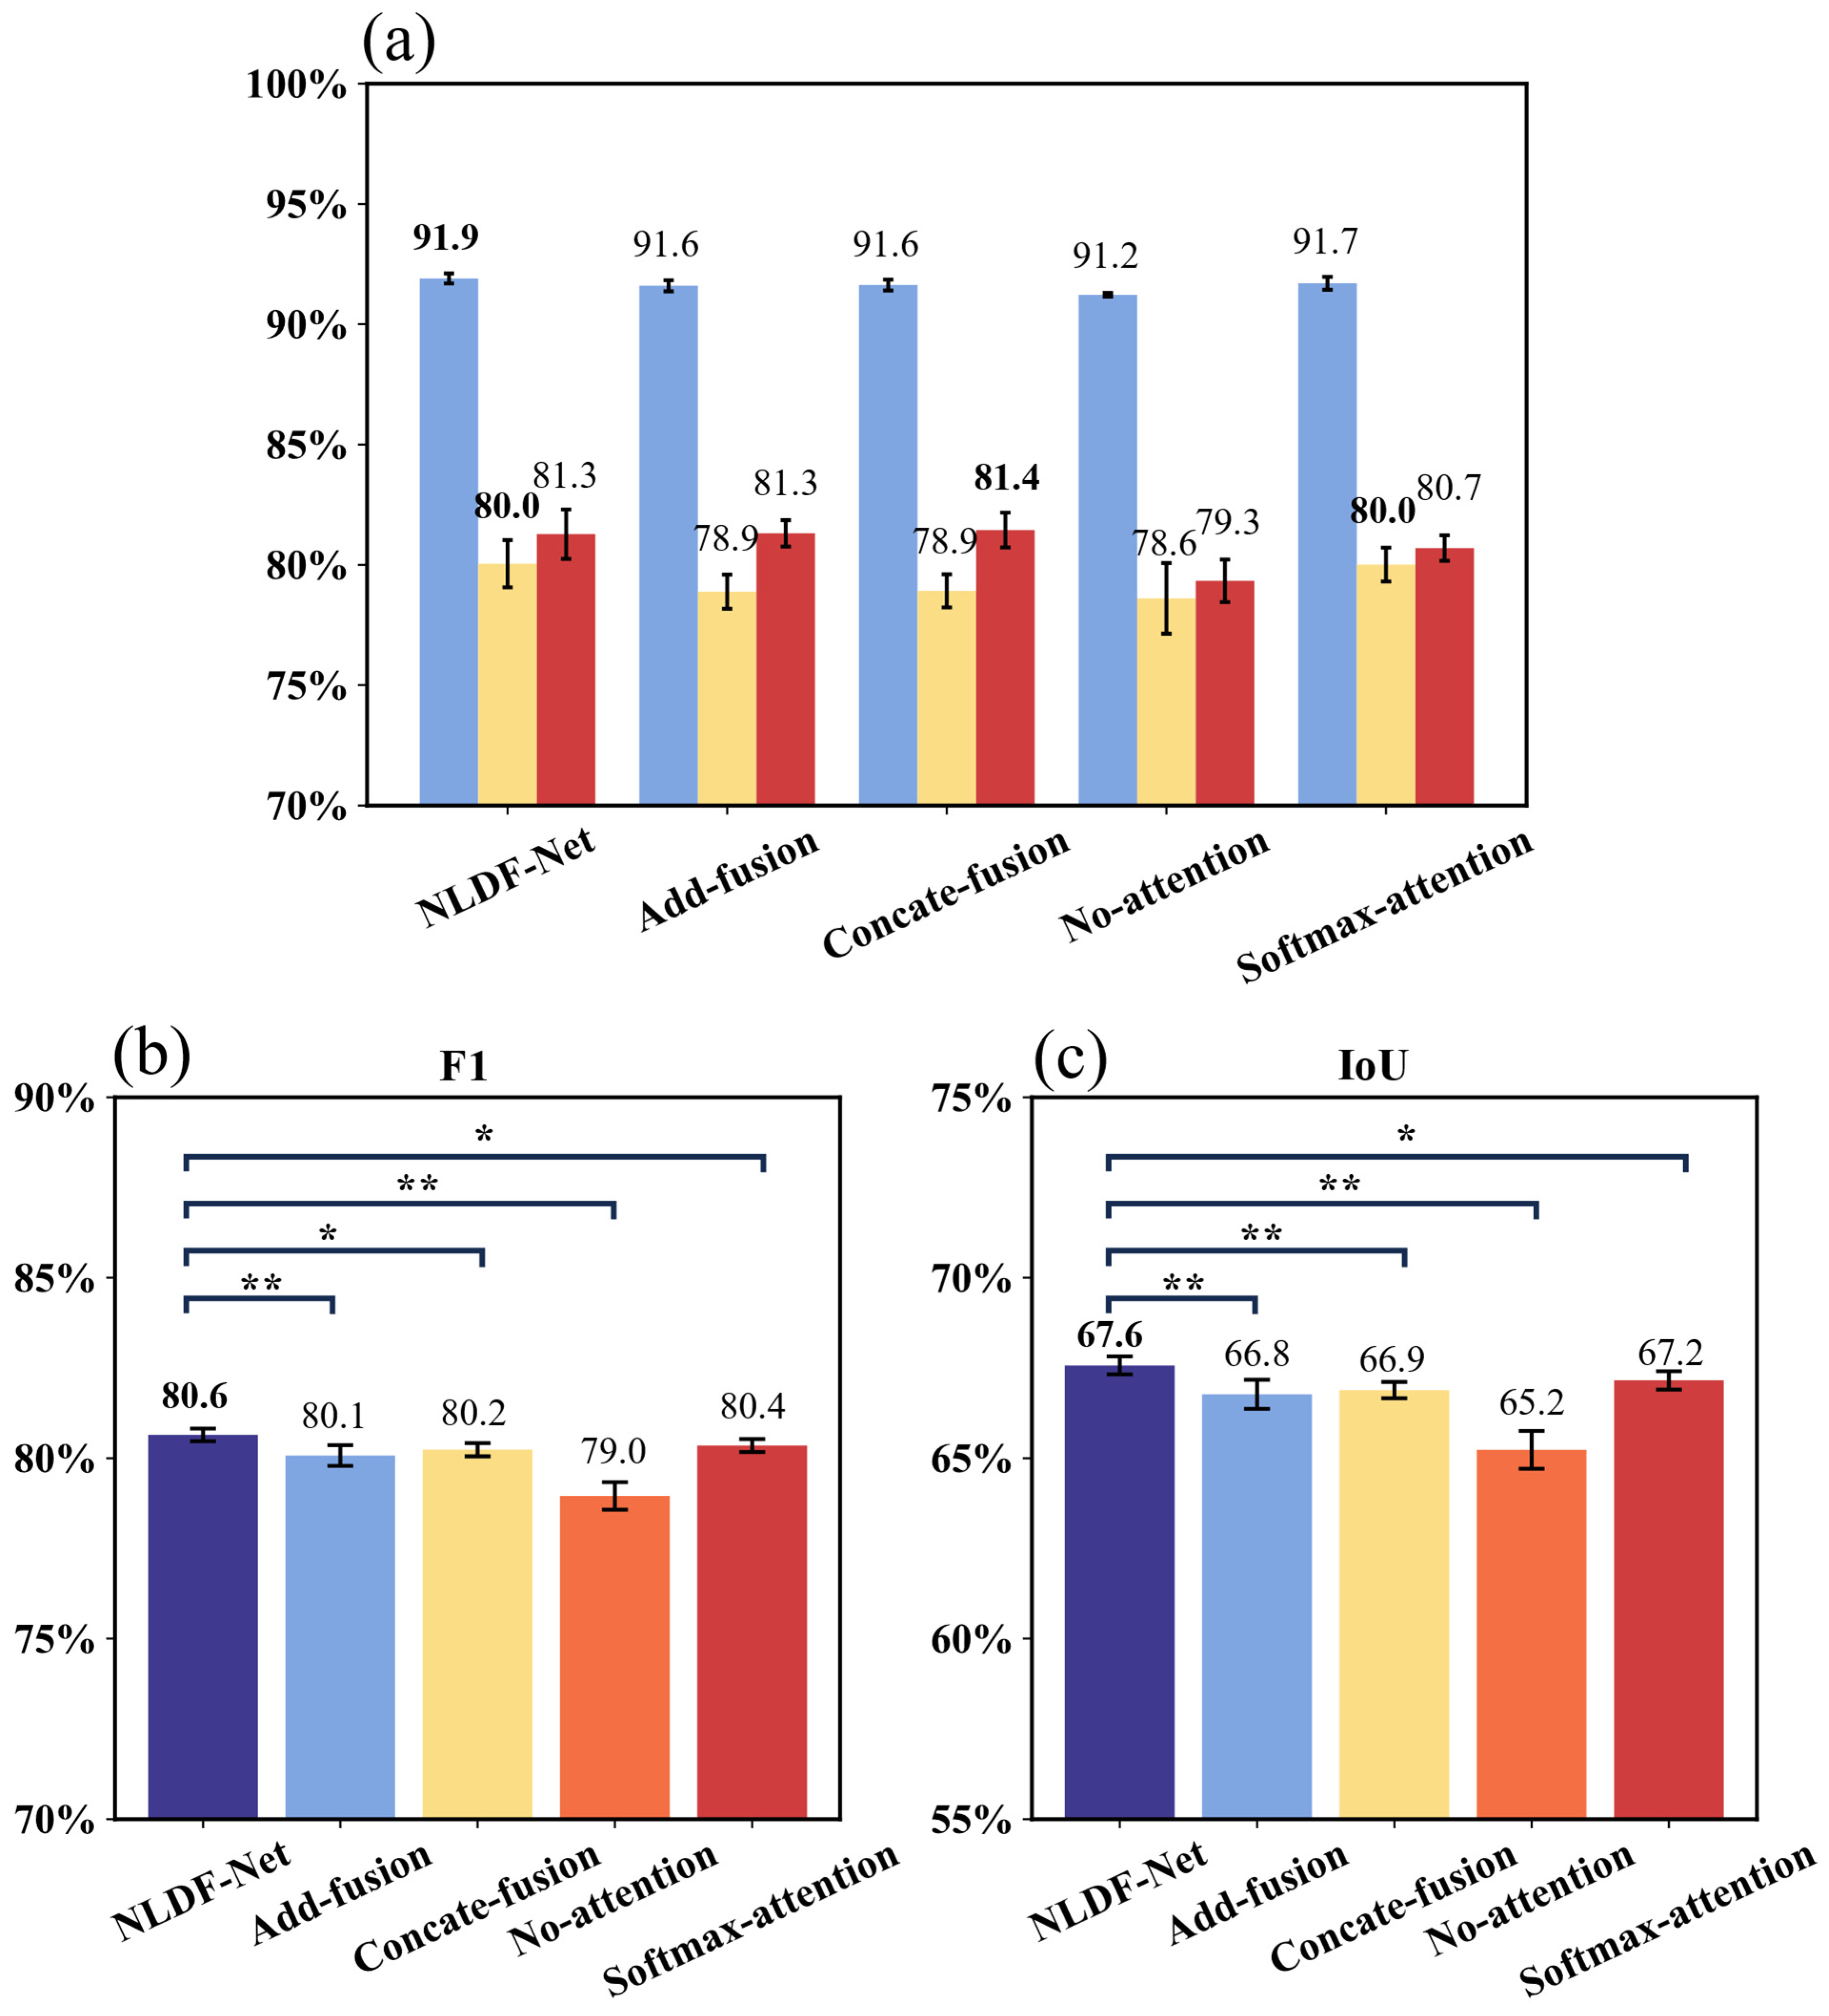
Figure 5 shows the evaluation metrics results of the comparisons with different module combinations. The OA, Precision, Recall, F1, and IoU of our proposed method on the HRT-set dataset were 91.9%, 80.0%, 81.3%, 80.6%, and 67.6%, respectively, and the values of other indicators besides recall were the highest. The OA value of our NLDF-Net model was 0.7% and 0.2% higher than that of No-attention and Softmax-attention, while F1 increased by 1.6% and 0.2%, and IoU increased by 2.4% and 0.4%, respectively. Using the t-test, in terms of F1 and IoU, NLDF-Net shows a highly significant difference with No-attention and significant differences with Softmax-attention. Moreover, a comparison of the experimental results of Add-fusion, Concat-fusion, and our NLDF-Net, showed that the OA values of our model were 0.3% higher than those of both add fusion and Concat fusion methods; furthermore, precision increased by 0.1%, F1 increased by 0.5% and 0.4%, and IoU increased by 0.8% and 0.7%, respectively. The t-test showed that, as far as F1 is concerned, NLDF-Net showed a highly significant difference with Add-fusion and significant difference with Concat-fusion; for IoU, NLDF-Net showed a highly significant difference with both Add-fusion and Concat-fusion. The experimental results show that coupling the attention module (ANB-LN) and fusion module (DFB) improved the accuracy of our model.
The visual prediction results are shown in Figure 6. We selected some representative images for display, which featured houses, forest land, orchards, roads, bare land, and other interference factors, as well as high vegetation coverage. In addition, some terraces had small areas and irregular boundaries. According to the experimental results in the first and second rows of Figure 6, the model successfully excluded orchards and large-area houses and accurately extracted the boundaries of the terraces with evident characteristics. However, compared with the single-fusion method, the double-fusion method excluded parts of barren land with similar characteristics to the terrace. As seen from the images in the third and fourth rows, compared with the other experimental groups, our model excluded forest land with a strip distribution, whereas the other experimental groups were confused. In the experimental results in the fourth row, our model could not only completely identify the terraces but also extract the irregular terrace boundaries, whereas the other experimental groups had difficulty achieving such an effect.

3.3. Comparisons with Advanced State-of-the-Art Deep Learning Models

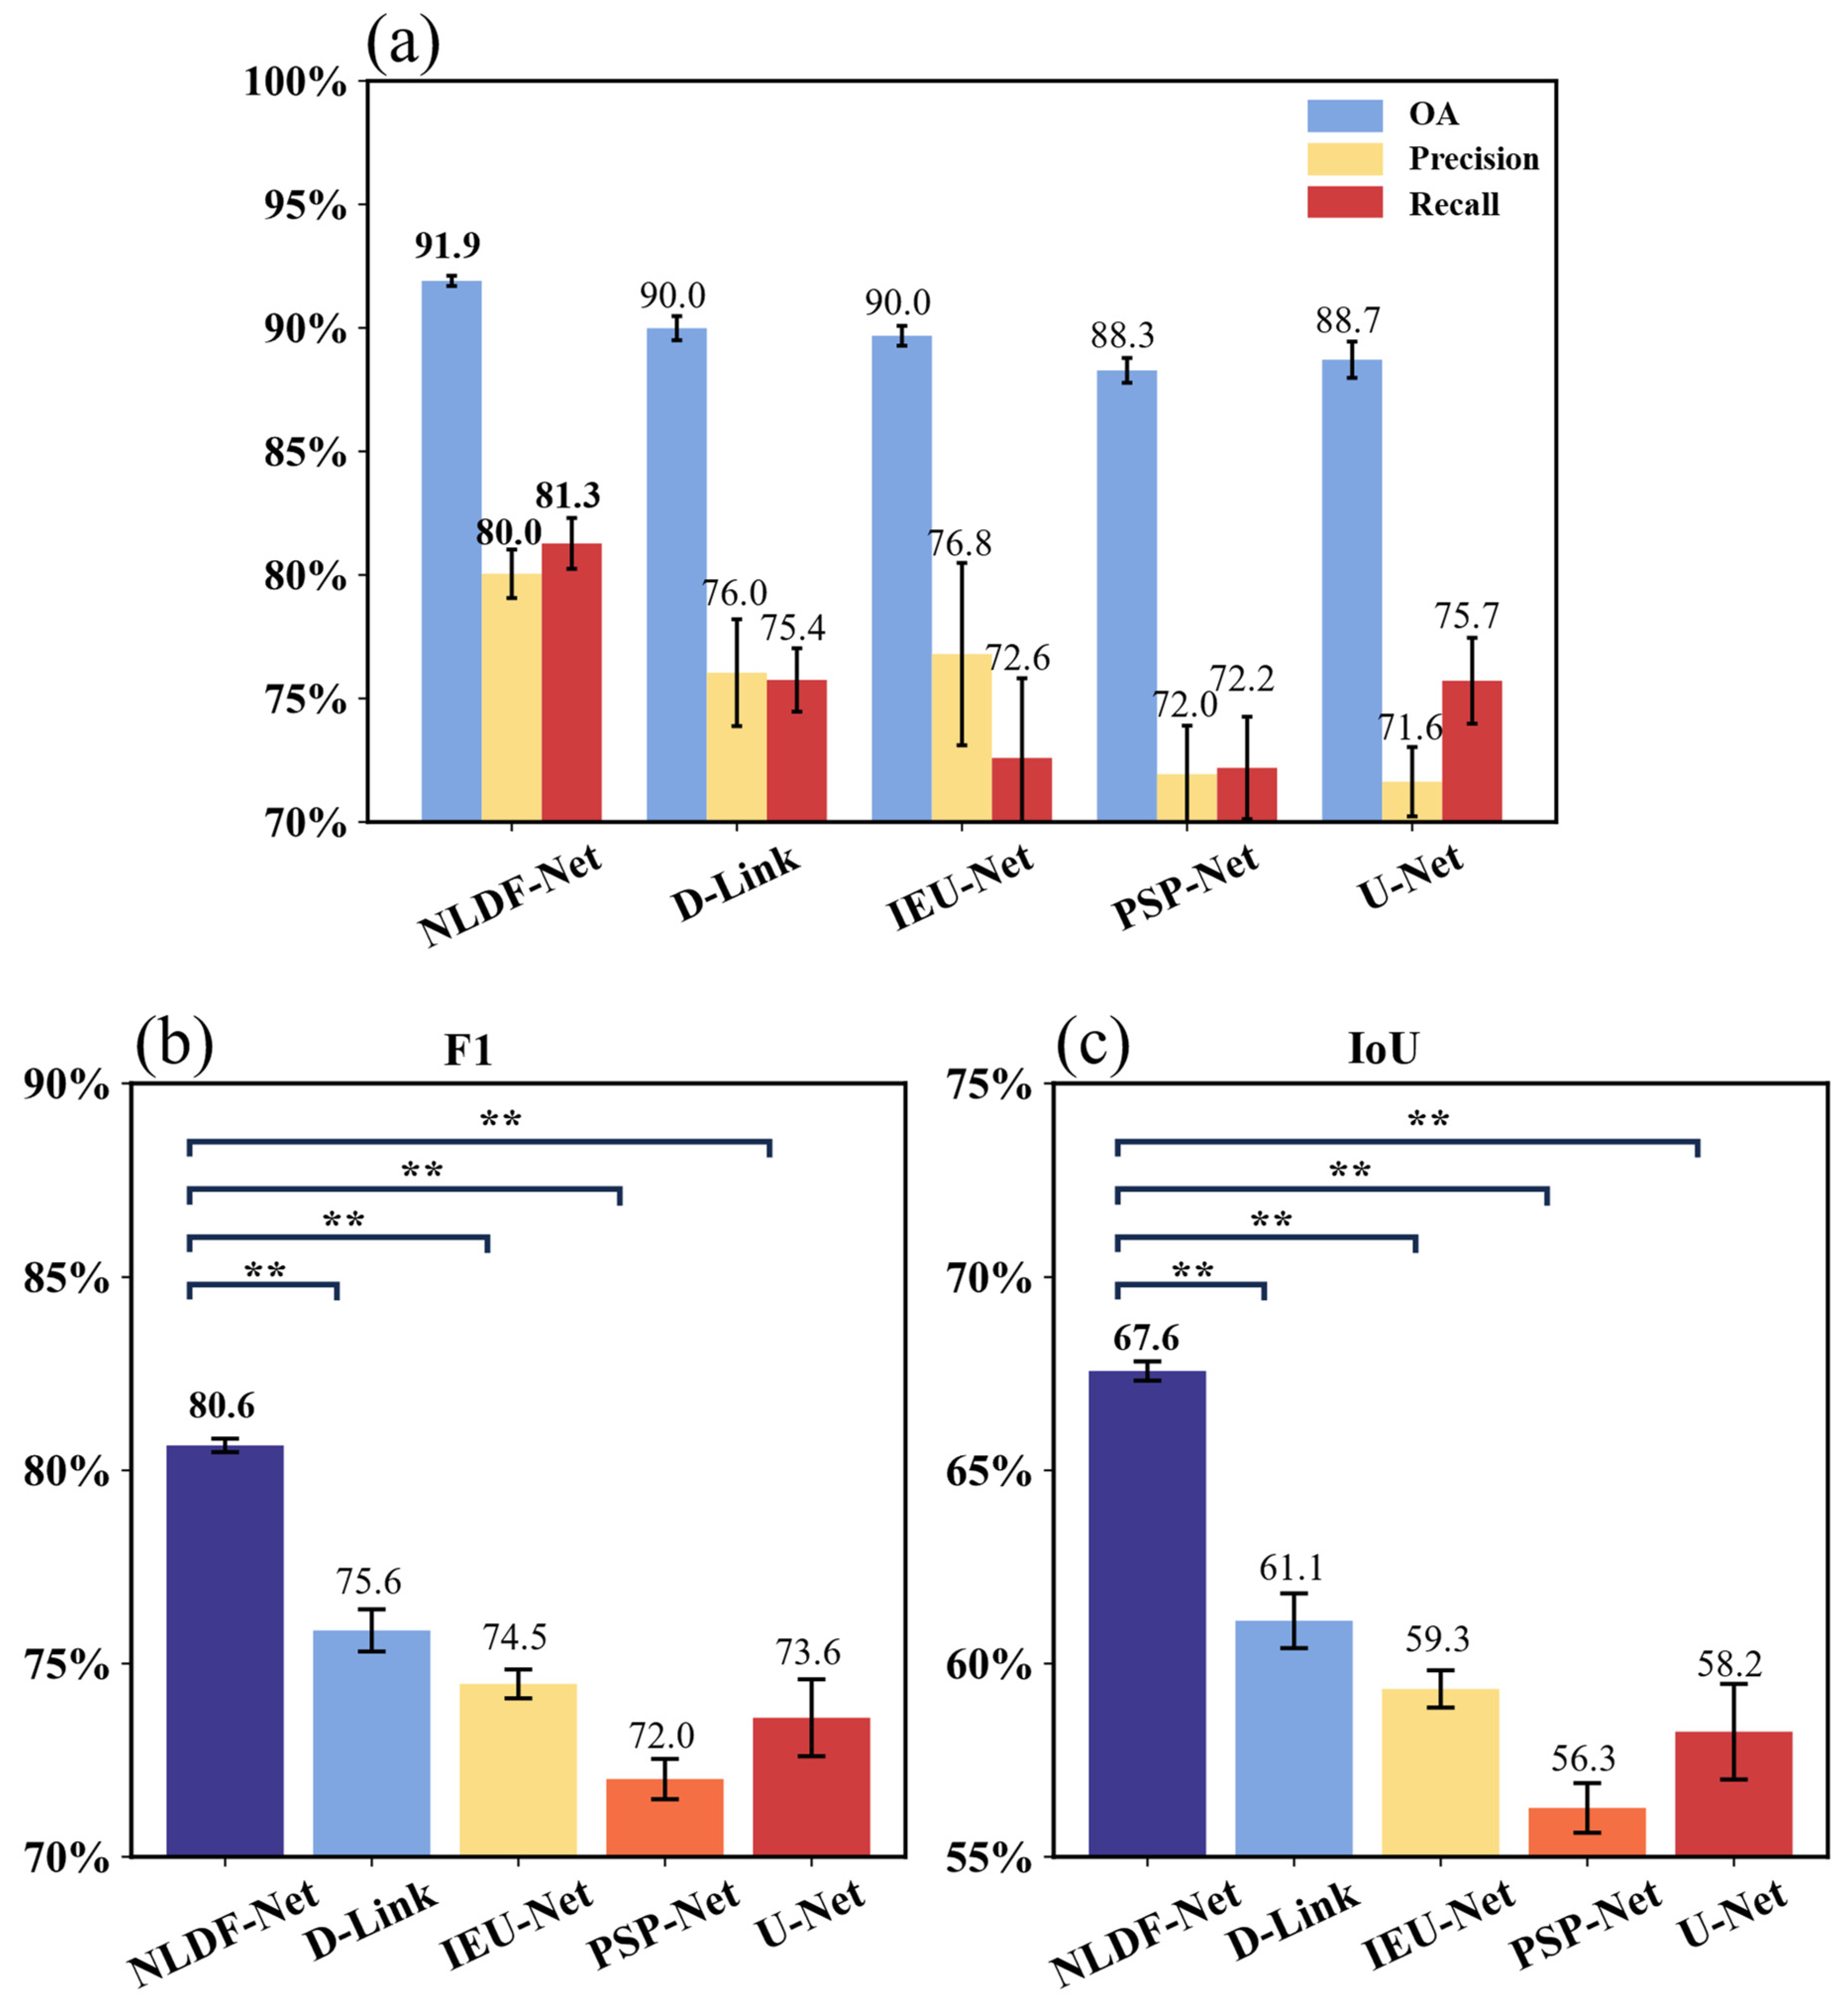
Figure 7 presents the precision evaluation metrics results of the comparisons with advanced state-of-the-art deep learning models. Compared to D-Link, IEU-Net, PSP-Net and U-Net, the OA values of NLDF-Net, increased by 1.9%, 1.9%, 3.6%, and 3.2%, respectively, whereas the Precision increased by 4.0%, 3.2%, 8.0%, and 8.4%. F1 increased by 5.0%, 6.1%, 8.6%, and 7.0%, respectively, while IoU increased by 6.5%, 8.3%, 11.3%, and 9.4%, respectively. According to the t-test, NLDF-Net was significantly different from all other models in terms of F1 and IoU. The results show that our framework outperformed the other frameworks for all indicators, suggesting that the NLDF-Net framework may be superior for identifying terraces in southern China.
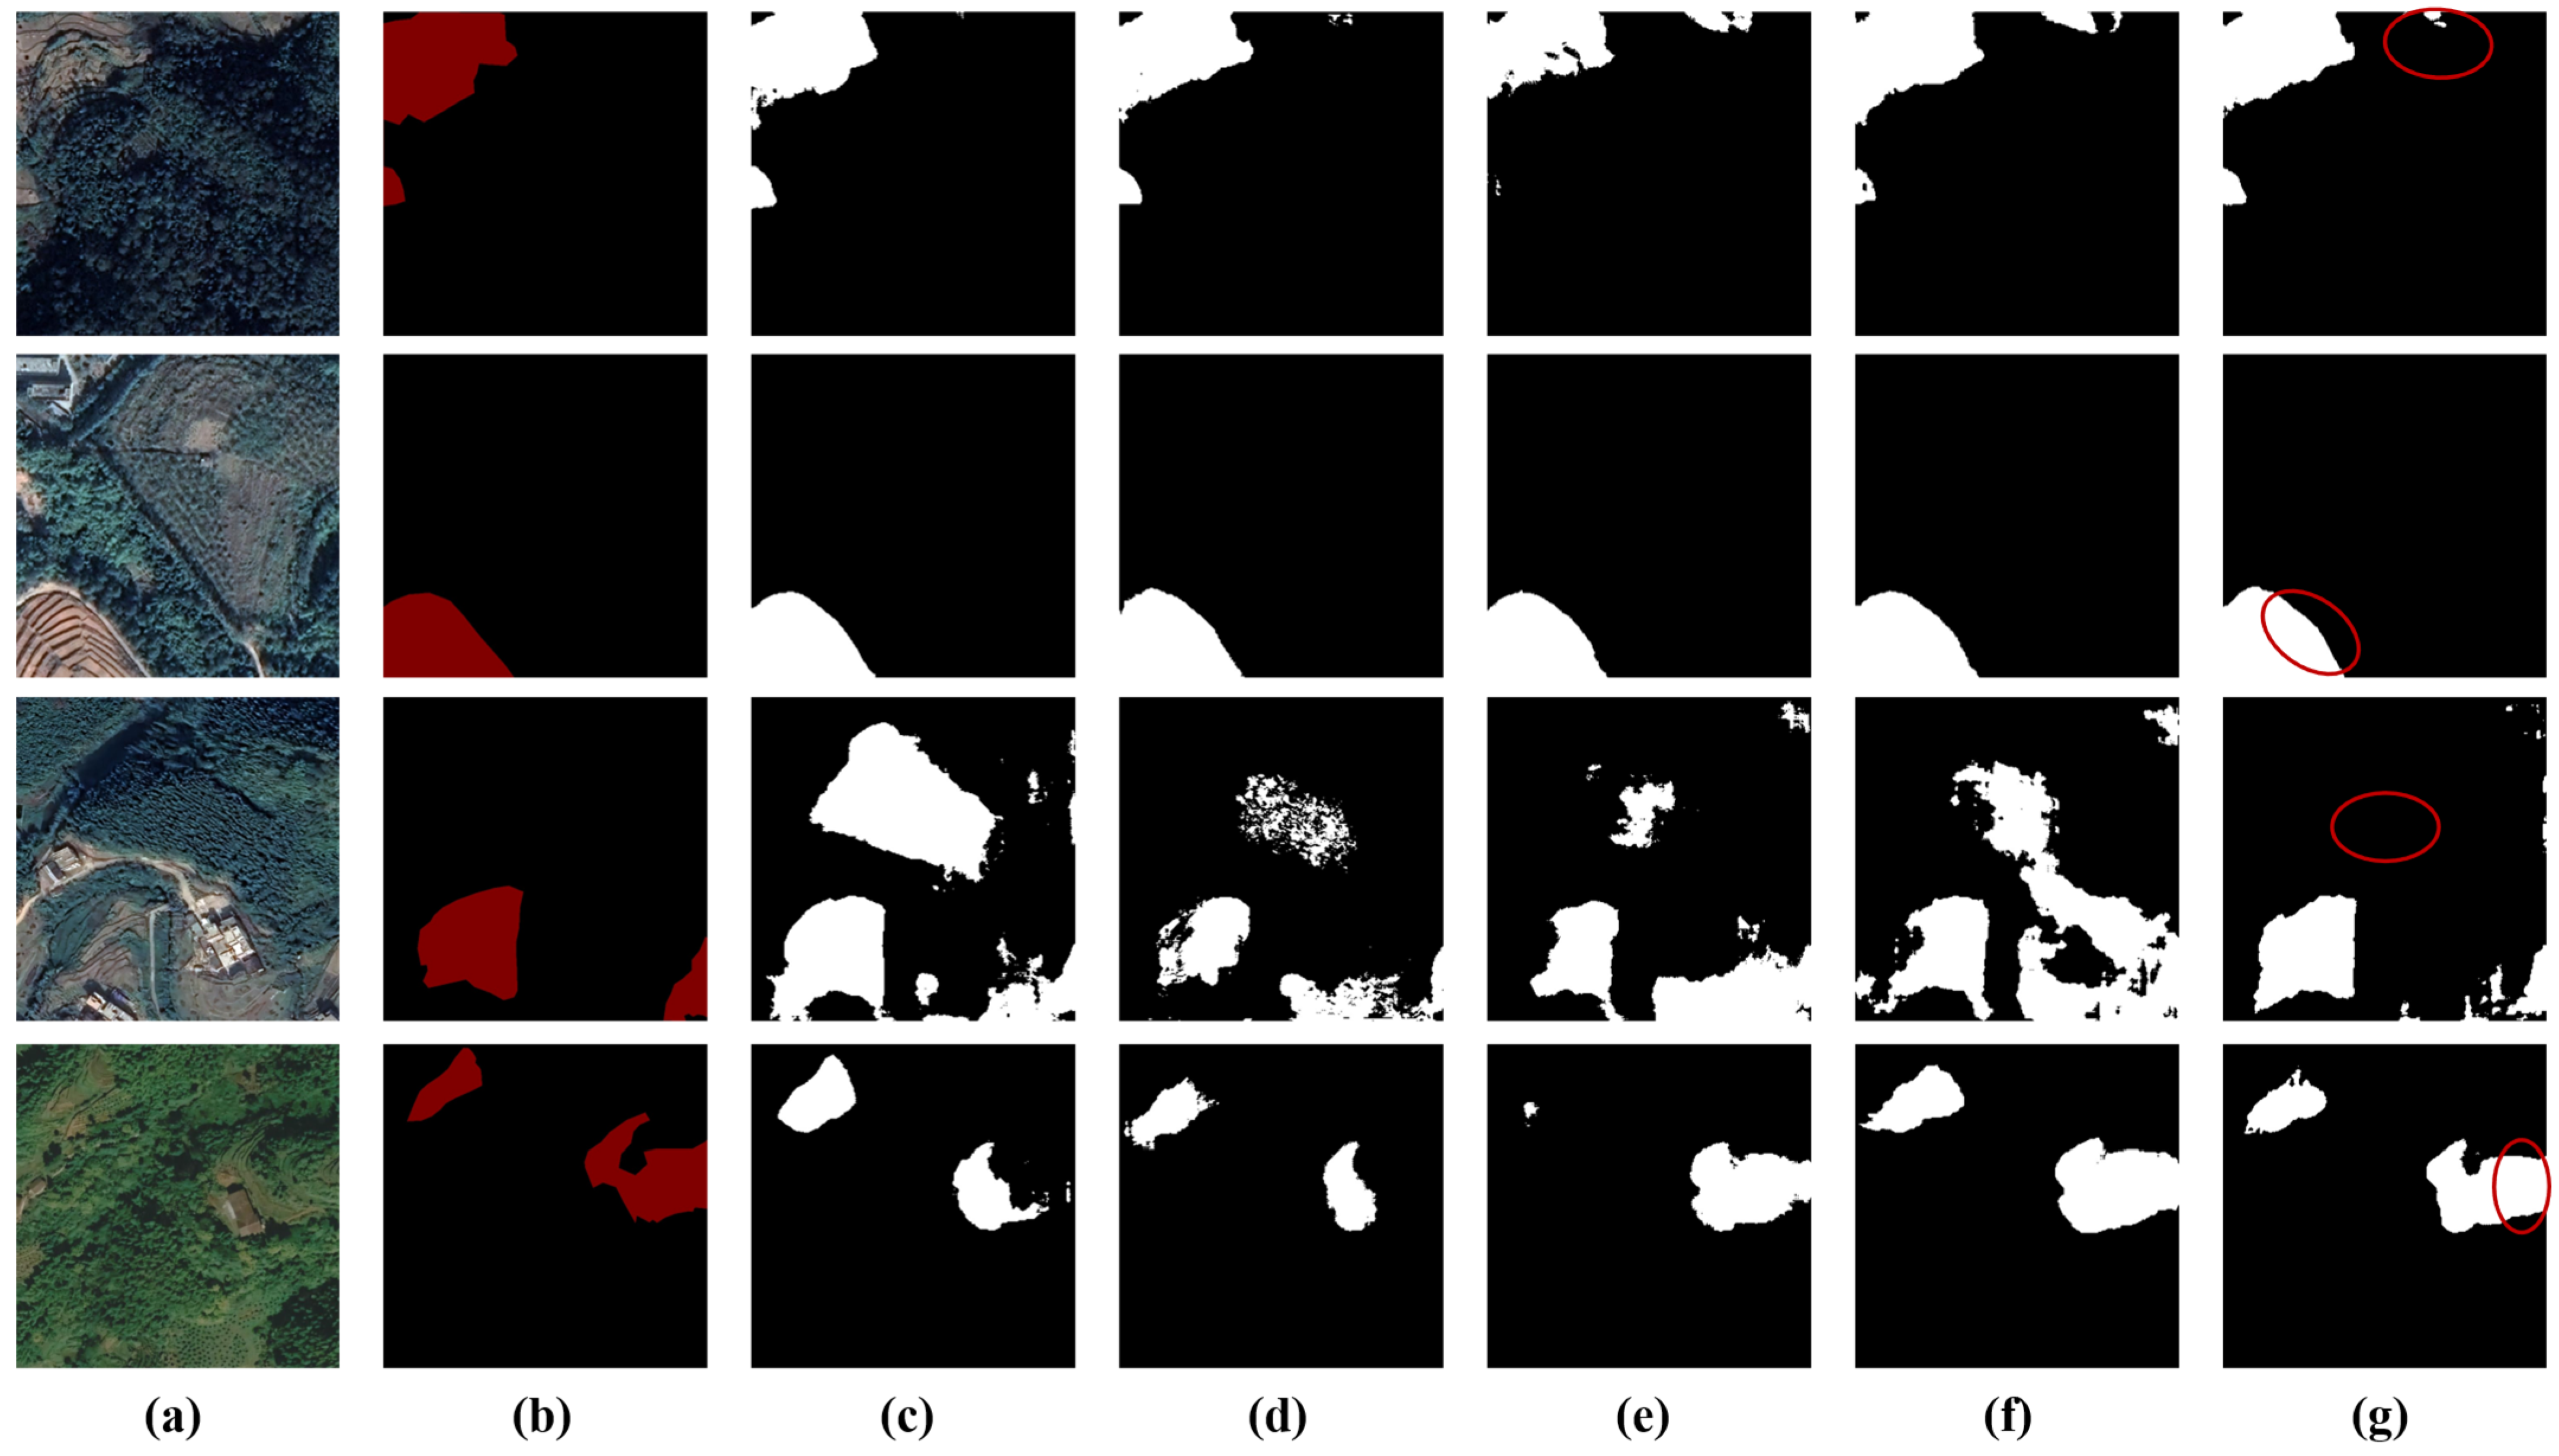
A visualization of the prediction results is shown in Figure 8. From the images in the first row, compared with the other three models, both D-Link and our model excluded the interference factor of the orchard, whereas compared with D-Link, our model was able to exclude the interference factor of the road. The images in the second row show that, compared with the other two models, IEU-Net, D-Link, and our model did not miss the small-area terrace on the left, though our model was able to better identify the boundary of two small-area terraces. The third row of images shows that our method successfully identified small-area terraces without the effects of the interference factors of small-area houses. In addition, our model identified and eliminated road interference factors. As shown by the images in the fourth row, compared with other models, our model better identified some terraces with small areas and unobvious features, while other models could not.

4. Discussion

In this study, we proposed NLDF-Net, an automatic mapping method for extracting terraces in southern China based on high-resolution remote sensing images. In addition, we constructed a terrace HRT dataset for Guangdong Province, China, upon which we conducted comparative experiments, including the comparisons of different module combinations and of our model with other classical network models. The comparisons with different module combination results showed that the performance and accuracy of our NLDF-Net model improved after adding the attention mechanism compared to that of the No-attention group, likely because the attention mechanism can capture long-range dependencies. In other words, the relationship between pixels at a certain distance in the image is established, which can improve the attention of the model to terraces in a complex background of ground objects. Comparing the results of the Softmax-attention experimental group to our model results, our proposed linear attention allocation exceeded the softmax attention allocation because the softmax operation uses the exponential function for normalization, where a large input value drives an overly large output value; therefore, the attention is only allocated to the area with the largest input value and other areas are overlooked. Linear normalization uses the data of the entire input array to allocate attention, which prevents the above problems and makes the attention allocation more reasonable, thereby improving the accuracy of the corresponding model. By comparing the results of the Add-fusion and Concat-fusion experimental groups, the double-fusion method outperformed the single-feature fusion method, likely because by combining the two methods, the DFM could fully fuse the features from the encoding and decoding stages, make better use of semantic and detailed information, and promote the effect of the model. Features of the encoding layer have fewer convolutions, higher resolution, and contain more location and detailed information. After multiple convolutions of the coding layer, the semantic information is enhanced, but the corresponding feature resolution and perception of details are reduced. Using only a single-fusion method of Concat or add often causes the loss of some features; therefore, the efficient fusion of the two can provide their respective advantages and improve the effect of the model. Through the comparison experiments of other advanced models, the five quantitative indicators of our model are higher than those of other models. Figure 6 shows that in the selected verification sample areas, the recognition effect of our model was best due to the following advantages: NLDF-Net can (1) accurately extract terraces by eliminating interference elements in complex terrain environments, (2) effectively extract complex terrace boundaries, and (3) identify terraces with small area and unobvious characteristics. However, our model has some limitations. This model was designed for the recognition of high-resolution spectral images and cannot use low-resolution terrain data, such as DEM data, though elevation change is an important characteristic of terraces. After adding terrain data, the recognition results of some terraces with unobvious spectral and textural features were greatly improved, and the recognition accuracy of the model was also improved.

5. Conclusions

In this study, considering the characteristics of small areas, fragmented distribution, high vegetation coverage, interclass feature similarity, and intra-class feature heterogeneity of terraces in southern China, we proposed a deep learning model, NLDF-Net, combining ANB-LN and DFB, capable of recognizing terraces in southern China using high-resolution remote sensing images. First, the model gradually extracted the spectral and textural features of the terrace through four layers of downsampling in the coding area, after which the downsampling results of the third and fourth layers were input into the AFNB-LN for attention promotion. Subsequently, the size of the original input image was gradually restored by four upsampling layers in the decoding area, in which each upsampling was fully fused with the downsampled feature map through the DFB. The last upsampling result was input into the APNB-LN for attention promotion. Finally, the output result was obtained by compressing the number of feature maps.
We then created a high-resolution terrace dataset of Guangdong Province, China, based on Google Earth’s HRT set, which contains training sets of different types of terraces in different seasons. Comparisons with different module combination on the HRT set proved the effectiveness of the ANB-LN and DFB modules, and comparison experiments with other advanced models proved the superiority of NLDF-Net. A visual comparison of the prediction results reveals that our model accurately extracted the boundaries of the terraces and identified terraces with unobvious features or small areas. However, owing to the problem of resolution mismatch, our model cannot utilize low-resolution terrain data, and this limitation produces some terrace recognition results with unclear spectra and textures that appear fragmented or even unrecognizable. In the future, we will explore how to solve the problem of mismatched model input resolution such that the model can use topographic and spectral data simultaneously, improve the stability of the model, and accurately extract various types of terraces in more diverse scenes.

Author Contributions

Conceptualization, Y.Z.; methodology, Y.Z.; formal analysis, Y.Z. and J.Z.; investigation, Y.Z. and J.Z.; resources, S.L. and Y.X.; writing—original draft preparation, Y.Z.; writing—review and editing, Y.Z., J.Z., S.L. and Y.X.; visualization, Y.Z. and J.Z.; funding acquisition, S.L. and Y.X. All authors have read and agreed to the published version of the manuscript.

Funding

This research was funded by Guangdong Major Project of Basic and Applied Basic Research (2021B0301030007) and Major Scientific Research Projects of Beijing Normal University, Zhuhai (ZHPT2023013).

Data Availability Statement

No new data were created or analyzed in this study. Data sharing is not applicable to this article.

Conflicts of Interest

The authors declare no conflicts of interest.

References

  1. Petanidou, T.; Kizos, T.; Soulakellis, N. Socioeconomic Dimensions of Changes in the Agricultural Landscape of the Mediterranean Basin: A Case Study of the Abandonment of Cultivation Terraces on Nisyros Island, Greece. Environ. Manag. 2008, 41, 250–266. [Google Scholar] [CrossRef] [PubMed]
  2. Price, S.; Nixon, L. Ancient Greek Agricultural Terraces: Evidence from Texts and Archaeological Survey. Am. J. Archaeol. 2005, 109, 665–694. [Google Scholar] [CrossRef]
  3. Baryła, A.; Pierzgalski, E. Ridged Terraces—Functions, Construction and Use. J. Environ. Eng. Landsc. Manag. 2008, 16, 1–6. [Google Scholar] [CrossRef]
  4. Cevasco, A.; Pepe, G.; Brandolini, P. The Influences of Geological and Land Use Settings on Shallow Landslides Triggered by an Intense Rainfall Event in a Coastal Terraced Environment. Bull. Eng. Geol. Environ. 2014, 73, 859–875. [Google Scholar] [CrossRef]
  5. Dorren, L.; Rey, F. A Review of the Effect of Terracing on Erosion. In Briefing Papers of the 2nd Scape Workshop; Boix-Fayons, C., Imeson, A., Eds.; SCAPE: Cinque Terre, Italy, 2004; pp. 97–108. [Google Scholar]
  6. Arnáez, J.; Lana-Renault, N.; Lasanta, T.; Ruiz-Flaño, P.; Castroviejo, J. Effects of Farming Terraces on Hydrological and Geomorphological Processes. A Review. Catena 2015, 128, 122–134. [Google Scholar] [CrossRef]
  7. Cao, Y.; Wu, Y.; Zhang, Y.; Tian, J. Landscape Pattern and Sustainability of a 1300-Year-Old Agricultural Landscape in Subtropical Mountain Areas, Southwestern China. Int. J. Sustain. Dev. World Ecol. 2013, 20, 349–357. [Google Scholar] [CrossRef]
  8. Wei, W.; Chen, D.; Wang, L.; Daryanto, S.; Chen, L.; Yu, Y.; Lu, Y.; Sun, G.; Feng, T. Global Synthesis of the Classifications, Distributions, Benefits and Issues of Terracing. Earth Sci. Rev. 2016, 159, 388–403. [Google Scholar] [CrossRef]
  9. Posthumus, H.; De Graaff, J. Cost-Benefit Analysis of Bench Terraces, a Case Study in Peru. Land. Degrad. Dev. 2005, 16, 1–11. [Google Scholar] [CrossRef]
  10. Deng, C.; Zhang, G.; Liu, Y.; Nie, X.; Li, Z.; Liu, J.; Zhu, D. Advantages and Disadvantages of Terracing: A Comprehensive Review. Int. Soil Water Conserv. 2021, 9, 344–359. [Google Scholar] [CrossRef]
  11. Shimoda, S.; Koyanagi, T.F. Land Use Alters the Plant-Derived Carbon and Nitrogen Pools in Terraced Rice Paddies in a Mountain Village. Sustainability 2017, 9, 1973. [Google Scholar] [CrossRef]
  12. Chen, D.; Wei, W.; Chen, L. How Can Terracing Impact on Soil Moisture Variation in China? A Meta-Analysis. Agric. Water Manag. 2020, 227, 105849. [Google Scholar] [CrossRef]
  13. Chen, D.; Wei, W.; Daryanto, S.; Tarolli, P. Does Terracing Enhance Soil Organic Carbon Sequestration? A National-Scale Data Analysis in China. Sci. Total Environ. 2020, 721, 137751. [Google Scholar] [CrossRef]
  14. Wen, Y.; Kasielke, T.; Li, H.; Zhang, B.; Zepp, H. May Agricultural Terraces Induce Gully Erosion? A Case Study from the Black Soil Region of Northeast China. Sci. Total Environ. 2021, 750, 141715. [Google Scholar] [CrossRef] [PubMed]
  15. Ackermann, O.; Maeir, A.M.; Frumin, S.S.; Svoray, T.; Weiss, E.; Zhevelev, H.M.; Horwitz, L.K. The Paleo-Anthropocene and the Genesis of the Current Landscape of Israel. J. Landsc. Ecol. 2017, 10, 109–140. [Google Scholar] [CrossRef]
  16. Schönbrodt-Stitt, S.; Behrens, T.; Schmidt, K.; Shi, X.; Scholten, T. Degradation of Cultivated Bench Terraces in the Three Gorges Area: Field Mapping and Data Mining. Ecol. Indic. 2013, 34, 478–493. [Google Scholar] [CrossRef]
  17. Gao, X.; Roder, G.; Jiao, Y.; Ding, Y.; Liu, Z.; Tarolli, P. Farmers’ Landslide Risk Perceptions and Willingness for Restoration and Conservation of World Heritage Site of Honghe Hani Rice Terraces, China. Landslides 2020, 17, 1915–1924. [Google Scholar] [CrossRef]
  18. Agnoletti, M.; Cargnello, G.; Gardin, L.; Santoro, A.; Bazzoffi, P.; Sansone, L.; Pezza, L.; Belfiore, N. Traditional Landscape and Rural Development: Comparative Study in Three Terraced Areas in Northern, Central and Southern Italy to Evaluate the Efficacy of GAEC Standard 4.4 of Cross Compliance. Ital. J. Agron. 2011, 6, e16. [Google Scholar] [CrossRef]
  19. Jiao, Y.; Li, X.; Liang, L.; Takeuchi, K.; Okuro, T.; Zhang, D.; Sun, L. Indigenous Ecological Knowledge and Natural Resource Management in the Cultural Landscape of China’s Hani Terraces. Environ. Res. 2012, 27, 247–263. [Google Scholar] [CrossRef]
  20. Liu, X.Y.; Yang, S.T.; Wang, F.G.; He, X.Z.; Ma, H.B.; Luo, Y. Analysis on Sediment Yield Reduced by Current Terrace and Shrubs-Herbs-Arbor Vegetation in the Loess Plateau. J. Hydraul. Eng. 2014, 45, 1293–1300. [Google Scholar]
  21. Faulkner, H.; Ruiz, J.; Zukowskyj, P.; Downward, S. Erosion Risk Associated with Rapid and Extensive Agricultural Clearances on Dispersive Materials in Southeast Spain. Environ. Sci. Policy 2003, 6, 115–127. [Google Scholar] [CrossRef]
  22. Siyuan, W.; Jiyuan, L.; Zengxiang, Z.; Quanbin, Z.; Xiaoli, Z. Analysis on Spatial-Temporal Features of Land Use in China. Acta Geogr. Sin. 2001, 56, 631–639. [Google Scholar]
  23. Liu, J.; Tian, H.; Liu, M.; Zhuang, D.; Melillo, J.M.; Zhang, Z. China’s Changing Landscape during the 1990s: Large-Scale Land Transformations Estimated with Satellite Data. Geophys. Res. Lett. 2005, 32, L02405. [Google Scholar] [CrossRef]
  24. Martínez-Casasnovas, J.A.; Ramos, M.C.; Cots-Folch, R. Influence of the EU CAP on Terrain Morphology and Vineyard Cultivation in the Priorat Region of NE Spain. Land. Use Policy 2010, 27, 11–21. [Google Scholar] [CrossRef]
  25. Zhao, B.Y.; Ma, N.; Yang, J.; Li, Z.H.; Wang, Q.X. Extracting Features of Soil and Water Conservation Measures from Remote Sensing Images of Different Resolution Levels: Accuracy Analysis. Bull. Soil. Water Conserv. 2012, 32, 154–157. [Google Scholar]
  26. Ronneberger, O.; Fischer, P.; Brox, T. U-Net: Convolutional Networks for Biomedical Image Segmentation. In Medical Image Computing and Computer-Assisted Intervention—MICCAI 2015; Navab, N., Hornegger, J., Wells, W.M., Frangi, A.F., Eds.; Lecture Notes in Computer Science; Springer International Publishing: Cham, Switzerland, 2015; Volume 9351, pp. 234–241. ISBN 978-3-319-24573-7. [Google Scholar]
  27. Badrinarayanan, V.; Kendall, A.; Cipolla, R. Segnet: A Deep Convolutional Encoder-Decoder Architecture for Image Segmentation. IEEE Trans. Pattern Anal. Mach. Intell. 2017, 39, 2481–2495. [Google Scholar] [CrossRef] [PubMed]
  28. Zhao, H.; Shi, J.; Qi, X.; Wang, X.; Jia, J. Pyramid Scene Parsing Network. In Proceedings of the IEEE Conference on Computer Vision and Pattern Recognition, Honolulu, HI, USA, 21–26 July 2017; pp. 2881–2890. [Google Scholar]
  29. Wang, K.; Xu, C.; Li, G.; Zhang, Y.; Zheng, Y.; Sun, C. Combining Convolutional Neural Networks and Self-Attention for Fundus Diseases Identification. Sci. Rep. 2023, 13, 76. [Google Scholar] [CrossRef] [PubMed]
  30. Zhao, F.; Xiong, L.-Y.; Wang, C.; Wang, H.-R.; Wei, H.; Tang, G.-A. Terraces Mapping by Using Deep Learning Approach from Remote Sensing Images and Digital Elevation Models. Trans. GIS 2021, 25, 2438–2454. [Google Scholar] [CrossRef]
  31. Lu, Y.; Li, X.; Xin, L.; Song, H.; Wang, X. Mapping the Terraces on the Loess Plateau Based on a Deep Learning-Based Model at 1.89 m Resolution. Sci. Data 2023, 10, 115. [Google Scholar] [CrossRef] [PubMed]
  32. Ding, H.; Na, J.; Jiang, S.; Zhu, J.; Liu, K.; Fu, Y.; Li, F. Evaluation of Three Different Machine Learning Methods for Object-Based Artificial Terrace Mapping—A Case Study of the Loess Plateau, China. Remote Sens. 2021, 13, 1021. [Google Scholar] [CrossRef]
  33. Cao, B.; Yu, L.; Naipal, V.; Ciais, P.; Li, W.; Zhao, Y.; Wei, W.; Chen, D.; Liu, Z.; Gong, P. A 30 m Terrace Mapping in China Using Landsat 8 Imagery and Digital Elevation Model Based on the Google Earth Engine. Earth Syst. Sci. Data 2021, 13, 2437–2456. [Google Scholar] [CrossRef]
  34. Sun, K.; Xiao, B.; Liu, D.; Wang, J. Deep High-Resolution Representation Learning for Human Pose Estimation. In Proceedings of the IEEE/CVF Conference on Computer Vision and Pattern Recognition, Long Beach, CA, USA, 15–20 June 2019; pp. 5693–5703. [Google Scholar]
  35. LeCun, Y.; Bengio, Y.; Hinton, G. Deep Learning. Nature 2015, 521, 436–444. [Google Scholar] [CrossRef] [PubMed]
  36. Ouyang, W.; Zeng, X.; Wang, X.; Qiu, S.; Luo, P.; Tian, Y.; Li, H.; Yang, S.; Wang, Z.; Li, H. DeepID-Net: Object Detection with Deformable Part Based Convolutional Neural Networks. IEEE Trans. Pattern Anal. Mach. Intell. 2016, 39, 1320–1334. [Google Scholar] [CrossRef] [PubMed]
  37. Noh, H.; Hong, S.; Han, B. Learning Deconvolution Network for Semantic Segmentation. In Proceedings of the IEEE International Conference on Computer Vision, Santiago, Chile, 7–13 December 2015; pp. 1520–1528. [Google Scholar]
  38. Hu, K.; Zhang, D.; Xia, M. CDUNet: Cloud Detection UNet for Remote Sensing Imagery. Remote Sens. 2021, 13, 4533. [Google Scholar] [CrossRef]
  39. He, X.; Zhou, Y.; Zhao, J.; Zhang, D.; Yao, R.; Xue, Y. Swin Transformer Embedding UNet for Remote Sensing Image Semantic Segmentation. IEEE Trans. Geosci. Remote Sens. 2022, 60, 1–15. [Google Scholar] [CrossRef]
  40. Zhao, X.; Yuan, Y.; Song, M.; Ding, Y.; Lin, F.; Liang, D.; Zhang, D. Use of Unmanned Aerial Vehicle Imagery and Deep Learning UNet to Extract Rice Lodging. Sensors 2019, 19, 3859. [Google Scholar] [CrossRef]
  41. Yu, M.; Rui, X.; Xie, W.; Xu, X.; Wei, W. Research on Automatic Identification Method of Terraces on the Loess Plateau Based on Deep Transfer Learning. Remote Sens. 2022, 14, 2446. [Google Scholar] [CrossRef]
  42. Luo, L.; Li, F.; Dai, Z.; Yang, X.; Liu, W.; Fang, X. Terrace Extraction Based on Remote Sensing Images and Digital Elevation Model in the Loess Plateau, China. Earth Sci. Inform. 2020, 13, 433–446. [Google Scholar] [CrossRef]
  43. Zhu, P.; Xu, H.; Zhou, L.; Yu, P.; Zhang, L.; Liu, S. Automatic Mapping of Gully from Satellite Images Using Asymmetric Non-Local LinkNet: A Case Study in Northeast China. Int. Soil Water Conserv. Res. 2024, 12, 365–378. [Google Scholar] [CrossRef]
  44. Wang, Z.; Xin, Z.; Liao, G.; Huang, P.; Xuan, J.; Sun, Y.; Tai, Y. Land-Sea Target Detection and Recognition in SAR Image Based on Non-Local Channel Attention Network. IEEE Trans. Geosci. Remote Sens. 2022, 60, 1–16. [Google Scholar] [CrossRef]
  45. Zhu, Z.; Xu, M.; Bai, S.; Huang, T.; Bai, X. Asymmetric Non-Local Neural Networks for Semantic Segmentation. In Proceedings of the IEEE/CVF International Conference on Computer Vision (ICCV), Seoul, Republic of Korea, 27 October–2 November 2019; pp. 593–602. [Google Scholar]
  46. Liang, X.; Wang, X.; Lei, Z.; Liao, S.; Li, S.Z. Soft-Margin Softmax for Deep Classification. In Neural Information Processing; Liu, D., Xie, S., Li, Y., Zhao, D., El-Alfy, E.-S.M., Eds.; Springer International Publishing: Cham, Switzerland, 2017; pp. 413–421. [Google Scholar]
  47. Zhang, H.; Xu, H.; Tian, X.; Jiang, J.; Ma, J. Image Fusion Meets Deep Learning: A Survey and Perspective. Inf. Fusion. 2021, 76, 323–336. [Google Scholar] [CrossRef]
  48. Huang, G.; Liu, Z.; van der Maaten, L.; Weinberger, K.Q. Densely Connected Convolutional Networks. In Proceedings of the IEEE Conference on Computer Vision and Pattern Recognition (CVPR), Honolulu, HI, USA, 21–26 July 2017; pp. 4700–4708. [Google Scholar]
  49. He, K.; Zhang, X.; Ren, S.; Sun, J. Deep Residual Learning for Image Recognition. In Proceedings of the IEEE Conference on Computer Vision and Pattern Recognition (CVPR), Las Vegas, NV, USA, 27–30 June 2016; pp. 770–778. [Google Scholar]
  50. Potere, D. Horizontal Positional Accuracy of Google Earth’s High-Resolution Imagery Archive. Sensors 2008, 8, 7973–7981. [Google Scholar] [CrossRef] [PubMed]
  51. Gafurov, A.M.; Yermolayev, O.P. Automatic Gully Detection: Neural Networks and Computer Vision. Remote Sens. 2020, 12, 1743. [Google Scholar] [CrossRef]
  52. Samarin, M.; Zweifel, L.; Roth, V.; Alewell, C. Identifying Soil Erosion Processes in Alpine Grasslands on Aerial Imagery with a U-Net Convolutional Neural Network. Remote Sens. 2020, 12, 4149. [Google Scholar] [CrossRef]
  53. Srivastava, N.; Hinton, G.; Krizhevsky, A.; Sutskever, I.; Salakhutdinov, R. Dropout: A Simple Way to Prevent Neural Networks from Overfitting. J. Mach. Learn. Res. 2014, 15, 1929–1958. [Google Scholar]
  54. Ioffe, S.; Szegedy, C. Batch Normalization: Accelerating Deep Network Training by Reducing Internal Covariate Shift. In Proceedings of the International Conference on Machine Learning, Lille, France, 6–11 July 2015; pp. 448–456. [Google Scholar]
  55. Zhou, L.; Zhang, C.; Wu, M. D-LinkNet: LinkNet with Pretrained Encoder and Dilated Convolution for High Resolution Satellite Imagery Road Extraction. In Proceedings of the IEEE Conference on Computer Vision and Pattern Recognition Workshops, Salt Lake City, UT, USA, 18–23 June 2018; pp. 182–186. [Google Scholar]
  56. Wu, K.; Cai, F. Dual Attention D-LinkNet for Road Segmentation in Remote Sensing Images. In Proceedings of the 2022 IEEE 14th International Conference on Advanced Infocomm Technology (ICAIT), Chongqing, China, 8–11 July 2022; pp. 304–307. [Google Scholar]
  57. Olofsson, P.; Foody, G.M.; Herold, M.; Stehman, S.V.; Woodcock, C.E.; Wulder, M.A. Good Practices for Estimating Area and Assessing Accuracy of Land Change. Remote Sens. Environ. 2014, 148, 42–57. [Google Scholar] [CrossRef]
  58. Olofsson, P.; Foody, G.M.; Stehman, S.V.; Woodcock, C.E. Making Better Use of Accuracy Data in Land Change Studies: Estimating Accuracy and Area and Quantifying Uncertainty Using Stratified Estimation. Remote Sens. Environ. 2013, 129, 122–131. [Google Scholar] [CrossRef]
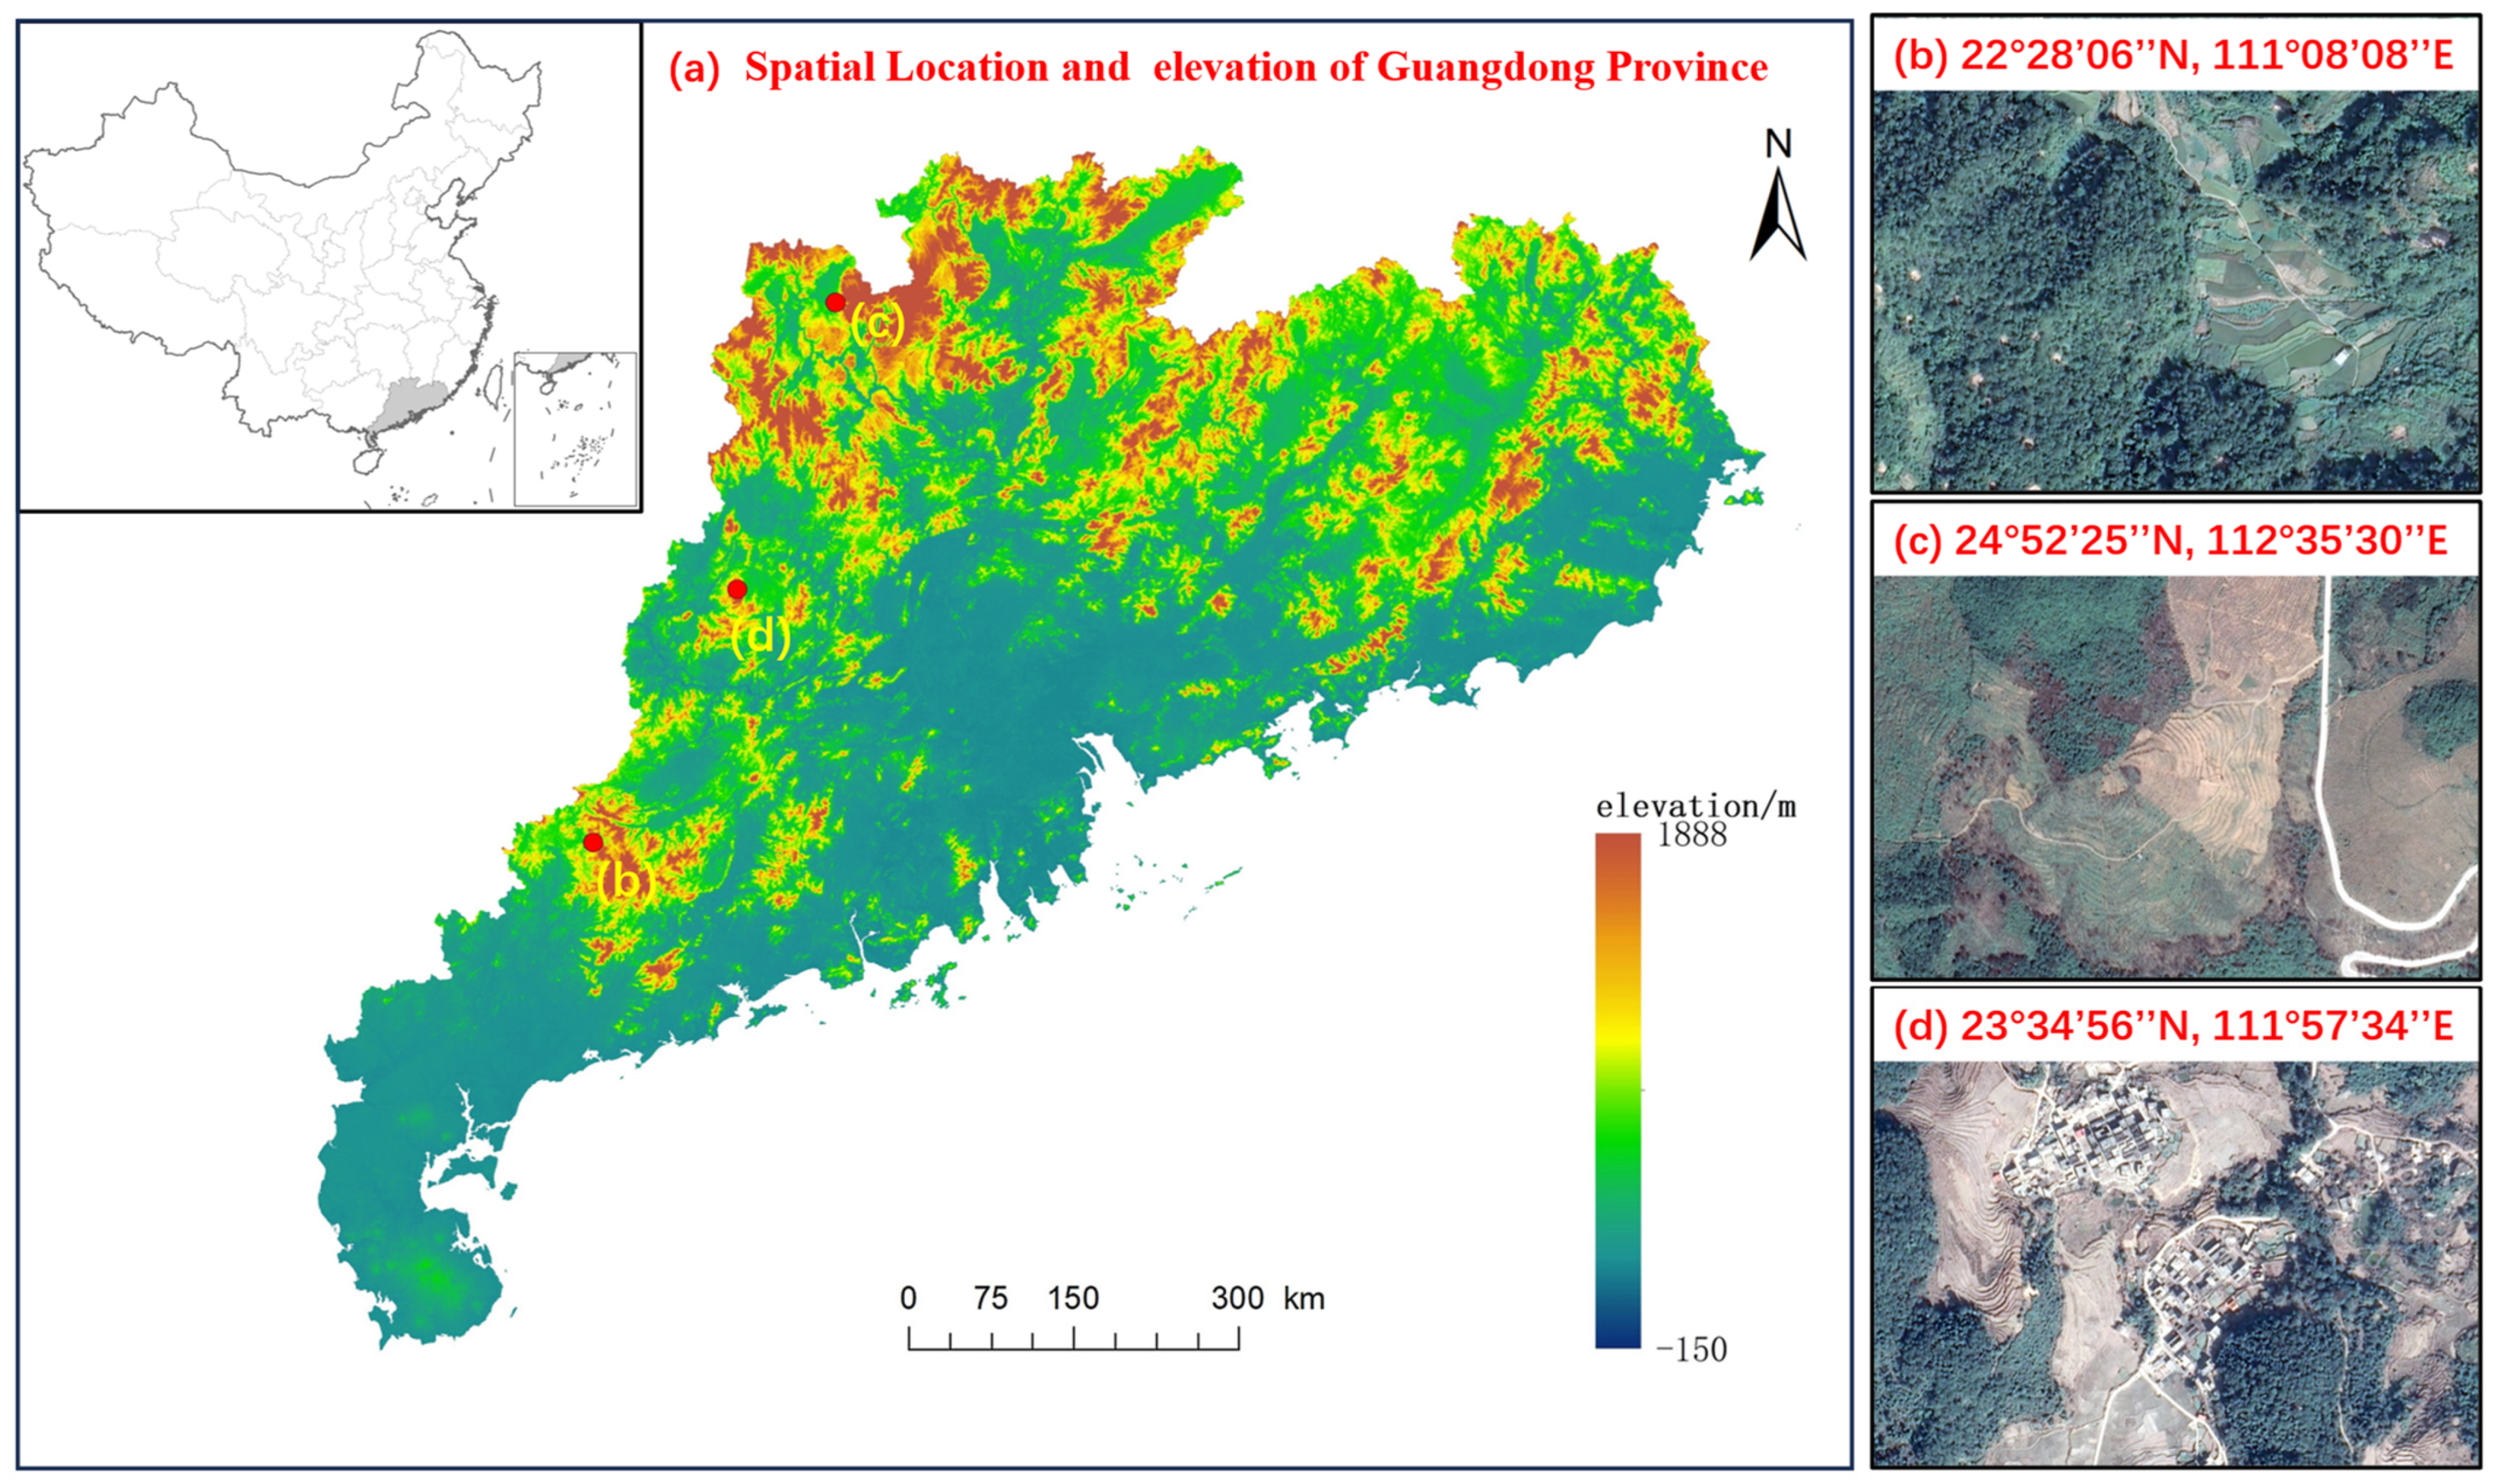
Figure 1. (a) Topographical map of Guangdong province and (bd) images of classical terrace distribution areas, including (b) a terrace in Hongguan Town, Xinyi, Maoming, Guangdong; (c) a terrace in Chaotian Town, Lianzhou, Qingyuan, Guangdong; and (d) a terrace in Tanjitou, Fengkai County, Zhaoqing, Guangdong.
Remotesensing 16 01649 g001
Figure 2. Schematic of the research workflow.
Remotesensing 16 01649 g002
Figure 3. Architecture of the NLDF-Net framework.
Remotesensing 16 01649 g003
Figure 4. Some classical examples of remote sensing images from the HRT-set: (a) rice terraces in the bare-soil stage; (b) rice terraces in the planting stage; (c) shrub terraces in the bare soil stage; (d) shrub terraces in the planting stage; (e) neat forest belts; (f) ridges and furrows; (g) fields; (h) striped roads; and (il) fragmented terraces.
Remotesensing 16 01649 g004
Figure 5. Evaluation metrics results of the comparisons with different module combination. The bolded part is the highest value for each indicator. (a) OA, precision, and recall results. (b) F1 results and corresponding t-test results, where * means 0.01 ≤ p < 0.05 and ** means p < 0.01. (c) IoU results and corresponding t-test results, where * means 0.01 ≤ p < 0.05 and ** means p < 0.01.
Remotesensing 16 01649 g005
Figure 6. Visual comparison of the terrace extraction results among different experiment groups. (a) Original images. (b) Ground truth label. (cg)Predicted labels of No-attention, Softmax-attention, Add-fusion, Concat-fusion, and NLDF-Net, respectively.
Remotesensing 16 01649 g006
Figure 7. Evaluation metrics results of the comparisons with advanced state-of-the-art deep learning models. The bolded part is the highest value for each indicator. (a) OA, precision, recall results. (b) F1 results and corresponding t-test results, where ** means p < 0.01. (c) IoU results and corresponding t-test results, where ** means p < 0.01.
Remotesensing 16 01649 g007
Figure 8. Visual comparison of the terrace extraction results with different comparison algorithms: (a) original images, (b) ground truth label, and (cg) the predicted labels of (c) PSP-Net, (d) U-Net, (e) IEU-Net, (f) D-Link, and (g) NLDF-Net.
Remotesensing 16 01649 g008
Disclaimer/Publisher’s Note: The statements, opinions and data contained in all publications are solely those of the individual author(s) and contributor(s) and not of MDPI and/or the editor(s). MDPI and/or the editor(s) disclaim responsibility for any injury to people or property resulting from any ideas, methods, instructions or products referred to in the content.