Article

Temperature Effects in AMSR2 Soil Moisture Products and Development of a Removal Method Using Data at Ascending and Descending Overpasses

by
Minjiao Lu
1,2,
Kim Oanh Hoang
1,3,* and
Agampodi Deva Thisaru Nayanathara Kumarasiri
1
1
Department of Civil and Environmental Engineering, Nagaoka University of Technology, 1603-1, Kamitomioka, Nagaoka 940-2188, Niigata, Japan
2
School of River and Ocean Engineering, Chongqing Jiaotong University, Chongqing 400016, China
3
Department of Civil Engineering, National Institute of Technology, Ishikawa College, Kitachujo, Tsubata 929-0392, Ishikawa, Japan
*
Author to whom correspondence should be addressed.
Remote Sens. 2024, 16(9), 1606; https://doi.org/10.3390/rs16091606
Submission received: 28 February 2024 / Revised: 21 April 2024 / Accepted: 25 April 2024 / Published: 30 April 2024
(This article belongs to the Topic Advances in Hydrogeological Research)

Abstract

:
Soil moisture is among the most essential variables in hydrology and earth science. Many satellite missions, such as AMSR-E/2, have been launched to observe it in broader spatial coverage to overcome the shortage of in situ observations. However, the satellite soil moisture products have been reported to comprise errors caused by the so-called “temperature effects” widely observed in dielectrically measured in situ volumetric soil water content (SWC). In this work, we confirmed the existence of these errors in AMSR2 soil moisture products. A new algorithm was developed to remove these errors using satellite data at ascending and descending overpasses. The application of this algorithm to both satellite and in situ data of SWC and soil temperature at the Mongolia site shows that the difference between SWC values at ascending and descending overpasses caused by temperature effects is effectively removed. We assess the impact of this removal method on satellite data by comparing it with in situ data, utilizing metrics such as the correlation coefficient and other widely adopted evaluation methods. It is shown that the difference between the original and corrected in situ SWC is much smaller than that between AMSR2 and in situ SWC, either corrected or not. The results indicate that the metric values between the corrected AMSR2 and in situ SWC, after removing apparent differences caused by temperature effects, slightly improved compared to those between the original AMSR2 and in situ SWC. Though these findings imply that the removed errors may not be the most dominant, considering the current significant difference between AMSR2 and in situ SWC, the removal makes the ascending and descending data have close characteristics. It may allow using data at both ascending and descending overpasses and double the temporal resolution of AMSR2 SWC data.

1. Introduction

Though soil moisture is a very tiny fraction of the total water budget (accounting for about 0.005% of whole water storage and 0.15% of the freshwater in the world), it is one of the most crucial variables for studies in the water and energy exchanges between the Earth’s surface and atmosphere [1,2,3,4]. Due to the high interaction with the atmosphere and the ground surface, soil moisture plays a significant role in developing weather patterns, including heat fluxes [5] and precipitation [6], and also in predicting extreme climate events such as drought [7,8]. Soil moisture is like a bridge between the air and the solid earth, in which water can return to the atmosphere via evaporation, infiltrate to the lower soil layers, percolate, and become groundwater or join to baseflow [9,10]. Furthermore, the energy exchange across the Earth’s surface is concurrent with these processes to create balance in the water cycle. Some studies reported that soil moisture is vital in climate change research [11,12]. Many studies have been and are currently being conducted to observe soil moisture [13,14,15,16].
As a numeric metric to express the soil moisture, volumetric soil water content (SWC) is the most widely used. Though the in situ SWC observation is known as the most precise soil moisture data, it suffers a noticeable limitation due to the spatial coverage. Although the number of soil moisture networks is increasing [17,18], more is needed to satisfy the demand. Meanwhile, extreme weather and climate events have become more frequent during the past decade [19,20]. There was an urgent need to establish techniques that satisfy soil moisture’s temporal and spatial measurements. Hence, the microwave remote sensing technique for soil moisture has been proposed to meet the need [21]. With the launching of two dedicated satellite missions, SMOS [22] and SMAP [23], along with the products from other projects such as AMSR-E/2 [24,25,26], numerous opportunities have been opened for global hydrometeorological studies.
Nonetheless, satellite-based soil moisture faces another obstacle related to accuracy. Although many efforts have been made to improve the quality of these estimations, the accuracy in some areas still needs improvement [27]. It is widely recognized that satellite soil water content data at ascending and descending overpasses have systematic differences in the values [28,29,30,31,32]. According to Hoang and Lu [33], this discrepancy is mainly caused by the difference in soil temperatures at ascending and descending overpasses, the so-called ’temperature effects’ (hereafter referred to as TEs). Though these effects were observed in dielectrically measured in situ soil moisture several decades ago [34,35,36] and various methods have been proposed to make corrections [35,37], few studies on satellite soil moisture have been carried out.
It has been reported that the TEs in satellite soil moisture are similar to their impact on in situ data and have the same physical base [28,37,38,39]. Hoang and Lu [33] checked the existence of TEs in SMAP soil moisture product and showed that the temperature dependency of the dielectric permittivity [38,40] can have significant effects on surface brightness temperature from which AMSR2 SWC is retrieved.
During the last few decades, several studies have been initiated to propose the temperature effect removal algorithms. The current algorithms can be sorted mainly into three groups, namely, data-driven approach [37,41], empirical [42,43], and mixture model-based methods [35]. However, none of these methods is dedicated to temperature correction in satellite soil moisture data. Though Hoang and Lu [33] also tried to apply Kapilaratne and Lu’s method [37,41] to remove the TEs in the SMAP SWC product, these methods require in situ data as a reference or high temporal resolution of SWC and soil temperature to calculate daily amplitudes. Modifications are necessary to apply to satellite data, which are only observed once or twice a day.
Based on Kapilaratne and Lu’s concept [37,41], a new method suitable for sun-synchronized satellite observation is developed in this study. This method is designed to remove the TEs for AMSR2 soil moisture using only the data at ascending and descending overpasses (hereafter referred to as ascending and descending data). This method is then evaluated by comparison of the differences between the soil moisture at ascending and descending overpasses before and after this removal. Also, the impact of this removal on AMSR2 soil moisture product is investigated.

2. Materials and Methods

2.1. The Review of Studies to Remove Temperature Effects

Several studies tried to determine the total TEs on soil moisture, yet the influences of diurnal changes in soil temperature on dielectric measurement of SWC still need to be eliminated. Through a detailed analysis of the data, Lu et al. [37] clarified that the diurnal amplitude of the in situ SWC is proportional to the product of the diurnal amplitude of soil temperature and the daily mean SWC, as shown in Equation (1).
A θ = α θ m A T
where A θ ( m 3 / m 3 ) and A T (°C) represent the daily amplitude of in situ SWC and soil temperature, respectively; θ m ( m 3 / m 3 ) stands for the mean in situ SWC of a day and α ( m 3 / m 3 / ° C ) is the temperature correction coefficient for in situ SWC. In the study by Kapilaratne and Lu [41], it was found that the α value varies significantly across specific regions. This variability can be attributed to the fact that soil moisture demonstrates diverse characteristics influenced by factors such as climate, soil properties, and land coverage, resulting in different dependencies on temperature.
Lu et al. [37] also introduced an expansion form for Equation (1) as a general form by assuming the apparent diurnal changes of SWC caused by the changes in soil temperature from the reference temperature.
θ θ r e f = α θ c ( T T r e f )
where T (°C) and T r e f (°C) are the actual soil temperature and reference temperature at which the sensor calibration curve was created; θ ( m 3 / m 3 ) and θ r e f ( m 3 / m 3 ) stand for measured and actual in situ SWC at T and T r e f , respectively; and θ c ( m 3 / m 3 ) represents the in situ SWC at temperature T c (°C), which is between T and T r e f . Usually, T r e f can be set to 20 °C. To make SWC correction, namely, to calculate the actual in situ SWC, Equation (3) is derived by introducing approximation θ c = θ r e f .
θ r e f = θ 1 + α ( T T r e f )
Lu et al. [37] also confirmed that 20 °C soil temperature change can lead to a 16 percent relative error in the actual in situ SWC at the Mongolia site. In order to avoid the effects of rainfall, Lu et al. [37] excluded the data of the days with significant daily rainfall amount and their subsequent days. This exclusion limits its application to soil moisture sites without rainfall observation. In 2017, Kapilaratne and Lu [41] automated their method to eliminate the requirement of in situ rainfall information.
However, estimating the temperature correction coefficient requires the daily amplitude of SWC and soil temperature, which are often difficult to obtain from satellite data. Even sun-synchronized satellites such as SMAP and AMSR2 only have two observations a day at most. Furthermore, some satellites cannot provide direct observation of the soil temperature. Hoang and Lu [33] confirmed the existence of TEs in SMAP soil moisture product and showed the possibility of making SWC correction using the in situ soil temperature and the temperature correction coefficient α estimated from in situ data. However, this solution, again, faces the limitation regarding the spatial coverage. Considering the differences in observation technology and the microwave frequencies, a new method using satellite data is expected.

2.2. The New Method to Remove TEs from AMRS2 Soil Moisture Product

Theoretically, the amplitudes in Equation (1) can be substituted by differences between data at AMSR2 ascending and descending overpasses. However, the difference in AMSR2 SWC may include changes caused by soil temperature and other physical phenomena such as evapotranspiration and soil water redistribution [33,41]. Separating these two will be crucial for developing a new TE removal algorithm.
This study investigates the relationship among three consecutive AMSR2 observations: one at descending overpass and its previous and following ascending overpasses. This sequence forms what we refer to as the previous Ascending—Descending—following Ascending relationship (ADA triple hereafter). The ADA triples of soil temperature and SWC are formed by the ratios of them at two adjacent ascending overpasses to their values at descending overpass and are calculated as follows
R θ X = θ X θ D R T X = T X + 273.15 T D + 273.15
where R expresses ratios, θ ( m 3 / m 3 ) and T (°C) denote SWC and temperature, and subscript X = A p , A f or D represents the previous ascending overpass, the following ascending overpass and the descending overpass, respectively.
The mean ratios of all ADA triples calculated from Equation (4) are displayed in Figure 1. They form two triangles (ADA triangle hereafter), one for temperature and another for SWC. In Figure 1, R θ and R T stand for the ratios of SWC and temperature of each overpass relative to their values at descending overpass, respectively. A m signifies the average value of two adjacent ascending overpasses (the previous Ascending, Ap, and the following Ascending, Af). Following this, R θ , A m and R T , A m denote the ratios between the A m values and descending data of SWC and temperature, respectively.
It is observable that the temperature ADA triangle is almost bilaterally symmetrical. The temperatures at previous and following ascending overpasses are almost identical. The SWC ADA triangle shows a decreasing trend from the previous ascending and the following ascending overpasses. Considering the TEs in SWCs at two ascending overpasses should be almost the same, the difference between SWCs at the previous ascending overpass and the following ascending overpass can be a decrease other than TEs. The average of the SWCs, θ A m , at two ascending overpasses and the SWC at descending overpass may have very close actual SWCs. Their difference is mainly caused by the difference in temperatures at ascending and descending overpasses. Based on the above analysis, we can obtain
Δ θ = α θ D , r e f Δ T θ A m = θ A p + θ A f 2 T A m = T A p + T A f 2 Δ θ = θ A m θ D Δ T = T A m T D
where θ D , r e f ( m 3 / m 3 ) expresses the actual SWC at the descending overpass; θ ( m 3 / m 3 ) and T (°C) stand for the soil water content and temperature; the subscript A and D mean ascending and descending; small subscripts p, f and m represent the words “previous”, “following” and “mean”, respectively; for instance, θ A m ( m 3 / m 3 ) denotes the mean SWC of two adjacent ascending overpasses.
By slightly changing Kapilaratne and Lu’s algorithm [37,41], the temperature correction coefficient α can be estimated using ascending and descending data only. Because θ D , r e f is unknown and needs to be calculated from α , θ D and T r e f , we estimate the α as follows.
Step 0: 
set initial θ D , r e f = ( θ A m + θ D ) / 2 ;
Step 1: 
apply the recursive regression method [41] to estimate α ;
Step 2: 
renew θ D , r e f = θ D / ( 1 + α ( T D T r e f ) ) .
By repeating steps 1 and 2, the α value will converge very quickly. In many cases, the second estimation of α is accurate enough. In step 1, linear regression and outlier removal are carried out recursively. The outlier removal removes the data points outside the confidence interval which depends on pre-assigned confidence level, γ . In this study, it is set to 0.01. Kapilaratne and Lu [41] showed this removal can effectively remove large changes caused by other factors, e.g., rainfall.
Just like the process of removing temperature effects from in situ data, the temperature correction coefficient ( α value) varies significantly across distinct regions. This variance arises from the inclusion of the vegetation factor as a crucial component within the Radiative Transfer Model utilized for satellite soil moisture retrieval, primarily depicted by land cover [44]. Consequently, the α value necessitates adjustment tailored to the characteristics of individual regions. Although the precise temporal and spatial distribution of α remains unclear, generating a global map of α can be automated by employing the ADA triangle method with AMSR2 soil moisture dataset.

2.3. The Tools Using for Evaluating New TE Removal Method on AMSR2 Soil Water Content

We evaluate the impact of temperature effect removal from three aspects. First and foremost, the visual confirmation will be conducted to examine the difference between ascending and descending AMSR2 soil moisture data of before and after the removal. Secondly, the quantitative evaluation of the impact of temperature effect removal on in situ and AMSR2 SWC datasets will be carried out. In this approach, both original and corrected AMSR2 SWC datasets are compared with original and corrected in situ SWC datasets and quantitatively evaluated by using the following metrics:
M E = 1 N t t = 1 N t ( Y 2 ( t ) Y 1 ( t ) )
M A E = 1 N t t = 1 N t Y 2 ( t ) Y 1 ( t )
R = 1 N t t = 1 N t ( Y 2 ( t ) μ 2 ) ( Y 1 ( t ) μ 1 ) σ 2 σ 1
R M S E = 1 N t t = 1 N t ( Y 2 ( t ) Y 1 ( t ) ) 2
u b R M S E = 1 N t t = 1 N t ( ( Y 2 ( t ) μ 2 ) ( Y 1 ( t ) μ 1 ) ) 2
where Y 1 and Y 2 are two variables to be compared; μ 1 , μ 1 , σ 1 and σ 2 are their mean values and standard deviations; t and N t are sequential numbers of time and the total number of the data; M E , M A E , R, R M S E and u b R M S E are mean error, mean absolute error, correlation coefficient, root mean square error and unbiased root mean square error, respectively. They are widely used to evaluate satellite soil moisture products [28,32,33]. These metrics are affected by all errors. The large errors are dominant, especially in R M S E and u b R M S E . They are used to evaluate the satellite soil moisture product’s total performance compared to the in situ ones.
In order to avoid the effects of significant errors caused by factors other than temperature, the following equation
M e d A E = m e d i a n ( Y 2 ( t ) Y 1 ( t ) )
is used to pick up the median value of absolute errors ( M e d A E ) for all data, including the outliers.
Last but not least, we will assess the influence of the TE removal basing on the difference between ascending and descending SWC data quantitatively. In this case, the absolute difference ( A D ) between θ A m and θ D is analyzed as the following equation:
A D ( t ) = θ A m ( t ) θ D ( t )
To exclude the impacts of the outlier, Equation (13) was applied to pick up the median value for all AD values ( M e d A D ) of Equation (12).
M e d A D = m e d i a n ( A D ( t ) )

2.4. Data Description

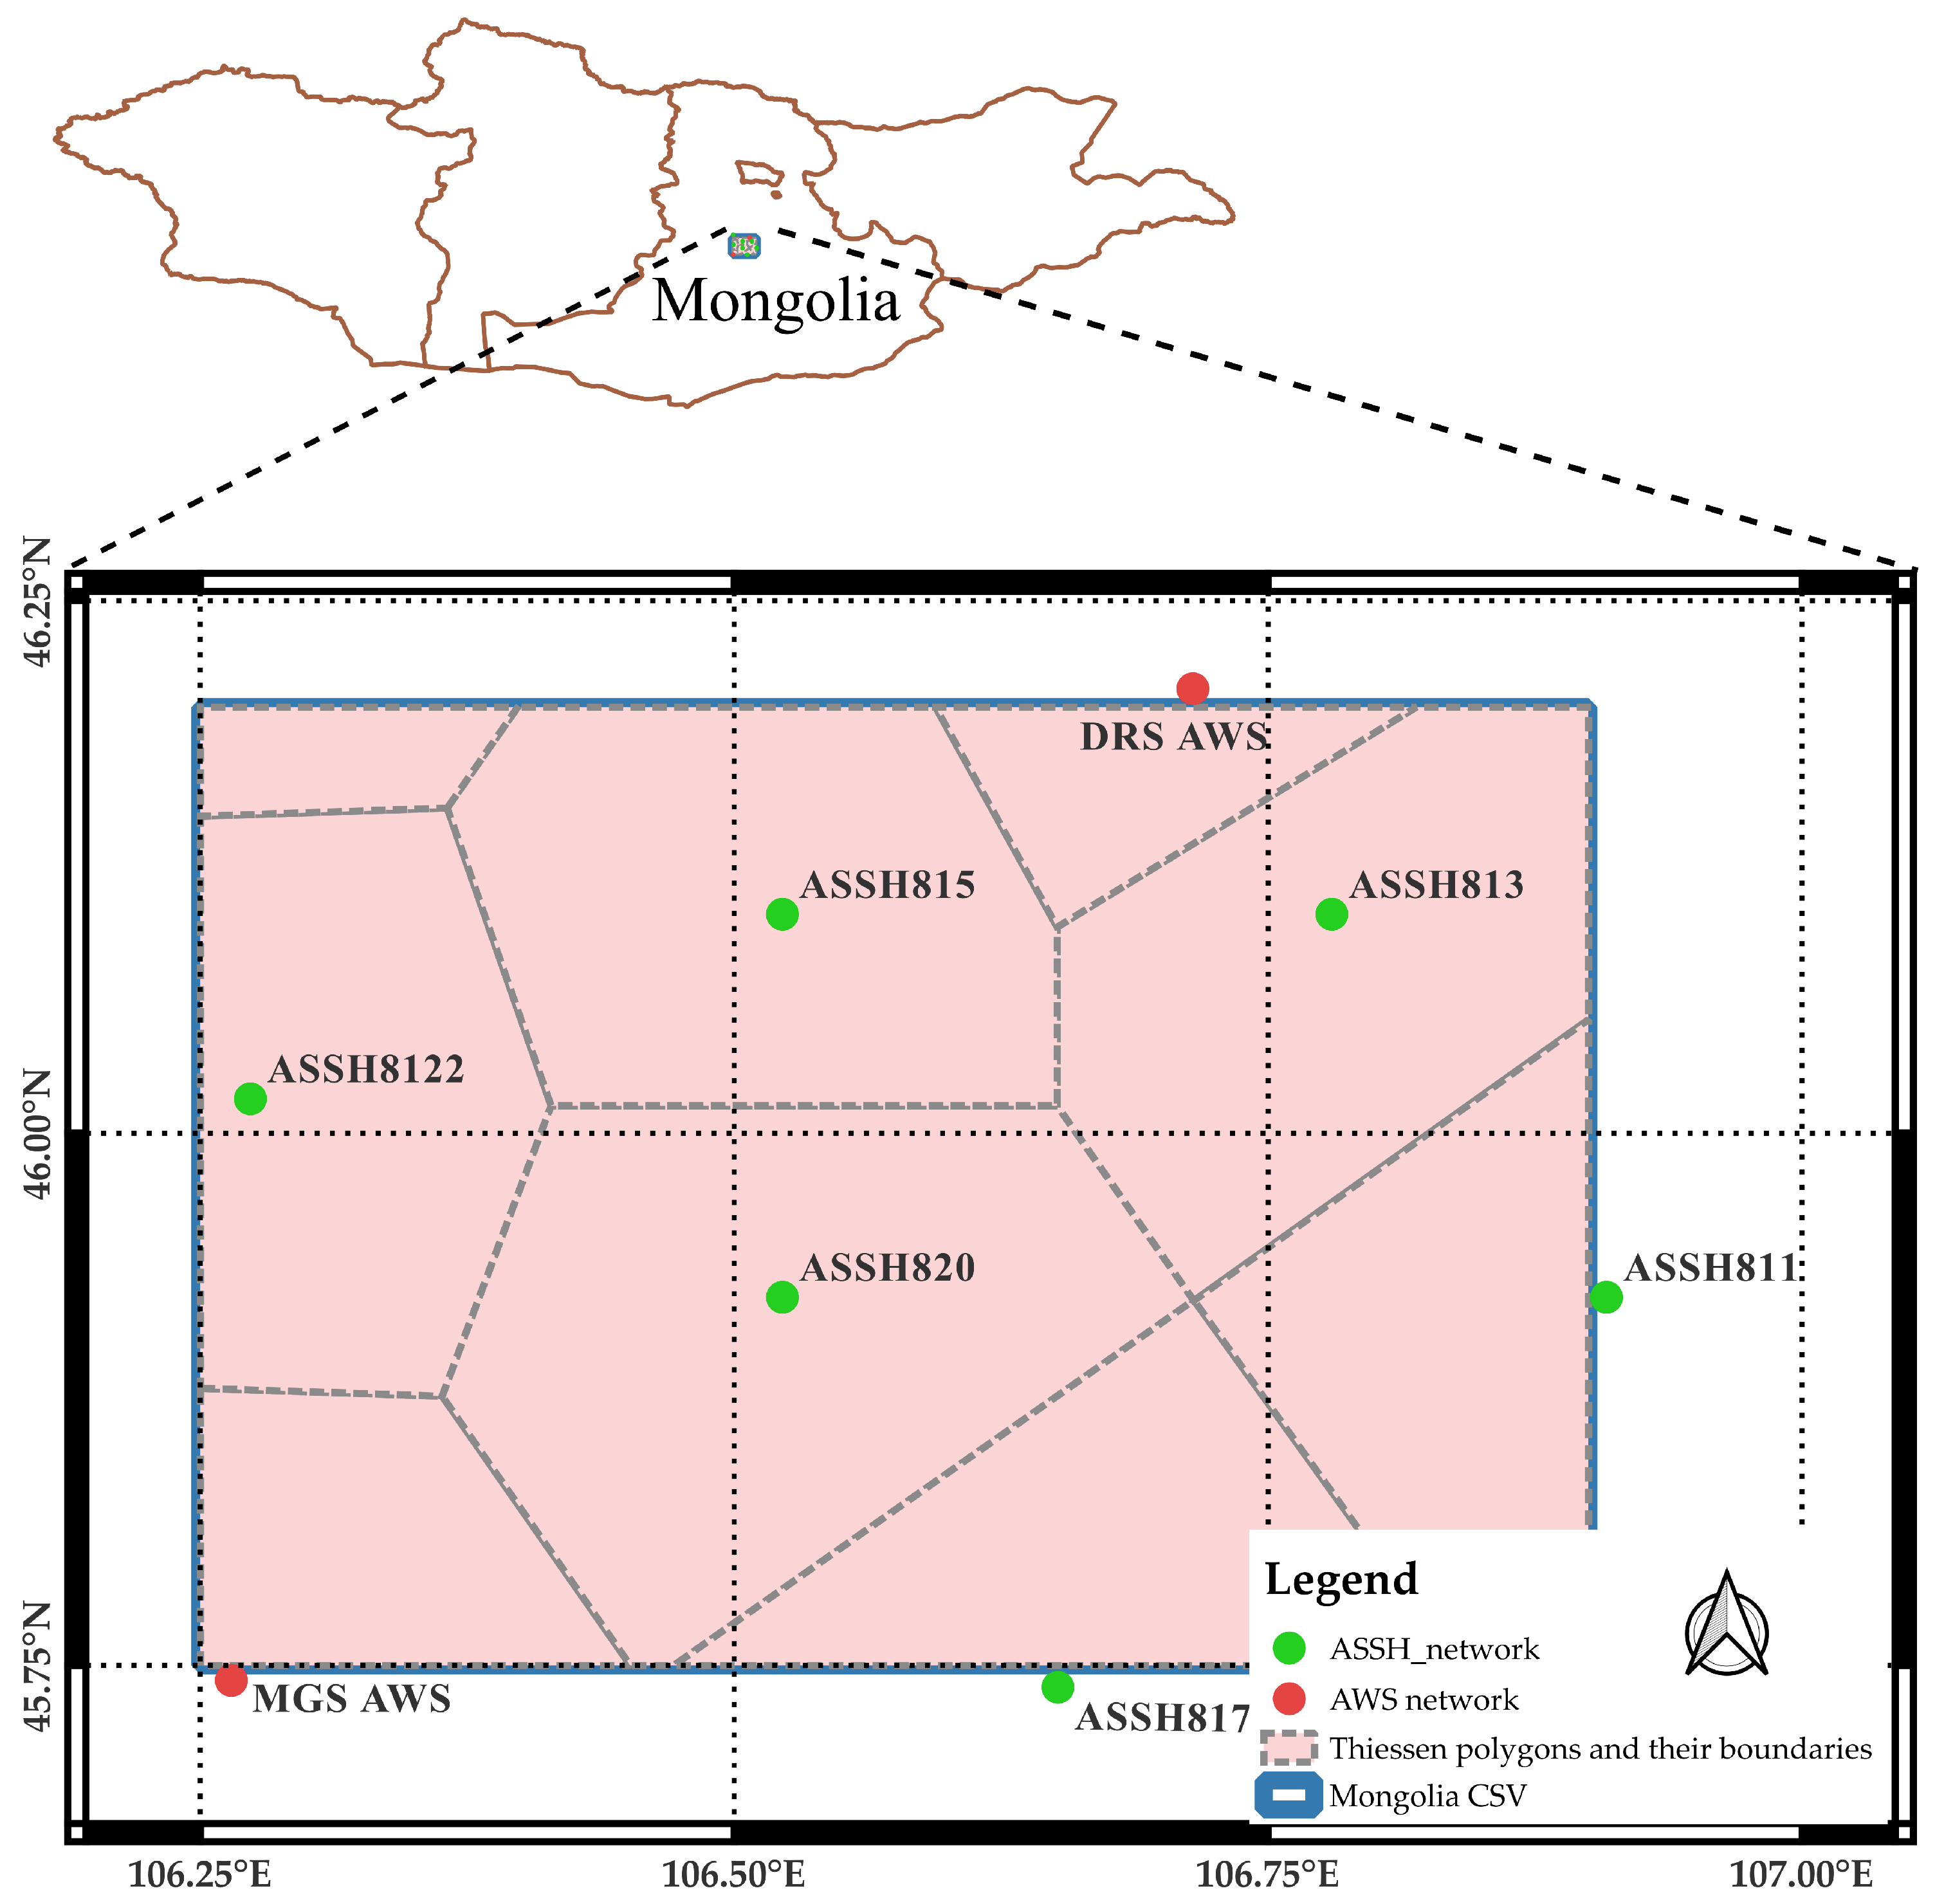
In this study, we chose the Mongolia site as a representative location to assess the effectiveness of the ADA triangle method. As a validation site maintained by The Japan Aerospace Exploration Agency (JAXA) science team, its data are widely used for calibrating and validating AMSR2 soil moisture product [30,31]. The confirmation and removal of TEs in AMSR2 soil moisture product focused on a 50 × 50 km specific target area (45.75°N, 106.9°E and 46.2°N, 106.25°E), corresponding to an AMSR2 soil moisture single pixel (refer to Figure 2) that is known as the Core Validation Site (CVS) in this study. This target area was within a more extensive study area on the Mongolian Plateau, spanning a region of 1.1° × 1.1° [30]. The study area is dominated by the cold, arid climatic (BSk) area (as sorted in the Köppen–Geiger climate classification [45]). According to Yamanaka [46], this area exhibits a fully desert climate characterized by a high Budyko’s radiative dryness index (greater than three) and low annual precipitation. Though short grass and small shrubs grow from late spring to mid-autumn, the predominant land cover is bare soil. Land use mainly consists of rangeland, interspersed with sparsely distributed ephemeral ponds and small towns. Soil types are predominantly sandy loam or sandy silt loam with abundant gravel. It is noted that soil-hydraulic properties play a significant role in regulating the soil moisture patterns in the Mongolia CVS area [30]. The topography of this site is primarily flat, with an elevation from 1300 m to 1500 m [30].

2.4.1. In Situ Data

Based on data availability and quality of all months at all stations, we chose nine stations from four AWSs and twelve ASSHs for analysis from 5 September 2016 to 31 October 2019. These selected stations have successfully observed the essential elements of meteorology and soil moisture for the Coordinated Enhanced Observing Period (CEOP) and several projects, e.g., the ADEOS-II Mongolian Plateau Experiment (AMPEX) for ground truth and the Mongol AMSR/AMSR-E/ALOS Validation Experiment (MAVEX). During the installation process, particular attention was paid to ensuring that each station represents the surrounding geomorphological and vegetation conditions [30,31]. The Global Change Observation Mission (GCOM) website of JAXA provides the in situ database for this study (https://suzaku.eorc.jaxa.jp/GCOM/insitu/index.html, accessed on 31 July 2023). For analysis, we accessed this website and downloaded the necessary data. The details of selected stations at the Mongolia site are displayed in Table 1 and Figure 2. As shown in Table 1, this site comprises two automatic weather stations (AWSs) and seven automatic stations for soil hydrology (ASSHs). The AWSs monitor important meteorological parameters and soil moisture readings at 30 min intervals at depths of 3 cm, 10 cm, and 40 cm for all stations. The ASSHs, on the other hand, measure soil moisture and soil temperature every two hours at depths of 3 and 10 cm. Before installation, all sensors used at AWSs are calibrated and verified against a reference marker and the Japanese Meteorological Agency standard in a laboratory setting [30]. Soil moisture sensors are the TDR sensors inserted horizontally. Further details of AWS and ASSH networks can be found in [30].
Considering the penetration depth of the microwave, this study used soil water content ( θ I n S i t u ) and temperature ( T S ) observed at 3-centimeter depth. We resampled the data of AWSs to generate a bi-hourly dataset. Then, the areal average values over the CVS are calculated from this dataset by using the Thiessen polygon method as follows:
V ¯ = i = 1 N s w i V i
S V = i = 1 N s w i ( V i V ¯ ) 2
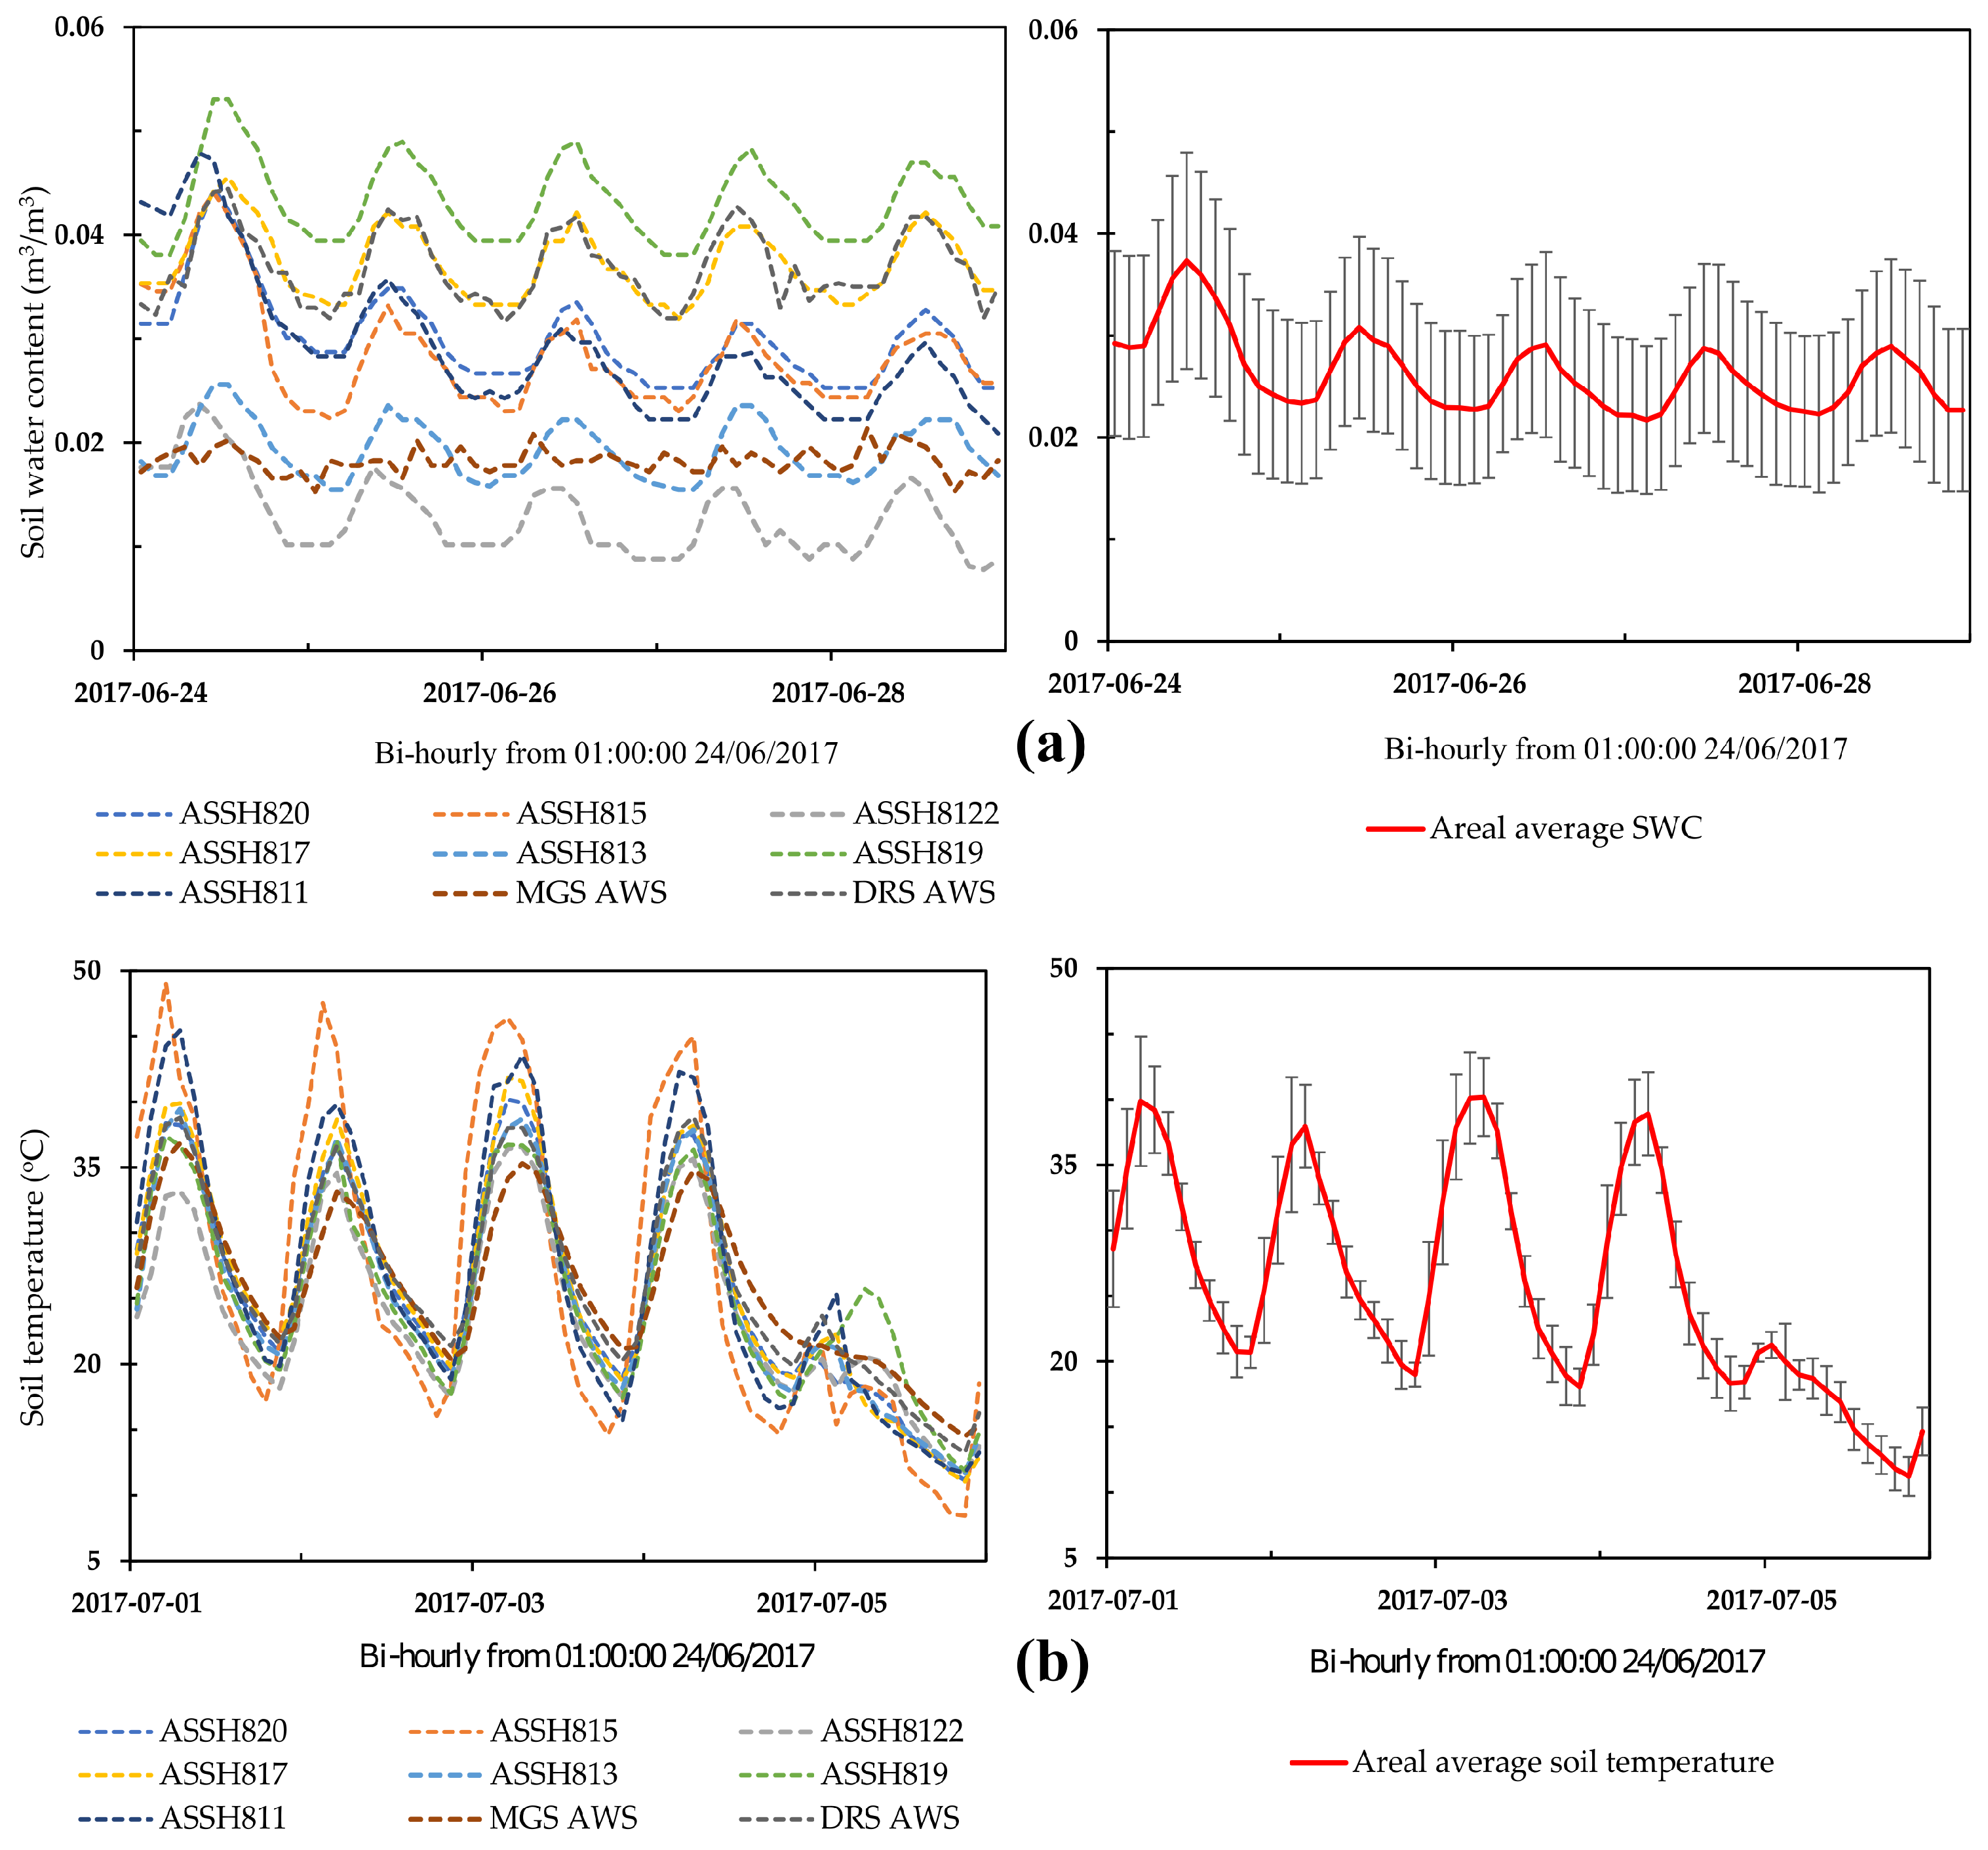
where N s is the number of stations; V is the variable to be averaged; V ¯ is the average value; and w is the Thiessen weight, and i = 1 N s w i = 1 . The CVS and Thiessen polygons are shown in Figure 2 and the Thiessen weights are displayed in Table 1. This study will compare the average SWC with the satellite data over the CVS. Over the study period, the long-term averages of V ¯ and S V of the SWC are 0.0624 m 3 / m 3 and 0.0160 m 3 / m 3 , respectively. The variability among nine stations and their deviation from the areal average values is illustrated in Figure 3 over a period of five days, showcasing both temporal and spatial fluctuations in the Mongolia CVS dataset. Figure 3a displays the soil water content values, while Figure 3b represents the soil temperature readings. On the left side of Figure 3 are the observed values, while on the right side are their corresponding areal averages and standard deviations.
Also, a pseudo-satellite dataset was made by picking up data closest to the ascending and descending overpasses of AMSR2 (13:30 and 1:30 local time, respectively). This is a test bed for developing the algorithm to remove TEs. In many cases, especially the cases comparing with AMSR2 data, this pseudo-satellite dataset is simply referred to as in situ dataset.

2.4.2. Satellite Data

AMSR2 level 2 (L2) soil moisture content (SMC) product was used in this study. AMSR2, part of the Global Change Observation Mission 1—Water (GCOM-W1), was launched by the Japan Aerospace Exploration Agency (JAXA) in May 2012. Starting from August 2012, data from AMSR2 became accessible [24,32]. They can be accessed through the website https://gportal.jaxa.jp/gpr/?lang=en (accessed on 30 July 2023). The JAXA Earth Observation Research Center (EORC) provides soil moisture product derived from AMSR2. This product is retrieved from brightness temperature data observed at ascending and descending orbits [29]. The ascending and descending overpasses are about 13:30 and 1:30 local time, respectively. The spatial resolution is about 50 kilometers. The soil water content from the JAXA SMC product is referred to as AMSR2 SWC ( θ A M S R 2 ).
In order to confirm the possibility of removing TEs using satellite data only, the AMSR2 level 2 (L2) land surface temperature (LST) product is also used. This is called AMSR2 surface temperature ( T S F ).

3. Results

3.1. The Existence of Temperature Effects

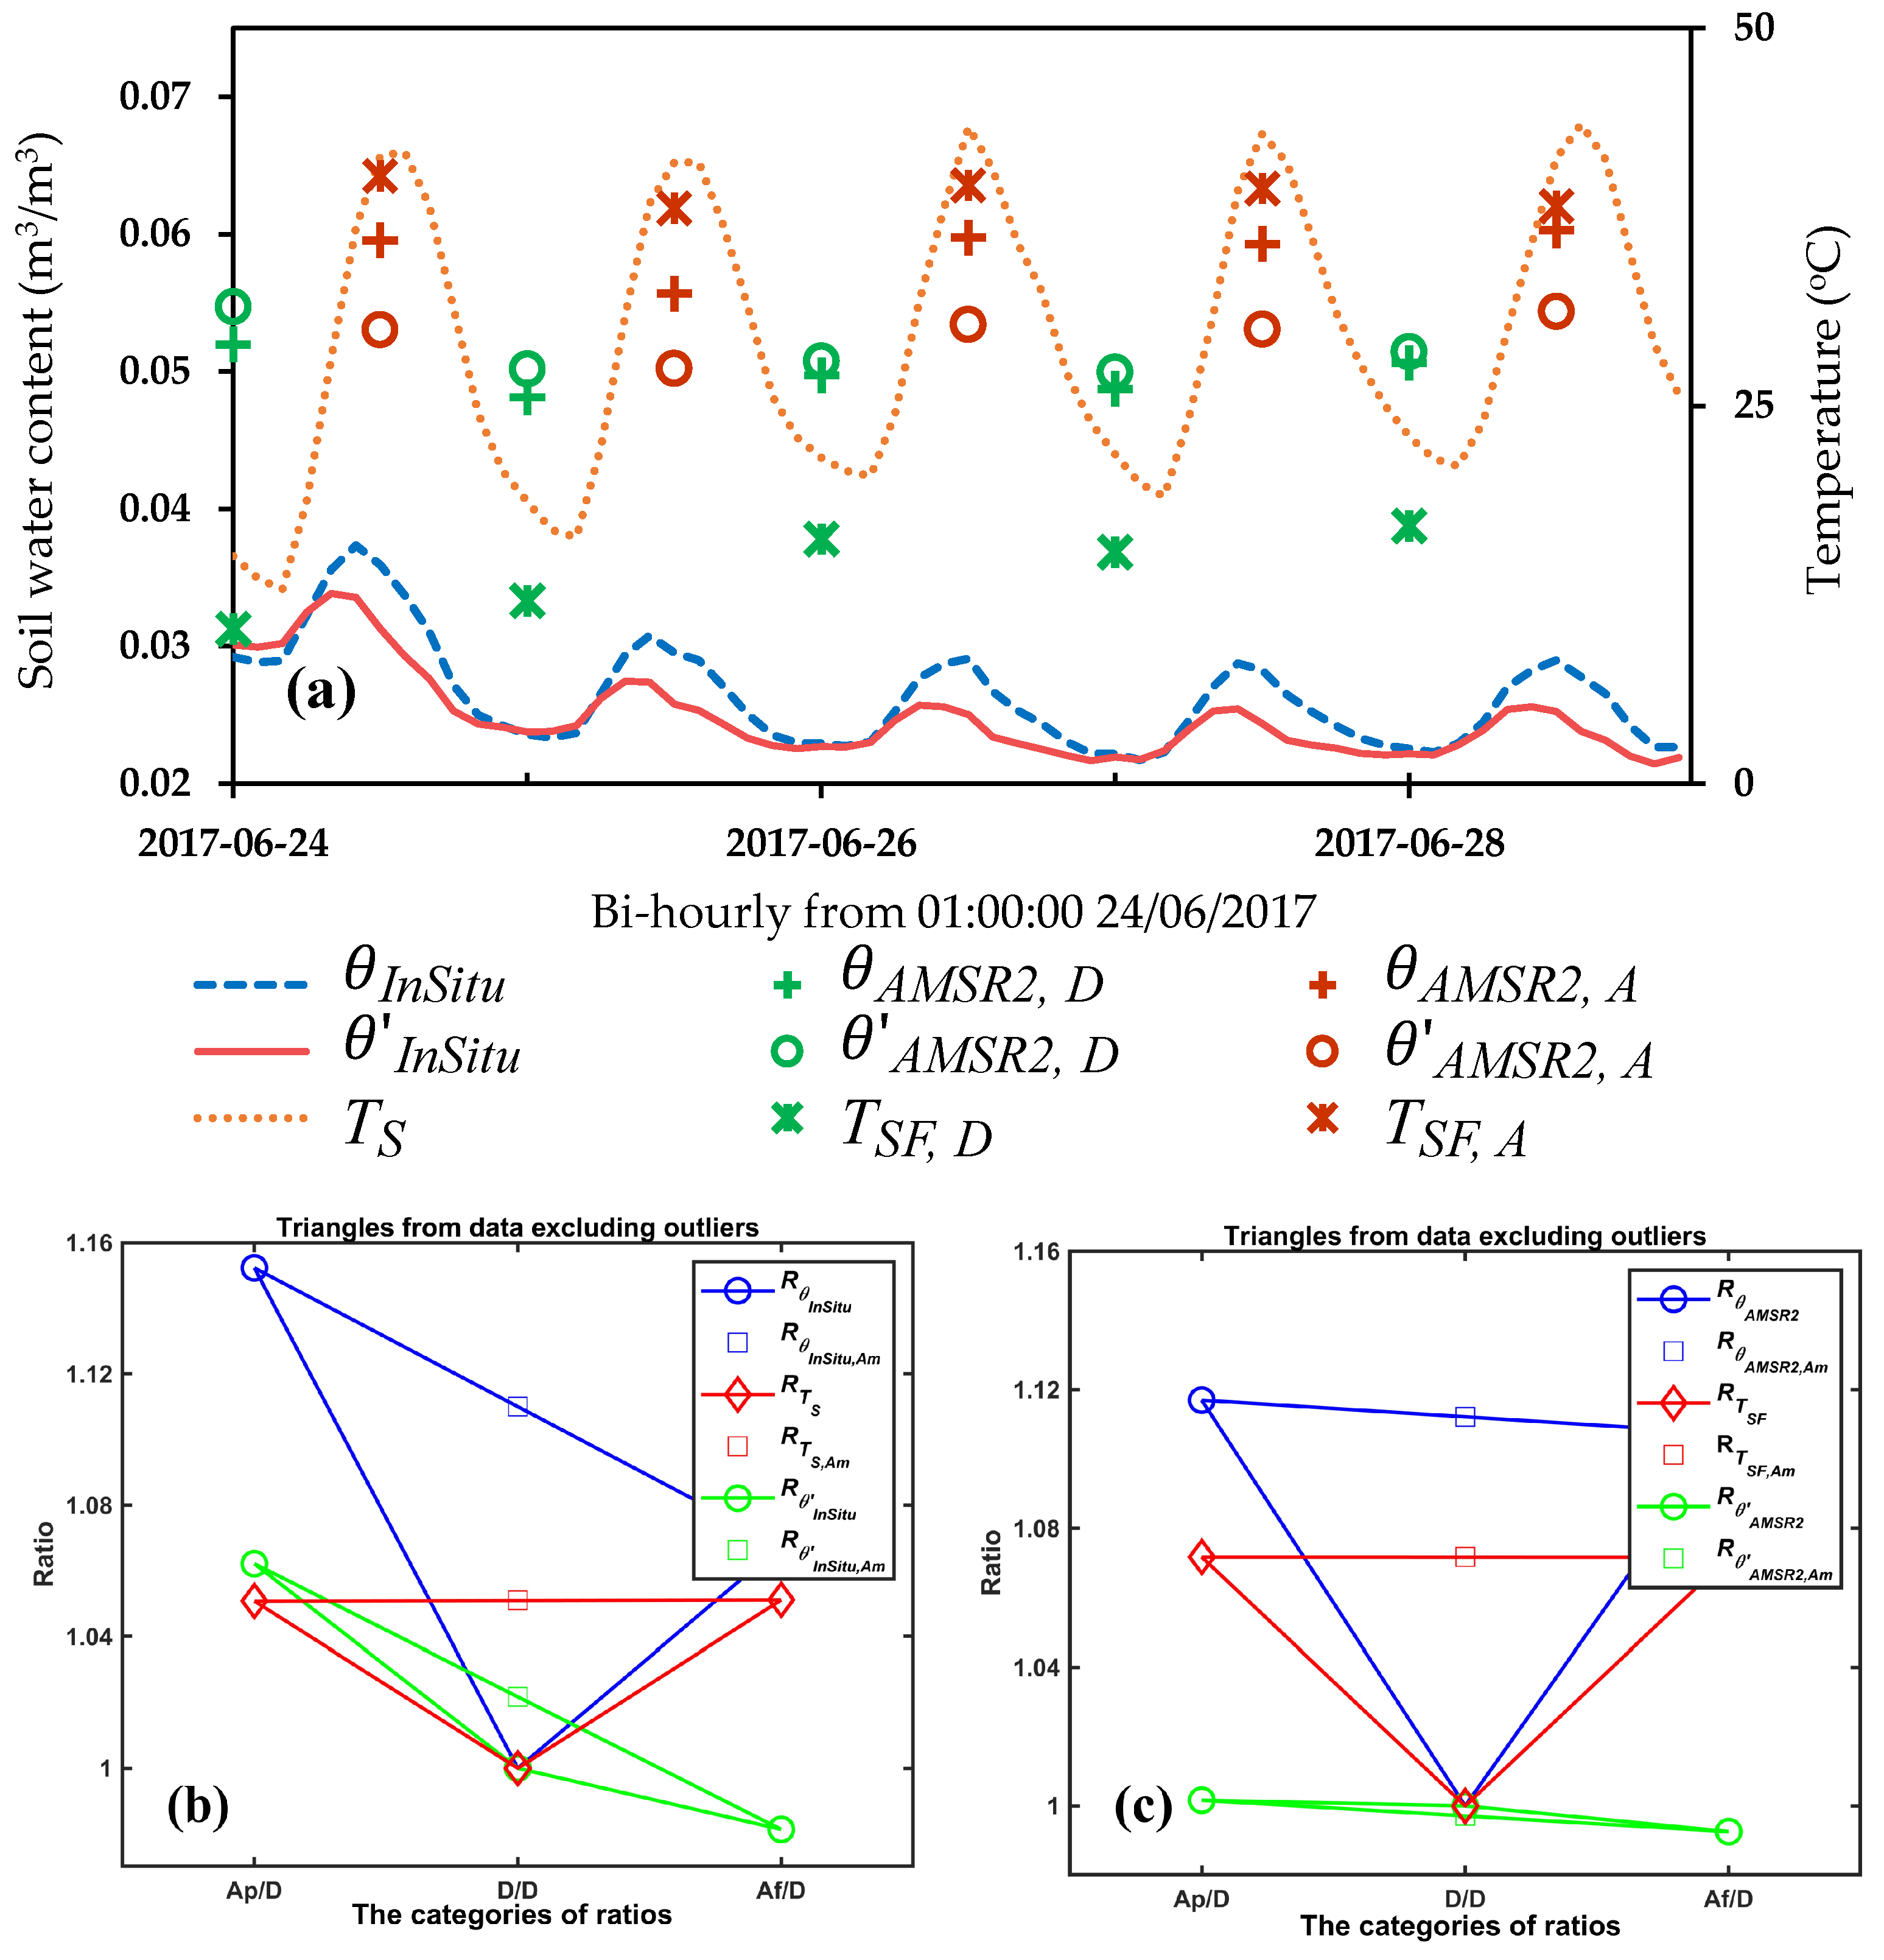
Figure 4a shows bi-hourly in situ soil temperature and SWC, and AMSR2 SWC and AMSR2 surface temperature from 24 June 2017 to 28 June 2017, picked up from the whole study period. The in situ SWC, namely the TDR sensor reading and AMSR2 SWC, shows diurnal changes almost synchronized with the soil temperature. These diurnal changes differ from the ones caused by evaporation [47] because evaporation usually reduces the daytime SWC. Kapilaratne and Lu [48] also showed an opposite diurnal change in SWC to the potential evaporation. This phenomenon implies that TEs exist in both the in situ SWC and AMSR2 SWC and are more dominant than changes caused by evaporation.
Figure 4b shows the ADA triangles made from the pseudo-satellite dataset made from the whole in situ dataset, and Figure 4c is the ADA triangles made from AMSR2 SWC and surface temperature. The two ADA triangles of temperature are almost bilaterally symmetrical. The ADA triangle of AMSR2 surface temperature has a more significant difference between ascending and descending overpasses than in situ soil temperature. This trend may reflect the difference between these two temperatures: the in situ temperature is observed at a depth of 3 cm and AMSR2 surface temperature is land surface temperature derived from AMSR2 brightness temperature [49]. The two SWC ADA triangles show decreasing trends of SWCs from the previous ascending overpass to the following one. Considering the temperatures at the two adjacent ascending times are almost the same, this declination may not be caused by temperature. Recognizing the difference between the averaged ascending SWC and the descending SWC as TEs is reasonable. TEs in in situ SWC are more significant than those in AMSR2 SWC. Based on these observations, applying the removal algorithm to these datasets is highly possible.

3.2. Results of the Removal Algorithm

Figure 5 shows the results of the removal algorithm applied to the in situ dataset and AMSR2 dataset. Both are the results of the second round application of the recursive regression. The blue dots are original data; the red circles are data points outside the upper and lower bounds of the 99% confidence interval and are excluded as outliers in the recursive regression [41]. Among many possible reasons for these outliers, rainfall may be the most obvious one. A meaningful rainfall before the descending overpass may increase θ D and make the data below the confidence interval’s lower bound.
On the other hand, the rainfall before the following ascending overpass will increase θ A m and make the data lie above the average of the upper bound. The temperature effect coefficients are 0.0060 and 0.0054, respectively. As mentioned in the previous subsection, the TEs in in situ data are more significant than those in AMSR2. These values mean that a 20 °C temperature change may cause 12.0 percent and 10.8 percent apparent relative error in in situ and AMSR2 SWC, respectively.

3.3. Evaluation of the Impact of Temperature Effect Removal

3.3.1. Visual Confirmation of the Impact of Temperature Effect Removal on the Difference between the Data from Ascending and Descending Overpasses

Figure 6 displays part of the time series of the in situ SWC and AMSR2 SWC ( θ I n S i t u and θ A M S R 2 ) before and after correction (indicated by a superscript prime), and ADA triangles of in situ data and AMSR2 data without outliers. In Figure 6a, the SWCs at ascending overpass from 24 July 2023 to 28 July 2017 become closer to that at descending overpass after removing the TEs. The green lines in Figure 6b,c show the ADA triangles of the in situ SWC and the AMSR2 SWC, respectively, after applying the TE removal. It is observable that the TEs in the original ADA triangles are reduced, revealing that the distances between θ A m and θ D have become smaller. Moreover, the differences between the previous and following ascending overpasses are nearly unchanged. This result means the new removal algorithm can remove TEs and conserve the SWC declination caused by other factors.

3.3.2. Quantitative Evaluation of the Impact of Temperature Effect Removal on In Situ and AMSR2 SWC Datasets

By applying the newly developed temperature removal algorithm, corrected in situ and AMSR2 SWC ( θ I n S i t u and θ A M S R 2 ) datasets are derived. These datasets will undergo analysis using five metrics outlined in Section 2.3 to examine the relationship between four pairs as follows:
  • Original in situ SWC ( θ I n S i t u ) and corrected in situ SWC ( θ I n S i t u );
  • Original AMSR2 SWC ( θ A M S R 2 ) and original in situ SWC ( θ I n S i t u );
  • Original AMSR2 SWC ( θ A M S R 2 ) and corrected in situ SWC ( θ I n S i t u );
  • Corrected AMSR2 SWC ( θ A M S R 2 ) and corrected in situ SWC ( θ I n S i t u ).
Table 2 displays the values of the quantitative metrics of averaged data of the ascending data and descending overpasses in the following four pairs of the original and corrected AMSR2 and in situ SWC products from September 2016 to October 2019.
The first pair is used to check the impact of TE removal, namely data correction on in situ data and the ground truth in satellite SWC evaluation. The metric values showed that this pair has a much smaller difference than the other three pairs of AMSR2 and in situ SWC data. This result implies that the direct impacts of TE removal on soil moisture products will be limited. The other three pairs give metric values similar to other evaluation studies (for example, [28,32,33]). Their metric values show relatively significant differences between AMSR2 and in situ SWC data, indicating the need to improve the retrieval algorithm.
However, there are still differences worth noting. The metric values of the averaged ascending data in the second pair are much worse than those of the data at the descending overpass. This means that the descending retrievals would be more stable than the ascending because the effects of variations in both the spatial and profile variability of AMSR2 surface temperature are relatively small [28]. In the other two pairs, the corrected in situ data are compared with AMSR2 data before and after correction. Given the relatively small difference between original and corrected in situ SWCs, these two pairs show values of all metrics similar to those of the original in situ and AMSR2 SWC.
The fourth pair, corrected AMSR2 and in situ SWC, is considered a potential pair for the evaluation of satellite soil moisture products because errors caused by TEs are apparent and do not physically exist. Though the difference is insignificant, it is compared to the pair of the original AMSR2 and the in situ SWC in detail. After correction, M E values are improved for both ascending and descending data. These values indicate the overestimation of AMSR2 SWC reduced by 5.4 percent and 9.2 percent for ascending and descending data, respectively. For the other four metrics, M A E , R, R M S E and u b R M S E , the values are improved by 4.1 percent, 20.7 percent, 3.7 percent and 3.5 percent for ascending data, and worsened by 4.6 percent, 2.4 percent, 3.8 percent and 4.3 percent for descending data. For the most commonly used metric, R, the improvement in the ascending data is more significant than the worsening in the descending data.
In addition to the averaged ascending and descending data, Table 3 also shows the M e d A E values of the previous and following ascending data. Compared to M A E s, all M e d A E s are much smaller because the effects of significant absolute errors are excluded. Like the other five metrics, M e d A E s are improved in ascending data and worsened in descending data.

3.3.3. Quantitative Evaluation of the Impact of Temperature Effect Removal on the Difference between Ascending and Descending SWC

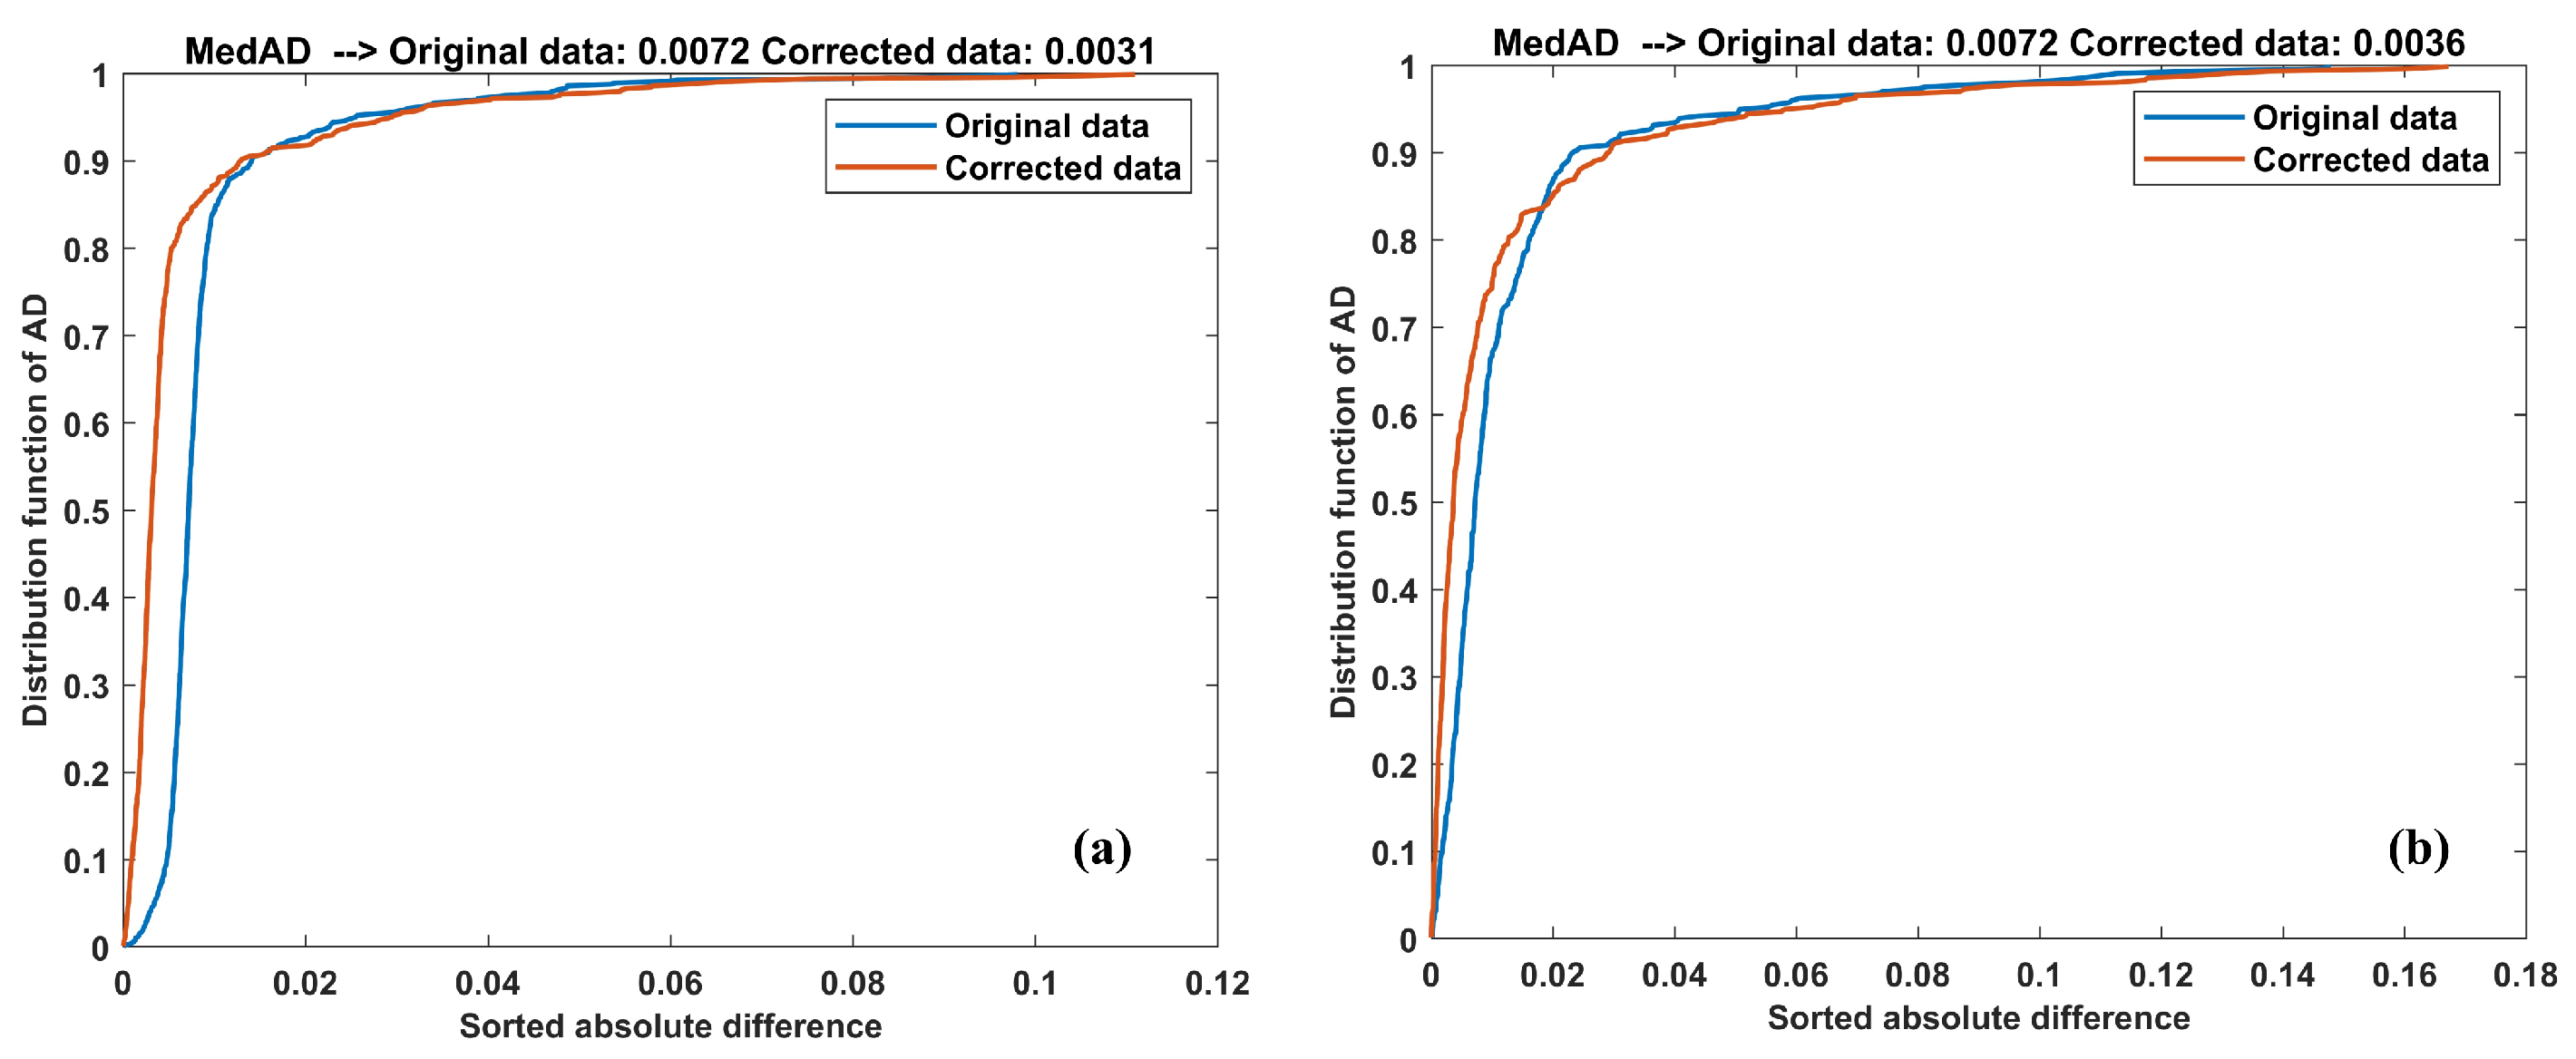
In order to evaluate the impact of temperature effect removal on the difference between ascending and descending SWC, the absolute difference between θ A m and θ D is analyzed using Equation (12). Figure 7 shows the accumulated distribution functions of the absolute difference between θ A m and θ D of the in situ (Figure 7a) and AMSR2 SWC (Figure 7b). Clearly, the low part of the accumulated distribution functions moved left after the TE removal. For both the in situ and AMSR2 SWC, more than 80% of the absolute differences become smaller.
Equation (13) is further utilized to determine the median value across all datasets. Employing this approach helps mitigate the influence of outliers mainly attributed to rainfall factors, enabling a more comprehensive assessment of the efficacy of TE removal on data affected by TEs. For the in situ SWC, the median value of the absolute difference between ascending and descending data was reduced from 0.0072 to 0.0031. For AMSR2 SWC, the same value was reduced from 0.0072 to 0.0036. Both reductions are almost half.

4. Discussion

This study confirmed that temperature effects exist in AMSR2 SWC product as well as in dielectrically measured in situ SWC [37] and SMAP SWC product [33] by visual inspection of time series of SWC and temperature and analysis of ADA triangles. The ascending and descending AMSR2 SWC data show diurnal fluctuation synchronized with AMSR2 surface temperature. The ascending SWC data in the daytime are more significant affected by the surface temperature than the descending nighttime ones. Similar to dielectrically measured in situ SWC and SMAP SWC products, this phenomenon can be considered as an apparent diurnal change caused by temperature effects because it cannot be reasonably explained by other physical factors, such as evapotranspiration [47,48].
The analysis of ADA triangles makes it possible to identify the contribution of temperature effects in the differences between ascending and descending SWC data. Then, a new temperature effect removal algorithm suitable for satellite SWC products, which only have two observations at ascending and descending overpasses, is designed following Kapilaratne and Lu’s concepts [37,41]. The application of this new algorithm proves itself capable of reducing the differences between ascending and descending SWC data in both the AMSR2 product and the in situ SWC dataset using observations at satellite overpasses. Furthermore, the ADA triangles after TE removal represent very close slopes between the previous and following ascending data, implying that the new algorithm mainly removes TEs while conserving the SWC declination caused by other factors. This algorithm can effectively remove TEs using data observed at the ascending and descending overpasses only.
The impacts of the newly developed TE removal algorithm on AMSR2 and in situ SWC are then evaluated using corrected and original data. Besides the widely used mean error, mean absolute error, correlation coefficient, root mean square error and unbiased root mean square error, the median absolute error is introduced to evaluate the differences between original and corrected SWC data without the effects of significant errors caused by factors other than temperature. It is shown that the differences between in situ and AMSR2 SWC, corrected or not, are much larger than those between original and corrected in situ SWC data. Though the relative importance of TE removal may increase while AMSR2 SWC improves and its difference with the in situ SWC narrows, the impact of TE removal is currently limited.
Though the difference is insignificant, a detailed comparison between the original SWC pair and the corrected SWC pair is made because the latter is considered a potential pair capable of excluding apparent errors caused by TEs in evaluating satellite soil moisture products. After correction, M E values showing the retrieval bias are improved for ascending and descending data. The other five metrics, M e d A E , M A E , R, R M S E and u b R M S E , present a significant improvement in the ascending data and a slight worsening in the descending data.
Finally, the absolute difference between a descending SWC and the average of its two adjacent ascending SWCs is analyzed. It shows that the low part of the accumulated distribution functions of the absolute difference of the in situ and AMSR2 SWC moved leftward after TE removal. The median absolute differences of absolute differences in AMSR2 and in situ SWC are almost half. More than 80 percent of data points reduced the absolute difference between ascending and descending data. This reduction denotes that the ascending and descending data of AMSR2 and the in situ SWC become more homogenous after TE removal. This result may allow using both ascending and descending data and double the temporal resolution of AMSR2 SWC data.

5. Conclusions

The findings of this study mark a significant milestone in our understanding of the Advanced Microwave Scanning Radiometer 2 (AMSR2) soil moisture products. Firstly, our research confirms the presence of TEs in these datasets, aligning with previous studies that have identified TEs in SMAP soil water content data. Additionally, we have successfully devised a novel method for removing these effects from AMSR2 soil water content, marking the first instance of such a solution being developed. Our results indicate a modest improvement in the relationship between AMSR2 and in situ soil water content following the application of our correction method. While it is worth noting that the errors attributed to TEs may not be the predominant factor contributing to the observed differences between AMSR2 and in situ soil water content, our correction method nonetheless brings the ascending and descending data into closer alignment. Consequently, this enhancement allows for the combined utilization of both ascending and descending data, effectively doubling the temporal resolution of AMSR2 soil water content data for future research endeavors.

Author Contributions

Conceptualization, M.L. and K.O.H.; methodology, M.L. and K.O.H.; software, M.L.; validation, M.L., K.O.H. and A.D.T.N.K.; formal analysis, K.O.H. and A.D.T.N.K.; investigation, K.O.H. and A.D.T.N.K.; resources, M.L.; data curation, K.O.H. and A.D.T.N.K.; writing—original draft preparation, K.O.H. and A.D.T.N.K.; writing—review and editing, M.L., K.O.H. and A.D.T.N.K.; visualization, M.L., K.O.H. and A.D.T.N.K.; supervision, M.L.; project administration, M.L.; funding acquisition, M.L. All authors have read and agreed to the published version of the manuscript.

Funding

This study is supported by JAXA as a joint research project between JAXA and Nagaoka University of Technology (ER3AMF122) under the 3rd Earth Observation Research Announcement for the period 2022–2023.

Data Availability Statement

The data presented in this study are openly available at The Global Change Observation Mission (GCOM) website of JAXA (https://suzaku.eorc.jaxa.jp/GCOM/insitu/index.html, accessed on 31 July 2023) and the website https://gportal.jaxa.jp/gpr/?lang=en (accessed on 30 July 2023).

Conflicts of Interest

The authors declare no conflicts of interest.

Abbreviations

The following abbreviations are used in this manuscript:
ADAAscending Previous—Descending—Ascending Following
AMPEXThe ADEOS-II Mongolian Plateau EXperiment
AMSRThe Advanced Microwave Scanning Radiometer
AMSR-EThe Advanced Microwave Scanning Radiometer for Earth Observing System
AMSR2The Advanced Microwave Scanning Radiometer 2
ASSHsAutomatic Stations for Soil Hydrology
AWSsAutomatic Weather Stations
CEOPThe Coordinated Enhanced Observing Period
CVSCore Validation Site
EORCThe JAXA Earth Observation Research Center
GCOMThe Global Change Observation Mission
GCOM-W1The Global Change Observation Mission 1—Water
JAXAThe Japan Aerospace Exploration Agency
LSTLand Surface Temperature
MAVEXThe Mongol AMSR/AMSR-E/ALOS Validation EXperiment
SMAPThe Soil Moisture Active Passive Mission
SMCSoil Moisture Content
SMOSThe Soil Moisture and Ocean Salinity Mission
SWCSoil Water Content
TDRTime Domain Reflectometry
TEsTemperature Effects

References

  1. Mahfouf, J.F.F.; Richard, E.; Mascart, P. The influence of soil and vegetation on the development of mesoscale circulations. J. Appl. Meteorol. Climatol. 1987, 26, 1483–1495. [Google Scholar] [CrossRef]
  2. Entekhabi, D.; Rodriguez-Iturbe, I.; Castelli, F. Mutual interaction of soil moisture state and atmospheric processes. J. Hydrol. 1996, 184, 3–17. [Google Scholar] [CrossRef]
  3. Dobriyal, P.; Qureshi, A.; Badola, R.; Hussain, S.A. A review of the methods available for estimating soil moisture and its implications for water resource management. J. Hydrol. 2012, 458–459, 110–117. [Google Scholar] [CrossRef]
  4. Pang, Z.; Qin, X.; Jiang, W.; Fu, J.; Yang, K.; Lu, J.; Qu, W.; Li, L.; Li, X. The review of soil moisture multi-scale verification methods. ISPRS Ann. Photogramm. Remote. Sens. Spat. Inf. Sci. 2020, 5, 395–399. [Google Scholar] [CrossRef]
  5. Seneviratne, S.I.; Corti, T.; Davin, E.L.; Hirschi, M.; Jaeger, E.B.; Lehner, I.; Orlowsky, B.; Teuling, A.J. Investigating soil moisture–climate interactions in a changing climate: A review. Earth-Sci. Rev. 2010, 99, 125–161. [Google Scholar] [CrossRef]
  6. Koster, R.D.; Suarez, M.J. The influence of land surface moisture retention on precipitation statistics. J. Clim. 1996, 9, 2551–2567. [Google Scholar] [CrossRef]
  7. Xu, Y.; Wang, L.; Ross, K.W.; Liu, C.; Berry, K. Standardized soil moisture index for drought monitoring based on Soil Moisture Active Passive observations and 36 years of North American Land Data Assimilation System data: A case study in the Southeast United States. Remote. Sens. 2018, 10, 301. [Google Scholar] [CrossRef] [PubMed]
  8. Jiménez-Donaire, M.d.P.; Tarquis, A.; Giráldez, J.V. Evaluation of a combined drought indicator and its predictive potential for agricultural droughts in Southern Spain. Nat. Hazards Earth Syst. Sci. Discuss. 2019, 20, 21–33. [Google Scholar] [CrossRef]
  9. Larson, K.M.; Small, E.E.; Gutmann, E.; Bilich, A.; Axelrad, P.; Braun, J. Using GPS multipath to measure soil moisture fluctuations: Initial results. GPS Solut. 2007, 12, 173–177. [Google Scholar] [CrossRef]
  10. Rahgozar, M.; Shah, N.; Ross, M. Estimation of evapotranspiration and water budget components using continuous soil moisture and water table monitoring. Int. Sch. Res. Not. 2012, 2012, 1–15. [Google Scholar] [CrossRef]
  11. Douville, H.; Chauvin, F. Relevance of soil moisture for seasonal climate predictions: A preliminary study. Clim. Dyn. 2000, 16, 719–736. [Google Scholar] [CrossRef]
  12. Berg, A.; Sheffield, J. Climate change and drought: The soil moisture perspective. Curr. Clim. Chang. Rep. 2018, 4, 180–191. [Google Scholar] [CrossRef]
  13. Famiglietti, J.S.; Wood, E.F. Multiscale modeling of spatially variable water and energy balance processes. Water Resour. Res. 1994, 30, 3061–3078. [Google Scholar] [CrossRef]
  14. Susha Lekshmi, S.U.; Singh, D.N.; Shojaei Baghini, M. A critical review of soil moisture measurement. Measurement 2014, 54, 92–105. [Google Scholar] [CrossRef]
  15. Dorigo, W.; Van Oevelen, P.; Wagner, W.; Drusch, M.; Mecklenburg, S.; Robock, A.; Jackson, T. A new international network for in situ soil moisture data. Eos 2011, 92, 141–142. [Google Scholar] [CrossRef]
  16. Brocca, L.; Hasenauer, S.; Lacava, T.; Melone, F.; Moramarco, T.; Wagner, W.; Dorigo, W.; Matgen, P.; Martínez-Fernández, J.; Llorens, P.; et al. Soil moisture estimation through ASCAT and AMSR-E sensors: An intercomparison and validation study across Europe. Remote. Sens. Environ. 2011, 115, 3390–3408. [Google Scholar] [CrossRef]
  17. Bell, J.E.; Palecki, M.A.; Baker, C.B.; Collins, W.G.; Lawrimore, J.H.; Leeper, R.D.; Hall, M.E.; Kochendorfer, J.; Meyers, T.P.; Wilson, T.; et al. U.S. climate reference network soil moisture and temperature observations. J. Hydrometeorol. 2013, 14, 977–988. [Google Scholar] [CrossRef]
  18. Dorigo, W.; Himmelbauer, I.; Aberer, D.; Schremmer, L.; Petrakovic, I.; Zappa, L.; Preimesberger, W.; Xaver, A.; Annor, F.; Ardö, J.; et al. The International Soil Moisture Network: Serving Earth system science for over a decade. Hydrol. Earth Syst. Sci. Discuss. 2021, 1–83. [Google Scholar] [CrossRef]
  19. Xie, P.; Arkin, P.A. Global precipitation: A 17-year monthly analysis based on gauge observations, satellite estimates, and numerical model outputs. Bull. Am. Meteorol. Soc. 1997, 78, 2539–2558. [Google Scholar] [CrossRef]
  20. Fujibe, F.; Yamazaki, N.; Kobayashi, K.; Nakamigawa, H. Long-term changes of temperature extremes and day-to-day variability in Japan. Pap. Meteorol. Geophys. 2007, 58, 63–72. [Google Scholar] [CrossRef]
  21. Jackson, T.J.; Schmugge, T.J. Passive Microwave Remote Sensing of Soil Moisture; Aacademic Press, INC.: Cambridge, MA, USA, 1986; Volume 14, pp. 123–159. [Google Scholar] [CrossRef]
  22. Kerr, Y.H.; Waldteufel, P.; Wigneron, J.P.P.; Delwart, S.; Cabot, F.; Boutin, J.; Escorihuela, M.J.J.; Font, J.; Reul, N.; Gruhier, C.; et al. The SMOS mission: New tool for monitoring key elements of the global water cycle. Proc. IEEE 2010, 98, 666–687. [Google Scholar] [CrossRef]
  23. Entekhabi, D.; Njoku, E.G.; O’Neill, P.E.; Kellogg, K.H.; Crow, W.T.; Edelstein, W.N.; Entin, J.K.; Goodman, S.D.; Jackson, T.J.; Johnson, J.; et al. The soil moisture active passive (SMAP) mission. Proc. IEEE 2010, 98, 704–716. [Google Scholar] [CrossRef]
  24. Imaoka, K.; Kachi, M.; Kasahara, M.; Ito, N.; Nakagawa, K.; Oki, T. Instrument performance and calibration of AMSR-E and AMSR2. Int. Arch. Photogramm. Remote. Sens. Spat. Inf. Sci.-Isprs Arch. 2010, 38, 13–16. [Google Scholar]
  25. Imaoka, K.; Maeda, T.; Kachi, M.; Kasahara, M.; Ito, N.; Nakagawa, K. Status of AMSR2 instrument on GCOM-W1. In Proceedings of the SPIE 8528, Earth Observing Missions and Sensors: Development, Implementation, and Characterization II, Kyoto, Japan, 29 October–1 November 2012; Shimoda, H., Xiong, X., Cao, C., Gu, X., Kim, C., Kiran Kumar, A.S., Eds.; 2012; p. 852815. Available online: https://spie.org/Publications/Proceedings/Volume/8528#_=_ (accessed on 30 July 2023). [CrossRef]
  26. Njoku, E.E.G.; Jackson, T.J.T.; Lakshmi, V.; Chan, T.T.K.; Nghiem, S.V.S. Soil moisture retrieval from AMSR-E. IEEE Trans. Geosci. Remote. Sens. 2003, 41, 215–229. [Google Scholar] [CrossRef]
  27. Chan, S.K.; Bindlish, R.; O’Neill, P.; Jackson, T.; Njoku, E.; Dunbar, S.; Chaubell, J.; Piepmeier, J.; Yueh, S.; Entekhabi, D.; et al. Development and assessment of the SMAP enhanced passive soil moisture product. Remote. Sens. Environ. 2018, 204, 931–941. [Google Scholar] [CrossRef] [PubMed]
  28. Bindlish, R.; Cosh, M.H.; Jackson, T.J.; Koike, T.; Fujii, H.; Chan, S.K.; Asanuma, J.; Berg, A.; Bosch, D.D.; Caldwell, T.; et al. GCOM-W AMSR2 soil moisture product validation using core validation sites. IEEE J. Sel. Top. Appl. Earth Obs. Remote. Sens. 2018, 11, 209–219. [Google Scholar] [CrossRef]
  29. Koike, T.; Nakamura, Y.; Kaihotsu, I.; Davva, G.; Matsuura, N.; Tamagawa, K.; Fujii, H. Development of an Advanced Microwave Scanning Radiometer (AMSR-E) algorithm for soil moisture and vegetation water content (in Japanese). Proc. Hydraul. Eng. 2004, 48, 217–222. [Google Scholar] [CrossRef]
  30. Kaihotsu, I.; Koike, T.; Yamanaka, T.; Fujii, H.; Ohta, T.; Tamagawa, K.; Oyunbataar, D.; Akiyama, R. Validation of soil moisture estimation by AMSR-E in the Mongolian Plateau. J. Remote. Sens. Soc. Jpn. 2009, 29, 271–281. [Google Scholar] [CrossRef]
  31. Kaihotsu, I.; Asanuma, J.; Aida, K.; Oyunbaatar, D. Evaluation of the AMSR2 L2 soil moisture product of JAXA on the Mongolian Plateau over seven years (2012–2018). SN Appl. Sci. 2019, 1, 1477. [Google Scholar] [CrossRef]
  32. Wu, Q.; Liu, H.; Wang, L.; Deng, C. Evaluation of AMSR2 soil moisture products over the contiguous United States using in situ data from the International Soil Moisture Network. Int. J. Appl. Earth Obs. Geoinf. 2016, 45, 187–199. [Google Scholar] [CrossRef]
  33. Hoang, K.O.; Lu, M. Assessment of the temperature effects in SMAP satellite soil moisture products in Oklahoma. Remote. Sens. 2021, 13, 4104. [Google Scholar] [CrossRef]
  34. Schanz, T.; Baille, W.; Tuan, L.N.; Schanz, T.; Baille, W.; Tuan, L.N. Effects of temperature on measurements of soil water content with time domain reflectometry. Geotech. Test. J. 2011, 34, 103152:1–8. [Google Scholar] [CrossRef]
  35. Or, D.; Wraith, J.M.; Or, D. Temperature effects on soil bulk dielectric permittivity measured by time domain reflectometry: A physical model. Water Resour. Res. 1999, 35, 371–383. [Google Scholar] [CrossRef]
  36. Halbertsma, J.; Van den Elsen, E.; Bohl, H.; Skierucha, W. Temperature effects in soil water content determined with time domain reflectometry. Zesz. Probl. Postep. Nauk. Rol. 1996, 436, 65–74. [Google Scholar]
  37. Lu, M.; Kapilaratne, J.; Kaihotsu, I. A data-driven method to remove temperature effects in TDR measured soil water content at a Mongolian site. Hydrol. Res. Lett. 2015, 9, 8–13. [Google Scholar] [CrossRef]
  38. Mironov, V.; Kerr, Y.; Wigneron, J.P.; Kosolapova, L.; Demontoux, F. Temperature and texture-dependent dielectric model for moist soils at 1.4 GHz. IEEE Geosci. Remote. Sens. Lett. 2013, 10, 419–423. [Google Scholar] [CrossRef]
  39. Tsujimoto, K.; Ohta, T.; Fujii, H.; Komatsu, M. Dielectric behavior of wet soils in the 1–36 GHz microwave range: Modeling and validation. J. Jpn. Soc. Soil Phys. 2022, 151, 3–24. [Google Scholar] [CrossRef] [PubMed]
  40. Mironov, V.L.; Dobson, M.C.; Kaupp, V.H.; Komarov, S.A.; Kleshchenko, V.N. Generalized refractive mixing dielectric model for moist soils. Geosci. Remote. Sens. IEEE Trans. 2004, 42, 773–785. [Google Scholar] [CrossRef]
  41. Kapilaratne, R.G.; Lu, M. Automated general temperature correction method for dielectric soil moisture sensors. J. Hydrol. 2017, 551, 203–216. [Google Scholar] [CrossRef]
  42. Skierucha, W. Temperature dependence of time domain reflectometry-measured soil dielectric permittivity. J. Plant Nutr. Soil Sci. 2009, 172, 186–193. [Google Scholar] [CrossRef]
  43. Gong, Y.; Cao, Q.; Sun, Z. The effects of soil bulk density, clay content and temperature on soil water content measurement using time-domain reflectometry. Hydrol. Process. 2003, 17, 3601–3614. [Google Scholar] [CrossRef]
  44. Fujii, H.; Koike, T.; Imaoka, K. Improvement of the AMSR-E algorithm for moisture estimation by introducing a fractional vegetation coverage dataset derived from MODIS data. J. Remote. Sens. Soc. Jpn. 2009, 29, 282–292. [Google Scholar] [CrossRef]
  45. Peel, M.C.; Finlayson, B.L.; McMahon, T.A. Updated world map of the Köppen-Geiger climate classification. Hydrol. Earth Syst. Sci. 2007, 11, 1633–1644. [Google Scholar] [CrossRef]
  46. Yamanaka, T.; Kaihotsu, I.; Oyunbaatar, D.; Ganbold, T. Characteristics and controlling factors of regional-scale variability in surface soil moisture within semi-arid grassland in Mongolia. J. Meteorol. Soc. Jpn. 2007, 85A, 261–270. [Google Scholar] [CrossRef]
  47. Jackson, D.R. Diurnal changes in soil water content during drying. In Field Soil Water Regime; Bruce, R.R., Flach, K.W., Taylor, H.M., Eds.; SSSA: Woodlawn, MA, USA, 1973; pp. 37–55. [Google Scholar] [CrossRef]
  48. Kapilaratne, R.G.C.J.; Lu, M. Evaluation of evaporation related diurnal change from dielectrically measured soil moisture. J. Water Resour. Hydraul. Eng. 2017, 6, 43–50. [Google Scholar] [CrossRef]
  49. Holmes, T.R.; De Jeu, R.A.; Owe, M.; Dolman, A.J. Land surface temperature from Ka band (37 GHz) passive microwave observations. J. Geophys. Res. Atmos. 2009, 114, 1–15. [Google Scholar] [CrossRef]
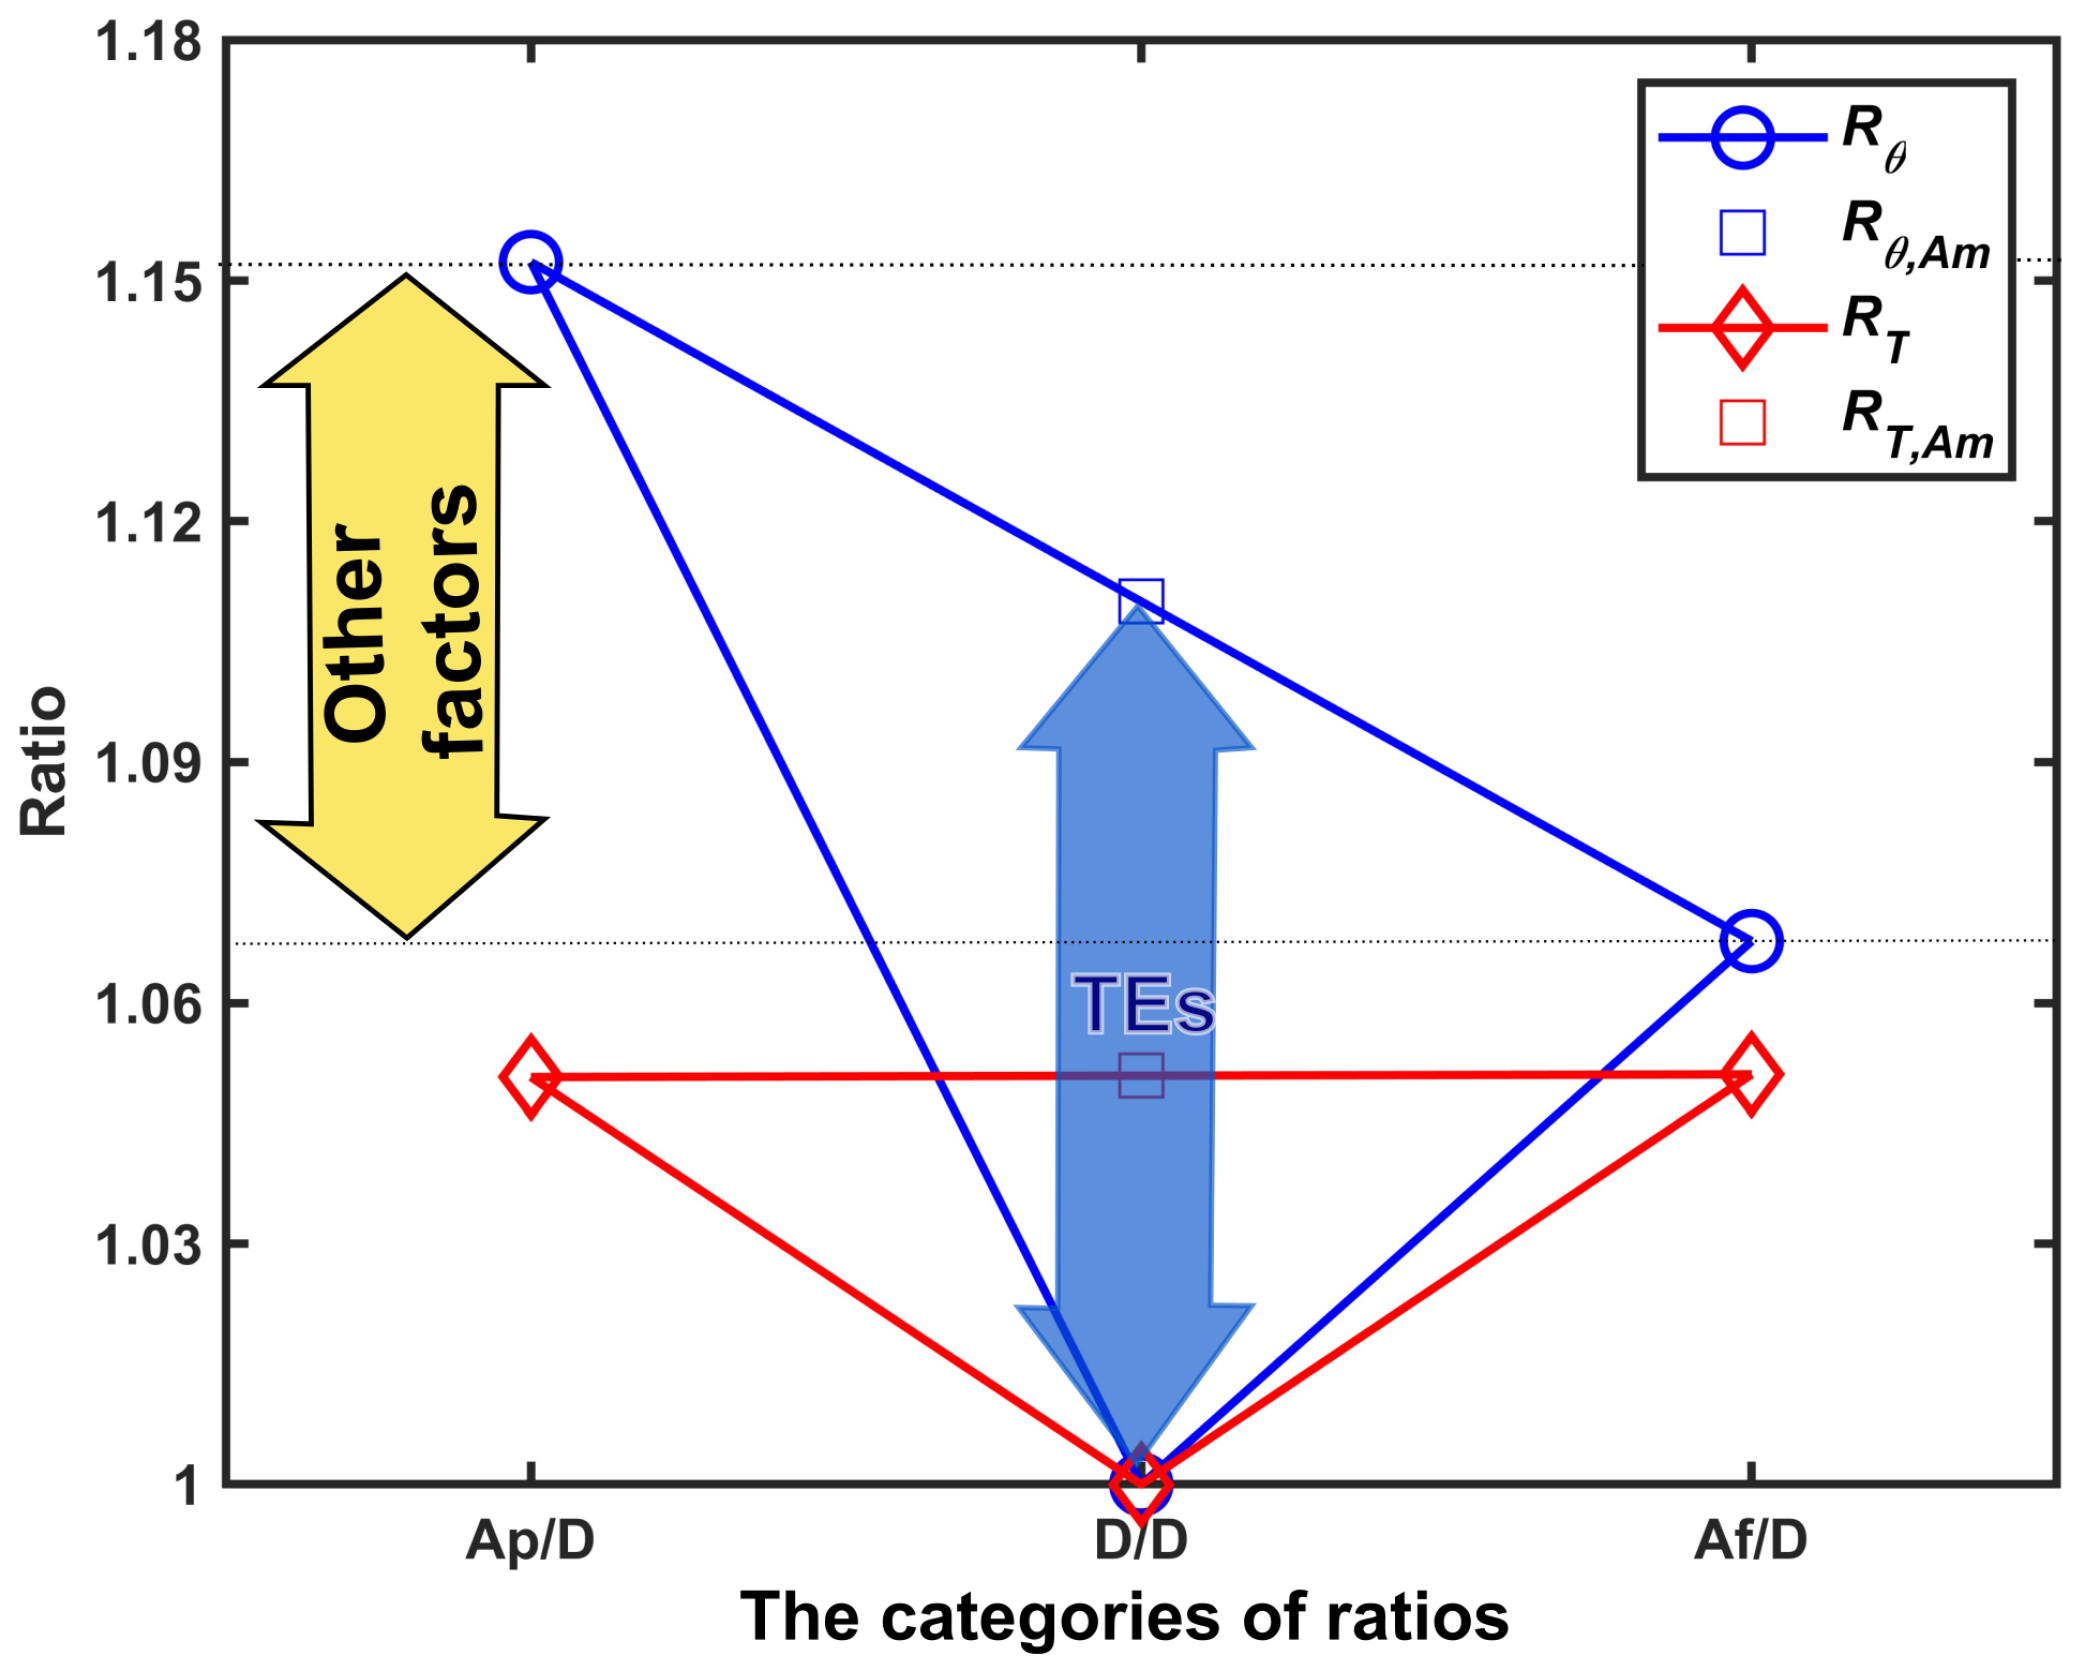
Figure 1. Ratios of temperature ( R T ) and SWC ( R θ ) in three categories, Ap/D: ratio of value at previous ascending overpass to that at descending overpass, D/D: ratio of value at descending overpass to itself, Af/D: ratio of value at following ascending overpass to that at descending overpass. The red diamond is the average ratio of temperature of all ADA triples and the blue circle is the average ratio of SWC of ADA triples. The red square shows ( R T , A m ), the average ratios of temperature in category Ap/D and Af/D; and the blue square shows ( R θ , A m ), the average ratios of SWC in category Ap/D and Af/D. The yellow double-head arrow line indicates the differences between two ratios of SWC in categories Ap/D and Af/D which may be caused by factors other than temperature, and the blue double-head arrow line indicates the difference caused by temperature effects (TEs).
Remotesensing 16 01606 g001
Figure 2. Study area in Mongolia. The green and red dots are automatic stations for soil hydrology (ASSHs) and automatic weather stations (AWSs).
Remotesensing 16 01606 g002
Figure 3. The variety among nine stations in the Mongolia CVS, presenting their respective average values alongside the standard deviation over a five-day period. Panel (a) displays the soil water content values, while panel (b) showcases the soil temperature readings.
Remotesensing 16 01606 g003
Figure 4. The bi-hourly in situ soil temperature, in situ SWC and AMSR2 SWC and AMSR2 LST at ascending and descending overpasses averaged over CVS in Mongolia (a). The blue dashed line and orange dotted line represent the in situ SWC ( θ I n S i t u ) and soil temperature ( T S ) at 3 cm depth, respectively. The red and green stars stand for AMSR2 LST at ascending ( T S F , A ) and descending ( T S F , D ) overpasses, and the red and green pluses are AMSR2 SWC at ascending ( θ A M S R 2 , A ) and descending overpasses ( θ A M S R 2 , D ), respectively. (b,c) The ADA triangles of temperature and SWC of in situ and satellite data. The red lines are the temperature and the blue lines are the SWC in both.
Remotesensing 16 01606 g004
Figure 5. Estimation of temperature effect coefficient from in situ data (a) and AMSR2 data (b). The blue dots are the original data and the red circles are the outliers determined in the recursive regression.
Remotesensing 16 01606 g005
Figure 6. The bi-hourly in situ soil temperature, in situ SWC and the original and corrected AMSR2 SWC and AMSR2 LST at ascending and descending overpasses averaged over the CVS in Mongolia (a). In addition to Figure 4a, a red line representing the corrected in situ SWC ( θ I n S i t u ) at 3 cm depth and the red and green circles showing the corrected AMSR2 SWC at ascending ( θ A M S R 2 , A ) and descending ( θ A M S R 2 , D ) overpasses are added. The green ADA triangles of the corrected in situ and the AMSR2 SWC are also added in both (b,c).
Remotesensing 16 01606 g006
Figure 7. Accumulated absolute difference between θ A m and θ D of in situ SWC (a) and AMSR2 SWC (b). The blue and red lines are the data before and after the correction.
Remotesensing 16 01606 g007
Table 1. Automatic weather stations (AWSs) and automatic stations for soil hydrology (ASSHs) used in this study.
Station IDLocationAltitudeResolutionThiessen Weight
MGS AWS( 45 ° 44 34 . 9 , 106 ° 15 52 . 2 )1393 m30 min0.069
DRS AWS( 46 ° 12 31 . 2 , 106 ° 42 53 . 0 )1297 m30 min0.040
ASSH811/ASSH1( 45 ° 55 22 . 5 , 106 ° 54 30 . 2 )1450 m2 h0.114
ASSH813( 46 ° 06 10 . 0 , 106 ° 46 47 . 2 )1318 m2 h0.155
ASSH817/ASSH7( 45 ° 44 23 . 4 , 106 ° 39 05 . 5 )1342 m2 h0.108
ASSH819/ASSH9( 46 ° 16 57 . 6 , 106 ° 15 52 . 1 )1407 m2 h0.022
ASSH820/ASSH10( 45 ° 55 22 . 5 , 106 ° 31 21 . 2 )1422 m2 h0.204
ASSH815/ASSH11( 46 ° 06 10 . 0 , 106 ° 31 21 . 2 )1383 m2 h0.158
ASSH8122( 46 ° 00 58 . 0 , 106 ° 16 24 . 3 )1502 m2 h0.130
Table 2. Values of the quantitative metrics, mean error, mean absolute error, correlation coefficient, root mean square error and unbiased root mean square error of the averaged ascending data and descending data in four pairs of the original and corrected AMSR2 and in situ SWC products from September 2016 to October 2019.
Pair ME ( m 3 / m 3 ) MAE ( m 3 / m 3 ) R RMSE ( m 3 / m 3 ) ubRMSE ( m 3 / m 3 )
Y 2 Y 1 ME Am ME D MAE Am MAE D R Am R D RMSE Am RMSE D ubRMSE Am ubRMSE D
θ I n S i t u θ I n S i t u −0.00390.00250.00420.00260.99800.99930.00510.00370.00320.0028
θ A M S R 2 θ I n S i t u 0.01480.00870.03630.03460.19940.45470.05100.04940.04880.0486
θ A M S R 2 θ I n S i t u 0.0190.01120.0350.03570.20760.45260.04890.05150.04760.0502
θ A M S R 2 θ I n S i t u 0.01400.00790.03480.03620.24070.44390.04910.05130.04710.0507
Subscripts A m and D are the same as those defined in Equation (5).
Table 3. Values of median absolute errors of the averaged ascending data and descending data in four pairs of the original and corrected AMSR2 and in situ SWC products from September 2016 to October 2019.
Pair MedAE ( m 3 / m 3 )
Y 2 Y 1 MedAE A p MedAE D MedAE A f MedAE A m
θ I n S i t u θ I n S i t u 0.00340.00170.00350.0034
θ A M S R 2 θ I n S i t u 0.02850.02560.02700.0275
θ A M S R 2 θ I n S i t u 0.02810.02530.02790.0280
θ A M S R 2 θ I n S i t u 0.02680.02770.02590.0261
Subscripts A p , A f , A m and D are the same as those defined in Equation (5).
Disclaimer/Publisher’s Note: The statements, opinions and data contained in all publications are solely those of the individual author(s) and contributor(s) and not of MDPI and/or the editor(s). MDPI and/or the editor(s) disclaim responsibility for any injury to people or property resulting from any ideas, methods, instructions or products referred to in the content.