Abstract
Tectonic features on the Moon can reflect the state of stress during the formation of the structure, and sinuous rilles can provide further insight into the tectonic-thermal evolution of the Moon. Manual visual interpretation is the primary method for extracting these linear structures due to their complex morphology. However, extracting these features from the vast amount of lunar remote sensing data requires significant time and effort from researchers, especially for small-scale tectonic features, such as wrinkle ridges, lobate scarps, and high-relief ridges. In order to enhance the efficiency of linear structure detection, this paper conducts research on the automatic detection method of linear structures using sinuous rilles as an example case. In this paper, a multimodal semantic segmentation method, “Sinuous Rille Network (SR-Net)”, for detecting sinuous rilles is proposed based on DeepLabv3+. This method combines advanced techniques such as ECA-ResNet and dynamic feature fusion. Compared to other networks, such as PSPNet, ResUNet, and DeepLabv3+, SR-Net demonstrates superior precision (95.20%) and recall (92.18%) on the multimodal sinuous rille test set. The trained SR-Net was applied in detecting lunar sinuous rilles within the range of 60°S to 60°N latitude. A new catalogue of sinuous rilles was generated based on the results of the detection process. The methodology proposed in this paper is not confined to the detection of sinuous rilles; with further improvements, it can be extended to the detection of other linear structures.
1. Introduction
According to their geometrical features, lunar structures can be broadly classified into linear or circular structures [1]. Linear structures related to volcanic activity can reflect the stress state and thermal state of the lunar surface. The study of linear structures is important for understanding the evolution of the stress field, volcanism, and tectonic-thermal processes. Lunar remote sensing optical images and Digital Elevation Models (DEMs) are the primary data sources for studying lunar tectonic activity and evolution. Previously, the detection of linear structures was primarily reliant on manual interpretation [1,2,3,4] and digitization [5,6,7,8], which was time-consuming and prone to significant errors. It was extremely challenging to manually detect global linear structures from a vast number of remote sensing images. Therefore, it is urgently needed to develop an automated technique for detecting linear structures. Sinuous rilles, one of the most obvious linear structure features on the lunar surface, exhibit a more intricate morphology compared to graben and crater-floor fractures. Therefore, we used the sinuous rilles as a proxy to study the automatic detection of linear structures.
Lunar sinuous rilles are characterized by highly varying lengths (2.1~566 km), depths (4.8~534 m), and widths (0.16~4.3 km), with parallel, laterally continuous walls [2]. These features are mainly distributed within mare regions and show different degrees of sinuosity. The topographic profiles of these channels typically display a distinctive V- or U-shape (refer to Figure 1).

Figure 1.
Example of a sinuous rille observed on the Moon. (a) The optical image features of the sinuous rille in the Lunar Reconnaissance Orbiter Camera Wide-Angle Camera (LROC WAC) image (red arrows indicate its location). (b) The topographic features of the sinuous rille in the DEM data of the Lunar Orbiting Laser Altimeter (LROA) and SELENE, (AA’ is a profile line). (c) The topographic profile along AA’ in (b).
The origin of lunar sinuous rilles is still not fully understood. Two main hypotheses have been proposed to explain their formation: lava channels [9,10,11] and collapsed lava tubes [12,13]. The lava channel model proposes that sinuous rilles are formed by the flow of lava between stationary levees. This lava may or may not be covered with patches of solidified crust. The lava flows turbulently, mechanically and thermally eroding the underlying material. Thermal erosion refers to the phenomenon whereby the heat from flowing lava erodes and melts the underlying substrate, resulting in the creation of channel-like features on the lunar surface [14]. The model suggests that low-viscosity lunar lavas may have flowed in a turbulent manner, causing erosion and forming the sinuous rilles. Conversely, the collapsed lava tube model proposes that sinuous rilles are, in fact, collapsed lava tubes. A lava tube is defined as a conduit for molten lava beneath a solidified crust [15]. In this model, the lava flows through the tube and eventually collapses, leaving behind the sinuous rille.
The study of sinuous rilles not only sheds light on the precise mechanism of channel formation but also provides crucial insights into volcanic history, sources of eruption material, flow characteristics, and magma transport pathways [16]. In recent years, sinuous rilles have garnered renewed attention due to their correlation with lunar lava channels and their potential as areas of interest for future human landing sites on the lunar surface [17,18,19]. In conclusion, conducting detection studies of sinuous rilles will provide fundamental data for research on lunar volcanism. Additionally, they could potentially serve as shelters for future lava tube exploration and base building.
In previous studies, the primary method for detecting and extracting sinuous rilles was manual visual interpretation, whether in compiling and updating catalogs of sinuous rilles [2,3] or in creating lunar geological maps [1,4]. However, this approach is not only labor-intensive but also inefficient. Given the vast expanse of the lunar surface, it is a big challenge for experts to manually detect all sinuous rilles, and there are variations in the features detected by different professionals. Therefore, this study aims to develop a tool for the automatic and consistent detection of sinuous rilles.
In recent years, with the emergence of AlexNet [20] and the rapid advancement of graphics processing units (GPUs), an increasing number of researchers have turned to convolutional neural networks (CNNs) for object detection and segmentation tasks in computer vision. In the realm of lunar remote sensing, Silburt [21] pioneered the application of the U-Net [22] network framework for semantic segmentation in impact-crater detection. Subsequently, numerous researchers have pursued related studies on the automatic detection and extraction of lunar craters by semantic segmentation [23,24,25,26]. Unlike craters, sinuous rilles exhibit greater structural complexity, and there has been limited research on their automatic detection. Semantic segmentation has gained widespread adoption on Earth for accurate recognition of linear ground objects, such as automated road extraction [27], pavement crack detection [28], water body delineation, and flood monitoring [29]. Notably, the morphology of these terrestrial features bears certain similarities to that of sinuous rilles, which could provide valuable insights for this study.
Fundamentally, previous methods used for automatically detecting sinuous rilles can be categorized into two groups: conventional image segmentation methods and deep learning-based approaches. For instance, Li [7] applied the principle of topographic curvature and conducted digital quantitative analysis to extract linear structures on the lunar surface. Lou [8] introduced a method based on mean filtering techniques. Real features of lunar structures are extracted by calculating their average change value of DEM data under regional gradient constraints. These traditional methods offer the advantages of simple computational principles and easy implementation. However, they heavily rely on threshold selection and have limited generalization capabilities.
In contrast to traditional image segmentation, methods based on semantic segmentation are independent of the threshold selection. In addition, due to the high generalization ability of CNNs, a well-trained model can accurately detect targets in various regions. Chen [23] proposed a High-Resolution Moon-Net (HRM-Net) framework to detect both impact craters and rilles simultaneously on the lunar surface. The high-resolution global-local networks (HR-GLNets) model proposed by Jia [25] improves the accuracy of crater and rille detection. However, due to the shortage of a high-quality lunar rille dataset, these models had to use a surface crack dataset containing pavement cracks in concrete [28] and a self-created small dataset with rille annotations as training datasets. It is well understood that training most semantic segmentation models requires establishing high-quality data annotations. Therefore, to facilitate the automatic detection of sinuous rilles, we established a dataset annotated with sinuous rilles and devised a novel multimodal feature fusion network for sinuous rille semantic segmentation, which we term SR-Net. Our model adopts an end-to-end deep learning approach, and a multimodal feature fusion module is incorporated into the network for extracting and fusing features from multimodal image pairs. This approach optimally exploits multimodal features and enhances the robustness and reliability of the automatic detection system. Additionally, an attention mechanism module plays a crucial role in enhancing the accuracy of the prediction results for the sinuous rille detection system. Further details regarding the training dataset, model architecture, and hyperparameter settings are elaborated in the Materials and Methods section.
The key contributions of this study are summarized as follows:
- A multimodal semantic segmentation method was developed for the automatic detection of sinuous rilles on the lunar surface.
- A high-quality dataset labeled with sinuous rilles was created for training deep learning models.
- Several sinuous rilles not included in a previous catalog [2] of sinuous rilles were detected using our method, and the global distribution of sinuous rilles was mapped.
The paper is structured as follows: Section 2 describes the dataset, methodology, and evaluation indices. Section 3 presents the experimental results and compares the proposed network with existing ones. Section 4 discusses the issues with the experimental data and model predictions and suggests the directions for future research. Finally, Section 5 presents our conclusions.
2. Materials and Methods
2.1. Overview of SR-Net
SR-Net is a proposed method for sinuous rille detection. It is based on state-of-the-art semantic segmentation, attention mechanisms, and multimodal feature fusion. SR-Net utilizes the encoder–decoder architecture of DeepLabv3+ [30], as illustrated in Figure 2a. The encoder is primarily used to extract semantic information about sinuous rilles from input data. It is composed of two parts: the Dynamic Fusion Module [31] and the feature map extraction module. The Dynamic Fusion Module combines overlapping patches of optical images, DEM, and slope data into a three-channel feature map. Feature maps are extracted using two modules: ECA-ResNet [32] and Atrous Spatial Pyramid Pooling (ASPP) [33]. These modules extract low-level and high-level features from multimodal data. The decoder is designed to integrate the low-level and high-level feature output from the encoder and transform the fused feature maps into the final sinuous rille segmentation maps. It is to be noted that, in Figure 2a, the Dynamic Fusion Module 1 (DFM1) of the encoder differs from the Dynamic Fusion Module 2 (DFM2) of the decoder. DFM1 combines only the channel attention mechanism, whereas DFM2 combines both the channel and spatial attention mechanisms. The architecture and elements of the network model are discussed in detail in Section 2.3 and Section 2.4.
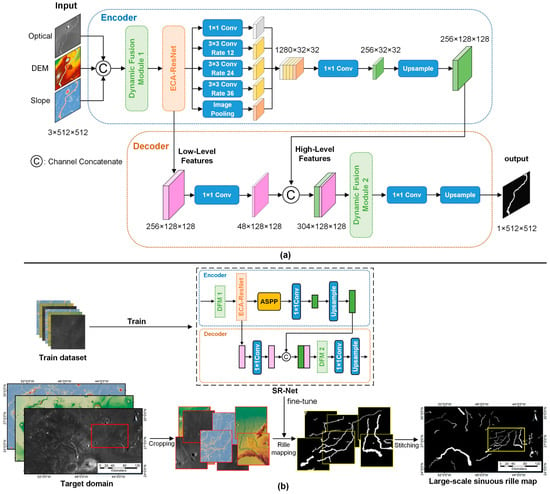
Figure 2.
Overview of the proposed sinuous rille detection framework: (a) detailed design of SR-Net and (b) process of generating large-scale sinuous rille maps.
The SR-Net model is trained and fine-tuned by training and validation dataset to obtain the final model. The final model can detect large-scale sinuous rilles. The detection process is shown in Figure 2b. Firstly, crop the multimodal data of the target domain to obtain overlapping patches. The overlapping patches are input into the model, which can generate segmentation maps for each pair of overlapping patches. Finally, these segmentation maps are stitched together to generate the prediction results for the respective domain. We describe the datasets used for model training, validation, and testing in Section 2.2. More details on model training can be found in Section 2.5, while Section 2.6 explains the metrics used for model evaluation.
2.2. Data Preparation
High-quality datasets with sinuous rille annotations are crucial for training deep learning models. Past research has typically addressed this issue via the transfer learning approach, due to a shortage of datasets. However, the utilization of non-specific training datasets may impede model convergence and lead to lower accuracy of the final model. To enhance the model’s accuracy, we labeled approximately 150 sinuous rilles using optical images, DEM, and slope data for the dataset. The optical image (monochrome, 643 nm) was collected by the LROC WAC aboard the Lunar Reconnaissance Orbiter (LRO). The LROC WAC covers the entire Moon with a resolution of 100 m/pixel [34]. The DEM data were generated using the information from the LOLA onboard the LRO and the Terrain Camera (TC) onboard SELENE. The DEM data cover a latitude range of ±60 degrees (full longitude range) with a resolution of 512 pixels/degree (59 m/pixel) [35]. These data were archived in the USGC database. The slope raster is created from the DEM by the ArcGIS Slope tool. As sinuous rilles are primarily located in the mid-to-low-latitude region, we selected the ±60 degrees (DEM coverage) as our study area. To detect finer sinuous rilles, we maintained the original resolution of our input DEM and slope data, while the upsampling and cropping of the WAC image data by ArcGIS tools were performed to align with the resolution and extent of the DEM. These data are in Plate Carrée projection with a resolution of 184,320 × 61,440 pixels and a bit depth of 16 bits/pixel. It is typically necessary to use 4 pixels to reliably and completely catalogue a feature. Given that the maximum resolution of the data in this case is 59 m/pixel, the minimum width at which a sinuous rille can be identified is theoretically 236 m.
The previous catalog of sinuous rilles [2] recorded 195 of them and listed the longitude, latitude, width, and length of each sinuous rille. The 1:2,500,000-scale geologic map of the Moon [1,4] depicts 474 sinuous rilles as line features. Currently, these datasets cannot be used directly for training deep learning models because they lack the necessary labels corresponding to the image data. Typically, these labels are presented as binary graphs. We identified and mapped 150 sinuous rilles through manual visual interpretation. The Polygon to Raster Conversion tool was used to convert these labels into raster data that align with the size and resolution of WAC, DEM, and slope data. Due to limitations in CPU and GPU memory, large-scale images cannot be directly input into the model training. Therefore, we employed the sliding-window cropping method to synchronously crop data of size 184,320 × 61,440 pixels. The cropping window size was 512 × 512 pixels, and the overlap between sliding windows was 0.6.
The 2325 crops of data containing annotations of sinuous rilles and a small number of crops without annotations from the overlapping patches were screened. Each crop set included an optical image, DEM data, a slope map, and the corresponding ground truth (as shown in Figure 3). These data were divided randomly into three independent datasets in a 6:2:2 ratio, comprising the training set, validation set, and test set. Since a significant amount of data is needed for model training, we performed data augmentation using horizontal flipping, vertical flipping, and diagonal mirroring. Table 1 shows that there are 5580 pairs of augmented data used for model training, 1860 pairs for validation, and 1860 pairs for testing. However, the accuracy of labeled data can be affected by human subjectivity. To ensure accuracy, we enlisted experts in lunar geology to verify each labeled datum during production.
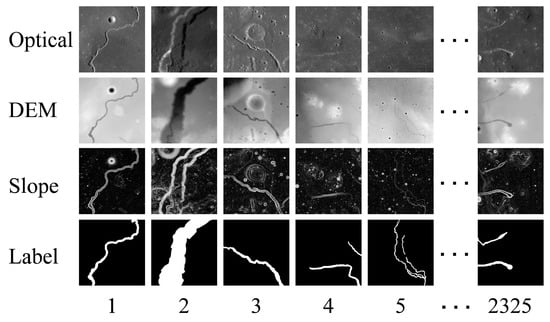
Figure 3.
Samples from multimodal dataset of sinuate rilles, consisting of 2325 groups, with each containing four types of data: optical, DEM, slope, and ground truth. The approximate coordinates of the sinuous rills in the figure are (48.32°W, 15.24°N), (49.38°W, 25.06°N), (29.18°E, 14.59°N), (57.04°W, 14.09°N), (59.98°W, 13.93°N), and (55.91°W, 13.69°N).

Table 1.
Multimodal dataset for training, validation, and testing.
2.3. Network Architecture
In recent years, many network structures have been proposed for image semantic segmentation, such as PSPNet [36], U-Net, and DeepLabv3+. DeepLabv3+ is an advanced semantic segmentation architecture proposed by Chen [30] in 2018. The authors propose a simple and effective encoder–decoder with Atrous separable convolution by combining the Spatial Pyramid Pooling module from PSP-Net and the encoder–decoder structure from U-Net. The architecture not only progressively recovers spatial information through the encoder–decoder structure to capture clearer object boundaries but also efficiently extends the network’s perceptual domain to encompass a wide range of contextual information through the dilated convolution in the ASPP module. To prevent the loss of feature information, the architecture extracts low-level feature maps during feature extraction and combines them with high-level feature maps in the decoder stage.
By analyzing the distribution and morphological size of the sinuous rilles across the entire Moon, we determined that the length of the sinuous rilles ranges from 2.1 km to 566 km, and the width ranges from 0.16 km to 4.3 km. It can be inferred that the scale of the sinuous rilles varies greatly, thus requiring a larger receptive field for feature extraction. Furthermore, since sinuous rilles display a linear structure, it is crucial to accurately extract their edges. Therefore, DeepLabv3+ was selected as the primary network architecture in this study.
The DeepLabv3+ architecture is enhanced by incorporating a dynamic fusion module and an attention mechanism. The network receives three multimodal images of size 512 × 512, fuses them, and feeds them into ECA-ResNet. The ECA-ResNet module then outputs a low-level feature of size 128 × 128 with 256 channels to the decoder. This feature is convolved to reduce the number of channels to 48. The ECA-ResNet module outputs a high-level feature map with 256 channels and a size of 32 × 32 to the ASPP. This is then convolved and upsampled to generate a feature map with 256 channels and a size of 128 × 128. The low-level and high-level features are combined using the dynamic fusion module in the decoder. The fused features are convolved and upsampled, resulting in a prediction with a single channel and an image size of 512 × 512.
2.4. Network Elements Introduction
2.4.1. Attention Mechanism Module
To enhance the performance of SR-Net, an integrated the attention mechanism module was integrated into the model. Attention mechanisms in computer vision are dynamic weighting processes that mimic the ability of the human visual system to focus on important regions of an image, while ignoring irrelevant parts of it. Different types of attention mechanisms, including channel attention, spatial attention, temporal attention, branch attention, and hybrid attention, have been successfully applied in various tasks, such as image classification, object detection, semantic segmentation, and video understanding. These mechanisms have significantly contributed to the development of computer vision systems [37].
In this paper, an attention mechanism module is proposed which mainly consists of channel attention and spatial attention. The channel attention mechanism focuses on generating attention masks across the channel domain to select important channels in the input feature map. It enhances the discriminative power of features by assigning different weights to various channels. The spatial attention mechanism generates attention masks across spatial domains to select important spatial regions or predict the most relevant spatial positions directly. It captures the spatial relationships of features and helps the network focus on informative regions in the input.
The channel attention mechanism was pioneered by the Squeeze-and-Excitation Network (SE-Net) [38], which effectively enhances the representational capabilities of deep neural networks. Wang [32] proposed the Efficient Channel Attention (ECA) module, which is based on the SE module. The ECA module utilizes adaptive convolution kernel sizing instead of manual tuning to decrease model complexity and enhance performance.
The ECA module was selected as the channel attention module for this paper, and its framework is shown in Figure 4. To begin, a convolution block, , undergoes Global Average Pooling (GAP) to produce the aggregated features, , that represent the global channel information, where the c-th element of is calculated by the following:
where W, H, and C represent the width, height, and channel dimensions. After calculating the feature , the weights of its channels are determined through one-dimensional convolution. This process helps determine the interdependence between each channel. Formally, it can be written as follows:
where denotes the weight of the channels, denotes the Sigmoid function, represents the one-dimensional convolution with a convolution kernel of size , and is the result of GAP. The value of is adaptively obtained based on the channel dimension using the adaptive function, . The function is calculated as follows:
where indicates the nearest odd number of t, and γ and b are relationship coefficients. According to the original ECA-Net article, we set γ and b to 2 and 1, respectively. Finally, the input feature, , is multiplied by the channel weights to obtain the features with channel attention, and it is formulated as follows:
where denotes the features output by the channel attention module.
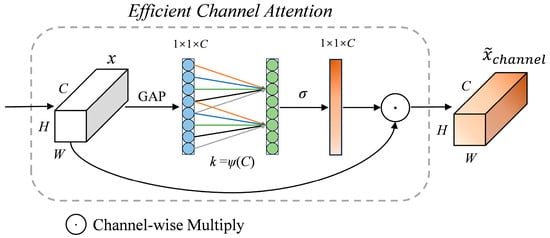
Figure 4.
Framework diagram of the Efficient Channel Attention (ECA) module.
Spatial attention can enhance the model’s ability to comprehend different regions in image features, resulting in more accurate classification and segmentation. Previous studies have successfully improved model performance by combining channel attention with spatial attention [39,40,41]. In the dynamic fusion module of our network’s decoder, we developed a new attention module called Efficient Spatial and Channel Attention (ESCA), as illustrated in Figure 5. This module can parallelize the spatial attention module of scSE [41] and the ECA module to extract spatial information and channel features, respectively. The spatial attention mechanism in ESCA employs a 1 × 1 convolution to squeeze the spatial dimensions of the input feature map. The sigmoid activation function is then applied to generate spatial attention weights, which determine the importance of each feature map location. The overall process can be written as follows:
where indicates the spatial attention weights; denotes the 1 × 1 convolution; denotes the feature of spatial attention output; denotes the fusion value of and ; and denotes the fusion function, which can be maximal, additive, multiplicative, or concatenative. Here, we use addition to combine the computed results of two parallel attention modules. It is important to note that the broadcast mechanism is used to compute the channel attention in the process because the dimensions of the spatial attention weights differ from the dimensions of the input features.
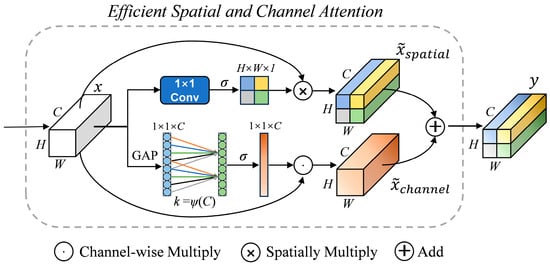
Figure 5.
Framework diagram of the newly proposed Efficient Spatial and Channel Attention (ESCA) module.
2.4.2. Feature Map Extraction
In deep learning, various feature-extraction backbone networks impact the training speed, number of parameters, and model performance. Therefore, selecting the appropriate feature map extraction method is crucial for model training. For this task, we utilize ECA-ResNet50 and the ASPP module to extract feature maps.
In practice, CNNs can suffer from degradation problems as the network depth increases, leading to an increase in the training errors instead of a decrease. He [42] proposed a residual network (ResNet), which is a deep residual network structure that introduces residual connections. The basic structure of ResNet consists of multiple residual blocks, with each comprising two convolutional layers and a skip connection. The first convolutional layer extracts features, and the second one maps the extracted features to the target dimension. The skip connections allow the input layer to be directly added to the output layer, allowing the network to learn the residuals. This approach effectively solves the problems of gradient vanishing and gradient explosion during deep neural network training. ResNet50 is composed of 50 convolutional layers that reduce the spatial dimensions of input features through residual blocks and pooling layers to extract high-level features. The ECA-ResNet50 module was created by adding the ECA module to each of the “bottleneck” convolutional layers of ResNet50. This module effectively weights the channels of the convolutional to enhance the network’s representation of sinuous rille features.
Afterward, an ASPP module is appended to expand the receptive field and enhance the performance of the semantic segmentation model, especially when handling images with objects of different scales. The ASPP module consists of a convolution and three parallel Atrous convolutions with different dilation rates, along with global pooling. The dilation rates regulate the receptive field size of the convolutional filters, enabling the network to capture information at various scales. The global pooling operation consolidates information from the entire feature map, providing a global context. In this paper, the dilation rates are set to 6, 12, and 18, respectively, and the weights of the remaining points in the Atrous convolution are all zero.
2.4.3. Dynamic Fusion Module
The multimodal feature fusion technique aims to combine and integrate features from different modalities to enhance the overall expressiveness and performance of the fused features. This approach plays a crucial role in tasks such as object detection, segmentation, and scene perception [43]. In impact-crater detection studies, by integrating various types of data such as optical images, elevation maps, and slope maps, a more comprehensive and reliable understanding of the terrain can be achieved, thereby enhancing crater detection performance [24]. Therefore, this paper combines multimodal data to study the automatic detection of sinuous rilles. A dynamic fusion approach is proposed to integrate multimodal data, thus enhancing the model’s robustness.
Multimodal data fusion is a crucial component of our proposed approach. When designing networks for multimodal perception, three problems typically arise: determining which data to fuse, how to fuse them efficiently, and at what stage to perform the fusion. Feng [44] discusses the two primary aspects of the process of multimodal data fusion: the fusion operation and the fusion stage. The fusion operations include four main types: addition or average mean, concatenation, ensemble, and mixture of experts. Among these, concatenation is the most commonly used fusion operation. The fusion stage comprises early, middle, and late fusions (as shown in Figure 6). Early fusion refers to the network learning the joint feature of multiple modalities in the early stage. The joint feature is the result of mapping the information from various modalities to the same feature space. This strategy is less computationally demanding and requires less memory, but it comes at the cost of model inflexibility. Although late fusion provides flexibility and modularity, it comes with high computational and memory costs and overlooks the correlation between multimodal features. Middle fusion refers to the fusion of features at an intermediate layer of the network. This approach provides the network with a high degree of flexibility and establishes correlations between multimodal features. However, finding the optimal method for fusing the middle layer can be challenging. As the performance of a fusion method depends on various factors, such as sensing patterns, data, and network architectures, there is no direct evidence to support the existence of a fusion method with superior performance. Therefore, choosing a feature fusion method appropriate for our task is a matter that needs to be explored in this section.

Figure 6.
An illustration of early fusion, late fusion, and middle fusion methods.
Tewari [24] enhanced the accuracy of impact-crater detection by fusing three types of data, namely optical mosaic, DEM mosaic, and slope mosaic, prior to feature extraction. The optical mosaic reflects the light shading and surface texture features of the lunar surface, while the DEM mosaic contains elevation information and topographic features. The slope mosaic is derived from the DEM mosaic, which accurately represents the terrain’s inclination. Similar to impact craters, sinuous rilles are depressed configurations, which exhibit brightness and shadow features on optical mosaics. On DEM mosaics, the internal channels of sinuous rilles are typically lower than the height of the external edges of the channels, and the rille walls display tilted features on slope mosaics. Thus, we concatenated the multimodal data before performing feature extraction.
Although concatenating multimodal data directly can be effective, this fusion operation may assign equal weight to different modalities. The results of the ablation experiments in Section 3.1 demonstrate that the model’s predictions vary depending on the data modality. To enhance the performance of the model pair, we utilize the Dynamic Fusion Module to allocate weights to various modal features during the multimodal feature fusion process. The Dynamic Fusion Module in the BEVFusion network [31] uses the Attention Mechanism Module to select important fusion features based on static weight fusion. This effectively enhances the efficiency of multimodal feature fusion. Inspired by the Dynamic Fusion Module, we improved it by replacing the basic attention mechanism module with either the ECA or ESCA module, allowing for the adaptive selection of multimodal features. The improved early Dynamic Fusion Module 1 can be seen in Figure 7 and can be formulated as follows:
where denotes the concatenation operation along the channel dimension. is a static channel and spatial fusion function implemented by a concatenation operation and a 3 × 3 convolution layer. is the adaptive feature selection function, which is formulated as follow:
where represents the feature after static fusion. Meanwhile, the other parameters match the formula used for calculating the ECA module, as detailed in Equations (1)–(4).
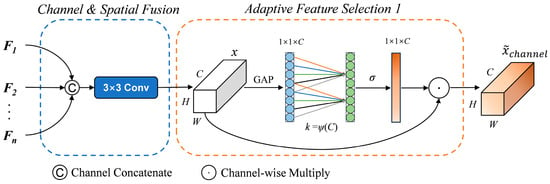
Figure 7.
The Dynamic Fusion Module 1.
During experiments, we observed that integrating spatial attention into the multimodal fusion module during the encoder stage did not significantly improve the network performance. Instead, it introduced additional model complexity and prolonged the training time. We speculate that the primary reason for this issue may be that the multimodal data feature representations in the early fusion stage are not sufficiently rich enough to provide the necessary information for the spatial attention mechanism to make effective differentiations and selections. During the decoder stage of integrating low-level and high-level features, we included spatial attention for experimentation. We observed that the performance of the model improved when both parallel channel attention and spatial attention were used at this stage. For this purpose, we replaced the ECA module with the ESCA module to optimize the adaptive feature selection function. This change is illustrated in Figure 8 and can be mathematically expressed by the following equation:
where W represents a 1 × 1 convolution operation used to transform the feature map from [H, W, C] to [H, W, 1] features. The dynamic module corresponding to this is represented as follows:
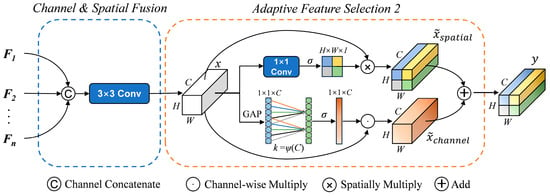
Figure 8.
The Dynamic Fusion Module 2.
Unlike , replaces the single-channel attention mechanism module with a new module that incorporates both channel and spatial attention mechanisms in parallel.
2.5. Training Details
In the training of Convolutional Neural Networks, it is usually necessary to set appropriate hyperparameters, optimizers, and loss functions to facilitate the training of a superior model. To fully train the model, it is trained on the sinuous rilles dataset for 100 epochs. To maintain inference performance and learning speed during training, we utilized the RMSProp optimizer, with a learning rate of 1 × 10⁻⁴ and a batch size of 4.
This paper discusses the detection of lunar sinuous rilles as a binary classification problem. To measure the distinction between positive and negative samples, we utilize the Binary Cross Entropy with Logits Loss function (BCEWithLogitsLoss). This loss function combines a Sigmoid layer and the BCELoss in one single class, making it more numerically stable than using BCELoss after applying sigmoid. It can be mathematically described as follows:
where denotes the ground-truth target value of pixel i in the mask; denotes the prediction pixel; and represents the Sigmoid function, which maps to the interval (0, 1) to stabilize the values. The loss value reflects the disparity between the predicted and true values. In iterative training, the model with the smallest average validation loss is considered the optimal model.
Our approach was trained and tested on an NVIDIA TITAN GPU card with 24 GB of video memory. Our network was implemented using the PyTorch version 2.0 framework on a Windows 10 operating system with a CUDA 10.1 environment.
2.6. Evaluation Metrics
This study utilizes Mean Intersection over Union (MIoU), recall, precision, and F1-score as objective evaluation metrics to assess the performance of our model in automatically detecting lunar sinuous rilles. MIoU represents the Mean Intersection over Union of the model predictions to the true values, which is commonly used to measure the segmentation effectiveness of the model. The expression is as follows:
TP (True Positive) represents the number of pixels that correctly predicted sinuous rilles, while FP (False Positive) represents the number of pixels that incorrectly predicted sinuous rilles as the background. Similarly, TN (True Negative) represents the number of correctly predicted background pixels, and FN (False Negative) represents the number of pixels that were incorrectly predicted as sinuous rilles.
The recall measures the model’s ability to detect positive samples. The higher the recall, the more positive samples are detected.
The precision measures the accuracy of the model in classifying a sample as positive.
In practice, recall and precision are contradictory performance metrics. Therefore, it is common to measure the accuracy of a model using a composite F1-score, which is the harmonic mean of precision and recall.
In the results section of Section 3, we comprehensively evaluate our experimental results using the aforementioned metrics.
2.7. Morphometric Features Measurements
In order to catalogue the identified results, based on the WAC and DEM data, the morphological parameters of sinuous rilles (e.g., width, depth, length, and sinuosity index) are measured in this paper as follows.
- (1)
- Width: The width of a sinuous rille is the distance between the tops of two parallel walls of the channel. For each sinuous rille, three profile lines were made perpendicular to the direction of the channel, and the width values from the three profile lines were measured and averaged to obtain the characteristic width of each sinuous rille.
- (2)
- Depth: The depth of a sinuous rille was defined as the difference in average height between the topography around the channel (i.e., wall elevation) and the bottom of the channel. The three profile lines along which width measurements were taken were averaged for depth values at three locations to obtain the depth of each sinuous rille.
- (3)
- Length: The length of the sinuous rilles was obtained by measuring the length of the two walls of the channel and averaging them.
- (4)
- Sinuosity index: This dimensionless index is commonly employed to quantify the degree of sinuous rilles curvature. The sinuosity index is defined as the ratio of the length of the channel to the straight-line distance between the beginning and end of the channel.
The morphometric measurements are presented in the Table S1 (Supplementary Material), which also provides the coordinates in latitude and longitude.
3. Results
3.1. Comparison of Single-Channel and Multi-Model Data Inputs
To verify the validity of the multimodal data, we conducted experiments using DeepLabv3+ on both multimodal data and single-channel data. The single-channel data included optical data, DEM data, and slope data. Table 2 shows that the results from the single-channel analysis indicate that the slope data provide the most accurate results, but the MIoU, recall, precision, and F1-score are all better with multimodal input than with a single channel. The performance of the model was enhanced by integrating multimodal data, as indicated by the 0.92% increase in MIoU, 0.63% increase in recall, 1.52% increase in precision, and a 1.05% increase in F1-score when compared to slope data.

Table 2.
Experiments were conducted on multimodal data input and single-channel input using the sinuate rilles test dataset with DeepLabv3+ trained models. Bold and underlined indicate the best and second-best results of this evaluation index.
3.2. Experiment Using the Multi-Model Sinuous Rilles Dataset
The experimental results in Section 3.1 indicate that the weights of different modal data in the model vary. A simple concatenation operation makes it difficult for the model to find the optimal weights. To address this issue, we introduce a dynamic fusion module to determine the optimal fusion weights.
To validate the performance of the algorithm, SR-Net was compared with other state-of-the-art semantic segmentation models, such as PSPNet, ResUNet, and DeepLabv3+, using both the validation set and the test set. To ensure objectivity, we trained all models using the same input data, a learning rate of 1 × 10⁻⁴, batch sizes of 4, and 100 epochs. Figure 9 shows some of the results after training. The figure illustrates that each model has its strengths and weaknesses in detecting sinuous rilles. These models were able to effectively detect curved sinuous rilles with distinct features. PSPNet utilizes a Spatial Pyramid Pooling module for feature extraction, leading to improved performance on wider sinuous rilles. ResUNet’s encoder–decoder structure leads to an improved performance on narrow sinuous rilles. Overall, DeepLabv3+ combines the advantages of the first two methods and outperforms them. RS-Net combines the Attention Mechanism and Dynamic Fusion Module with DeepLabv3+ to detect targets more accurately.
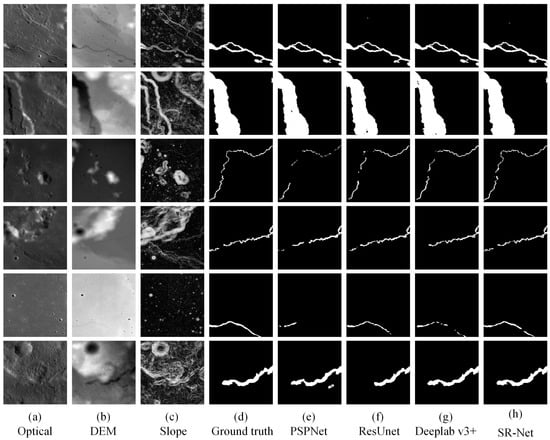
Figure 9.
Some sinuous rille detection results from different networks. (a) Original optical image. (b) Elevation data. (c) Slope data calculated from elevation data. (d) Ground truth from the raw data. (e) The semantic segmentation results of PSPNet. (f) The results of ResUnet. (g) The results of DeepLabv3+. (h) The results of SR-Net. The areas detected as sinuous rilles are represented by white, while the background is black. The approximate coordinates of the sinuous rills in the figure are (0.26°W, 25.27°N), (49.38°W, 25.06°N), (30.20°W, 21.46°N), (52.56°E, 29.45°N), (48.41°E, 40.41°N), and (48.5°W, 24.94°N).
In addition, we tested various models using evaluation metrics, and the results are presented in Table 3. The results indicate that the SR-Net model outperforms the other models in terms of precision, MIoU, recall, and F1-scores. It is further confirmed that the combination of the Attention Mechanism Module and Dynamic Multimodal Feature Fusion Module is effective in improving model performance.

Table 3.
Quantitative results of different network models on the validation dataset and test dataset. Boldface and underline show the best and second-best values, respectively.
It is unfortunate that, in the field of the detection of lunar geological structures, especially linear structures, there are no standard training sets available. Instead, there are usually self-created training, validation, and testing datasets, meaning that models can be tested and evaluated only with their own datasets. For this reason, it is of the utmost importance to construct standardized datasets for future research.
3.3. Detection of Lunar Sinuous Rilles
The trained SR-Net was applied to detect sinuous rilles within the latitude range of 60°S to 60°N. Although it is effective in detecting sinuous rilles, the model has a challenge of incorrectly detecting other linear structures, such as grabens and crater-floor fractures, which are similar to sinuous rilles, as illustrated in Figure 10. From Figure 10, it can be seen that there are still some differences in the linear configuration of these similar negative terrains and that these configurations can be classified based on morphological features. The main morphological features of the sinuous rilles are that they are sinuous in nature and are mostly present with wide sources and thin tails. The grabens are mostly continuous and straight or arcuate, and there are parallel marginal sidewalls on both sides. The crater-floor fractures are mainly located at the bottom of the impact crater and have more complex cross-cutting features. To extract the complete sinuous rilles of the range, we converted the raster data output from the model into editable vector data. We manually excluded elements that are not sinuous rilles and mapped some sinuous rilles that the model did not fully recognize. Although there are some shortcomings in extracting sinuous rilles directly and perfectly, it has enhanced our mapping efficiency.
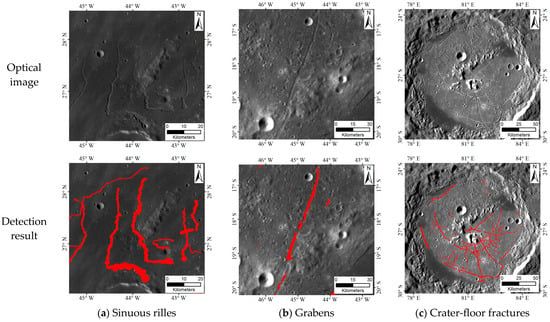
Figure 10.
Accurate detection of sinuous rilles and potential misidentification of other linear structures. The red content in the figure represents the features that have been automatically detected by the model. (a) The results show correct detection of sinuous rilles. (b) The model detects grabens as sinuous rilles. (c) Crater-floor fractures are detected by the model as sinuous rilles.
After screening and mapping, we identified a total of 459 sinuous rilles. These sinuous rilles exclude misclassified features from the previous catalog of sinuous rilles [2] and the 1:2,500,000-scale geologic map of the global Moon [1,4]. Additionally, several sinuous rilles that were previously unmapped were added. The distribution of these sinuous rilles is illustrated in Figure 11. Lu [1] divides the lunar crust into five tectonic units based on tectonic distribution characteristics: the Mare Tectonic Unit (MTU), South Pole-Aitken Tectonic Unit (SPATU), Northern Plain Tectonic Unit (NPTU), Anorthosite Highland Tectonic Unit (AHTU), and Mare–Highland Transition Tectonic Unit (MHTTU). Based on this tectonic unit division system, a statistical analysis was conducted on the extracted sinuous rilles. The results show that there are 376 sinuous rilles located in MTU, 38 in AHTU, 39 in MHTTU, 5 in SPATU, and 1 in NPTU. The sinuous rilles not in the MTU are located within basins or large impact craters. Dark basalts are also found near these sinuous rilles, suggesting that the areas where the sinuous rilles are present were likely volcanically active in the past.
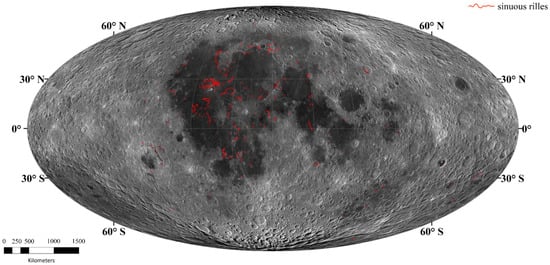
Figure 11.
The global distribution of lunar sinuous rilles. The base image is WAC mosaic-plotted in Mollweide Projection.
3.4. Properties of Detected Sinuous Rilles
The analysis of the attributes of the 459 sinuous rilles in Supplementary Material revealed that the morphology of these features was highly variable, with significant differences in length, width, depth, and curvature indices.
The lengths of sinuous rilles exhibited considerable variability, ranging from 2 km to 699 km (average length, 32 km; median length, 16 km). Notably, 94.8% of sinuous rilles were less than 100 km in length (see Figure 12a). The observed fluctuations in length can be attributed to different lava eruption mechanisms [3]. Longer sinuous rilles may be related to the duration [14] or lava eruption rate [15]. The observed widths of sinuous rilles ranged from 251 m to 5.2 km (average width, 781 m; median width, 578 m). Of these sinuous rilles, a total of 79.7% were less than 1 km in width (as illustrated in Figure 12b). The depths of sinuous rilles were observed to range from 4.5 m to 668 m (average depth, 67.8 m; median depth, 41 m), with 81.6% of the channels less than 100 m deep (see Figure 12c). As illustrated in Figure 12d, the depth of sinuous rilles is found to be linearly related to the observed width of sinuous rilles (R2 = 0.55). However, the linear relationship is found to be poor, which may be attributed to the influence of channel origins resulting from disparate thermal and mechanical erosion processes [3]. It was observed that the sinuosity index values ranged from 1.01 to 3.23, with 10.2% greater than 1.5 and 30.2% less than 1.1 (mean sinuosity index, 1.24; median sinuosity index, 1.16). See Figure 13 for further details.
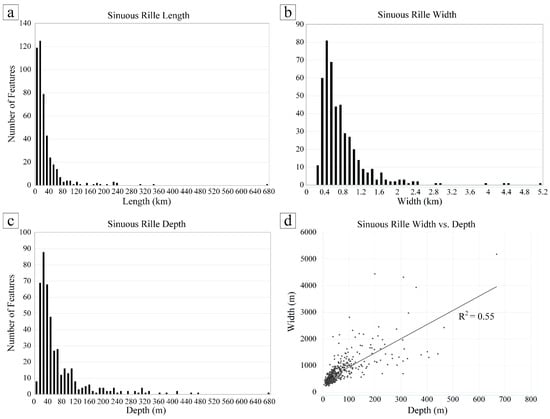
Figure 12.
The observed trends in length (a), width (b), depth (c), and width-to-depth relationship (d) of sinuous rilles are presented herewith.
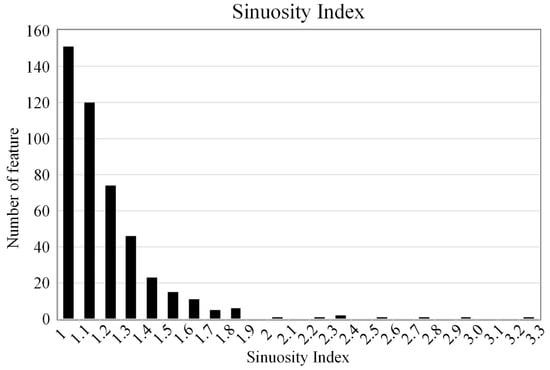
Figure 13.
Trends in observed regional sinuosity indices. The bars represent the number of meandering fine lines observed within the corresponding 0.1 sinuosity index.
A comparison was made with the statistics of Hurwitz [2], which revealed the existence of additional relatively short sinuous rilles. The distribution of widths was found to be comparable to previous studies. However, there were some differences in depth, which may have been caused by differences in the manner in which the measurements were conducted and the points at which they were recorded. In addition, a number of features with low sinuosity indices but exhibiting some of the morphological characteristics of sinuous rilles were also identified.
4. Discussion
Multimodal data can provide rich information acquired by different sensors during model training, reducing the potential errors and uncertainties associated with single-sensor data. These data can futher improve the performance of the model in detecting targets. Multimodal data fusion was utilized to automatically detect sinuous rilles in this study. Table 2 demonstrates that various types of lunar remote sensing data can significantly influence the model’s prediction results, with multimodal data producing the best performance. For this reason, the fusion of multimodal data holds great potential for research in lunar and planetary exploration.
HRM-Net [23] and HR-GLNet [25] are commonly used for the automatic detection of lunar rilles. These models have been able to detect impact craters and rilles at the same time using a single model, without distinguishing between sinuous rilles and straight or curved rilles. They are similar in morphology but different in geological origin [1]. In contrast, our study focuses on the automatic detection of sinuous rilles using a specialized model. Additionally, we created a multimodal dataset of sinuous rilles for model-training purposes. We expect that this dataset will facilitate the study of new machine learning methods for linear structures on the Moon. Although this dataset was manually annotated, it is still a big challenge to ensure complete accuracy. Therefore, during the annotation process, we referred to the previous catalog of sinuous rilles for guidance and meticulously reviewed the annotation information to minimize errors.
In the process of constructing the model, we employed multimodal data fusion, attention mechanisms, and semantic segmentation to establish SR-Net. This model has demonstrated superior performance in detecting sinuous rilles at any scale and accurately classifying them at the pixel level. Furthermore, it has detected numerous sinuous rilles that were previously unidentified. Based on the results of the automated detection, the global distribution of lunar sinuous rilles was effectively mapped. In addition, we catalogued these sinuous rilles (Supplementary Material), which not only contain the latitude and longitude coordinates, width, depth, length, and degree of curvature, of each sinuous rille but also indicate with a number “1” which sinuous rilles were identified in previous studies and which sinuous rilles were newly identified in this study. It is worth mentioning that some of the sinuous rilles identified in the literature [2] with a width of less than 236 m were not detected in this paper. The 18 newly identified sinuous rilles in the literature [3] were also detected by our method, of which the features Rilles Number 42 and 48 in their results were excluded, as we considered them to be crater-floor fractures. And some of the identified features in the literature [1] were not sinuous rilles but grabens, which we also removed. In addition, some sinuous rilles that were one in origin were divided into two sinuous rilles due to destruction by later geological tectonic movements, and they are also divided into two in this paper. We ended up with 143 newly identified sinuous rilles. The global distribution and cataloguing of lunar sinuous rilles could provide important spatial information for future lava tube exploration and base construction, as well as fundamental data on the spatial and temporal distribution of lunar volcanic activity. The method proposed in this paper is also applicable to the automatic detection of other linear structures, the only difference being the need to produce datasets corresponding to other types of linear structures.
However, this study also has some limitations. For our model, it appears to be more sensitive to notch-like linear structures and may incorrectly detect some grabens, crater-floor fractures, and a few secondary craters as sinuous rilles (as shown in Figure 10). During the experimental design phase, we took into account the impact of other linear structures similar to sinuous rilles. We also included a small number of negative samples in the training set for training. Although this issue has been improved, it has not been entirely resolved. Based on preliminary analyses, it appears that the limitations are due to the similarity of the morphological features of these linear structures and the lack of diversity in the training samples. We attempted to include spectral data in our experiments. However, due to their poor quality and lower spatial resolution compared to optical imagery and topographic data, the currently available spectral data for the entire Moon are not significantly effective in detecting elongated formations, such as sinuous rilles. Additionally, creating datasets for other types of linear structures is a complex and time-consuming project. As these issues cannot be resolved in the short term, we have to manually exclude the misidentifications from the detection results. In the future work, we will further enhance the construction of the lunar linear structure dataset. In addition, it is limited by the fact that the current remote sensing data of different modalities have large differences in resolution, varying quality and alignment difficulties. It is difficult to integrate more multimodal data to further enhance our model. With the continuous development of exploration technology, it is possible to obtain more different kinds of high-quality remote sensing exploration data, which could potentially facilitate the research of automatic detection.
5. Conclusions
This paper proposes SR-Net as a semantic segmentation network for detecting lunar sinuous rilles. Additionally, a multimodal dataset of sinuous rilles was constructed. The model is based on the DeepLabv3+ model structure with a dynamic multimodal feature-fusion technique. Optical images, DEM, and slope data are used to train the model. Experiments demonstrate that fusing multimodal data enhances the model’s performance compared to training on a single type of data. SR-Net outperforms typical semantic segmentation models in terms of MioU (93.90%), recall (92.18%), accuracy (95.20%), and F1-score (93.67%) on the sinuous rilles test set. SR-Net was used to detect lunar sinuous rilles, and we effectively mapped the global distribution of sinuous rilles based on the detection results. Furthermore, the results of the detection were catalogued; 143 of them are newly discovered. The approach presented in this paper can enhance the efficiency of detecting lunar linear structures and geological resources in the future. The final model has some limitations, especially in detecting linear structures similar to sinuous rilles, which require further attention. The aim of this work is to contribute to the study of deep learning methods for future lunar and planetary exploration.
Supplementary Materials
The following supporting information can be downloaded at: https://www.mdpi.com/article/10.3390/rs16091602/s1.
Author Contributions
Conceptualization, S.Z. and J.L. (Jianzhong Liu); data curation, J.L. (Jianzhong Liu); formal analysis, S.Z.; funding acquisition, J.L. (Jianzhong Liu), K.Z. and J.L. (Jingwen Liu); investigation, S.Z.; methodology, S.Z.; project administration, J.L. (Jianzhong Liu); resources, J.L. (Jianzhong Liu) and K.Z.; software, S.Z.; supervision, J.L. (Jianzhong Liu); validation, S.Z., G.M., K.Z., D.L. and J.Z.; visualization, S.Z.; writing—original draft, S.Z.; writing—review and editing, S.Z., J.L. (Jianzhong Liu), G.M., K.Z., D.L., J.Z., J.L. (Jingwen Liu) and M.R. All authors have read and agreed to the published version of the manuscript.
Funding
This research was funded by the National Key Research and Development Program of China (Grant No. 2022YFF0503100); the National Natural Science Foundation of China (Grant No. 42202264); the National Natural Science Foundation of China (Grant No. 42302267); the Guizhou Provincial Science and Technology Projects (Grant No. [QKHJC-ZK(2023)-478]); the Key Research Program of the Chinese Academy of Sciences (Grant No. KGFZD-145-23-15); and the Compilation of Chinese Regional Geological Chronicles and Series of Maps (Grant No. DD20221645).
Data Availability Statement
Optical image data from LROC WAC and DEM data from LROA&SELENE used in this study can be downloaded from the website of the United States Geological Survey at https://astrogeology.usgs.gov/search/map/Moon/LRO/LROC_WAC/Lunar_LRO_LROC-WAC_Mosaic_global_100m_June2013, accessed on 18 March 2024 and https://astrogeology.usgs.gov/search/map/Moon/LRO/LOLA/Lunar_LRO_LOLAKaguya_DEMmerge_60N60S_512ppd, accessed on 18 March 2024, respectively.
Acknowledgments
We would like to thank and acknowledge three reviewers for their thoughtful comments that helped to significantly improve our manuscript. We are grateful for the discussion with Pengju Sun and Yaya Gu, whose suggestions were very helpful for our research.
Conflicts of Interest
The authors declare no conflicts of interest.
References
- Lu, T.; Zhu, K.; Chen, S.; Liu, J.; Ling, Z.; Ding, X.; Han, K.; Chen, J.; Cheng, W.; Lei, D.; et al. The 1:2,500,000-scale global tectonic map of the Moon. Sci. Bull. 2022, 67, 1962–1966. [Google Scholar] [CrossRef] [PubMed]
- Hurwitz, D.M.; Head, J.W.; Hiesinger, H. Lunar Sinuous Rilles: Distribution, Characteristics, and Implications for Their Origin. Planet. Space Sci. 2013, 79–80, 1–38. [Google Scholar] [CrossRef]
- Podda, S.; Melis, M.T.; Collu, C.; Demurtas, V.; Perseu, F.O.; Brunetti, M.T.; Scaioni, M. New Morphometric Data of Lunar Sinuous Rilles. IEEE J. Sel. Top. Appl. Earth Obs. Remote Sens. 2020, 13, 3304–3316. [Google Scholar] [CrossRef]
- Ji, J.; Guo, D.; Liu, J.; Chen, S.; Ling, Z.; Ding, X.; Han, K.; Chen, J.; Cheng, W.; Zhu, K.; et al. The 1:2,500,000-Scale Geologic Map of the Global Moon. Sci. Bull. 2022, 67, 1544–1548. [Google Scholar] [CrossRef]
- Micheal, A.A.; Vani, K.; Sanjeevi, S. Automatic Detection of Ridges in Lunar Images Using Phase Symmetry and Phase Con-gruency. Comput. Geosci. 2014, 73, 122–131. [Google Scholar] [CrossRef]
- Peng, M.; Wang, Y.; Yue, Z.; Di, K. Automated detection of lunar ridges based on dem data. Int. Arch. Photogramm. Remote Sens. Spat. Inf. Sci. 2019, XLII-2/W13, 1431–1435. [Google Scholar] [CrossRef]
- Li, K.; Chen, J.; Tarolli, P.; Sofia, G.; Feng, Z.; Li, J. Geomorphometric multi-scale analysis for the automatic detection of linear structures on the lunar surface. Earth Sci. Front. 2014, 21, 212–222. [Google Scholar] [CrossRef]
- Lou, Y.; Kang, Z. Extract the lunar linear structure information by average filtering method based on DEM data. Sci. Surv. Mapp. 2018, 43, 155–160. [Google Scholar] [CrossRef]
- Carr, M.H. The Role of Lava Erosion in the Formation of Lunar Rilles and Martian Channels. Icarus 1974, 22, 1–23. [Google Scholar] [CrossRef]
- Williams, D.A.; Fagents, S.A.; Greeley, R. A Reassessment of the Emplacement and Erosional Potential of Turbulent, Low-Viscosity Lavas on the Moon. J. Geophys. Res. Planets 2000, 105, 20189–20205. [Google Scholar] [CrossRef]
- Hurwitz, D.M.; Head, J.W.; Wilson, L.; Hiesinger, H. Origin of Lunar Sinuous Rilles: Modeling Effects of Gravity, Surface Slope, and Lava Composition on Erosion Rates during the Formation of Rima Prinz: ORIGIN OF RIMA PRINZ. J. Geophys. Res. Planets 2012, 117. [Google Scholar] [CrossRef]
- Greeley, R. Lunar Hadley Rille: Considerations of Its Origin. Science 1971, 172, 722–725. [Google Scholar] [CrossRef][Green Version]
- Gornitz, V. The Origin of Sinuous Rilles. Moon 1973, 6, 337–356. [Google Scholar] [CrossRef]
- Roberts, C.E.; Gregg, T.K.P. Rima Marius, the Moon: Formation of lunar sinuous rilles by constructional and erosional processes. Icarus 2019, 317, 682–688. [Google Scholar] [CrossRef]
- Wilson, L.; Head, J.W. The control of lava rheology on the formation of lunar sinuous rilles by substrate thermal erosion: Topographic and morphometric relationships with eruption rates, erosion rates, event durations, and erupted magma volumes. Planet. Sci. J. 2023, 4, 210. [Google Scholar] [CrossRef]
- Head, J.W. Lunar Volcanism in Space and Time. Rev. Geophys. 1976, 14, 265. [Google Scholar] [CrossRef]
- Xiao, L.; Huang, J.; Zhao, J.; Zhao, J. Significance and preliminary proposal for exploring the lunar lava tubes. Sci. Sin. Phys. Mech. Astron. 2018, 48, 119602. [Google Scholar] [CrossRef]
- Smith, D.J.K.; Pouwels, C.R.; Heemskerk, M.; Cattani, B.M.; Konijnenberg, E.; Heemskerk, R.; Ogalde, S. Overview of the CHILL-ICE 2021 Science Experiments and Research Campaign. Space Sci. Technol. 2022, 2022, 9760968. [Google Scholar] [CrossRef]
- Zhu, K.; Yang, M.; Yan, X.; Li, W.; Feng, W.; Zhong, M. GRAIL Gravity Gradients Evidence for a Potential Lava Tube at Marius Hills on the Moon. Icarus 2024, 408, 115814. [Google Scholar] [CrossRef]
- Krizhevsky, A.; Sutskever, I.; Hinton, G.E. ImageNet Classification with Deep Convolutional Neural Networks. Commun. ACM 2017, 60, 84–90. [Google Scholar] [CrossRef]
- Silburt, A.; Ali-Dib, M.; Zhu, C.; Jackson, A.; Valencia, D.; Kissin, Y.; Tamayo, D.; Menou, K. Lunar Crater Identification via Deep Learning. Icarus 2019, 317, 27–38. [Google Scholar] [CrossRef]
- Ronneberger, O.; Fischer, P.; Brox, T. U-Net: Convolutional Networks for Biomedical Image Segmentation. arXiv 2015, arXiv:1505.04597. [Google Scholar] [CrossRef]
- Chen, S.; Li, Y.; Zhang, T.; Zhu, X.; Sun, S.; Gao, X. Lunar Features Detection for Energy Discovery via Deep Learning. Appl. Energy 2021, 296, 117085. [Google Scholar] [CrossRef]
- Tewari, A.; Verma, V.; Srivastava, P.; Jain, V.; Khanna, N. Automated Crater Detection from Co-Registered Optical Images, Elevation Maps and Slope Maps Using Deep Learning. Planet. Space Sci. 2022, 218, 105500. [Google Scholar] [CrossRef]
- Jia, Y.; Liu, L.; Peng, S.; Feng, M.; Wan, G. An Efficient High-Resolution Global–Local Network to Detect Lunar Features for Space Energy Discovery. Remote Sens. 2022, 14, 1391. [Google Scholar] [CrossRef]
- Latorre, F.; Spiller, D.; Sasidharan, S.T.; Basheer, S.; Curti, F. Transfer Learning for Real-Time Crater Detection on Asteroids Using a Fully Convolutional Neural Network. Icarus 2023, 394, 115434. [Google Scholar] [CrossRef]
- Zhu, Q.; Zhang, Y.; Wang, L.; Zhong, Y.; Guan, Q.; Lu, X.; Zhang, L.; Li, D. A Global Context-Aware and Batch-Independent Network for Road Extraction from VHR Satellite Imagery. ISPRS J. Photogramm. Remote Sens. 2021, 175, 353–365. [Google Scholar] [CrossRef]
- Yang, F.; Zhang, L.; Yu, S.; Prokhorov, D.; Mei, X.; Ling, H. Feature Pyramid and Hierarchical Boosting Network for Pavement Crack Detection. IEEE Trans. Intell. Transp. Syst. 2020, 21, 1525–1535. [Google Scholar] [CrossRef]
- Kim, J.; Kim, H.; Jeon, H.; Jeong, S.-H.; Song, J.; Vadivel, S.K.P.; Kim, D. Synergistic Use of Geospatial Data for Water Body Extraction from Sentinel-1 Images for Operational Flood Monitoring across Southeast Asia Using Deep Neural Networks. Remote Sens. 2021, 13, 4759. [Google Scholar] [CrossRef]
- Chen, L.-C.; Zhu, Y.; Papandreou, G.; Schroff, F.; Adam, H. Encoder-Decoder with Atrous Separable Convolution for Semantic Image Segmentation. In Computer Vision—ECCV 2018; Ferrari, V., Hebert, M., Sminchisescu, C., Weiss, Y., Eds.; Lecture Notes in Computer Science; Springer International Publishing: Cham, Switzerland, 2018; Volume 11211, pp. 833–851. [Google Scholar] [CrossRef]
- Liang, T.; Xie, H.; Yu, K.; Xia, Z.; Lin, Z.; Wang, Y.; Tang, T.; Wang, B.; Tang, Z. BEVFusion: A Simple and Robust LiDAR-Camera Fusion Framework. arXiv 2022, arXiv:2205.13790. [Google Scholar] [CrossRef]
- Wang, Q.; Wu, B.; Zhu, P.; Li, P.; Zuo, W.; Hu, Q. ECA-Net: Efficient Channel Attention for Deep Convolutional Neural Networks. arXiv 2020, arXiv:1910.03151. [Google Scholar] [CrossRef]
- Chen, L.-C.; Papandreou, G.; Kokkinos, I.; Murphy, K.; Yuille, A.L. DeepLab: Semantic Image Segmentation with Deep Convolutional Nets, Atrous Convolution, and Fully Connected CRFs. arXiv 2017, arXiv:1606.00915. [Google Scholar] [CrossRef]
- Robinson, M.S.; Brylow, S.M.; Tschimmel, M.; Humm, D.; Lawrence, S.J.; Thomas, P.C.; Denevi, B.W.; Bowman-Cisneros, E.; Zerr, J.; Ravine, M.A.; et al. Lunar Reconnaissance Orbiter Camera (LROC) Instrument Overview. Space Sci. Rev. 2010, 150, 81–124. [Google Scholar] [CrossRef]
- Barker, M.K.; Mazarico, E.; Neumann, G.A.; Zuber, M.T.; Haruyama, J.; Smith, D.E. A New Lunar Digital Elevation Model from the Lunar Orbiter Laser Altimeter and SELENE Terrain Camera. Icarus 2016, 273, 346–355. [Google Scholar] [CrossRef]
- Zhao, H.; Shi, J.; Qi, X.; Wang, X.; Jia, J. Pyramid Scene Parsing Network. In Proceedings of the 2017 IEEE Conference on Computer Vision and Pattern Recognition (CVPR), Honolulu, HI, USA, 21–26 July 2017; IEEE: Piscataway, NJ, USA, 2017; pp. 6230–6239. [Google Scholar] [CrossRef]
- Guo, M.-H.; Xu, T.-X.; Liu, J.-J.; Liu, Z.-N.; Jiang, P.-T.; Mu, T.-J.; Zhang, S.-H.; Martin, R.R.; Cheng, M.-M.; Hu, S.-M. Attention Mechanisms in Computer Vision: A Survey. Comput. Vis. Media 2022, 8, 331–368. [Google Scholar] [CrossRef]
- Hu, J.; Shen, L.; Albanie, S.; Sun, G.; Wu, E. Squeeze-and-Excitation Networks. arXiv 2019, arXiv:1709.01507. [Google Scholar] [CrossRef]
- Woo, S.; Park, J.; Lee, J.-Y.; Kweon, I.S. CBAM: Convolutional Block Attention Module. arXiv 2018, arXiv:1807.06521. [Google Scholar] [CrossRef]
- Park, J.; Woo, S.; Lee, J.-Y.; Kweon, I.S. BAM: Bottleneck Attention Module. arXiv 2018, arXiv:1807.06514. [Google Scholar] [CrossRef]
- Roy, A.G.; Navab, N.; Wachinger, C. Concurrent Spatial and Channel ‘Squeeze & Excitation’ in Fully Convolutional Networks. In Medical Image Computing and Computer Assisted Intervention—MICCAI 2018; Frangi, A.F., Schnabel, J.A., Davatzikos, C., Alberola-López, C., Fichtinger, G., Eds.; Lecture Notes in Computer Science; Springer International Publishing: Cham, Switzerland, 2018; Volume 11070, pp. 421–429. [Google Scholar] [CrossRef]
- He, K.; Zhang, X.; Ren, S.; Sun, J. Deep Residual Learning for Image Recognition. arXiv 2015, arXiv:1512.03385. [Google Scholar] [CrossRef]
- Zhao, Z.; Bai, H.; Zhang, J.; Zhang, Y.; Xu, S.; Lin, Z.; Timofte, R.; Van Gool, L. CDDFuse: Correlation-Driven Dual-Branch Feature Decomposition for Multi-Modality Image Fusion. arXiv 2023, arXiv:2211.14461. [Google Scholar] [CrossRef]
- Feng, D.; Haase-Schütz, C.; Rosenbaum, L.; Hertlein, H.; Glaeser, C.; Timm, F.; Wiesbeck, W.; Dietmayer, K. Deep Multi-Modal Object Detection and Semantic Segmentation for Autonomous Driving: Datasets, Methods, and Challenges. IEEE Trans. Intell. Transp. Syst. 2021, 22, 1341–1360. [Google Scholar] [CrossRef]
Disclaimer/Publisher’s Note: The statements, opinions and data contained in all publications are solely those of the individual author(s) and contributor(s) and not of MDPI and/or the editor(s). MDPI and/or the editor(s) disclaim responsibility for any injury to people or property resulting from any ideas, methods, instructions or products referred to in the content. |
© 2024 by the authors. Licensee MDPI, Basel, Switzerland. This article is an open access article distributed under the terms and conditions of the Creative Commons Attribution (CC BY) license (https://creativecommons.org/licenses/by/4.0/).