Abstract
The proliferation of invasive plant species poses a significant ecological threat, necessitating effective mapping strategies for control and conservation efforts. Existing studies employing unmanned aerial vehicles (UAVs) and multispectral (MS) sensors in complex natural environments have predominantly relied on classical machine learning (ML) models for mapping plant species in natural environments. However, a critical gap exists in the literature regarding the use of deep learning (DL) techniques that integrate MS data and vegetation indices (VIs) with different feature extraction techniques to map invasive species in complex natural environments. This research addresses this gap by focusing on mapping the distribution of the Broad-leaved pepper (BLP) along the coastal strip in the Sunshine Coast region of Southern Queensland in Australia. The methodology employs a dual approach, utilising classical ML models including Random Forest (RF), eXtreme Gradient Boosting (XGBoost), and Support Vector Machine (SVM) in conjunction with the U-Net DL model. This comparative analysis allows for an in-depth evaluation of the performance and effectiveness of both classical ML and advanced DL techniques in mapping the distribution of BLP along the coastal strip. Results indicate that the DL U-Net model outperforms classical ML models, achieving a precision of 83%, recall of 81%, and F1–score of 82% for BLP classification during training and validation. The DL U-Net model attains a precision of 86%, recall of 76%, and F1–score of 81% for BLP classification, along with an Intersection over Union (IoU) of 68% on the separate test dataset not used for training. These findings contribute valuable insights to environmental conservation efforts, emphasising the significance of integrating MS data with DL techniques for the accurate mapping of invasive plant species.
1. Introduction
The preservation and effective management of plant species within foreshore bushland reserves are paramount for maintaining biodiversity and ecological equilibrium. However, classifying plant species in these ecologically sensitive areas has proven to be a formidable challenge due to their remarkable floristic diversity and intricate spectral characteristics. The utilisation of unmanned aerial systems (UAS) for image acquisition has emerged as a powerful tool in remote sensing research [1,2,3], offering a promising solution to overcome the challenges in identifying and mapping plant species within foreshore bushland reserves. UAS-based image acquisition involves deploying unmanned aerial vehicles (UAVs) equipped with various sensors such as multispectral (MS) [4,5,6,7] and red, green, blue (RGB) [8,9,10,11] to capture high-resolution imagery of the Earth’s surface. These sensors allow for the collection of data across different spectral bands, providing valuable information on vegetation health, structure, and composition. This approach presents several prospects for remote sensing, including high spatial resolution, which enables detailed mapping of land cover and vegetation, and temporal flexibility, which allows researchers to acquire data at specific times and respond rapidly to dynamic environmental changes [12,13]. Additionally, UAV platforms facilitate targeted data acquisition over areas of interest, enhancing data quality and reducing the need for extensive postprocessing. However, the adoption of UAV technology in remote sensing research also presents challenges. Regulatory restrictions [14] such as airspace regulations and permit requirements can pose barriers to UAV deployment. Furthermore, unpredictable weather parameters [15] such as wind conditions, cloud cover, and precipitation can impact flight stability and sensor performance, further complicating data acquisition efforts. UAV-based MS imagery presents distinct differences compared to conducting research over satellite MS imagery. This is different to satellite imagery, which typically provides researchers with a unique combination of high spatial and temporal resolutions [16]. This means that UAVs can capture detailed imagery with fine-grained spatial information, allowing for more precise analysis of vegetation health, land cover, and other environmental variables [17,18,19]. Additionally, UAVs offer greater flexibility and maneuverability in terms of flight paths and angles compared to satellite platforms, enabling researchers to target specific areas of interest with optimal perspectives. These advantages make UAV-based MS imagery particularly well-suited for applications such as the mapping of invasive plant species in natural eco systems.
Artificial intelligence (AI) techniques, including classical machine learning (ML) and deep learning (DL), leverage the power of airborne-collected datasets to automate the classification of plant species covering large extensions of land [20,21,22,23,24,25]. Convolutional Neural Networks (CNNs), a subset of DL algorithms, have revolutionised the field of computer vision and image analysis due to their ability to automatically learn hierarchical representations from raw data [26,27]. Unlike classical ML algorithms and logistic regression, CNNs can automatically discover and leverage complex patterns and relationships within the data, leading to more accurate and robust classification results. Additionally, CNNs can adapt to variations in spectral characteristics and environmental conditions, enhancing their generalisation capabilities [28] across different geographic regions and time periods. By leveraging the spatial and spectral information provided by UAV-based imagery, CNNs can effectively discriminate between different plant species and land cover types, facilitating more detailed and comprehensive mapping of vegetation distribution and dynamics. U-Net CNN architecture was selected for this study due to its well-documented effectiveness in semantic segmentation tasks, particularly in handling complex spatial relationships and capturing fine-grained details in imagery [19,29,30,31]. U-Net architecture possesses several distinctive features that make it suitable for semantic segmentation tasks [32]. Its design comprises a contracting path, often referred to as the encoder, which progressively down samples input images through convolutional and pooling operations, thereby capturing contextual information, and learning hierarchical features at various scales. This process allows U-Net to extract high-level features from input data while reducing spatial dimensions. Following the contracting path is the expanding path (or decoder), which employs transposed convolutions or up sampling operations to restore spatial resolution and localise features with pixel-level accuracy [32,33,34,35]. The skip connections between corresponding layers in the contracting and expanding paths facilitate the propagation of fine-grained spatial information, enabling the network to retain detailed features from earlier layers while incorporating context from higher-level features. This unique architecture enables U-Net to effectively capture both local and global spatial dependencies, making it particularly suitable for extracting fine-grained spatial information from high-resolution multispectral imagery captured by UAVs [36].
Broad-leaved pepper (BLP) (Schinus terebinthifolius) is a garden escapee and is native to Brazil [37]. It has the potential to impact terrestrial biodiversity and conservation environments by smothering and transforming ecosystems, outcompeting recruitment of native plants and reducing the ecological values of natural areas. Additionally, it has the potential impact on community and residential areas by reducing amenity and scenic value of the natural areas. Growing up to 10 m high and broad [37], it can dominate the canopy. Its seeds can be easily dispersed by birds and mammals as well as reproduced from root suckers and human movement, allowing easy encroachment in the coastal dune system. To effectively manage and mitigate the impact of this invasive species, there is a crucial need for tools that can classify and map its distribution, aiding in strategic management and conservation efforts. Therefore, this study explores the application of classical ML models such as Random Forest (RF), eXtreme Gradient Boosting (XGBoost), and Support Vector Machine (SVM) and DL models, exemplified by U-Net, for the classification of BLP within the confines of the study area.
Existing Studies
This literature review reveals a diverse array of studies employing MS, hyperspectral (HS), LiDAR, and thermal imagery for tree species classification, predominantly utilising RF models. Xu et al. (2020) focused on MS and RGB imagery to classify conifer and broadleaf species, achieving an overall accuracy (OA) of 80.2% [38]. Hartling et al. (2021) expanded the sensor suite to MS, HS, LiDAR, and thermal data for classifying specific tree species with an OA of 83.3% [39]. Sivanandam and Lucieer (2022) employed MS and RGB imagery to classify six tree species, reporting OAs of 84% and 93% using RF [40]. Dash et al. (2019) integrated MS and LiDAR data for classifying conifer and background, achieving Kappa values ranging from 40% to 70% [41]. Otsu et al. (2019) focused on MS and RGB imagery to distinguish defoliated, pine, evergreen oak, and shadow categories, demonstrating a high OA of 95% [42]. Franklin and Ahmed (2018) utilised only MS data for classifying sugar maple, aspen, birch, red maple, and other species, achieving an OA of 78% [43]. Collectively, these studies underscore the efficacy of RF models in the classification of tree species across various sensor combinations, showcasing advancements in accuracy and versatility. Another set of studies employed various imageries and SVM models for tree species classification. Hartling et al. (2021) utilised MS, HS, LiDAR, and thermal imagery with SVM to classify specific tree species [39]. Abdollahnejad and Panagiotidis (2020) focused on MS imagery to categorise broad leaves, Norway Spruce, and Scots Pine, and differentiate between dead, healthy, and infected trees, achieving an OA of 81.1% using SVM [44]. Sothe et al. (2019) applied HS imagery to classify 12 tree species with SVM, reporting OAs ranging from 11% to 72.4% [45]. Onishi and Ise (2021) utilised RGB imagery for deciduous broad-leaved tree classification, achieving a high OA of 90% with SVM [46].
Several studies not only employ classical ML methods but also explore the application of DL techniques for enhanced accuracy and precision in plant species classification. The literature review encompasses a series of studies employing RGB imagery and DL models for tree species classification, showcasing remarkable achievements in accuracy and segmentation. Onishi and Ise (2021) achieved a 90% OA using a CNN for deciduous broad-leaved tree classification [46], while Kentsch et al. (2020) applied ResNet50 and U-Net models for distinguishing between deciduous and evergreen trees, reporting high DICE coefficients [47]. Other studies applied U-Net for diverse applications, including classifying nine tree species and related elements [48], tree species classification with different DL architectures [49], semantic segmentation of a single tree species in an urban environment [50], mapping forest types in the Atlantic rainforest [51], and fine-grained segmentation of plant species and communities [52]. There are a few studies applying MS imagery and U-Net models for distinct applications. Hamdi et al. (2019) focused on forest damage assessment using DL such as vegetation mapping and analysis on high-resolution remote sensing data, achieving an impressive OA of 92% with the U-Net model [53]. Freudenberg et al. (2019) targeted large-scale palm tree detection in high-resolution satellite images using U-Net, reporting OAs ranging from 89% to 92% [54].
A notable research gap emerges in the literature concerning the lack of studies that integrate UAV MS imagery and DL models for the classification of tree species in complex natural environments, particularly focusing on BLP species. There is a noticeable lack of exploration regarding the use of DL models, especially concerning their integration with specific vegetation indices (VIs) for classifying invasive plant species. Additionally, while some studies have shown the effectiveness of DL models when applied to RGB data, there is a shortage of research that delves into the application of DL techniques specifically with MS data. The objectives of this study are to (1) explore mapping options using classical ML and DL with UAV-based MS imagery and VIs for BLP along the coastal strip and (2) contribute to biodiversity preservation and sustainable practices, informing decision making for management options within the study area.
2. Methodology
2.1. Processing Pipeline
The methodology section outlines the systematic approach employed in this study to achieve the identification of BLP within the study area. The research methodology encompasses four key stages (Figure 1): (1) data collection and preprocessing, (2) data labelling, (3) model training, and (4) the subsequent testing and prediction processes.
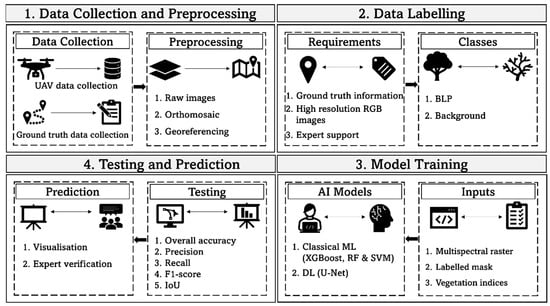
Figure 1.
Processing pipeline for BLP identification using UAV-based spectral data and AI.
2.2. Study Location
This study focuses on the foreshore bushland reserves situated in the Sunshine Coast region of Southern Queensland (Figure 2). The selected areas represent a spectrum of ecological conditions and diverse plant species, including the ecologically significant BLP. The research spans the coastal strip extending from Point Cartwright to Wurtulla within the control of the Sunshine Coast Council (SCC), covering a total area of 93 hectares (ha) along a nine-kilometer stretch of the beach.
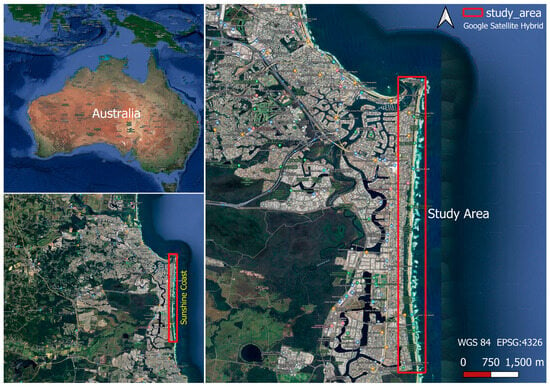
Figure 2.
Study site of coastal strip from Point Cartwright to Wurtulla.
2.3. Data Collection
UAV Data Collection
The studied area encompassed five foreshore bushland reserves, Wurtulla, Bokarina, Warana, Buddina, and Point Cartwright. Aerial spectral imageries were collected through the utilisation of two distinct sensor types including DJI Zenmuse–P1 (Shenzhen, Guangdong, China) for RGB imaging and MicaSense Altum-PT (Eagle Aerial Systems, Inc., Witchita, KS, USA) for MS imaging, both sensors affixed to the DJI Matrice 300 UAV (Shenzhen, Guangdong, China) equipped with Real-Time Kinematic Global Navigation Satellite System (RTK GNSS) technology. The total flight time to capture the RGB imagery was just over 4 h, capturing over 13,312 images. The MS imagery collection took longer, with over 5.5 h needed to capture a total of 26,763 images. Table 1 shows the specification of MicaSense Altum-PT used in this study and Table 2 shows the summary of flight parameters used for RGB and MS data collection. Table 3 outlines the specific dates of the data collection campaigns for UAV RGB and MS imagery.

Table 1.
Comprehensive sensor specifications for MicaSense Altum-PT.

Table 2.
Summary of flight parameters for UAV data collection.

Table 3.
Dates of data capture for RGB and multispectral imagery in five foreshore bushland reserves.
2.4. Ground Truth Data Collection
Five foreshore bushland reserves were further sub divided into eight mapping areas to identify the canopy and sub-canopy of BLP. The ground surveys created polygons over samples of canopy consisting of more than 80% of the selected species. Table 4 presents the time taken and date of ground truth data collection in each mapping area. In Figure 3, the ground truth locations, and designated areas of the Wurtulla site are shown, providing an overview of geographical features and reference points.

Table 4.
BLP ground truthing dates time allocation.
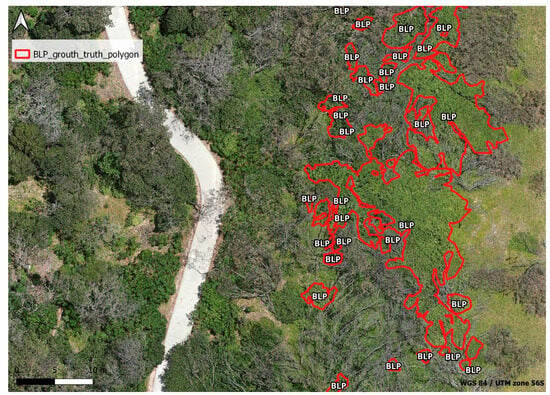
Figure 3.
BLP ground truth locations at Wurtulla site.
2.5. Preprocessing of UAV Imagery
The MS and RGB data obtained from the survey missions along the coastal region were postprocessed to obtain georeferenced orthomosaics. The MS orthomosaics were generated using Agisoft Metashape 1.6.6 (Agisoft LLC, Petersburg, Russia) and the RGB orthomosaics were developed using the Cloud-based platform of DroneDeploy. The MicaSense Altum-PT processing workflow in Agisoft Metashape Professional involved several key steps (Figure 4) to ensure accurate MS data processing.

Figure 4.
MicaSense Altum processing workflow for multispectral orthomosaic generation (including Reflectance Calibration) in Agisoft Metashape Professional.
Georeferencing
The methodology (Figure 5) employed involves georeferencing MS orthomosaic using the RGB orthomosaic as a reference through a third-order polynomial transformation model, comprising parameters for scaling, rotation, and translation using ArcGIS Pro 3.1 (Esri, Redlands, CA, USA).
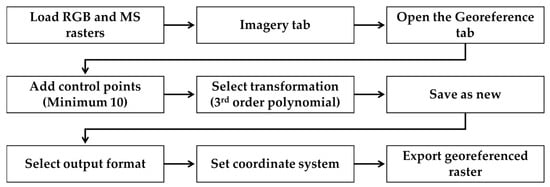
Figure 5.
Outline of processing pipeline for georeferencing of high-resolution RGB and multispectral imagery.
A total of 20 ground control points (GCPs) were chosen strategically across the imagery to ensure a well-distributed representation. This step is crucial due to the challenges posed by identifying different classes in the MS orthomosaic. Using the georeferencing technique significantly reduced the time required for the laborious process of labelling the various classes in the MS orthomosaic data.
2.6. Data Labelling and Extraction of Region of Interest
The labelling process was conducted exclusively for the BLP class, while the remaining areas (background class including other vegetation and non-vegetation) were left unlabeled using image analyst extension tool in ArcGIS Pro 3.1. The data labeling begins with the application of georeferenced high-resolution RGB imagery, ensuring spatial accuracy for subsequent analysis. Ground truth polygons delineating BLP, as detailed in Section 2.4, are overlaid onto the RGB imagery. These ground truth polygons are thoroughly verified by domain experts to ensure accuracy. BLP identification characteristics such as leaf serrations, leaf arrangement, and leaf colour were taken into consideration for labelling purposes. Leveraging the Image Analyst extension tool within ArcGIS Pro, specifically the Classification Wizard and Training Sample Manager functionalities, enables precise labeling of BLP. Drawing tools are employed to manually digitise polygons or points encapsulating BLP class. Each labeled feature is assigned a class ID value, typically denoted as “1”, representing the presence of BLP. Subsequently, the labeled dataset is saved or converted to a GIS vector file format, accompanied by an attribute table containing pertinent information. Figure 6 shows the ground truth labeling of BLP at the Bokarina site with selected ROIs.
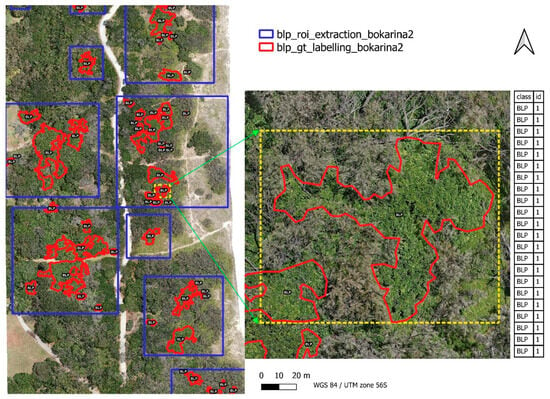
Figure 6.
Ground truth labeling of BLP at the Bokarina site, highlighting BLP population in red within a small region highlighting in yellow dotted lines.
The Python script was developed to rasterise the labelled vector file into raster format (mask) for model training. After labelling, the orthomosaic datasets (12 sites) were subdivided into 104 regions of interest (ROI). These ROIs represent specific areas within the orthomosaic datasets that are selected for further processing and extracted based on ground truth information and labelling. The ROIs vary in size and are not uniform; each one differs in dimensions, with sizes ranging from 400 × 400 to 1600 × 1600 pixels. Training ML models on ROIs offers advantages such as focused training and reduced computational cost. Out of these, 75% of ROIs were allocated for training and validation (number of ROIs: 83), while the remaining ROIs were designated for testing (number of ROIs: 21). The testing ROIs were employed solely for verifying the classification performance of the model and were not applied during the training process.
2.7. Machine Learning for BLP Semantic Segmentation
In this section, we outline our approach to integrating AI techniques such as classical ML and DL U-Net for the semantic segmentation of BLP, encompassing processes such as estimation of VIs, feature selection, and model training and testing.
Estimation of Vegetation Indices and Feature Selection
In Table 5, a set of various VIs (27) employed across different studies showcases the diversity in approaches to classify the vegetations in environmental research. The selected VIs (27) cover a range of vegetation and chlorophyll-related measures, offering a comprehensive set for analysis in the study.

Table 5.
VIs derived from spectral bands including blue (B), green (G), red (R), near-infrared (NIR), and red-edge used for BLP model training and improvement.
The methodology for VI feature extraction involved the utilisation of four distinct techniques: spectral signature analysis, correlation matrix, Variable Importance Factor (VIF) analysis, and Principal Component Analysis (PCA). Each technique was chosen to provide unique insights into vegetation characteristics. Spectral signature analysis leveraged the distinct spectral properties of vegetation to extract relevant features. Correlation matrix analysis was used to select VIs with low correlation. The correlation matrix allowed for the identification of VIs that exhibited minimal correlation with each other, thereby reducing redundancy and enhancing the diversity of information captured by the selected features. VIF analysis was employed to identify and prioritise important features related to VIs. PCA was employed to reduce dimensionality and extract meaningful vegetation features based on principal components. These techniques were selected to obtain different combinations of VI feature sets, allowing for comprehensive testing to determine which combination yielded the best performance for modeling purposes.
2.8. Machine Learning Model Training
The training phase of model was conducted using Python 3.8.10. Geospatial Data Abstraction Library (GDAL) 3.0.2, XGBoost 1.5.0, Scikit-learn 0.24.2, OpenCV 4.6.0.66, Matplotlib 3.8.2, TensorFlow 2.10.0, and Keras 2.10.0 were applied for data processing and ML tasks. Cloud-based high-performance computing (Number of CPUs: 4, Number of GPUs: 1, GPU: A100 (40 GB), Memory: 64 GB) was used to train the U-Net model.
The classical ML model training and testing involved different processing steps to segment the BLP for mapping (Figure 7). After importing the essential Python libraries, the MS input ROIs, and their corresponding mask (labelled raster) ROIs were loaded. These MS input ROIs underwent preprocessing steps, including histogram equalisation for enhancement and calculation of VIs to capture relevant features, and these VIs were integrated into the input MS ROI array using concatenate function. Moreover, a low pass filter was applied to the MS ROIs to reduce noise and improve model performance. Subsequently, empty lists X and y were created to accommodate the features (X) and labeled mask (y). Subsequently, the python scripts proceeded to iterate through each MS input ROIs, filtering labeled data (Id = 1) by generating a mask based on pixel values greater than 0 in the corresponding input labelled mask. This process effectively identified the labeled regions within the mask, facilitating the extraction of features and labels. The extracted features and labels were then converted to NumPy arrays for model training. Following data preprocessing, the training dataset was split into training and testing sets using the train-test split function, allowing for the assessment of model performance on unseen data. Different classical ML classifiers with predetermined parameters were then defined, and it was fitted to the training data. Once the model was trained, the best-performing model was saved to a file for future use. Subsequently, the saved best model was loaded, and its performance was evaluated using the testing ROIs mentioned in Section 2.6.
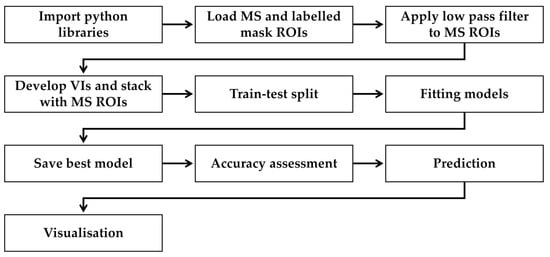
Figure 7.
Processing pipeline for classical machine learning model training for BLP classification.
Figure 8 depicts the key processing pipeline specifically designed for training DL U-Net models, emphasising the distinct stages and methodologies essential for leveraging neural networks in image segmentation tasks. Following Python library imports, a function for the estimation of VIs is defined to compute VIs from MS input ROIs. Subsequently, the MS ROIs and labeled mask ROIs undergo a tiling process, dividing them into smaller patches (32 × 32, 64 × 64, 128 × 128, 256 × 256, 512 × 512) to streamline model training. Furthermore, masks are transformed into categorical representation through one-hot encoding, preparing them for semantic segmentation tasks. Once the data were split into training and testing sets using scikit-learn’s ‘train_test_split’ function, they were fed to DL U-Net architecture.
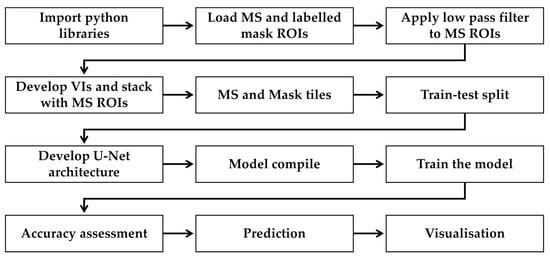
Figure 8.
Processing pipeline for DL U-Net model training for BLP classification.
The architecture is characterised by a U-shaped structure featuring a contracting path followed by an expansive path (Figure 9). In the contracting path, the input ROIs undergo a series of convolutional layers interspersed with max-pooling operations. These layers progressively reduce the spatial dimensions of the feature maps while increasing their depth, allowing the model to capture hierarchical features at different levels of abstraction. After reaching a bottleneck layer, the expansive path begins, where the feature maps are up sampled through deconvolutional layers. Concurrently, skip connections are established between corresponding layers in the contracting and expansive paths, facilitating the integration of both local and global context information. These connections enable precise localisation of objects and improve segmentation accuracy. The model is then compiled with the Adam optimizer and categorical cross-entropy loss, marking the preparation phase for model training. At the end of the network, a convolutional layer with softmax activation is applied to generate pixel-wise predictions for each class. This produces a segmentation map where each pixel is assigned a probability distribution over the different classes, allowing for the fine-grained classification of regions within the image. After model training, the best model checkpoint is saved based on validation loss, ensuring optimal performance. Finally, the best model was evaluated by testing ROIs to assess its generalisation ability and ensure its effectiveness in segmenting unseen regions.

Figure 9.
U-Net architecture used for BLP classification.
The complexity and inference speed of the U-Net model are indeed critical considerations in its deployment for practical applications. Various modules within the U-Net architecture contribute to its overall complexity and inference speed, each playing a crucial role in its performance. The convolutional layers within the U-Net architecture perform feature extraction and hierarchical representation learning. The number of convolutional layers and their filter sizes significantly impact the model’s receptive field and feature extraction capabilities. However, an excessive number of convolutional layers can increase model complexity and inference time. Skip connections between corresponding encoder and decoder layers facilitate the fusion of low-level and high-level features, enhancing the model’s segmentation accuracy. However, the inclusion of skip connections increases the number of parameters in the model, leading to higher complexity.
2.9. Parameter Tunning for Model Improvement
For the RF model utilised in BLP classification, several key hyperparameters were fine-tuned. This includes parameters such as the number of decision trees (n_estimators) and the maximum depth of each tree (max_depth). In the SVM model employed for BLP classification, a radial basis function (RBF) kernel was utilised. The RBF kernel is effective in capturing complex relationships within the data and is particularly suitable for nonlinear classification tasks. XGBoost is configured with parameters specifically designed for gradient-boosted decision trees. While XGBoost does not directly use kernel functions like SVM, it allows for fine-tuning of parameters related to boosting rounds, learning rates, and the objective function. These parameters were adjusted to control the boosting process and prevent overfitting during model training. Table 6 summarises the key parameters and configurations used in the U-Net model improvement. It outlines the preprocessing steps, model architectures, and training settings. Preprocessing involves the selection of different bands, VIs, patch sizes, and the application of low-pass and Gaussian blur filters. Many model architectures were employed, each with varying characteristics such as the number of convolution layers and dropout rates. Also, different number of learning rates, batch sizes, and epochs were used for model training and tuning.

Table 6.
Parameter tunning for U-Net model improvement.
The chosen settings for each parameter category aim to comprehensively explore the model’s capability to learn from the input data, generalise unseen samples, and achieve superior performance in segmentation tasks. The selection of different bands, VIs, and patch sizes allows for the examination of how these factors impact the model’s ability to extract meaningful features and classify vegetation effectively. By including options such as using all bands, selecting specific bands, or incorporating VIs, the aim is to identify the most informative input data representation for the model. Similarly, applying low pass and Gaussian blur filters at different sizes enables the evaluation of their effects on noise reduction and feature preservation in the input data. Variations in the number of convolution layers and dropout rates in the model architecture influence its capacity to learn hierarchical representations and prevent overfitting. By testing different architectures with varying layer configurations and dropout rates, the goal is to find an optimal balance between model complexity and generalisation ability. Tuning parameters such as learning rate, batch size, and number of epochs during model compilation and training significantly impact the convergence speed and final performance of the model. The selection of appropriate learning rates ensures efficient gradient descent optimisation, while adjusting batch size and epochs affects the stability and convergence of the training process.
2.10. Model Testing
The models were evaluated and compared based on their performance metrics and ability to handle different classes effectively in a classification scenario. OA, precision, recall, F1–score, and Intersection over Union (IoU) were used to evaluate the model’s performance for the classification of BLP. Evaluation descriptors, including true positive (TP), false positive (FP), true negative (TN), and false-negative (FN), were used to determine the overall accuracy (Equation (1)), precision (Equation (2)), recall (Equation (3)), F1–score (Equation (4)), and IoU (Equation (5)).
2.11. Model Prediction and Segmentation Map
Each orthomosaic underwent cropping into 256 × 256 tiles (image patches) using the split raster function within ArcGIS Pro to enable the prediction of the entire orthomosaic for each site. To address the challenge of detecting BLP lying at the edges of consecutive tiles, a deliberate strategy was employed during the orthomosaic splitting phase. Firstly, the orthomosaic was divided into 256 × 256 tiles, incorporating a 10% overlap between neighboring tiles. This overlap ensured that BLP spanning the boundaries of adjacent tiles were not missed during prediction. Following this, the individual tiles underwent prediction employing the selected best model based on testing performance. To preserve the spatial reference integrity of prediction tiles, the geotransform parameters and projection information of the original MS image tiles were retrieved using the GDAL library, ensuring accurate georeferencing of the predicted image. Subsequently, the predicted image was reshaped to 2D by selecting the class with the highest probability for each pixel, achieved through argmax function provided by the NumPy library in Python along the specified axis. A new file was then created to store the predicted image data in ENVI format, written to the specified directory, and supplemented with spatial reference information. Finally, in ArcGIS Pro, the merging of predicted tiles for each site was facilitated by accessing the merge raster tool under the raster function in the data management category. This enabled the seamless combination of individual predicted tiles into a single raster (orthomosaic) dataset, ensuring a cohesive representation of the entire study area’s distribution of BLP.
3. Results
3.1. Selection of Vegetation Indices
From the spectral signature plot analysis (Figure 10 and Figure 11), the top five features included two specific bands (NIR and red-edge) and five VIs (MSAVI, EVI, OSAVI, TVI, and DVI) were selected for ML model training. These features were identified based on spectral difference between two classes through spectral signatures.
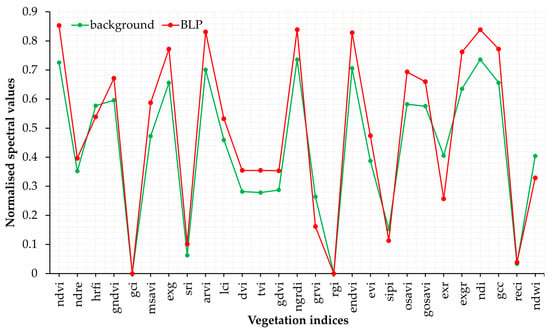
Figure 10.
Spectral signature differences for various VIs.
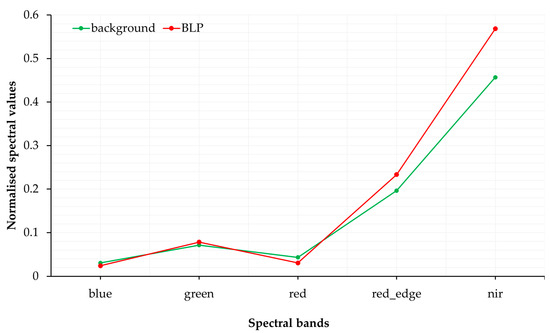
Figure 11.
Spectral signature difference for spectral bands.
The VIF analysis highlighted several crucial VIs based on their VIF values (Figure 12). These included SRI, RECI, EVI, GCI, and RGI. Through correlation matrix analysis, the VIs including GCI, SRI, RGI, OSAVI, and RECI were selected based on their low correlation coefficients (Figure 13). Additionally, PCA revealed essential vegetation features, with the following prominent features including GOSAVI, NGRDI, GRVI, EVI, and RECI. Table 7 illustrates the selected VIs through different feature selection techniques.
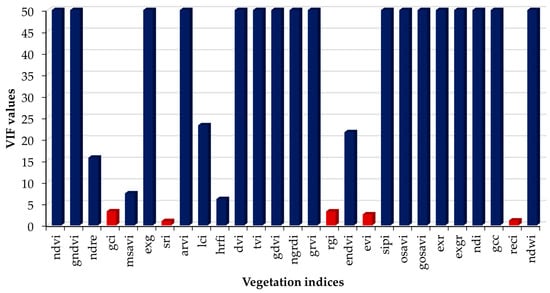
Figure 12.
Variable importance factor (VIF) values for different VIs.
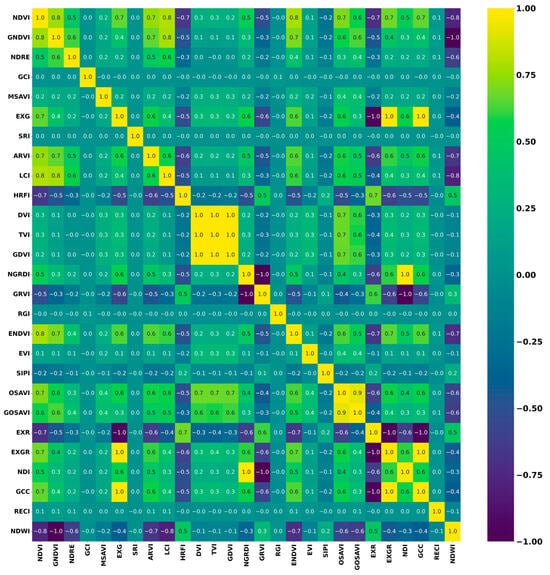
Figure 13.
Correlation heatmap for different VIs used in this study.

Table 7.
Summary of selected VIs using different feature extraction techniques.
3.2. Performance of Classical Machine Learning Models
The best performances were obtained using a feature set with five spectral bands and the top five VIs selected from PCA feature extraction technique. Among the explored models, the RF Classifier performed well with “n_estimators” = 150 and “max_depth” = 16. SVM used a radial basis function (RBF) kernel for capturing complex relationships within the data. The XGBoost Classifier, employing gradient-boosted decision trees, showed efficacy with an objective set to “binary: logistic” and “n_estimators = 100”. Table 8 provides a comprehensive comparison of best performance metrics, including precision (P), recall (R), F1–score, and OA, for the background and BLP classes across three different classical ML models (XGBoost, RF, SVM) during the training, validation, and testing phases. During the training and validation stages, RF exhibited the highest overall accuracy at 93%, outperforming both XGBoost (91%) and SVM (76%). In the subsequent testing phase, RF maintained a relatively high overall accuracy of 77%, surpassing XGBoost with 80%, while SVM exhibited a lower overall accuracy of 62%. However, RF demonstrated the best performance in predicting BLP compared to XGBoost and SVM, particularly in terms of BLP precision. Figure 14 showcases the BLP prediction outcomes derived from the RF model, delineating the training and testing phases, within a specified region of interest in the Bokarina study site.

Table 8.
Comparison of performance metrics (precision, recall, F1–score, Overall Accuracy) for Background and BLP classes across different classification models (XGBoost, RF, SVM) in training, validation, and testing phases.
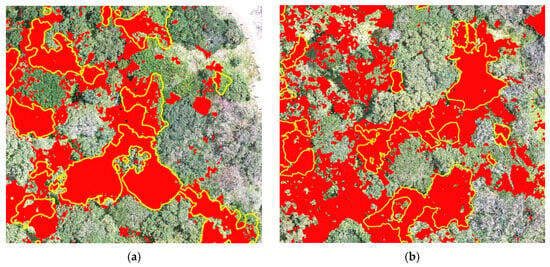
Figure 14.
BLP prediction outcomes generated by RF model at region of interest in Bokarina study site: yellow polygons represent ground truth labels, regions highlighted in red denote prediction outcomes (a) training phase, (b) testing phase.
3.3. Performance of U-Net Model
The results obtained from the best hyperparameters are explained in this section. The best hyperparameters include patch size of 256 × 256. Without any filters, optimal configuration includes convolution layers ranging from 64 to 1024, dropout rate of 0.2, learning rate set at 0.001, and batch size of 30 with 200 epochs. Table 9, Table 10 and Table 11 present performance metrics, including precision, recall, F1–score, and IoU, for both background and BLP classes throughout the training, validation, and testing phases of the U-Net model using the best hyperparameters with different feature sets. All VIs (27) feature set generally performs better in terms of precision, recall, F1–score, and IoU for the background class, while the five bands feature set performs better for the BLP class, especially in terms of precision and recall during training and validation. However, when it comes to testing, the performance drops for both feature sets, with the All VIs (27) showing a slightly better performance for the background class and the 5 bands showing better results for the BLP class (Table 9).

Table 9.
U-Net model in training, validation, and testing performance metrics (precision (P), recall (R), F1–score (F1), and Intersection over Union (IoU)) for background and BLP classes using two feature sets (5 bands and all 27 vegetation indices) without feature extraction technique.

Table 10.
U-Net model in training, validation, and testing performance metrics (precision (P), recall (R), F1–score (F1), and Intersection over Union (IoU)) for background and BLP classes using four feature extraction techniques.

Table 11.
U-Net model in training, validation, and testing performance metrics (precision (P), recall (R), F1–score (F1), and Intersection over Union (IoU)) for background and BLP classes using spectral signature technique.
The findings indicated that the five VIs from spectral signature plot extraction technique consistently yielded superior precision and recall for both background and BLP classes across all phases, with precision ranging from 96% to 82% and recall ranging from 93% to 87%. Conversely, the five VIs from VIF extraction technique exhibited notably lower precision and recall, particularly for the BLP class, with values as low as 49% and 31%, respectively. During testing, performance generally declined across all techniques compared to training and validation, with the five VIs from spectral signature plot technique maintaining relatively better performance. These results underscore the critical role of feature extraction techniques in optimising the U-Net model performance for land cover classification tasks (Table 10).
Table 11 outlines the performance metrics of a U-Net model using the spectral signature technique across training, validation, and testing phases. The second feature set (two bands with five VIs) consistently demonstrates higher precision, recall, F1–scores, and IoU metrics for both background and BLP classes during all phases compared to the first set (two bands and three VIs). Therefore, based on all the techniques mentioned above, two bands (NIR and red-edge) and five VIs (MSAVI, EVI, OSAVI, TVI, DVI) extracted from spectral signature plot technique show the best performance to classify the BLP in this study. Figure 15 shows the visual representation of selected top five VIs from spectral signature plot for model improvement.
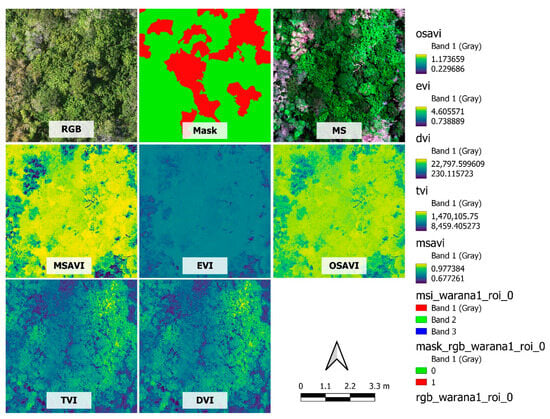
Figure 15.
Visual representation of the RGB regions of interest with respective labelled mask, multispectral, and selected VIs.
Figure 16 illustrates the precision (P) and recall (R) rates of BLP class for different feature sets in a testing dataset. Five bands alone attained a precision of 77% and a recall of 60%, while all VIs yielded a precision of 67% and a recall of 42%. When considering only five VIs, the precision increased to 83% with a recall of 75%. Combining five bands with five VIs resulted in a precision of 76% and a recall of 63%. However, using only two bands with three VIs led to lower rates of precision (59%) and recall (50%). Notably, the combination of two bands and five VIs achieved the highest precision at 86%, accompanied by a recall of 76%.
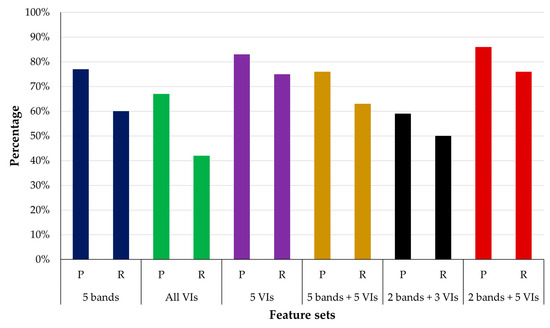
Figure 16.
Comparison of U-Net model performance (precision (P) and recall (R) for BLP) using different feature sets in testing dataset.
3.4. Training Plots
Figure 17 presents the training plot of the U-Net BLP model, showcasing key performance metrics. The training process unfolds over 155 epochs, revealing an evolving trend in various performance metrics. In the initial stages, the model demonstrates a significant increase in training accuracy, reaching 70.2% in the first epoch, and progressively climbing to 99.4% by the 155th epoch. Validation accuracy follows a similar upward trajectory, from 24.6% to 91.4% (Figure 17a). Training and validation losses exhibit a consistent decline over epochs, with training loss dropping from 628,799,081 to 0.0159 and validation loss decreasing from 8,051,853.5 to 0.4207 (Figure 17b). In summary, the model undergoes substantial improvement across epochs, achieving high accuracy, low loss, increased precision, and minimised false positives, indicative of its robust learning and generalisation.
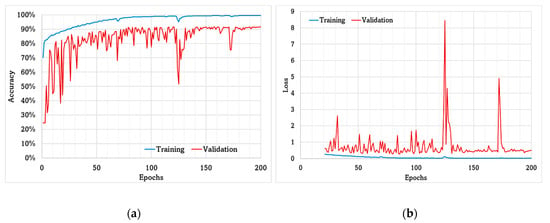
Figure 17.
U-Net BLP model training plot: (a) accuracy, (b) precision (BLP).
3.5. Cross Validation
Figure 18 provides an overview of the K-fold cross-validation results for the BLP U-Net model. Figure 18a displays the accuracy of the model across different folds, demonstrating its consistency and performance, while Figure 18b visualises the loss, indicating the model’s error rate during cross-validation. Additionally, the model’s overall performance across all folds is summarised with an average validation binary accuracy of approximately 90.83% with the standard deviation of 1.58 and an average validation binary loss of approximately 0.45 with the standard deviation of 0.15.
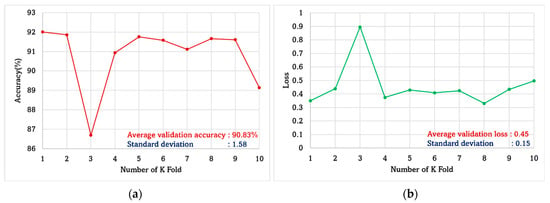
Figure 18.
K-fold cross-validation for BLP U-Net model: (a) accuracy, (b) loss metrics.
3.6. Prediction of Multispectral ROIs from Testing Dataset
The methodology involved utilising the best performing U-Net model, optimised through rigorous hyperparameter tuning, in conjunction with a feature set comprising two bands and five VIs, to predict ROIs within the testing dataset and the entire orthomosaic across all designated sites. Figure 19 illustrates the BLP prediction map for the testing ROIs in Warana 1 site, showcasing the outcomes generated by the U-Net model. The figure includes key elements such as high-resolution RGB images in the first column, MS ROIs in the second column, label masks in the third column, and U-Net predictions in the fourth column. In this representation, the green colour signifies the background, while red indicates the presence of the target species for BLP.
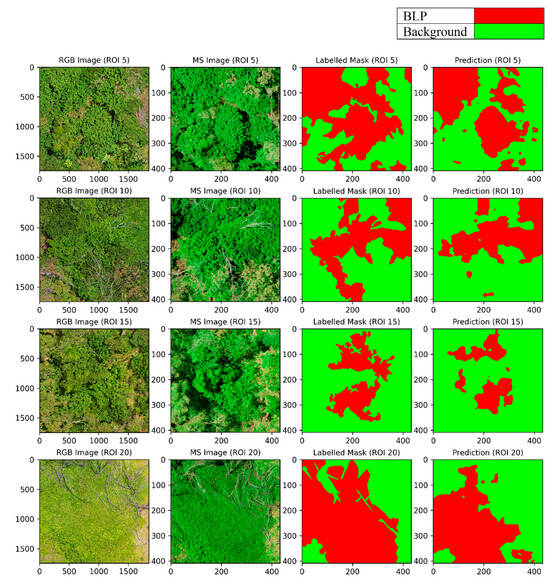
Figure 19.
BLP prediction outcomes generated by U-Net model showcasing selected ROIs from testing phase. Representation includes RGB images, MS views, corresponding labelled masks, and U-Net model predictions.
3.7. Visualisation of Prediction Maps
In Figure 20, U-Net predictions are showcased featuring a high-resolution RGB image of the entire study area at the Bokarina2 site, overlaid on a Google Earth satellite image. Figure 20b offers a closer examination of the model’s output with a zoomed-in view, providing finer details of the prediction. Figure 21 illustrates the integration of a Google Earth satellite image, presenting a specific site within Bokarina2 overlaid with BLP predictions highlighted in red. This depiction underscores the spatial accuracy of the model in identifying target species within the study area.
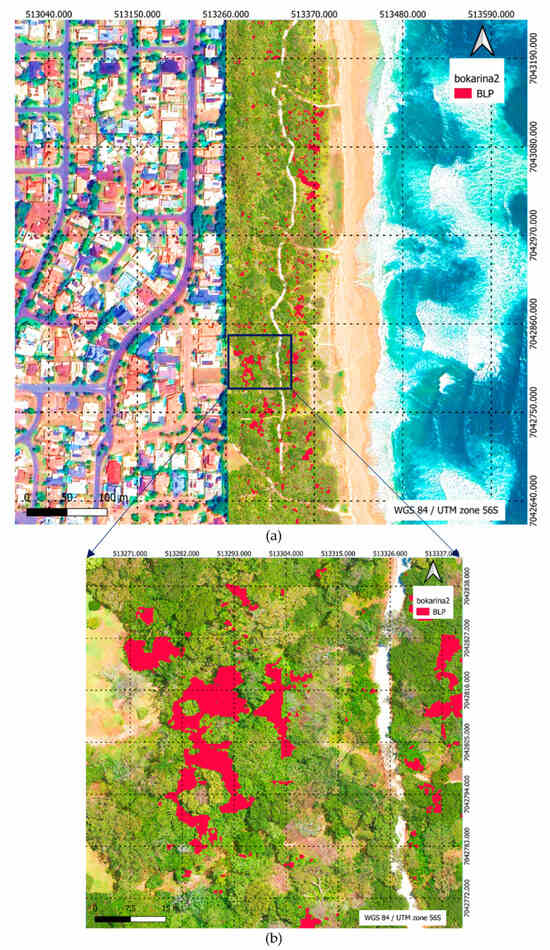
Figure 20.
U-Net predictions, encompassing high-resolution RGB image of entire study area of Bokarina2 site overlaid on Google Earth satellite image. (a) U-Net predictions depicted with BLP highlighted in red, (b) offers zoomed-in view of prediction, providing closer examination of model’s output at a more detailed level.
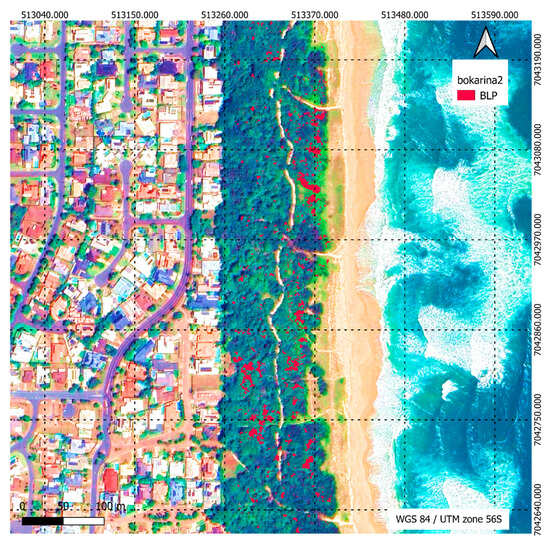
Figure 21.
Integration of Google Earth satellite image depicting site within Bokarina2 overlaid with BLP predictions highlighted in red, illustrating model’s spatial accuracy in identifying target species.
4. Discussion
This study investigates an in-depth exploration of the distribution mapping of significant coastal invasive plant species of BLP. Our study responds to the critical need for precise plant species classification in ecologically diverse coastal regions by employing cutting-edge technologies including UAV-based remote sensing and AI. This research is a novel approach not explored in previous studies targeting these plant species. In the broader landscape of plant species classification studies in different plant types in similar environments, it is noteworthy that the majority have leaned towards the utilisation of classical ML models, with notable instances of RF, SVM, and KNN [39,44,45,70,71,72,73], while past works [47,48,50,52,53,54,74] have provided valuable insights into the U-Net model classification of various plant types using RGB and MS imagery collected by UAV or satellite. These existing studies obtained an OA range between 84% and 97% for the classification of different classes in natural environments. Our research extends this narrative by employing a hybrid approach, utilising classical ML models such as RF, XGBoost, and SVM, alongside DL models like U-Net which obtained better results than classical ML models. In comparison to existing studies that have primarily focused on different plant types in similar natural environments, our research looks at applying UAVs and MS technology to classify the specific plant species of BLP. Comparing our findings to existing studies, our research builds upon the foundation laid by prior researchers [53,54,75] in utilising MS sensor technology and UAVs for ecological mapping using different DL models. Our findings reveal that the DL U-Net model outperformed other models, exhibiting promising results in the classification of BLP during testing. Other researchers also incorporated the DL models, such as U-Net to increase the overall accuracy of classification [50,74]. Therefore, our study stands out in the realm of plant species classification, with a complex environment.
The discussion explores the performance of various feature sets in a classification task, focusing on precision, recall, F1–score, and IoU metrics during training, validation, and testing phases. The results underscore the significance of feature richness and diversity in achieving accurate classifications. While feature sets comprised solely of bands or VIs exhibit limitations in performance, the integration of both spectral bands and VIs demonstrates more balanced outcomes, suggesting the complementary nature of these features in capturing relevant information for classification. Notably, the combination of two bands and five VIs emerges as a promising approach, offering strong performance across all metrics, particularly in testing. This highlights the importance of considering a diverse range of features in remote sensing classification tasks to ensure robust and reliable results, emphasising the potential benefits of integrating multiple data sources for improved accuracy and generalisation.
We identified two bands (NIR and red-edge) and five VIs (MSAVI, EVI, OSAVI, TVI, and DVI) as the optimal combination for accurate BLP detection. These features were chosen based on their strong correlation with the response variable and their demonstrated effectiveness in capturing relevant spectral information indicative of BLP presence. Techniques such as spectral signature plot analysis revealed the discriminative power of these features, highlighting their ability to differentiate BLP from surrounding features. Each VI possesses unique characteristics that contribute to its effectiveness in vegetation classification and monitoring. MSAVI excels in reducing soil background noise, ensuring accurate detection of vegetation even in areas with significant soil influence [76]. EVI stands out for its ability to minimise atmospheric influences and soil brightness effects, providing improved sensitivity to canopy structural variations crucial for multi-temporal studies [77]. OSAVI is tailored to address soil brightness variations and atmospheric influences, maintaining high sensitivity to vegetation changes while minimising soil background noise [78]. TVI comprehensively captures vegetation vigor and health, demonstrating resilience to atmospheric disturbances and soil variability, thus making it valuable for assessing plant health [79]. DVI offers a straightforward measure of vegetation greenness and is widely applicable in vegetation monitoring tasks, owing to its sensitivity to changes in vegetation biomass and canopy structure [80,81].
In our study, the training plot exhibits a smoother trend compared to the test plot, a phenomenon attributed to the inherent complexities within our dataset. The dataset is characterised by significant environmental variations and the coexistence of multiple plant species including Alectryon coriaceus, Cupaniopsis anacardioides, and Alphitonia excelsa, which have similar morphological characteristics, leading to more pronounced fluctuations, especially in the early stages of each epoch. This complexity poses challenges during model training, making it more difficult for the algorithm to generalise effectively due to spectral heterogeneity. Moreover, the lower resolution of the MS images further amplifies these challenges, introducing a layer of ambiguity in feature extraction. Understanding and addressing these complexities is crucial for improving the model’s performance, particularly in scenarios where environmental factors and overlapping species contribute to the overall complexity of the dataset. However, as the epochs progress, there is a noticeable reduction in fluctuations in the test plot, eventually converging towards a smoother trajectory, indicating improved model stability and generalisation over time. Furthermore, both models exhibit a very low standard deviation in the context of cross-validation. This suggests that the performance metrics across different folds or iterations of the cross-validation process are consistently close to the mean. This can be interpreted as a positive sign, indicating that the models are robust and yield stable results across diverse subsets of the data. The low standard deviation observed in cross-validation metrics for both models signify a high level of stability and consistency in their performance across various folds or iterations. The low variability in performance metrics provides confidence in the reliability of the models, suggesting that their effectiveness is not contingent on specific data splits and reinforcing their potential for generalisation to test data.
5. Limitations of the Study
One of the fundamental limitations of this study was the absence of ground control points (GCPs) during flight missions. RTK GNSS technology was used to capture data from the field, yet we faced difficulties in achieving perfect alignment between the RGB and MS imagery. Shadow and blur effects within the MS imagery introduced inaccuracies in the labelling process. In the densely vegetated environment of these study areas, we frequently encountered challenges from the overlapping canopies of various plant species. This overlap made it difficult to accurately label the target species and, in turn, reduced the overall accuracy of our models. The presence of other plant species that closely resembled the BLP added another layer of complexity to our research. Due to the growth form of BLP, it was possible to identify their trunks to see overall BLP populations in dense infestations during ground-truthing. However, mapping the canopy cover by ground distribution was difficult due to the growth form of BLP and accessibility of the sites. Additionally, in many of the foredune areas, native Horsetail she-oaks (Casuarina equisitifolia) obscure the aerial visibility of BLP.
6. Conclusions and Recommendations
In conclusion, this study mapped the distribution of BLP along the coastal strip, leveraging UAV-based MS technology and AI. Among the models tested, the DL U-Net model exhibited the most promising results with a feature set of two specific bands including (NIR) and red-edge, along with five key VIs including MSAVI, EVI, OSAVI, TVI, and DVI. It is worth noting that the complexity of BLP presented a particular challenge in accurate identification from aerial imagery. The findings underscore the importance of tailoring models to the unique characteristics of plant species and highlight the potential for further research in addressing the challenges associated with complex plant types. This study provides valuable insights into the capabilities and limitations of utilising remote sensing and AI for plant classification and offers a foundation for future research directions in natural environment settings. The implementation of DL models like the U-Net model for classifying BLP in a natural environment significantly contributes to biodiversity preservation and informed decision-making for management options.
The vital recommendation for future research is the integration of GCPs during flight missions. GCPs serve as a crucial reference, aiding in precise georeferencing and aligning RGB and MS imagery. Future studies should focus on strategies to mitigate shadow and blur effects in MS imagery. This could involve collecting data under more controlled lighting and environmental conditions to minimise these issues. To address and minimise shadow effects in UAV-based studies conducted in natural environments, several recommendations can be implemented. The effectiveness of plant species identification in complex natural environments can be greatly improved by diversifying the selection of DL models and applying various image preprocessing techniques. Incorporating a range of DL models, including other CNN models, RNNs, and DNNs offers the advantage of harnessing distinct architectural strengths.
Author Contributions
Conceptualizations, N.A., F.V., M.H. and A.W.; methodology, N.A., F.V., M.H. and A.W.; software, N.A. and F.V.; validation, M.H. and A.W.; formal analysis, N.A.; investigation, N.A., F.V., M.H. and A.W.; resources, F.V. and M.H.; data curation, M.H. and A.W.; writing—original draft preparation, N.A.; writing—review and editing, F.V., M.H., A.W. and F.G.; visualisation, N.A.; supervision, F.V., M.H. and F.G.; project administration, F.V. and M.H.; funding acquisition, M.H. All authors have read and agreed to the published version of the manuscript.
Funding
This project is conducted through the Invasive Weeds Project and funded through the SCC Environmental Levy.
Data Availability Statement
Data relevant to this study can be provided upon request.
Acknowledgments
Sunshine Coast Council (SCC) partnered with Peter Trotter from Aspect UAV and QUT to undertake this trial. We would like to acknowledge the support and assistance from Sunshine Coast Council officers Sarah Jones and Timothy Byrne, and Ricardo Burgos Granados for undertaking the labelling process.
Conflicts of Interest
The authors declare that they have no conflicts of interest related to this research.
References
- Bolch, E.A.; Hestir, E.L.; Khanna, S. Performance and Feasibility of Drone-Mounted Imaging Spectroscopy for Invasive Aquatic Vegetation Detection. Remote Sens. 2021, 13, 582. [Google Scholar] [CrossRef]
- Abeysinghe, T.; Milas, A.S.; Arend, K.; Hohman, B.; Reil, P.; Gregory, A.; Vázquez-Ortega, A. Mapping Invasive Phragmites Australis in the Old Woman Creek Estuary Using UAV Remote Sensing and Machine Learning Classifiers. Remote Sens. 2019, 11, 1380. [Google Scholar] [CrossRef]
- da Silva, S.D.P.; Eugenio, F.C.; Fantinel, R.A.; Amaral, L.d.P.; dos Santos, A.R.; Mallmann, C.L.; dos Santos, F.D.; Pereira, R.S.; Ruoso, R. Modeling and Detection of Invasive Trees Using UAV Image and Machine Learning in a Subtropical Forest in Brazil. Ecol. Inform. 2023, 74, 101989. [Google Scholar] [CrossRef]
- Li, X.; Ba, Y.; Zhang, S.; Nong, M.; Zhang, M.; Wang, C. Sugarcane Nitrogen and Irrigation Level Prediction Based on UAV-Captured Multispectral Images at the Elongation Stage. bioRxiv 2020. [Google Scholar] [CrossRef]
- Hoffrén, R.; Lamelas, M.T.; de la Riva, J. UAV-Derived Photogrammetric Point Clouds and Multispectral Indices for Fuel Estimation in Mediterranean Forests. Remote Sens. Appl. 2023, 31, 100997. [Google Scholar] [CrossRef]
- Arnold, T.; De Biasio, M.; Fritz, A.; Leitner, R. UAV-Based Multispectral Environmental Monitoring. In SENSORS, 2010 IEEE; IEEE: Piscataway, NJ, USA, 2010; pp. 995–998. [Google Scholar] [CrossRef]
- Nebiker, S.; Annen, A.; Scherrer, M.; Oesch, D. A Light-Weight Multispectral Sensor for Micro UAV—Opportunities for Very High Resolution Airborne Remote Sensing. Int. Arch. Photogramm. Remote Sens. Spat. Inf. Sci. 2008, 37, 1193–1200. [Google Scholar]
- Diez, Y.; Kentsch, S.; Fukuda, M.; Caceres, M.L.L.; Moritake, K.; Cabezas, M. Deep Learning in Forestry Using Uav-Acquired Rgb Data: A Practical Review. Remote Sens. 2021, 13, 2837. [Google Scholar] [CrossRef]
- Zheng, J.Y.; Hao, Y.Y.; Wang, Y.C.; Zhou, S.Q.; Wu, W.B.; Yuan, Q.; Gao, Y.; Guo, H.Q.; Cai, X.X.; Zhao, B. Coastal Wetland Vegetation Classification Using Pixel-Based, Object-Based and Deep Learning Methods Based on RGB-UAV. Land 2022, 11, 2039. [Google Scholar] [CrossRef]
- Amarasingam, N.; Gonzalez, F.; Salgadoe, A.S.A.; Sandino, J.; Powell, K. Detection of White Leaf Disease in Sugarcane Crops Using UAV-Derived RGB Imagery with Existing Deep Learning Models. Remote Sens. 2022, 14, 6137. [Google Scholar] [CrossRef]
- Lucena, F.; Breunig, F.M.; Kux, H. The Combined Use of UAV-Based RGB and DEM Images for the Detection and Delineation of Orange Tree Crowns with Mask R-CNN: An Approach of Labeling and Unified Framework. Future Internet 2022, 14, 275. [Google Scholar] [CrossRef]
- Sun, Z.; Wang, X.; Wang, Z.; Yang, L.; Xie, Y.; Huang, Y. UAVs as Remote Sensing Platforms in Plant Ecology: Review of Applications and Challenges. J. Plant Ecol. 2021, 14, 1003–1023. [Google Scholar] [CrossRef]
- Khanal, S.; Kushal, K.C.; Fulton, J.P.; Shearer, S.; Ozkan, E. Remote Sensing in Agriculture—Accomplishments, Limitations, and Opportunities. Remote Sens. 2020, 12, 3783. [Google Scholar] [CrossRef]
- Hardin, P.J.; Lulla, V.; Jensen, R.R.; Jensen, J.R. Small Unmanned Aerial Systems (SUAS) for Environmental Remote Sensing: Challenges and Opportunities Revisited. GISci. Remote Sens. 2019, 56, 309–322. [Google Scholar] [CrossRef]
- Hardin, P.; Jensen, R. Small-Scale Unmanned Aerial Vehicles in Environmental Remote Sensing: Challenges and Opportunities. GISci. Remote Sens. 2011, 48, 99–111. [Google Scholar] [CrossRef]
- Amarasingam, N.; Ashan Salgadoe, A.S.; Powell, K.; Gonzalez, L.F.; Natarajan, S. A Review of UAV Platforms, Sensors, and Applications for Monitoring of Sugarcane Crops. Remote Sens. Appl. 2022, 26, 100712. [Google Scholar] [CrossRef]
- Berni, J.A.J.; Zarco-Tejada, P.J.; Suárez, L.; González-Dugo, V.; Fereres, E. Remote Sensing of Vegetation from UAV Platforms Using Lightweight Multispectral and Thermal Imaging Sensors. Int. Arch. Photogramm. Remote Sens. Spat. Inf. Sci. 2009, 38, 6. [Google Scholar]
- Alexandridis, T.K.; Tamouridou, A.A.; Pantazi, X.E.; Lagopodi, A.L.; Kashefi, J.; Ovakoglou, G.; Polychronos, V.; Moshou, D. Novelty Detection Classifiers in Weed Mapping: Silybum Marianum Detection on UAV Multispectral Images. Sensors 2017, 17, 2007. [Google Scholar] [CrossRef]
- Zhang, T.; Yang, Z.; Xu, Z.; Li, J. Wheat Yellow Rust Severity Detection by Efficient DF-UNet and UAV Multispectral Imagery. IEEE Sens. J. 2022, 22, 9057–9068. [Google Scholar] [CrossRef]
- Cruz, C.; McGuinness, K.; Perrin, P.M.; O’Connell, J.; Martin, J.R.; Connolly, J. Improving the Mapping of Coastal Invasive Species Using UAV Imagery and Deep Learning. Int. J. Remote Sens. 2023, 44, 5713–5735. [Google Scholar] [CrossRef]
- Samiappan, S.; Turnage, G.; Hathcock, L.A.; Moorhead, R. Mapping of Invasive Phragmites (Common Reed) in Gulf of Mexico Coastal Wetlands Using Multispectral Imagery and Small Unmanned Aerial Systems. Int. J. Remote Sens. 2017, 38, 2861–2882. [Google Scholar] [CrossRef]
- Di Gennaro, S.F.; Rizza, F.; Badeck, F.W.; Berton, A.; Delbono, S.; Gioli, B.; Toscano, P.; Zaldei, A.; Matese, A. UAV-Based High-Throughput Phenotyping to Discriminate Barley Vigour with Visible and near-Infrared Vegetation Indices. Int. J. Remote Sens. 2018, 39, 5330–5344. [Google Scholar] [CrossRef]
- Hill, D.J.; Tarasoff, C.; Whitworth, G.E.; Baron, J.; Bradshaw, J.L.; Church, J.S. Utility of Unmanned Aerial Vehicles for Mapping Invasive Plant Species: A Case Study on Yellow Flag Iris (Iris pseudacorus L.). Int. J. Remote Sens. 2017, 38, 2083–2105. [Google Scholar] [CrossRef]
- Tamouridou, A.A.; Alexandridis, T.K.; Pantazi, X.E.; Lagopodi, A.L.; Kashefi, J.; Moshou, D. Evaluation of UAV Imagery for Mapping Silybum Marianum Weed Patches. Int. J. Remote Sens. 2017, 38, 2246–2259. [Google Scholar] [CrossRef]
- Ahmed, O.S.; Shemrock, A.; Chabot, D.; Dillon, C.; Williams, G.; Wasson, R.; Franklin, S.E. Hierarchical Land Cover and Vegetation Classification Using Multispectral Data Acquired from an Unmanned Aerial Vehicle. Int. J. Remote Sens. 2017, 38, 2037–2052. [Google Scholar] [CrossRef]
- Tlebaldinova, A.; Karmenova, M.; Ponkina, E.; Bondarovich, A. CNN-Based Approaches for Weed Detection. In Proceedings of the 2022 10th International Scientific Conference on Computer Science, COMSCI 2022-Proceedings, Sofia, Bulgaria, 30 May–2 June 2022; Institute of Electrical and Electronics Engineers Inc.: Piscataway, NJ, USA, 2022. [Google Scholar]
- Sievers, O. CNN-Based Methods for Tree Species Detection in UAV Images; Linköping University: Linköping, Sweden, 2022. [Google Scholar]
- Zheng, Q.; Tian, X.; Yu, Z.; Jiang, N.; Elhanashi, A.; Saponara, S.; Yu, R. Application of Wavelet-Packet Transform Driven Deep Learning Method in PM2.5 Concentration Prediction: A Case Study of Qingdao, China. Sustain. Cities Soc. 2023, 92, 104486. [Google Scholar] [CrossRef]
- Zhao, X.; Yuan, Y.; Song, M.; Ding, Y.; Lin, F.; Liang, D.; Zhang, D. Use of Unmanned Aerial Vehicle Imagery and Deep Learning Unet to Extract Rice Lodging. Sensors 2019, 19, 3859. [Google Scholar] [CrossRef]
- Arun, R.A.; Umamaheswari, S.; Jain, A.V. Reduced U-Net Architecture for Classifying Crop and Weed Using Pixel-Wise Segmentation. In Proceedings of the 2020 IEEE International Conference for Innovation in Technology, INOCON 2020, Bengaluru, India, 6 November 2020; Institute of Electrical and Electronics Engineers Inc.: Piscataway, NJ, USA, 2020. [Google Scholar]
- Ye, W.; Lao, J.; Liu, Y.; Chang, C.C.; Zhang, Z.; Li, H.; Zhou, H. Pine Pest Detection Using Remote Sensing Satellite Images Combined with a Multi-Scale Attention-UNet Model. Ecol. Inform. 2022, 72, 101906. [Google Scholar] [CrossRef]
- Ronneberger, O.; Fischer, P.; Brox, T. U-Net: Convolutional Networks for Biomedical Image Segmentation. In Proceedings of the Medical Image Computing and Computer-Assisted Intervention–MICCAI 2015: 18th International Conference, Munich, Germany, 5–9 October 2015; Springer: Berlin/Heidelberg, Germany, 2015. [Google Scholar]
- He, Y.; Zhang, X.; Zhang, Z.; Fang, H. Automated Detection of Boundary Line in Paddy Field Using MobileV2-UNet and RANSAC. Comput. Electron. Agric. 2022, 194, 106697. [Google Scholar] [CrossRef]
- Yu, H.; Men, Z.; Bi, C.; Liu, H. Research on Field Soybean Weed Identification Based on an Improved UNet Model Combined With a Channel Attention Mechanism. Front. Plant Sci. 2022, 13, 890051. [Google Scholar] [CrossRef]
- Boyina, L.; Sandhya, G.; Vasavi, S.; Koneru, L.; Koushik, V. Weed Detection in Broad Leaves Using Invariant U-Net Model. In Proceedings of the ICCISc 2021—2021 International Conference on Communication, Control and Information Sciences, Proceedings, Idukki, India, 16–18 June 2021; Institute of Electrical and Electronics Engineers Inc.: Piscataway, NJ, USA, 2021. [Google Scholar]
- Sahin, H.M.; Miftahushudur, T.; Grieve, B.; Yin, H. Segmentation of Weeds and Crops Using Multispectral Imaging and CRF-Enhanced U-Net. Comput. Electron. Agric. 2023, 211, 107956. [Google Scholar] [CrossRef]
- Department of Agriculture and Fisheries. Broad-Leaved Pepper Tree Fact Sheet; Department of Agriculture and Fisheries: Canberra ACT, Australia, 2020.
- Xu, Z.; Shen, X.; Cao, L.; Coops, N.C.; Goodbody, T.R.H.; Zhong, T.; Zhao, W.; Sun, Q.; Ba, S.; Zhang, Z.; et al. Tree Species Classification Using UAS-Based Digital Aerial Photogrammetry Point Clouds and Multispectral Imageries in Subtropical Natural Forests. Int. J. Appl. Earth Obs. Geoinf. 2020, 92, 102173. [Google Scholar] [CrossRef]
- Hartling, S.; Sagan, V.; Maimaitijiang, M. Urban Tree Species Classification Using UAV-Based Multi-Sensor Data Fusion and Machine Learning. GIsci. Remote Sens. 2021, 58, 1250–1275. [Google Scholar] [CrossRef]
- Sivanandam, P.; Lucieer, A. Tree Detection and Species Classification in a Mixed Species Forest Using Unoccupied Aircraft System (UAS) RGB and Multispectral Imagery. Remote Sens. 2022, 14, 4963. [Google Scholar] [CrossRef]
- Dash, J.P.; Watt, M.S.; Paul, T.S.H.; Morgenroth, J.; Pearse, G.D. Early Detection of Invasive Exotic Trees Using UAV and Manned Aircraft Multispectral and LiDAR Data. Remote Sens. 2019, 11, 1812. [Google Scholar] [CrossRef]
- Otsu, K.; Pla, M.; Duane, A.; Cardil, A.; Brotons, L. Estimating the Threshold of Detection on Tree Crown Defoliation Using Vegetation Indices from Uas Multispectral Imagery. Drones 2019, 3, 80. [Google Scholar] [CrossRef]
- Franklin, S.E.; Ahmed, O.S.; Williams, G. Northern Conifer Forest Species Classification Using Multispectral Data Acquired from an Unmanned Aerial Vehicle. Photogramm. Eng. Remote Sens. 2017, 83, 501–507. [Google Scholar] [CrossRef]
- Abdollahnejad, A.; Panagiotidis, D. Tree Species Classification and Health Status Assessment for a Mixed Broadleaf-Conifer Forest with Uas Multispectral Imaging. Remote Sens. 2020, 12, 3722. [Google Scholar] [CrossRef]
- Sothe, C.; Dalponte, M.; de Almeida, C.M.; Schimalski, M.B.; Lima, C.L.; Liesenberg, V.; Miyoshi, G.T.; Tommaselli, A.M.G. Tree Species Classification in a Highly Diverse Subtropical Forest Integrating UAV-Based Photogrammetric Point Cloud and Hyperspectral Data. Remote Sens. 2019, 11, 1338. [Google Scholar] [CrossRef]
- Onishi, M.; Ise, T. Explainable Identification and Mapping of Trees Using UAV RGB Image and Deep Learning. Sci. Rep. 2021, 11, 903. [Google Scholar] [CrossRef]
- Kentsch, S.; Caceres, M.L.L.; Serrano, D.; Roure, F.; Diez, Y. Computer Vision and Deep Learning Techniques for the Analysis of Drone-Acquired Forest Images, a Transfer Learning Study. Remote Sens. 2020, 12, 1287. [Google Scholar] [CrossRef]
- Schiefer, F.; Kattenborn, T.; Frick, A.; Frey, J.; Schall, P.; Koch, B.; Schmidtlein, S. Mapping Forest Tree Species in High Resolution UAV-Based RGB-Imagery by Means of Convolutional Neural Networks. ISPRS J. Photogramm. Remote Sens. 2020, 170, 205–215. [Google Scholar] [CrossRef]
- Zou, K.; Chen, X.; Wang, Y.; Zhang, C.; Zhang, F. A Modified U-Net with a Specific Data Argumentation Method for Semantic Segmentation of Weed Images in the Field. Comput. Electron. Agric. 2021, 187, 106242. [Google Scholar] [CrossRef]
- Torres, D.L.; Feitosa, R.Q.; Happ, P.N.; La Rosa, L.E.C.; Junior, J.M.; Martins, J.; Bressan, P.O.; Gonçalves, W.N.; Liesenberg, V. Applying Fully Convolutional Architectures for Semantic Segmentation of a Single Tree Species in Urban Environment on High Resolution UAV Optical Imagery. Sensors 2020, 20, 563. [Google Scholar] [CrossRef] [PubMed]
- Wagner, F.H.; Sanchez, A.; Tarabalka, Y.; Lotte, R.G.; Ferreira, M.P.; Aidar, M.P.M.; Gloor, E.; Phillips, O.L.; Aragão, L.E.O.C. Using the U-Net Convolutional Network to Map Forest Types and Disturbance in the Atlantic Rainforest with Very High Resolution Images. Remote Sens. Ecol. Conserv. 2019, 5, 360–375. [Google Scholar] [CrossRef]
- Kattenborn, T.; Eichel, J.; Fassnacht, F.E. Convolutional Neural Networks Enable Efficient, Accurate and Fine-Grained Segmentation of Plant Species and Communities from High-Resolution UAV Imagery. Sci. Rep. 2019, 9, 17656. [Google Scholar] [CrossRef] [PubMed]
- Hamdi, Z.M.; Brandmeier, M.; Straub, C. Forest Damage Assessment Using Deep Learning on High Resolution Remote Sensing Data. Remote Sens. 2019, 11, 1976. [Google Scholar] [CrossRef]
- Freudenberg, M.; Nölke, N.; Agostini, A.; Urban, K.; Wörgötter, F.; Kleinn, C. Large Scale Palm Tree Detection in High Resolution Satellite Images Using U-Net. Remote Sens. 2019, 11, 312. [Google Scholar] [CrossRef]
- Imran, A.B.; Khan, K.; Ali, N.; Ahmad, N.; Ali, A.; Shah, K. Narrow Band Based and Broadband Derived Vegetation Indices Using Sentinel-2 Imagery to Estimate Vegetation Biomass. Glob. J. Environ. Sci. Manag. 2020, 6, 97–108. [Google Scholar] [CrossRef]
- Marcial-Pablo, M.d.J.; Gonzalez-Sanchez, A.; Jimenez-Jimenez, S.I.; Ontiveros-Capurata, R.E.; Ojeda-Bustamante, W. Estimation of Vegetation Fraction Using RGB and Multispectral Images from UAV. Int. J. Remote Sens. 2019, 40, 420–438. [Google Scholar] [CrossRef]
- Boiarskii, B. Comparison of NDVI and NDRE Indices to Detect Differences in Vegetation and Chlorophyll Content. J. Mech. Contin. Math. Sci. 2019, 4, 20–29. [Google Scholar] [CrossRef]
- Yu, R.; Luo, Y.; Zhou, Q.; Zhang, X.; Wu, D.; Ren, L. Early Detection of Pine Wilt Disease Using Deep Learning Algorithms and UAV-Based Multispectral Imagery. For. Ecol. Manag. 2021, 497, 119493. [Google Scholar] [CrossRef]
- Haboudane, D.; Miller, J.R.; Pattey, E.; Zarco-Tejada, P.J.; Strachan, I.B. Hyperspectral Vegetation Indices and Novel Algorithms for Predicting Green LAI of Crop Canopies: Modeling and Validation in the Context of Precision Agriculture. Remote Sens. Environ. 2004, 90, 337–352. [Google Scholar] [CrossRef]
- Kumar, V.; Sharma, A.; Bhardwaj, R.; Thukral, A.K. Comparison of Different Reflectance Indices for Vegetation Analysis Using Landsat-TM Data. Remote Sens. Appl. 2018, 12, 70–77. [Google Scholar] [CrossRef]
- Scher, C.L.; Karimi, N.; Glasenhardt, M.C.; Tuffin, A.; Cannon, C.H.; Scharenbroch, B.C.; Hipp, A.L. Application of Remote Sensing Technology to Estimate Productivity and Assess Phylogenetic Heritability. Appl. Plant Sci. 2020, 8, e11401. [Google Scholar] [CrossRef] [PubMed]
- Avola, G.; Di Gennaro, S.F.; Cantini, C.; Riggi, E.; Muratore, F.; Tornambè, C.; Matese, A. Remotely Sensed Vegetation Indices to Discriminate Field-Grown Olive Cultivars. Remote Sens. 2019, 11, 1242. [Google Scholar] [CrossRef]
- Xue, J.; Su, B. Significant Remote Sensing Vegetation Indices: A Review of Developments and Applications. J. Sens. 2017, 2017, 1353691. [Google Scholar] [CrossRef]
- Susantoro, T.M.; Wikantika, K.; Saepuloh, A.; Harsolumakso, A.H. Selection of Vegetation Indices for Mapping the Sugarcane Condition around the Oil and Gas Field of North West Java Basin, Indonesia. IOP Conf. Ser. Earth Environ. Sci. 2018, 149, 012001. [Google Scholar] [CrossRef]
- Capolupo, A.; Monterisi, C.; Tarantino, E. Landsat Images Classification Algorithm (LICA) to Automatically Extract Land Cover Information in Google Earth Engine Environment. Remote Sens. 2020, 12, 1201. [Google Scholar] [CrossRef]
- Kerkech, M.; Hafiane, A.; Canals, R. Deep Leaning Approach with Colorimetric Spaces and Vegetation Indices for Vine Diseases Detection in UAV Images. Comput. Electron. Agric. 2018, 155, 237–243. [Google Scholar] [CrossRef]
- Melillos, G.; Hadjimitsis, D.G. Using Simple Ratio (SR) Vegetation Index to Detect Deep Man-Made Infrastructures in Cyprus. In Detection and Sensing of Mines, Explosive Objects, and Obscured Targets XXV; SPIE: Bellingham, WA, USA, 2020; p. 22. [Google Scholar]
- Guo, Y.; Fu, Y.H.; Chen, S.; Robin Bryant, C.; Li, X.; Senthilnath, J.; Sun, H.; Wang, S.; Wu, Z.; de Beurs, K. Integrating Spectral and Textural Information for Identifying the Tasseling Date of Summer Maize Using UAV Based RGB Images. Int. J. Appl. Earth Obs. Geoinf. 2021, 102, 102435. [Google Scholar] [CrossRef]
- Alabi, T.R.; Abebe, A.T.; Chigeza, G.; Fowobaje, K.R. Estimation of Soybean Grain Yield from Multispectral High-Resolution UAV Data with Machine Learning Models in West Africa. Remote Sens. Appl. 2022, 27, 100782. [Google Scholar] [CrossRef]
- Effiom, A.E.; van Leeuwen, L.M.; Nyktas, P.; Okojie, J.A.; Erdbrügger, J. Combining Unmanned Aerial Vehicle and Multispectral Pleiades Data for Tree Species Identification, a Prerequisite for Accurate Carbon Estimation. J. Appl. Remote Sens. 2019, 13, 1. [Google Scholar] [CrossRef]
- Kampen, M.; Mund, J.-P.; Lederbauer, S.; Immitzer, M. UAV-Based Multispectral Data for Tree Species Classification and Tree Vitality Analysis; Dreiländertagung der DGPF, der OVG und der SGPF: Wien, Österreich, 2019. [Google Scholar]
- Guo, Q.; Zhang, J.; Guo, S.; Ye, Z.; Deng, H.; Hou, X.; Zhang, H. Urban Tree Classification Based on Object-Oriented Approach and Random Forest Algorithm Using Unmanned Aerial Vehicle (UAV) Multispectral Imagery. Remote Sens. 2022, 14, 3885. [Google Scholar] [CrossRef]
- Tu, Y.H.; Johansen, K.; Phinn, S.; Robson, A. Measuring Canopy Structure and Condition Using Multi-Spectral UAS Imagery in a Horticultural Environment. Remote Sens. 2019, 11, 269. [Google Scholar] [CrossRef]
- Kislov, D.E.; Korznikov, K.A. Automatic Windthrow Detection Using Very-High-Resolution Satellite Imagery and Deep Learning. Remote Sens. 2020, 12, 1145. [Google Scholar] [CrossRef]
- Chen, X.; Shen, X.; Cao, L. Tree Species Classification in Subtropical Natural Forests Using High-Resolution UAV RGB and SuperView-1 Multispectral Imageries Based on Deep Learning Network Approaches: A Case Study within the Baima Snow Mountain National Nature Reserve, China. Remote Sens. 2023, 15, 2697. [Google Scholar] [CrossRef]
- Voitik, A.; Kravchenko, V.; Pushka, O.; Kutkovetska, T.; Shchur, T.; Kocira, S. Comparison of NDVI, NDRE, MSAVI and NDSI Indices for Early Diagnosis of Crop Problems. Agric. Eng. 2023, 27, 47–57. [Google Scholar] [CrossRef]
- Gurung, R.B.; Breidt, F.J.; Dutin, A.; Ogle, S.M. Predicting Enhanced Vegetation Index (EVI) Curves for Ecosystem Modeling Applications. Remote Sens. Environ. 2009, 113, 2186–2193. [Google Scholar] [CrossRef]
- Rondeaux, G.; Steven, M.; Baret, F. Optimization of Soil-Adjusted Vegetation Indices. Remote Sens. Environ. 1996, 55, 95–107. [Google Scholar] [CrossRef]
- Xu, Z.Y.; Sun, B.; Zhang, W.F.; Li, Y.F.; Yan, Z.Y.; Yue, W.; Teng, S.H. An Evaluation of a Remote Sensing Method Based on Optimized Triangular Vegetation Index TVI for Aboveground Shrub Biomass Estimation in Shrub-Encroached Grassland. Acta Prataculturae Sin. 2023, 32, 1. [Google Scholar]
- Naji, T.A.H. Study of Vegetation Cover Distribution Using DVI, PVI, WDVI Indices with 2D-Space Plot. Proc. J. Phys. Conf. Ser. 2018, 1003, 012083. [Google Scholar] [CrossRef]
- Gunathilaka, M.D.K.L. Modelling the Behavior of DVI and IPVI Vegetation Indices Using Multi-Temporal Remotely Sensed Data. Int. J. Environ. Eng. Educ. 2021, 3, 9–16. [Google Scholar] [CrossRef]
Disclaimer/Publisher’s Note: The statements, opinions and data contained in all publications are solely those of the individual author(s) and contributor(s) and not of MDPI and/or the editor(s). MDPI and/or the editor(s) disclaim responsibility for any injury to people or property resulting from any ideas, methods, instructions or products referred to in the content. |
© 2024 by the authors. Licensee MDPI, Basel, Switzerland. This article is an open access article distributed under the terms and conditions of the Creative Commons Attribution (CC BY) license (https://creativecommons.org/licenses/by/4.0/).