Technical Note

Annual and Seasonal Variations in Aerosol Optical Characteristics in the Huai River Basin, China from 2007 to 2021

1
Key Laboratory of Atmospheric Optics, Anhui Institute of Optics and Fine Mechanics, Hefei Institutes of Physical Science, Chinese Academy of Sciences, Hefei 230031, China
2
Science Island Branch of Graduate School, University of Science and Technology of China, Hefei 230026, China
3
Advanced Laser Technology Laboratory of Anhui Province, Hefei 230037, China
*
Author to whom correspondence should be addressed.
Remote Sens. 2024, 16(9), 1571; https://doi.org/10.3390/rs16091571
Submission received: 26 March 2024 / Revised: 23 April 2024 / Accepted: 25 April 2024 / Published: 28 April 2024
(This article belongs to the Section Atmospheric Remote Sensing)

Abstract

:
Over the past three decades, China has seen aerosol levels substantially surpass the global average, significantly impacting regional climate. This study investigates the long-term and seasonal variations of aerosols in the Huai River Basin (HRB) using MODIS, CALIOP observations from 2007 to 2021, and ground-based measurements. A notable finding is a significant decline in the annual mean Aerosol Optical Depth (AOD) across the HRB, with MODIS showing a decrease of approximately 0.023 to 0.027 per year, while CALIOP, which misses thin aerosol layers, recorded a decrease of about 0.016 per year. This downward trend is corroborated by improvements in air quality, as evidenced by PM2.5 measurements and visibility-based aerosol extinction coefficients. Aerosol decreases occurred at all heights, but for aerosols below 800 m, with an annual AOD decrease of 0.011. The study also quantifies the long-term trends of five major aerosol types, identifying Polluted Dust (PD) as the predominant frequency type (46%), which has significantly decreased, contributing to about 68% of the total AOD reduction observed by CALIOP (0.011 per year). Despite this, Dust and Polluted Continental (PC) aerosols persist, with PC showing no clear trend of decrease. Seasonal analysis reveals aerosol peaks in summer, contrary to surface measurements, attributed to variations in the Boundary Layer (BL) depth, affecting aerosol distribution and extinction. Furthermore, the study explores the influence of seasonal wind patterns on aerosol type variation, noting that shifts in wind direction contribute to the observed changes in aerosol types, particularly affecting Dust and PD occurrences. The integration of satellite and ground measurements provides a comprehensive view of regional aerosol properties, highlighting the effectiveness of China’s environmental policies in aerosol reduction. Nonetheless, the persistence of high PD and PC levels underscores the need for continued efforts to reduce both primary and secondary aerosol production to further enhance regional air quality.

1. Introduction

Atmospheric aerosols are a critical component of the Earth-atmosphere system, as highlighted in the Intergovernmental Panel on Climate Change (IPCC) report [1]. These microscopic particles are instrumental in regulating the Earth’s energy budget and influencing climate dynamics by altering solar radiation, and, indirectly, by interacting with cloud microphysical processes to affect cloud properties and their radiative impacts [2,3,4,5]. Increasing aerosol concentration in the atmosphere not only poses a risk to local health but also has significant implications for global and regional climate patterns, affecting atmospheric structure, monsoon circulation, and the hydrological cycle [6,7,8,9].
The optical characteristics of regional aerosols are shaped by a variety of factors, including the local terrain, types of aerosols, aerosol column loading, and atmospheric chemical and physical processes [10]. As a result, aerosol distributions exhibit pronounced spatial variations, highlighting the urgent need for analyzing long-term spatial and temporal changes in aerosol optical properties to fully understand their impact on the Earth’s climate system [11].
While ground-based remote sensing offers valuable insights into aerosol optical properties at local and regional scales, satellite-based observations are critical to offering a global perspective. Passive satellite instruments, such as the Moderate Resolution Imaging Spectroradiometer (MODIS) and Multiangle Imaging SpectroRadiometer (MISR), are pivotal in providing detailed information on atmospheric aerosols and their physical and chemical characteristics [12,13]. However, lacking the vertical distribution of aerosols from these passive sensors introduces significant uncertainties in assessing aerosol direct radiative forcing. Lidar measurements, including ground-based, airborne, and space-based systems, provided essential information on aerosol vertical distributions. Since the launch of Cloud-Aerosol Lidar and Infrared Pathfinder Satellite Observations (CALIPSO) in 2006, the Cloud–Aerosol Lidar with Orthogonal Polarization (CALIOP) provided long-term global aerosol vertical distributions [14,15,16,17,18]. With advancements in CALIOP retrieval techniques, CALIOP-derived Aerosol Optical Depth (AOD) measurements have shown consistency with MODIS observations and agree well with ground-based Lidar measurements [19]. Moreover, CALIOP provides reliable information on aerosol-type distributions, enhancing our understanding of aerosol sources, supporting detailed process studies, and studying long-term aerosol variations [20]. Thus, the synergy between active and passive satellite measurements from ground and space allows for a comprehensive characterization of aerosol horizontal and vertical distributions.
In the past two decades, the high aerosol loadings in China have garnered considerable attention [21,22]. Accurately characterizing these aerosols is vital not only for understanding their regional impacts but also for predicting future changes in aerosol concentrations. Although MODIS and CALIOP measurements have been extensively used for aerosol studies in China, efforts to combine these datasets for regional aerosol variation studies have been limited. In this work, we leverage both MODIS and CALIOP observations and complement them with ground-based measurements to examine long-term and seasonal aerosol variations in the Huai River Basin (HRB), centered around Shou County, China. Located between the Yangtze and Yellow River basins, the HRB represents the diverse climatic conditions of eastern China and provides an ideal setting for studying Dust, biomass burning, anthropogenic pollution, and mixed-type aerosols.
Utilizing satellite data, including AOD and extinction coefficient profiles for various aerosol subtypes, seasonal and long-term aerosol variations across the HRB are documented in this study. Long-term near-surface aerosol changes are explored with PM2.5 levels and visibility; additionally, we explore the origins of different aerosol types based on surface wind patterns. The methodology and study area are introduced in Section 2, followed by an analysis of 15-year MODIS and CALIOP data to quantify seasonal and annual aerosol variations, including long-term trends, in Section 3. The major conclusions are summarized in Section 4.

2. Data and Methodology

2.1. The Study Region

The Huai River originates from Tongbai Mountain in eastern Henan Province, China, and extends through the provinces of Henan, Hubei, Anhui, and Jiangsu, traversing from west to east. Positioned strategically between the Yellow and Yangtze River Basins, the HRB spans a geographical expanse from 111.55°E to 121.25°E and from 30.55°N to 36.36°N, covering a vast drainage area of over 270,000 km2 [23,24]. Acting as a natural demarcation between southern and northern China, the HRB is situated within a continental monsoon climate zone. Other than local aerosol sources, long-range transported aerosols contribute to regional aerosol variations. Thus, the region is ideal for studying various types of aerosols. The Shou County observatory site was established as one of the China climate monitoring sites with in situ and remote sensing equipment for aerosol observations. The Shou County site was also the primary site for the DOE/ARM mobile facility (AMF) deployment in 2008 [25].
This study focuses on analyzing the optical properties of various aerosol types within a 3° by 3° latitude and longitude region over the HRB in Anhui Province (115.5°E to 118.5°E, 30.8°N to 33.8°N), as indicated by the red box in Figure 1a, utilizing a 15-year dataset (2007–2021) from the MODIS and CALIOP measurements. The Shou County site (116.37°E, 32.27°N), marked with an orange star, is equipped with ground-based lidar and other instruments [26]. We validate the effectiveness of CALIOP by using ground-based lidar, as shown in Figure 2. The CALIOP 16-day repeating tracks from January 2007 to August 2018, corresponding to the satellite’s operation within the A-Train configuration, and presented in Figure 1b. From September 2018 to December 2021, during the C-Train configuration period, CALIOP ground tracks drifted over to cover the whole region, as illustrated in Figure 1c.

2.2. CALIPSO Instrument and Data

The CALIPSO satellite, a collaborative endeavor between NASA (National Aeronautics and Space Administration) and the French Space Agency (CNES—Centre National d’Études Spatiales), was launched on 28 April 2006 [27]. Operating in a formation with the CloudSat satellite, carrying a cloud profiling radar, was the essential part of the international “A-Train” constellation for simultaneous active and passive Earth observations until 13 September 2018. Subsequently, CALIPSO underwent a planned orbital adjustment, descending from an altitude of 705 km to 688 km above the Earth’s surface to rejoin CloudSat in the newly formed “C-Train” configuration.
CALIPSO is equipped with a suite of three instruments: CALIOP, the Imaging Infrared Radiometer (IIR), and a Wide Field Camera (WFC). CALIOP, the cornerstone instrument for aerosol profiling, delivers attenuated backscatter profiles at two wavelengths, 532 nm and 1064 nm, facilitating measurements during both day and night. It also provides valuable data on depolarization ratios and color ratios, critical for distinguishing aerosol and cloud types [28,29]. Although CALIOP’s horizontal coverage is constrained by its narrow field of view, it compensates with continuous spatial and temporal measurements. Its vertical resolution, ranging from 30 to 60 m, allows for precise profiling of atmospheric layers.
CALIOP Level 2 products provide aerosol properties and their vertical distributions, which are well validated. The aerosol and cloud discrimination is provided by a Vertical Feature Mask and Atmospheric Volume Description (AVD) flags [29]. Aerosols are classified into seven subtypes: Dust, marine, Dusty marine, clean continental (CC), biomass burning (smoke), polluted Dust(PD), and polluted continental(PC) based on CALIOP measurements and prior information [30]. Then, the extinction can be retrieved using lidar ratios; aerosol type-dependent lidar ratios are used to improve aerosol extinction coefficient retrievals [31]. Prior investigations have validated CALIPSO Version-2 for different aerosol types through comparisons with ground-based elastic and Raman lidars, as well as Aerosol Robotic Network (AERONET) data. The classification exhibited optimal agreement for dust types and moderate agreement for polluted continental aerosols [32,33,34,35,36].
For this research, we utilized the CALIOP Level 2 (version 4.10) aerosol profile products, covering the period from January 2007 to December 2021. This dataset includes both daytime and nighttime observations. AOD was computed from the CALIOP 5-km aerosol layer products, integrating the extinction profiles of all discernible aerosol layers within the troposphere.
To ensure the integrity of the data, the following two quality control measures were applied to the CALIOP aerosol analysis:
1.
Cloud-Free Conditions: Only observations collected under cloud-free conditions were included to prevent cloud contamination. CALIOP provides Cloud–Aerosol Discrimination (CAD) scores to differentiate between clouds and aerosols, with CAD scores from −100 to +100, where a more negative score denotes higher confidence in aerosol classification. Only data with CAD scores ≤ −20 were considered [37].
2.
Extinction Quality Control (QC): Extinction retrievals with Extinction QC 532 = 0, indicating a successful extinction solution via the default lidar ratio, and Extinction QC = 1, denoting a constrained method leveraging two-way transmittance, are used for the statistics. Additionally, seasonal vertical profiles of extinction coefficients and aerosol subtypes were analyzed using Level 2 aerosol profile products (version 4.10). In the aerosol occurrence frequencies, one layer of aerosol represents one occurrence.

2.3. MODIS Aerosol Measurements

MODIS measurements are available on NASA’s Terra and Aqua satellites. Atmosphere Level-2 (L2) products provide AOD retrievals at a spatial resolution of approximately 10 km. The most recent Collection 6 update for both Terra and Aqua satellites integrates advanced algorithms, namely Dark Target (DT) and Deep Blue (DB), for precise AOD retrieval [37]. In this paper, we exclusively utilize DT products.
The MODIS initial AOD retrieval is performed at a finer resolution of 1 km × 1 km for clear sky pixels. These fine measurements are subsequently aggregated to a 10 km × 10 km coarser scale, designated as the aerosol “retrieval product pixel”. This aggregation process is herein referred to simply as “retrieval”. Accompanying each retrieval is a Quality Assurance (QA) flag ranging from 3 to 1, which is assigned based on evaluations of the 1 km × 1 km pixel AOD within each 10 km × 10 km retrieval. A QA flag value of 3 indicates the utmost confident retrievals, whereas QA values of 2 and 1 indicate decreasing levels of certainty. These confidence levels are subject to influence by various factors, including the potential for cloud contamination and the heterogeneity of the observed scene [38,39].
In the present analysis, we employed the latest MODIS Collection 6 data, focusing on Terra AOD (MOD04_10K) and Aqua AOD (MYD04_10K) obtained at 550 nm and selected with QA flag = 3. To assure the reliability of the aerosol data over our study area, we applied the criterion “Land-Ocean-Quality-Flag” = 3, ensuring the selection of only the most dependable observations.

2.4. Ground-Based Instruments and Data

To better understand the seasonal fluctuations in aerosol concentrations near the Earth’s surface, our study integrates satellite-derived aerosol data with ground-based measurements. In addition to PM2.5 concentrations measured at the Shou County site, visibility (V) measurements at the same location are utilized to calculate aerosol extinction coefficients to represent the near-surface atmosphere. The calculation of extinction coefficients is based on the Koschmeider formula, V = 3.92/k, where k (km−1) and V (km) represent the extinction coefficient and visibility [40]. The synergy of ground-based single-site measurements with large-area measurements assumes statistical homogeneity across the area under investigation, an assumption critical to the interpretation of our findings.

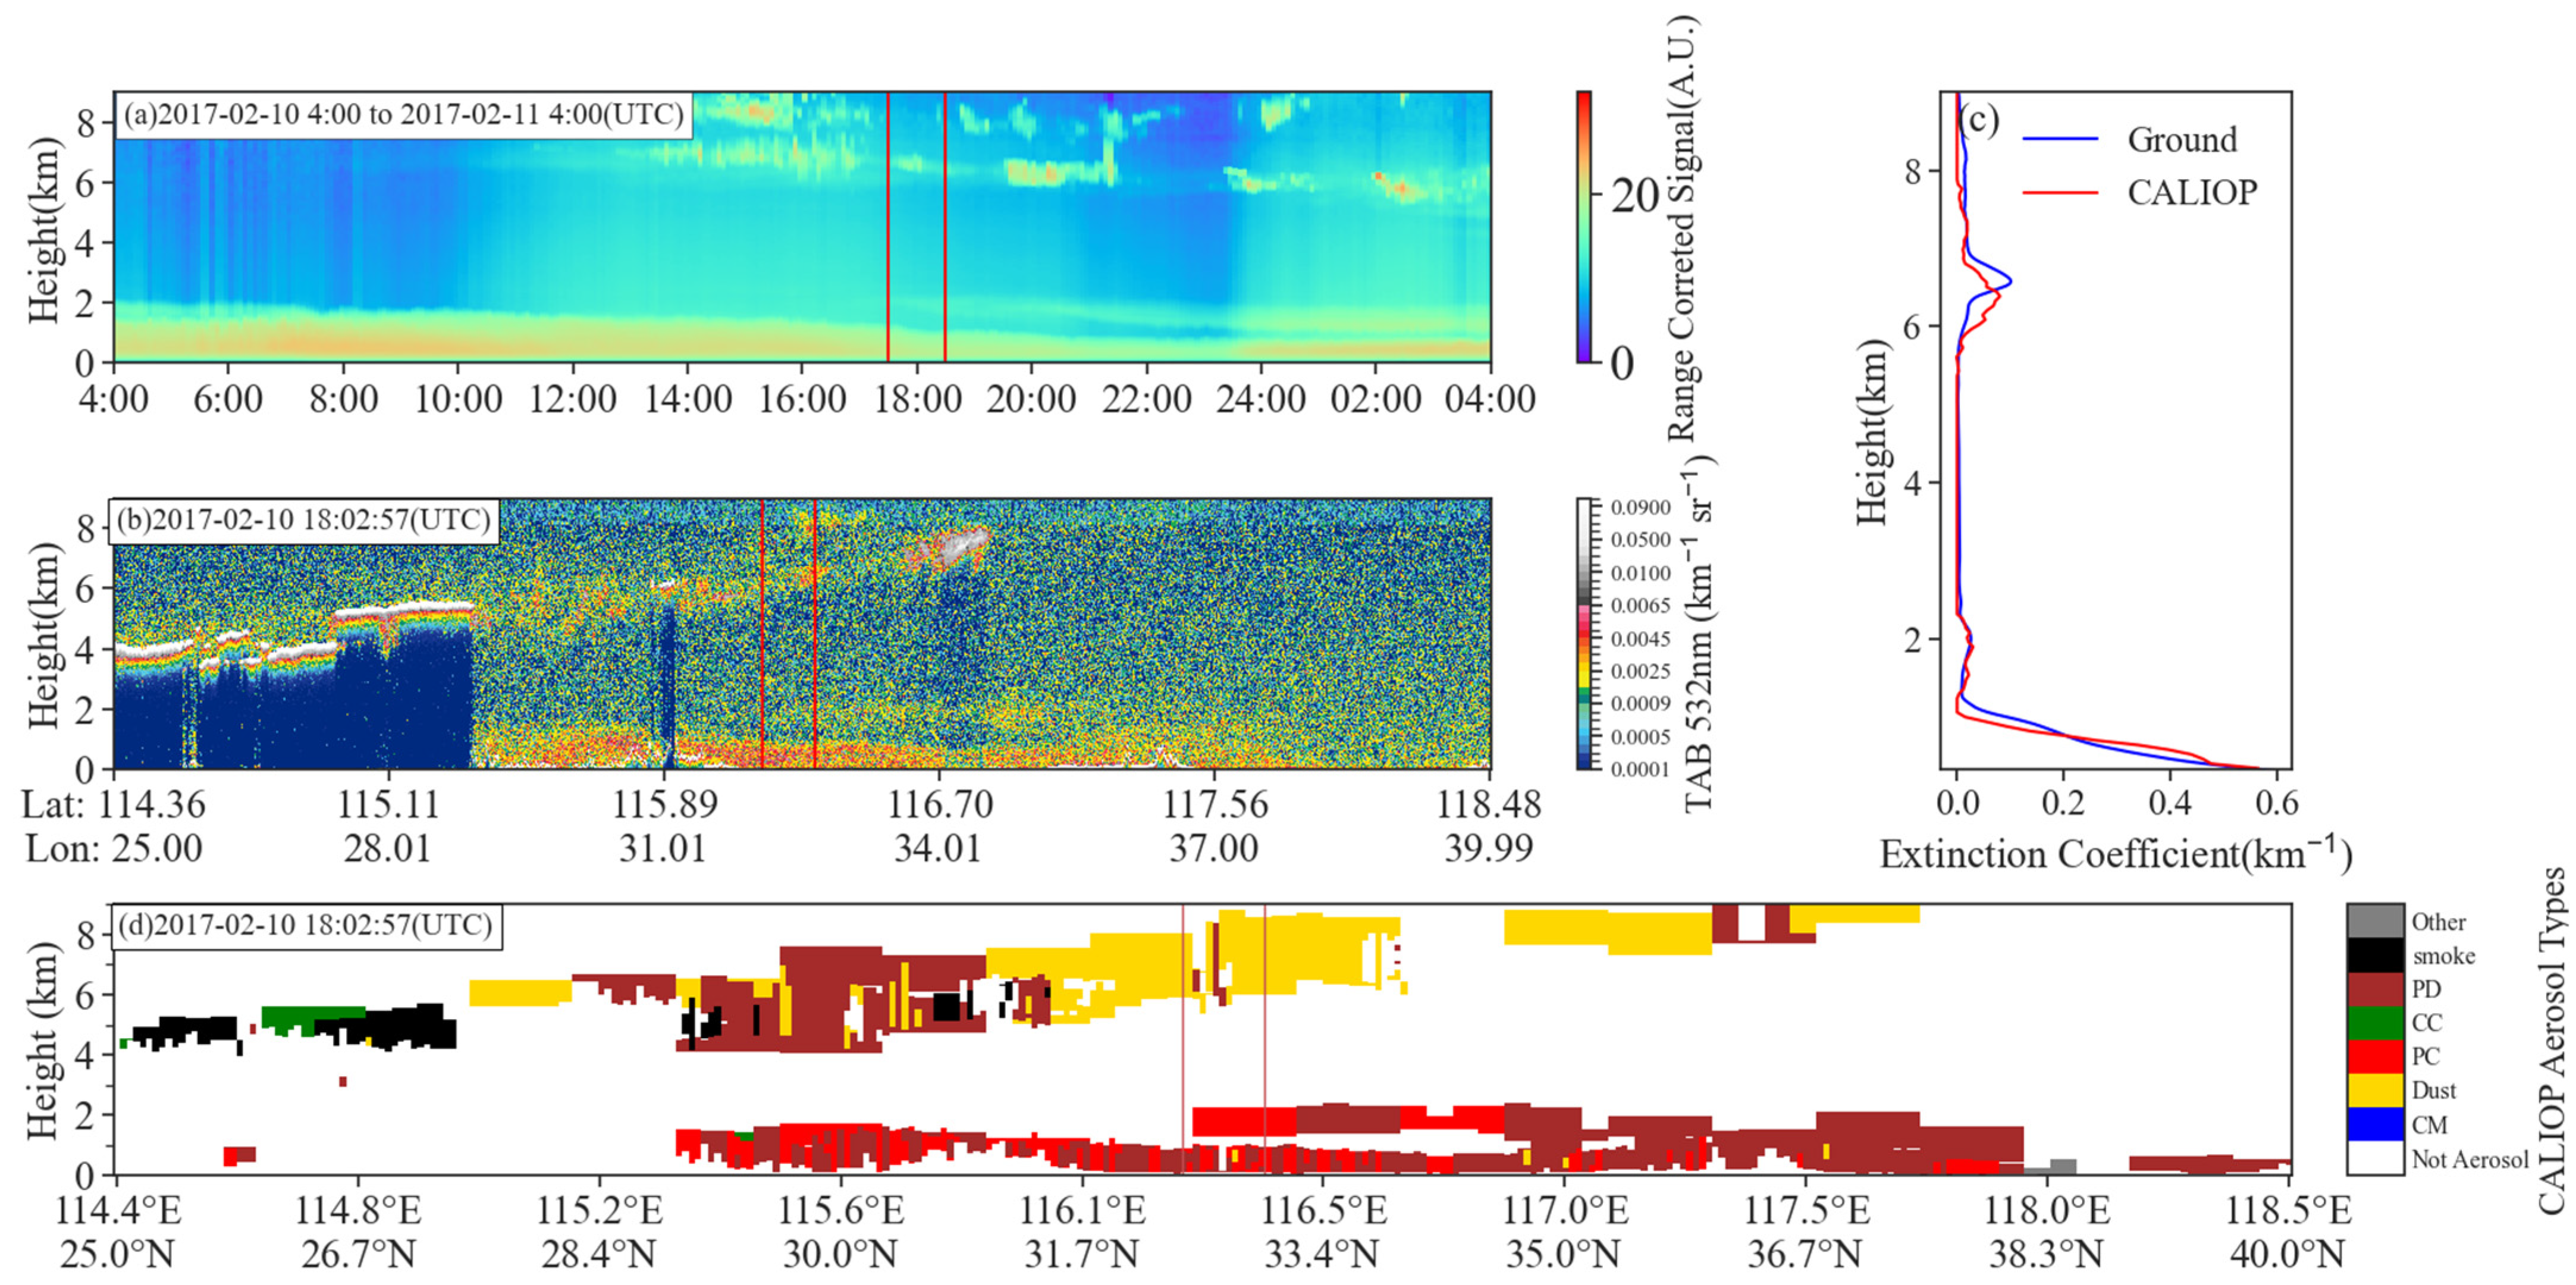
2.5. A Measurement Example

An example of CALIOP measurements over the region on 10 February 2017 is presented in Figure 2. Ground-based elastic lidar measurements (Figure 2a) show dense aerosol layers below 2 km with optically thin high cloud/aerosol layers. The CALIPSO satellite overpassed the region around 18:02:57 UTC. CALIOP measurements within the 25°N to 40°N latitude band are presented in Figure 2b, with two vertical red lines identifying data within 50 km of the Shou County site. CALIOP measurements show a large spatial variation in cloud height, but high clouds and low-density boundary layer aerosol layers near the site are consistent with ground-based measurements. Figure 2c compares the average extinction coefficients between the ground lidar and CALIOP measurements; the red lines are marked by CALIPSO. Although there are noticeable differences in aerosol layer top distribution and the layer peak in the 6–9 km, the two lidar measurements agreed well, especially considering spatial variations.

3. Results

3.1. Long-Term Regional Aerosol Variations

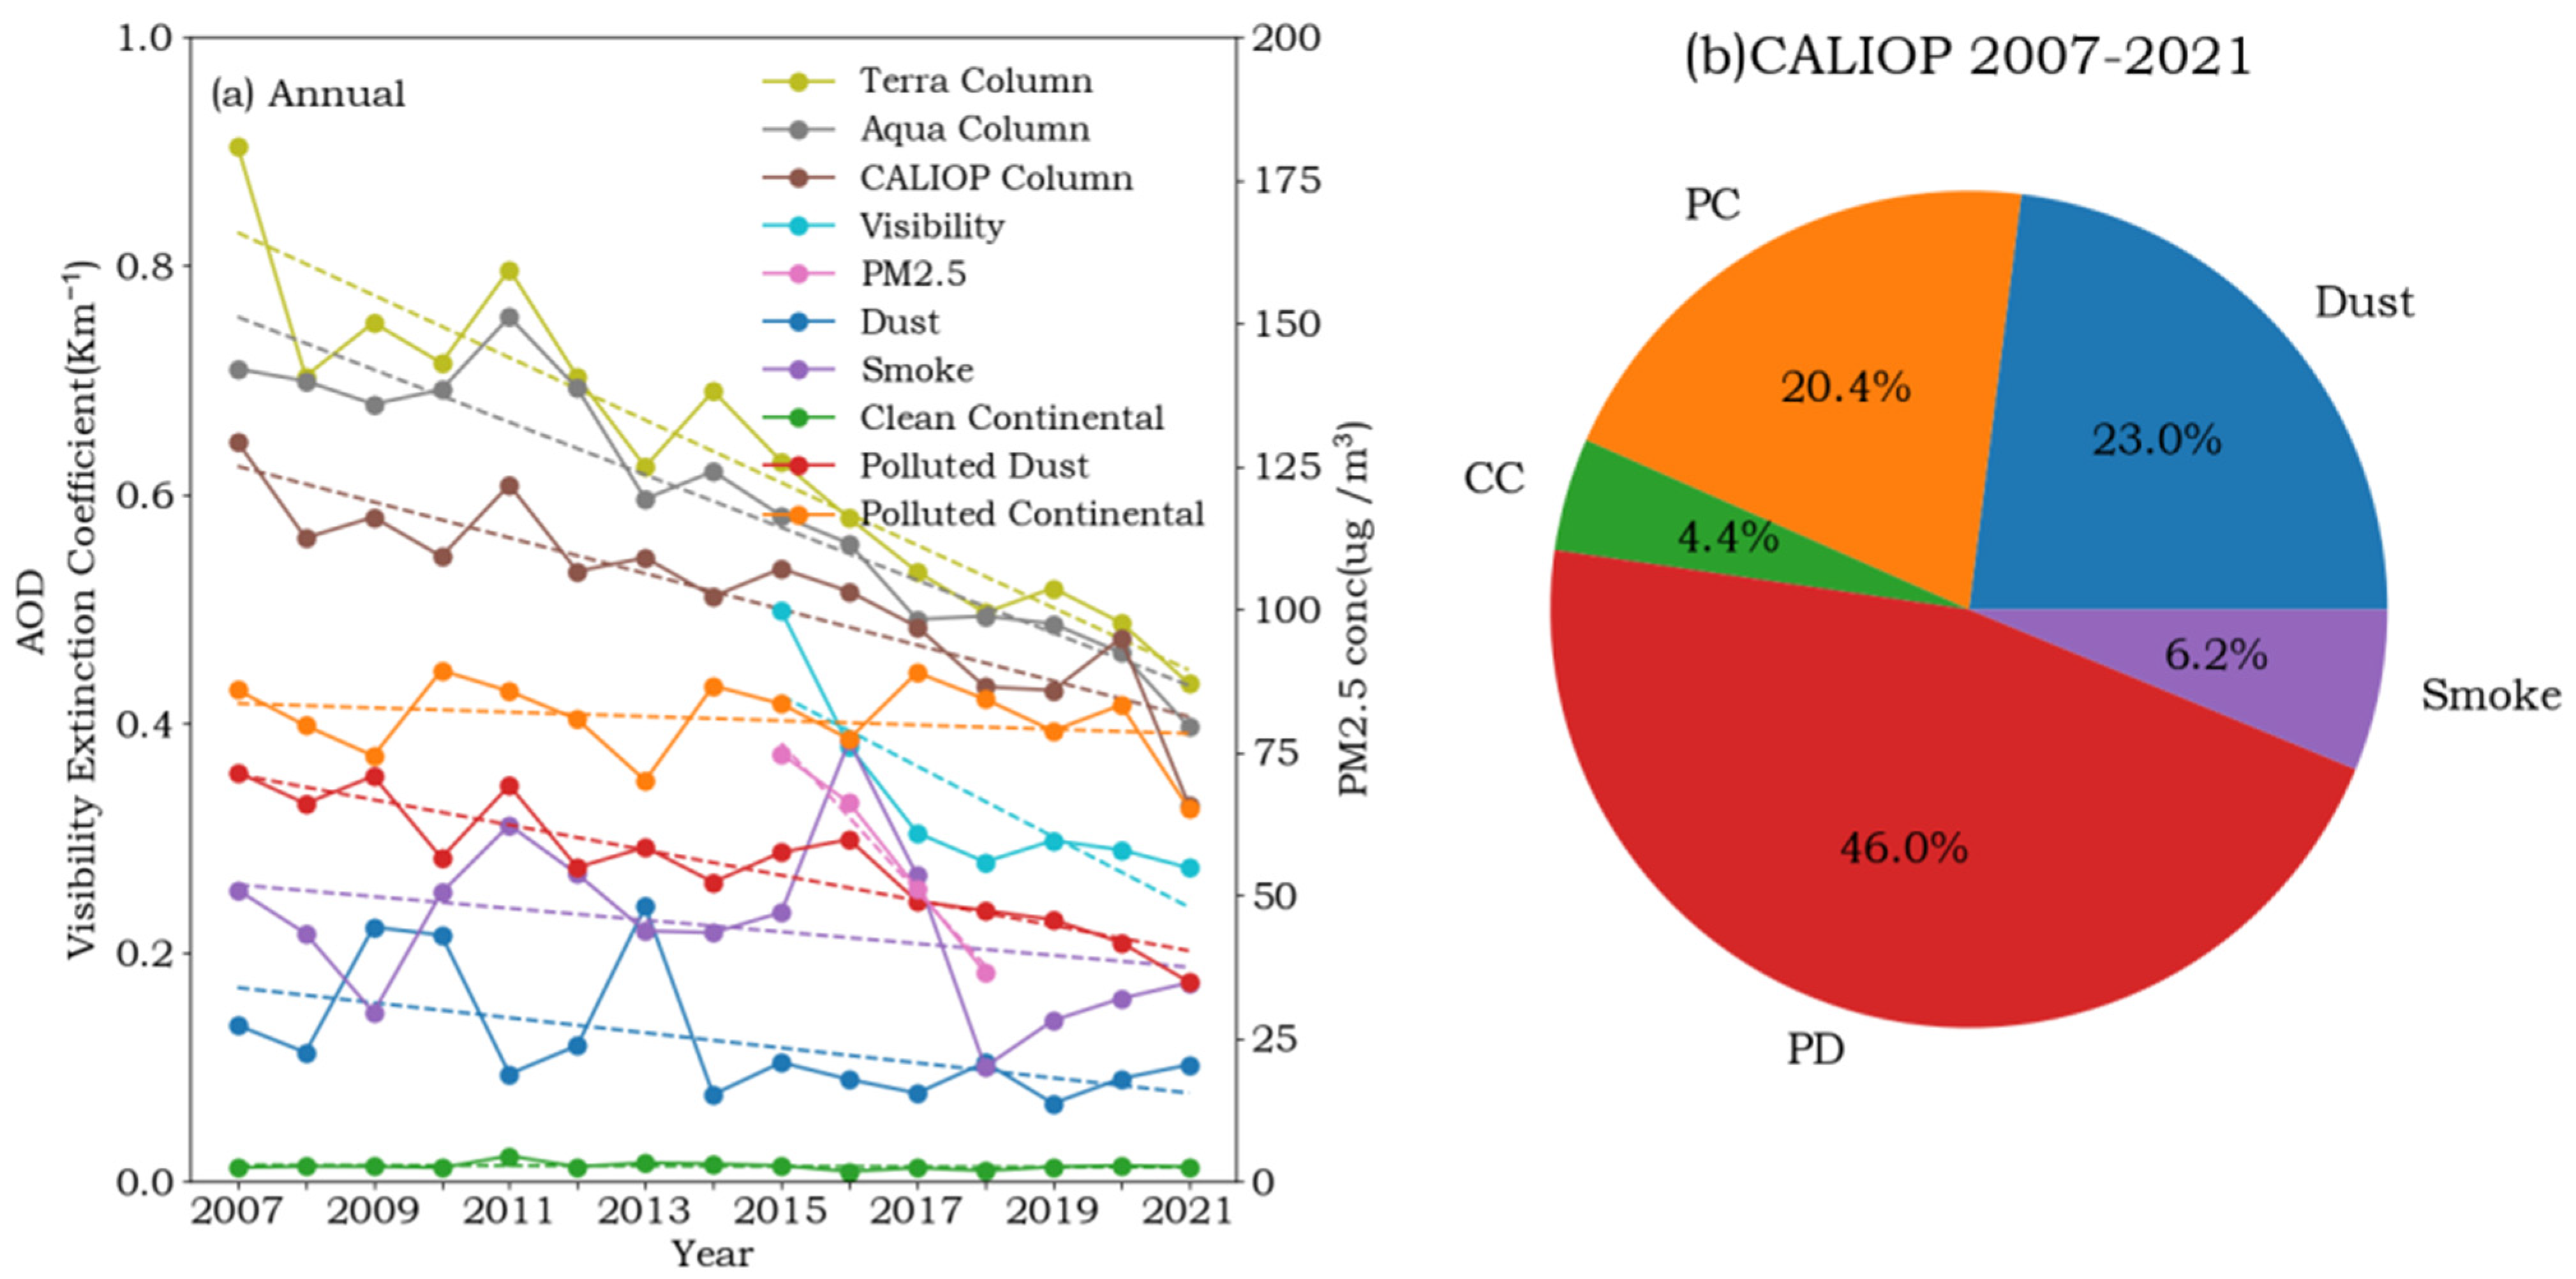
With the 15 years of MODIS and CALIOP observations, the long-term aerosol variations are presented in Figure 3a. Although there are significant differences in the three AODs, the graduate decrease of AOD in the region is a robust feature. With China’s economic development, it also experienced a high air pollution period [41]. In 2022, MODIS mean AOD was still above 0.7 in the region, which is extremely high compared to the global mean AOD. However, efforts were implemented to reduce air pollution, especially after 2013, which led to a steady decrease in AODs. Trend analysis shows that the AOD values decreased by 0.027, 0.023, and 0.016 per year, respectively, based on MODIS Terra, Aqua, and CALIOP measurements. Ground-based visibility measurements are presented to support the observed long-term AOD declining trend. From 2015–2021, near-surface extinction coefficients decreased by 0.03/km per year. From 2015 to 2018, annual mean PM2.5 concentrations decreased by 12.9 μg/m3 per year at the site, consistent with the optical measurements discussed above.
The AOD differences among the three measurements are consistent with other studies [18]. Although it is small, MODIS AOD from Terra and Aqua satellites are slightly different. One factor could be the diurnal variation of boundary layer (BL) relative humidity, which is higher during the Terra overpass in the morning than the Aqua overpass as a result of the growth of BL depth. CALIOP’s detection limits are highly dependent on background noise. Thus, CALIOP often misses optically thin aerosol layers in the free troposphere, leading to lower AOD biases [42]. By comparing CALIPSO with ground-based Raman lidars from the Atmospheric Radiation Measurement (ARM) program, Thorsen et al. [43] showed that CALIOP does not detect all relatively significant aerosols, tending to miss optically thin aerosol layers. However, CALIOP-based AOD is consistent with MODIS AOD when aerosols are concentrated in the BL [44].
Although CALIOP has a lower bias, it still offers a robust long-term trend. Thus, we further explore long-term changes in different types of aerosols in the region with the CALIOP measurements presented in Figure 3a. As expected, there is a large range of AOD variations among the five aerosol types, from below 0.02 for CC to the annual mean of 0.43 for PC, which remains almost consistent throughout the period. PD aerosols show a significant declining trend in the region, with an annual decrease of 0.011. Smoke and Dust aerosols have large internal annual variations as they can be impacted by a few dust storms and fire events. Local smoke AODs peaked in 2016, mainly due to 31 smoke profiles detected on 12 September 2016, with an average optical depth of 0.57. The higher Dust AOD values observed in 2009, 2010, and 2013 are associated with a few strong dust storms passing the region, particularly noticeable on 18 October and 27 December 2009, 17 March 2010, and 3 March, 27–28 April, and 11–14 November 2013, with dust AOD greater than 1. PD is the dominant frequency aerosol type in the region (46%, see Figure 3b), followed by Dust (23.0%) and PC (20.4%) aerosols. Thus, PD decreases derived from overall AOD changes in the region.
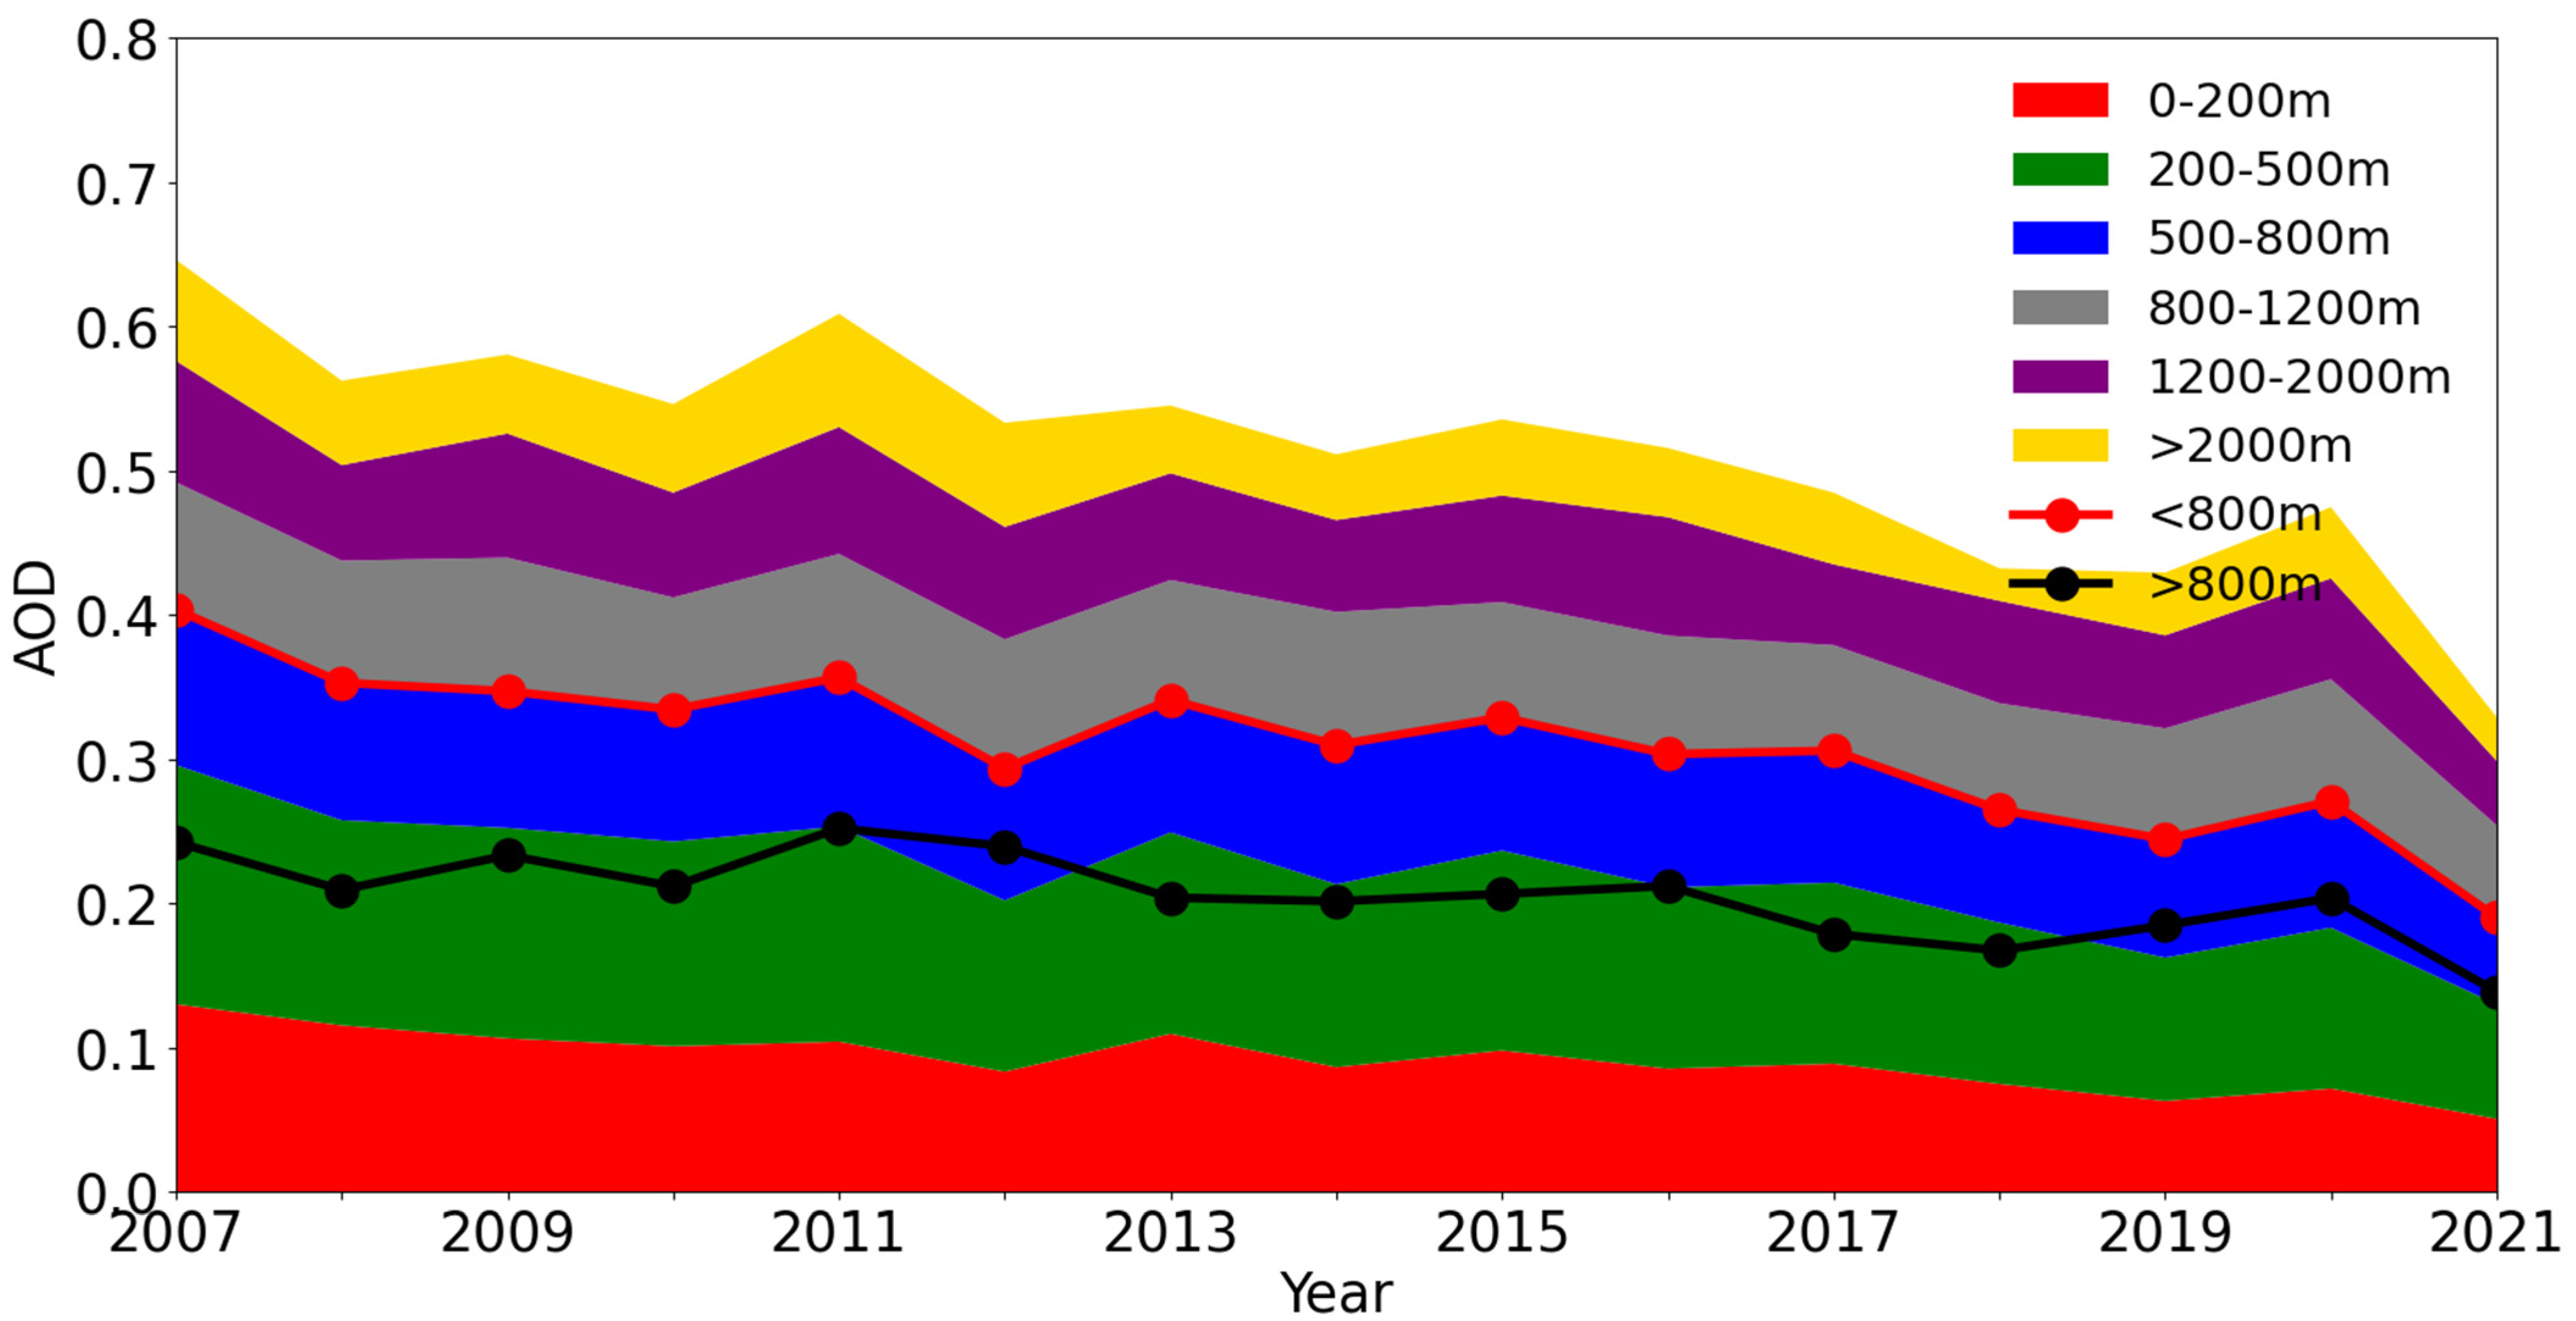
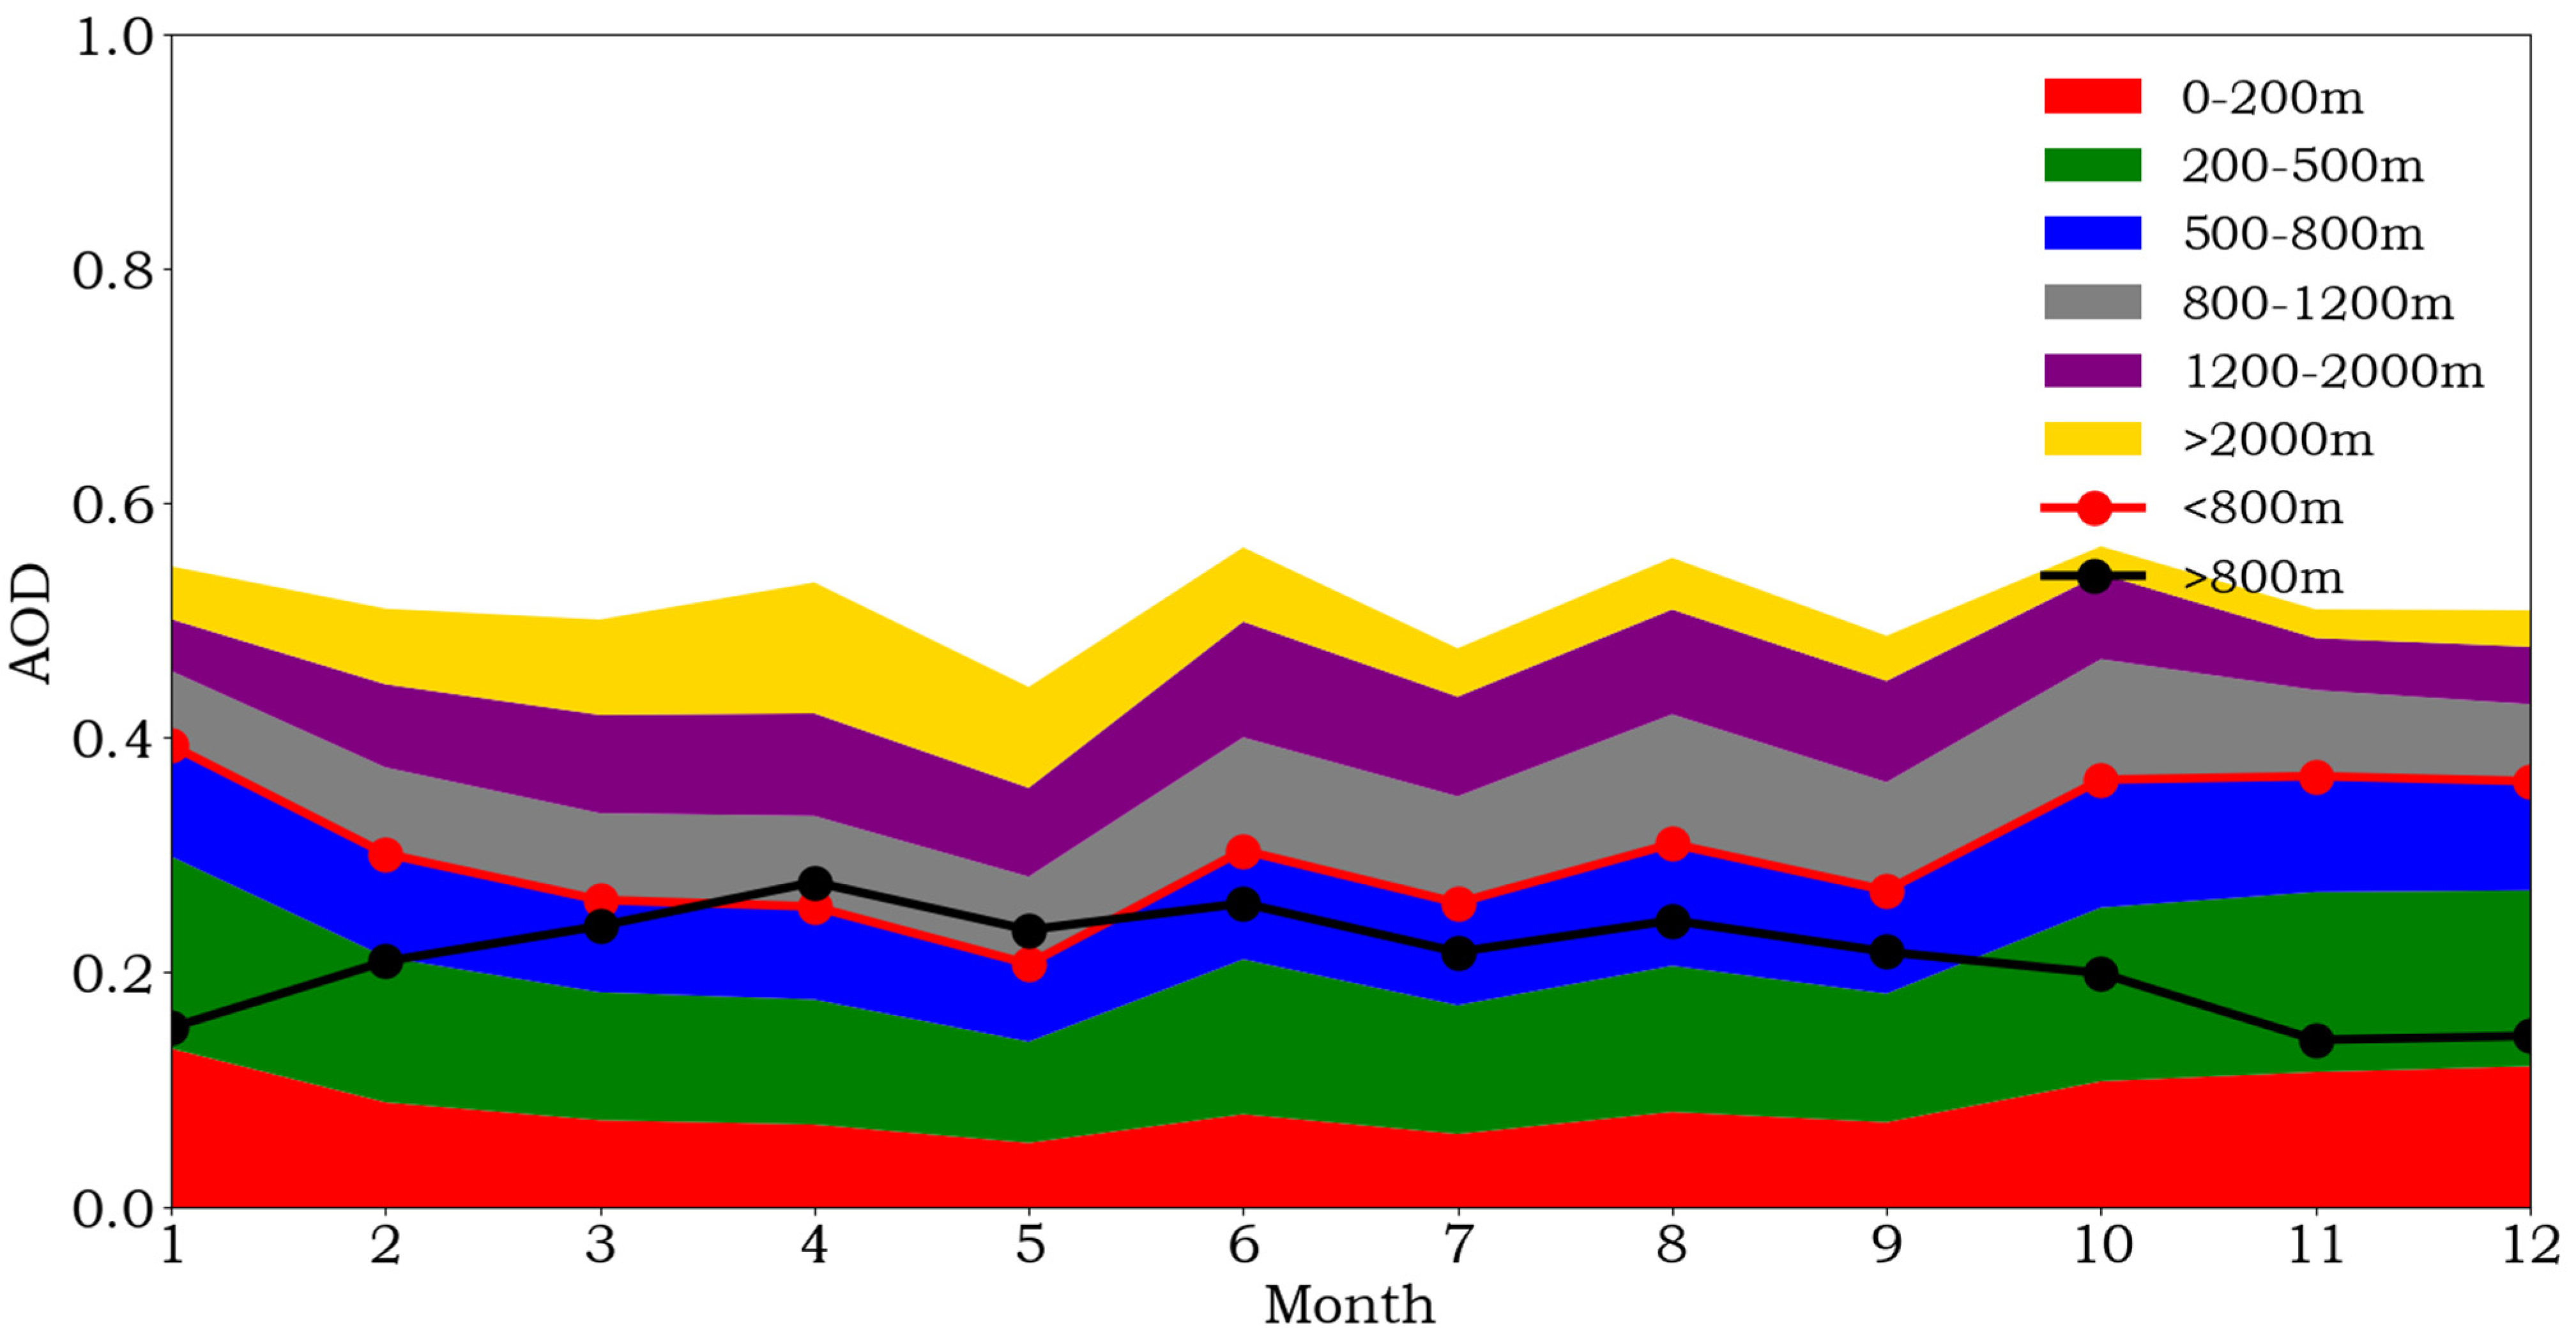
With CALIOP’s vertical resolving capability, Figure 4 shows the contributions and long-term changes of different atmospheric layers on the total AOD, with red for 0–200 m, green for 200–500 m, blue for 500–800 m, gray for 800–1200 m, purple for 1200–2000 m, and yellow for above 2000 m. These altitudes indicate heights measured above sea level. Aerosols in the lower 500 m contribute to about ~50% of total AOD. Thus, the surface measurements showed similar decreasing slopes as the AODs in Figure 3a. Figure 4 shows that aerosol loading decreases occurred at different height ranges. To show AOD trends at different altitude layers better, contributions below 800 m and above 800 m are presented in Figure 4. From 2007 to 2021, the AOD below 800 m decreased at ~0.011 per year, which is more than the decrease rate for the aerosol above 800 m (at ~0.005 per year).
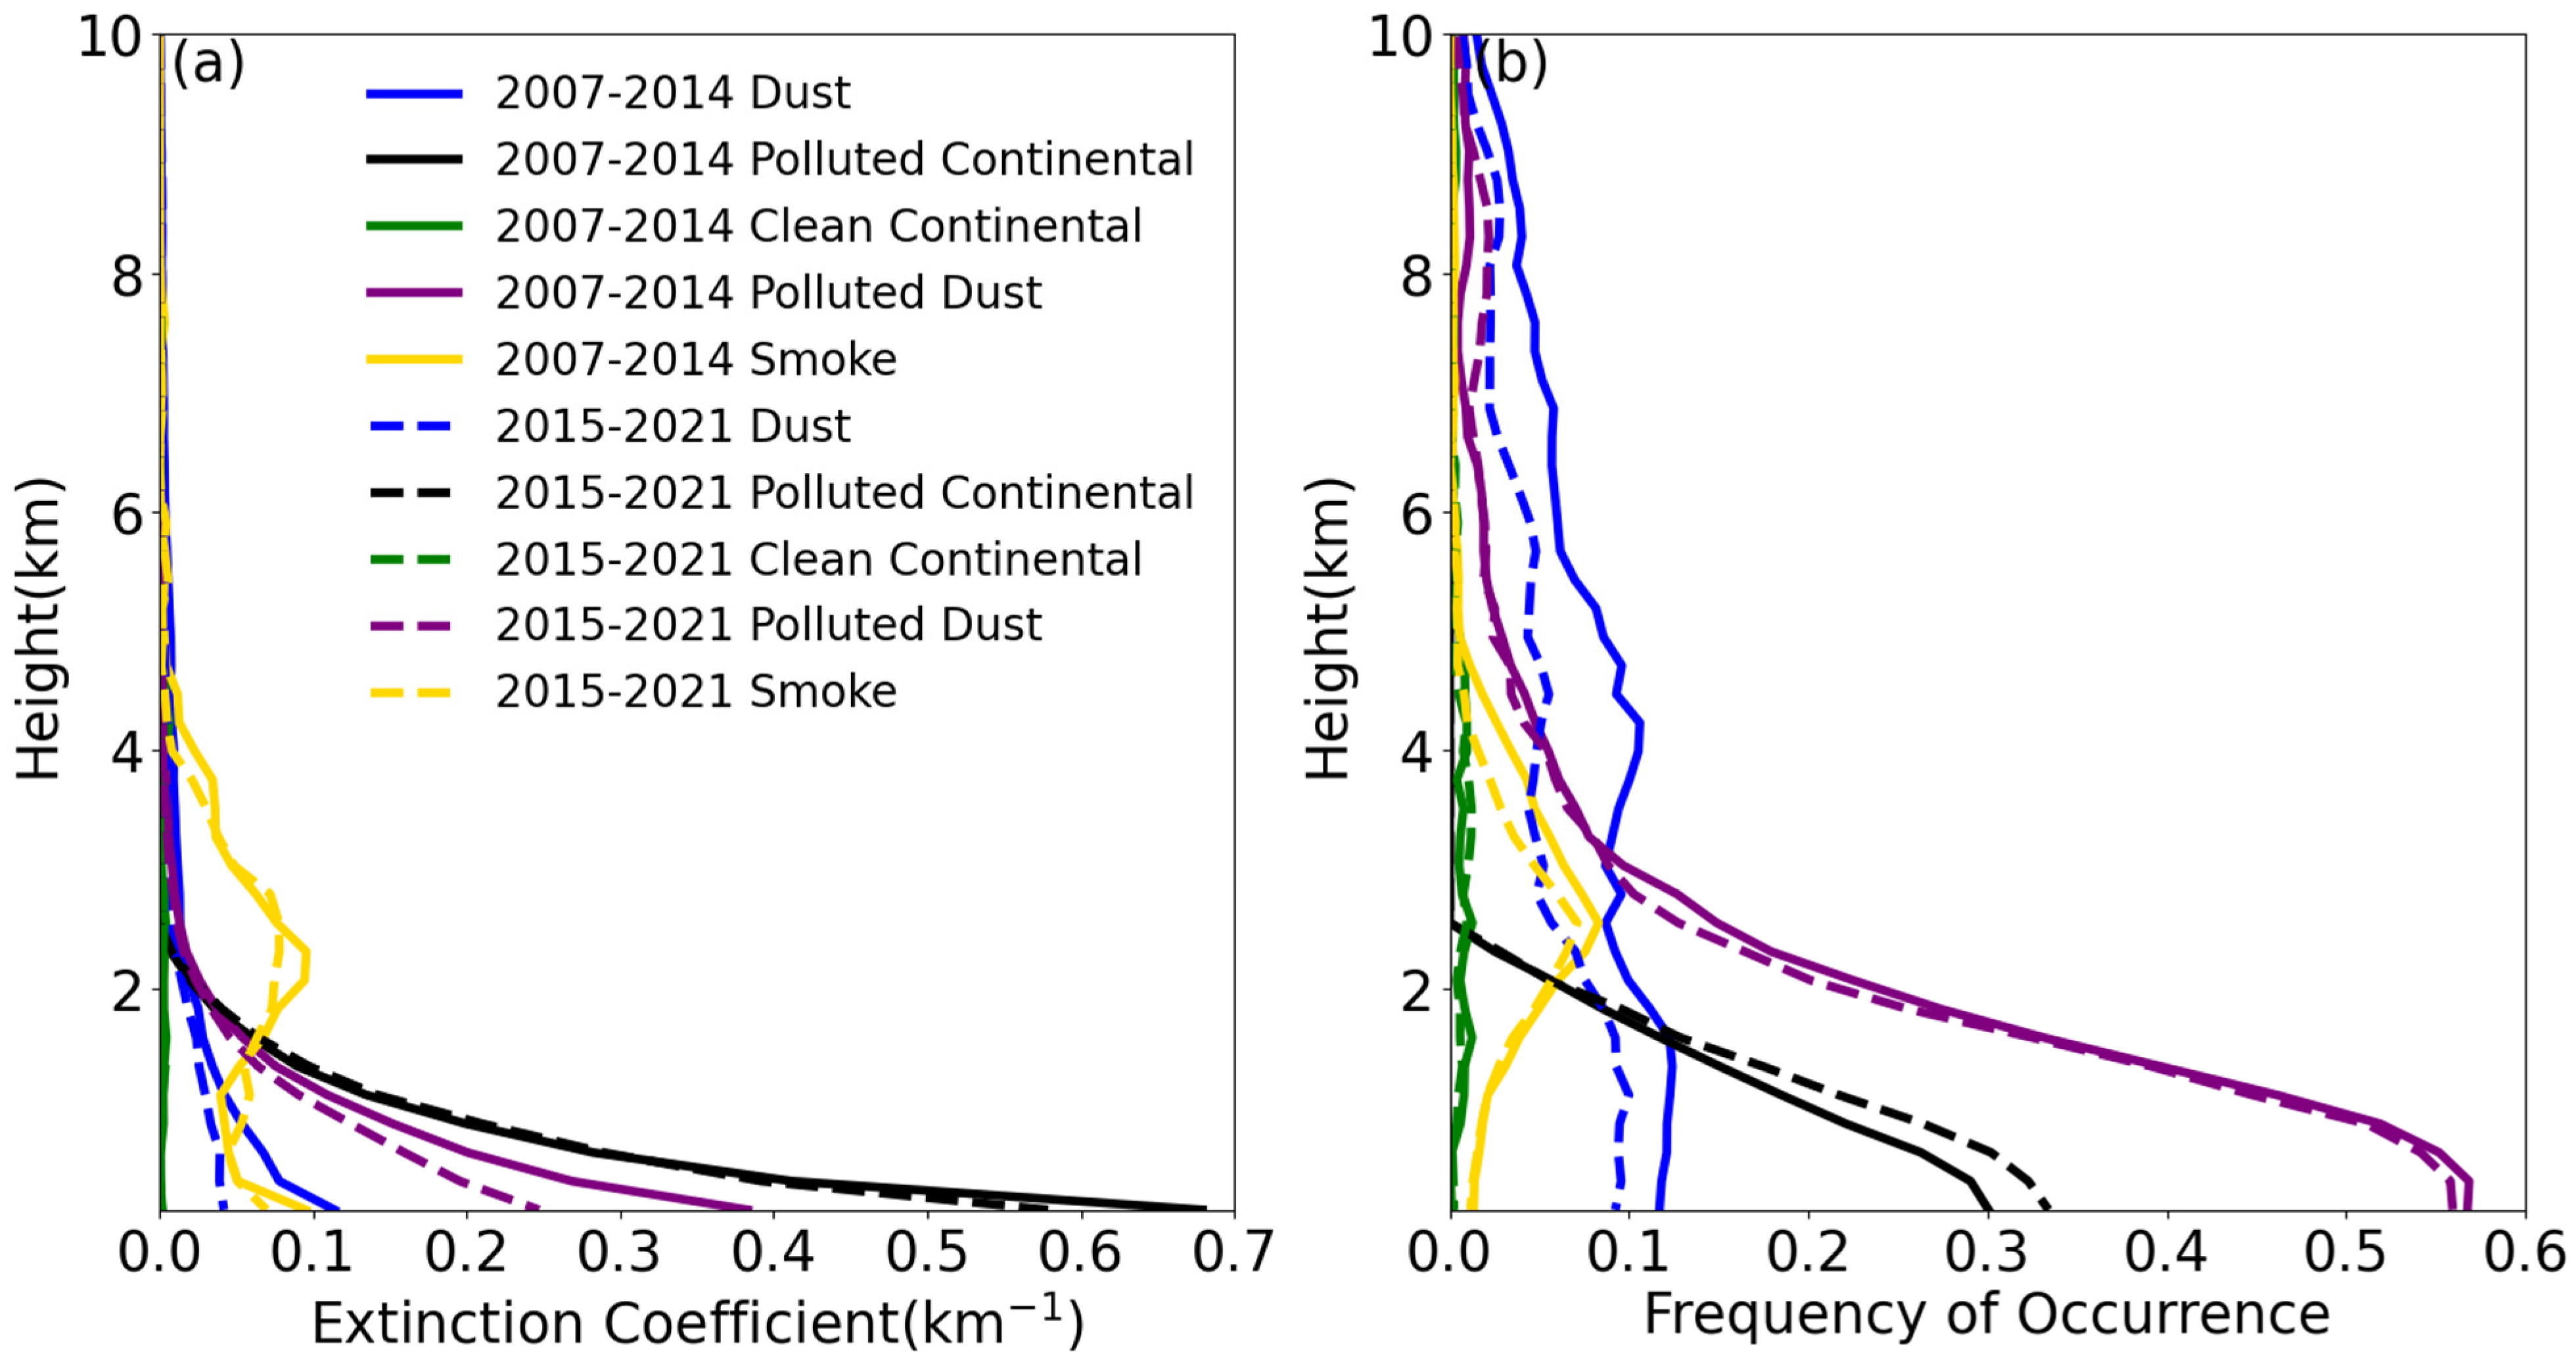
Aerosol changes vertically for the five aerosol types are presented in Figure 5 by comparing average extinction coefficients at 532 nm and occurrence frequencies between two periods: 2007–2014 and 2015–2021. Extinction coefficients of Dust, PD, and PC peak around the surface. In contrast, the peak extinction coefficient of Smoke aerosols are located at 2.4 km, indicating the long-range transport nature of smoke aerosols. Above 5 km, CALIOP-detected aerosols are mainly Dust and PD, which are often lifted into the upper troposphere through terrain and mesoscale dynamics lifting and transported widely over the northern hemisphere [45]. Comparing the two periods, the extinction coefficients of PD and Dust significantly decreased, PC’s extinction coefficient remained stable within the 0–2 km range, smoke’s extinction coefficient increased below 2 km and decreased above 2 km, and the extinction coefficient of CC aerosols remained essentially unchanged. The significant changes in PD’s extinction coefficient occur below 2 km, indicating a reduction in pollution levels within the near-surface layer.
Figure 5b shows the occurrence frequencies of different aerosol types. PC aerosols mainly appear within the 0–3 km altitude range, showing a slightly increased occurrence frequency. Dust aerosols have a two-mode vertical distribution with local peaks below and above 3 km, with an overall decrease in occurrence frequency. Smoke aerosols mainly appear between 0–5 km in altitude, with a relatively stable occurrence frequency at 0–2 km. However, the occurrence frequency above 2 km to 5 km decreases, indicating less long-range transported smoke impacting the region. Meanwhile, the occurrence frequency of PD decreases from 1–5 km and increases from 6–10 km, reflecting the complex and variable nature of aerosols in the HRB due to PD being a mixture of aerosols.

3.2. Seasonal Aerosol Variations

Monthly mean aerosol properties in the region are presented in Figure 6 to illustrate the annual cycle of aerosols. MODIS AODs peak in June and reach their lowest point in December. However, CALIOP AODs show a weaker seasonal dependence than MODIS AODs due to significant AOD differences between March and June. The differences are attributed to uncertainties in both measurements. As pointed out earlier, CALIOP could miss some optically thin aerosol layers due to underestimated AODs, which could be larger in the summertime due to the high solar background. Luo et al. [42] showed that CALIOP L2 retrieval could fail to detect up to 20% of Dust layers in the region during March, April, and May. Under high aerosol loading conditions, CALIOP could underestimate near-surface aerosols due to strong attenuation and background noise. On the other hand, MODIS AODs are biased higher when AOD is above 0.4 in the region as compared with ground-based sunphotometer measurements, especially in June during the local harvesting season with a fasting change surface property. Thus, the true AOD cycle in the region is between MODIS and CALIOP measurements.
Surface aerosol loading based on extinction coefficients and PM2.5 have a different annual cycle than the AOD, with lower values in the summer months. In the summer, the convective BL heights are significantly higher than the winter BL depths, which allow aerosols to mix in a deep layer and lead to lower BL aerosol extinction in the summer than in the winter. Other than overall BL depth differences, near-surface inversion layers in wintertime could cap locally generated aerosols, leading to higher near-surface aerosol extinction coefficients and lower visibility. Previous studies by Zheng [10] and Cheng [46] have shown a good correlation between extinction coefficient and near-surface layer AOD with PM2.5 concentrations. The annual cycles of surface aerosol extinction coefficients and PM2.5 concentrations in Figure 6 support the positive correlation between the two variables.
To provide a vertically resolved aerosol annual cycle, Figure 7 shows the contributions of different layers to the total AOD based on CALIOP measurements, The altitudes of the different layers represent heights above sea level. Figure 7 shows that the contributions of low 200 m have low values in summer, which is consistent with the near-surface extinction coefficients given in Figure 6. Notably, aerosols at heights below 200 m could be missed due to surface contamination [47], but this does not alter the AOD key in the region with flat terrain. The different seasonal trends for above and below 800 m layers are clear, with the below 800 m layer reaching the lowest in May and the above 800 m layer reaching the highest in April. The different seasonal trends are consistent with the BL depth seasonal variations, with more aerosols transported above 800 m in late spring and summer due to deeper BL and stronger vertical mixing [10,48,49]. The formation of secondary aerosols is more rapid in summer due to stronger radiation and higher temperatures, with much of the secondary aerosols produced in the upper levels [50,51]. Additionally, the seasonal variations of AOD at different vertical levels may also be influenced by changes in the amount of water vapor, affecting hygroscopic growth [10]. Furthermore, the strong seasonal, long-range aerosol transports in spring in the study region, especially Dust aerosols (see Table 1 and Figure 8), also contribute to the higher AOD contribution for the above 800 m layer [45].
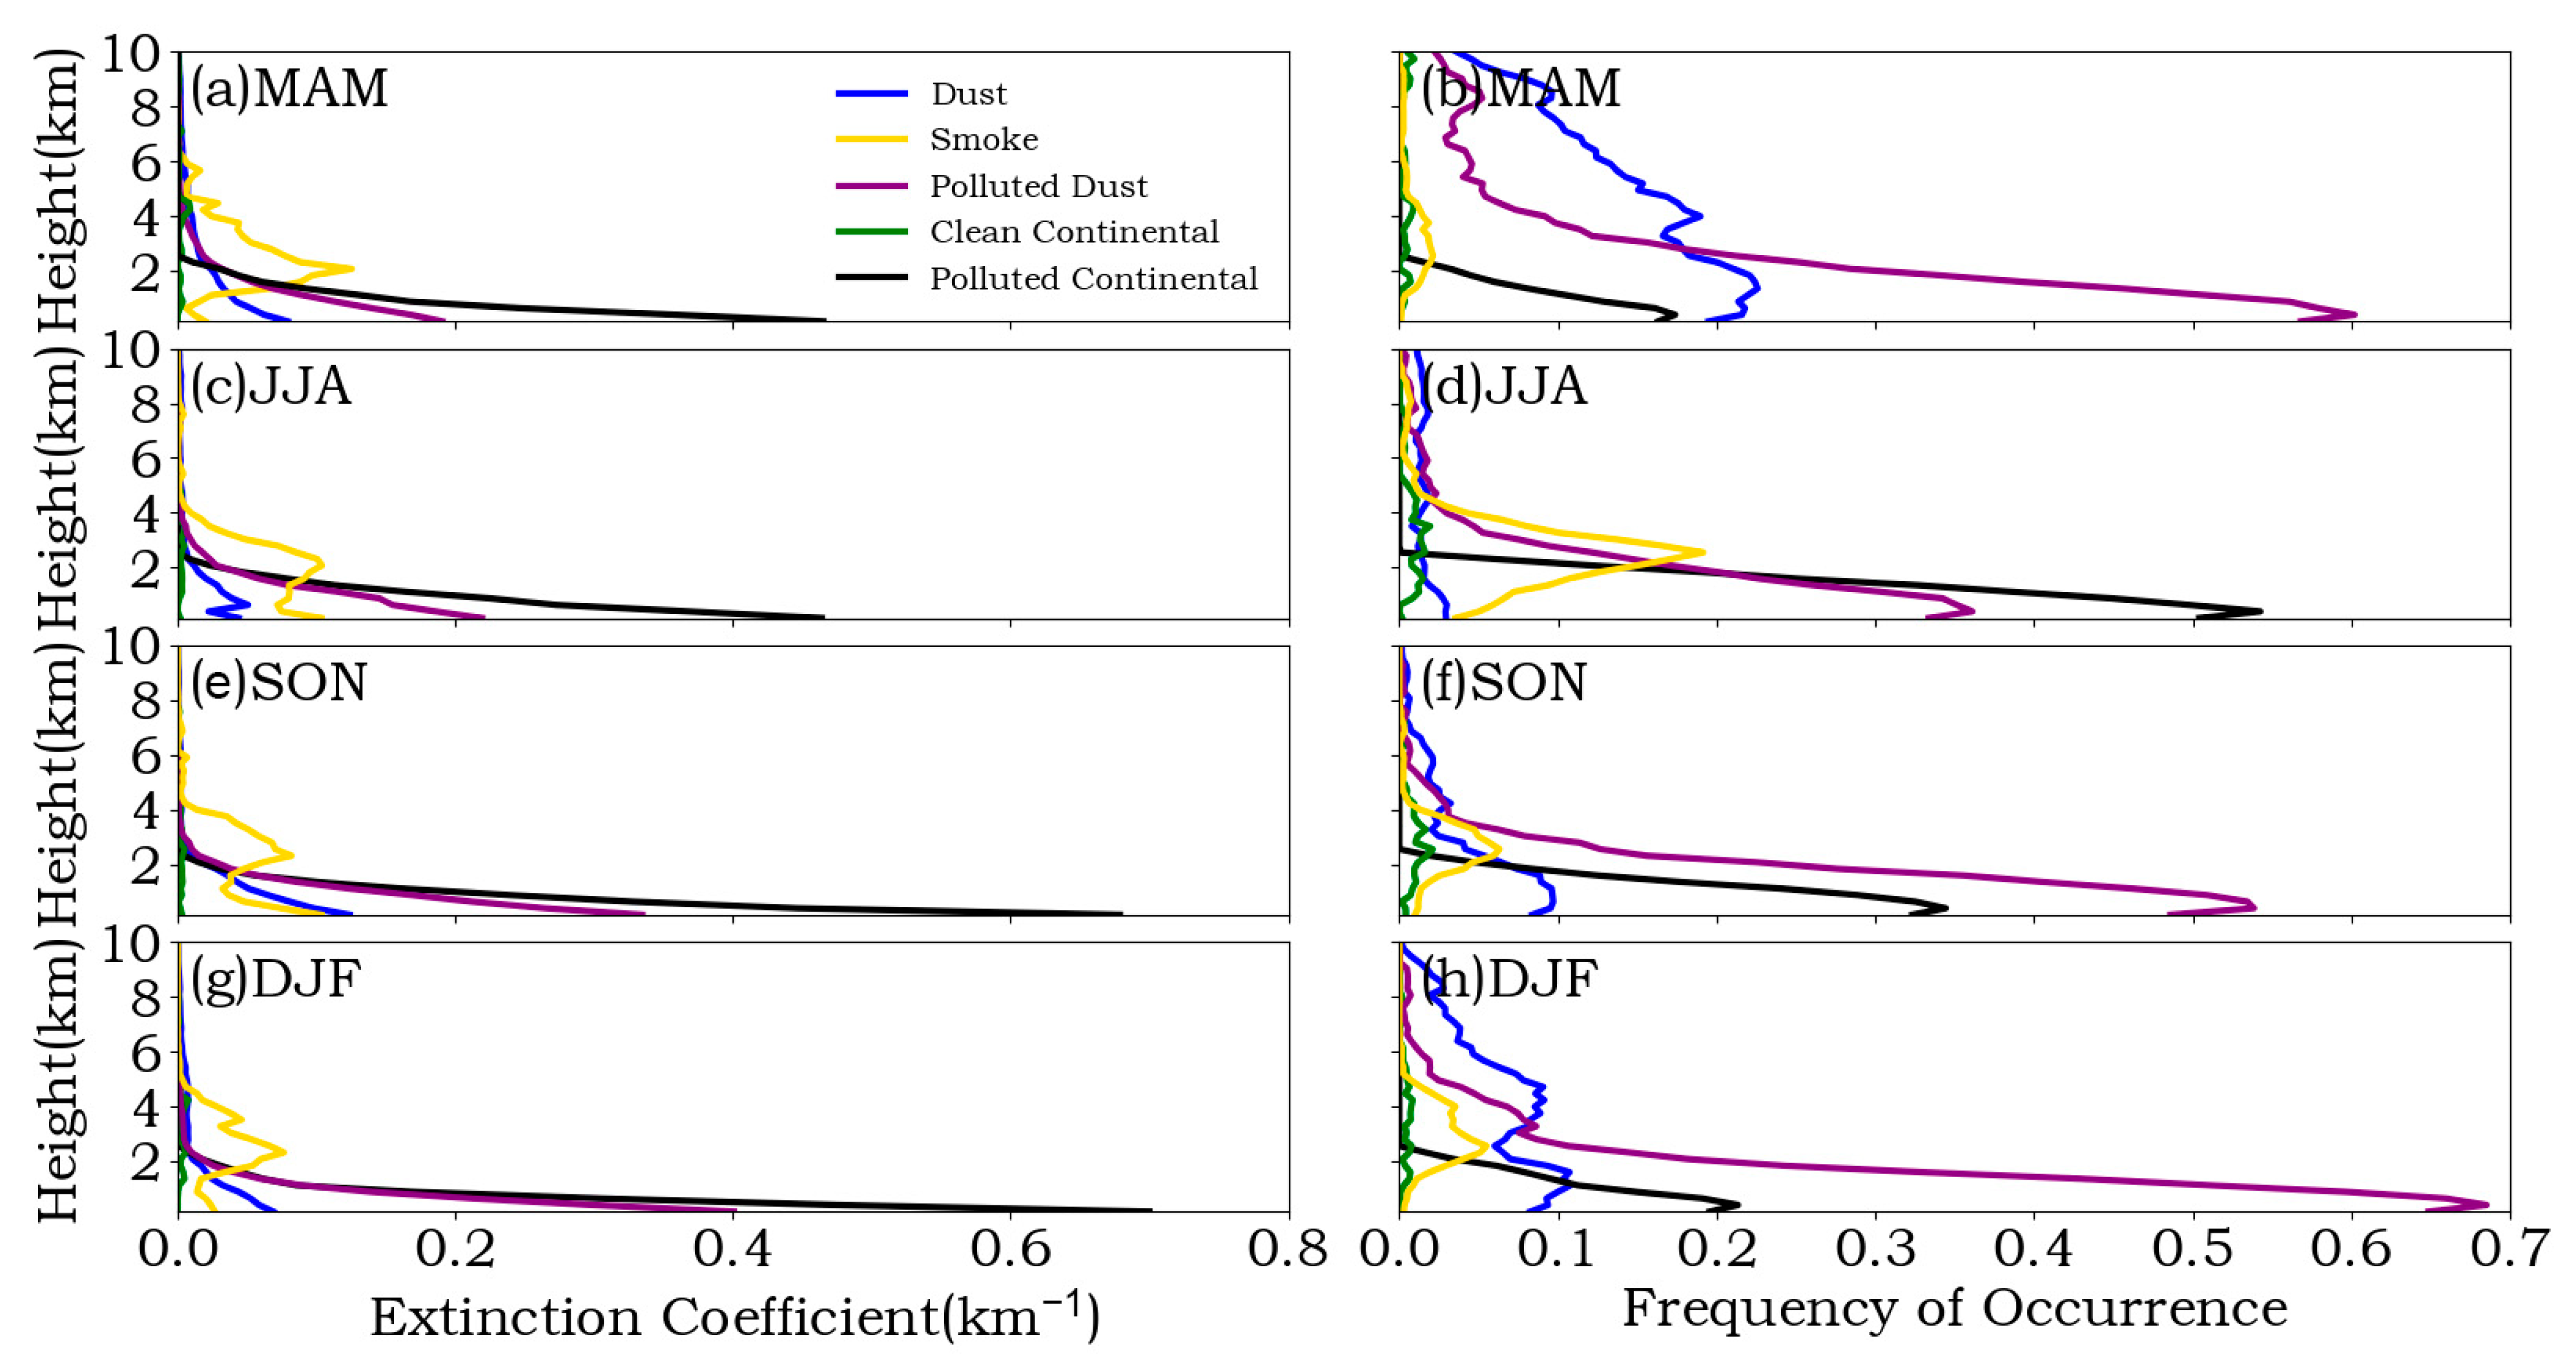
The seasonal variations of aerosol types and their vertical distributions in the region are summarized in Table 1 and Figure 8. In the region, the highest occurrence rate of dust is observed in the spring, consistent with the dust aerosol occurrence pattern in China [52]. Dust can reach up to 10 km altitude all season, with the highest occurrence in MAM followed by DJF. Mid-level and low-level dust mainly come from dust sources in northern and north-west China, and it is consistent with more frequent surface wind from the west, north-west, and north during MAM and DJF in Figure 9. Upper tropospheric dust in the region could also be from African dust sources [53].
PD is the dominant aerosol type in the region, with high occurrences all season. Vertically, PD is mainly distributed in the lower BL. The peak near-surface extinction coefficient of PD exceeds 0.35 km−1 in autumn and winter. The region is surrounded by heavy PD, especially in the east and northeast. Other than in dust sources, PD also comes from construction and farming in the region or long-range transported dust mixed with local air pollution. JJA has a slightly lower PD occurrence due to the growing and rainy season in the region and enhanced southeast wind.
PC aerosols contribute to the most polluted events in the region. The mean peak extinction coefficient is slightly below 0.7 km−1 in autumn and exceeds 0.7 km−1 in winter. Active secondary aerosol productions associated with high temperatures and solar radiation could be the main reason for summer peak PC aerosol occurrence. During the summer, the region is well-covered with vegetation, leading to fewer regional dust sources. Thus, more PC and less PD aerosols are detected in the summer.
Smoke aerosols in the region are mainly elevated in both extinction and occurrence distributions, peaking at ~2–3 km. While the peak extinction coefficients vary little among seasons, summer has the highest smoke occurrence. This is primarily attributed to the high temperatures and abundant vegetation in the southern regions, which are conducive to natural burning. In Figure 9b, the seasonal enhanced southern wind transports smoke long-range to the region. Additionally, there are local smoke sources associated with regional agricultural practices, such as straw burning.
CC aerosols maintain very low extinction coefficients throughout the year, indicating that the CC aerosol type has a minimal impact on the overall optical depth in the region. However, the occurrence rates of CC aerosols in summer and autumn are higher than in spring and winter.

4. Discussions

There is a significant decline in the annual mean AODs of MODIS and CALIOP in the HRB region from 2007 to 2021. MODIS AODs decreased from ~0.023 to ~0.027 per year. Due to CALIOP missing some optically thin aerosol layers during the daytime, CALIOP reported lower AODs than MODIS and had ~0.016 per year. Satellite-detected AOD decreases are consistent with the near-surface changes of aerosol extinction coefficients based on visibility measurements and air quality improvements indicated with PM2.5 measurements. Aerosol decreases occurred at all heights but were mainly contributed by aerosols below 800 m, with an annual AOD decrease of 0.011.
Regional aerosol annual cycles were characterized with MODIS and CALIPSO measurements, surface extinction coefficients, and PM2.5 measurements. While AOD measurements showed local aerosol peaked in summer when surface measurements showed lower values. These different seasonal trends mainly result from the seasonal variations of BL depth, which peaks in summer and allows aerosols distributed in a deeper layer in summer to have a lower extinction in lower BL. The seasonal contributions of different vertical layers derived from CALIOP confirm this seasonal vertical shifting of aerosol distributions.
This study demonstrated that the synergy of active (CALIOP) and passive (MODIS) satellite measurements and ground measurements offers a comprehensive view of regional aerosol properties and their distributions. Other than AOD or extinction coefficient measurements, aerosol size information could be used to further improve regional aerosol characterization. These measurements together offer not only improved value for model valuation and improvements but also important guidance for regional air quality improvements. These data confirmed regional air quality improvements. The significant reduction in PD highlights China’s environmental policies in reducing particulate matter in the atmosphere associated with primary aerosol production. However, the overall PD and PC levels are still very high in the region. Further improvements in regional air quality require efforts to reduce both primary and secondary aerosol productions over an extended region.

5. Conclusions

During the last 30 years, aerosol loadings in China have been significantly higher than the global mean, which has pronounced regional climate impact. Thus, understanding these aerosol changes is critical. Here long-term and seasonal aerosol variations in the HRB are studied with MODIS column integrated and CALIOP vertically resolved observations from 2007 to 2021 together with ground-based measurements. The major results are:
Long-term trends of five major aerosol types in the region are quantified with CALIOP measurements. PD is the dominant frequencies aerosol type (46.0% mean occurrence) in the region and decreased significantly during the periods (0.011 per year AOD decrease or ~68% CALIOP total AOD decrease). The extinction coefficient of PD aerosols showed that the decreases mainly occurred within 0–2 km. Dust is the second abundant aerosols in the region decrease slightly over the time. PC is the third abundant aerosols in the region but with the highest AOD with no clear decrease trend.
Seasonal aerosol type variations are explored together with surface wind climatology. Although the regional surface wind is mainly from east and southeast, seasonal varying wind directions driving the observed seasonal aerosol type variations as the HRB region is surrounded by varying aerosol sources. Seasonal higher wind from north and north-west in spring and winter leads higher dust occurrence in the region. PD is the dominated frequencies aerosol type in the region with a slightly lower PD occurrence in JJA due to the growing and rainy season in the region and enhanced south-east wind. PC aerosols peaked in summer months but with highest mean peak extinction coefficient exceeds 0.7 km−1 in winter.

Author Contributions

X.D.: Methodology, Software, Validation, Fromal analysis, Writing—original draft; C.X.: Writing—review & editing, Supervision, Project administration, Funding acquisition; D.L.: Fornal analysis, Writing—review & editing; Y.W.: Fornal analysis, Writing—review & editing, Supervision. All authors have read and agreed to the published version of the manuscript.

Funding

This work was supported in part by the Civil Aerospace Technology Pre-research Project (D040103), the Strategic Priority Research Program of the Chinese Academy of Sciences (XDA17040524), Anhui Province 2017 High-level Science and Technology Talent Team Project (010567900) and Key Program of 13th Five-Year Plan, CASHIPS (KP-2019-05).

Data Availability Statement

The CALIPSO data were obtained from NASA Langley Research Center Atmospheric Science Data Center through the websites https://eosweb.larc.nasa.gov/project/CALIPSO (accessed on 20 March 2024). MODIS data are available at https://ladsweb.modaps.eosdis.nasa.gov (accessed on 20 March 2024). PM2.5 and Visibility data from Shou County Meteorological Bureau.

Conflicts of Interest

The authors declare no conflict of interest.

References

  1. Change, I. Climate change 2007: The physical science basis. Agenda 2007, 6, 333. [Google Scholar]
  2. Twomey, S. The influence of pollution on the shortwave albedo of clouds. J. Atmos. Sci 1977, 34, 1149–1152. [Google Scholar] [CrossRef]
  3. Haywood, J.; Boucher, O. Estimates of the direct and indirect radiative forcing due to tropospheric aerosols: A review. Rev. Geophys. 2000, 38, 513–543. [Google Scholar] [CrossRef]
  4. Fan, J.; Wang, Y.; Rosenfeld, D.; Liu, X. Review of aerosol-cloud interactions: Mechanisms, significance, and challenges. J. Atmos. Sci. 2016, 73, 4221–4252. [Google Scholar] [CrossRef]
  5. Bellouin, N.; Quaas, J.; Gryspeerdt, E.; Kinne, S.; Stier, P.; Watson-Parris, D.; Boucher, O.; Carslaw, K.S.; Christensen, M.; Daniau, A.; et al. Bounding global aerosol radiative forcing of climate change. Rev. Geophys. 2020, 58, e2019RG000660. [Google Scholar] [CrossRef] [PubMed]
  6. Hansen, J.; Sato, M.; Ruedy, R. Radiative forcing and climate response. J. Geophys. Res. Atmos. 1997, 102, 6831–6864. [Google Scholar] [CrossRef]
  7. Wu, P.; Christidis, N.; Stott, P. Anthropogenic impact on Earth’s hydrological cycle. Nat. Clim. Change 2013, 3, 807–810. [Google Scholar] [CrossRef]
  8. Rahimi, S.; Liu, X.; Wu, C.; Lau, W.K.; Brown, H.; Wu, M.; Qian, Y. Quantifying snow darkening and atmospheric radiative effects of black carbon and dust on the South Asian monsoon and hydrological cycle: Experiments using variable-resolution CESM. Atmos. Chem. Phys. 2019, 19, 12025–12049. [Google Scholar] [CrossRef]
  9. Wang, H.; Xie, S.P.; Kosaka, Y.; Liu, Q.; Du, Y. Dynamics of Asian summer monsoon response to anthropogenic aerosol forcing. J. Clim. 2019, 32, 843–858. [Google Scholar] [CrossRef]
  10. Zheng, C.; Zhao, C.; Zhu, Y.; Wang, Y.; Shi, X.; Wu, X.; Chen, T.; Wu, F.; Qiu, Y. Analysis of influential factors for the relationship between PM 2.5 and AOD in Beijing. Atmos. Chem. Phys. 2017, 17, 13473–13489. [Google Scholar] [CrossRef]
  11. Kaufman, Y.J.; Boucher, O.; Tanré, D.; Chin, M.; Remer, L.A.; Takemura, T. Aerosol anthropogenic component estimated from satellite data. Geophys. Res. Lett. 2005, 32, L17804. [Google Scholar] [CrossRef]
  12. Boiyo, R.; Kumar, K.R.; Zhao, T.; Bao, Y. Climatological analysis of aerosol optical properties over East Africa observed from space-borne sensors during 2001–2015. Atmos. Environ. 2017, 152, 298–313. [Google Scholar] [CrossRef]
  13. Huneeus, N.; Schulz, M.; Balkanski, Y.; Griesfeller, J.; Kinne, S.; Prospero, J.; Bauer, S.; Boucher, O.; Chin, M.; Dentener, F.; et al. Global dust model intercomparison in AeroCom phase I. Atmos. Chem. Phys. 2011, 11, 7781–7816. [Google Scholar] [CrossRef]
  14. Winker, D.M.; Vaughan, M.A.; Omar, A.; Hu, Y.; Powell, K.A.; Liu, Z.; Hunt, W.H.; Young, S.A. Overview of the CALIPSO mission and CALIOP data processing algorithms. J. Atmos. Ocean. Technol. 2009, 26, 2310–2323. [Google Scholar] [CrossRef]
  15. Yu, H.; Chin, M.; Winker, D.M.; Omar, A.H.; Liu, Z.; Kittaka, C.; Diehl, T. Global view of aerosol vertical distributions from CALIPSO lidar measurements and GOCART simulations: Regional and seasonal variations. J. Geophys. Res. Atmos. 2010, 115, D00H30. [Google Scholar] [CrossRef]
  16. Winker, D.M.; Tackett, J.L.; Getzewich, B.J.; Liu, Z.; Vaughan, M.A.; Rogers, R.R. The global 3-D distribution of tropospheric aerosols as characterized by CALIOP. Atmos. Chem. Phys. 2013, 13, 3345–3361. [Google Scholar] [CrossRef]
  17. Tian, P.; Cao, X.; Zhang, L.; Sun, N.X.; Sun, L.; Logan, T.; Shi, J.S.; Wang, Y.; Ji, Y.M.; Lin, Y.; et al. Aerosol vertical distribution and optical properties over China from long-term satellite and ground-based remote sensing. Atmos. Chem. Phys. 2017, 17, 2509–2523. [Google Scholar] [CrossRef]
  18. Zhao, B.; Jiang, J.H.; Diner, D.J.; Su, H.; Gu, Y.; Liou, K.-N.; Jiang, Z.; Huang, L.; Takano, Y.; Fan, X. Intra-annual variations of regional aerosol optical depth, vertical distribution, and particle types from multiple satellite and ground-based observational datasets. Atmos. Chem. Phys. 2018, 18, 11247–11260. [Google Scholar] [CrossRef]
  19. Kittaka, C.; Winker, D.M.; Vaughan, M.A.; Omar, A.; Remer, L.A. Intercomparison of column aerosol optical depths from CALIPSO and MODIS-Aqua. Atmos. Meas. Tech. 2011, 4, 131–141. [Google Scholar] [CrossRef]
  20. Shu, Z.; Liu, Y.; Zhao, T.; Zhou, Y.; Habtemicheal, B.A.; Shen, L.; Hu, J.; Ma, X.; Sun, X. Long-term variations in aerosol optical properties, types, and radiative forcing in the Sichuan Basin, Southwest China. Sci. Total Environ. 2022, 807, 151490. [Google Scholar] [CrossRef]
  21. Shen, L.; Wang, H.; Zhao, T.; Liu, J.; Bai, Y.; Kong, S.; Shu, Z. Characterizing regional aerosol pollution in central China based on 19 years of MODIS data: Spatiotemporal variation and aerosol type discrimination. Environ. Pollut. 2020, 263, 114556. [Google Scholar] [CrossRef]
  22. Chen, X.; Li, K.; Yang, T.; Yang, Z.; Wang, X.; Zhu, B.; Chen, L.; Yang, Y.; Liao, H. Trends and drivers of aerosol vertical distribution over China from 2013 to 2020: Insights from integrated observations and modeling. Sci. Total Environ. 2024, 917, 170485. [Google Scholar] [CrossRef] [PubMed]
  23. He, Y.; Ye, J.; Yang, X. Analysis of the spatio-temporal patterns of dry and wet conditions in the Huai River Basin using the standardized precipitation index. Atmos. Res. 2015, 166, 120–128. [Google Scholar] [CrossRef]
  24. Li, M.; Chu, R.; Shen, S.; Islam, A.R.M.T. Dynamic analysis of pan evaporation variations in the Huai River Basin, a climate transition zone in eastern China. Sci. Total Environ. 2018, 625, 496–509. [Google Scholar] [CrossRef] [PubMed]
  25. Li, Z.; Chen, H.; Tsay, S.C.; Wang, W.C.; Kumemerow, C.; Stephens, G.; Berg, W.; Menon, S.; Liu, Y.; Miller, M.; et al. ARM Mobile Facility Deployment in China 2008 (AMF-China) Science Plan; DOE/SC-ARM. 2008. Available online: https://www.arm.gov/publications/programdocs/doe-sc-arm-0802.pdf (accessed on 20 March 2024).
  26. Fu, S.; Xie, C.; Zhuang, P.; Tian, X.; Zhang, Z.; Wang, B.; Liu, D. Study of persistent foggy-hazy composite pollution in winter over Huainan through ground-based and satellite measurements. Atmosphere 2019, 10, 656. [Google Scholar] [CrossRef]
  27. Winker, D.M.; Pelon, J.; Coakley, J.A., Jr.; Ackerman, S.A.; Charlson, R.J.; Colarco, P.R.; Flamant, P.; Fu, Q.; Hoff, R.M.; Kittaka, C.; et al. The CALIPSO mission: A global 3D view of aerosols and clouds. Bull. Am. Meteorol. Soc. 2010, 91, 1211–1230. [Google Scholar] [CrossRef]
  28. Liu, Z.; Vaughan, M.A.; Winker, D.M.; Hostetler, C.A.; Poole, L.R.; Hlavka, D.; Hart, W.; McGill, M. Use of probability distribution functions for discriminating between cloud and aerosol in lidar backscatter data. J. Geophys. Res. Atmos. 2004, 109, 4732. [Google Scholar] [CrossRef]
  29. Liu, Z.; Vaughan, M.; Winker, D.; Kittaka, C.; Getzewich, B.; Kuehn, R.; Omar, A.; Powell, K.; Trepte, C.; Hostetler, C. The CALIPSO lidar cloud and aerosol discrimination: Version 2 algorithm and initial assessment of performance. J. Atmos. Ocean. Technol. 2009, 26, 1198–1213. [Google Scholar] [CrossRef]
  30. Young, S.A.; Vaughan, M.A.; Garnier, A.; Tackett, J.L.; Lambeth, J.D.; Powell, K.A. Extinction and optical depth retrievals for CALIPSO’s Version 4 data release. Atmos. Meas. Tech. 2018, 11, 5701–5727. [Google Scholar] [CrossRef]
  31. Kim, M.H.; Omar, A.H.; Tackett, J.L.; Vaughan, M.A.; Winker, D.M.; Trepte, C.R.; Hu, Y.; Liu, Z.; Poole, L.R.; Pitts, M.C.; et al. The CALIPSO version 4 automated aerosol classification and lidar ratio selection algorithm. Atmos. Meas. Tech. 2018, 11, 6107–6135. [Google Scholar] [CrossRef]
  32. Burton, S.P.; Ferrare, R.A.; Vaughan, M.A.; Omar, A.H.; Rogers, R.R.; Hostetler, C.A.; Hair, J.W. Aerosol classification from airborne HSRL and comparisons with the CALIPSO vertical feature mask. Atmos. Meas. Tech. 2013, 6, 1397–1412. [Google Scholar] [CrossRef]
  33. Rogers, R.R.; Hostetler, C.A.; Hair, J.W.; Ferrare, R.A.; Liu, Z.; Obland, M.D.; Harper, D.B.; Cook, A.L.; Powell, K.A.; Vaughan, M.A.; et al. Assessment of the CALIPSO Lidar 532 nm attenuated backscatter calibration using the NASA LaRC airborne High Spectral Resolution Lidar. Atmos. Chem. Phys. 2011, 11, 1295–1311. [Google Scholar] [CrossRef]
  34. Pappalardo, G.; Wandinger, U.; Mona, L.; Hiebsch, A.; Mattis, I.; Amodeo, A.; Ansmann, A.; Seifert, P.; Linné, H.; Apituley, A.; et al. EARLINET correlative measurements for CALIPSO: First intercomparison results. J. Geophys. Res. Atmos. 2010, 115, 12147. [Google Scholar] [CrossRef]
  35. Mamouri, R.E.; Amiridis, V.; Papayannis, A.; Giannakaki, E.; Tsaknakis, G.; Bali, D.S. Validation of CALIPSO space-borne-derived attenuated backscatter coefficient profiles using a ground-based lidar in Athens, Greece. Atmos. Meas. Tech. 2009, 2, 513–522. [Google Scholar] [CrossRef]
  36. Mona, L.; Pappalardo, G.; Amodeo, A.; D’Amico, G.; Madonna, F.; Boselli, A.; Giunta, A.; Russo, F.; Cuomo, V. One year of CNR-IMAA multi-wavelength Raman lidar measurements in correspondence of CALIPSO overpass: Level 1 products comparison. Atmos. Chem. Phys. Discuss. 2009, 9, 7213–7228. [Google Scholar] [CrossRef]
  37. Sayer, A.M.; Hsu, N.C.; Bettenhausen, C.; Jeong, M.J. Validation and uncertainty estimates for MODIS Collection 6 “Deep Blue” aerosol data. J. Geophys. Res. Atmos. 2013, 118, 7864–7872. [Google Scholar] [CrossRef]
  38. Levy, R.C.; Remer, L.A.; Kleidman, R.G.; Mattoo, S.; Ichoku, C.; Kahn, R.; Eck, T.F. Global evaluation of the Collection 5 MODIS dark-target aerosol products over land. Atmos. Chem. Phys. 2010, 10, 10399–10420. [Google Scholar] [CrossRef]
  39. Levy, R.C.; Mattoo, S.; Munchak, L.A.; Sayer, A.M.; Patadia, F.; Hsu, N.C. The Collection 6 MODIS aerosol products over land and ocean. Atmos. Meas. Tech. 2013, 6, 2989–3034. [Google Scholar] [CrossRef]
  40. Griffing, G.W. Relations between the prevailing visibility, nephelometer scattering coefficient and sunphotometer turbidity coefficient. Atmos. Environ. (1967) 1980, 14, 577–584. [Google Scholar] [CrossRef]
  41. Lu, P.; Hamori, S.; Tian, S. Policy effect of the “blue sky plan” on air pollution, ESG investment, and financial performance of china’s steel industry. Front. Environ. Sci. 2022, 10, 955906. [Google Scholar] [CrossRef]
  42. Luo, T.; Wang, Z.; Zhang, D.; Liu, X.; Wang, Y.; Yuan, R. Global dust distribution from improved thin dust layer detection using A-train satellite lidar observations. Geophys. Res. Lett. 2015, 42, 620–628. [Google Scholar] [CrossRef]
  43. Thorsen, T.J.; Ferrare, R.A.; Hostetler, C.A.; Vaughan, M.A.; Fu, Q. The impact of lidar detection sensitivity on assessing aerosol direct radiative effects. Geophys. Res. Lett. 2017, 44, 9059–9067. [Google Scholar] [CrossRef]
  44. Luo, T.; Yuan, R.; Wang, Z. On factors controlling marine boundary layer aerosol optical depth. J. Geophys. Res. Atmos. 2014, 119, 3321–3334. [Google Scholar] [CrossRef]
  45. Yang, K.; Wang, Z.; Luo, T.; Liu, X.; Wu, M. Upper troposphere dust belt formation processes vary seasonally and spatially in the Northern Hemisphere. Commun. Earth Environ. 2022, 3, 24. [Google Scholar] [CrossRef]
  46. Cheng, Z.; Wang, S.; Jiang, J.; Fu, Q.; Chen, C.; Xu, B.; Yu, J.; Fu, X.; Hao, J. Long-term trend of haze pollution and impact of particulate matter in the Yangtze River Delta, China. Environ. Pollut. 2013, 182, 101–110. [Google Scholar] [CrossRef]
  47. Kim, M.H.; Omar, A.H.; Vaughan, M.A.; Winker, D.M.; Trepte, C.R.; Hu, Y.; Liu, Z.; Kim, S.-W. Quantifying the low bias of CALIPSO’s column aerosol optical depth due to undetected aerosol layers. J. Geophys. Res. Atmos. 2017, 122, 1098–1113. [Google Scholar] [CrossRef] [PubMed]
  48. Guo, J.; Miao, Y.; Zhang, Y.; Liu, H.; Li, Z.; Zhang, W.; He, J.; Lou, M.; Yan, Y.; Bian, L. The climatology of planetary boundary layer height in China derived from radiosonde and reanalysis data. Atmos. Chem. Phys. 2016, 16, 13309–13319. [Google Scholar] [CrossRef]
  49. Liu, J.; Zheng, Y.; Li, Z.; Flynn, C.; Cribb, M.S. Seasonal variations of aerosol optical properties, vertical distribution and associated radiative effects in the Yangtze Delta region of China. J. Geophys. Res. Atmos. 2012, 117, 1036407. [Google Scholar] [CrossRef]
  50. Minguillón, M.C.; Brines, M.; Pérez, N.; Reche, C.; Pandolfi, M.; Fonseca, A.S.; Amato, F.; Alastuey, A.; Lyasota, A.; Codina, B.; et al. New particle formation at ground level and in the vertical column over the Barcelona area. Atmos. Res. 2015, 164, 118–130. [Google Scholar] [CrossRef]
  51. Heald, C.L.; Jacob, D.J.; Park, R.J.; Russell, L.M.; Huebert, B.J.; Seinfeld, J.H.; Liao, H.; Weber, R.J. A large organic aerosol source in the free troposphere missing from current models. Geophys. Res. Lett. 2005, 32, L18809. [Google Scholar] [CrossRef]
  52. Wang, H.; Zhang, L.; Cao, X.; Zhang, Z.; Liang, J. A-Train satellite measurements of dust aerosol distributions over northern China. J. Quant. Spectrosc. Radiat. Transf. 2013, 122, 170–179. [Google Scholar] [CrossRef]
  53. Liu, Q.; Huang, Z.; Hu, Z.; Dong, Q.; Li, S. Long-range transport and evolution of Saharan dust over East Asia from 2007 to 2020. J. Geophys. Res. Atmos. 2022, 127, e2022JD036974. [Google Scholar] [CrossRef]
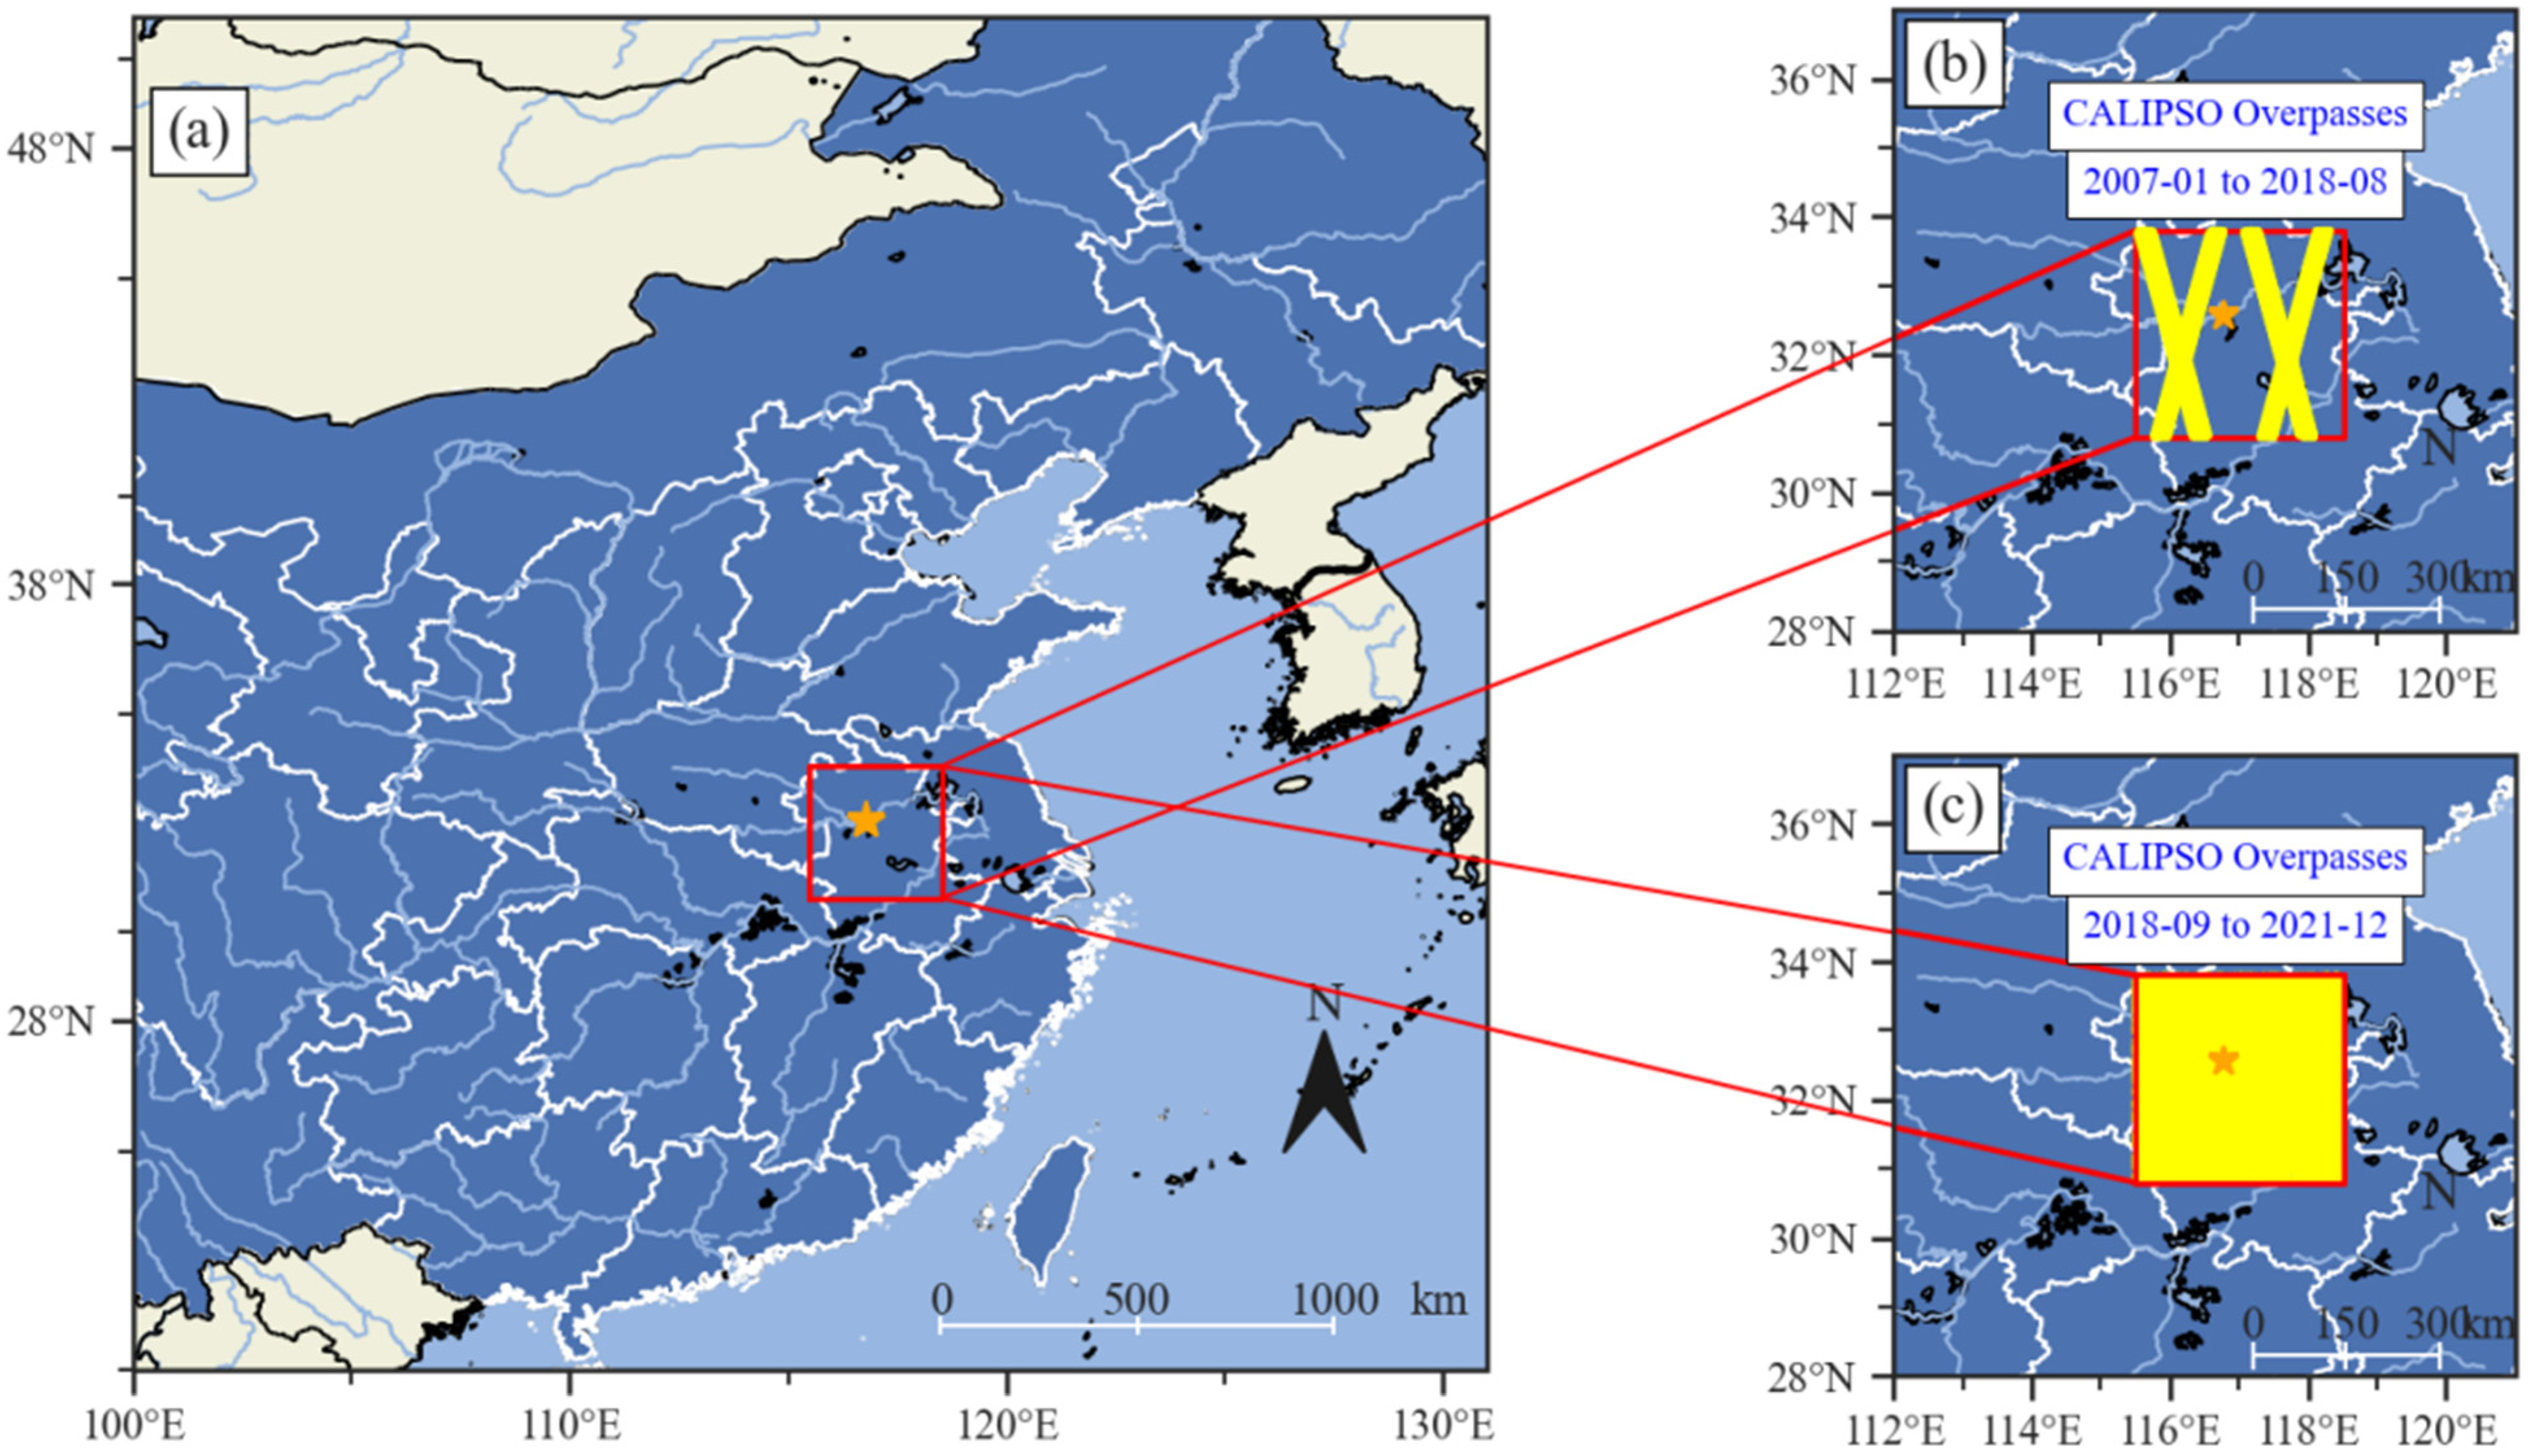
Figure 1. (a) The red box highlights the HRB selected in this study with data from the MODIS. The orange star denotes the location of the Shou County ground-based observation station (orange star), serving as a pivotal point for collecting localized atmospheric measurements to complement the satellite-derived aerosol data. (b) The CALIPSO repeating tracks during the A-train configuration period from January 2007 to August 2018. (c) The CALIPSO moving ground-track coverage during the C-train configuration period from September 2018 to February 2021.
Remotesensing 16 01571 g001
Figure 2. (a) Ground-based range-corrected lidar signals at the Shou County site (116.37°E, 32.27°N) from 10 February 2017, 4:00 to 11 February 2017, 4:00 (UTC), with two vertical red lines indicating the period half an hour before and after the CALIOP overpass. (b) CALIOP total attenuated backscatter (TAB) at 532 nm on 10 February 2017, around 18:02:57 (UTC), with two vertical red lines marking the specific latitude range of interest from 30.8°N to 33.8°N. (c) Comparison of the extinction coefficient between ground-based lidar and CALIOP during the overpass. (d) CALIOP aerosol type identifications with two vertical red lines marking the specific latitude range of interest from 30.8°N to 33.8°N.
Remotesensing 16 01571 g002
Figure 3. (a) The long-term AOD trends in the Shou County region from 2007 to 2021, including AODs from Terra and Aqua MODIS and CALIOP total and for various aerosol types. Also including the visibility extinction coefficient and PM2.5 concentrations. (b) occurrence frequencies of different aerosol types based on CALIOP data from 2007 to 2021.
Remotesensing 16 01571 g003
Figure 4. The contributions of different layers to annual mean AODs during 2007–2021 in HRB as observed by CALIOP. The integrated AOD for heights below and above 800 m are shown as red and black solid lines.
Remotesensing 16 01571 g004
Figure 5. Comparisons of aerosol extinction (a) and occurrence frequency (b) profiles for five different aerosol types during the periods of 2007–2014 (solid lines) and 2015–2021 (dashed lines).
Remotesensing 16 01571 g005
Figure 6. (a) The annual cycles of AODs based on MODIS and CALIPSO measurements during 2007–2021, surface extinction coefficients based on visibility measurements during 2015–2021, and PM2.5 concentrations during 2015–2018. (b) The annual cycles of temperature and relative humidity during 2015–2021.
Remotesensing 16 01571 g006
Figure 7. The variations of different atmospheric layer contributions to monthly mean AODs based on CALIOP measurements during 2007–2021 in HRB. The AODs for heights below and above 800 m are shown as solid red and black lines.
Remotesensing 16 01571 g007
Figure 8. The seasonal mean vertical structures of extinction coefficients (left column) and occurrence frequency (right column) for five different aerosol types from CALIOP measurements.
Remotesensing 16 01571 g008
Figure 9. Wind rose charts showing seasonal surface wind speeds (m/s) and wind directions at the Shou County site during 2015–2021.
Remotesensing 16 01571 g009
Table 1. The seasonal occurrences of five different aerosol types in the region.
Season\Aerosol TypeCCSmokeDDPDPC
Spring (MAM)2.8%2.8%39.0%45.8%9.7%
Summer (JJA)6.5%17.7%9.8%35.5%33.5%
Autumn (SON)5.6%6.7%15.8%46.9%23.9%
Winter (DJF)3.3%6.0%26.3%49.9%14.5%
Disclaimer/Publisher’s Note: The statements, opinions and data contained in all publications are solely those of the individual author(s) and contributor(s) and not of MDPI and/or the editor(s). MDPI and/or the editor(s) disclaim responsibility for any injury to people or property resulting from any ideas, methods, instructions or products referred to in the content.