Article

Research on Three-Dimensional Cloud Structure Retrieval and Fusion Technology for the MODIS Instrument

1
Precision Regional Earth Modeling and Information Center, Nanjing University of Information Science and Technology, Nanjing 210044, China
2
COMAC Meteorological Laboratory, COMAC Flight Test Center, Shanghai 201323, China
3
Key Laboratory for Cloud Physics, China Meteorological Administration, Beijing 100081, China
*
Author to whom correspondence should be addressed.
Remote Sens. 2024, 16(9), 1561; https://doi.org/10.3390/rs16091561
Submission received: 19 March 2024 / Revised: 12 April 2024 / Accepted: 24 April 2024 / Published: 28 April 2024

Abstract

:
Accurate three-dimensional (3D) cloud structure measurements are critical for assessing the influence of clouds on the Earth’s atmospheric system. This study extended the MODIS (Moderate-Resolution Imaging Spectroradiometer) cloud vertical profile (64 × 64 scene, about 70 km in width × 15 km in height) retrieval technique based on conditional generative adversarial networks (CGAN) to construct seamless 3D cloud fields for the MODIS granules. Firstly, the accuracy and spatial continuity of the retrievals (of 7180 samples from the validation set) were statistically evaluated. Then, according to the characteristics of the retrieval error, a spatially overlapping-scene ensemble generation method and a bidirectional ensemble binning probability fusion (CGAN-BEBPF) technique were developed, which improved the CGAN retrieval accuracy and support to construct seamless 3D clouds for the MODIS granules. The CGAN-BEBPF technique involved three steps: cloud masking, intensity scaling, and optimal value selection. It ensured adequate coverage of the low reflectivity areas while preserving the high-reflectivity cloud cores. The technique was applied to retrieve the 3D cloud fields of Typhoon Chaba and a multi-cell convective system and the results were compared with ground-based radar measurements. The cloud structures of the CGAN-BEBPF results were highly consistent with the ground-based radar observations. The CGAN-EBEPF technique retrieved weak ice clouds at the top levels that were missed by ground-based radars and filled the gaps of the ground-based radars in the lower levels. The CGAN-BEBPF was automated to retrieve 3D cloud radar reflectivity along the MODIS track over the seas to the east and south of mainland China, providing valuable cloud information to support maritime and near-shore typhoons and convection prediction for the cloud-sensitive applications in the regions.

1. Introduction

Clouds are a critical element of the Earth’s atmospheric system. Clouds affect the energy balance of the Earth’s atmosphere and atmospheric circulations across all scales [1,2]. Accurate detection of the three-dimensional (3D) structure of clouds is essential for improving the simulation of cloud and precipitation processes, diabatic data assimilation, and studying cloud–radiation interaction and its impact on climate [3]. Currently, many sensors, including satellite active and passive remote sensing, radiosonde observations, ground-based remote sensing observations, and aircraft measurements, etc., have been developed to obtain cloud information. Nevertheless, all existing platforms have significant limitations.
Weather and cloud radars are the most important cloud detection instruments for detecting 3D structures of clouds. However, most radars are ground-based and their coverage is limited, especially for remote mountainous areas and over the oceans. Geostationary satellites provide continuous observation of large-scale horizontal cloud distributions over the oceans, but due to their high altitude, the observation is typically achieved with passive remote sensing, which is mostly limited to cloud-top properties. Several polar-orbiting satellites are equipped with active remote sensing (including radar). For example, the W-band (94 GHz) millimeter-wave cloud-profiling radar (CPR), on the CloudSat satellite, provides a global detection of 2D vertical cloud structures [4]. The GPM (Global Precipitation Measurement Core Observatory) [5,6] and the FY-3G satellite [7] are equipped with dual-frequency precipitation radars (DPR) and precipitation measurement radar (PMR) respectively, detecting the 3D precipitation structures. Nevertheless, these radars usually have very narrow swath widths (100–250 km) and low horizontal resolution. Polar-orbiting satellites carrying passive remote sensing instruments, such as MODIS, have a wide swath scanning field of view and a high spatial resolution [8,9]. Therefore, it is highly desired to develop new methods to retrieve clouds based on these satellites’ passive remote sensing to obtain large-scale oceanic cloud 3D structures.
Several researchers have attempted to explore satellite observations to obtain 3D cloud information. Barker et al. used a radiation-similarity approach based on thermal infrared and visible channel data to estimate cloud ceilings. This approach relates donor pixels (from the active sensor data) to the recipient pixels in the surrounding regions [10]. Miller et al. analyzed the statistical relationships between cloud types and cloud water content profiles and used detailed local cloud-profile information from active sensors to approximate properties of the surrounding regional cloud field. Since satellite passive observing systems provide very limited information about clouds in the vertical dimension, the technique can only be applied to the uppermost cloud layer observed [11]. Noh et al. developed a statistical cloud base height (CBH) estimation method to support constructing 3D clouds for aviation applications [12]. Obviously, these studies present very limited capabilities for retrieving 3D clouds, especially for the broad ocean areas [13].
Modern deep learning technologies provide new capabilities to retrieve clouds from satellites with passive remote sensing. Several works employed deep learning algorithms to study cloud properties [14,15,16,17]. With deep learning technologies, it is possible to establish a relationship between the CloudSat CPR 2D cloud vertical profiles and the corresponding MODIS L2 cloud products so that 3D clouds can be retrieved in the full MODIS granules. Generative adversarial networks (GANs) and their variant conditional generative adversarial networks (CGANs) have been proven to be very encouraging tools for establishing such a desired relationship [18,19]. By setting up a CGAN model, Leinonen et al. retrieved CloudSat CPR-equivalent 2D cloud profiles (64 × 64 scenes, with a horizontal length of 70 km and a vertical height of 15 km) [20]. Wang et al. expanded the dataset in Leinonen et al.’s study and conducted a systematic assessment of Leinonen’s CGAN model for different cloud types and geographical regions [20]. Their study showed that the CGAN model presents great capabilities for retrieving clouds with structured patterns, significant thickness, and high reflectivity, such as deep convective clouds and nimbostratus [21]. It retrieves more than 60% of deep convective cloud cases and 50% of nimbostratus cases having probability of detection (POD) scores greater than 0.8 at a threshold of −25 dBZ.
This study aims to extend the works of Leinonen et al. [20] and Wang et al. [21] to post-process their 64 × 64-pixel cloud scenes with better accuracy and produce seamless 3D clouds for the MODIS granules (2030 × 1354 pixels) [22] with 64 vertical levels. Firstly, we analyzed the error characteristics of Leinonen et al.’s CGAN-retrieved cloud scenes. Secondly, an ensemble fusion technique (described in Section 3) based on CGAN (CGAN-BEBPF) was developed to improve the accuracy of the CGAN model generation and achieve probabilistic fusion CGAN-retrievals of the 2D cloud radar reflectivity factors to produce seamless 3D cloud radar reflectivity fields for full MODIS granules with a horizontal resolution of 1 km and a vertical resolution of 240 m. The results were compared with ground-based weather radar observations.
The structure of this paper is as follows. Section 2 introduces the data sources, Leinonen et al.’s CGAN-based MODIS 2D vertical scene retrieval technique, the weather case selection for this study, and the evaluation criteria for the 3D cloud retrievals. Section 3 describes the bidirectional ensemble binning probabilistic fusion (BEBPF) technique and an evaluation using CloudSat CPR data. In Section 4, the 3D cloud structures retrieved for typhoon Chaba-2022 and a multi-cell convective system are compared with ground-based radar observations. Finally, Section 5 summarizes the research results and provides future perspectives.

2. Data and Methodology

2.1. CloudSat and MODIS Datasets

The data used in this study are from the CloudSat (CPR) and Aqua (MODIS) satellites, similar to those used for training the CGAN cloud scene retrieval model by Leinonen et al. [20] and Wang et al. [21]. CloudSat is in a sun-synchronous orbit at an altitude of 705 km. It is equipped with the cloud profiling radar (CPR), a 94 GHz millimeter-wave (W-band) radar that has significantly higher sensitivity to clouds compared to standard ground-based weather radars [4]. The 2B-GEOPROF product from CloudSat [23,24] provides radar reflectivity observations obtained by the CPR. The Aqua satellite carries the Moderate Resolution Imaging Spectroradiometer (MODIS) [8,9], which has 36 spectral bands covering the visible to the thermal infrared regions, and is capable of achieving full global observation coverage within a 2-day period [25]. MODIS enables the detection and characterization of horizontal cloud extents and cloud radiative properties on a global scale [26,27]. Since both the Aqua and CloudSat satellites are part of the A-Train constellation, these two satellites fly in close proximity, with a time separation of less than one minute. Therefore, the cloud observation data from the MODIS instrument on Aqua and the CPR instrument on CloudSat are considered spatiotemporally consistent. Note that MODIS provides updated data twice a day for both daytime and nighttime observations.
The CGAN model developed by Leinonen et al. [20] retrieves the CloudSat CPR reflectivity from the cloud-top pressure (Ptop), cloud water path (CWP), cloud optical thickness (τc), effective particle radius (re), and cloud mask, provided by the MODIS MOD06-AUX cloud product [28]. The dataset comprises global oceanic airspace data from 2010 to 2017, with a total of 251,456 samples (179,660 from Leinonen et al. and 71,796 from Wang et al.). Ninety percent of the sample was selected for training, totaling 219,848 samples, while the remaining 10% of the data from Wang et al. were used for validation, totaling 7180 items. A vertical cross-section of 64 × 64 pixels, defined as a “scene” by Leinonen et al. [20], was generated individually along the CloudSat CPR track. Therefore, a scene covered an area of approximately 70 km horizontally and 15 km in height. The MODIS cloud products use a great-circle nearest-neighbor scheme to match the CloudSat CPR reflectivity, constituting the training samples for the CGAN model [28].

2.2. Requirements for Retrieving 3D Cloud Fields for the MODIS Granules

The CGAN-based cloud retrieval model developed by Leinonen et al. [20] retrieves 2D cloud radar reflectivity scenes (64 × 64 pixels) along the CPR track, using only one-dimensional MODIS cloud observations (64 pixels) as inputs. A MODIS granule is 5 min chunks of a MODIS swath containing 2030 × 1354 pixels (Figure 1) and covering a section about 2030 km along the orbit and 2330 km wide [22,29]. To construct 3D cloud fields for MODIS granules, we needed to account for the retrieval accuracy of individual scenes and ensure continuity between neighboring scenes. Additionally, we also needed to ensure continuity in the direction perpendicular to the CPR track. In this study, we developed a series of algorithms to complete seamless 3D cloud field construction. Firstly, we evaluated the characteristics of the CGAN-generated scenes. Then, we designed an ensemble and blending method to extend the CGAN scenes to the full MODIS granule width, and finally we dealt with the other direction (normal to the CPR track) and obtained a final 3D cloud output. The set of processes is referred to as bidirectional ensemble binning probabilistic fusion based on CGAN (CGAN-BEBPF). The pathway of CGAN-BEBPF is described in Figure 1. The algorithms in each step are discussed in detail in Section 3.

2.3. Case Selection

In February 2018, the CloudSat satellite underwent a descent orbit operation, resulting in its withdrawal from the ‘A-train’ constellation. Therefore, since 2018, the CGAN-retrieved MODIS cloud scenes have no longer had matched CPR observations. To validate the 3D cloud fields with CGAN-BEBPF, two groups of weather cases were selected. The first group included six cases from 2014 to 2017. They were used to evaluate the results of CGAN-BEBPF by comparing them with the CPR observations. The second group included typhoon Chaba (South China, 2 July 2022) and a multi-cell convective system (South China, 24 August 2022) occurring in the near-shore seas along the south coasts of China, for which there were no matching CPR observations. The observation range of the coastal ground-based weather radars (S-band) is about 200 km out into the sea, which provided reflectivity data for verifying the 3D cloud fields retrieved for these two cases. The ground-based radar data used for verification were from the Severe Weather Automatic Nowcast System (SWAN) radar mosaic data provided by the National Meteorological Centre (NMC) of the China Meteorological Administration. Table 1 describes the cases in the two groups. Note that the Group 1 cases were also used as a reference in designing EBPF value-selection strategies (to be detailed later).

2.4. Verification Metrics

To evaluate the 3D cloud field retrievals, the Heidke Skill Score (HSS) [30,31] was calculated using the binary confusion matrix proposed by Finley et al. (1884) [32] (Table 2), as verified against the CPR observations. The evaluation was performed pixel by pixel and case by case.
HSS is computed as
H S S = 2 × ( T P × T N F N × F P ) T P + F N F N + T N + ( T P + F P ) ( F P + T N )
where, for a given radar reflectivity factor threshold K, TP are the occurrences where the observation is greater than or equal to K and the retrieval is also greater than or equal to K. FN are the occurrences where the observation is greater than or equal to K while the retrieval is less than K. FP are the occurrences where the observation is less than K while the retrieval is greater than or equal to K. TN are occurrences where the observation is less than K and the retrieval is less than K. The selected test thresholds in this study were −22 dBz, −15 dBz, −10 dBz, −5 dBz, 0 dBz, 5 dBz, and 10 dBz.
To calculate the accuracy for the cloud mask determined by ensemble members in Section 3.3, the accuracy score against the CPR observation was calculated as follows:
A c c u r a c y = T P + T N T P + F N + F P + T N
This metric reflects the accuracy of the ensemble cloud mask for distinguishing cloudy and clear pixels.

3. Bidirectional Ensemble Binning Probability Fusion (BEBPF)

3.1. Errors Distribution of the CGAN Scene Retrievals

Since Leinonen et al.’s CGAN model retrievals are 2D vertical cross sections of cloud radar reflectivity (64 × 64 pixels), i.e., a scene used to reconstruct 3D cloud fields over MODIS granules, the simple way is to run the CGAN model by sliding the scenes throughout the MODIS granule and then combining the individual output scenes. However, such a method leads to significant discontinuity at the junction of the scenes. The discontinuity can be caused by the uncertainties of the CGAN model. Thus, to fuse the scenes seamlessly, one must consider the accuracy of the CGAN-retrieved scenes and the consistency between the neighboring scenes, especially at their lateral boundary zones. One way to cope with the problem is to use sliding windows to generate overlapping scenes and then take an average. However, this causes an artificial smoothing (weakening) of cloud core intensities.
We overcame the problem in three steps. Firstly, we evaluated the error properties of the scenes; secondly, based on the error properties of the scenes, we developed an ensemble-based probabilistic blending scheme to fuse the scenes along the CloudSat track, seamlessly; and lastly, we worked out a similar method to process the scenes in the direction normal to the CloudSat track.
The root mean squared error (RMSE) of the CGAN-retrieved scenes (64 × 64) was calculated pixel by pixel for a total of 7180 samples in the validation set. The average error was calculated over the 64 vertical layers, shown in Figure 2. There are significant horizontal variations in the RMSE of the CGAN-generated scenes. Larger errors existed in the lateral boundary zones and the interior errors also appeared to oscillate. This suggests that the CGAN generation was influenced by the boundaries because the pixels near the boundary had less information to be used to infer the labels and, thus, the retrieval error increased toward the boundary of the scenes. The internal oscillations were caused by uneven error distribution due to the diverse cloud types among samples. When calculating pixel-wise RMSE, pixels with fewer cloudy samples are more influenced by outliers, leading to minor internal oscillations.

3.2. Ensembles of the CGAN-Retrieved Scenes

Based on the characteristics of the CGAN-retrieved scene errors, an overlapping scene generation method (e.g., scenes with small spatial shifting) was designed to provide the uncertainty information of the CGAN retrievals. After several tests, we chose to retrieve CGAN scenes by sliding the scene generation by four-pixel intervals at a time. This resulted in 16 retrievals for each pixel, making a 16-member ensemble. To check the representation of the CGAN-retrieving uncertainties, Figure 3a displays the results of the 16 ensemble members for a mesoscale convective system and the CPR observations. It can be seen that although all retrievals appeared to be similar to the CPR observation in an overview, the locations and intensity of their convective cores differed significantly. This was more obvious by comparing the radar reflectivity distribution between the retrieval results and the CPR observations (Figure 3b). There were significant differences between the shift-retrieved individual scenes for all radar reflectivity intensities.

3.3. Ensemble Binning Probability Fusion (EBPF)

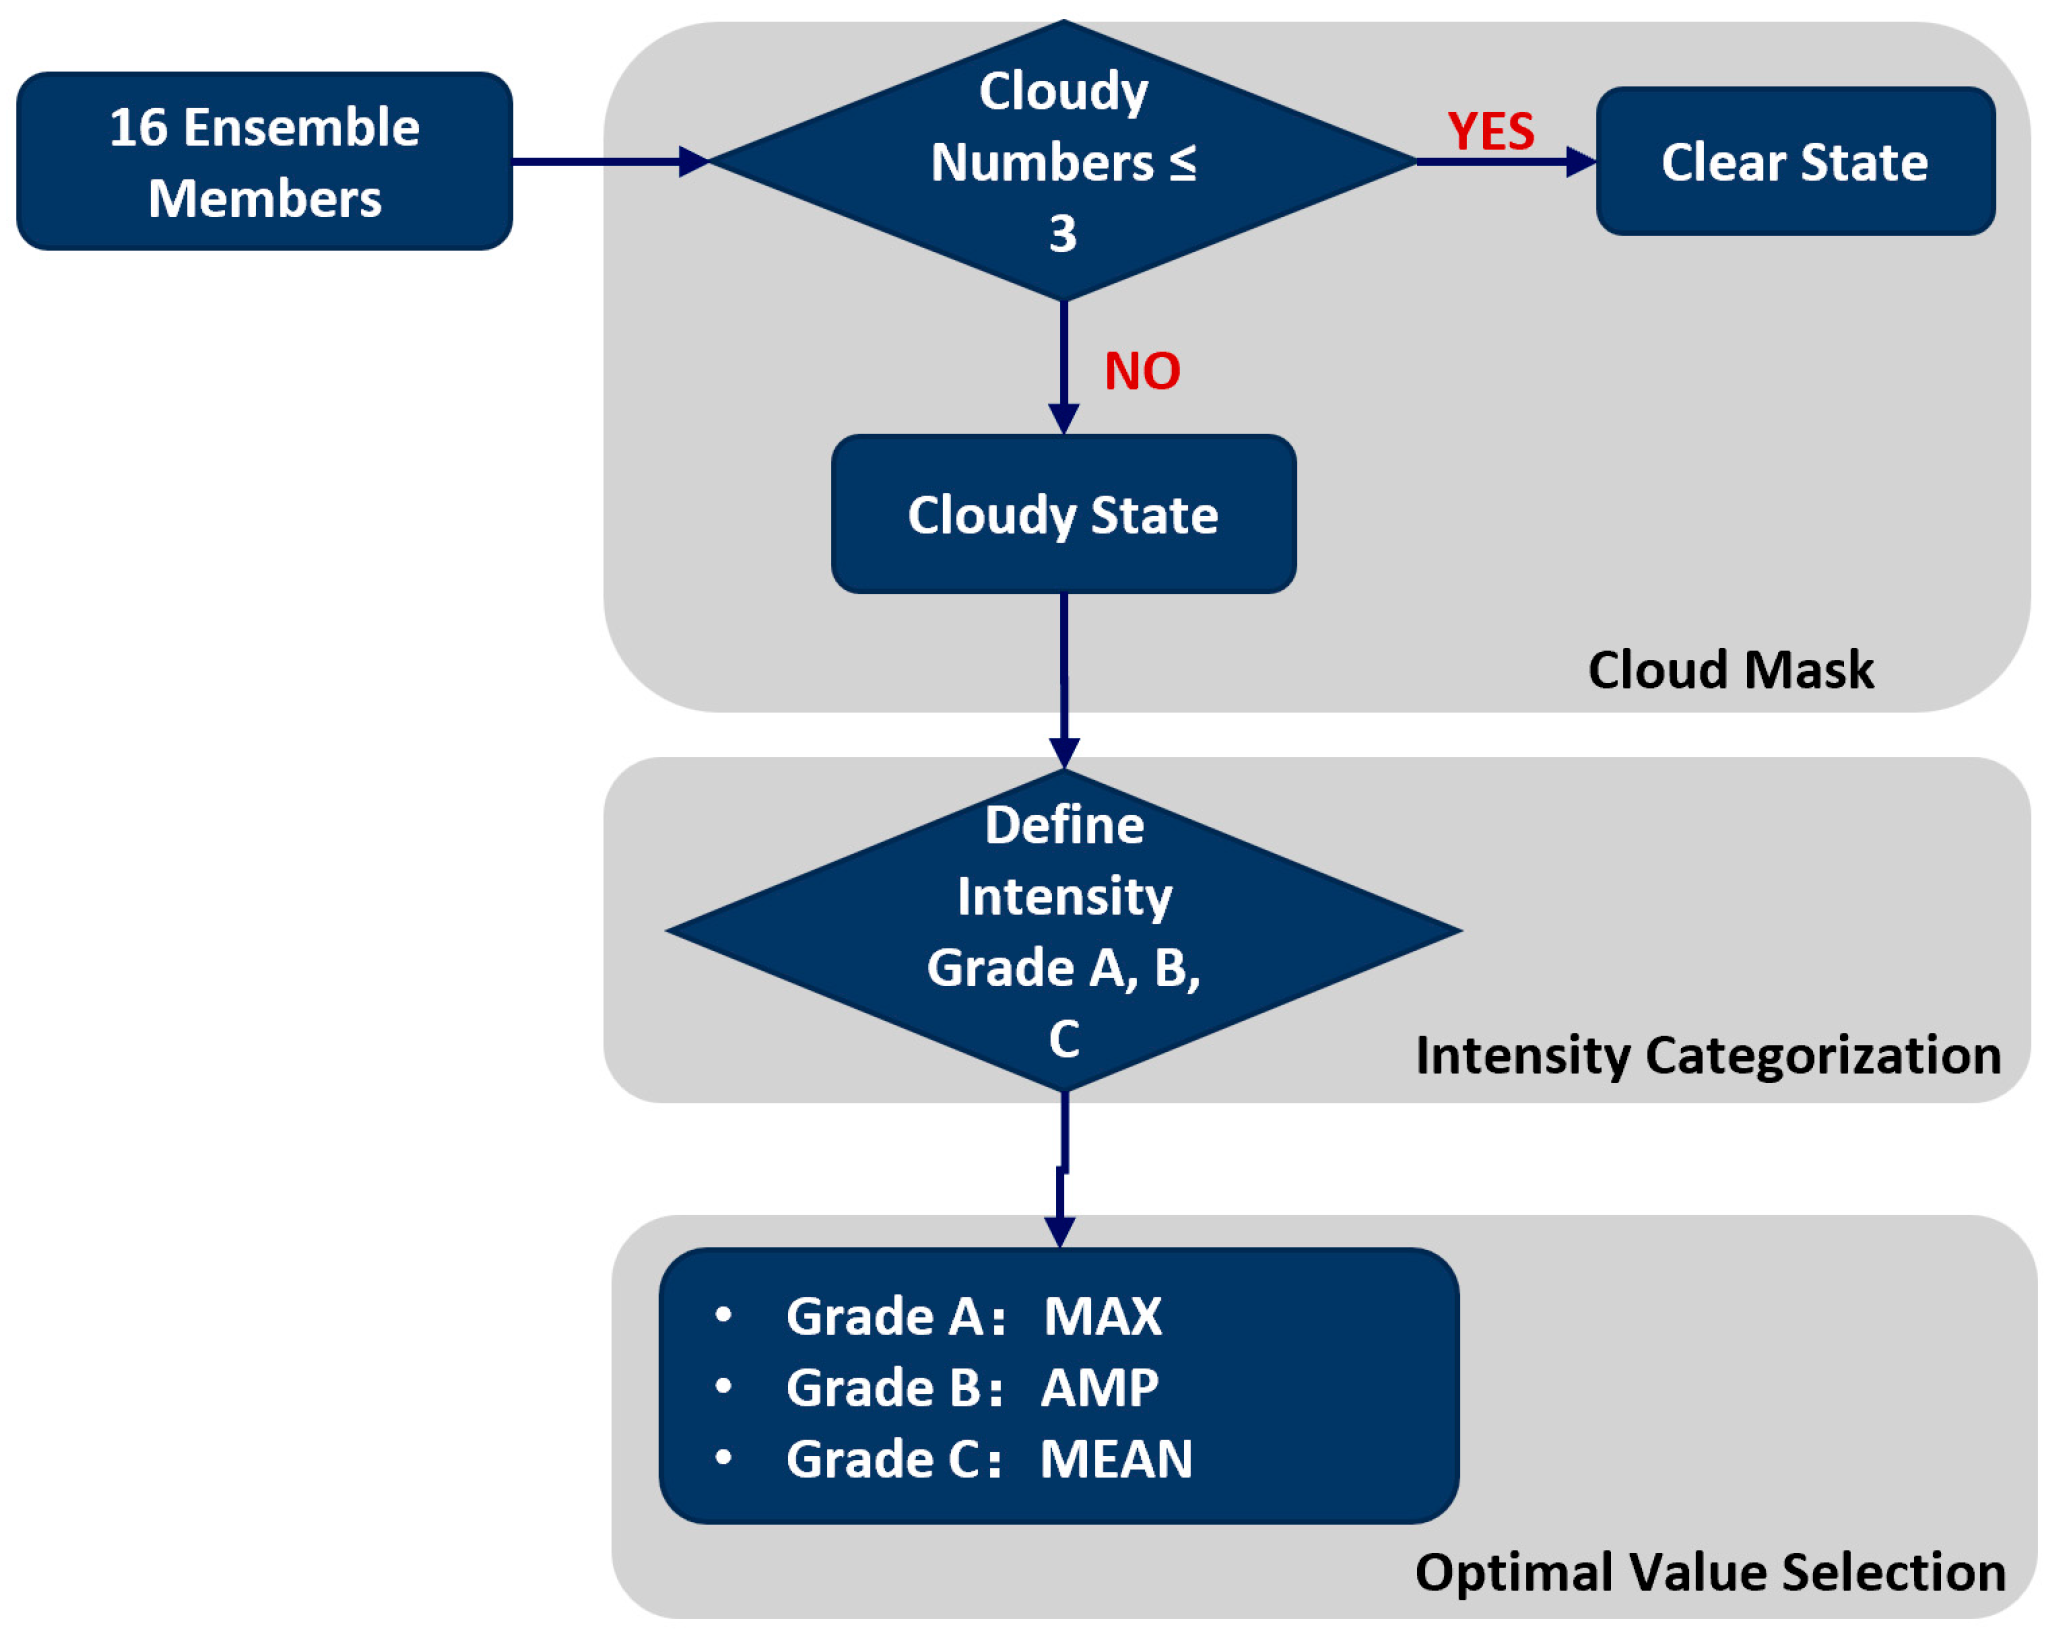
Based on the CGAN-retrieved ensemble, an ensemble binning probability fusion (EBPF) technique was designed to determine the blending weights of the CGAN retrievals (ensemble members) at each pixel according to the ensemble probability distributions. The EBPF technique comprised three algorithms (Figure 4): cloud masking, intensity scaling, and optimal value selection. The Group 1 weather cases in Table 1 were used to determine the weight parameters in these three algorithms. Note that the EBPF technique only blended the CGAN-retrieved 2D scenes along the horizontal direction of the scene ensemble and it did not retrieve 3D cloud fields.
(1)
Cloud Masking
As a first step, we classified whether the target pixel was cloudy or clear based on the ensemble members. Since the ensemble contained probabilistic information for cloudy or clear for each pixel, for a given pixel, the classification of cloudy or clear was determined by the probability distribution of the ensemble members. To do so, we defined the cloudy probability threshold in terms of the number of ensemble members to establish the cloud mask. To determine an optimal threshold, we ran the cloud masking with thresholds of 0–15 members for all six Group 1 cases in Table 1, respectively. Specifically, for example, given a pixel, a threshold of 2 meant that if more than 2 members of the ensemble said “cloudy”, we defined the pixel as cloudy. Then, the computed result based on each threshold was verified against the CPR observations. The accuracy scores (Equation (2)) computed for different thresholds over all six cases are shown in Figure 5a. Apparently, a threshold of 3 was optimal, yielding the highest accuracy of 94.85%. Figure 5b–d show the results for the case on 4 December 2017 (Table 1). Apparently, the ensemble cloud masks determined with threshold 3 were quite consistent with the CPR observations. Therefore, threshold 3 was selected.
(2)
Intensity Scaling and Processing
In considering that the accuracy of the CGAN-retrieved clouds changes with the radar reflectivity intensity, we divided the retrieved radar reflectivity into different grades and optimized the value for each grade. The CPR data and ensemble retrievals of six cases listed in Table 1 were used as a basis to determine the scaling and value optimization. To focus on severe convective clouds and typhoons, the radar reflectivity below −22 dBZ, predominantly clutter in clear areas, was set to “no cloud”. To define a proper intensity grade classification, for the CPR radar reflectivity factors ranging from −22 dBZ to 20 dBZ, we firstly divided them into 8 bins, at intervals of 5 dBZ (referred to as bins 1 to 8). By examining the performance of different ensemble blending schemes for all bins, we came up with three desired intensity grades. For each bin, the ensemble mode (MODE), which indicates the most values that appear in the ensemble members, the mean (MEAN), and the maximum reflectivity factor (MAX) for each of the 8 CPR radar reflectivity bins were calculated. In addition, we also calculated the mean of MODE and MEAN, abbreviated as “avg_max_prob (AMP)”. The verification results against the CPR observations are shown in Figure 6.
Figure 6 shows that only a small subset of ensemble members had high radar reflectivity at the rain cores due to the uncertainty in the CGAN retrievals. Apparently, the ensemble mean tended to dilute the intensity of the rain cores. Thus, for the high radar reflectivity (10 dBZ to 20 dBZ), named as intensity Grade A, the maximum value among the 16 ensemble members was retained. For the medium radar reflectivity (−5 dBZ to 10 dBZ), named Grade B, since the mode value often led to an underestimation for cloud clusters with severe convective systems, and the AMP result performed better, we selected the AMP result. Finally, for the low radar reflectivity (−22 dBZ to −5 dBZ), named Grade C, the mean value of the ensemble members was chosen. As a result, by defining the three intensity Grades: A, B, and C, for each pixel, we could choose the best ensemble intensity blending scheme according to its intensity grade to determine the final intensity at the pixel based on the 16 ensemble members.

3.4. Evaluation of EBPF

To demonstrate the advantages of EBPF, the reconstruction by EBPF was compared with direct splicing of the CGAN-retrieved scenes, ensemble mean, and ensemble maximum for a nimbostratus case. The ensemble maximum referred to the highest value among the ensemble members if one of the members had a value exceeding 5 dBZ, otherwise, the ensemble mean was taken.
The results are presented in Figure 7. Compared with the CPR observations (Figure 7(a1,b1)), direct splicing resulted in serious discontinuity (Figure 7(a2,b2)); ensemble mean smoothed out the intense core and led to an underestimation (Figure 7(a3,b3)), while ensemble maximum caused an overestimation of the cloud intensity (Figure 7(a4,b4)). EBPF (Figure 7(a5,b5)) produced the best result. It preserved the mid- to high reflectivity (Grade A and B) which was more consistent with the CPR observations.
The TS scores of the EBPF retrievals over all six cases in Group 1 (Table 1) are given in Table 3. For comparison, the TS scores of the four experiments were computed against the CPR observation for different thresholds. In general, EBPF obtained the highest TS scores across various thresholds, especially for the intense rain cores (a threshold of 10 dBZ). It indicated that EBPF not only ensured good coverage in the low reflectivity region but also retained the high reflectivity cores.

3.5. Bidirectional EBPF 3D Cloud Retrieving (BEBPF)

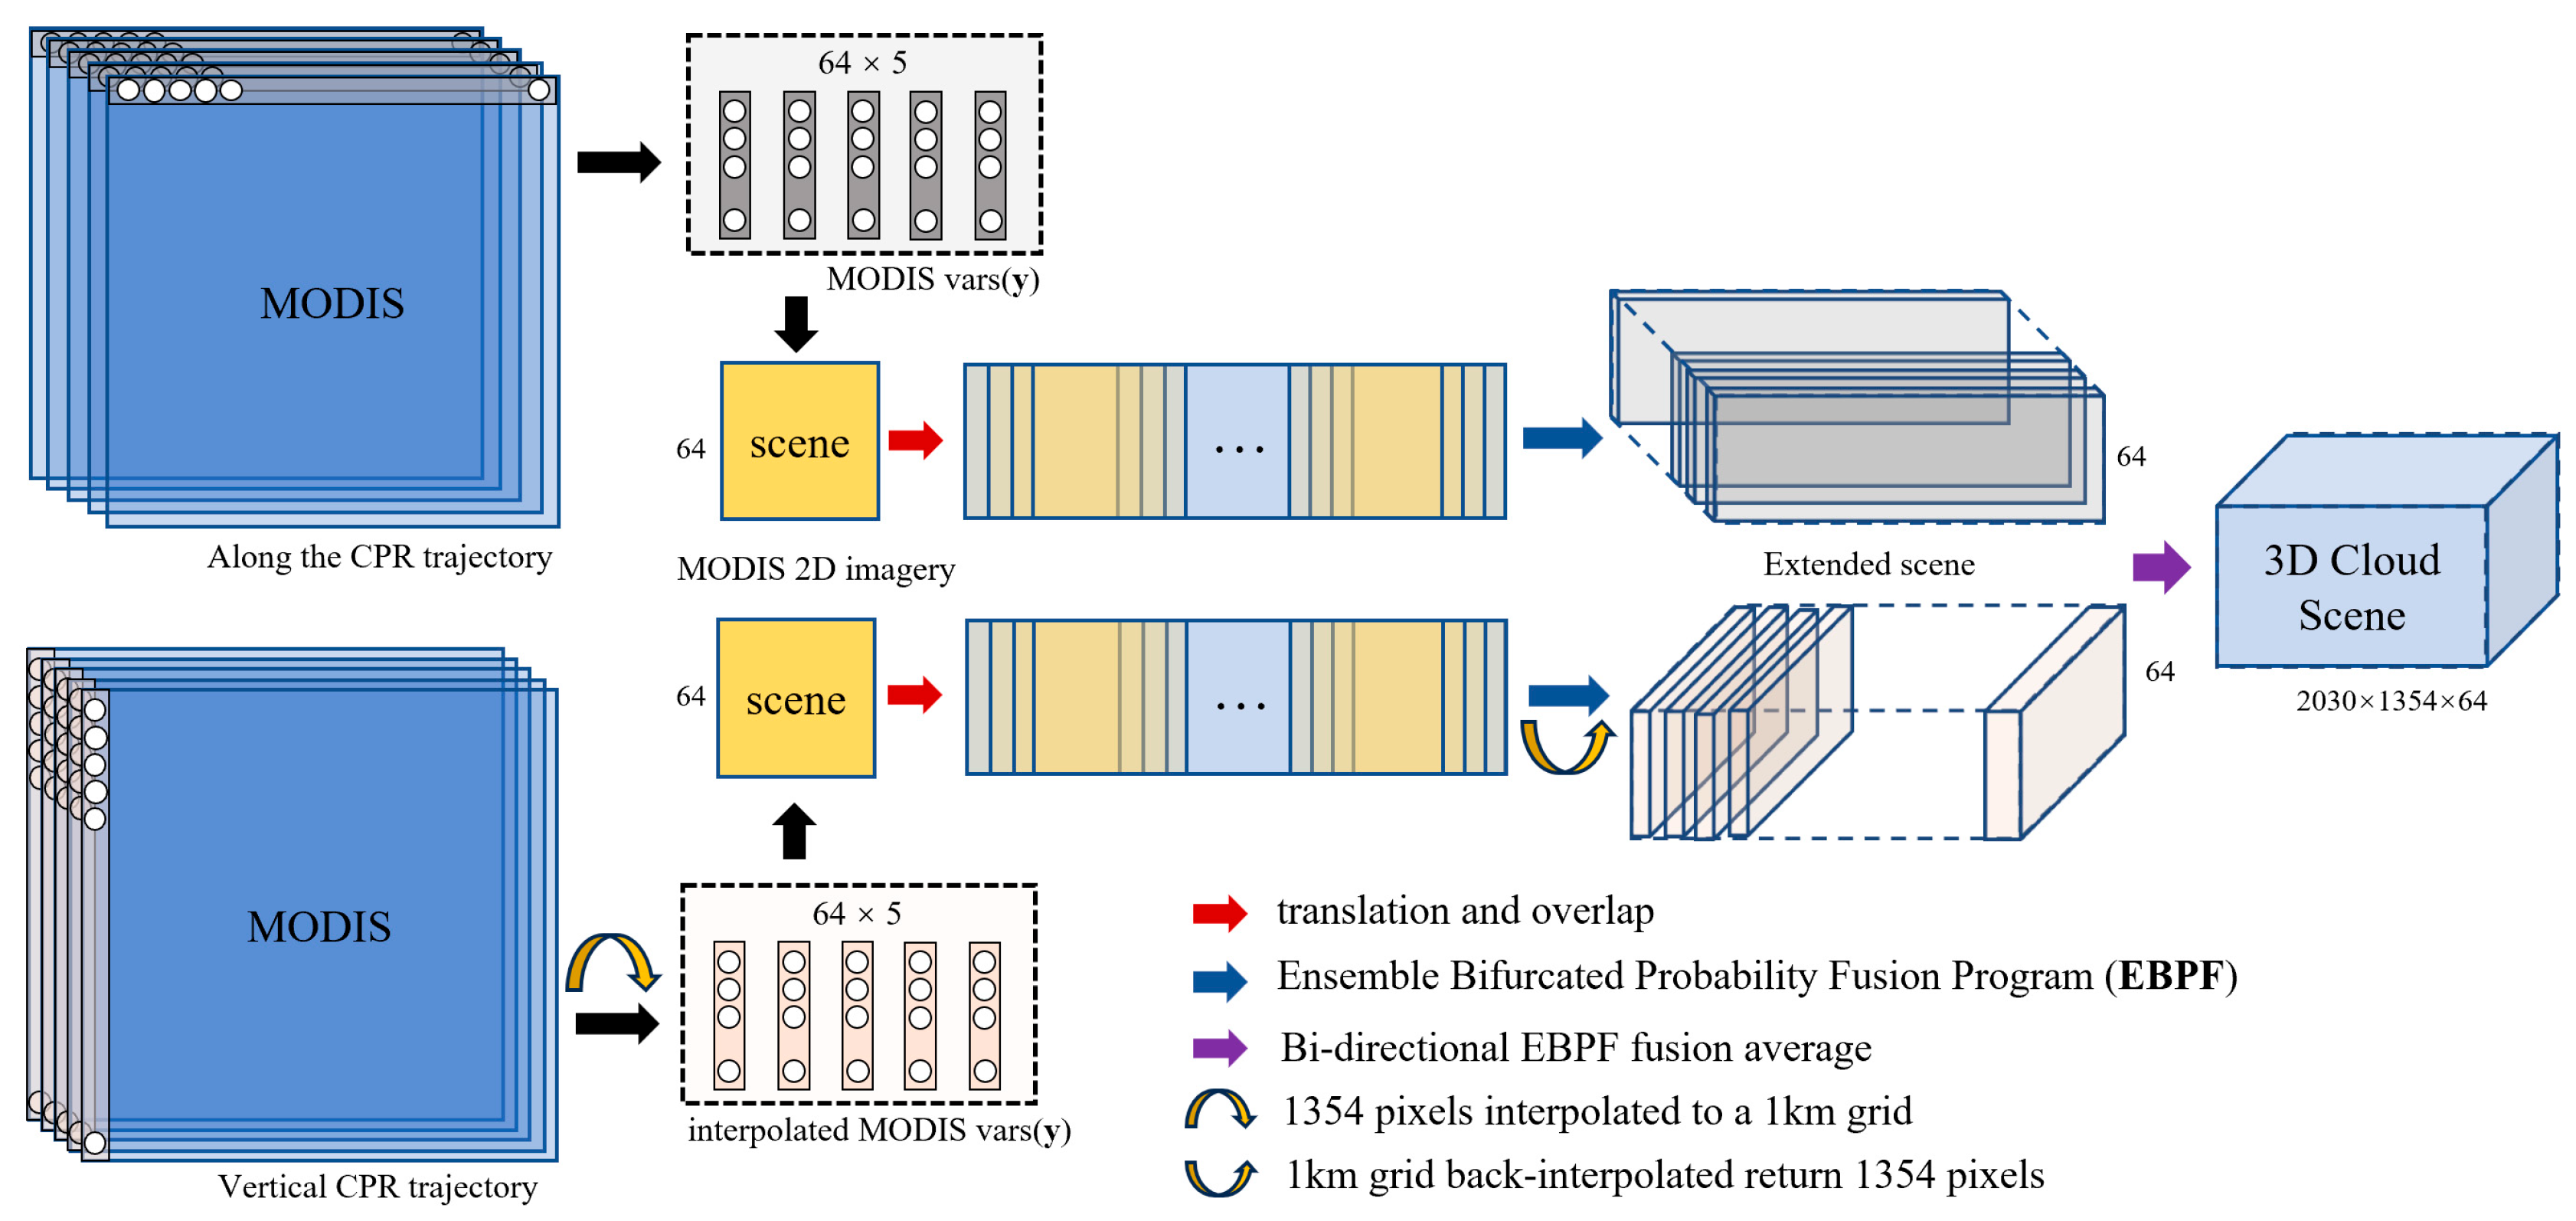
While EBPF extends Leinonen et al. [20] CGAN cloud scene retrievals along the CPR track direction with continuous and improved cloud vertical profiles, we still had to consider whether these cloud vertical cross sections could be directly spliced in the normal direction of the CPR trajectory. Three algorithms were examined: (a) simply splicing the Leinonen et al. [20] CGAN scenes retrieved in the direction normal to the CPR track (direct splicing, Figure 8a), (b) performing EBPF in the direction, and (c) combining the EBPF results in both directions, i.e., bidirectional EBPF (CGAN-BEBPF).
The results of a case study using the above three methods are shown in Figure 8c–e, and compared with the CPR observation (real, Figure 8b). Direct splicing produced evident discontinuity (Figure 8c), EBPF generated better results (Figure 8d), and CGAN-BEBPF brought about further improvements (Figure 8e). Therefore, CGAN-BEBPF was selected for generating MODIS 3D cloud fields.
Figure 9 presents the flowchart for constructing a 3D cloud field with CGAN-BEBPF for a MODIS granule. Firstly, EBPF was applied along the CPR trajectory direction. Next, we utilized EBPF in the direction normal to the CPR trajectory. It is noteworthy that during this progress, we performed linear interpolation as well as inverse interpolation computation on MODIS data corresponding to this observation direction (see Figure 9 for details). Finally, the results of these two steps were averaged to generate the final 3D cloud field.

4. Case Studies

To demonstrate the capability of CGAN-BEBFP, the 3D cloud fields for Typhoon Chaba and a complex convective system that occurred in the coastal regions of the South China Sea were retrieved and the results compared with the on-shore ground-based radar observations. The descriptions of these two cases are given in Table 1. Ground-based radar data were obtained from the SWAN radar mosaic data provided by the National Meteorological Center (NMC) of the China Meteorological Administration. The effective particle radius data from MODIS were plotted for comparison.

4.1. Typhoon Chaba

Typhoon Chaba was observed by MODIS at 02:50 UTC on 2 July 2022. Figure 10 presents the 3D cloud radar reflectivity retrieved with CGAN-BEBFP and a comparison with the MODIS effective particle radius and the SWAN mosaic of reflectivity. Although the MODIS effective particle radius did not correspond directly to the radar reflectivity, we referred to the spatial extent and rainband structures from it. As shown in the figure, the cloud and rainband distribution of the CGAN-BEBFP-retrieved 3D reflectivity (Figure 10b) and MODIS effective particle radius (Figure 10a) were quite consistent, indicating an overall good capability of CGAN-BEBFP. Figure 10b,c show that CGAN-BEBPF retrieved the weak-intensity cloud areas that were missed by SWAN because CPR (W-band) is more sensitive to small cloud droplets than ground-based radars (S-band). To verify the detailed structures of the typhoon rainbands, we masked the retrieved 3D cloud fields with ground-based radar reflectivity measurements and the results are shown in Figure 10d. In general, the rainband structures of the 3D retrieval well agreed with the ground-based radar observations. The 3D cloud retrievals captured the typhoon eyewall (“A” labeled in Figure 10d) and spiral rainbands (“B”, “C”, and “D”) precisely.
To verify the 3D cloud retrieval, the cross sections of the 3D cloud fields at heights of 1500 m, 6000 m, 9000 m, and 14,000 m were compared with ground-based radar observations at the same heights (Figure 11). Several important points can be drawn. (a) In a deep middle layer (Figure 11b,c,f,g), the CGAN-BEBPF-retrieved cloud fields were principally consistent with the ground-based radar measurements. The retrieval evidently broadened the ground radar rainbands observed by the ground-based radars due to its ability to retrieve the weak cloud regions. (b) In the upper layer (Figure 11d,h), CGAN-BEBPF recovered the important cloud structures of ice crystals and snow particles that were partly or completely missed by the ground-based radars. (c) CGAN-BEBPF retrieved the eyewall and rainbands observed by the ground radars, as well as the weak-intensity cloud boundaries around these rainbands (Figure 11a), but it significantly underestimated the intensity of the rainband core. This was related to the intrinsic shortcoming of the CloudSat CPR (W-band), which cannot properly detect lower-level strong precipitation cores due to severe signal attenuation by a deep layer of intense cloud particles. We can see that the rainbands retrieved by CGAN-BEBPF featured with hollow weak echo zones in the rain core. Three of them are labeled in Figure 11a as “A”, “B”, and “C”.

4.2. A Multi-Cell Convective System

Figure 12 shows the CGAN-BEBPF 3D cloud retrieval and the ground radar observations of an intense convective cloud cluster associated with a tropical storm that occurred in the South China Sea at 06:00 UTC on 24 August 2022. The MODIS effective particle radius is also presented for comparison (Figure 12a). Comparing the CGAN-BEBPF-retrieved 3D cloud distribution with the spatial coverage of the MODIS effective particle radius, we found that they were quite consistent (Figure 12b). CGAN-BEBPF successfully recovered the gravity wave rainbands near the coast (labeled as “B”) and the major oceanic cloud mass (labeled as “C”) that was beyond the detection range of the ground-based radar observations (Figure 12c). It is worth pointing out that, although the CGAN was trained with the data over the oceans, CGAN-BEBPF retrieved accurately the lines of strong cellular convection over land (labeled in “A”) in terms of both convection locations and intensity. This suggests that the model presents some capability for retrieving 3D cloud fields over land.

5. Conclusions

This work extended the CGAN-based MODIS cloud retrieval work of Leinonen et al. [20] to generate seamless 3D cloud radar reflectivity for the whole MODIS granule. A bidirectional ensemble binning probability fusion (BEBPF) was proposed to automate the 3D cloud radar reflectivity generation based on the CGAN model. CGAN-BEBPF enhanced the accuracy of the original CGAN retrievals and enabled a seamless fusion of the 64 × 64 (75 km horizontal × 15 km vertical) cloud vertical profiles (scenes) to generate 3D cloud fields for the MODIS granules. CGAN-BEBPF was applied to retrieve the 3D cloud structure of a typhoon and a multi-cell convective system, and the results were compared with ground-based radar observations. The results demonstrate that CGAN-BEBPF retrieved 3D clouds and rainbands of typhoons and severe convection with remarkable accuracy and reliability. The main conclusions are summarized below.
(1)
Statistical verification of the 7180 2D cloud scenes (vertical cross sections of cloud radar reflectivity) generated by the CGAN model of Leinonen et al. [20] exhibited discontinuity in neighboring scenes, internal uncertainties, and an increase in error towards lateral boundaries. Running the model for the overlapping scenes, but with a small shift in the grids, changed the retrieval results significantly.
(2)
A bidirectional ensemble binning probability fusion (BEBPF) technique was introduced to overcome the issues of Leinonen et al. CGAN model and generate seamless 3D cloud fields for the MODIS granules, termed CGAN-BEBPF. CGAN-BEBPF optimized the Leinonen et al. [20] CGAN model retrieval (scenes) accuracy and realized seamless fusion of the scene by generating overlapped scenes and pixel-wise ensembles and making use of the ensemble probability information. CGAN-BEBPF had three components: cloud masking, intensity scaling, and optimal value selection. CGAN-BEBPF provided superior coverage of the low reflectivity areas and preserved high reflectivity in the cloud cores, significantly outperforming the direct splicing or simple ensemble mean methods.
(3)
CGAN-BEBPF was applied to retrieve the 3D cloud structure of typhoon Chaba and a multi-cell convective system. A comparison of the retrieved CGAN-BEBPF 3D cloud fields with the ground-based radar observations showed that CGAN-BEBPF was remarkably capable of retrieving the structure and locations of rainbands and convective cells of typhoon and severe convection, as well as the weak ice and snow clouds in the upper layer of deep convective systems, which were mostly missed by ground-based radars. Furthermore, CGAN-BEBPF retrieved weak clouds around rainbands, producing broader 3D rainbands than those observed by ground-based radars.
(4)
Due to the signal attenuation effect of the CloudSat CPR (W-band), CGAN-BEBPF underestimated the radar reflectivity in the lowest 2–3 km precipitation layer of deep convective cores and had difficulty in resolving the sharp small-scale core structures.
Overall, CGAN-BEBPF exhibited outstanding performance in generating high-resolution (~1 km horizontally and 240 m vertically) 3D cloud fields at ~1 km over the 2330 km-wide MODIS granules over the oceans, and thus significantly filled some gaps in the modern cloud measurements. The CGAN-BEBPF package has been run in near-real time at Nanjing University of Information Science and Technology to generate 3D cloud fields in the South China Sea and Western Pacific coastal regions and provides valuable cloud information for forecasting typhoons and severe convection. Since the polar-orbiting MODIS only observes a region twice a day, it cannot track the cloud field evolution. We are currently working to extend this capability to retrieve 3D cloud fields using the Advanced Himawari Imager (AHI) on board Himawari-8/9 and the Advanced Geosynchronous Radiation Imager (AGRI) on board FY-4 geostationary satellite observations. In addition, we are also exploring using ground-based radar reflectivity observations to construct labels for the deep learning model, which will potentially provide more accurate 3D precipitation reflectivity retrievals that can be more effectively assimilated into numerical weather prediction models to improve typhoon and severe convection prediction.

Author Contributions

Conceptualization, Y.L.; methodology, Y.Q. and F.W.; software, Y.Q. and F.W.; validation, Y.L., H.F. and Y.Z.; formal analysis, Y.Q. and H.F.; investigation, Y.Q. and Y.L.; resources, Y.L. and F.W.; data curation, F.W. and Y.Z.; writing—original draft preparation, Y.Q.; writing—review and editing, Y.L., H.F. and J.D.; visualization, Y.Q.; supervision, Y.L.; project administration, Y.L.; funding acquisition, Y.L. and J.D. All authors have read and agreed to the published version of the manuscript.

Funding

This research was funded by the NSFC-CMA Joint Research (Grant #U2342222) and the National Key R&D Program of China (Grant 2023YFC3007600).

Data Availability Statement

The original CloudSat data products 2B-GEOPROF and MOD06-AUX are available at the CloudSat Data Processing Center, http://www.cloudsat.cira.colostate.edu/ (accessed on 18 March 2024). A Python/Keras implementation code that can be used to reproduce the model is available at https://github.com/jleinonen/cloudsat-gan (accessed on 18 March 2024). The Python version we use is 3.8.8 and the TensorFlow version is 2.4.1.

Conflicts of Interest

The authors declare no conflict of interest.

References

  1. Li, Z.; Barker, H.W.; Moreau, L. The variable effect of clouds on atmospheric absorption of solar radiation. Nature 1995, 376, 486–490. [Google Scholar] [CrossRef]
  2. Stephens, G.L. Cloud feedbacks in the climate system: A critical review. J. Clim. 2005, 18, 237–273. [Google Scholar] [CrossRef]
  3. Randall, D.; Khairoutdinov, M.; Arakawa, A.; Grabowski, W. Breaking the cloud parameterization deadlock. Bull. Am. Meteorol. Soc. 2003, 84, 1547–1564. [Google Scholar] [CrossRef]
  4. Stephens, G.L.; Vane, D.G.; Boain, R.J.; Mace, G.G.; Sassen, K.; Wang, Z.; Illingworth, A.J.; O’connor, E.J.; Rossow, W.B.; Durden, S.L.; et al. The CloudSat mission and the A-Train: A new dimension of space-based observations of clouds and precipitation. Bull. Am. Meteorol. Soc. 2002, 83, 1771–1790. [Google Scholar] [CrossRef]
  5. Iguchi, T.; Seto, S.; Meneghini, R.; Yoshida, N.; Awaka, J.; Le, M.; Chandrasekar, V.; Kubota, T. GPM/DPR Level-2 Algorithm Theoretical Basis Document; NASA Goddard Space Flight Center: Greenbelt, MD, USA, 2010. [Google Scholar]
  6. Liao, L.; Meneghini, R. GPM DPR retrievals: Algorithm, evaluation, and validation. Remote Sens. 2022, 14, 843. [Google Scholar] [CrossRef]
  7. Bali, M. GSICS Quarterly Vol. 17 No. 3. 2023. Available online: https://repository.library.noaa.gov/view/noaa/56327 (accessed on 24 April 2024).
  8. Parkinson, C.L. Aqua: An Earth-observing satellite mission to examine water and other climate variables. IEEE Trans. Geosci. Remote Sens. 2003, 41, 173–183. [Google Scholar] [CrossRef]
  9. Platnick, S.; King, M.D.; Ackerman, S.A.; Menzel, W.P.; Baum, B.A.; Riédi, J.C.; Frey, R.A. The MODIS cloud products: Algorithms and examples from Terra. IEEE Trans. Geosci. Remote Sens. 2003, 41, 459–473. [Google Scholar] [CrossRef]
  10. Barker, H.W.; Jerg, M.P.; Wehr, T.; Kato, S.; Donovan, D.P.; Hogan, R.J. A 3D cloud-construction algorithm for the EarthCARE satellite mission. Q. J. R. Meteorol. Soc. 2011, 137, 1042–1058. [Google Scholar] [CrossRef]
  11. Miller, S.D.; Forsythe, J.M.; Partain, P.T.; Haynes, J.M.; Bankert, R.L.; Sengupta, M.; Mitrescu, C.; Hawkins, J.D.; Haar, T.H.V. Estimating three-dimensional cloud structure via statistically blended satellite observations. J. Appl. Meteorol. Climatol. 2014, 53, 437–455. [Google Scholar] [CrossRef]
  12. Noh, Y.J.; Haynes, J.M.; Miller, S.D.; Seaman, C.J.; Heidinger, A.K.; Weinrich, J.; Kulie, M.S.; Niznik, M.; Daub, B.J. A Framework for Satellite-Based 3D Cloud Data: An Overview of the VIIRS Cloud Base Height Retrieval and User Engagement for Aviation Applications. Remote Sens. 2022, 14, 5524. [Google Scholar] [CrossRef]
  13. Dubovik, O.; Schuster, G.L.; Xu, F.; Hu, Y.; Bösch, H.; Landgraf, J.; Li, Z. Grand challenges in satellite remote sensing. Front. Remote Sens. 2021, 2, 619818. [Google Scholar] [CrossRef]
  14. Jeppesen, J.H.; Jacobsen, R.H.; Inceoglu, F.; Toftegaard, T.S. A cloud detection algorithm for satellite imagery based on deep learning. Remote Sens. Environ. 2019, 229, 247–259. [Google Scholar] [CrossRef]
  15. Lee, Y.; Kummerow, C.D.; Ebert-Uphoff, I. Applying machine learning methods to detect convection using Geostationary Operational Environmental Satellite-16 (GOES-16) advanced baseline imager (ABI) data. Atmos. Meas. Tech. 2021, 14, 2699–2716. [Google Scholar] [CrossRef]
  16. Pritt, M.; Chern, G. Satellite image classification with deep learning. In Proceedings of the 2017 IEEE Applied Imagery Pattern Recognition Workshop (AIPR), Washington, DC, USA, 10–12 October 2017; IEEE: Piscataway, NJ, USA, 2017; pp. 1–7. [Google Scholar]
  17. Chen, S.; Wang, H.; Xu, F.; Jin, Y.-Q. Target classification using the deep convolutional networks for SAR images. IEEE Trans. Geosci. Remote Sens. 2016, 54, 4806–4817. [Google Scholar] [CrossRef]
  18. Goodfellow, I.; Pouget-Abadie, J.; Mirza, M.; Xu, B.; Warde-Farley, D.; Ozair, S.; Courville, A.; Bengio, Y. Generative adversarial nets. arXiv 2014, arXiv:1406.2661. [Google Scholar]
  19. Mirza, M.; Osindero, S. Conditional generative adversarial nets. arXiv 2014, arXiv:1411.1784. [Google Scholar]
  20. Leinonen, J.; Guillaume, A.; Yuan, T. Reconstruction of cloud vertical structure with a generative adversarial network. Geophys. Res. Lett. 2019, 46, 7035–7044. [Google Scholar] [CrossRef]
  21. Wang, F.; Liu, Y.; Zhou, Y.; Sun, R.; Duan, J.; Li, Y.; Ding, Q.; Wang, H. Retrieving Vertical Cloud Radar Reflectivity from MODIS Cloud Products with CGAN: An Evaluation for Different Cloud Types and Latitudes. Remote Sens. 2023, 15, 816. [Google Scholar] [CrossRef]
  22. Remer, L.A.; Tanré, D.; Kaufman, Y.J.; Levy, R.; Mattoo, S. Algorithm for remote sensing of tropospheric aerosol from MODIS: Collection 005. Natl. Aeronaut. Space Adm. 2006, 1490. Available online: https://modis-images.gsfc.nasa.gov/_docs/MOD04:MYD04_ATBD_C005_rev1.pdf (accessed on 18 March 2024).
  23. Marchand, R.; Mace, G.G.; Ackerman, T.; Stephens, G. Hydrometeor detection using CloudSat—An Earth-orbiting 94-GHz cloud radar. J. Atmos. Ocean. Technol. 2008, 25, 519–533. [Google Scholar] [CrossRef]
  24. Stephens, G.L.; Vane, D.G.; Tanelli, S.; Im, E.; Durden, S.; Rokey, M.; Reinke, D.; Partain, P.; Mace, G.G.; Austin, R.; et al. CloudSat mission: Performance and early science after the first year of operation. J. Geophys. Res. Atmos. 2008, 113. [Google Scholar] [CrossRef]
  25. Barnes, W.L.; Xiong, X.; Salomonson, V.V. Status of terra MODIS and aqua MODIS. Adv. Space Res. 2003, 32, 2099–2106. [Google Scholar] [CrossRef]
  26. Kotarba, A.Z. Calibration of global MODIS cloud amount using CALIOP cloud profiles. Atmos. Meas. Tech. 2020, 13, 4995–5012. [Google Scholar] [CrossRef]
  27. Kang, L.; Marchand, R.; Smith, W. Evaluation of MODIS and Himawari-8 low clouds retrievals over the Southern Ocean with in situ measurements from the SOCRATES campaign. Earth Space Sci. 2021, 8, e2020EA001397. [Google Scholar] [CrossRef]
  28. Cronk, H.; Partain, P. Cloudsat mod06-aux auxiliary data process description and interface control document. Natl. Aeronaut. Space Adm. Earth Syst. Sci. Pathfind. Mission. 2018. Available online: https://www.cloudsat.cira.colostate.edu/cloudsat-static/info/dl/mod06-5km-aux/MOD06-AUX_PDICD.P1_R05.rev0_.pdf (accessed on 18 March 2024).
  29. Barnes, W.L.; Pagano, T.S.; Salomonson, V.V. Prelaunch characteristics of the moderate resolution imaging spectroradiometer (MODIS) on EOS-AM1. IEEE Trans. Geosci. Remote Sens. 1998, 36, 1088–1100. [Google Scholar] [CrossRef]
  30. Heidke, P. Calculation of the success and goodness of strong wind forecasts in the storm warning service. Geogr. Ann. Stockh. 1926, 8, 301–349. [Google Scholar]
  31. Doswell, C.A., III; Davies-Jones, R.; Keller, D.L. On Summary Measures of Skill in Rare Event Forecasting Based on Contingency Tables. Weather Forecast. 1990, 5, 576–585. [Google Scholar] [CrossRef]
  32. Gilbert, G.K. Finley’s Tornado predictions. Am. Meteorol. J. 1884, 1, 166. [Google Scholar]
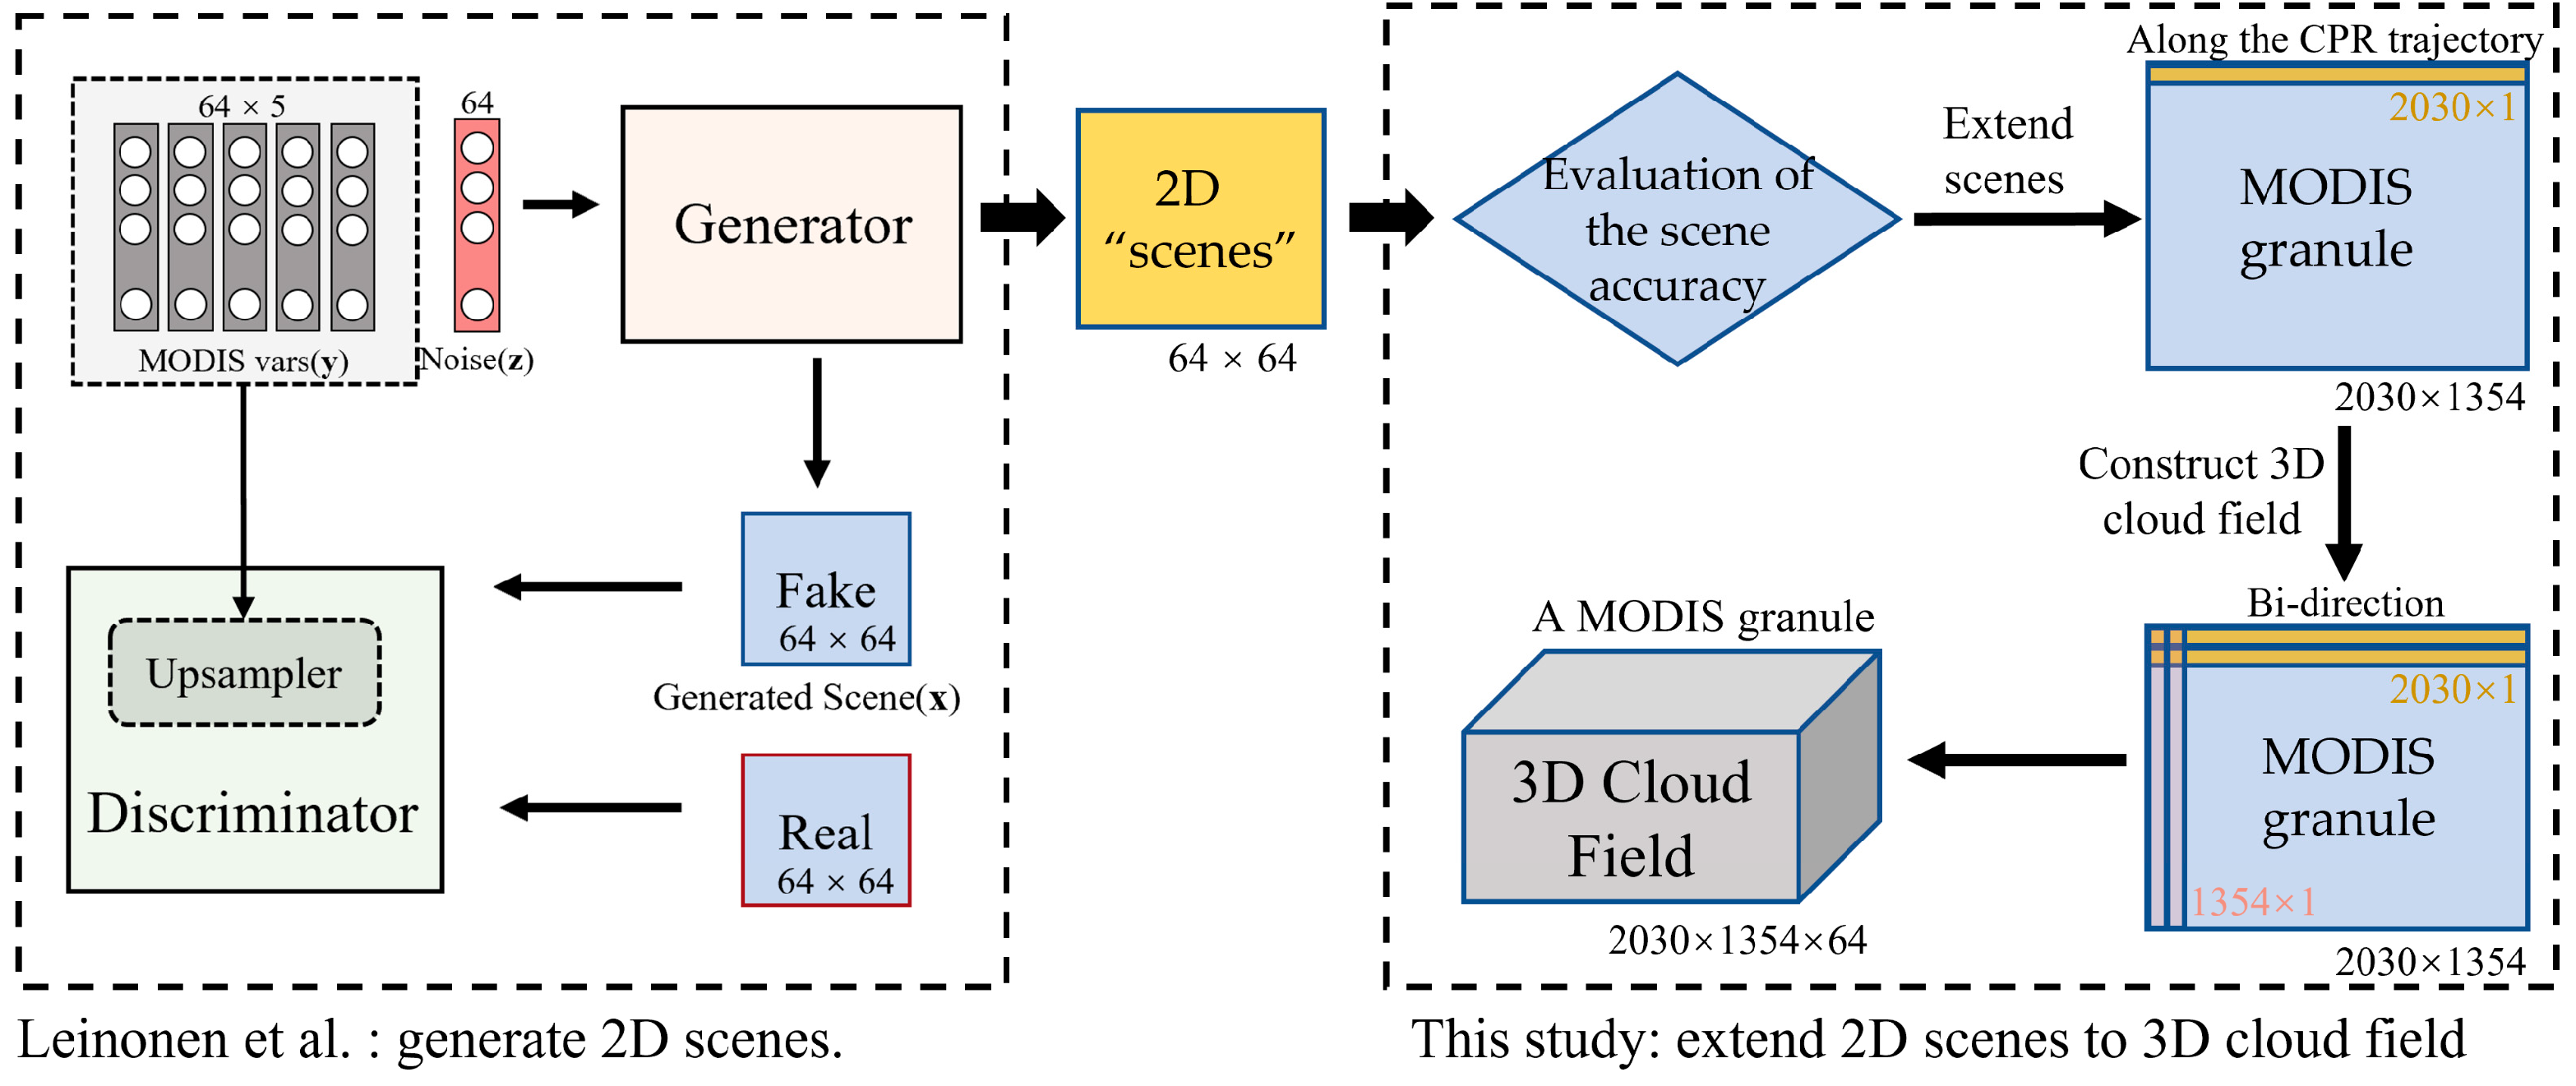
Figure 1. The work plan for constructing a 3D cloud field from a MODIS granule based on the CGAN model. The left part is the CGAN model by Leinonen et al. [20], which generates 2D scenes. The right part is the research carried out in this paper, where 2D scenes (64 × 64) were seamlessly fused to obtain 3D cloud fields for the MODIS granules (2030 × 1354) with 64 vertical levels. A MODIS granule refers to a 5 min observation result from MODIS.
Remotesensing 16 01561 g001
Figure 2. The distribution of the vertical average RMSE of the retrieved 2D cloud scenes for the 7180 test samples.
Remotesensing 16 01561 g002
Figure 3. A case of a strong convective system with a horizontal distance of about 200 km, valid at 15:45 UTC, 4 December 2017 (from Group 1 in Table 1). The segment from 27°32′37″S, 26°17′34″W to 24°39′37″S, 27°00′30″W. (a) The radar reflectivity factors of the CPR observation (real) and those for 16 ensemble members generated by shifting every 4 pixels. The radar reflectivity range is from −30 to 20 dBZ. (b) The radar reflectivity factor spectral distribution of the 16 GGAN-retrieved ensemble members (violet) and the CPR observations (blue). The 16 ensemble members, differing by 4 pixels each, are labeled as Gan1–16.
Remotesensing 16 01561 g003
Figure 4. The workflow of EBPF with the three algorithms, ensemble cloud masking, ensemble intensity scaling, and ensemble optimal (blending) value selection, in the EBPF technique.
Remotesensing 16 01561 g004
Figure 5. (a) The accuracy score for the ensemble cloud masking scheme with different probability thresholds over the six cases in Group 1 (Table 1). Results for the case at 15:45 UTC, 4 December 2017: (b) the cloud mask of the CPR observations; (c) the ensemble cloud mask obtained without a cloudy threshold; (d) the ensemble cloud mask with the cloudy probability (the number of members) threshold of 3.
Remotesensing 16 01561 g005
Figure 6. The violin plots of the ensemble-blending reflectivity with four methods: the reflectivity mode (MODE), the mean reflectivity (MEAN), and the maximum reflectivity (MAX) and avg_max_prob (AMP) result for 8 radar reflectivity bins (ah). The shaded area between the black dashed lines in (ah) represents the target grades. The percentage indicates the hit rate on the target CPR bin.
Remotesensing 16 01561 g006
Figure 7. (a) Cloud radar reflectivity of the CPR observations (a1) vs. the retrievals with direct splicing (a2), ensemble mean (a3), ensemble maximum (a4), and EBPF (a5). (b) Masks for the intensity Grade A (10 dBZ to 20 dBZ), B (−5 dBZ to 10 dBZ), and C (−22 dBZ to −5 dBZ) derived from the cloud radar reflectivity in (a1a5). (b1b5) are the masks segmented based on the intensities of (a1a5) respectively. The case is a nimbostratus intercepted at 23:10 UTC, 31 December 2014 (Table 1). The segment is from 46°56′35″N, 151°16′20″W to 52°41′39″N, 153°42′5″W.
Remotesensing 16 01561 g007
Figure 8. (a) Schematic diagram showing CGAN cloud retrieving in the directions along and normal to the CPR track. The red line in the figure indicates the CPR trajectory; (b) CPR observed cloud vertical profile (cross section); (c) splicing the CGAN scene retrievals in the direction normal to the CPR track; (d) splicing the EBPF retrievals in the direction normal to the CPR track, and (e) the CGAN-BEBPF retrieval. The case is a nimbostratus intercepted at 23:10 UTC, 31 December 2014 (Table 1). The segment is from 46°56′35″N, 151°16′20″W to 52°41′39″N, 153°42′5″W.
Remotesensing 16 01561 g008
Figure 9. Flowchart for constructing a 3D cloud field for a MODIS granule using CGAN-BEBPF. The upper part of the diagram illustrates the process of performing EBPF along the CPR observation trajectory direction. The lower part shows the process of performing EBPF in the normal direction of the CPR trajectory. During this progress, the 1354 pixels were firstly interpolated to a 1 km grid. Then the EBPF calculation was performed on these interpolated grids. Finaly, the results were interpolated back to the original MODIS pixel positions to be consistent with the standard MODIS products.
Remotesensing 16 01561 g009
Figure 10. The retrieved 3D cloud fields and the MODIS and ground-based radar observations of Typhoon Chaba (South China, 02:50 UTC on 2 July 2022). (a) The MODIS effective particles radius; (b) the composite radar reflectivity of the CGAN-BEBPF 3D cloud fields; (c) the composite radar reflectivity of the ground-based radar observation (SWAN); (d) the composite radar reflectivity of the CGAN-BEBPF 3D cloud fields masked with the cloud areas of the ground-based radar observations.
Remotesensing 16 01561 g010
Figure 11. (ah) Comparison of the retrieved MODIS 3D cloud fields with ground-based radar observations of Typhoon Chaba (South China, 02:50 UTC on 2 July 2022), at altitudes of 1500 m (a,e), 6000 m (b,f), 9000 m (c,g), and 14,000 m (d,h). BEBPF stands for the retrieved MODIS 3D cloud fields by CGAN-BEBPF and SWAN stands for ground-based radar observations.
Remotesensing 16 01561 g011
Figure 12. A multi-convective cell system (South China, 06:00 UTC on 24 August 2022). (a) The MODIS effective particles radius; (b) the composite radar reflectivity (mdbz) of the CGAN-BEBPF 3D cloud fields; (c) the composite radar reflectivity (mdbz) of the ground-based radar (SWAN).
Remotesensing 16 01561 g012
Table 1. Description of the weather cases in this study. They are divided into two groups. The first group had matched CPR observations, while the second had no matched CPR observations. All cases were based on UTC. The geographical coordinates given in the table are for the central point of the cases. (None of the cases in the table is in the supplementary dataset provided by Wang et al. [21]).
Group 1Group 2
23:10, 31 December 2014
Western Pacific
(44°17′48″N, 150°18′1″W)
14:10, 31 March 2014
Atlantic Ocean
(10°29′28″S, 5°34′52″W)
02:50, 2 July 2022
Typhoon Chaba
(19°42′56″N, 114°21′21″E)
23:45, 31 March 2015
Western Pacific
(35°26′5″N, 156°40′55″W)
16:40, 20 October 2016
Atlantic Ocean
(43°56′46″S, 37°00′43″W)
06:00, 24 August 2022
A complex convective system
(18°44′28″N, 111°34′23″E)
04:00, 30 July 2016
Eastern Pacific
(23°00′47″N, 141°33′43″E)
15:45, 4 December 2017
Atlantic Ocean
(21°03′40″S, 27°52′6″W)
Table 2. The binary confusion matrix.
Predictions (Positive)Predictions (Negative)
Observation (positive)True positive (TP)False negative (FN)
Observation (negative)False positive (FP)True negative (TN)
Table 3. The average HSS scores for the six cases in Group 1 (Table 1) for thresholds of −22 dBZ, −15 dBZ, −10 dBZ, −5 dBZ, 0 dBZ, 5 dBZ, and 10 dBZ.
−22 dBZ−15 dBZ−10 dBZ−5 dBZ0 dBZ5 dBZ10 dBZ
Direct splicing0.690.710.720.690.640.550.40
Ensemble mean0.670.730.730.700.660.570.31
Ensemble maximum0.670.730.730.710.660.570.48
EBPF0.710.740.750.710.660.590.53
Disclaimer/Publisher’s Note: The statements, opinions and data contained in all publications are solely those of the individual author(s) and contributor(s) and not of MDPI and/or the editor(s). MDPI and/or the editor(s) disclaim responsibility for any injury to people or property resulting from any ideas, methods, instructions or products referred to in the content.