Article

Spatiotemporal Analysis of Drought Characteristics and Their Impact on Vegetation and Crop Production in Rwanda

by
Schadrack Niyonsenga
1,2,3,4,
Anwar Eziz
1,5,
Alishir Kurban
1,2,4,5,6,7,*,
Xiuliang Yuan
1,2,4,5,6,
Edovia Dufatanye Umwali
1,2,3,4,
Hossein Azadi
1,5,7,
Egide Hakorimana
1,2,3,4,
Adeline Umugwaneza
1,2,3,4,
Gift Donu Fidelis
1,2,5,
Justin Nsanzabaganwa
1,2,3,4 and
Vincent Nzabarinda
1,2
1
State Key Laboratory of Desert and Oasis Ecology, Key Laboratory of Ecological Safety and Sustainable Development in Arid Lands, Xinjiang Institute of Ecology and Geography, Chinese Academy of Sciences, 818 South Beijing Road, Urumqi 830011, China
2
University of Chinese Academy of Sciences, Beijing 100049, China
3
Faculty of Environmental Studies, University of Lay Adventist of Kigali (UNILAK), Kigali P.O. Box 6392, Rwanda
4
Joint Research Center for Natural Resources and Environment in East Africa, Kigali P.O. Box 6392, Rwanda
5
Sino-Belgian Joint Laboratory for Geo-Information, Urumqi 830011, China
6
Key Laboratory of GIS & RS Application of Xinjiang Uyghur Autonomous Region, Urumqi 830011, China
7
Sino-Belgian Joint Laboratory for Geo-Information, B-9000 Ghent, Belgium
*
Author to whom correspondence should be addressed.
Remote Sens. 2024, 16(8), 1455; https://doi.org/10.3390/rs16081455
Submission received: 8 March 2024 / Revised: 4 April 2024 / Accepted: 15 April 2024 / Published: 20 April 2024
(This article belongs to the Special Issue Satellite-Based Climate Change and Sustainability Studies)

Abstract

:
In recent years, Rwanda, especially its Eastern Province, has been contending with water shortages, primarily due to prolonged dry spells and restricted water sources. This situation poses a substantial threat to the country’s agriculture-based economy and food security. The impact may escalate with climate change, exacerbating the frequency and severity of droughts. However, there is a lack of comprehensive spatiotemporal analysis of meteorological and agricultural droughts, which is an urgent need for a nationwide assessment of the drought’s impact on vegetation and agriculture. Therefore, the study aimed to identify meteorological and agricultural droughts by employing the Standardized Precipitation Evapotranspiration Index (SPEI) and the Vegetation Health Index (VHI). VHI comprises the Vegetation Condition Index (VCI) and the Temperature Condition Index (TCI), both derived from the Normalized Difference Vegetation Index (NDVI) and Land Surface Temperature (LST). This study analyzed data from 31 meteorological stations spanning from 1983 to 2020, as well as remote sensing indices from 2001 to 2020, to assess the spatiotemporal patterns, characteristics, and adverse impact of droughts on vegetation and agriculture. The results showed that the years 2003, 2004, 2005, 2006, 2013, 2014, 2015, 2016, and 2017 were the most prolonged and severe for both meteorological and agricultural droughts, especially in the Southern Province and Eastern Province. These extremely dry conditions led to a decline in both vegetation and crop production in the country. It is recommended that policymakers engage in proactive drought mitigation activities, address climate change, and enforce water resource management policies in Rwanda. These actions are crucial to decreasing the risk of drought and its negative impact on both vegetation and crop production in Rwanda.

Graphical Abstract

1. Introduction

Drought is more than a temporary climatic anomaly; it is a complex and multifaceted phenomenon that impacts various human and natural systems [1]. It is characterized by a prolonged and severe lack of precipitation that leads to a water shortage for some activity or group [2]. Drought can have devastating consequences for health, agriculture, economies, energy, and the environment, affecting millions worldwide every year [3]. The United Nations (UN) recognizes drought as a major factor in water scarcity, affecting 40% of the global population and posing a severe threat to human security and well-being. Projections indicate that by 2030, as many as 700 million people could face displacement due to water scarcity resulting from drought [4]. Climate change is intensifying the frequency, intensity, and duration of droughts in many regions of the world [5]. The hydrological cycle is altered as the global temperature rises, resulting in more extreme precipitation patterns [6]. In dry regions, higher temperatures increase evaporation and reduce soil moisture, creating a positive feedback loop that intensifies drought conditions [7].
Moreover, global studies highlight the enduring presence of drought, significantly affecting human health, wealth [7], agriculture [8], and the ecosystem [9]. This phenomenon leads to public health challenges, including insufficient sanitation and substandard drinking water quality [10]. However, the implementation of strategic planning and robust drought mitigation policies offers potential relief from these adverse impacts.
Rwanda, a landlocked gem in East Africa, is a country of diverse landscapes and abundant water resources. Its terrain, characterized by high altitudes, ranges from the low-lying Rusizi River at 950 m to the towering Mount Karisimbi at 4507 m [11]. The country’s water wealth is equally impressive, with vast untapped reserves replenished by a dense network of rainfall-fed lakes, rivers, wetlands, and groundwater systems. The hydrological network is divided into two major drainage basins: the Nile, covering 67% of the area and contributing 90% of the national waters, and the Congo, covering the remaining 33%. This network encompasses a multitude of lakes, including Kivu, Bulera, Ruhondo, and Muhazi, and rivers such as the Akagera and Nyabarongo in the Nile Basin and the Rusizi and Sebeya in the Congo Basin. Thus, Rwanda’s rich landforms and water resources form a vital part of its natural heritage [12].
Rwanda relies heavily on agriculture for economic development and food security. However, it faces climate change risks that could disrupt its climatic conditions, thereby impacting agricultural productivity [13]. The potential outcomes, such as higher temperatures, intense rainfall, and prolonged dry spells, pose a threat to crops, livestock, soil, water, and biodiversity elements crucial for the well-being of Rwandans, particularly the poor and vulnerable [14]. Droughts, a frequent hazard, affected over 4 million people from 1976 to 2007 in Rwanda, with the worst case in December 1989 causing 237 deaths due to hunger. According to the World Bank Group, droughts have resulted in social and environmental issues such as displacement, conflicts, and biodiversity loss, particularly in the eastern and southern regions of the country [15]. In 2015–2016, drought impacted crops on over 23,000 hectares in Kayonza, Nyagatare, and Kirehe districts, resulting in the deaths of 1750 cows due to a lack of fodder and water [16].
While some studies [17,18] have investigated the impacts of drought on agriculture and water resources in Rwanda, there remains a notable gap in comprehensively understanding the characteristics, trends, and potential implications of climate change on drought in the region. The existing literature primarily focuses on specific aspects and there is a need for a more holistic exploration. Drought events in Rwanda exhibit considerable spatial and temporal variability, exerting significant repercussions on both agriculture and water resources. Notably, a study by Ndayisaba et al. [19] utilized AVHRR and MODIS NDVI datasets to scrutinize vegetation changes in Rwanda. The study used regression and Hurst exponent methods to analyze the changes in vegetation cover from 1990 to 2014. The study’s findings indicated an overall increase in vegetation cover, with 81.3% of the areas showing improvement and 14.1% showing degradation. The most noticeable changes occurred in Kigali and the Eastern Province. Additionally, Mirindi [20] investigated historical and future drought characteristics in Rwanda’s Eastern Province amid climate change. Using the Standardized Precipitation Index (SPI), the study quantified meteorological droughts from 1981 to 2019 and employed the CORDEX Model for projections (RCP2.6 and RCP8.5) from 2022 to 2099. Findings revealed rising drought frequency and intensity, with projections indicating a continuing trend. However, the study solely focused on meteorological drought, overlooking other types like agricultural and hydrological droughts. Limited by using only one drought index (SPI), it also did not account for human activity effects. The study suggests broader geographical inclusion and integration of remote sensing indices like NDVI for future research enhancement. Furthermore, Uwimbabazi et al. [21] examined meteorological drought patterns in Rwanda using ground-based data from 1981 to 2020 and employed SPEI and SPI to assess drought severity at annual and seasonal scales. While no significant trends were observed in annual, March, April, and May (MAM) or October, November, and December (OND) rainfall, significant temperature increases were noted in MAM, OND, and annually. Moderate droughts were more prevalent than severe/extreme ones in MAM and OND, with varying intensity, duration, and frequency across the seasons. The study has some limitations as it focuses solely on meteorological drought and does not consider other types of drought, such as agricultural drought, and their impacts on vegetation and agriculture.
The current research on drought in Rwanda is limited in its exploration of spatiotemporal patterns, trends, and characteristics using remote sensing data and GIS techniques. Additionally, it is crucial to conduct a detailed analysis of the impact of drought on vegetation and agriculture at a national level. This would help identify areas that require further research. This study used a combination of remote sensing indices and ground-based data from 31 meteorological stations to assess drought conditions and their implications comprehensively. This study offers valuable insights for informed climate change planning by overcoming the limitations of prior research that lacked remote sensing indices and a comprehensive analysis of drought’s impact on vegetation and agriculture at the national scale.

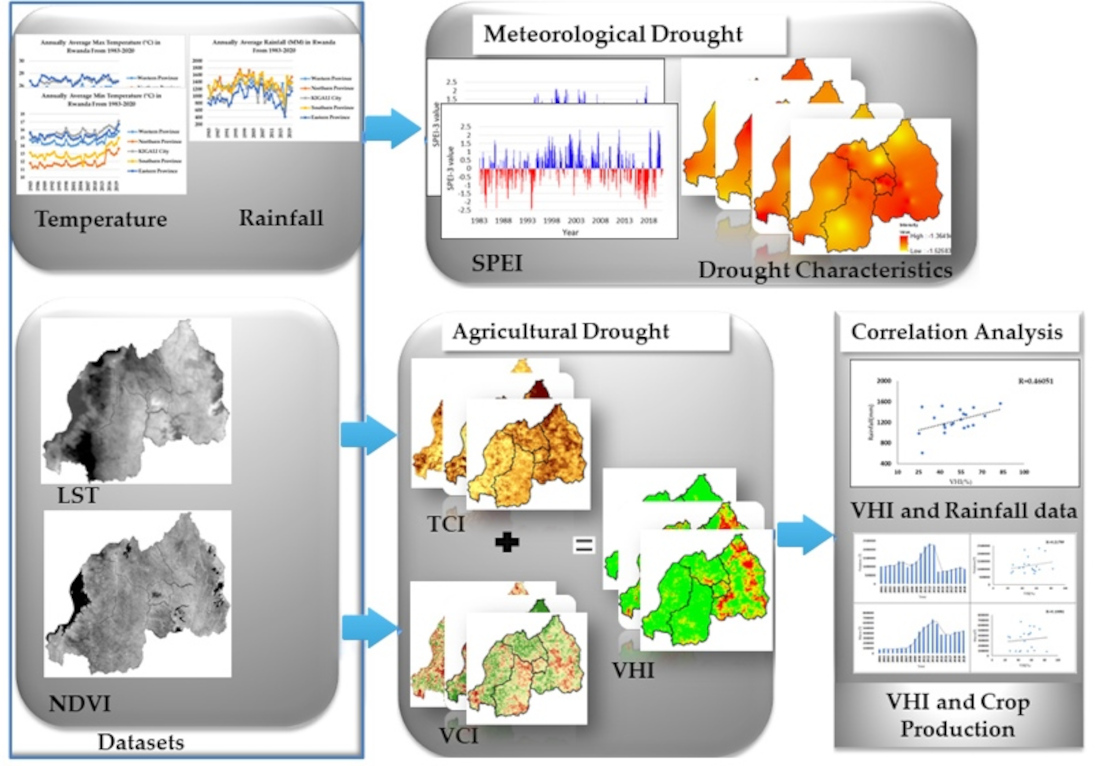
2. Materials and Methods

2.1. Study Area

Rwanda, situated on the East African Plateau, covers 26,338 km2. Positioned between latitudes 1°4′ and 2°51′ south and longitudes 28°53′ and 30°53′ east in the tropical belt, it shares borders with the Democratic Republic of Congo (RDC) to the west, Uganda to the north, Tanzania to the east, and Burundi to the south [22,23] (Figure 1).
Rwanda has a diverse ecosystem, including rainforests, savannahs, wetlands, and farmlands. Approximately 52% of the land is suitable for farming, with about 66% actively cultivated. Additionally, over 93,000 hectares of marshland are utilized for cultivation. The hilly terrain poses challenges such as runoff and landslides, increasing vulnerability to climate change effects, as reported by the World Bank [15]. Rwanda experiences a temperate tropical plateau climate with two rainy seasons (March to May and September to November) and two dry seasons (June to August and December to February). The country has two agricultural seasons corresponding to the rainy periods: Season A (September to December) and Season B (March to May). Rwanda comprises five provinces: Northern Province, WWestern Province, SSouthern Province, EEastern Province, and the capital city, Kigali City.

2.2. Datasets

The Rwanda Meteorology Agency (Meteo Rwanda) provided point-based rainfall and minimum and maximum temperature data from 31 stations across Rwanda for the study, which covered 1983 to 2020. The stations were grouped by province (Figure 1). The study used rainfall data as a proxy for precipitation because Rwanda does not have snowfall. The rainfall pattern (Figure 2) shows that the northern region has the highest annual average rainfall (above 1700 mm) and the eastern region has the lowest (400 mm). The eastern region also has the highest average annual maximum temperature of 27.69 °C, while the northern region has the lowest average annual minimum temperature of 11.20 °C.
MOD11A2 provides land surface temperature (LST) with an 8-day temporal resolution and a 1-km spatial resolution, while MOD13A3 offers normalized difference vegetation index (NDVI) data at 1 km spatial resolution and a 16-day temporal resolution. These datasets, accessed from the National Aeronautics and Space Administration’s (NASA) Earth Data Portal (https://ladsweb.modaps.eosdis.nasa.gov/search/ (accessed on 10 June 2023)), will be utilized from 2001 to 2020 to generate the Vegetation Condition Index (VCI) and Temperature Condition Index (TCI), contributing to the production of the Vegetation Health Index (VHI). Additionally, crop yield data for the same period can be obtained freely from the Food and Agriculture Organization of the United Nations (FAOSTAT) portal (https://www.fao.org/faostat/en/#data (accessed on 10 August 2023)).

2.3. Methods

2.3.1. Standardized Precipitation Evapotranspiration Index (SPEI)

The SPEI helped to identify meteorological drought by providing a standardized measure of the balance between precipitation and evapotranspiration, which are key meteorological variables for assessing drought conditions. The SPEI, an upgraded drought measure built on the SPI, helps us understand how global warming affects drought conditions [24]. The SPEI was proposed by Vicente-Serrano et al. [25] and is considered a suitable alternative to the SPI [26]. The study chose the SPEI-3 (3-month time scale) to capture short-term meteorological drought variations, particularly relevant for immediate impacts on ecosystems and water resources [27]. The Hargraves method, which is commonly employed for estimating potential evapotranspiration (PET), requires the monthly average maximum and minimum temperatures (Tmax and Tmin) as the main factors [28]. This method was used in our study.
(1)
Calculate climate level measurement Di (Equation (1)), which is the difference between precipitation Pi and PETi for the month I as follows:
D i = P i P E T i
This offers a straightforward assessment of the water balance for the examined month. The calculated Di values are aggregated at different time scales.
(2)
To calculate the total amount of water available for different periods of time, use the climate water balance series method.
  D n k = i = 0 k 1 ( P n 1 P E T n i ) ,   n k
The time scale, usually measured in months, is denoted by k and n represents the number of computations.
(3)
Apply the probability density function of a three-parameter log-logistic distributed variable to fit the data series (Equation (3))
                    f x = β α x y α β 1 1 + x y α β 2
The L-moment parameter estimation method can be used to obtain the origin parameter γ, the shape factor β, and the scale factor α. Therefore, the following Equation (4) gives the cumulative probability for a specific time scale:
F x = 1 + α x y β 1    
To obtain the SPEI time series of change (Equation (5)), the study applied a standard normal distribution to the cumulative probability density.
                        S P E I = W C 0 + C 1 W + C 2 W 2 1 + d 1 W + d 2 W 2 + d 3 W 3    
W is a parameter that is calculated by the formula 2 ln P , where P represents the probability of exceeding the specified moisture gain or loss when p ≤ 0.5, p = 1 − F(x), and when p > 0.5, p = 1 − p and the sign of SPEI is reversed. In addition to the variable factors, the equation has some fixed components: C0 = 2.515517, C1 = 0.802853, C2 = 0.010328, d1 = 1.432788, d2 = 0.189269, and d3 = 0.00130 [29].

2.3.2. Vegetation Health Index (VHI)

The VHI is specifically designed to assess vegetation health and vigor, making it a useful tool for monitoring agricultural drought. It is defined by two components, which are the VCI and the TCI.
Kogan [30] proposed the VCI as a method to account for local variations in ecosystem productivity, which indicates the condition of vegetation in different growth stages. The VCI is a remote sensing drought index based on the NDVI. It is computed using the following formula:
      V C I = N D V I N D V I m i n N D V I m a x N D V I m i n   × 100
where NDVI is the monthly NDVI and NDVImin and NDVImax are the monthly minimum and maximum NDVI values, respectively, over the study period.
On the other hand, the TCI (Equation (7)) index was developed in 1995 [30,31] and its computational algorithm is similar to VCI (Equation (6)). The TCI serves as a thermal stress indicator utilized for assessing temperature-related drought conditions. This remote sensing index assumes that during the drought event, soil moisture diminished significantly and caused high vegetation stress. LST can be calculated using different satellite images [32].
T C I = L S T m a x L S T L S T m a x L S T m i n   × 100
where LST is the monthly LST and LSTmin and LSTmax are the monthly minimum and maximum LST values, respectively, over the study period.
The VHI described in Equation (8) is one of the most popular remote sensing index used for drought monitoring [33,34].
V H I = α × V C I + 1 α × T C I
The VHI is calculated by combining two indices: the VCI and the TCI. Each index has a weight factor that determines how much it influences the VHI. The weight factor is denoted by α for the VCI and (1 − α) for the TCI. This study followed the recommendation of Kogan et al. [35] and used equal weights (α = 0.5) for both indices.
The VHI values indicate the severity of drought conditions, with lower values representing extreme drought and higher values representing optimal conditions. The threshold values were used to classify drought grades under SPEI and VHI following the studies of [36,37], which are elaborated in Table 1.

2.3.3. Inverse Distance Weighted (IDW)

The IDW interpolation method, a commonly used technique, predicts values for unmeasured locations based on the values of surrounding measured locations. This method operates under two primary assumptions: the influence of an unknown value of a point increases with proximity to the control point and the degree of influence is directly proportional to the inverse of the distance between points [38,39]. In the process of interpolation, observation points receive weights that decrease as the distance from the new point increases, affecting their relative influence [40]. The weighting power, which controls how weighting factors decrease as the distance from a new point increases, is used to assign weights to observation points. As the power increases, the value of the new point becomes closer to the value of the nearest observed point. Consequently, IDW operates on the assumption that the value of an attribute, denoted as z at any point without sampled data, is estimated by calculating a distance-weighted average of the sampled points located within a specified neighborhood around that unsampled point. This method ensures that the influence of distant points is minimized, thereby providing a more accurate prediction [41,42]. In this study, the IDW interpolation method was employed to analyze the spatial distribution of drought conditions. It was used to interpolate the drought characteristics observed at various stations and to create comprehensive drought maps.

2.3.4. Computation of Drought Characteristics

To calculate the drought characteristics, the study used the following parameters, which were evaluated based on drought events: duration, frequency, severity, and intensity (Table 2). This study applied the thresholds of SPEI ≤ −1.00 to identify drought and wetness events, respectively [36]. The study notes that these events were measured in months.
These parameters are commonly employed to examine the characteristics of drought conditions under various spatiotemporal conditions [36,43]. To assess the potential impact of global warming on drought characteristics, the parameters mentioned above are utilized.

2.3.5. Drought Trend Analysis

To detect the significant trends in the area, the nonparametric Mann-Kendall (MK) test was applied. This method is thought to be the best method for analyzing climatic changes and trends in climatological time series. The World Meteorological Organization (WMO) has approved the MK test as a method for analyzing trends in time series of environmental data. This test can reveal how a series changes over time and is often applied to track the time series analysis and to detect sudden shifts [44,45].

2.3.6. Pearson’s Correlation Coefficient

One way to measure the degree of linear correlation between two variables is Pearson’s correlation coefficient [46,47]. This study calculated Pearson’s correlation coefficient (r) to examine the relationships between the agricultural drought index and crop yields to determine the impact of agricultural drought on crop production. The formula used to calculate the Pearson correlation coefficient between those variables is
r = n Σ x y Σ x Σ y n Σ x 2 Σ x 2   n Σ y 2 Σ y 2
where r = Pearson’s correlation coefficient, n is several pairs of scores, x and y are distinct variables,  Σ x y  is a sum of the products of paired scores, Σ x  is a sum of x scores, Σ y is a sum of y scores, Σ x 2 is a sum of squared x scores, and Σ y 2   is a sum of squared y scores [48].

3. Results and Discussion

3.1. The Spatiotemporal Patterns of Meteorological Drought in Rwanda

This study assessed the spatiotemporal variability of meteorological droughts in Rwanda from 1983 to 2020 using the SPEI-3 timescale. The results showed that moderate to severe drought events occurred in many locations throughout the study period, with the most extreme drought occurring in 2017. The analysis demonstrated the spatial heterogeneity and temporal trends of drought patterns in Rwanda and offered valuable insights for drought monitoring and management. The analysis followed the drought classification presented in Table 1.
According to the SPEI-3 timescale, moderate drought was a prevalent occurrence across most of Rwanda’s provinces from 1983 to 2019. However, specific regions also encountered severe or extreme drought in certain years. In the Eastern Province, severe drought manifested in 1986, 1988, 1989, 2002, 2010, 2011, 2012, 2013, 2016, and 2017, with concurrent extreme drought events documented in 1993, 2000, and 2014 (Figure 3a). Likewise, the Southern Province witnessed severe drought in 1983, 1988, 1989, 1991, 2002, 2012, 2015, 2016, 2018, and 2019, alongside extreme drought occurrences in 1984, 1986, 1993, and 2017 (Figure 3b). In Kigali City, instances of severe drought were noted in 1983, 1990, 1992, 1993, 2002, 2005, 2008, 2016, 2017, and 2019. Additionally, extreme drought events were observed in 1986 and 2006 (Figure 3c). Within the Northern Province, severe drought events were recorded in 1984, 1986, 1989, 1993, 2004, 2012, 2014, and 2016, accompanied by extreme drought conditions in 1984 and 2017 (Figure 3d). Finally, the Western Province experienced severe drought events in 1984, 1986, 1993, 2004, 2005, 2006, 2010, 2013, 2014, 2015, 2018, and 2019, with concurrent extreme drought conditions witnessed in 2012 and 2017 (Figure 3e). Notably, as Figure 2c illustrates, most of the province experienced a severe rainfall deficit in 2017, resulting in extreme drought conditions that lasted throughout the year, in particular in the Northern and Western regions. This was the most challenging year for the provinces in terms of water scarcity and its impacts on agriculture, the environment, and livelihoods. The primary driver of these drought events was the marked deficiency in precipitation, which fell significantly below the historical average for the region.
However, the increase in surface air temperatures significantly contributed to exacerbating the water balance and intensifying drought conditions [49]. This temperature rise aligns with the findings of a study by Safari [50], which analyzed temperature trends and variability in Rwanda from 1983 to 2022. The study identified a statistically significant positive trend in minimum temperature for both the long dry season and short rain season, with increases of 0.17 °C/decade and 0.20 °C/decade, respectively. Similar dryness incidents were observed not only in Rwanda but also in neighboring countries, particularly in the northern and eastern parts of Burundi and Tanzania [51,52]. The analysis underscores the joint significance of rainfall and temperature in determining drought severity, emphasizing that changes in normal precipitation patterns can lead to drought events. Due to human activities, the frequency of extreme climatic events such as droughts and floods has been increasing globally. These changes are attributed to the global warming caused by human activities [53]. The evidence of detrimental anthropogenic activities and associated greenhouse gas emissions is unmistakable, as emphasized by the Intergovernmental Panel on Climate Change (IPCC) [53], while natural variability, such as the El Niño Southern Oscillation (ENSO), also influences extreme climatic events [54,55]. Climate variability, particularly in temperature and precipitation, has become a prevalent characteristic in many countries. This variability may contribute to the occurrence of droughts and wet events in the region, considering the influential roles of rainfall and temperature on evapotranspiration.

3.2. Drought Characteristics across Rwandan Provinces

The analysis of drought characteristics across Rwanda’s provinces, including Eastern Province, Northern Province, Kigali City, Southern Province, and Western Province, based on SPEI-3 timescale results, where the SPEI is at or below −1 (SPEI ≤ −1) from 1983 to 2020, provides a comprehensive view of the nation’s vulnerability to drought events.
The average duration of drought events exhibited variability among the provinces. The Western Province experienced durations ranging from 1 to 13 months, as shown in Figure 4d, while Southern Province saw droughts spanning 1 to 8 months. Northern Province had drought events that extended from 1 to 18 months and Kigali City recorded durations of 1 to 8 months. The Eastern Province observed droughts lasting from 1 to 13 months, with the majority lasting from 1 to 8 months. Droughts were observed across all provinces, with the highest frequency in the Eastern Province at approximately 18.64% of the study period. The Western Province observed a frequency of approximately 17.32%, followed by the NNorthern Province at 16.89%, Kigali City at around 15.35%, and the Southern Province at approximately 14.69% (Figure 4c). Furthermore, the highest average drought severity was found in the Northern Province at −2.72, followed by the Western Province at −2.43, Kigali City at −2.37, the Southern Province at −2.57, and the Eastern Province at −2.18 (Figure 4b). Moreover, the average drought intensity exhibited variation, with the Eastern Province having the highest average intensity at approximately −1.41, followed by the Western Province at −1.46, Kigali City at −1.39, the Northern Province at 1.43, and the Southern Province at −1.52 (Figure 4a).
The results highlight the temporal and spatial variability of drought occurrences in Rwanda, which have implications for agriculture and environmental management. The Eastern Province experienced the most frequent drought events, while the Southern Province faced the highest intensity. The Northern Province, on the other hand, suffered from the longest-lasting droughts, with the most severe average severity. These droughts lasted from 2016 to the end of 2017, due to a lack of rainfall and rising surface air temperatures, as shown in Figure 2c, which were unprecedented in this province. These findings are in line with the results of the study conducted by Twahirwa et al. [56]. The study assessed trends in rainfall and temperature in the Musanze district in the Northern Province and indicated increasing temperature trends and decreasing rainfall trends, with a significant downward tendency in rainfall during certain seasons.

3.3. Drought Trend Analysis Based on SPEI-3

The Mann-Kendall trend test results showed that none of the Rwandan provinces had a statistically significant trend at the 0.05 level. This indicated that there was no evidence of increasing or decreasing drought frequency or intensity in the past 38 years (1983–2020) based on SPEI-3. However, some provinces exhibited weak positive or negative trends that might warrant further analysis. The province with the highest positive trend was Kigali City, with a tau coefficient of 0.053 and a p-value of 0.09. This suggested that Kigali City experienced slightly wetter conditions over time but this trend was not strong enough to reject the null hypothesis of no trend. The province with the highest negative trend was Western Province, with a tau coefficient of −0.05 and a p-value of 0.11. This implied that Western Province experienced slightly drier conditions over time but this trend was not statistically significant either. The other three provinces (eastern, northern, and southern) had very small positive trends, with tau coefficients ranging from 0.008 to 0.026 and p-values ranging from 0.4 to 0.79. These results suggested that there was no clear trend in drought conditions for these provinces based on SPEI-3.
In summary, the Mann-Kendall trend test for SPEI-3 does not reveal any significant trends in drought conditions across Rwandan provinces in the past 38 years. However, some weak positive or negative trends may warrant further investigation using other indicators or methods. The findings presented align with a study by Kalisa et al. [57]. The study used the SPI index to assess drought occurrences and trends in the East African region. Concurrently, the Mann-Kendall test was employed to examine changes in precipitation and SPI across various time scales. Notably, the study indicated that SPI-3 identified insignificant positive trends over Rwanda, while SPI-12 revealed a significant positive trend in drought occurrences over the same region.

3.4. The Spatiotemporal Patterns of Agriculture Drought in Rwanda

This section examines the spatiotemporal patterns of agricultural drought in Rwanda. It focuses on three aspects: the impact of temperature variations on crop conditions using the TCI, the assessment of vegetation health and resilience to environmental stressors using the VCI, and the severity of agricultural drought using the VHI. The study employs remote sensing data (NDVI and LST) from 2001 to 2020. This helps to understand the effects of temperature, vegetation health, and the overall situation of agricultural drought in Rwanda.

3.4.1. Temperature Conditions and Crop Health: Insights from TCI Analysis

The Temperature Condition Index is a vital tool for agricultural drought monitoring, as it reflects the influence of temperature conditions on crop health and stress. Low TCI values signify heat stress, whereas high values indicate favorable conditions for vegetation [31,58]. Figure 5 and Figure 6 illustrate the spatial and temporal dynamics of TCI indices across the provinces of Rwanda from 2001 to 2020.
The annual TCI maps for the study area can be observed in Figure 5 and Figure 6, providing valuable insights into the variations in temperature conditions and their impacts on vegetation. The year 2003 was marked by significant thermal stress, especially in the Northern Province, Western Province, and Kigali City as well. During these years, TCI values fell below the critical threshold of 40, indicating unfavorable temperature conditions for vegetation (Figure 5). A similar pattern emerged in 2004, with thermal stress affecting the Southern Province, Kigali City, and the Eastern Province (Figure 5), and in 2005, particularly in the Eastern Province (Figure 5). In subsequent years, in 2015, thermal stress was notably prevalent, primarily affecting the Eastern Province and Kigali City, as demonstrated by TCI values dropping below 40 (Figure 6). A similar pattern emerged in 2010 and 2013, when western and Southern Province experienced thermal stress, with TCI values remaining below 40 (Figure 5 and Figure 6). Furthermore, the most intense thermal stress was observed in 2006, 2016, and 2017, particularly impacting the Eastern Province, Southern Provinces, and Kigali City. During these years, TCI values fell below 20 (Figure 5 and Figure 6), signifying exceptionally unfavorable temperature conditions for vegetation.
These patterns of thermal stress, especially during years with the lowest TCI values, have significant implications for vegetation and crop health. They can lead to reduced crop yields, less healthy vegetation, and potential disruptions to the ecosystem. The study conducted by Zeng et al. [58] emphasized that the thermal condition index has a more significant impact on the VHI than the VCI globally. Their research highlights the link between insufficient precipitation, causing water stress and high temperatures, affecting plant health, and causing heat stress. Gidey et al. [59] further support these findings by connecting vegetation stress to rising surface temperatures. Similarly, Gomes et al. [60] found that stressed vegetation features were predominant in the semi-arid region of northeastern Brazil. They also noted that the value of TCI was lower than 40 in El Niño years due to the irregular precipitation in the region. It is essential to understand these patterns for developing strategies to mitigate the effects of temperature-induced stress on vegetation and enhance agricultural and environmental resilience in the region.

3.4.2. Assessing Vegetation Health and Resilience in Response to Environmental Stressors: A VCI Analysis

Vegetation plays an essential role in the energy exchange of the land surface, the hydrological cycle, and climate regulation [61]. Vegetation patterns respond strongly to changes in the natural environment, especially to precipitation scarcity. Semi-arid regions, in particular, exhibit high sensitivity to variations in precipitation [62]. VCI is a key indicator of vegetation health on maps, indicating stress or poor conditions. Low VCI values indicate poor conditions, such as insufficient rainfall or soil moisture deficits, and are often associated with drought. High VCI values indicate robust healthy conditions, such as adequate rainfall and optimal soil moisture [31].
The results derived from the VCI index in Figure 7 and Figure 8 have revealed a significant pattern of considerable reductions in vegetation vigor within the study area over the past decade, particularly during specific years. This pattern, as indicated by VCI values falling below 40, can be attributed to a range of environmental stressors and challenges. In the years 2002 and 2012, the Western Province, Southern Province, and Northern Province experienced significant reductions in vegetation, reflecting the impact of environmental factors such as inadequate precipitation, soil moisture deficits, and unfavorable growing conditions. In 2003, 2010, 2011, 2014, 2018, and 2019, especially in the Eastern Province, Kigali City and the Southern Province grappled with similar issues, further emphasizing the sensitivity of vegetation to changes in its ecological surroundings. Notably, the years 2008, 2009, 2013, and 2015 were marked by significant reductions in vegetation, with values dropping below 40, particularly in the Southern Province, Kigali City, and the Eastern Province. These observations point to extended periods of unfavorable conditions, including inadequate rainfall and moisture deficits, which had a negative impact on vegetation health and vigor. Furthermore, in 2004, the entire Rwandan region exhibited signs of vegetation stress with values below 30, as shown in Figure 7. A similar pattern emerged in 2005, particularly in the Eastern Province and Kigali City. Moreover, in 2016, there was a substantial decline in vegetation vigor, with values falling below 20, primarily impacting the Eastern Province and Kigali City. This suggests ongoing challenges related to factors such as inadequate rainfall and soil moisture deficits.
Furthermore, the most significant reduction in vegetation vigor was observed in 2006 and 2017, with values falling below 15, as shown in Figure 7 and Figure 8. During these years, the entire study area experienced a significant decline in vegetation, with heightened levels of stress particularly in the Eastern Province, Kigali City, the Northern Province, and the Southern Province. These findings underscore the vulnerability of vegetation to prolonged environmental stressors, highlighting the adverse effects of insufficient rainfall, soil moisture deficits, and unfavorable growth conditions on the agricultural and ecological systems of the region. Moreover, these findings align with previous studies conducted in various regions worldwide. For instance, Dutta et al. [63] found that in India, there was noticeable stress on vegetation in 2002 compared to 2003. This was highlighted by the VCI, which pointed to crop stress due to drought in 2002, indicating a low VCI during that period. Similarly, Ait Ayad et al. [64] revealed that VCI maps obtained from their study indicated low values of the VCI in the years 1988, 2000, and 2006, implying unfavorable development situations in most of the Doukkala region. Additionally, the study demonstrated that the low VCI values reflected vegetation conditions close to the minimum values of the NDVI. As emphasized by Kogan [65], the VCI serves as a valuable tool for characterizing vegetation and assessing the dynamics of vegetation, along with climatic influences on plant health. The study concludes that the VCI holds significant promise for enhancing the analysis of vegetation conditions in non-homogeneous areas. Understanding these observed patterns and their underlying causes is imperative for the effective management of agriculture and the environment in these affected areas.

3.4.3. Assessing Agricultural Drought Using the Vegetation Health Index

The impact of water scarcity on the vegetation in the study region was evident from the values of VCI and TCI, which indicated low vegetation conditions and thermal stress, respectively. To assess the agricultural drought in the area from 2001 to 2020, the study integrated these parameters into VHI, which confirmed the occurrence of a typical dry spell during this period.
The annual maps illustrating the spatial distribution of VHI for the study area from 2001 to 2020 are presented in Figure 9 and Figure 10. It was found that in 2002, a period of mild to moderate drought was observed, particularly affecting the Western Province and Northern Provinces. In 2003 and 2015, severe drought conditions were noted, especially in the Eastern Province and Northern Province, as well as in 2009, 2010, 2013, and 2019, in Kigali City and the EEastern Province and Southern Province. Additionally, in 2004, severe drought conditions were particularly evident in the Western Province, Northern Province, and Eastern Province. Furthermore, the year 2005 witnessed an extreme drought, primarily impacting the Eastern Province. A similar pattern emerged in 2006, 2016, and 2017, with high-intensity drought events affecting all provinces in Rwanda, especially the Eastern Province and Southern Provinces. These drought events had significant implications for agriculture, resulting in crop failures, food shortages, population displacement, conflicts, and biodiversity loss, particularly in the eastern and southern regions of the country [15].
The findings of this study align with previous research, notably Uwimbabazi et al. [21], which investigated the drought conditions in Rwanda and found that the years 2015, 2016, and 2017 experienced varying degrees of dryness, with some areas like Kamembe Aero, Nyamagabe, Musanze Aero, Byumba, Nyagatare, Kawangire, and Ngoma exhibiting extreme drought events from 2016 to 2017. The observed occurrences of extreme dry events were attributed to a significant reduction in rainfall and elevated surface air temperatures during those years. Similarly, Kogan [31] reported that a series of intensive droughts have affected Ethiopia since the early 1970s, causing considerable damage to crops and the economy, which relies mostly on agriculture. The study also demonstrated that if both VCI and TCI remain below 35–40 for several weeks, a corn yield reduction of over 50% can be expected. Additionally, a study conducted by Lima et al. [66] reported that the VCI and TCI values indicated significant water stress on the vegetation in the study region. The study demonstrated that the combination of the above parameters through VHI confirms that the study area had a typical period of agricultural drought between 2010 and 2020. This collective evidence highlights the persistent threat of drought to agriculture, particularly in rainfed regions, where adverse effects on crops and economies are pronounced. Drawing on the broader scientific literature, including studies such as [67,68], the results reinforce the dire consequences of drought on agriculture. The cumulative impact of agricultural and meteorological droughts on vegetation is highlighted by previous research [69]. Therefore, Lottering et al. [70] recommended using strategies to adapt and cope with the expected rise in drought, especially for small-scale producers. This would help decrease the impacts and damages related to drought.

3.4.4. Agricultural Drought (VHI) Response to the Annual Rainfall

This study investigated the impact of below-average annual rainfall on agricultural drought in the study area. The main climatic factor that caused agricultural drought was the rainfall deficit. Previous studies [59,71] reported a linear and strong correlation, respectively, between rainfall and agricultural drought indices. They also suggested that low rainfall levels increased moisture stress and the occurrence of agricultural drought. However, this study revealed a moderate positive linear relationship between VHI and annual rainfall (R = 0.46, p < 0.05), as shown in Figure 11. This indicates that as rainfall increased, VHI also increased, implying less agricultural drought. This study concluded that insufficient rainfall led to high moisture stress levels and caused agricultural drought in dry years.

3.4.5. The Impact of Agricultural Drought on Crop Production in Rwanda

Dryness occurs in any region of the country, especially during the growing season, and can cause significant crop losses. In order to evaluate the direct impact of drought on crop production in the region during the study period, the study calculated Pearson correlation coefficients (r) between agricultural drought indices (VHI) and crop production (potatoes and maize).
Figure 12 presents a comprehensive view of national potatoes and maize production in Rwanda from 2001 to 2020. The data reveal notable declines in production for the observed species of crops. Maize and potato production dropped in 2004, 2006, 2007, 2014, 2015, 2016, and 2017 (Figure 12a,c), which coincided with the drought periods identified by the SPEI and VHI as drought indicators in this study. Agricultural drought poses a significant threat to both vegetation and crop production in Rwanda. Crop production and VHI showed a weak positive association for potatoes (R = 0.217891, p > 0.05) and maize (R = 0.10, p > 0.05), suggesting a possible negative impact of drought on crop production. However, the relationship was not statistically significant, probably because the VHI did not fully capture the influence of factors such as irrigation, chemical fertilizer usage, and other agricultural practices. Unfortunately, we could not evaluate the effect of these factors on crop production due to the limited data availability of agricultural practices for each province, which would have enhanced the value of the results mentioned above.
Moreover, similar positive correlations between crop yields and the Vegetation Health Index (VHI) have been observed in Germany [72]. Moreover, to cope with the challenges of climate variability and change, Rwanda may need to implement adaptation and resilience measures that can enhance the water efficiency and sustainability of its agricultural sector. Potential strategies include water harvesting and storage, crop rotation and intercropping, the adoption of drought-tolerant crop varieties, the improvement in irrigation infrastructure and management, and the promotion of climate-smart agricultural practices [73].

4. Conclusions

This comprehensive study examined meteorological drought patterns in Rwanda from 1983 to 2020, employing SPEI-3 annually, based on data from 31 meteorological stations nationwide. Additionally, the study investigated agricultural drought from 2001 to 2020 by incorporating remote sensing data (NDVI and LST). These data were used to compute the VCI and TCI, which were combined to derive the VHI as an indicator of agricultural drought. The analysis revealed that extended and intense drought events, especially in 2003, 2004, 2005, 2006, 2013, 2014, 2015, 2016, and 2017, significantly affected agricultural productivity. The Eastern Province was the most affected by frequent drought occurrences, while the Southern Province endured the most intense droughts. The Northern Province experienced the longest and most severe droughts, particularly between 2016 and 2017. Furthermore, the Mann-Kendall trend test for SPEI-3 indicated no significant trends in drought conditions across Rwandan provinces over the past 38 years. The study also examined the effects of below-average annual rainfall on agricultural drought, finding a moderately positive linear correlation between VHI and rainfall. Insufficient rainfall emerged as a primary contributor to high moisture stress and subsequent agricultural drought during dry years. Drought was found to adversely affect crop production. The identification of thermal stress and reduced vegetation vigor in various provinces highlighted the complex nature of drought impacts. The study underscored the vital role of remote sensing, satellite data, and drought indices in monitoring and assessing drought conditions.
Furthermore, this study establishes a foundation for future research on meteorological and agricultural droughts in Rwanda. As temperatures rise across Rwanda’s provinces, it is crucial for subsequent studies to evaluate the impacts of climate change. These studies should focus on how climate change affects the frequency and severity of droughts and project potential future scenarios. Furthermore, assessing the effectiveness of adaptation strategies in response to drought events and pinpointing areas for improvement are essential for increasing resilience to these droughts. Continued research will lead to a more thorough understanding of droughts in Rwanda and will guide the development of policies and strategies to bolster resilience against changing climatic conditions. This study recognizes its limitations, such as not considering irrigation, crop growth, and water demand impacts when assessing agricultural drought in plain regions. A notable gap is the exclusion of a Crop Water Stress Index (CWSI) based on sap flow for Conilon coffee plants. Future research should include CWSI or Crop Water Demand and Crop Growth Impacts (CWAPI) indices, derived from long-term sap flow measurements, to gain deeper insights into water stress and its effects on crop yield, particularly in provinces experiencing severe droughts.
This study not only contributes to our understanding of drought patterns and their impacts on vegetation and crop production in Rwanda but also underscores the significance of climate-resilient agricultural practices and the necessity for adaptive strategies. The findings of this research can serve as a foundation for future efforts to enhance the resilience and sustainability of Rwanda’s agricultural sector in the face of a changing climate.

Author Contributions

Conceptualization, S.N., A.K. and E.D.U. methodology, S.N., A.E. and E.D.U.; software, E.H., E.D.U., G.D.F. and S.N; validation, S.N. formal analysis S.N., V.N. and J.N.; investigation, S.N.; resources, S.N.; data curation, E.D.U., A.U. and S.N.; writing—original draft preparation, S.N.; writing—review and editing, A.E., H.A., S.N. and X.Y.; visualization, S.N.; supervision, A.K.; project administration, A.K.; funding acquisition, A.K. All authors have read and agreed to the published version of the manuscript.

Funding

This work was jointly funded by the National Natural Science Foundation of China (Grant No. 32071655), the Tianchi Talent (young scientist) Fund (E335030101), the National Youth Talent Project (Grant No. E3150102), and the Project for Cultivating High-Level Talent of Xinjiang Institute of Ecology and Geography, Chinese Academy of Sciences (Grant No. E3150101 and E1500103), Chinese Academy of Sciences President’s International Fellowship Initiative (2021VCA0004).

Data Availability Statement

The data are available upon reasonable request from the authors.

Acknowledgments

The author would like to express my profound gratitude to Toqeer Ahmed from COMSATS University Islamabad, Pakistan for his exceptional contribution throughout the revision process of the manuscript. His insights have been remarkable and greatly appreciated. The author would like to express their gratitude to the University of Chinese Academy of Science (UCAS) for the award of the ANSO Scholarship for Young Talents. Additionally, the authors greatly appreciate the support received from the Xinjiang Institute of Ecology and Geography, Chinese Academy of Sciences (CAS), and the Rwanda Office of Sino-Africa Joint Research Center, Chinese Academy of Sciences (SAJOREC-CAS). Furthermore, this study was made possible by the data provided by the Rwanda Meteorology Agency, the National Aeronautics and Space Administration (NASA), and the Food and Agriculture Organization of the United Nations (FAOSTAT), which we gratefully acknowledge.

Conflicts of Interest

The authors declare no conflicts of interest.

References

  1. Karavitis, C.A.; Tsesmelis, D.E.; Skondras, N.A.; Stamatakos, D.; Alexandris, S.; Fassouli, V.; Vasilakou, C.G.; Oikonomou, P.D.; Gregorič, G.; Grigg, N.S. Linking drought characteristics to impacts on a spatial and temporal scale. Water Policy 2014, 16, 1172–1197. [Google Scholar] [CrossRef]
  2. Heim, R.R., Jr. A review of twentieth-century drought indices used in the United States. Bull. Am. Meteorol. Soc. 2002, 83, 1149–1166. [Google Scholar] [CrossRef]
  3. Mishra, A.; Bruno, E.; Zilberman, D. Compound natural and human disasters: Managing drought and COVID-19 to sustain global agriculture and food sectors. Sci. Total Environ. 2021, 754, 142210. [Google Scholar] [CrossRef] [PubMed]
  4. Ismail, Z.; Go, Y.I. Fog-to-Water for Water Scarcity in Climate-Change Hazards Hotspots: Pilot Study in Southeast Asia. Glob. Chall. 2021, 5, 2000036. [Google Scholar] [CrossRef] [PubMed]
  5. Wang, D.; Hejazi, M.; Cai, X.; Valocchi, A.J. Climate change impact on meteorological, agricultural, and hydrological drought in central Illinois. Water Resour. Res. 2011, 47, 9. [Google Scholar] [CrossRef]
  6. Knapp, A.K.; Beier, C.; Briske, D.D.; Classen, A.T.; Luo, Y.; Reichstein, M.; Smith, M.D.; Smith, S.D.; Bell, J.E.; Fay, P.A. Consequences of more extreme precipitation regimes for terrestrial ecosystems. Bioscience 2008, 58, 811–821. [Google Scholar] [CrossRef]
  7. He, Q.-L.; Xiao, J.-L.; Shi, W.-Y. Responses of Terrestrial Evapotranspiration to Extreme Drought: A Review. Water 2022, 14, 3847. [Google Scholar] [CrossRef]
  8. Nembilwi, N.; Chikoore, H.; Kori, E.; Munyai, R.B.; Manyanya, T.C. The occurrence of drought in mopani district municipality, South Africa: Impacts, vulnerability and adaptation. Climate 2021, 9, 61. [Google Scholar] [CrossRef]
  9. Haile, G.G.; Tang, Q.; Sun, S.; Huang, Z.; Zhang, X.; Liu, X. Droughts in East Africa: Causes, impacts and resilience. Earth-Sci. Rev. 2019, 193, 146–161. [Google Scholar] [CrossRef]
  10. Mullin, M. The effects of drinking water service fragmentation on drought-related water security. Science 2020, 368, 274–277. [Google Scholar] [CrossRef]
  11. Gatera, Y. Developing Guidelines for the Protection of Cut Slope and Embankment for Roads in Rwanda. Doctoral Dissertation, College of Science and Technology, Phuentsholing, Bhutan, 2021. [Google Scholar]
  12. REMA. Rwanda State of Environment and Outlook Report; REMA: Kigali, Rwanda, 2009. [Google Scholar]
  13. Umugwaneza, A.; Chen, X.; Liu, T.; Li, Z.; Uwamahoro, S.; Mind’je, R.; Dufatanye Umwali, E.; Ingabire, R.; Uwineza, A. Future Climate Change Impact on the Nyabugogo Catchment Water Balance in Rwanda. Water 2021, 13, 3636. [Google Scholar] [CrossRef]
  14. The Ministry of Foreign Affairs of the Netherlands. Climate Change Profile: Rwanda. 2018. Available online: https://www.preventionweb.net/media/92552/download?startDownload=true/ (accessed on 10 July 2023).
  15. TWB Group. Climate Risk Country Profile: Rwanda. 2021. Available online: https://climateknowledgeportal.worldbank.org/sites/default/files/2021-09/15970-WB_Rwanda%20Country%20Profile-WEB.pdf/ (accessed on 14 May 2023).
  16. Emmanuel, N. Rwanda’s longest drought in six decades: The effects on food security and lessons learnt. The New Times, 15 September 2016. [Google Scholar]
  17. Buheji, M.; Muhorakeye, L. Mitigation of drought impact on livestock husbandry. Int. J. Manag. (IJM) 2023, 14, 61–76. [Google Scholar]
  18. Lydie, M. Droughts and Floodings Implications in Agriculture Sector in Rwanda: Consequences of Global Warming. In The Nature, Causes, Effects and Mitigation of Climate Change on the Environment; IntechOpen: London, UK, 2022. [Google Scholar]
  19. Ndayisaba, F.; Guo, H.; Bao, A.; Guo, H.; Karamage, F.; Kayiranga, A. Understanding the spatial temporal vegetation dynamics in Rwanda. Remote Sens. 2016, 8, 129. [Google Scholar] [CrossRef]
  20. Mirindi, J.D. Assessment of the Past and Future Meteorological Drought Characteristics in the Eastern Province of Rwanda Under a Changing Climate. Doctoral Dissertation, University of Nairobi, Nairobi, Kenya, 2022. [Google Scholar]
  21. Uwimbabazi, J.; Jing, Y.; Iyakaremye, V.; Ullah, I.; Ayugi, B. Observed changes in meteorological drought events during 1981–2020 over Rwanda, East Africa. Sustainability 2022, 14, 1519. [Google Scholar] [CrossRef]
  22. Henninger, S.M. Does the Global Warming Modify the Local Rwandan Climate? Scientific Research Publishing (SCIRP): Glendale, CA, USA, 2013. [Google Scholar]
  23. Sebaziga Ndakize, J. Spatial-Temporal Variability and Projected Rainfall over Rwanda. Doctoral Dissertation, University of Rwanda, Kigali, Rwanda, 2018. [Google Scholar]
  24. Kartika, F.D.; Wijayanti, P. Drought disaster modeling using drought index: A systematic literature review. In IOP Conference Series: Earth and Environmental Science; IOP Publishing: London, UK, 2023. [Google Scholar]
  25. Vicente-Serrano, S.M.; Beguería, S.; López-Moreno, J.I. A multiscalar drought index sensitive to global warming: The standardized precipitation evapotranspiration index. J. Clim. 2010, 23, 1696–1718. [Google Scholar] [CrossRef]
  26. Beguería, S.; Vicente-Serrano, S.M.; Reig, F.; Latorre, B. Standardized precipitation evapotranspiration index (SPEI) revisited: Parameter fitting, evapotranspiration models, tools, datasets and drought monitoring. Int. J. Climatol. 2014, 34, 3001–3023. [Google Scholar] [CrossRef]
  27. Haile, G.G.; Tang, Q.; Leng, G.; Jia, G.; Wang, J.; Cai, D.; Sun, S.; Baniya, B.; Zhang, Q. Long-term spatiotemporal variation of drought patterns over the Greater Horn of Africa. Sci. Total Environ. 2020, 704, 135299. [Google Scholar] [CrossRef]
  28. Stagge, J.H.; Tallaksen, L.M.; Xu, C.Y.; Van Lanen, H.A. Standardized precipitation-evapotranspiration index (SPEI): Sensitivity to potential evapotranspiration model and parameters. In Hydrology in a Changing World; Copernicus GmbH: Montpellier, France, 2014. [Google Scholar]
  29. He, J.; Li, B.; Yu, Y.; Sun, L.; Zhang, H.; Malik, I.; Wistuba, M.; Yu, R. Temporal variability of temperature, precipitation and drought indices in hyper-arid region of northwest China for the past 60 years. Atmosphere 2022, 13, 1561. [Google Scholar] [CrossRef]
  30. Kogan, F.N. Application of vegetation index and brightness temperature for drought detection. Adv. Space Res. 1995, 15, 91–100. [Google Scholar] [CrossRef]
  31. Kogan, F.N. Global drought watch from space. Bull. Am. Meteorol. Soc. 1997, 78, 621–636. [Google Scholar] [CrossRef]
  32. Khanmohammadi, F.; Homaee, M.; Noroozi, A.A. Soil moisture estimating with NDVI and land surface temperature and normalized moisture index using MODIS images. J. Water Soil Resour. Conserv. 2015, 4, 37–45. [Google Scholar]
  33. Pei, F.; Wu, C.; Liu, X.; Li, X.; Yang, K.; Zhou, Y.; Wang, K.; Xu, L.; Xia, G. Monitoring the vegetation activity in China using vegetation health indices. Agric. For. Meteorol. 2018, 248, 215–227. [Google Scholar] [CrossRef]
  34. Li, Y.; Strapasson, A.; Rojas, O. Assessment of El Niño and La Niña impacts on China: Enhancing the early warning system on food and agriculture. Weather Clim. Extrem. 2020, 27, 100208. [Google Scholar] [CrossRef]
  35. Kogan, F.; Guo, W.; Strashnaia, A.; Kleshenko, A.; Chub, O.; Virchenko, O. Modelling and prediction of crop losses from NOAA polar-orbiting operational satellites. Geomat. Nat. Hazards Risk 2016, 7, 886–900. [Google Scholar] [CrossRef]
  36. Haile, G.G.; Tang, Q.; Hosseini-Moghari, S.M.; Liu, X.; Gebremicael, T.; Leng, G.; Kebede, A.; Xu, X.; Yun, X. Projected impacts of climate change on drought patterns over East Africa. Earth’s Future 2020, 8, e2020EF001502. [Google Scholar] [CrossRef]
  37. Kogan, F. World droughts in the new millennium from AVHRR-based vegetation health indices. Eos Trans. Am. Geophys. Union 2002, 83, 557–563. [Google Scholar] [CrossRef]
  38. Ajaj, Q.M.; Shareef, M.A.; Hassan, N.D.; Hasan, S.F.; Noori, A.M. GIS based spatial modeling to mapping and estimation relative risk of different diseases using inverse distance weighting (IDW) interpolation algorithm and evidential belief function (EBF) (Case study: Minor Part of Kirkuk City, Iraq). Int. J. Eng. Technol. 2018, 7, 185–191. [Google Scholar] [CrossRef]
  39. Masroor, K.; Fanaei, F.; Yousefi, S.; Raeesi, M.; Abbaslou, H.; Shahsavani, A.; Hadei, M. Spatial modelling of PM2. 5 concentrations in Tehran using Kriging and inverse distance weighting (IDW) methods. J. Air Pollut. Health 2020, 5, 89–96. [Google Scholar]
  40. Maleika, W. Inverse distance weighting method optimization in the process of digital terrain model creation based on data collected from a multibeam echosounder. Appl. Geomat. 2020, 12, 397–407. [Google Scholar] [CrossRef]
  41. Shukla, K.; Kumar, P.; Mann, G.S.; Khare, M. Mapping spatial distribution of particulate matter using Kriging and Inverse Distance Weighting at supersites of megacity Delhi. Sustain. Cities Soc. 2020, 54, 101997. [Google Scholar] [CrossRef]
  42. Ibrahim, A.M.; Nasser, R.H.A. Comparison between inverse distance weighted (IDW) and Kriging. Int. J. Sci. Res. 2015, 6, 2319–7064. [Google Scholar]
  43. Ankrah, J.; Monteiro, A.; Madureira, H. Spatiotemporal Characteristics of Meteorological Drought and Wetness Events across the Coastal Savannah Agroecological Zone of Ghana. Water 2023, 15, 211. [Google Scholar] [CrossRef]
  44. Mann, H.B. Nonparametric tests against trend. Econom. J. Econom. Soc. 1945, 13, 245–259. [Google Scholar] [CrossRef]
  45. Kendall, M.G. Rank Correlation Methods. J. Inst. Actuar. 1948. [Google Scholar] [CrossRef]
  46. Cohen, I.; Huang, Y.; Chen, J.; Benesty, J.; Benesty, J.; Chen, J.; Huang, Y.; Cohen, I. Pearson correlation coefficient. In Noise Reduction in Speech Processing; Springer: Berlin/Heidelberg, Germany, 2009; pp. 1–4. [Google Scholar]
  47. Emerson, R.W. Causation and Pearson’s correlation coefficient. J. Vis. Impair. Blind. 2015, 109, 242–244. [Google Scholar] [CrossRef]
  48. Ishfaq, U.; Khan, H.U.; Iqbal, K. Modeling to find the top bloggers using sentiment features. In Proceedings of the IEEE 2016 International Conference on Computing, Electronic and Electrical Engineering (ICE Cube), Quetta, Pakistan, 11–12 April 2016. [Google Scholar]
  49. Cook, B.I.; Smerdon, J.E.; Seager, R.; Coats, S. Global warming and 21 st century drying. Clim. Dyn. 2014, 43, 2607–2627. [Google Scholar] [CrossRef]
  50. Safari, B.; Sebaziga, J.N. Trends and Variability in Temperature and Related Extreme Indices in Rwanda during the Past Four Decades. Atmosphere 2023, 14, 1449. [Google Scholar] [CrossRef]
  51. Chang’a, L.B.; Kijazi, A.L.; Luhunga, P.M.; Ng’ongolo, H.K.; Mtongori, H.I. Spatial and temporal analysis of rainfall and temperature extreme indices in Tanzania. Atmos. Clim. Sci. 2017, 7, 525–539. [Google Scholar] [CrossRef]
  52. Ndayiragije, J.M.; Li, F. Monitoring and analysis of drought characteristics based on climate change in Burundi using standardized precipitation evapotranspiration index. Water 2022, 14, 2511. [Google Scholar] [CrossRef]
  53. Pachauri, R.K.; Allen, M.R.; Barros, V.R.; Broome, J.; Cramer, W.; Christ, R.; Church, J.A.; Clarke, L.; Dahe, Q.; Dasgupta, P. Climate Change 2014: Synthesis Report. Contribution of Working Groups I, II and III to the Fifth Assessment Report of the Intergovernmental Panel on Climate Change; IPCC: Geneva, Switzerland, 2014. [Google Scholar]
  54. Dai, A. Future warming patterns linked to today’s climate variability. Sci. Rep. 2016, 6, 19110. [Google Scholar] [CrossRef]
  55. Lyon, B. Seasonal drought in the Greater Horn of Africa and its recent increase during the March–May long rains. J. Clim. 2014, 27, 7953–7975. [Google Scholar] [CrossRef]
  56. Twahirwa, A.; Oludhe, C.; Omondi, P.; Rwanyiziri, G.; Sebaziga Ndakize, J. Assessing Variability and Trends of Rainfall and Temperature for the District of Musanze in Rwanda. Adv. Meteorol. 2023, 2023, 7177776. [Google Scholar] [CrossRef]
  57. Kalisa, W.; Zhang, J.; Igbawua, T.; Ujoh, F.; Ebohon, O.J.; Namugize, J.N.; Yao, F. Spatio-temporal analysis of drought and return periods over the East African region using Standardized Precipitation Index from 1920 to 2016. Agric. Water Manag. 2020, 237, 106195. [Google Scholar] [CrossRef]
  58. Zeng, J.; Zhang, R.; Qu, Y.; Bento, V.A.; Zhou, T.; Lin, Y.; Wu, X.; Qi, J.; Shui, W.; Wang, Q. Improving the drought monitoring capability of VHI at the global scale via ensemble indices for various vegetation types from 2001 to 2018. Weather Clim. Extrem. 2022, 35, 100412. [Google Scholar] [CrossRef]
  59. Gidey, E.; Dikinya, O.; Sebego, R.; Segosebe, E.; Zenebe, A. Analysis of the long-term agricultural drought onset, cessation, duration, frequency, severity and spatial extent using Vegetation Health Index (VHI) in Raya and its environs, Northern Ethiopia. Environ. Syst. Res. 2018, 7, 1–18. [Google Scholar] [CrossRef]
  60. Gomes, A.R.d.S.; Alves, J.M.B.; Silva, E.M.d.; Gomes, M.R.d.S.; Gomes, C.R.d.S. Study of the Relationship Between the Variability of Vegetation and Temperature Indexes of the Northeast Region of Brazil. Rev. Bras. De Meteorol. 2019, 34, 359–368. [Google Scholar] [CrossRef]
  61. Li, Y.; Zhao, Z.; Wang, L.; Li, G.; Chang, L.; Li, Y. Vegetation changes in response to climatic factors and human activities in Jilin Province, China, 2000–2019. Sustainability 2021, 13, 8956. [Google Scholar] [CrossRef]
  62. Zhang, B.; Zhu, J.-J.; Liu, H.-M.; Pan, Q.-M. Effects of extreme rainfall and drought events on grassland ecosystems. Chin. J. Plant Ecol. 2014, 38, 1008. [Google Scholar]
  63. Dutta, D.; Kundu, A.; Patel, N.; Saha, S.; Siddiqui, A. Assessment of agricultural drought in Rajasthan (India) using remote sensing derived Vegetation Condition Index (VCI) and Standardized Precipitation Index (SPI). Egypt. J. Remote Sens. Space Sci. 2015, 18, 53–63. [Google Scholar] [CrossRef]
  64. Ait Ayad, N.; Ait Ayad, A.; El Khalidi, K.; Habib, A.; Charif, A. Remote sensing and meteorological indexes of drought using open short time-series data in Doukkala Region, Morocco. Ecol. Eng. Environ. Technol. 2023, 24, 1–10. [Google Scholar] [CrossRef]
  65. Kogan, F.N. Remote sensing of weather impacts on vegetation in non-homogeneous areas. Int. J. Remote Sens. 1990, 11, 1405–1419. [Google Scholar] [CrossRef]
  66. Lima, S.C.d.; Moraes Neto, J.M.d.; Lima, J.P.; Lima, F.C.d.; Saboya, L.M. Response of semi-arid vegetation to agricultural drought determined by indices derived from MODIS satellite. Rev. Bras. De Eng. Agrícola E Ambient. 2023, 27, 632–642. [Google Scholar] [CrossRef]
  67. Ahmed, S.M. Impacts of drought, food security policy and climate change on performance of irrigation schemes in Sub-saharan Africa: The case of Sudan. Agric. Water Manag. 2020, 232, 106064. [Google Scholar] [CrossRef]
  68. Manatsa, D.; Mukwada, G.; Siziba, E.; Chinyanganya, T. Analysis of multidimensional aspects of agricultural droughts in Zimbabwe using the Standardized Precipitation Index (SPI). Theor. Appl. Climatol. 2010, 102, 287–305. [Google Scholar] [CrossRef]
  69. Cao, S.; Zhang, L.; He, Y.; Zhang, Y.; Chen, Y.; Yao, S.; Yang, W.; Sun, Q. Effects and contributions of meteorological drought on agricultural drought under different climatic zones and vegetation types in Northwest China. Sci. Total Environ. 2022, 821, 153270. [Google Scholar] [CrossRef] [PubMed]
  70. Lottering, S.; Mafongoya, P.; Lottering, R. Drought and its impacts on small-scale farmers in sub-Saharan Africa: A review. S. Afr. Geogr. J. 2021, 103, 319–341. [Google Scholar] [CrossRef]
  71. Wan, Z.; Wang, P.; Li, X. Using MODIS land surface temperature and normalized difference vegetation index products for monitoring drought in the southern Great Plains, USA. Int. J. Remote Sens. 2004, 25, 61–72. [Google Scholar] [CrossRef]
  72. Kloos, S.; Yuan, Y.; Castelli, M.; Menzel, A. Agricultural drought detection with MODIS based vegetation health indices in southeast Germany. Remote Sens. 2021, 13, 3907. [Google Scholar] [CrossRef]
  73. Grigorieva, E.; Livenets, A.; Stelmakh, E. Adaptation of Agriculture to Climate Change: A Scoping Review. Climate 2023, 11, 202. [Google Scholar] [CrossRef]
Figure 1. Study area map, country province boundaries with 31 stations, and African country boundaries.
Remotesensing 16 01455 g001
Figure 2. Temporal patterns of annual mean maximum (a), minimum temperature in °C (b), and mean annual rainfall (mm), (c) for the four provinces and the capital city during the study period of 1983–2020.
Remotesensing 16 01455 g002
Figure 3. Temporal variation in SPEI-3 from 1983 to 2020 in the provinces of Rwanda: EEastern Province (a), Southern Province (b), Kigali City (c), Northern Province (d), and Western Province (e).
Remotesensing 16 01455 g003
Figure 4. The characteristics of drought considered are intensity (a), severity (b), frequency (c), and duration (d).
Remotesensing 16 01455 g004
Figure 5. Spatial-temporal variation in the TCI in the years 2001 and 2010.
Remotesensing 16 01455 g005
Figure 6. Spatial-temporal variation in the TCI in the years 2011 and 2020.
Remotesensing 16 01455 g006
Figure 7. Spatial-temporal variation in the VCI in the years 2001 and 2010.
Remotesensing 16 01455 g007
Figure 8. Spatial-temporal variation in the VCI in the years 2011 and 2020.
Remotesensing 16 01455 g008
Figure 9. Spatial-temporal variation in the vegetation health index (VHI) in the period between 2001 and 2010.
Remotesensing 16 01455 g009
Figure 10. Spatial-temporal variation in the vegetation health index (VHI) in the period between 2011 and 2020.
Remotesensing 16 01455 g010
Figure 11. Correlation between VHI and annual rainfall (2001 to 2020).
Remotesensing 16 01455 g011
Figure 12. Potato (a,b) and maize (c,d) production in the study area from 2001 to 2020, with a correlation between both crop productions and VHI.
Remotesensing 16 01455 g012
Table 1. Classification scales of drought.
GradeTypesSPEIVHI (%)
1No droughtSPEI > −1VHI > 40
2Mild drought-30 ≤ VHI < 40
3Moderate drought−1.5 < SPEI ≤ −120 ≤ VHI < 30
4Severe drought−2 < SPEI ≤ −1.510 ≤ VHI < 20
5Extreme droughtSPEI ≤ −2VHI < 10
Table 2. Parameter equations for drought characteristics analysis.
Drought CharacteristicsEquationSymbol and Units
Drought duration (D) D = i = 1 n d i n D: drought duration (months),
di: duration of an ith drought event,
n: total number of drought events
Drought frequency (F) F = n m N m × 100 F: drought frequency (%),
nm: number of drought months,
Nm: total number of months
Drought severity (S) S = i = 1 D u r a t i o n I n d e x S: drought severity
Drought intensity (I) I = 1 n i = 1 n SPEI I I: drought intensity (−),
n: number of drought occurrences in months with SPEI < −1,
SPEIi: SPEI value under the threshold (−)
Disclaimer/Publisher’s Note: The statements, opinions and data contained in all publications are solely those of the individual author(s) and contributor(s) and not of MDPI and/or the editor(s). MDPI and/or the editor(s) disclaim responsibility for any injury to people or property resulting from any ideas, methods, instructions or products referred to in the content.

