
BSDSNet: Dual-Stream Feature Extraction Network Based on Segment Anything Model for Synthetic Aperture Radar Land Cover Classification


Abstract
1. Introduction
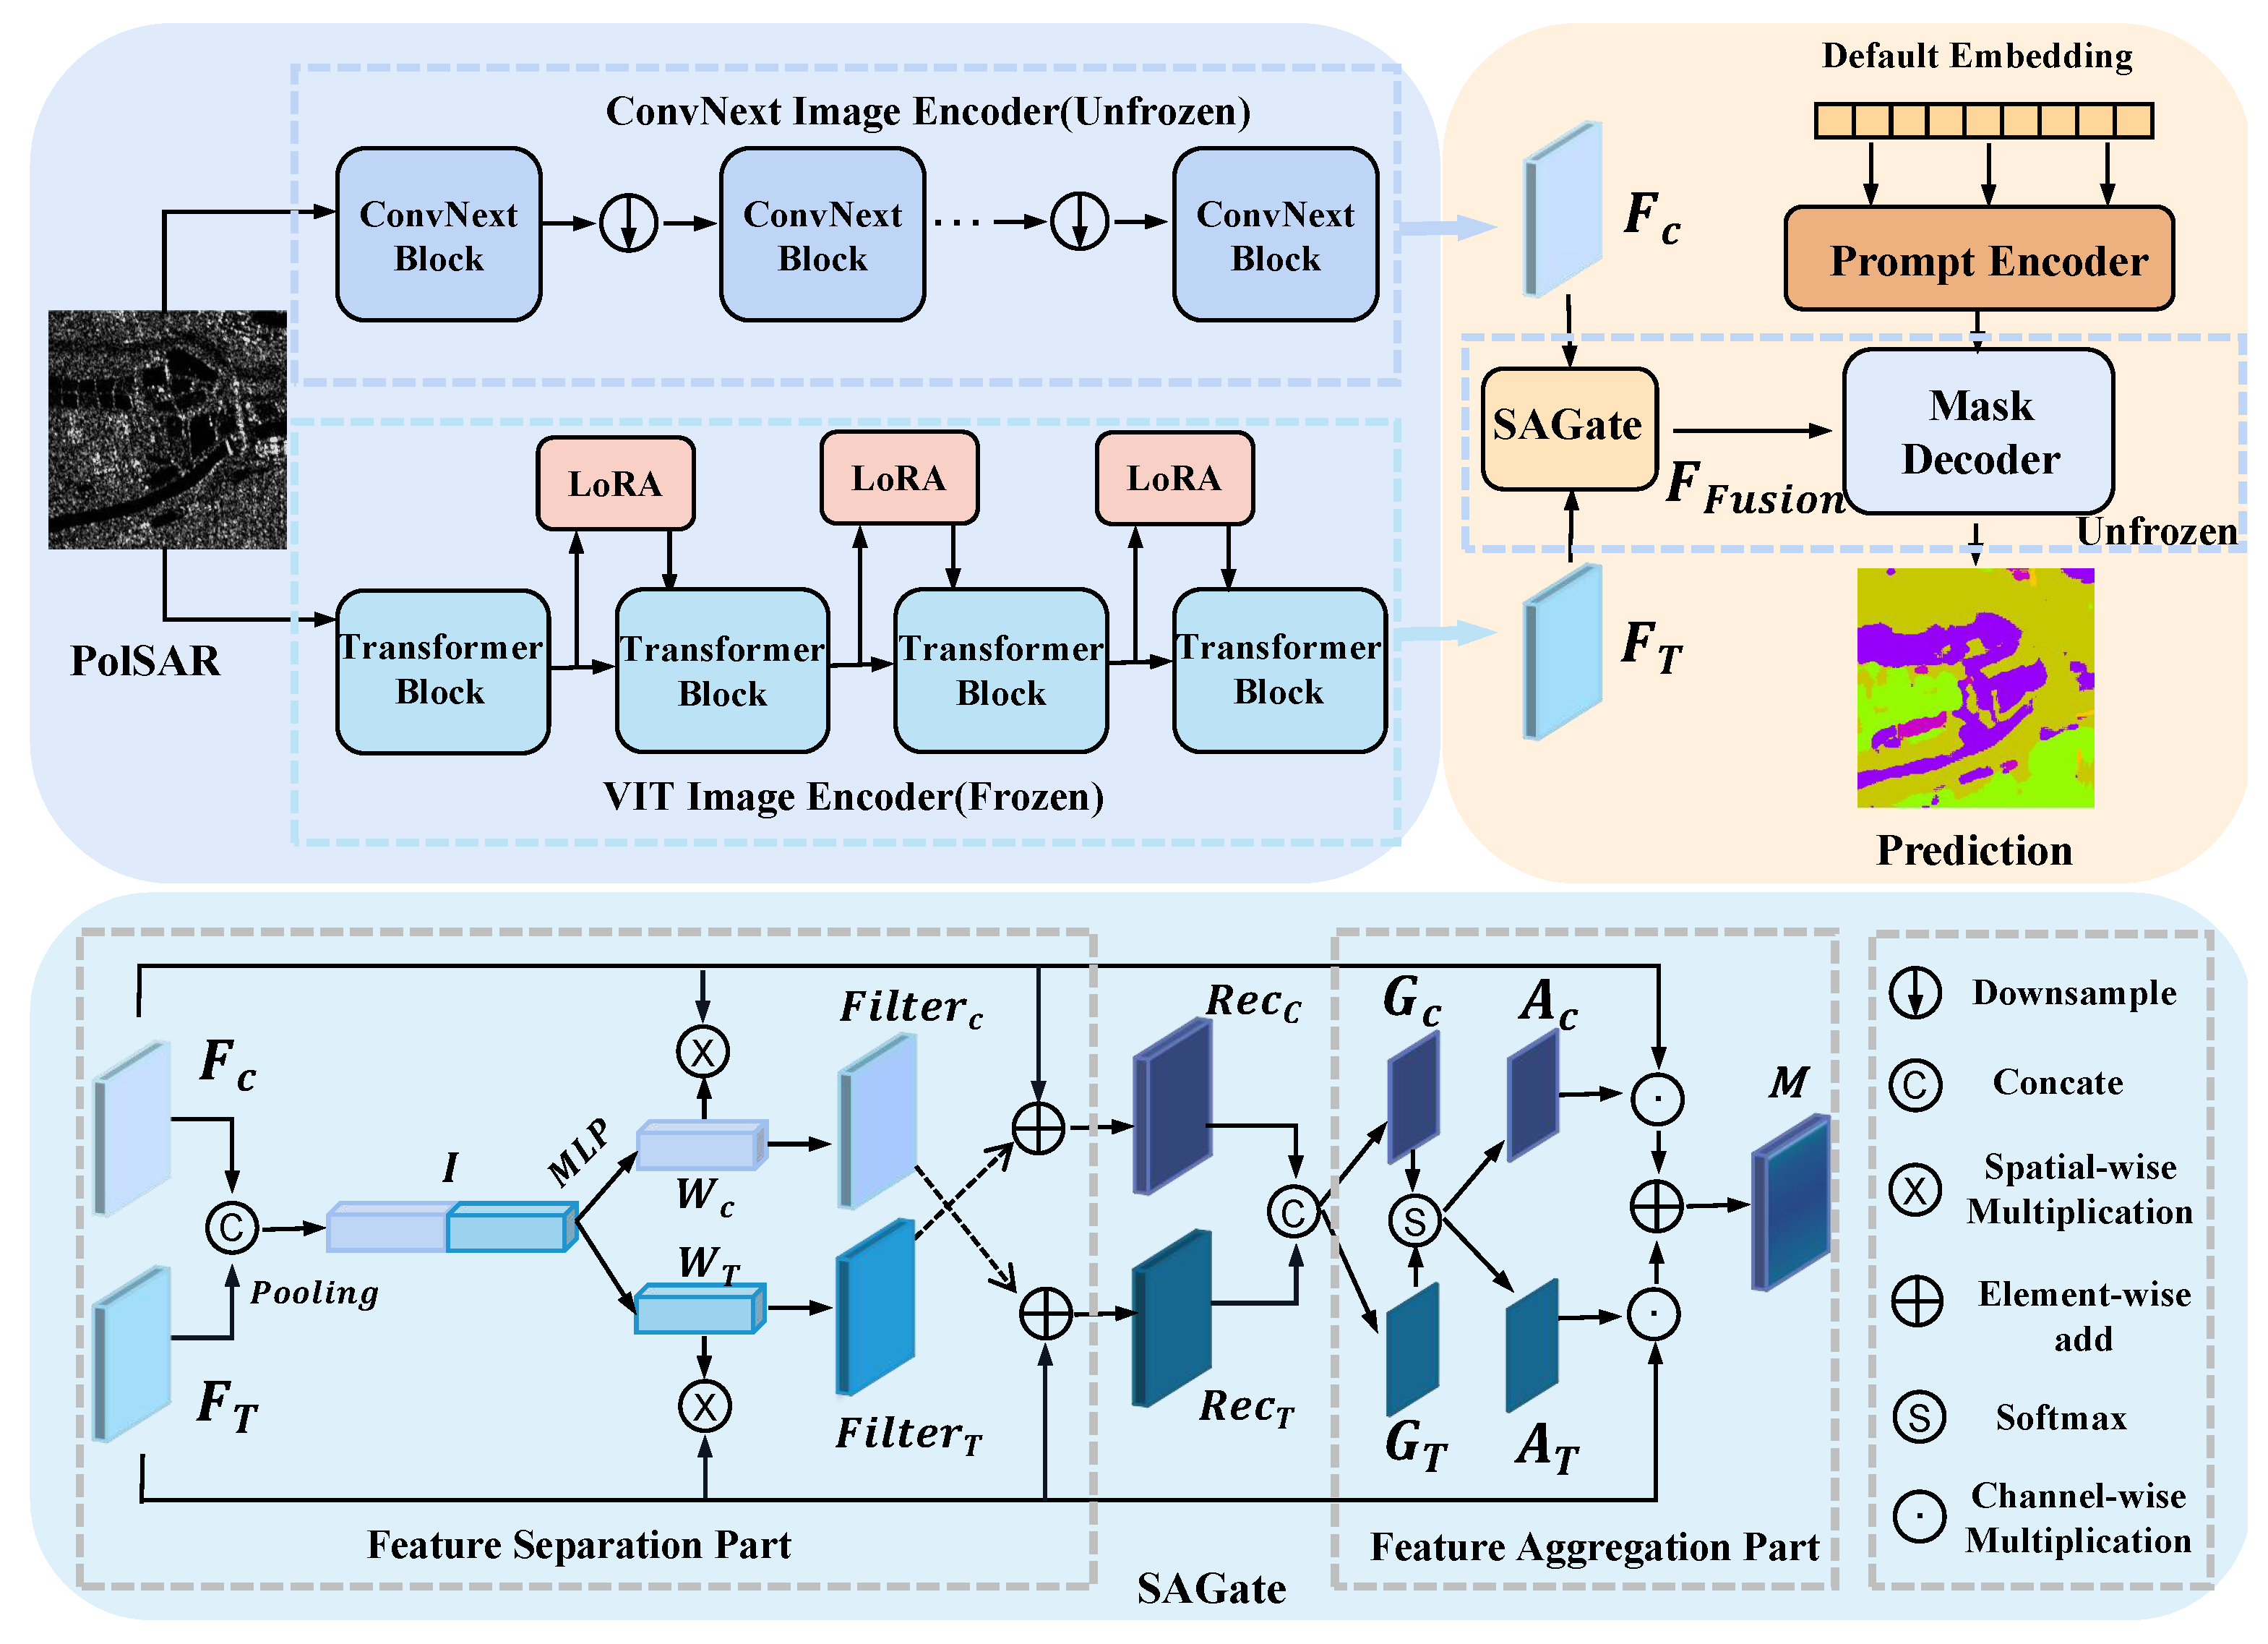
- We propose a dual-stream local–global feature encoding network, BSDSnet. It utilizes SAM as the backbone framework and consists of a ConvNext image encoder dedicated to extracting local information and another VIT image encoder to capture global features.
- We introduce a novel low-rank fine-tuning strategy, LoRA, specifically tailored to approximate low-rank updates for the parameters within the VIT image encoder. This innovative approach is designed to significantly reduce the parameter count, effectively minimizing the computational overhead.
- We introduce the SA-Gate feature fusion module to achieve a precise integration of both local and global information. This module comprises the Feature Separation (FS) module, which calibrates single-stream features, and the Feature Aggregation (FA) module, enabling dual-stream feature fusion.
2. Materials and Methods
2.1. Local Feature Extraction
2.1.1. Overview
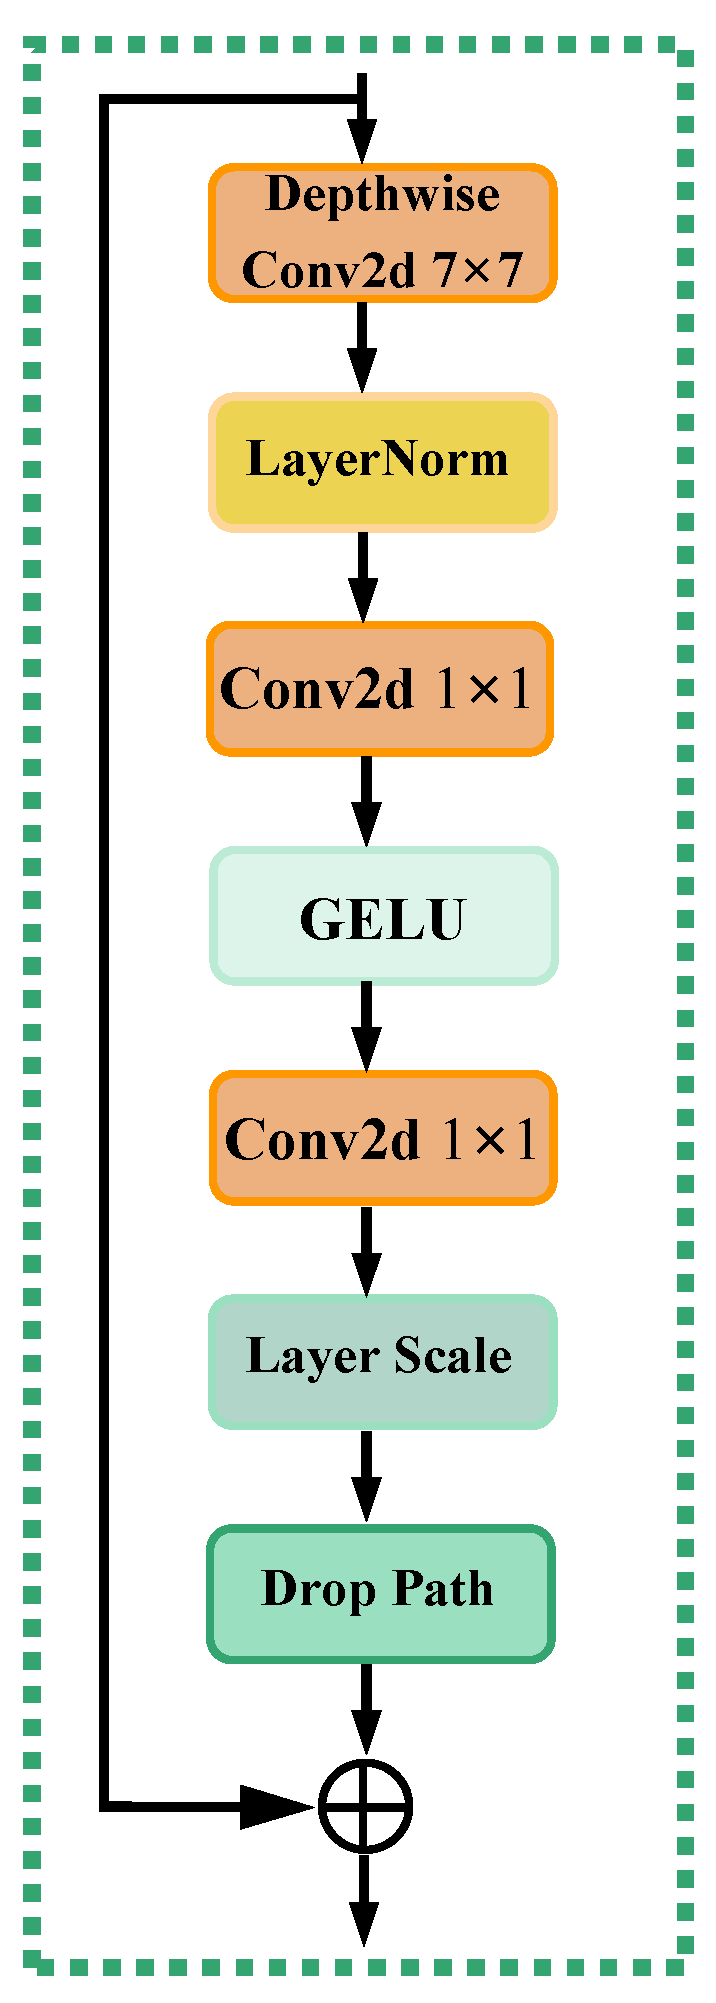
2.1.2. ConvNext
2.2. Global Feature Extraction
2.2.1. Overview
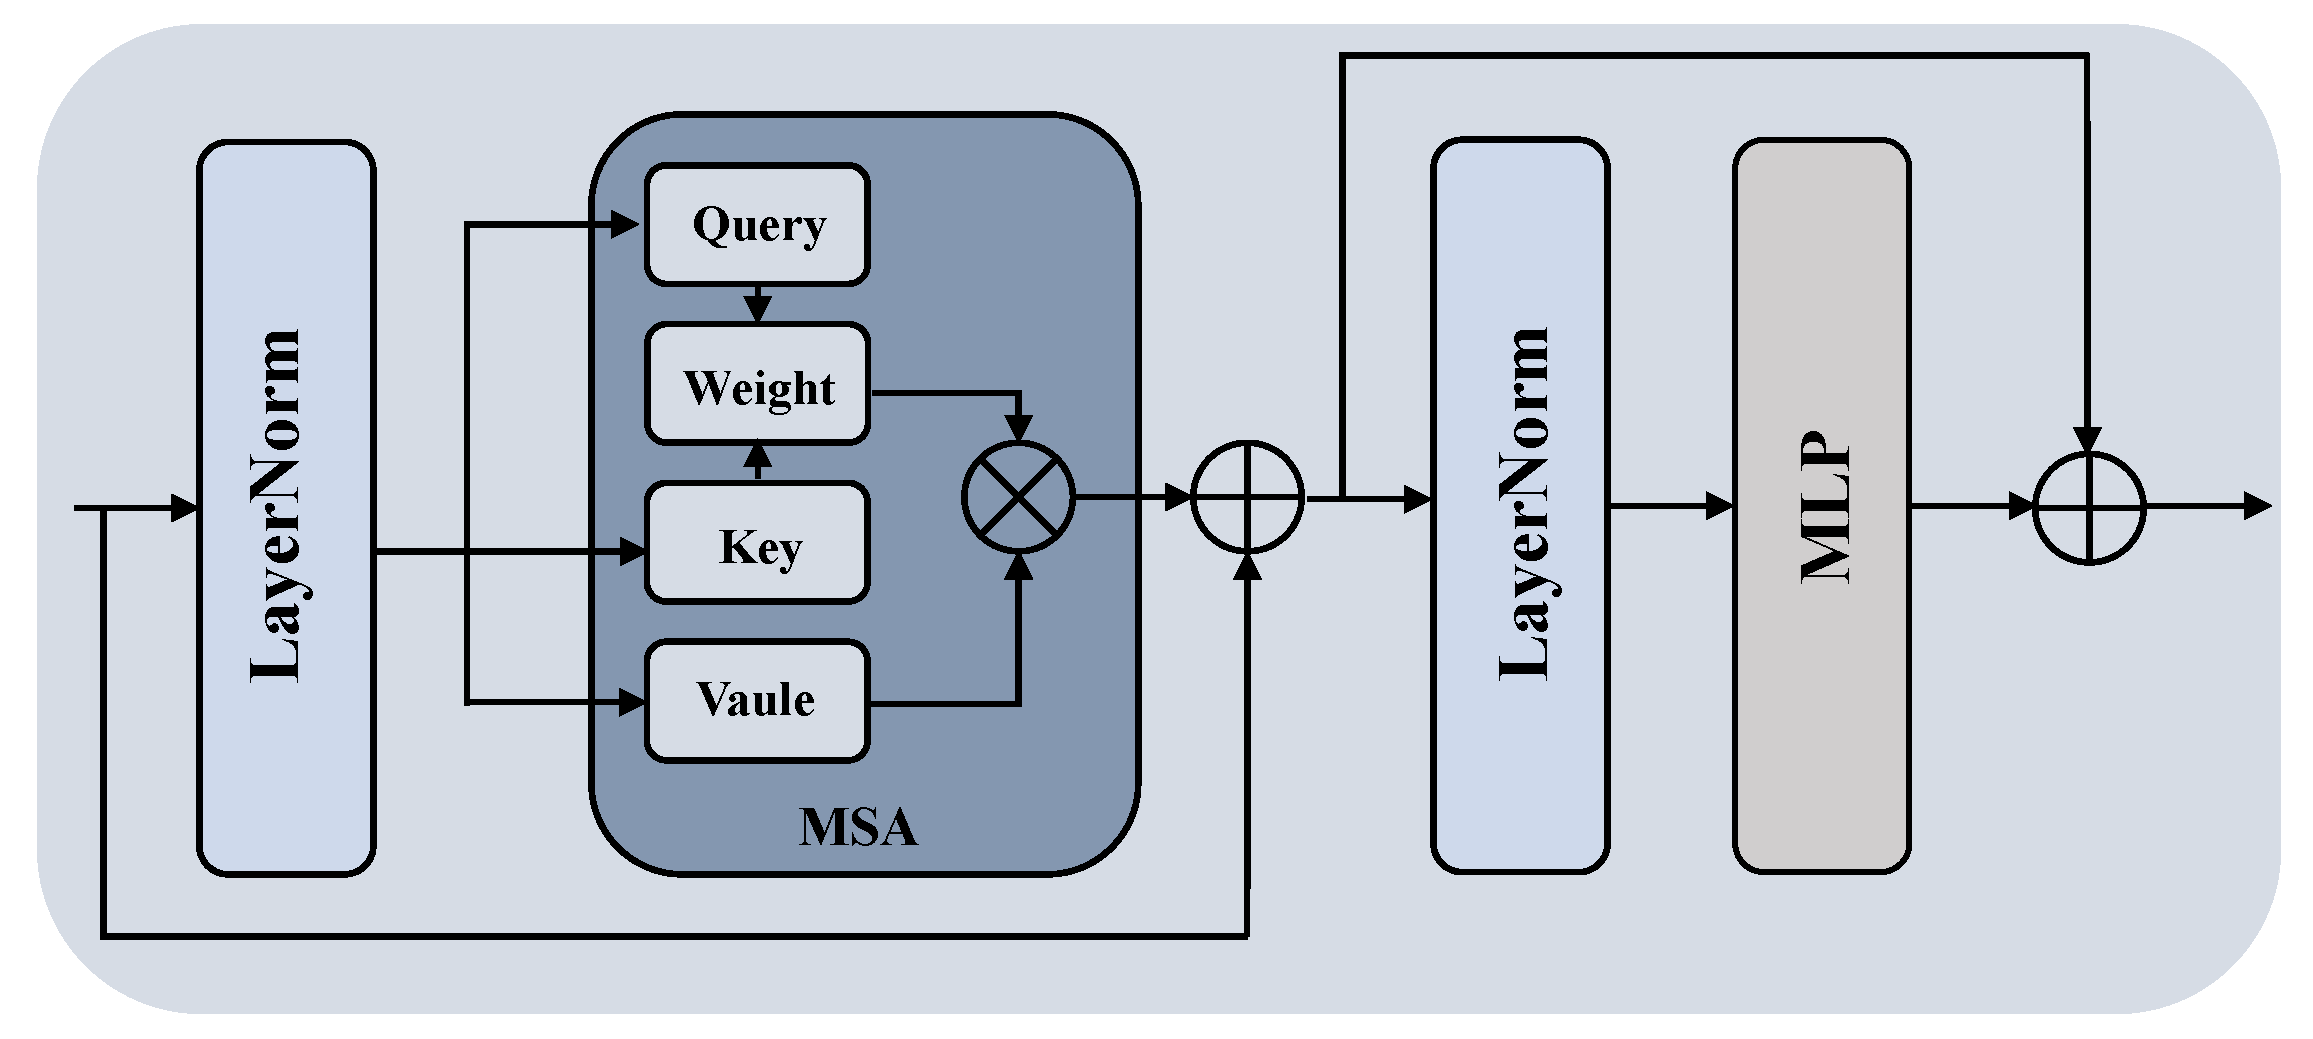
- A VIT image encoder. The VIT excels in capturing global features compared to traditional CNNs. The VIT leverages the self-attention mechanism, enabling features at each position to interact globally with other positions. This enables our method to effectively grasp the overall contextual information within the image, rather than solely focusing on local intricacies.
- LoRA. This is a low-rank adaptation method proposed by Microsoft, which compresses feature maps to lower dimensions and then reflects them to the original dimension, thereby reducing the computational overhead.
2.2.2. VIT Image Encoder
2.2.3. LoRA
2.3. SA-Gate
2.4. Decoder
2.5. Loss Function
2.6. Quantitative Analysis
3. Results
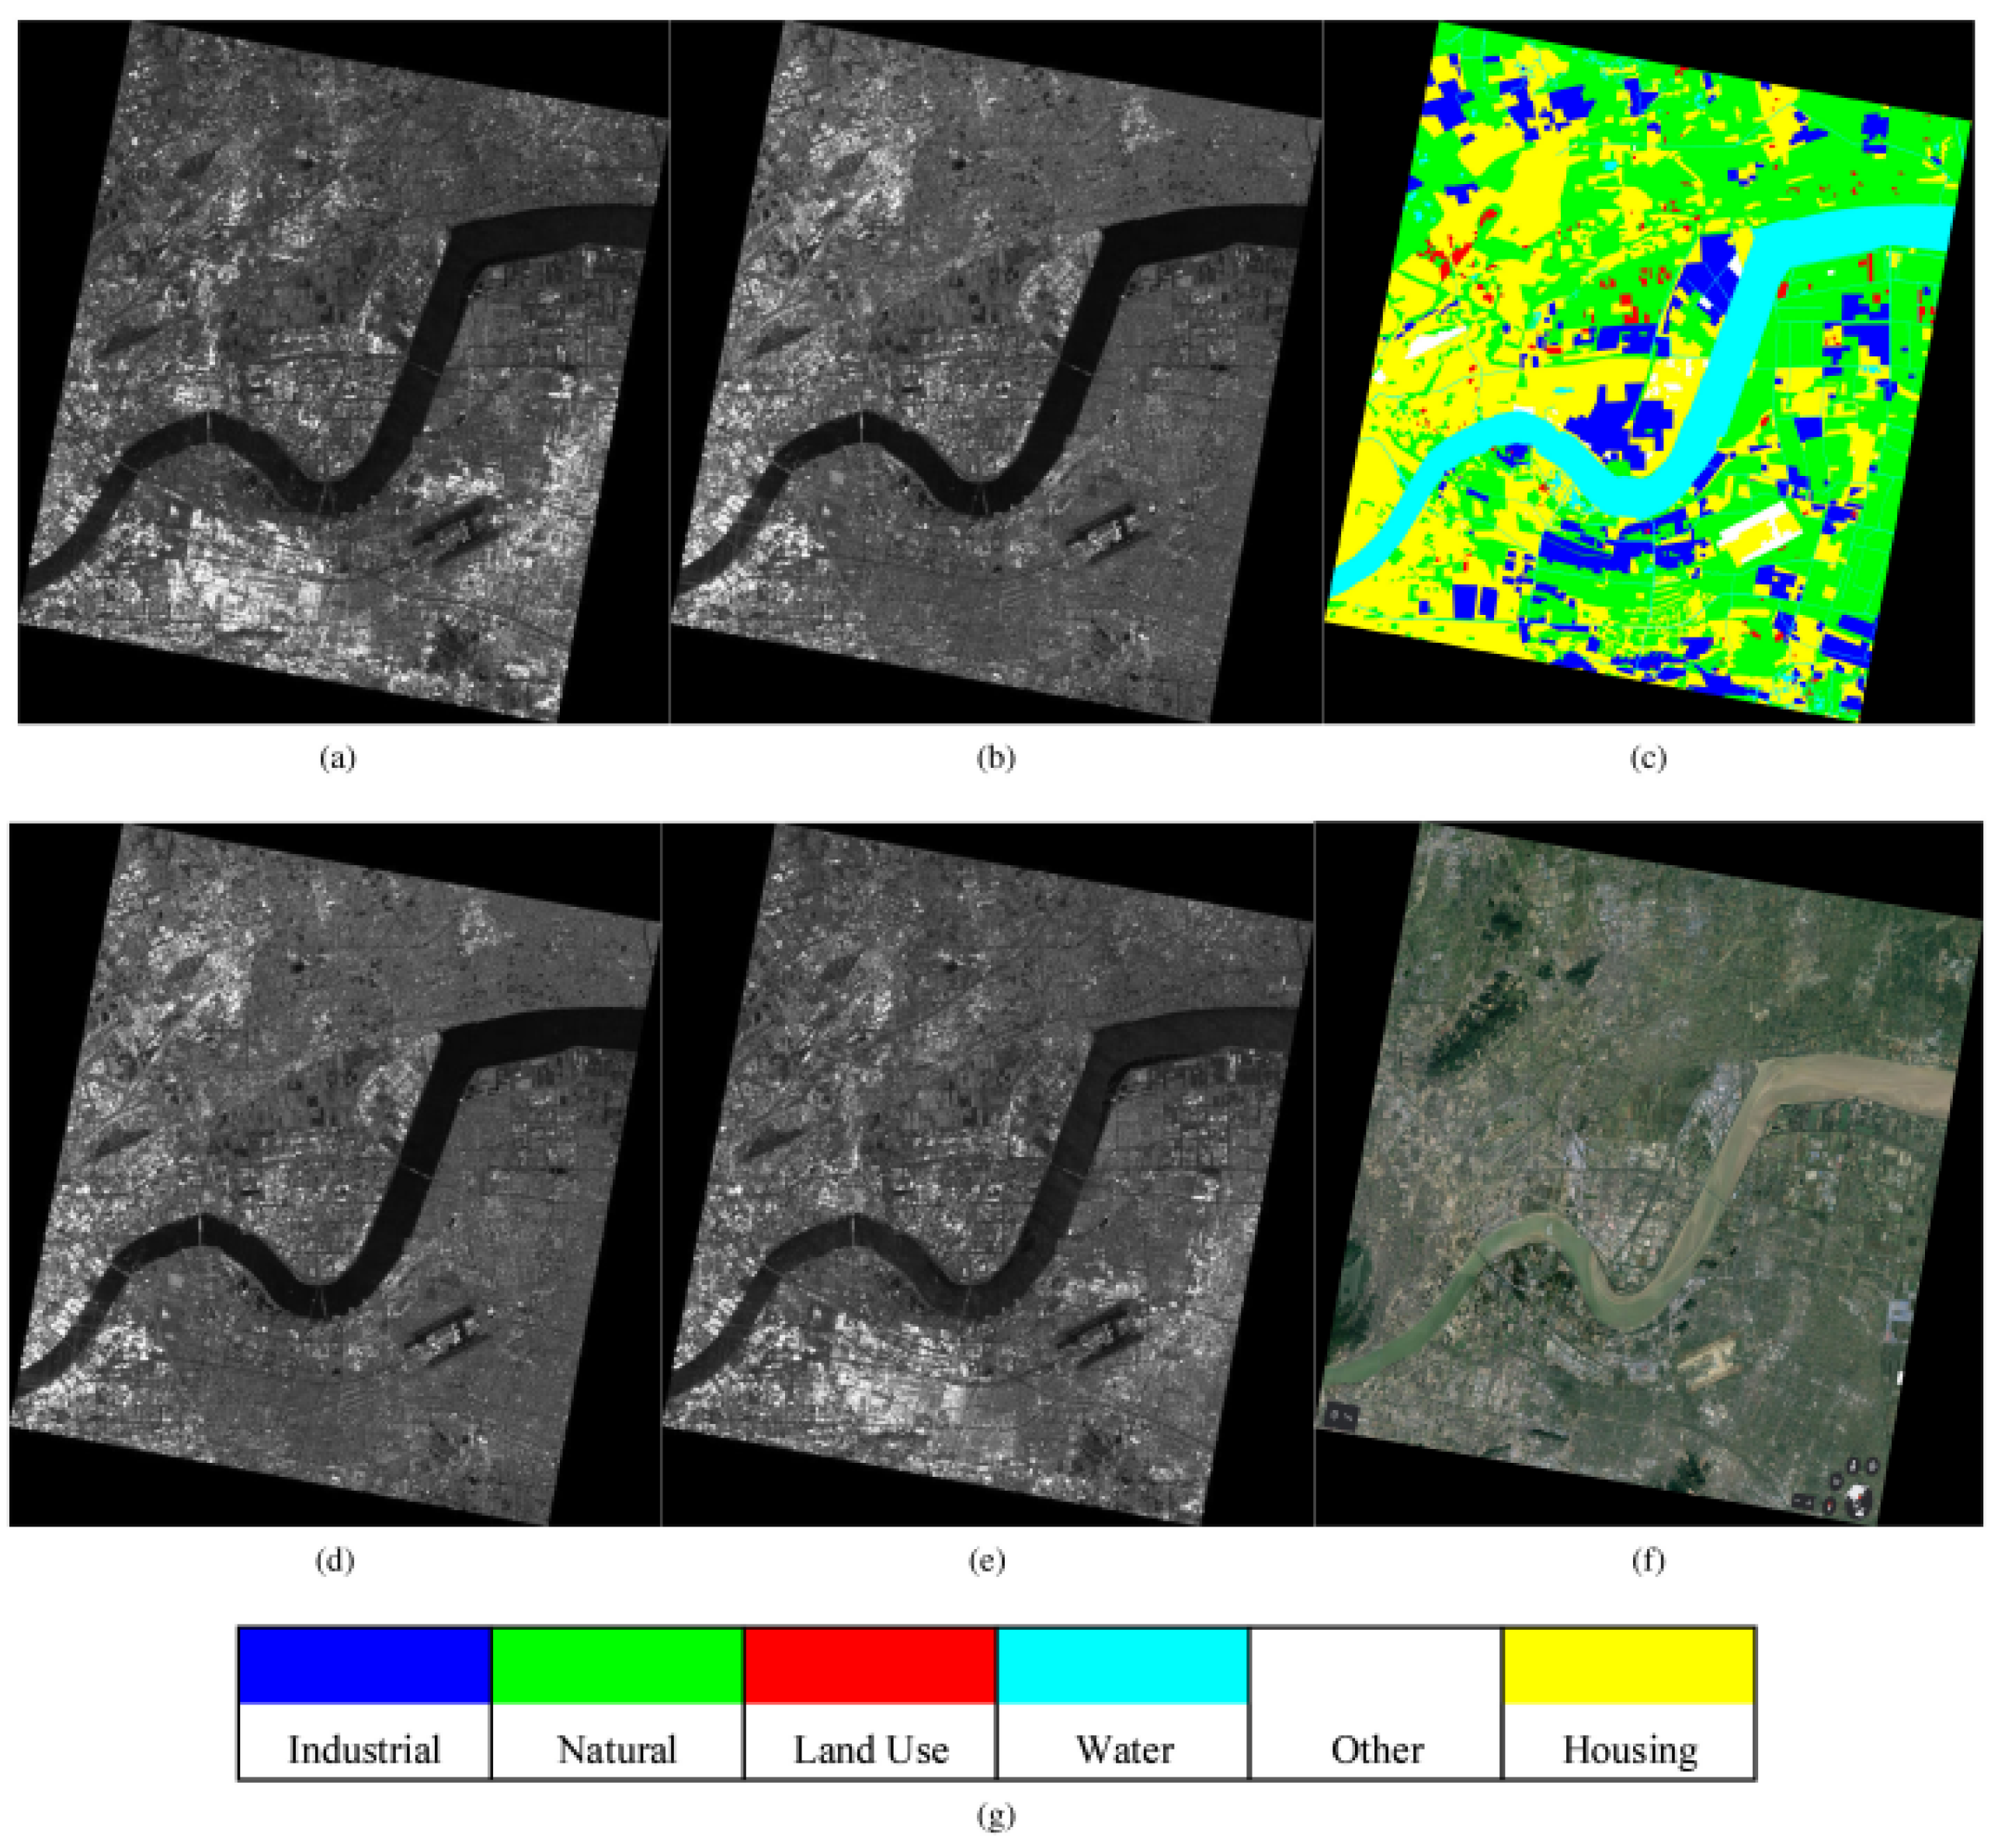
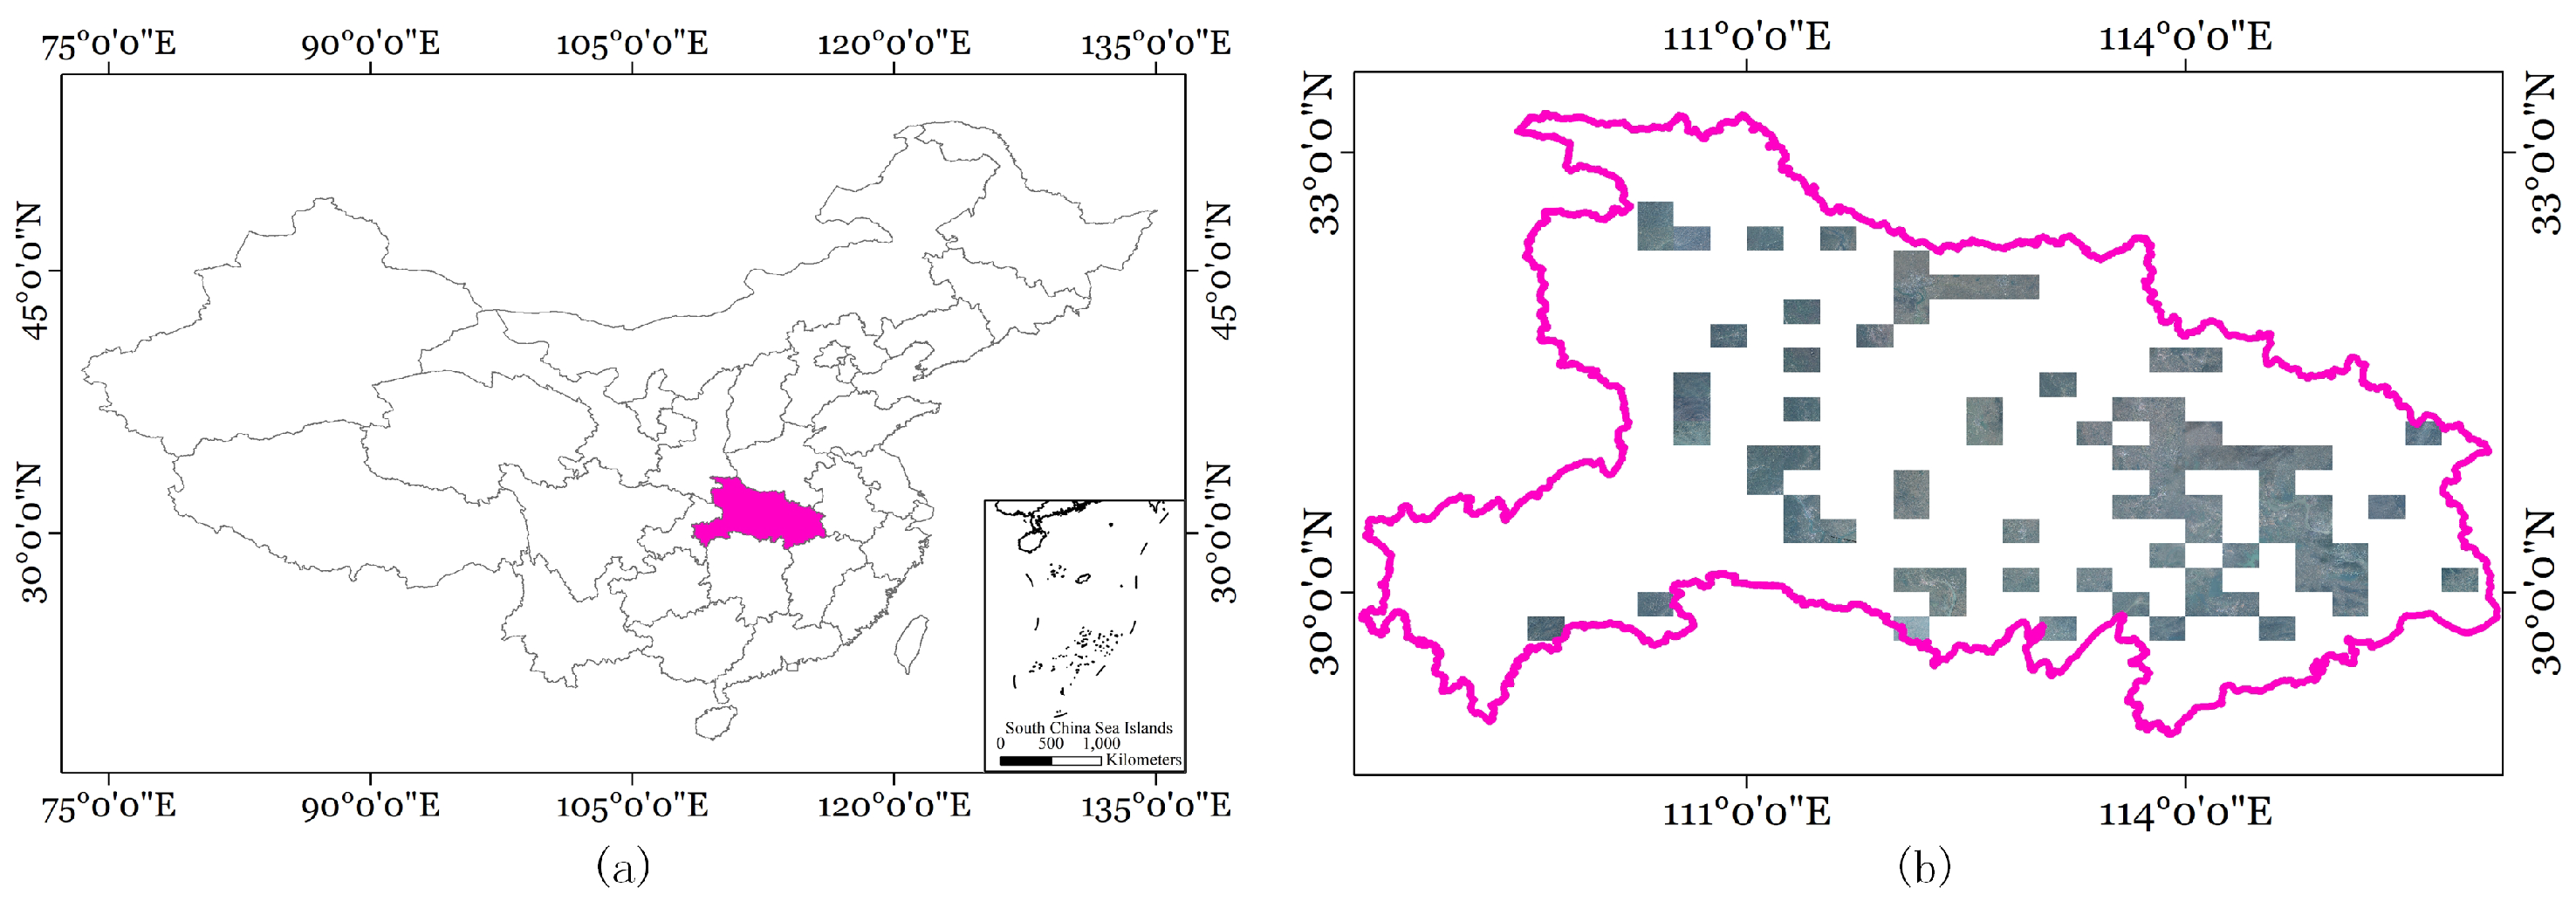
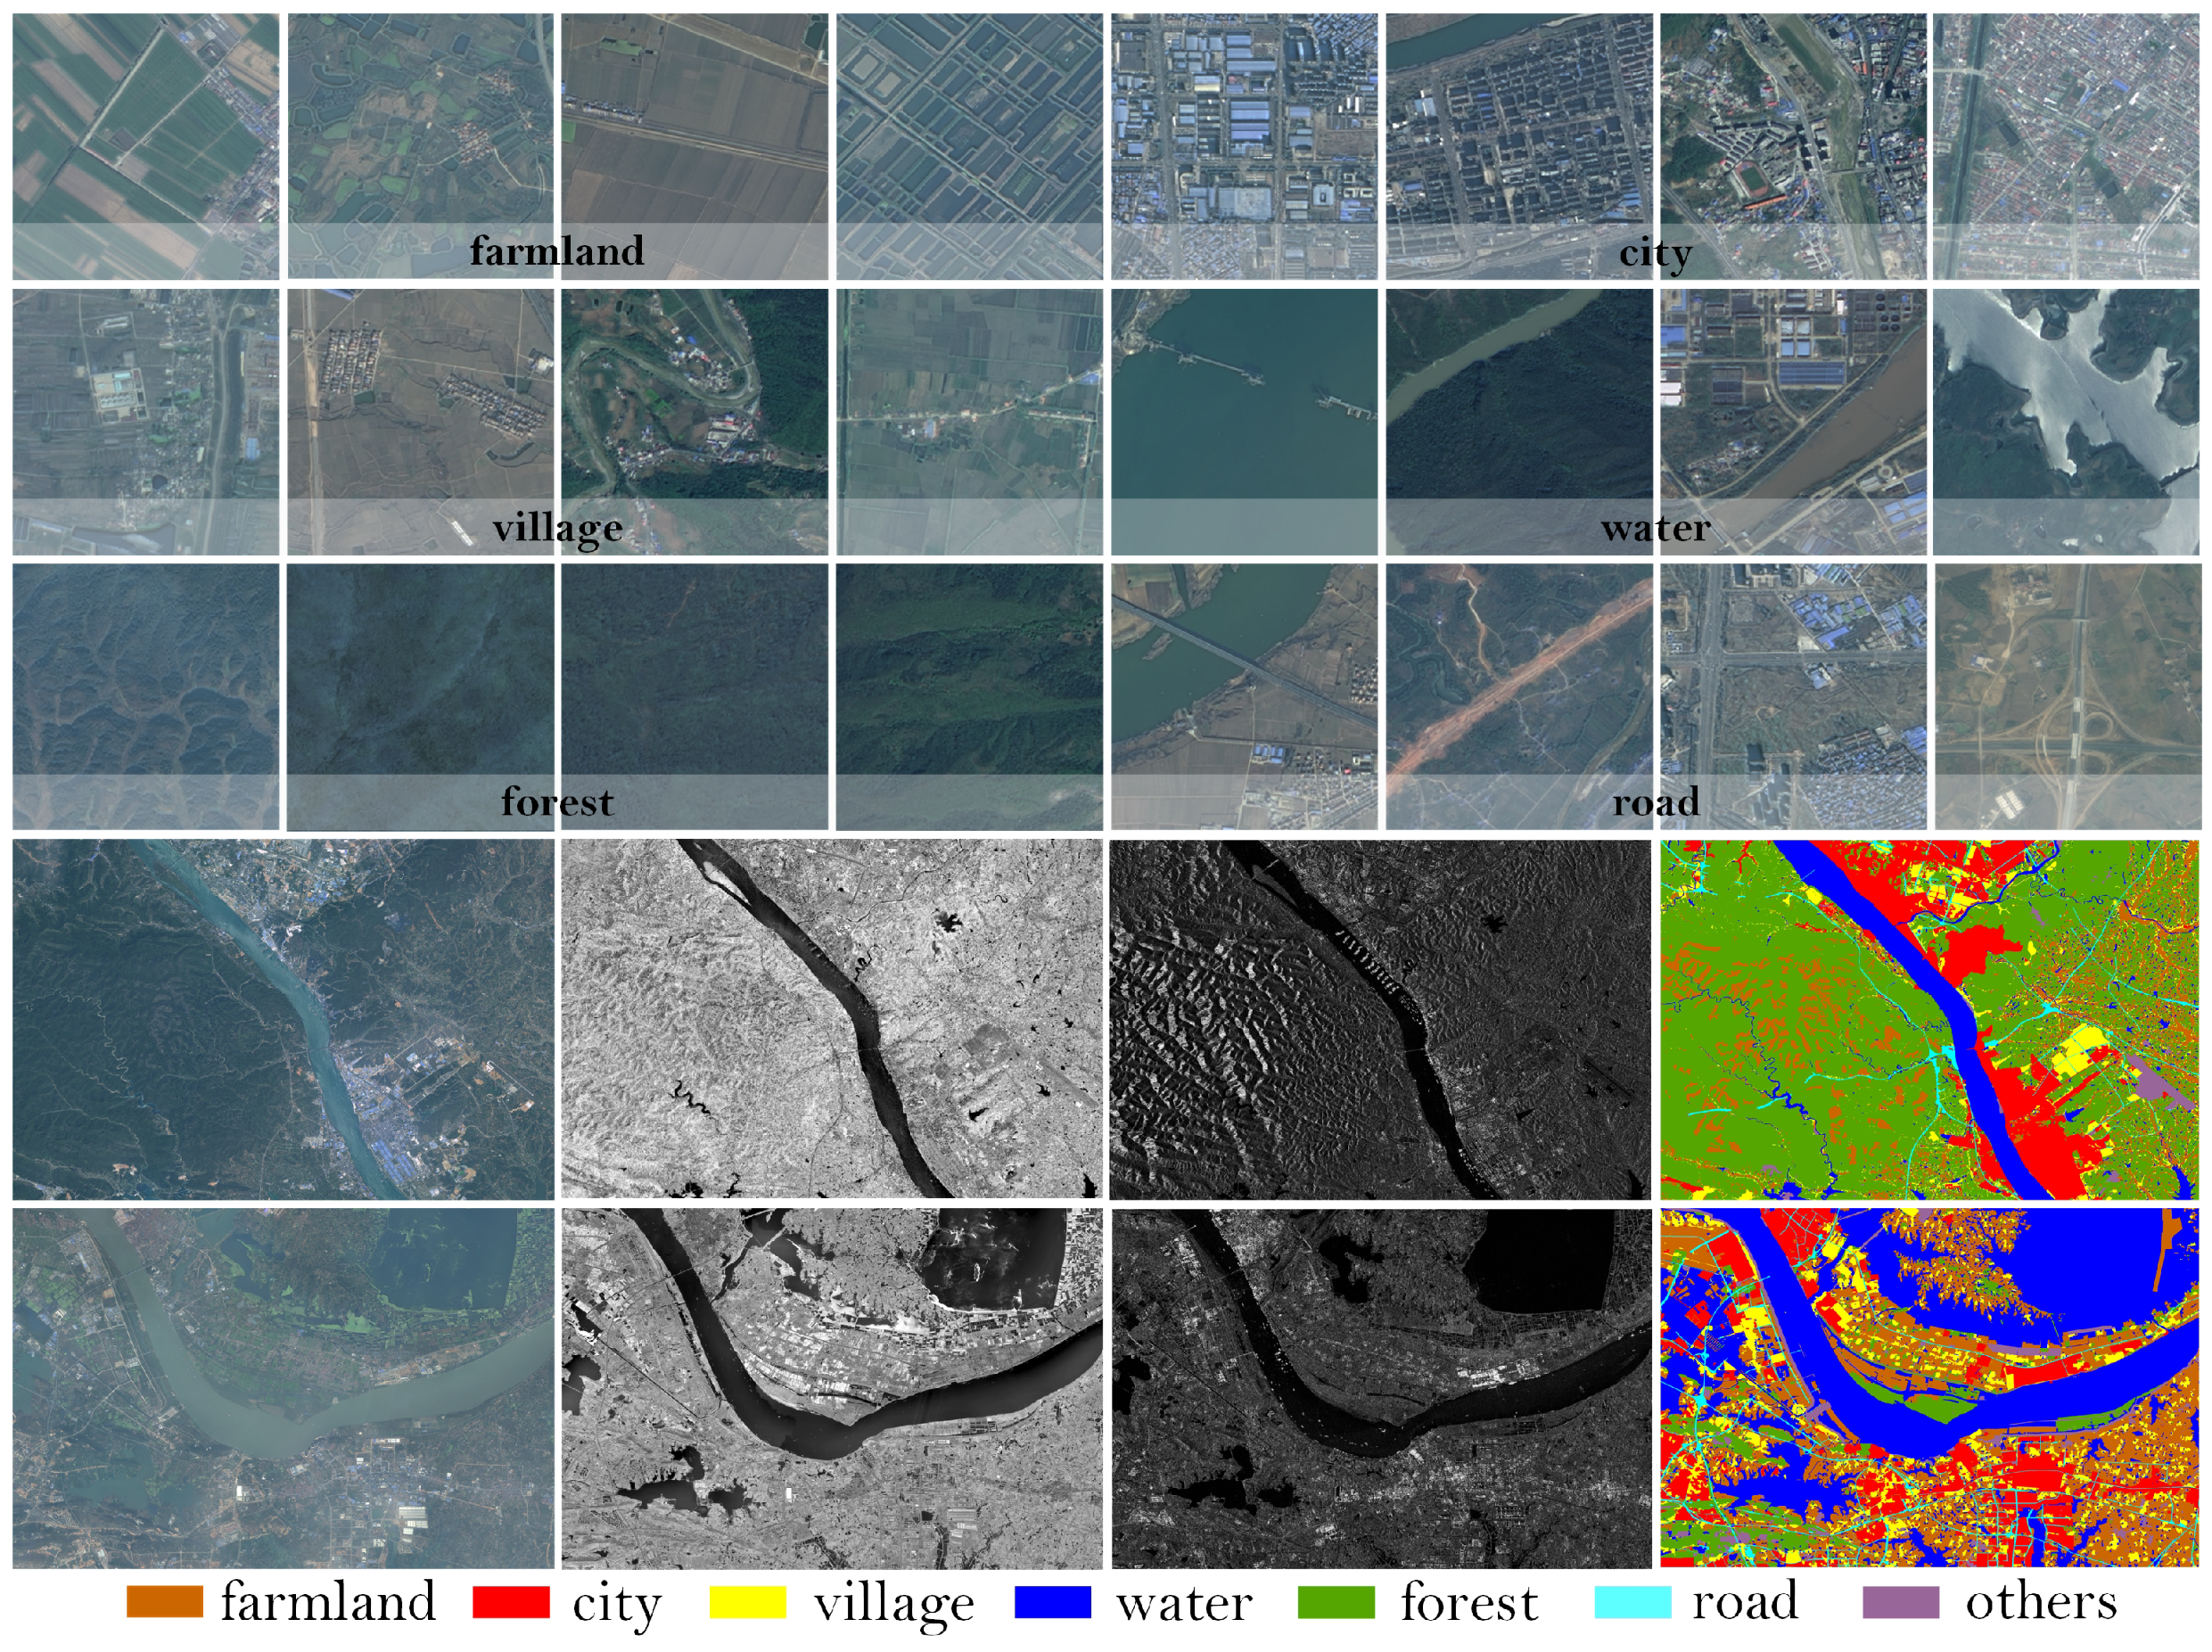
3.1. Training Settings and Data Description
3.2. Land Cover Classification Experiments
3.2.1. Comparative Baselines
- SwinUnet [37]: This method utilizes a Unet-inspired pure transformer for medical image segmentation. It incorporates image patches into a U-shaped encoder–decoder architecture based on transformers, enabling the acquisition of local–global semantic features.
- SegNet [38]: A comprehensive fully convolutional neural network structure, consisting of an encoder network paired with a decoder network; the architecture culminates in a layer to classify. SegNet introduces a noteworthy innovation by employing upsampling in its decoder to handle lower-resolution input feature maps.
- TransUnet [39]: A method that merits both transformers and U-Net, called TransUnet. The transformer processes input sequences derived from CNN-encoded feature maps for global context extraction. Simultaneously, the decoder upscales the encoded features and integrates them with high-resolution CNN feature maps to attain accurate segmentation.
- DANet [40]: This approach employs a dual-stream network, extracting features independently from SAR and optical images. It models semantic interdependencies on both spatial and channel dimensions by attaching two types of attention modules to the expanded fully convolutional network (FCN).
- EncNet [41]: An approach that captures the semantic context of the scene by introducing a context encoding module and selectively highlighting feature maps dependent on the class dependencies.
- Deeplabv3 [42]: A DeepLabv3 network with an encoder–decoder structure is proposed. DeepLabv3 is utilized for encoding rich contextual information, and a simple, effective decoder is employed to recover object boundaries.
- UnetFormer [43]: The method proposed a transformer-based decoder featuring an efficient global–local attention mechanism known as the global–local transformer block (GLTB), tailored for real-time urban scene segmentation.
- LSKNet [44]: The method proposed a rotating frame target detection algorithm for remote sensing images. This algorithm dynamically adjusts its large spatial sensing field to better model scenarios for ranging various objects in remote sensing scenes.
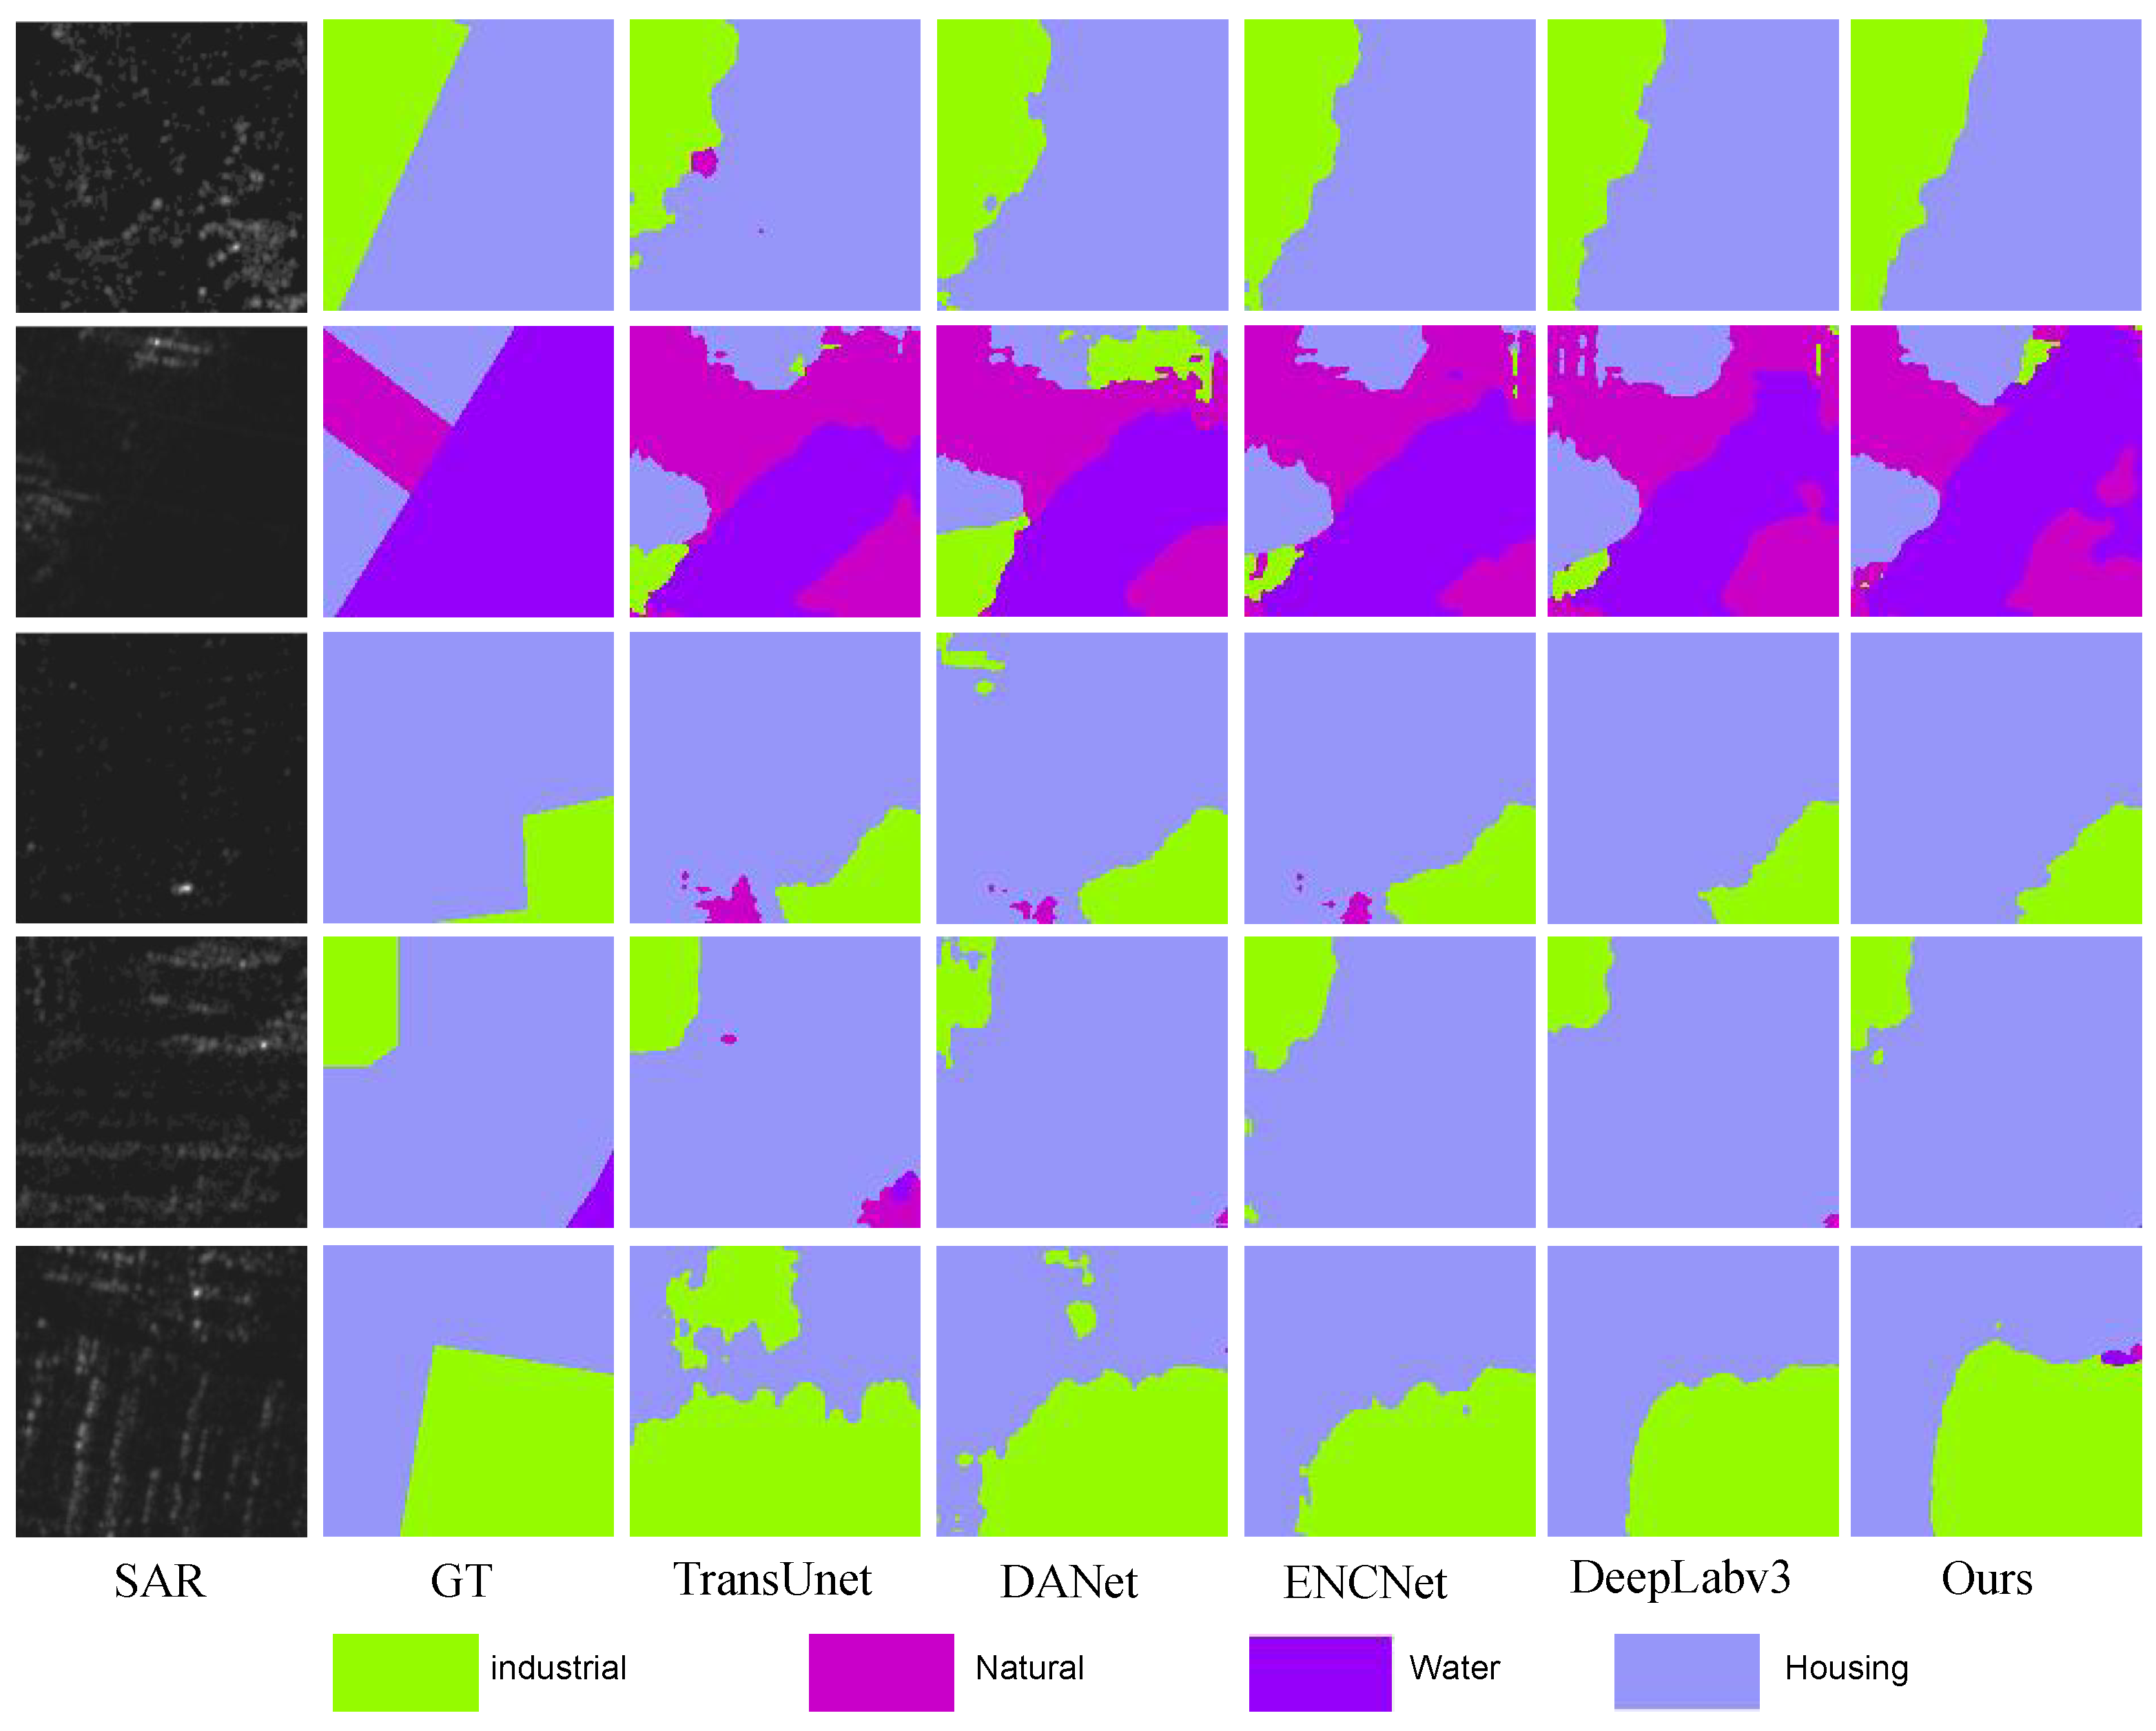
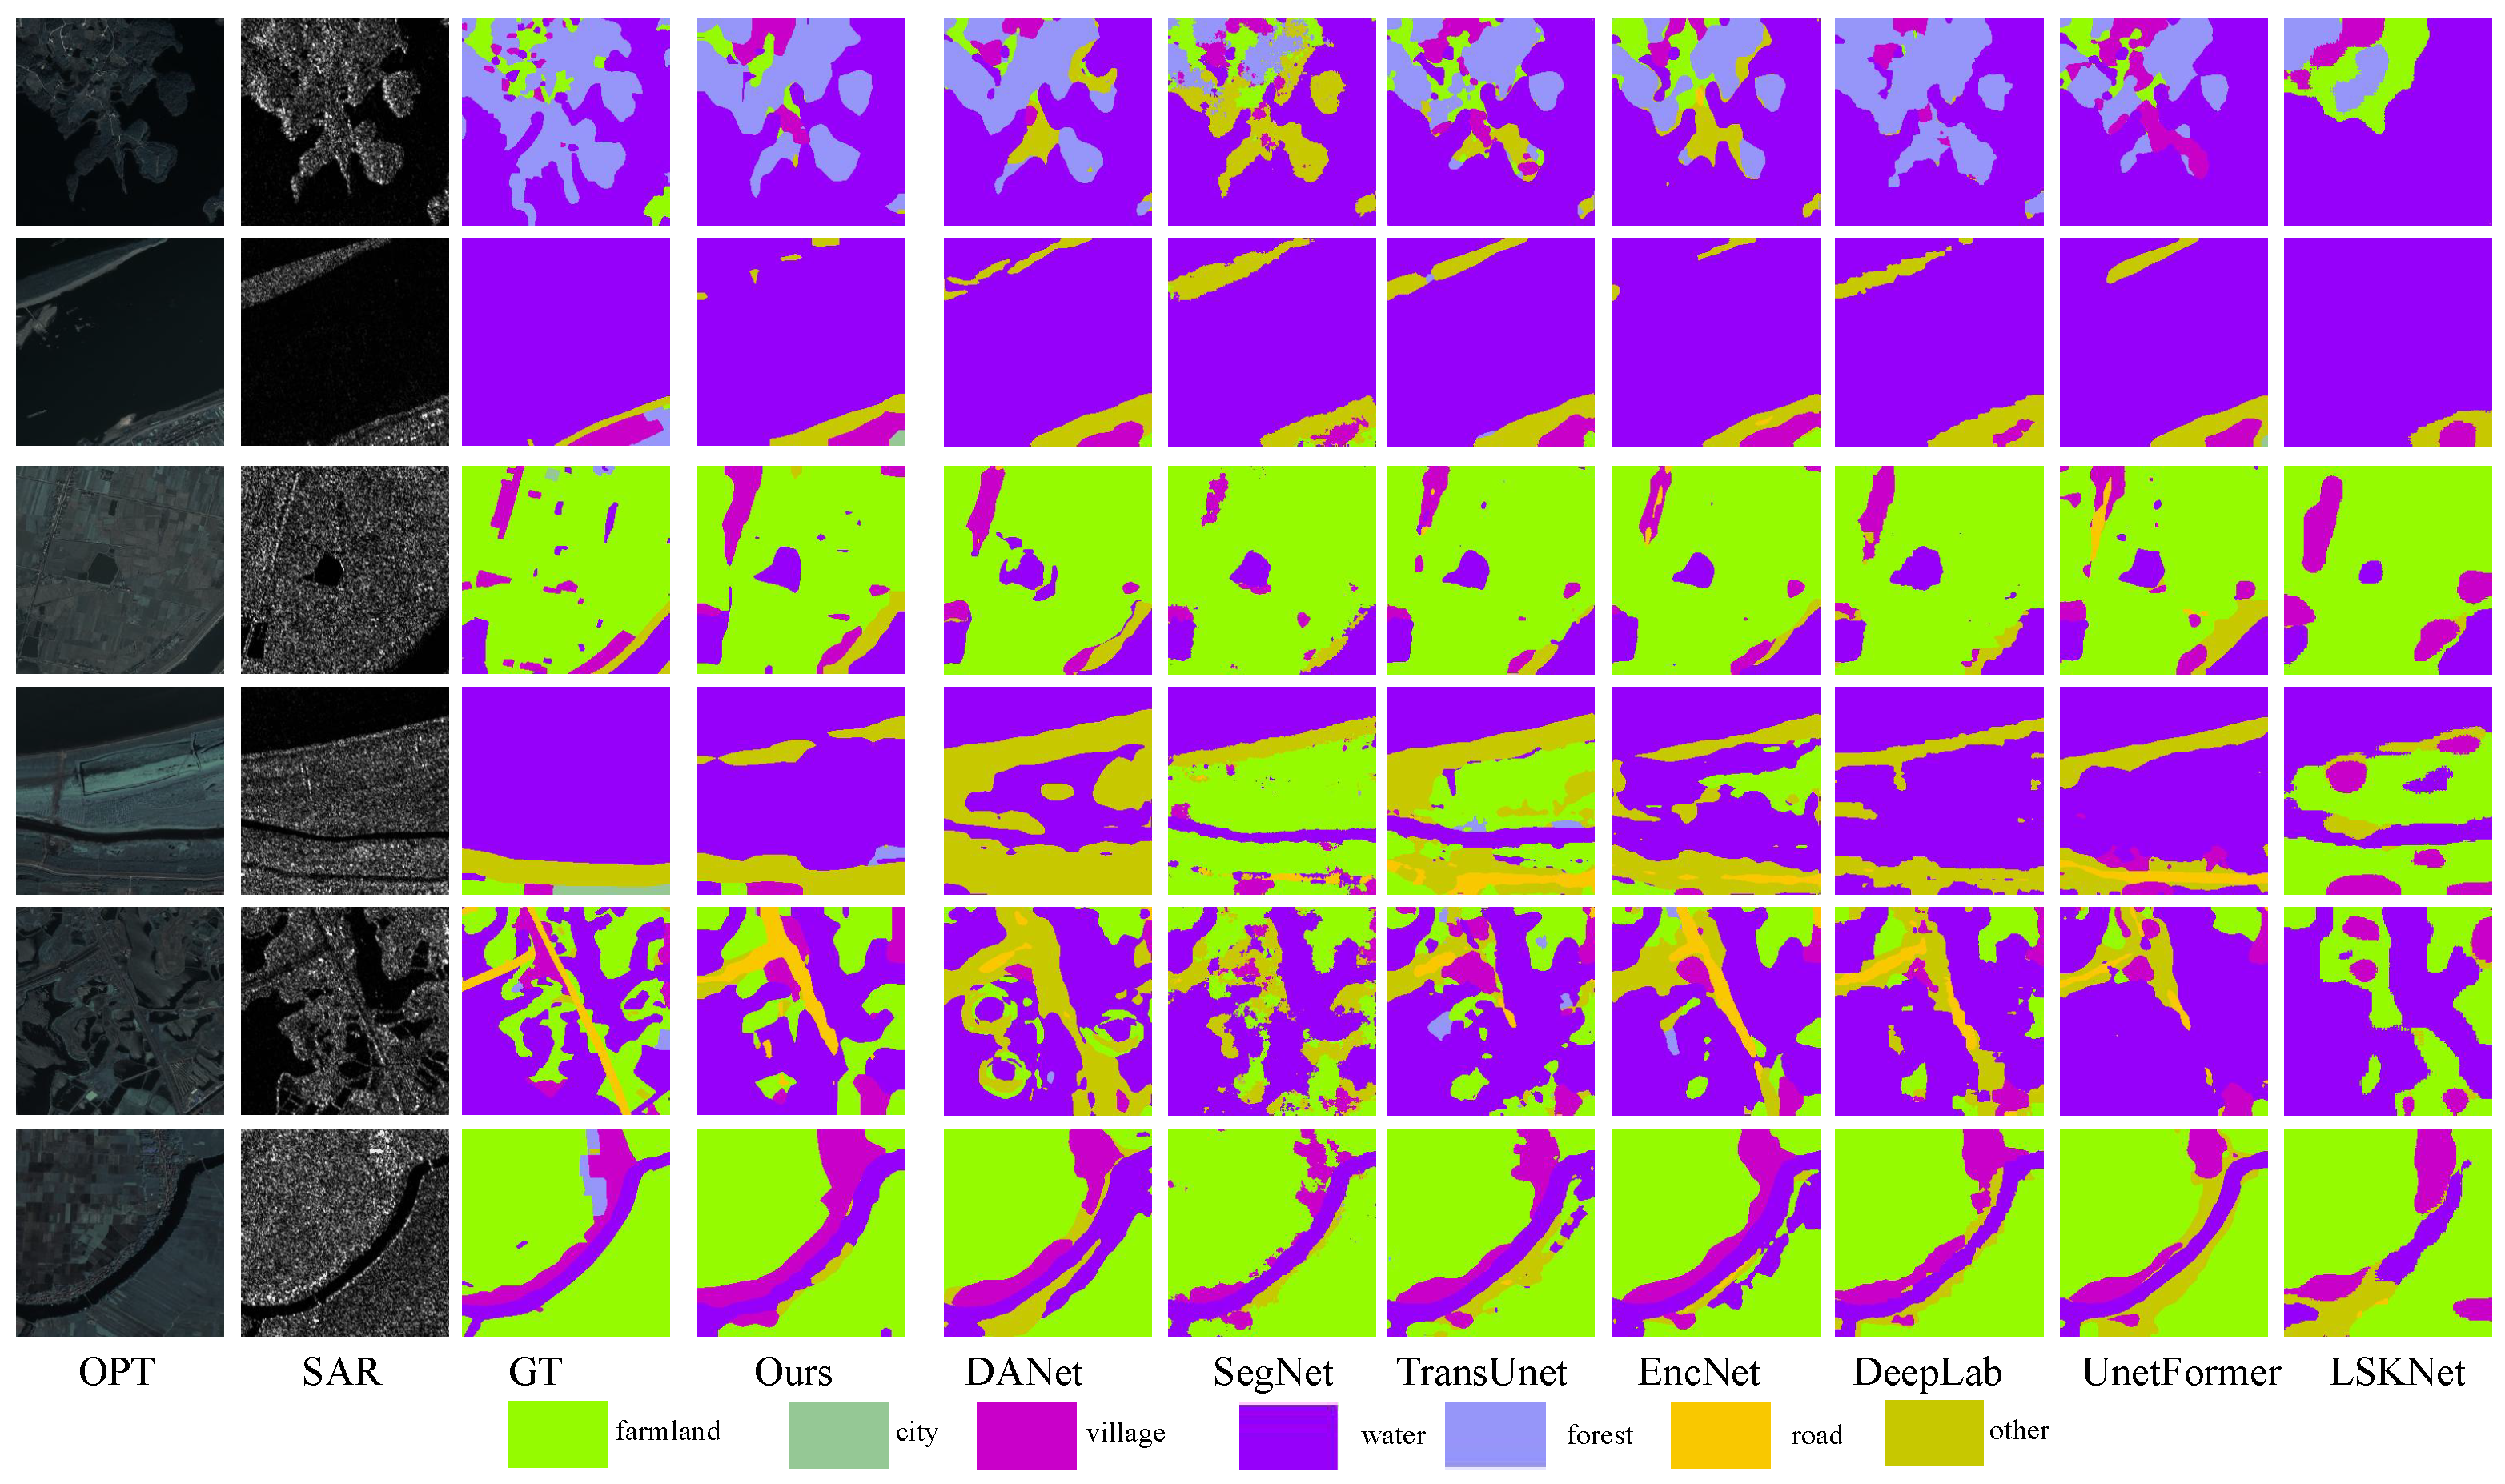
3.2.2. Comparison Experiments
3.2.3. Ablation Analysis
4. Discussion
5. Conclusions
Author Contributions
Funding
Data Availability Statement
Acknowledgments
Conflicts of Interest
References
- Letsoin, S.M.A.; Herak, D.; Purwestri, R.C. Evaluation Land Use Cover Changes over 29 Years in Papua Province of Indonesia Using Remote Sensing Data. IOP Conf. Ser. Earth Environ. Sci. 2022, 1034, 012013. [Google Scholar] [CrossRef]
- Dahhani, S.; Raji, M.; Hakdaoui, M.; Lhissou, R. Land cover mapping using sentinel-1 time-series data and machine-learning classifiers in agricultural sub-saharan landscape. Remote Sens. 2022, 15, 65. [Google Scholar] [CrossRef]
- Gómez, C.; White, J.C.; Wulder, M.A. Optical remotely sensed time series data for land cover classification: A review. ISPRS J. Photogramm. Remote Sens. 2016, 116, 55–72. [Google Scholar] [CrossRef]
- Xu, S.; Qi, Z.; Li, X.; Yeh, A.G.O. Investigation of the effect of the incidence angle on land cover classification using fully polarimetric SAR images. Int. J. Remote Sens. 2019, 40, 1576–1593. [Google Scholar] [CrossRef]
- Xie, C.; Zhang, X.; Zhuang, L.; Han, W.; Zheng, Y.; Chen, K. Classification of polarimetric SAR imagery based on improved MRF model using Wishart distance and category confidence-degree. In Proceedings of the 2023 IEEE International Radar Conference (RADAR), Sydney, Australia, 6–10 November 2023; pp. 1–4. [Google Scholar]
- Chaudhari, N.; Mitra, S.K.; Mandal, S.; Chirakkal, S.; Putrevu, D.; Misra, A. Edge-Preserving classification of polarimetric SAR images using Wishart distribution and conditional random field. Int. J. Remote Sens. 2022, 43, 2134–2155. [Google Scholar] [CrossRef]
- Montanaro, A.; Valsesia, D.; Fracastoro, G.; Magli, E. Semi-supervised learning for joint SAR and multispectral land cover classification. IEEE Geosci. Remote Sens. Lett. 2022, 19, 2506305. [Google Scholar] [CrossRef]
- Kang, W.; Xiang, Y.; Wang, F.; You, H. CFNet: A cross fusion network for joint land cover classification using optical and SAR images. IEEE J. Sel. Top. Appl. Earth Obs. Remote Sens. 2022, 15, 1562–1574. [Google Scholar] [CrossRef]
- Ghanbari, M.; Xu, L.; Clausi, D.A. Local and global spatial information for land cover semi-supervised classification of complex polarimetric SAR data. IEEE J. Sel. Top. Appl. Earth Obs. Remote Sens. 2023, 16, 3892–3904. [Google Scholar] [CrossRef]
- Wu, Y.; Ji, K.; Yu, W.; Su, Y. Region-based classification of polarimetric SAR images using Wishart MRF. IEEE Geosci. Remote Sens. Lett. 2008, 5, 668–672. [Google Scholar] [CrossRef]
- Mishra, P.; Singh, D.; Yamaguchi, Y. Land cover classification of PALSAR images by knowledge based decision tree classifier and supervised classifiers based on SAR observables. Prog. Electromagn. Res. B 2011, 30, 47–70. [Google Scholar] [CrossRef]
- Zhou, Y.; Wang, H.; Xu, F.; Jin, Y.Q. Polarimetric SAR Image Classification Using Deep Convolutional Neural Networks. IEEE Geosci. Remote Sens. Lett. 2016, 13, 1935–1939. [Google Scholar] [CrossRef]
- Mei, S.; Ji, J.; Hou, J.; Li, X.; Du, Q. Learning sensor-specific spatial-spectral features of hyperspectral images via convolutional neural networks. IEEE Trans. Geosci. Remote Sens. 2017, 55, 4520–4533. [Google Scholar] [CrossRef]
- Kavran, D.; Mongus, D.; Žalik, B.; Lukač, N. Graph Neural Network-Based Method of Spatiotemporal Land Cover Mapping Using Satellite Imagery. Sensors 2023, 23, 6648. [Google Scholar] [CrossRef] [PubMed]
- Zhao, W.; Peng, S.; Chen, J.; Peng, R. Contextual-Aware Land Cover Classification with U-Shaped Object Graph Neural Network. IEEE Geosci. Remote Sens. Lett. 2022, 19, 6510705. [Google Scholar] [CrossRef]
- Fang, Z.; Zhang, G.; Dai, Q.; Xue, B.; Wang, P. Hybrid Attention-Based Encoder–Decoder Fully Convolutional Network for PolSAR Image Classification. Remote Sens. 2023, 15, 526. [Google Scholar] [CrossRef]
- Ronneberger, O.; Fischer, P.; Brox, T. U-net: Convolutional networks for biomedical image segmentation. In Proceedings of the Medical Image Computing and Computer-Assisted Intervention—MICCAI 2015: 18th International Conference, Munich, Germany, 5–9 October 2015; pp. 234–241. [Google Scholar]
- Vaswani, A.; Shazeer, N.; Parmar, N.; Uszkoreit, J.; Jones, L.; Gomez, A.N.; Kaiser, L.; Polosukhin, I. Attention is all you need. In Proceedings of the Advances in Neural Information Processing Systems, Long Beach, CA, USA, 4–9 December 2017. [Google Scholar]
- Dong, H.; Zhang, L.; Zou, B. Exploring Vision Transformers for Polarimetric SAR Image Classification. IEEE Trans. Geosci. Remote Sens. 2022, 60, 5219715. [Google Scholar] [CrossRef]
- Wang, H.; Xing, C.; Yin, J.; Yang, J. Land cover classification for polarimetric SAR images based on vision transformer. Remote Sens. 2022, 14, 4656. [Google Scholar] [CrossRef]
- He, K.; Chen, X.; Xie, S.; Li, Y.; Dollár, P.; Girshick, R. Masked autoencoders are scalable vision learners. In Proceedings of the IEEE/CVF Conference on Computer Vision and Pattern Recognition, New Orleans, LA, USA, 18–24 June 2022; pp. 16000–16009. [Google Scholar]
- Liu, Z.; Mao, H.; Wu, C.-Y.; Feichtenhofer, C.; Darrell, T.; Xie, S. A convnet for the 2020s. In Proceedings of the IEEE/CVF Conference on Computer Vision and Pattern Recognition, New Orleans, LA, USA, 18–24 June 2022; pp. 11976–11986. [Google Scholar]
- Kirillov, A.; Mintun, E.; Ravi, N.; Mao, H.; Rolland, C.; Gustafson, L.; Xiao, T.; Whitehead, S.; Berg, A.C.; Lo, W.-Y.; et al. Segment anything. arXiv 2023, arXiv:2304.02643. [Google Scholar]
- Hu, E.J.; Shen, Y.; Wallis, P.; Allen-Zhu, Z.; Li, Y.; Wang, S.; Wang, L.; Chen, W. Lora: Low-rank adaptation of large language models. arXiv 2021, arXiv:2106.09685. [Google Scholar]
- Chen, X.; Lin, K.Y.; Wang, J.; Wu, W.; Qian, C.; Li, H.; Zeng, G. Bi-directional cross-modality feature propagation with separation-and-aggregation gate for RGB-D semantic segmentation. In Proceedings of the European Conference on Computer Vision, Online, 23–28 August 2020; pp. 561–577. [Google Scholar]
- Xu, F.; Shi, Y.; Ebel, P.; Yu, L.; Xia, G.S.; Yang, W.; Zhu, X.X. GLF-CR: SAR-enhanced cloud removal with global–local fusion. ISPRS J. Photogramm. Remote Sens. 2022, 192, 268–278. [Google Scholar] [CrossRef]
- He, K.; Zhang, X.; Ren, S.; Sun, J. Deep residual learning for image recognition. In Proceedings of the IEEE Conference on Computer Vision and Pattern Recognition, Las Vegas, NV, USA, 27–30 June 2016; pp. 770–778. [Google Scholar]
- Chollet, F. Deep learning with depthwise separable convolutions. In Proceedings of the CVPR, Honolulu, HI, USA, 21–26 July 2017. [Google Scholar]
- Ba, J.L.; Kiros, J.R.; Hinton, G.E. Layer normalization. arXiv 2016, arXiv:1607.06450. [Google Scholar]
- Wu, Z.; Jiang, X. Extraction of pine wilt disease regions using UAV RGB imagery and improved mask R-CNN models fused with ConvNeXt. Forests 2023, 14, 1672. [Google Scholar] [CrossRef]
- Hendrycks, D.; Gimpel, K. Gaussian error linear units (gelus). arXiv 2016, arXiv:1606.08415. [Google Scholar]
- Nair, V.; Hinton, G.E. Rectified linear units improve restricted boltzmann machines. In Proceedings of the ICML, Haifa, Israel, 21–24 June 2010. [Google Scholar]
- Zhang, K.; Liu, D. Customized segment anything model for medical image segmentation. arXiv 2023, arXiv:2304.13785. [Google Scholar]
- Dozat, T. Incorporating Nesterov Momentum into Adam. 2016. Available online: https://openreview.net/forum?id=OM0jvwB8jIp57ZJjtNEZ (accessed on 7 February 2024).
- Wang, Z.; Zeng, X.; Yan, Z.; Kang, J.; Sun, X. AIR-PolSAR-Seg: A large-scale data set for terrain segmentation in complex-scene PolSAR images. IEEE J. Sel. Top. Appl. Earth Obs. Remote Sens. 2022, 15, 3830–3841. [Google Scholar] [CrossRef]
- Li, X.; Zhang, G.; Cui, H.; Hou, S.; Wang, S.; Li, X.; Chen, Y.; Li, Z.; Zhang, L. MCANet: A joint semantic segmentation framework of optical and SAR images for land use classification. Int. J. Appl. Earth Obs. Geoinf. 2022, 106, 102638. [Google Scholar] [CrossRef]
- Cao, H.; Wang, Y.; Chen, J.; Jiang, D.; Zhang, X.; Tian, Q.; Wang, M. Swin-unet: Unet-like pure transformer for medical image segmentation. In Proceedings of the European Conference on Computer Vision, Tel Aviv, Israel, 23–27 October 2022; pp. 205–218. [Google Scholar]
- Badrinarayanan, V.; Kendall, A.; Cipolla, R. Segnet: A deep convolutional encoder-decoder architecture for image segmentation. IEEE Trans. Pattern Anal. Mach. Intell. 2017, 39, 2481–2495. [Google Scholar] [CrossRef] [PubMed]
- Chen, J.; Lu, Y.; Yu, Q.; Luo, X.; Adeli, E.; Wang, Y.; Lu, L.; Yuille, A.L.; Zhou, Y. Transunet: Transformers make strong encoders for medical image segmentation. arXiv 2021, arXiv:2102.04306. [Google Scholar]
- Fu, J.; Liu, J.; Tian, H.; Li, Y.; Bao, Y.; Fang, Z.; Lu, H. Dual attention network for scene segmentation. In Proceedings of the IEEE/CVF Conference on Computer Vision and Pattern Recognition, Long Beach, CA, USA, 15–20 June 2019; pp. 3146–3154. [Google Scholar]
- Zhang, H.; Dana, K.; Shi, J.; Zhang, Z.; Wang, X.; Tyagi, A.; Agrawal, A. Context encoding for semantic segmentation. In Proceedings of the IEEE conference on Computer Vision and Pattern Recognition, Salt Lake City, UT, USA, 18–23 June 2018; pp. 7151–7160. [Google Scholar]
- Chen, L.; Zhu, Y.; Papandreou, G.; Schroff, F.; Adam, H. Encoder-decoder with atrous separable convolution for semantic image segmentation. In Proceedings of the European Conference on Computer Vision (ECCV), Munich, Germany, 8–14 September 2018; pp. 801–818. [Google Scholar]
- Wang, L.; Li, R.; Zhang, C.; Fang, S.; Duan, C.; Meng, X.; Atkinson, P. UNetFormer: A UNet-like transformer for efficient semantic segmentation of remote sensing urban scene imagery. ISPRS J. Photogramm. Remote Sens. 2022, 190, 196–214. [Google Scholar] [CrossRef]
- Li, Y.; Hou, Q.; Zheng, Z.; Cheng, M.-M.; Yang, J.; Li, X. Large selective kernel network for remote sensing object detection. In Proceedings of the IEEE/CVF International Conference on Computer Vision, Paris, France, 1–6 October 2023; pp. 16794–16805. [Google Scholar]


| Method | OA | Kappa | mIou | F1 | Iou | |||
|---|---|---|---|---|---|---|---|---|
| Industrial | Natural | Water | Housing | |||||
| SwinUnet | 43.49 | 26.37 | 32.40 | 43.32 | 13.21 | 5.8 | 73.44 | 37.14 |
| LSKNet | 45.97 | 25.91 | 35.88 | 44.77 | 33.36 | 1.6 | 86.13 | 22.45 |
| SegNet | 52.25 | 33.30 | 41.57 | 51.85 | 32.57 | 0.64 | 83.28 | 49.78 |
| UnetFormer | 61.02 | 49.43 | 49.35 | 59.95 | 36.49 | 6.61 | 81.89 | 72.42 |
| TransUnet | 68.67 | 51.26 | 47.32 | 58.38 | 58.22 | 2.5 | 77.73 | 50.81 |
| DANet | 70.84 | 58.21 | 53.23 | 62.35 | 55.61 | 3.21 | 95.67 | 58.43 |
| EncNet | 73.92 | 63.32 | 59.20 | 67.90 | 66.67 | 17.18 | 99.05 | 53.92 |
| Deeplabv3 | 70.57 | 59.80 | 56.45 | 69.32 | 65.17 | 14.33 | 85.66 | 60.62 |
| Ours | 75.20 | 63.48 | 58.79 | 69.90 | 64.38 | 20.94 | 99.85 | 50.01 |
| Method | OA | Kappa | mIou | F1 | Iou | ||||||
|---|---|---|---|---|---|---|---|---|---|---|---|
| Farmland | City | Village | Water | Forest | Road | Others | |||||
| SwinU | 70.53 | 57.80 | 34.04 | 45.84 | 56.22 | 30.84 | 32.87 | 32.64 | 77.27 | 6.04 | 2.42 |
| LSKNet | 69.82 | 55.95 | 30.57 | 41.61 | 56.17 | 26.63 | 24.92 | 18.01 | 78.08 | 5.53 | 4.64 |
| SegNet | 73.21 | 60.51 | 36.00 | 48.85 | 59.35 | 29.55 | 36.03 | 27.76 | 77.88 | 15.48 | 5.93 |
| UnetF | 70.54 | 58.65 | 35.65 | 48.21 | 59.84 | 27.41 | 36.26 | 35.19 | 75.33 | 10.08 | 5.46 |
| TransU | 73.40 | 61.87 | 38.09 | 47.28 | 61.22 | 32.49 | 36.15 | 33.01 | 77.82 | 15.63 | 9.88 |
| DANet | 69.18 | 56.82 | 34.31 | 45.04 | 61.09 | 26.41 | 34.62 | 23.71 | 74.61 | 12.82 | 6.92 |
| EncNet | 73.67 | 61.73 | 35.34 | 51.50 | 63.72 | 25.33 | 32.88 | 32.46 | 78.70 | 10.67 | 3.64 |
| Deepl3 | 73.59 | 62.33 | 38.44 | 51.98 | 62.46 | 29.01 | 38.76 | 32.67 | 77.96 | 15.43 | 12.82 |
| Ours | 73.87 | 62.67 | 39.55 | 53.25 | 59.87 | 34.34 | 41.32 | 35.61 | 78.36 | 10.94 | 16.42 |
| VIT | ConvNext | SA-Gate | OA | Kappa | mIou | F1 |
|---|---|---|---|---|---|---|
| ✓ | × | × | 68.50 | 55.00 | 32.60 | 44.78 |
| ✓ | ✓ | × | 71.10 | 58.82 | 35.38 | 49.25 |
| ✓ | ✓ | ✓ | 73.87 | 62.67 | 39.55 | 53.25 |
Disclaimer/Publisher’s Note: The statements, opinions and data contained in all publications are solely those of the individual author(s) and contributor(s) and not of MDPI and/or the editor(s). MDPI and/or the editor(s) disclaim responsibility for any injury to people or property resulting from any ideas, methods, instructions or products referred to in the content. |
© 2024 by the authors. Licensee MDPI, Basel, Switzerland. This article is an open access article distributed under the terms and conditions of the Creative Commons Attribution (CC BY) license (https://creativecommons.org/licenses/by/4.0/).
Share and Cite
Wang, Y.; Zhang, W.; Chen, W.; Chen, C. BSDSNet: Dual-Stream Feature Extraction Network Based on Segment Anything Model for Synthetic Aperture Radar Land Cover Classification. Remote Sens. 2024, 16, 1150. https://doi.org/10.3390/rs16071150
Wang Y, Zhang W, Chen W, Chen C. BSDSNet: Dual-Stream Feature Extraction Network Based on Segment Anything Model for Synthetic Aperture Radar Land Cover Classification. Remote Sensing. 2024; 16(7):1150. https://doi.org/10.3390/rs16071150
Chicago/Turabian StyleWang, Yangyang, Wengang Zhang, Weidong Chen, and Chang Chen. 2024. "BSDSNet: Dual-Stream Feature Extraction Network Based on Segment Anything Model for Synthetic Aperture Radar Land Cover Classification" Remote Sensing 16, no. 7: 1150. https://doi.org/10.3390/rs16071150
APA StyleWang, Y., Zhang, W., Chen, W., & Chen, C. (2024). BSDSNet: Dual-Stream Feature Extraction Network Based on Segment Anything Model for Synthetic Aperture Radar Land Cover Classification. Remote Sensing, 16(7), 1150. https://doi.org/10.3390/rs16071150