Article

Accuracy Evaluation of Ocean Wave Spectra from Sentinel-1 SAR Based on Buoy Observations and ERA5 Data

1
The First Institute of Oceanography, Ministry of Natural Resources, Qingdao 266061, China
2
Technology Innovation Center for Maritime Silk Road Marine Resources and Environment Networked Observation, Ministry of Natural Resources, Qingdao 265800, China
*
Author to whom correspondence should be addressed.
Remote Sens. 2024, 16(6), 987; https://doi.org/10.3390/rs16060987
Submission received: 29 December 2023 / Revised: 5 March 2024 / Accepted: 7 March 2024 / Published: 12 March 2024

Abstract

:
Doppler mis-registrations in azimuth can lead to ocean waves shorter than a specific wavelength being undetectable by SAR. In order to evaluate the actual ocean wave observation ability, the accuracy of Sentinel-1 SAR ocean wave spectra from January 2016 to December 2021 is evaluated by comparisons to NDBC buoys, ERA5 wave height, and CMEMS buoys. The results compared with NDBC show that the spectral shape of Sentinel-1 SAR ocean wave spectra is accurate, while the spectral values need to be improved. The wave spectra of Sentinel-1 have the best observations in season autumn. The comparison results of total wave height show the RMSE and bias are 0.91 m and −0.52 m for the comparisons to NDBC buoy wave spectra data, 0.93 m and −0.68 m for the comparison to ERA5 wave height data, and 0.9 m and −0.35 m for the comparisons to CMEMS buoy data. The comparison results of wave height in different wind speeds and areas shows that the accuracy of Sentinel-1 wave mode data is relatively good in the open ocean located in middle and low latitude area under the medium wind speed, while those are relatively poor in high latitude areas or the areas with excessively high or low wind speed.

Graphical Abstract

1. Introduction

Ocean waves play an important role in affecting the marine environment, ocean-air exchange, ocean engineering and ocean navigation safety. They are a complex random process, mainly including wind waves and swells. Accurate acquisition of wave information is an important foundation for the study on ocean dynamics, which is of great value for understanding and studying of the ocean.
The means of ocean wave observation mainly include field observation and remote sensing observation. The former including buoys, ships and ocean stations that have a precise observation but with a few shortcomings such as spatial-temporal sparse observations, small coverage and high observation cost. Therefore, field observation data especially buoy data is commonly used as reference data to evaluate satellite or model data [1,2]. The latter involves altimeter, synthetic aperture radar (SAR) and ocean wave spectrometer [3], which have the advantages of large-area synchronous observation and fast data update. SAR can obtain the two-dimensional (2D) ocean wave spectra, which have been used in the improvement of numerical simulation accuracy [4], but the ability of SAR to provide usable spectra is limited by the motion of the ocean surface. Doppler misregistration in azimuth is induced by gravity wave orbital motion, leading to a distortion of the imaged spectrum and a strong cut-off in the azimuth direction, and only long waves can be observed [5,6,7]. At present, the standard wave spectra can be obtained from satellites such as Envisat, Sentinel-1A/B and China-France Oceanography Satellite (CFOSAT).
The CFOSAT, which jointly developed by China and France, marks the first international effort to achieve large-scale, high-precision synchronous observation of ocean surface winds and waves. Equipped with the Surface Waves Investigation and Monitoring (SWIM) spectrometer, CFOSAT utilizes a six-beam real aperture radar to continuously measure global ocean wave spectra, providing crucial data for global oceanographic research. Currently, several researchers have conducted data assessments on CFOSAT’s wave spectra. Xu et al. [8] compared CFOSAT’s omni-directional wave spectra and the directional function at peak wave number with NDBC buoys. The results indicate a high consistency between SWIM’s wave spectra at 8° and 10° incidence angles and NDBC data under medium and high sea conditions. Jiang et al. [9] validated SWIM’s partitioned integrated wave parameters with NDBC buoy data, including partitioned significant wave height, partitioned peak wave period, and partitioned peak wave direction. The results show that SWIM performs well at finding the spectral peaks of different partitions while partitioned significant wave height from SWIM is not that good. Hauser et al. [10] globally compared CFOSAT’s wave directional spectra and their mean parameters against wave model data and in-situ data. The results demonstrate that SWIM can provide high-quality wave spectral data within the wavelength range of 70–500 m. Li et al. [11] compared wave spectra obtained from SWIM’s 6°, 8°, 10°, and combined beams with NDBC buoy observations. The results indicate that CFOSAT can retrieve reliable wave frequency spectral forms with a high significant wave height.
Sentinel-1 (represents Sentinel-1A/B satellites in this paper) is one of the earth observation satellites series of European Space Agency (ESA). It is mainly used for emergency response, ocean monitoring, ice monitoring, ground subsidence and interferometric applications such as landslide monitoring [12]. Sentinel-1A/B SAR have an identical operation mode, including Stripmap (SM) mode, Interferometric Wide swath (IW) mode, Extra Wide swath (EW) mode and Wave (WV) mode. Wave mode is a ‘leapfrog’ observation style that used to obtain ocean wave information. Accuracy evaluation of remote sensing data is one of the important steps for the data application. ESA releases the accuracy evaluation report of Sentinel-1 payload status and data products every year. The evaluation results [13] show that the model transfer function (MTF) used for ocean wave inversion underestimates the wave energy under extreme sea states conditions. In addition, the accuracy evaluation of Sentinel-1 wave mode data has also been implemented by some researchers. Khan [14] evaluated the wave height, average wave direction and average wave period of Sentinel-1A wave spectra from July 2015 to May 2020 and Sentinel-1B wave spectra from October 2016 to May 2020. The results show that the wave height and average wave period of Sentinel-1 are in good agreement with WW3 while the accuracy of wave direction is not good. Wang et al. [15] evaluated the accuracy of Sentinel-1A swell data from April 2016 to February 2017 based on WW3. The results show that the overall observation error of Sentinel-1A is low, and the significant wave height (SWH) observed at WV2 angle is higher than that at WV1 with a systematic deviation of 0.22 m. Wang et al. [16] evaluated the accuracy of Sentinel-1 swell segmentation spectra wave height from June 2016 to June 2020 based on the WW3 and NDBC buoy wave spectra data. The results show that the swell wave height error of the Sentinel-1 wave mode is about 0.2 m. However, most of the developed evaluations of the Sentinel-1 wave mode data is based on the wave segmentation spectra and it cannot reflect the actual wave conditions represented by the total wave spectra. Therefore, it is necessary to evaluate the Sentinel-1 total wave spectra data based on the measured data of buoys.
The evaluation of wave spectra of Sentinel-1 in this paper consists of two parts: one part is based on comparisons between Sentinel-1 wave spectra and NDBC buoy one-dimensional wave spectra, and the other part is the evaluation of wave heights integrated from wave spectra of Sentinel-1 based on wave height of NDBC buoys, wave height of buoys collected by the Copernicus Marine Environment Monitoring Service (CMEMS), and ERA5 wave height data. Since the Sentinel-1 wave heights are obtained by integrating wave spectra data, the evaluation of Sentinel-1 wave heights is also an evaluation of Sentinel-1 wave spectra. It is the most comprehensive evaluation that contains evaluation under different wave height ranges, different sea areas, and wind speed conditions. The aim of this evaluation is to guide the use of Sentinel-1 OCN data in scientific research, meeting various application requirements. Section 2 presents the data and methods used in this study. Section 3 presents the accuracy assessment results of Sentinel-1 wave spectra and the conclusions are summarized in Section 4.

2. Data and Methods

2.1. Data

The data used in this study include total wave spectra of Sentinel-1 wave mode data and its’ integrated wave heights, NDBC buoy wave spectra data and its’ integrated wave heights, CMEMS buoy wave height data and ERA5 wave height data. The time span for Sentinel-1A data is from 1 January 2016, to 31 December 2021 while it is from 26 September 2016, to 23 December 2021 for Sentinel-1B data.

2.1.1. Sentinel-1 Wave Mode Data

Sentinel-1A and Sentinel-1B satellites both carry C-band SAR and operate in the same orbit plane with a phase difference of 180°. The Sentinel-1 SAR wave mode is observed alternately along the flight direction at two different incident angles of 23.5° and 36.5°. The distance between two adjacent images is 100 km, and the spatial coverage of the wave mode data is about 20 km × 20 km along with the spatial resolution is 5 m. The wave mode products involve OSW, OWI, and RVL component. This study used OSW component that include wave spectra and wind speed. The OSW component is estimated from Sentinel-1 Level-1 Single-Look Complex (SLC) SAR images by inversion of the corresponding image cross-spectra, and the wind speed data is obtained from the backscattering section based on the CMOD5n model [17]. The OSW component also contains information such as partitioned spectra and its corresponding wave height and wavelength, wind wave height, wind speed and wind direction provided by ECMWF (European Centre for Medium-Range Weather Forecasts), and additional information generated during the inversion of wave spectra. The directional resolution of the ocean wave spectra is 5° and the wavenumber range is 0.005–0.209 rad/m with 60 wavenumber bins in total. An illustration of spatial coverage of Sentinel-1 SAR wave mode data during January 2017 is shown in Figure 1.

2.1.2. NDBC Buoys Ocean Wave Spectra Data

NDBC buoy wave spectra data are the hourly wave spectra measurements provided by the National Data Buoy Center of the United States, including one-dimensional wave spectral density data, main wave direction, average wave direction and other parameters required for wave spectra calculation. The frequency range of the buoy wave spectra is 0.020–0.485 Hz and there are 47 frequency bins in total. The gap between each frequency node is around 0.01 Hz. The acquisition of wave spectra from NDBC buoys first started in the 1990s. This study used the wave spectra data of 40 buoys from 2016 to 2021. These buoys are mainly distributed in the northern Pacific Ocean, the east and west coasts of the United States, the Hawaii region, and the Atlantic Ocean. The distribution locations are shown in Figure 2.

2.1.3. CMEMS Buoys Wave Height Data

CMEMS buoy wave height data is provided by the Copernicus Marine Environmental Monitoring Service Center, including drifting buoy data, moored buoy data, sail drone data and tide gauge station data, among which the moored buoy can provide abundant significant wave height, maximum wave height, zero-crossing average wave height and other data. This study used the significant wave height of moored buoys with a wide time range and high observation frequency. The time range of partial buoys is more than 40 years, and the observation frequency includes 30 min, 1 h, 3 h, etc. The buoy data provided by CMEMS comes from many departments and agencies such as the National Data Buoy Center (NDBC), the National Institute of Ocean Technology (NIOT, India), the Scripps Institution of Oceanography, and the Fisheries and Oceans Canada. This study used 115 CMEMS buoys, including 68 NDBC buoys. These buoys are mainly distributed in the Pacific Ocean and the Atlantic Ocean, and a small number of buoys are distributed in the Indian Ocean. The distribution locations are shown in Figure 1.

2.1.4. ERA5 Data

ERA5 [18] is the fifth generation ECMWF atmospheric reanalysis data set of the global climate, which covering the period from January 1940 to present that combines a huge number of historical observations such as remote sensing data into an advanced modeling and data assimilation systems [19]. ERA5 replaces the ERA-Interim reanalysis which stopped being produced on 31 August 2019 and provides hourly estimates of a large number of atmospheric, land and oceanic climate variables. An evaluation of ERA5 wave height data was implemented and the results show that the ERA5 wave height data has a good agreement with the NDBC in-situ observations [20]. The SWH data of ERA5 that has a spatial resolution of 0.5° collected hourly during 2021 was used to evaluate the Sentinel-1 wave height in this study.

2.2. Methods

The accuracy evaluation of Sentinel-1 spectra mainly includes spatial-temporal matching, spectra, and wave height evaluation.

2.2.1. Spatial-Temporal Matching

Spatial-temporal matching represents matching the Sentinel-1 wave spectra and reference data that meets a certain space and time interval window size. In this study, the wave spectra evaluation and the wave height evaluation of Sentinel-1 wave mode used different spatial and temporal windows. According to the physical characteristics described by the wave spectra and the observation frequency of NDBC buoys (observation once every hour), the spatial windows of Sentinel-1 wave spectra accuracy evaluation are selected as 0.1° and 0.2°, and the time window is selected as 30 min. Considering the spatial resolution of hourly ERA5 wave height data used in this study is 0.5°, the spatial window of the evaluation between Senitnel-1 wave height and ERA5 wave height is 0.25° with a time window of 30 min. Since the Sentinel-1 wave mode has no observation data near the shore [21] and for the purpose of enough matching data to represent the observation accuracy of the Sentinel-1 wave mode, the spatial window of Sentinel-1 wave height accuracy evaluation based on NDBC and CMEMS buoys is selected as 0.5° along with the time window is 30 min. In addition, data of wave heights larger than 12 m were removed during the spatial-temporal matching process due to the significant uncertainty, and the evaluation based on wave heights exceeding 12 m is not reliable.

2.2.2. Accuracy Evaluation of Sentinel-1 Ocean Wave Spectra

Since the two-dimensional ocean wave spectra cannot be observed by NDBC buoys directly and the one-dimensional spectra can be acquired. This study integrated the Sentinel-1 2D ocean wave spectra into Sentinel-1 one-dimensional spectra and therefore the evaluation of Sentinel-1 2D wave spectra are realized by comparing the integrated 1D wave spectra with the NDBC buoy 1D wave spectra. The 2D wave spectra of Sentinel-1 wave mode is discretized into 60 wavenumber bins and 72 directional bins. The 2D frequency spectra, 1D frequency spectra and significant wave height can be calculated from the 2D wavenumber spectra. This study firstly converted the 2D wavenumber spectra of Sentinel-1 wave mode into 2D frequency spectra and then performed integration with respect to direction to obtain Sentinel-1 1D wave spectrum. The calculation formula are as follows.
F f = 0 2 π F k , θ k f k 1 d θ
where F ( k , θ ) is 2D wavenumber spectra, F f is 1D frequency spectra.
The observation frequency range and frequency nodes are different between Sentinel-1 1D wave spectra and NDBC 1D wave spectra: the frequency range of Sentinel-1 is around 0.03–0.23 Hz and 60 frequency nodes in total and the frequency range of NDBC is around 0.02–0.48 Hz and 47 frequency nodes in total. Therefore, it is necessary to interpolate the NDBC buoy wave spectra data to the frequency node of the Sentinel-1 wave spectra. The accuracy of the Sentinel-1 2D wave spectra are evaluated by comparing the spectral shape and spectral value of the 1D wave spectra. The CORR can represent the similarity of the 1D wave spectra between Sentinel-1 and NDBC buoys, and the MR can represent the spectral value similarity between Sentinel-1 and NDBC buoy 1D wave spectra. The calculation formula of CORR and MR are as follows.
C O R R = j = 1 m f s a r j f s a r ¯ f b u o y j f b u o y ¯ j = 1 m f s a r j f s a r ¯ 2 i = 1 m f b u o y j f b u o y ¯ 2
M r = j = 1 m f s a r j f b u o y j j = 1 m f b u o y j
where, m is the number of frequency nodes of Sentinel-1 spectra, and f b u o y ( j ) are the spectral value of the jth frequency node of Sentinel-1 and NDBC buoys 1D spectra respectively, f s a r ¯ and f b u o y ¯ are the average of 1D spectra value of Sentinel-1 and NDBC buoys respectively.

2.2.3. Accuracy Evaluation of Sentinel-1 Wave Height

The wave height calculated by NDBC buoys ocean wave spectra and the wave height of CMEMS buoys and ERA5 are used to evaluate the wave height of Sentinel-1. Both the wave height of NDBC buoys and Sentinel-1 are obtained by integrating the 1D ocean wave spectra separately according to the following expression.
S W H = 4 f 1 f 2 F f d f
where, F ( f ) is the 1D ocean wave spectra, S W H is the wave height, f 1 and f 2 are the minimum and maximum frequency of ocean wave spectra. The statistical parameters namely bias, root mean square error (RMSE), correlation coefficient (R) and divergence (SI) are used to evaluate the accuracy of wave height.
b i a s = 1 n i = 1 n ( x i y i )
R M S E = 1 n i = 1 n ( x i y i ) 2
R = i = 1 n x i x ¯ y i y ¯ i = 1 n x i x ¯ 2 i = 1 n y i y ¯ 2
S I = 1 n i = 1 n x i x ¯ ( y i y ¯ ) 2 y ¯
where n means the number of matching points, x i and y i mean the ith Sentinel-1 and buoy wave height data, respectively, x ¯ and y ¯ means the average value of all Sentinel-1 and buoy wave height data, respectively.

3. Results

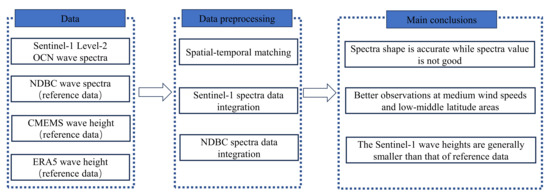
The accuracy of Sentinel-1 ocean wave spectra is evaluated by the NDBC buoys wave spectra data, ERA5 wave height data and CMEMS buoys wave height data. The evaluation of the Sentinel-1 wave spectra is based on NDBC buoys ocean wave spectra, and the evaluation of wave height is based on NDBC buoys spectra wave height, ERA5 wave height and CMEMS buoys wave height. Since the Sentinel-1 wave heights are obtained by integrating wave spectra data, the evaluation of Sentinel-1 wave heights is also an evaluation of Sentinel-1 wave spectra.

3.1. The Evaluation of Sentinel-1 Ocean Wave Spectra Based on NDBC Wave Spectra

According to the methods of spatial-temporal matching and wave spectra evaluation introduced in Section 2.2.1 and 
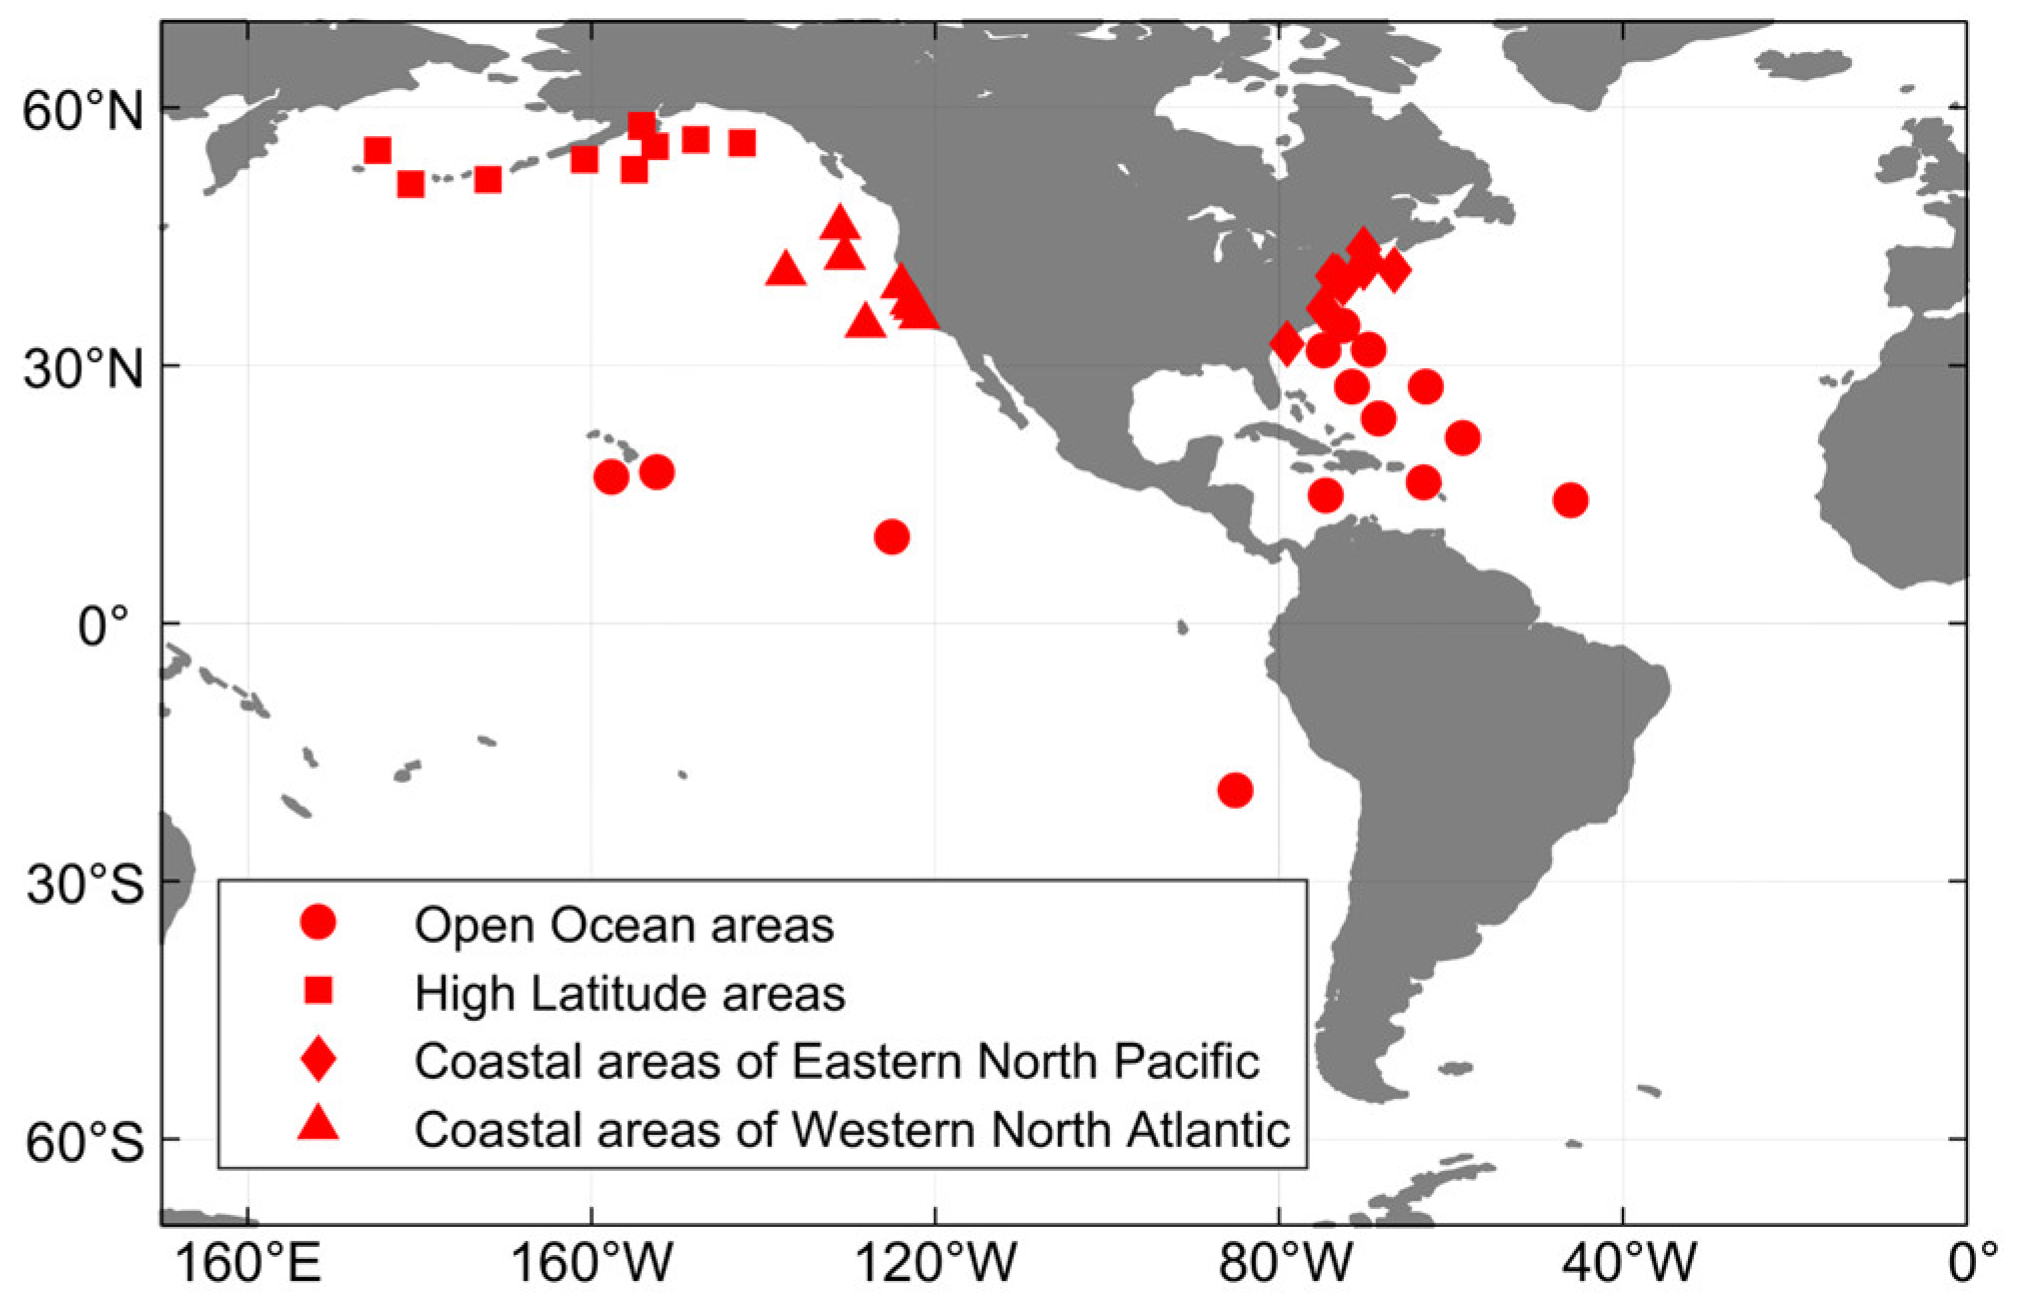
Section 2.2.2, the Sentinel-1 wave spectra evaluation is implemented based on the NDBC wave spectra. In order to analyze the impact of the size of the spatial windows on the evaluation results, two spatial windows of 0.1° and 0.2° are selected for analysis. There are 171 pairs of matching points in the 0.1° window and 406 matching points in the 0.2° window. The comparison results of one-dimensional wave spectra between Sentinel-1 and No. 41046 buoy at different times are shown in Figure 3. Since the observation frequencies of Sentinel-1 and NDBC buoys are different (The frequency range of NDBC buoys is 0.020–0.485 Hz and of Sentinel-1 is 0.03–0.23 Hz), the comparison results are limited to their common range.
It can be seen from Figure 3 that the consistency between Sentinel-1 and NDBC spectra mainly exists the following situations: the peak spectral density are basically the same, but the peak frequency of Sentinel-1 is significantly smaller than that of NDBC buoys, as shown in Figure 3a. The peak frequency is basically the same, but the peak spectral density of Sentinel-1 is smaller than that of NDBC buoys, as shown in Figure 3b. The peak spectral density and peak frequency are basically the same, as shown in Figure 3c. The peak spectral density and peak frequency are quite different, as shown in 
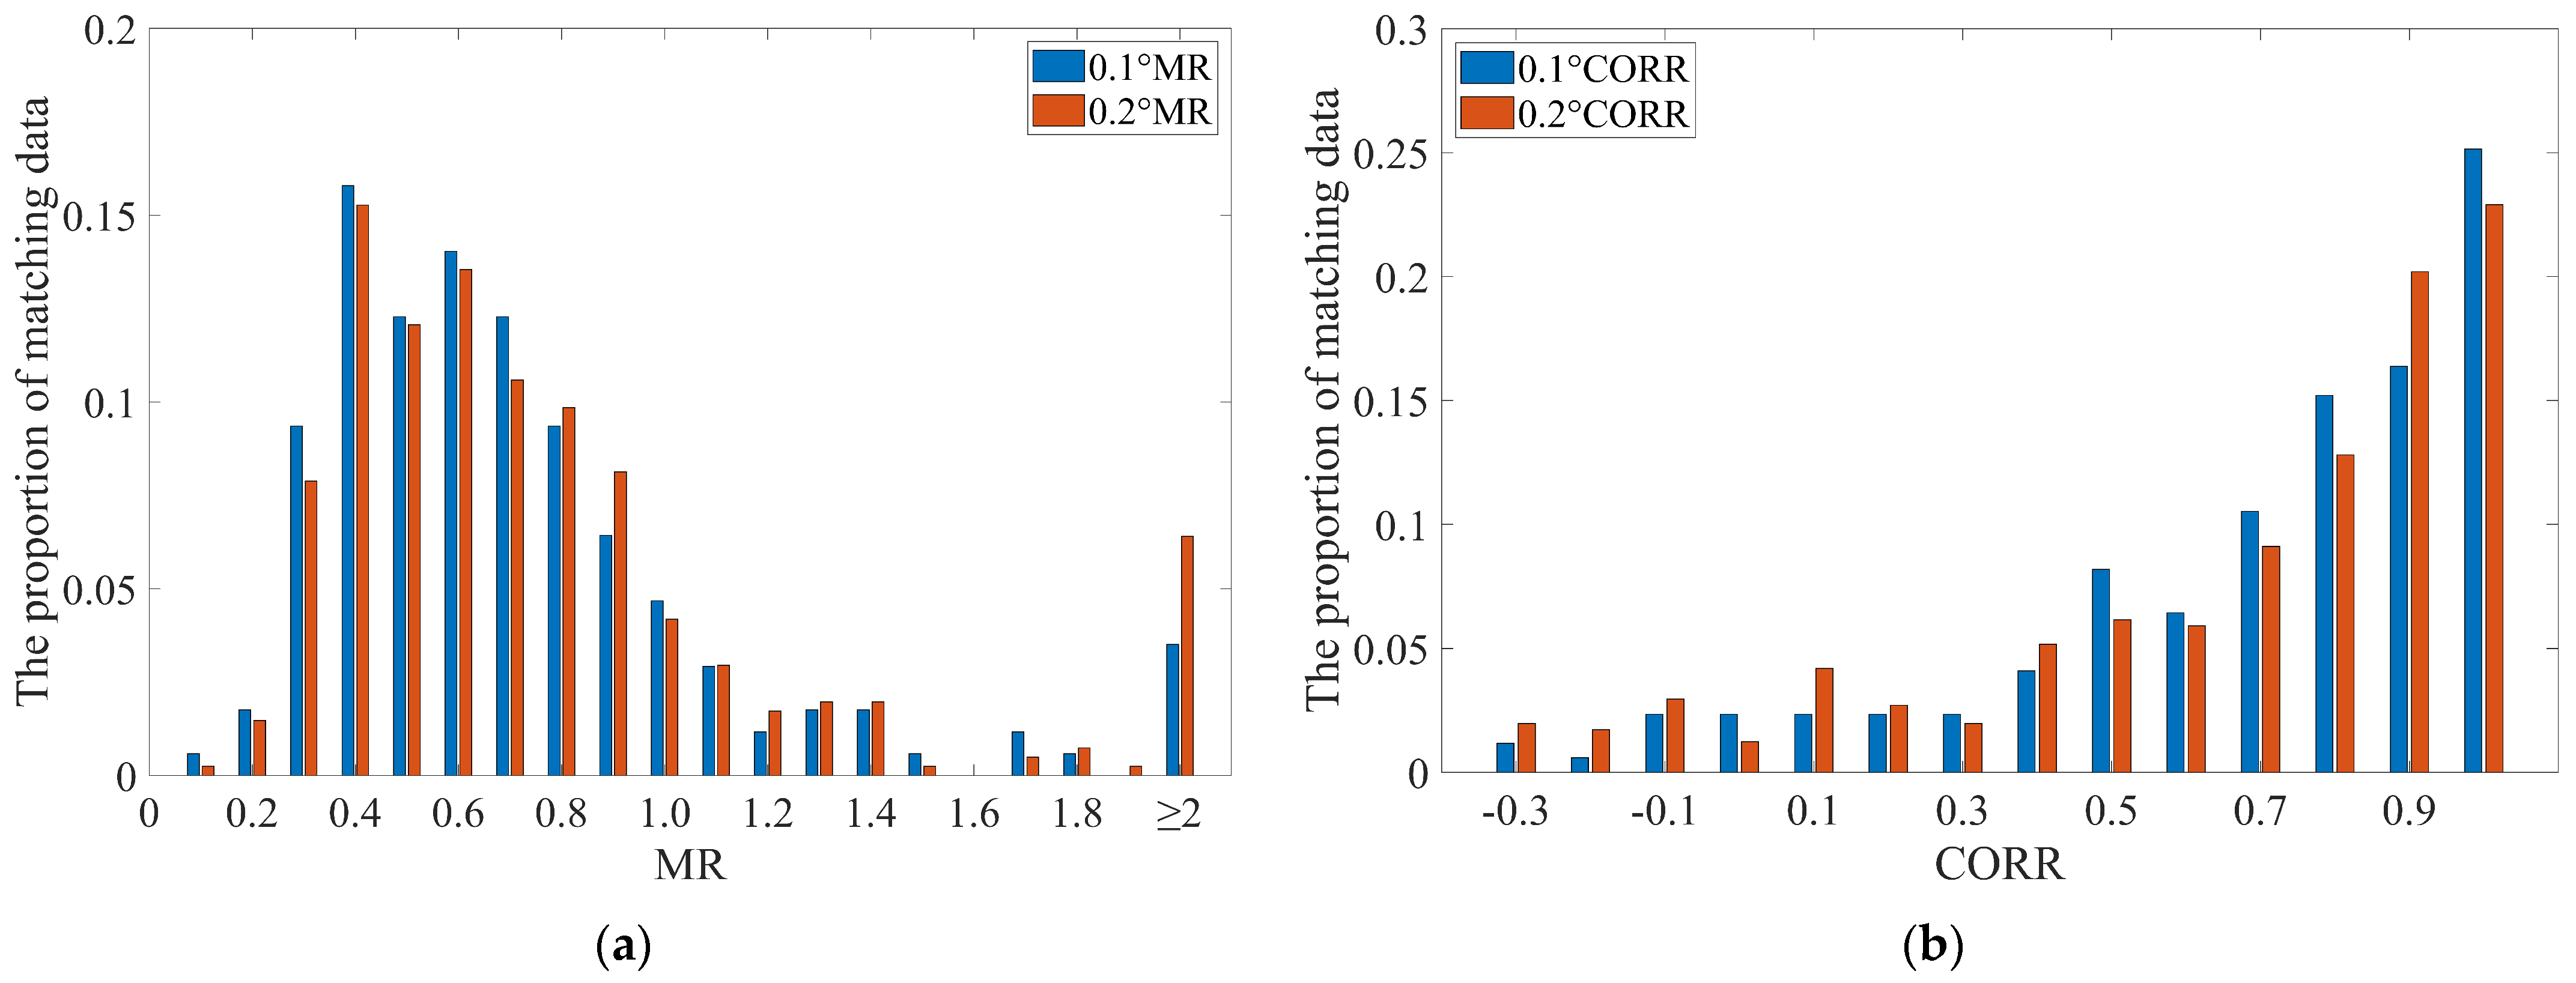
Figure 3d. In addition, the spectral density of Sentinel-1 is always smaller than that of NDBC buoys when the frequency is greater than 0.1 Hz. This indicates that Sentinel-1 is not accurate for high frequency part. Besides, most of the comparison results with bad consistency are always associated with low peak spectral density according to the co-located matching points. In order to quantitatively evaluate the accuracy of Sentinel-1 wave spectra, CORR and MR parameters introduced in 
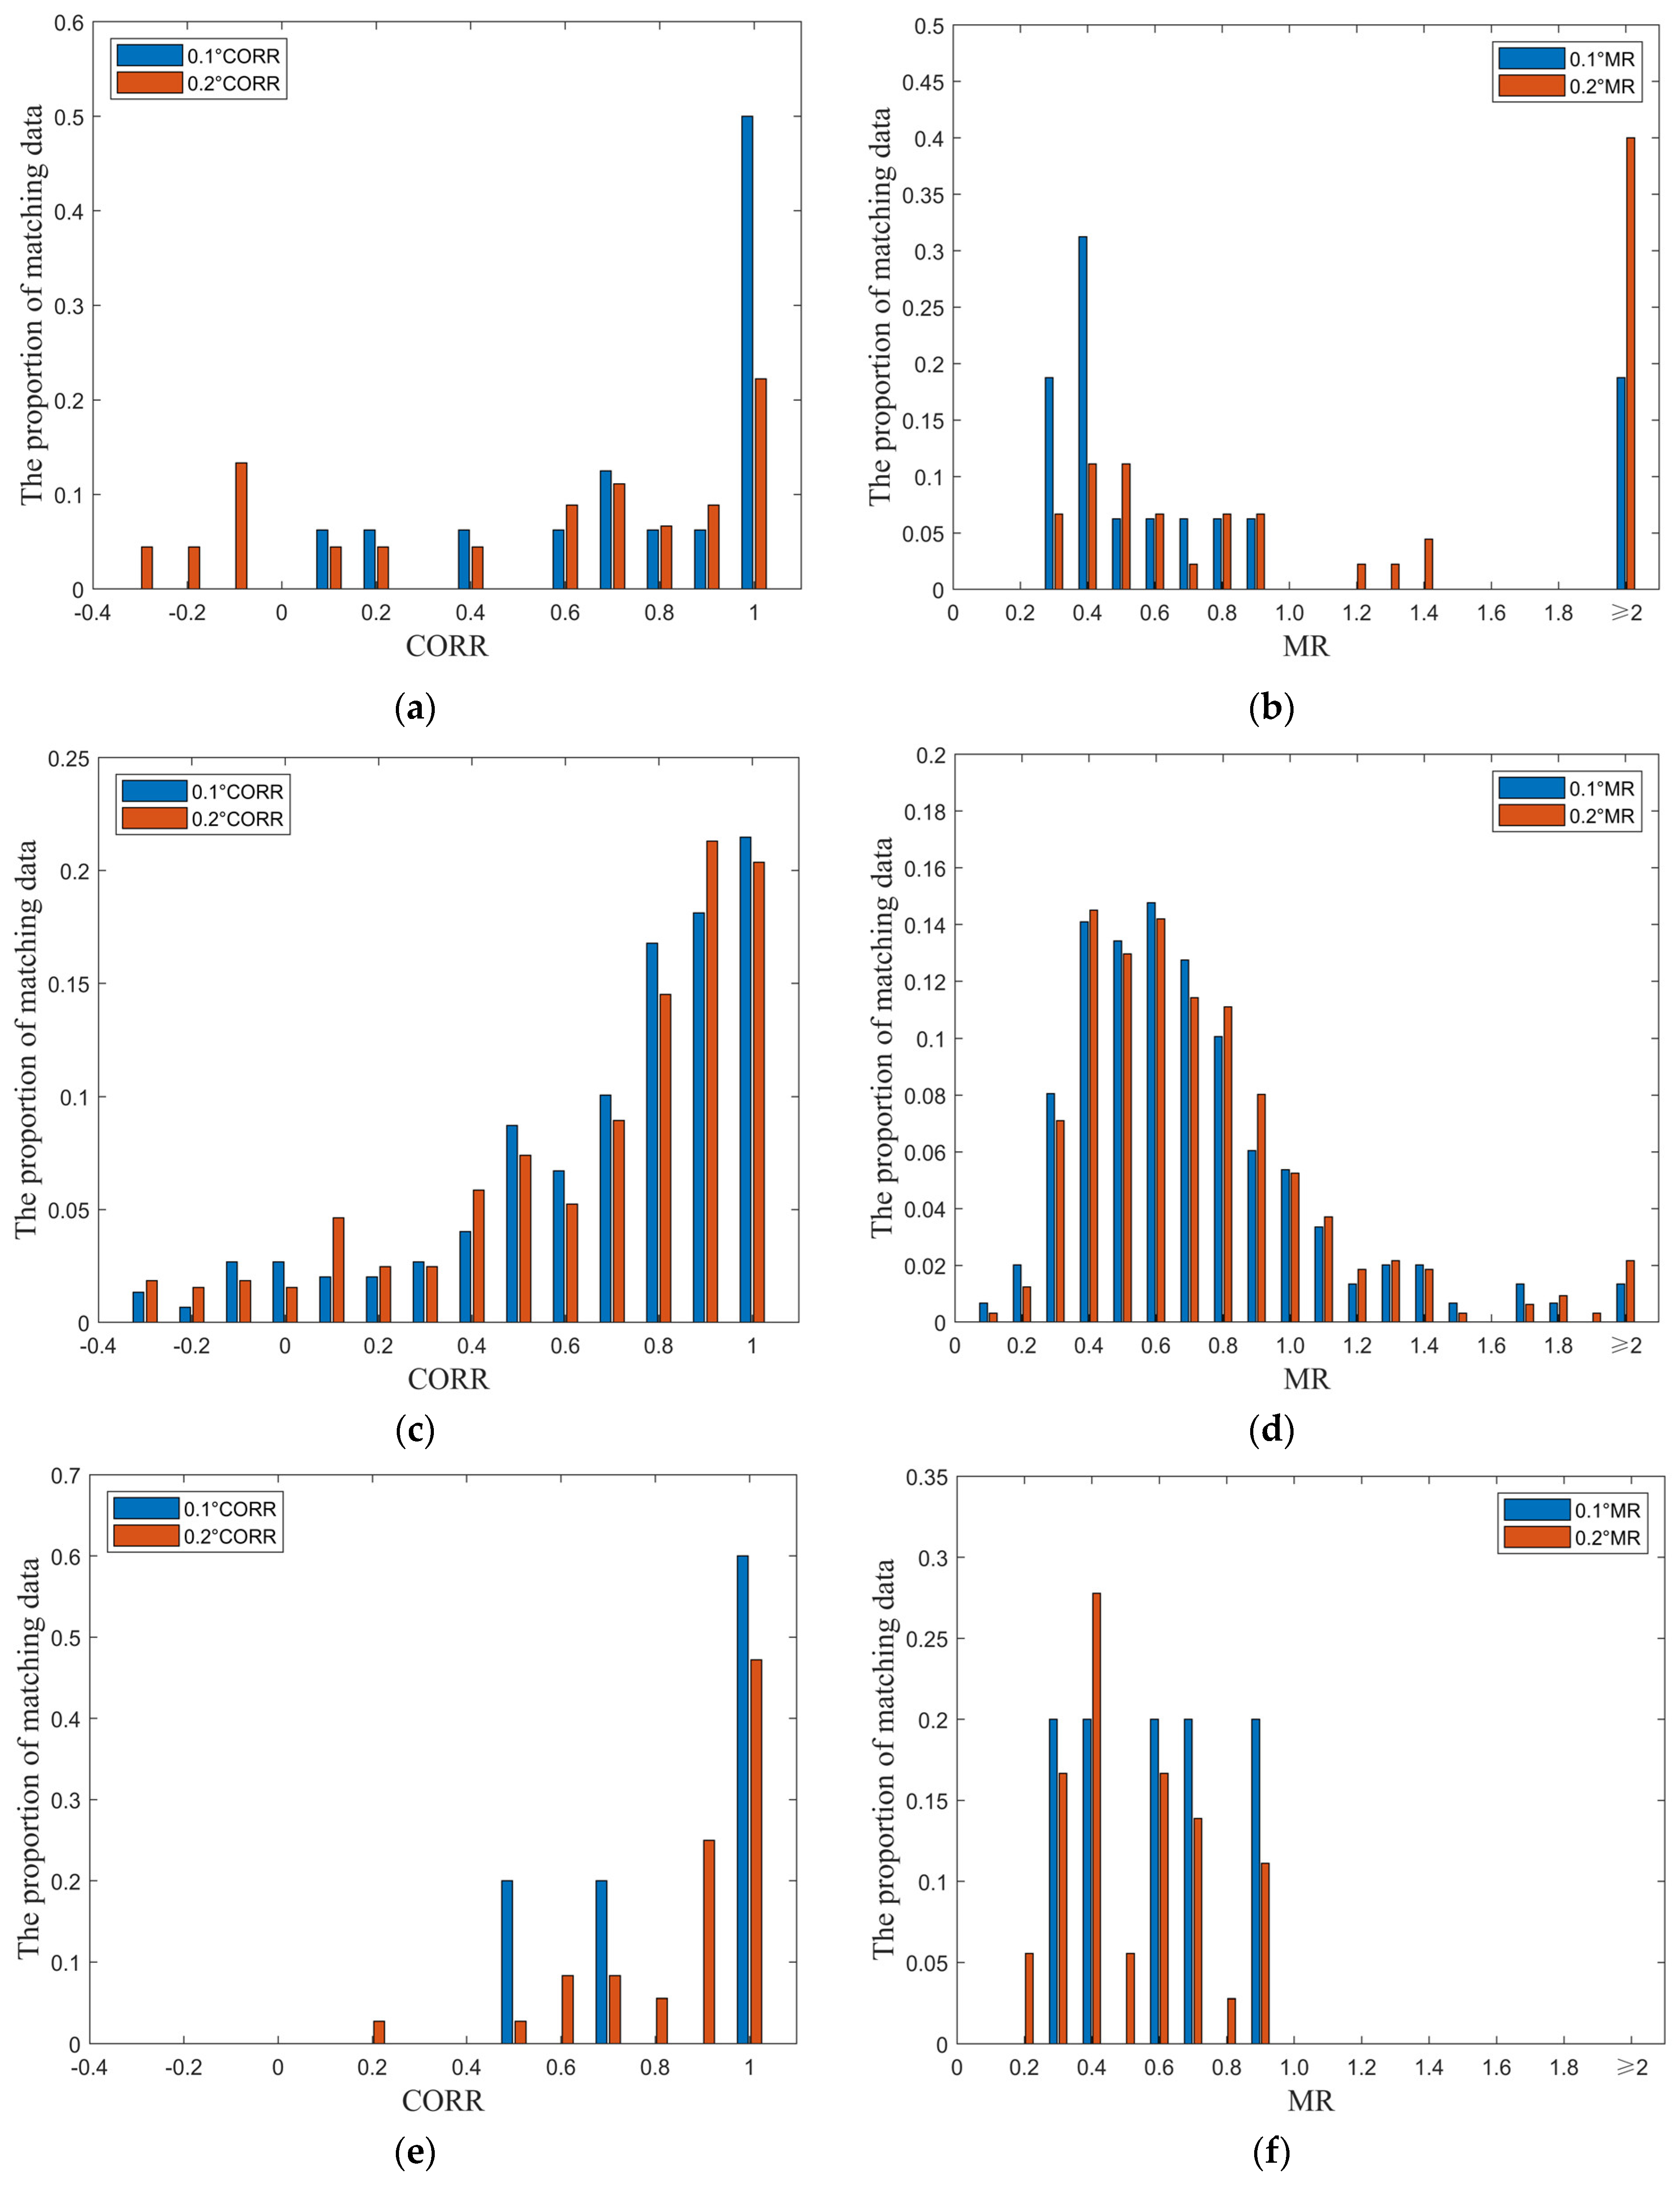
Section 2.2.2 are used for statistical analysis of Sentinel-1 wave spectra errors. The statistical histograms of CORR and MR under the 0.1° and 0.2° spatial windows are shown in Figure 4, where CORR/MR = a means that the CORR/MR range is in [a − 0.1, a].
The larger the CORR value, the closer the spectral shape of Sentinel-1 is to the spectral shape of the NDBC buoy; the smaller the MR value, the closer the spectral value of Sentinel-1 is to the spectral value of the NDBC buoy. In Figure 4, the CORR under the spatial scales of 0.1°and 0.2° is consistent and mainly larger than 0.7. The CORR greater than 0.7 under the spatial scales of 0.1° and 0.2° accounts for 56.7% and 55.9% of all co-located data, respectively. This indicates that the spectral shape of Sentinel-1 ocean wave spectra is relatively accurate. The MR is mainly between 0.3 and 0.9 and is consistent under two spatial scales. The MR less than 0.7 under the spatial scales of 0.1° and 0.2° accounted for 53.8% and 50.5% of all collocated data and MR less than 0.5 accounted for 27.5% and 24.9% respectively. This indicates that the spectral value between Sentinel-1 spectra and NDBC spectra have a bit different. The spectral shape describes the frequency distribution of the wave spectra, which represents the frequency range of the wave spectra. The spectral value describes the energy intensity of the wave spectra, which represents the amplitude of the frequency node of the wave spectra. SAR can capture frequency signals accurately while the accuracy of signal intensity is affected by various factors such as sea conditions and instruments. Therefore, the accuracy of the spectral shape is relatively high, while the accuracy of the spectral value is low.
In order to evaluate the accuracy of Sentinel-1 wave spectra in different sea conditions, this study calculated the CORR and MR under three different wave height ranges (low sea condition: 0–1 m, medium sea condition: 1–4 m and high sea condition: larger than 4 m) based on NDBC buoy wave height. The comparison of wave spectra between NDBC buoys and Sentinel-1 under different wave height ranges are shown in Figure 5.
It can be seen from Figure 5 that the evaluation result of Sentinel-1 wave spectra vary under different sea conditions and spatial windows. Smaller spatial windows lead Sentinel-1 wave spectra observations closer to those of NDBC buoys. Thus, the observations of Sentinel-1 wave spectra for sea states ranging from 0 to 1 m are optimal under 0.1° spatial window, with a proportion of CORR greater than 0.7 at 62.5%, and proportions of MR less than 0.7 and less than 0.5 at 62.5% and 50%, respectively. Furthermore, different spatial windows under the same sea state conditions exhibit significant differences in the distribution of CORR and MR: under the sea conditions of 0–1 m, the proportions of CORR exceeding 0.7, MR less than 0.7, and MR less than 0.5 under the 0.2° spatial window are 37.8%, 35.6%, and 17.8%, respectively, lower than that of the 0.1° spatial window. Under the sea conditions of 1–4 m, the distributions of CORR and MR under 0.1° and 0.2° spatial windows are basically consistent, with proportions of CORR exceeding 0.7 at 56.4% and 56.2%, and proportions of MR less than 0.7 and MR less than 0.5 at 53%, 50.3% and 24.8%, 23.1%, respectively. However, under the sea conditions with wave heights exceeding 4 m, the accuracy of the 0.2° spatial window surpasses that of the 0.1° window, with proportions of CORR exceeding 0.7 at 77.8% and 60.0%, and proportions of MR less than 0.7 and MR less than 0.5 at 72.2%, 50.0% and 60.0%, 40.0%, respectively. This indicates that the closer Sentinel-1 observations are to NDBC buoys under high sea conditions, the poorer the observation results of Sentinel-1 wave spectra. In summary, the larger the wave height, the poorer the observations of Sentinel-1 wave spectra, which attributed to larger wave heights corresponding to higher proportions of wind waves, resulting in significant error in Sentinel-1 observation results.
Different observation time may lead to variations in the observations of Sentinel-1 wave spectra. This study evaluates the accuracy of Sentinel-1 wave spectra under different season conditions in northern hemisphere. (Spring: March, April, May; Summer: June, July, August; Autumn: September, October, November; Winter: December, January, February). To ensure the results are more accurate, the seasonal analysis utilized matched data from December 2016 to November 2021. The comparison of wave spectra between NDBC buoys and Sentinel-1 under different seasons and different spatial window are shown in Table 1.
It can be seen from Table 1 that the observations of Sentinel-1 wave spectra are best in autumn, with a proportion of CORR greater than 0.7 accounts for 62.2%, a proportion of MR less than 0.7 accounts for 68.8%, and a proportion of MR less than 0.5 accounts for 33.3% under 0.1° spatial window. The observation results of Sentinel-1 wave spectra are worst in summer, with a proportion of CORR greater than 0.7 accounts for 48.8%, a proportion of MR less than 0.7 accounts for 44.2%, and a proportion of MR less than 0.5 accounts for 16.3% under 0.1° spatial window. The results show that seasonal variables have an impact on the observations of Sentinel-1 wave spectra, which may be related to the varying strengths of winds during different seasons.
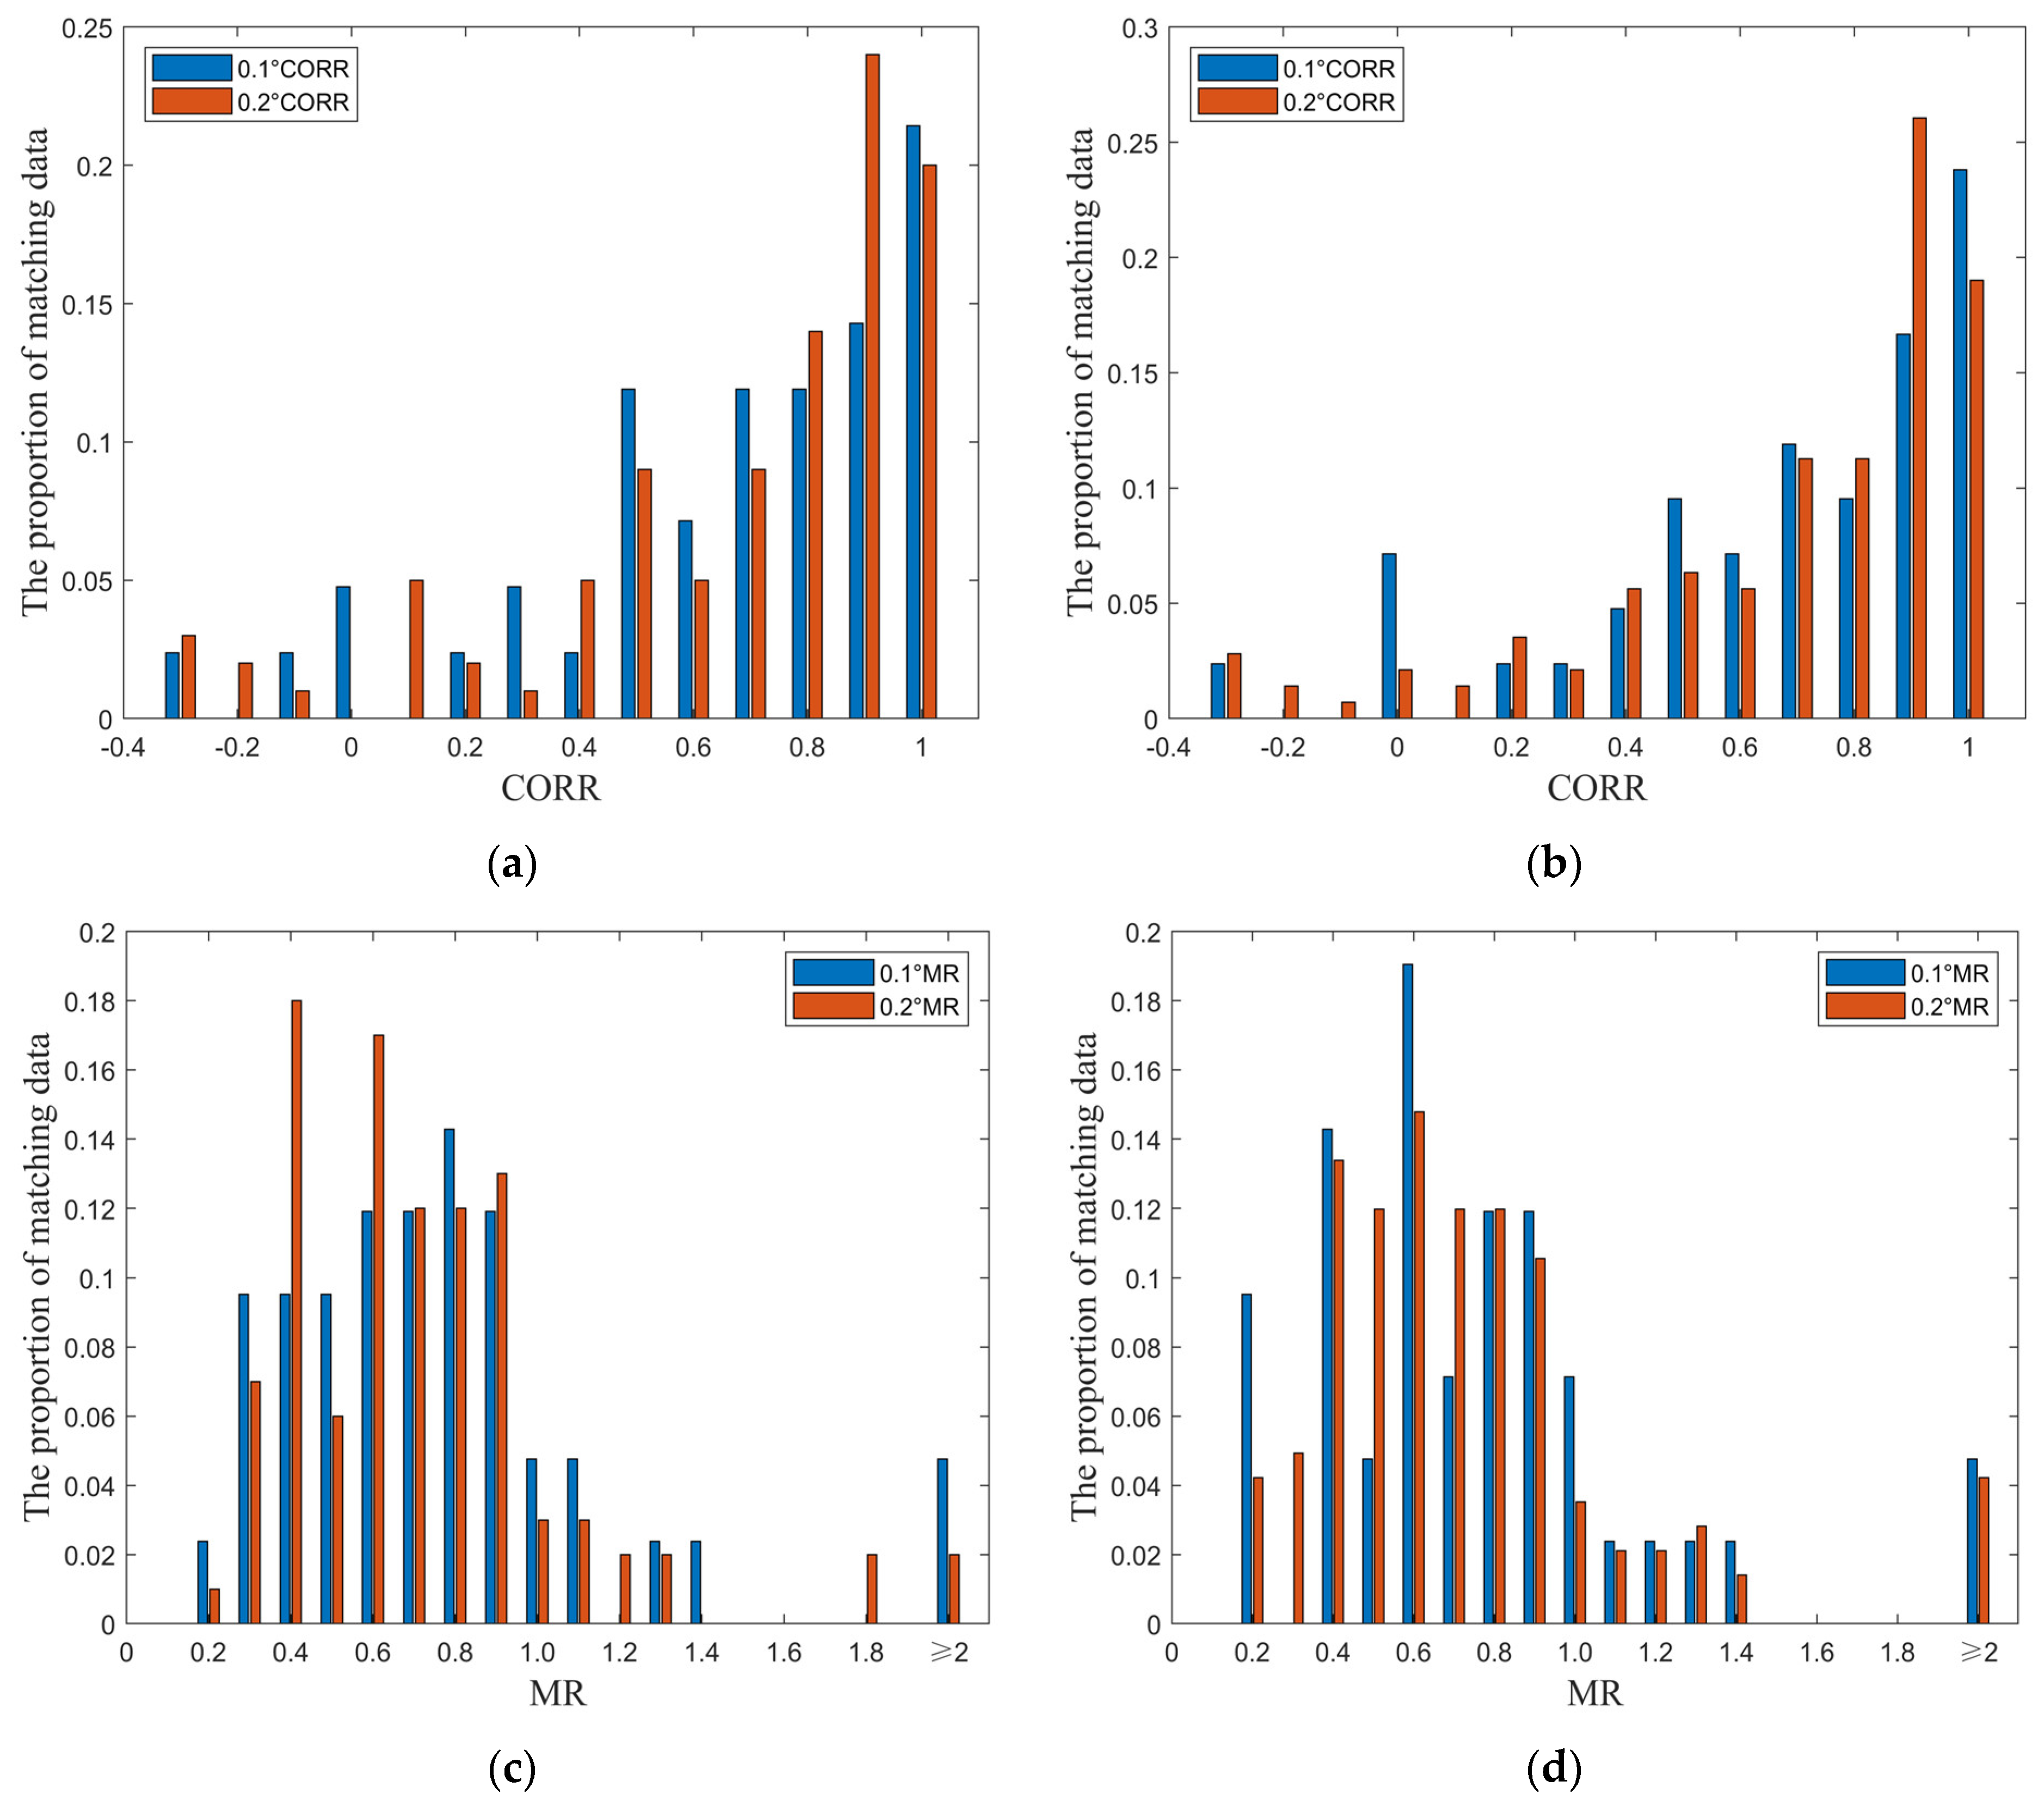
The ‘surfboard sampling’ effect [22] refers to a nonlinear sampling phenomenon occurring in radar measurements when the radar observation angle is smaller than the slope of waves. When the radar observation angle is smaller than the wave slope, the iso-range plane intersects the rough surface at multiple points like a long surfboard in choppy seas. This effect leads to deviations in the signals observed by the sensor from their true values and finally impacts the accuracy of the data. Specifically, it manifests in Sentinel-1 wave spectra by shifting the peak of wave energy towards lower wavenumbers, with the observed wave energy being less than the true value compared with NDBC buoys. The surfboard effect is more prevalent in wind waves with larger wave slopes. To evaluate the impact of the surfboard effect on the accuracy of Sentinel-1 wave spectrum observations, this study analyzes the issue of spectral shift in Sentinel-1 one-dimensional wave spectra for wind speeds exceeding 8 m/s within 0.1° and 0.2° spatial window. The Sentinel-1 one-dimensional wave spectra are shifted by one unit along the direction of increasing frequency, and the CORR and MR between the shifted Sentinel-1 wave spectra and the NDBC buoy wave spectra are calculated. Furthermore, the changes in the distribution of CORR and MR before and after the spectra shift are compared. The comparison results are shown in Figure 6.
It can be seen from Figure 6 that the accuracy of the Sentinel-1 wave spectra has significantly improved after spectral shift correction compared to the NDBC buoy wave spectra. Under the condition of 0.1° spatial window, the proportion of CORR greater than 0.7 increased from 47.6% before correction to 50.0% after correction, while the proportions of MR less than 0.7 and MR less than 0.5 increased from 42.8% and 21.4% before correction to 47.6% and 23.9% after correction, respectively. Under the condition of 0.2° spatial window, the proportion of CORR greater than 0.7 increased from 58.0% before correction to 80.0% after correction, while the proportions of MR less than 0.7 and MR less than 0.5 increased from 49.0% and 26.0% before correction to 70.0% and 32.0% after correction, respectively. The results indicate that the surfboard sampling effect has a significant impact on the accuracy of the Sentinel-1 wave spectra. Therefore, the data of Sentinel-1 wave spectra with smaller wave slopes should be used as much as possible.

3.2. Assessment of Sentinel-1 Wave Height Based on NDBC Ocean Wave Spectra

According to the spatial-temporal matching and wave height evaluation methods introduced in Section 2.2.1 and Section 2.2.3, the evaluation of Sentinel-1 wave height is implemented based on the NDBC wave spectra. The wave heights of NDBC and Sentinel-1 are obtained by integrating the 1D wave spectra, and a total of 4387 pairs of matching results are obtained after removing abnormal values. The comparison of wave height between NDBC buoys and Sentinel-1 is shown in Figure 7.
It can be seen from Figure 7 that the wave height of Sentinel-1 is mostly smaller than that of NDBC buoys, and the deviation between them becomes larger as the wave height increases. The reason for the deviation is that Sentinel-1 SAR can only observe waves within the cut-off wavelength due to the limitation of its instrument, while the range of NDBC buoys is wider. Therefore, the total spectral energy observed by Sentinel-1 is less than that obtained by NDBC buoys. It is obvious that there is a systematic bias between Sentinel-1 wave height and NDBC wave height. The Sentinel-1 wave height correction is implemented by linear regression based on the matching points. Compared with the NDBC wave height, the accuracy of the corrected Sentinel-1 wave height is improved, and the RMSE is reduced from 0.91 m to 0.75 m.
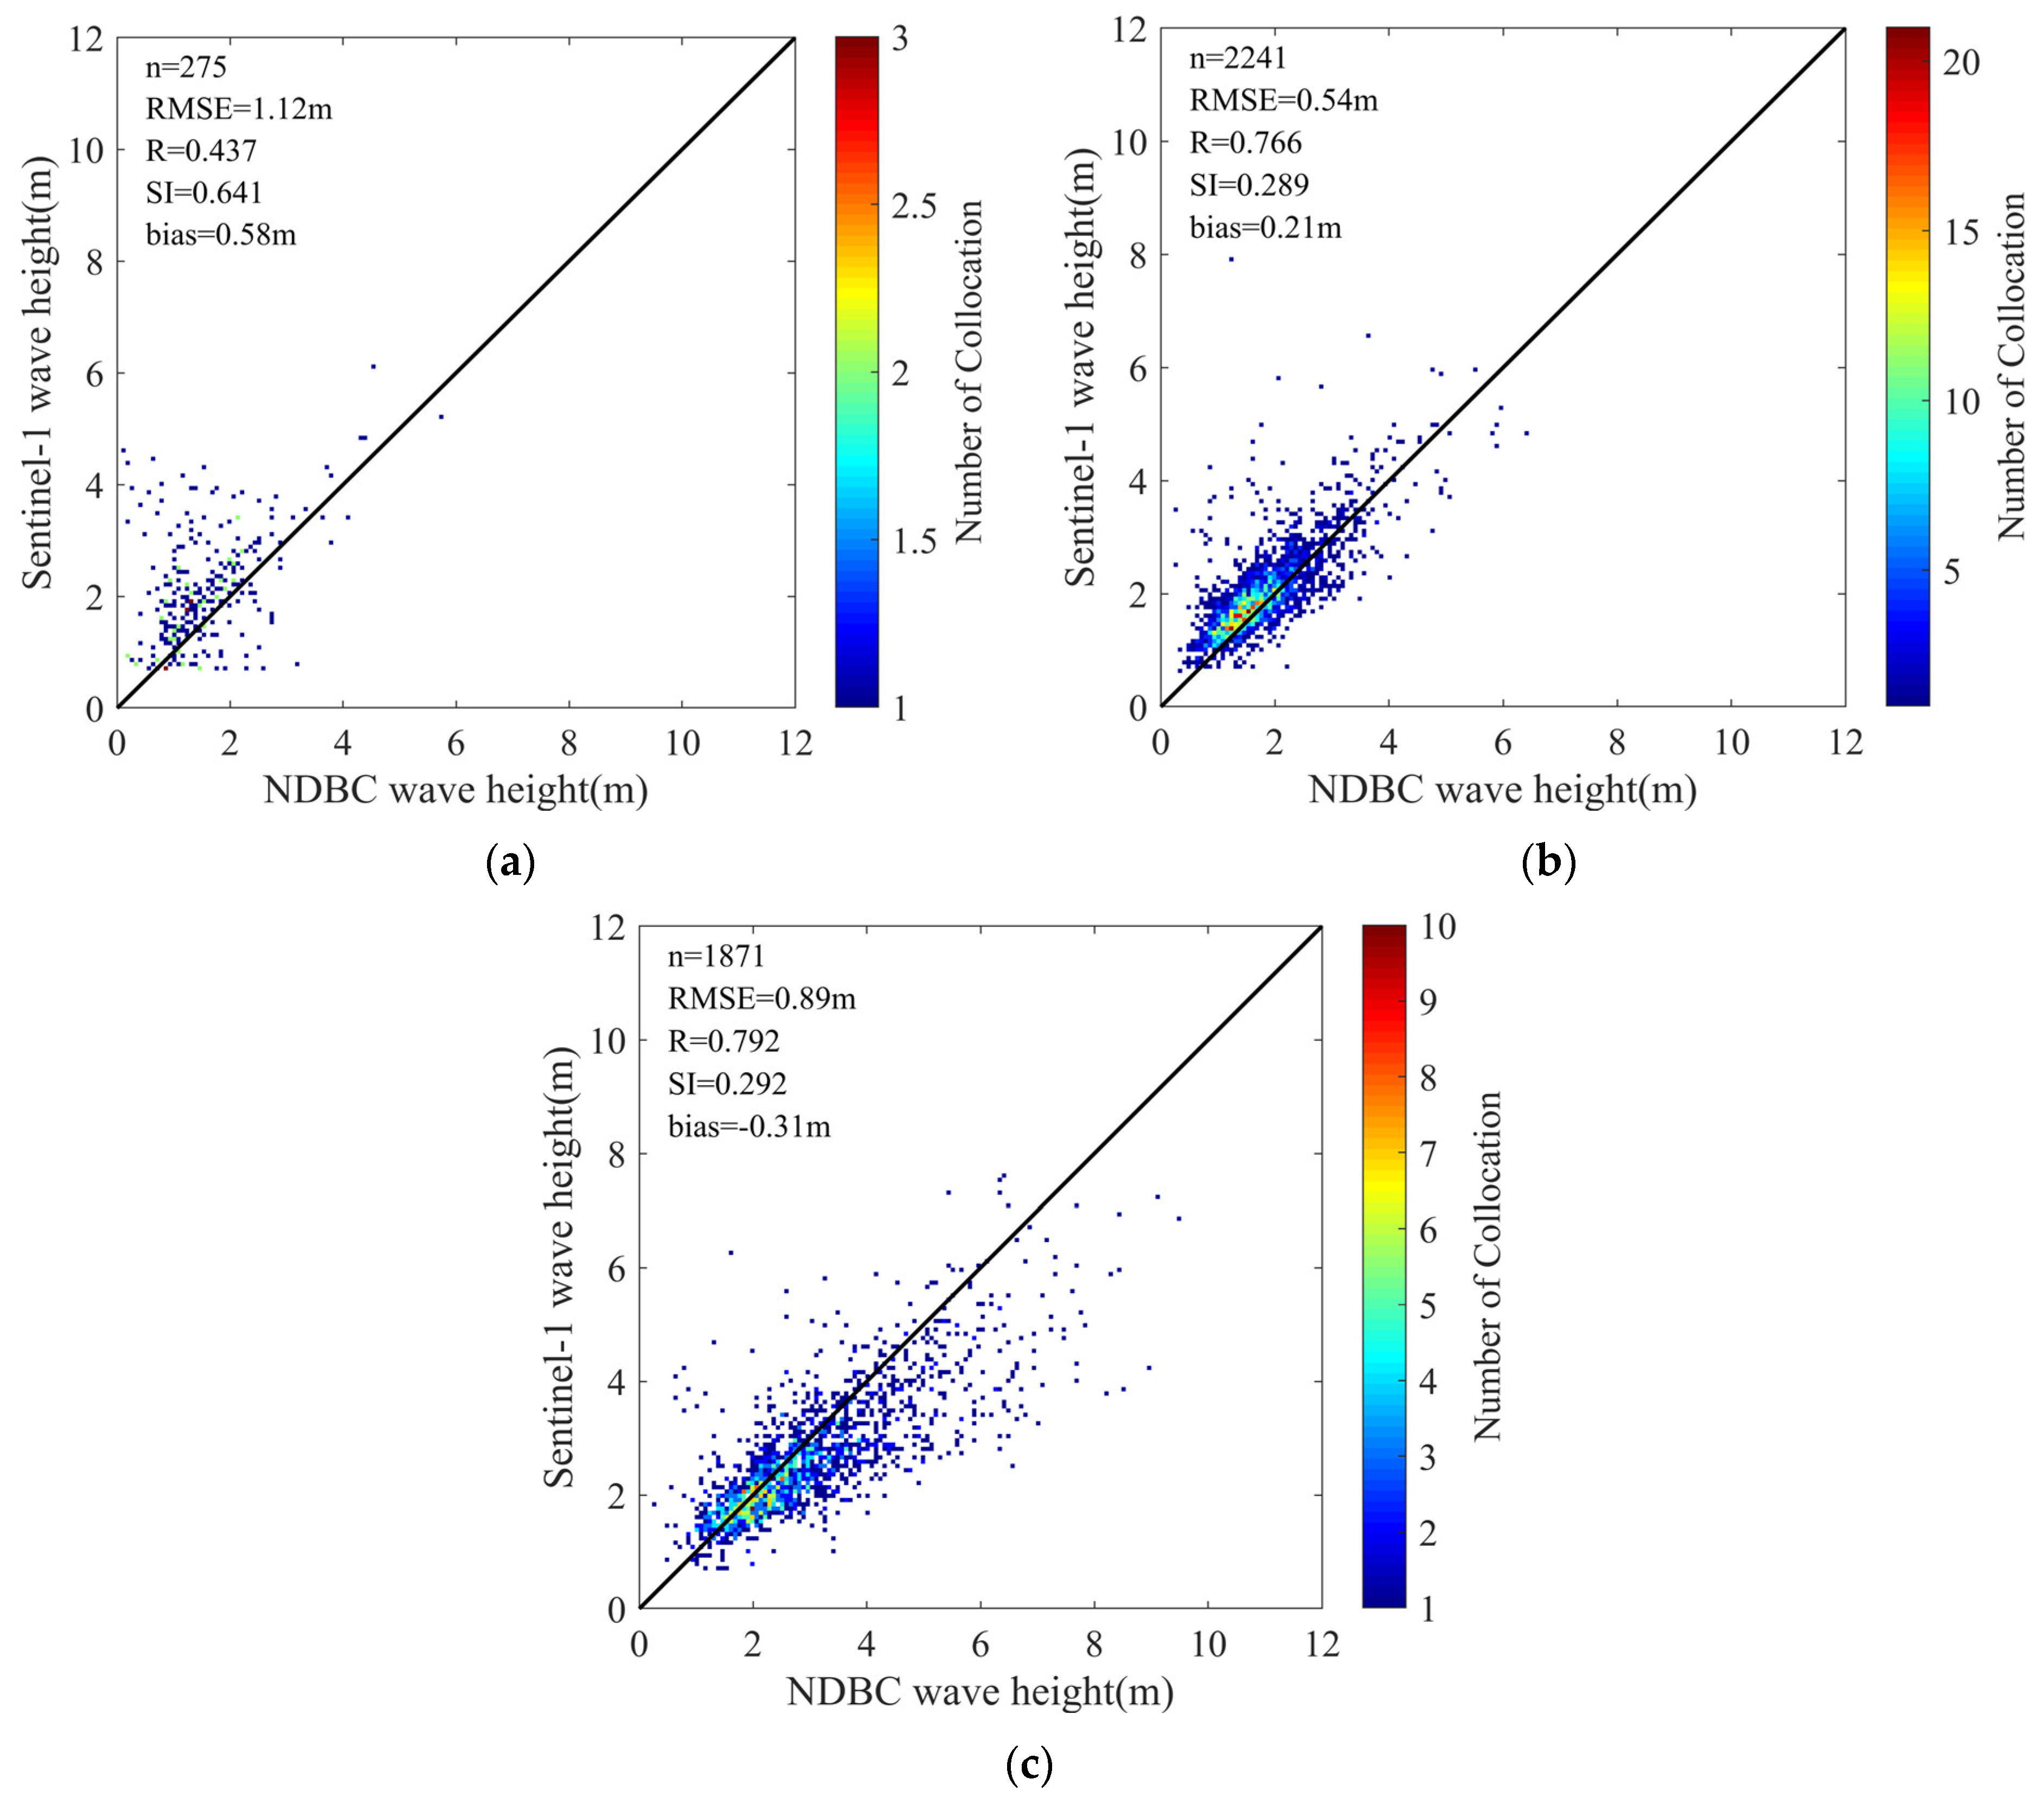
The observation accuracy of Sentinel-1 wave height is changeable under different wind speed or regions. This study investigated the accuracy of Sentinel-1 wave height under different wind speed and region conditions after removing the systematic bias from Sentinel-1 wave heights. Based on the wind speed contained in the Sentinel-1 product, the evaluation of Sentinel-1 wave height is implement under three different wind speed situations: 0–3 m/s (low wind speeds), 3–8 m/s (medium wind speeds) and larger than 8 m/s (high wind speeds). The accuracy evaluation results are shown in Figure 8.
It can be seen from Figure 8 that the accuracy of Sentinel-1 wave height data is relatively poor at low and high wind speeds, while the accuracy is relatively good at medium wind speeds with an RMSE of 0.54 m. When the wind speed is low, the wave height data are mainly distributed below 4 m, and the distribution of data points is scattered without obvious rules. The reason for the large error may be that the formation of waves and ripples on the sea surface is reduced, which resulting in a smooth sea surface and the reflected radar wave signal is weak under low wind condition, so that the backscatter signal received by SAR is very small and finally affects image quality and precision. When the wind speed is high, the wave height data are mainly distributed above 2 m. Since the waves are mainly short-wavelength at high wind speeds and SAR has poor observation accuracy for short-wavelength wind waves, so the error is relatively large and its RMSE is 0.89 m.
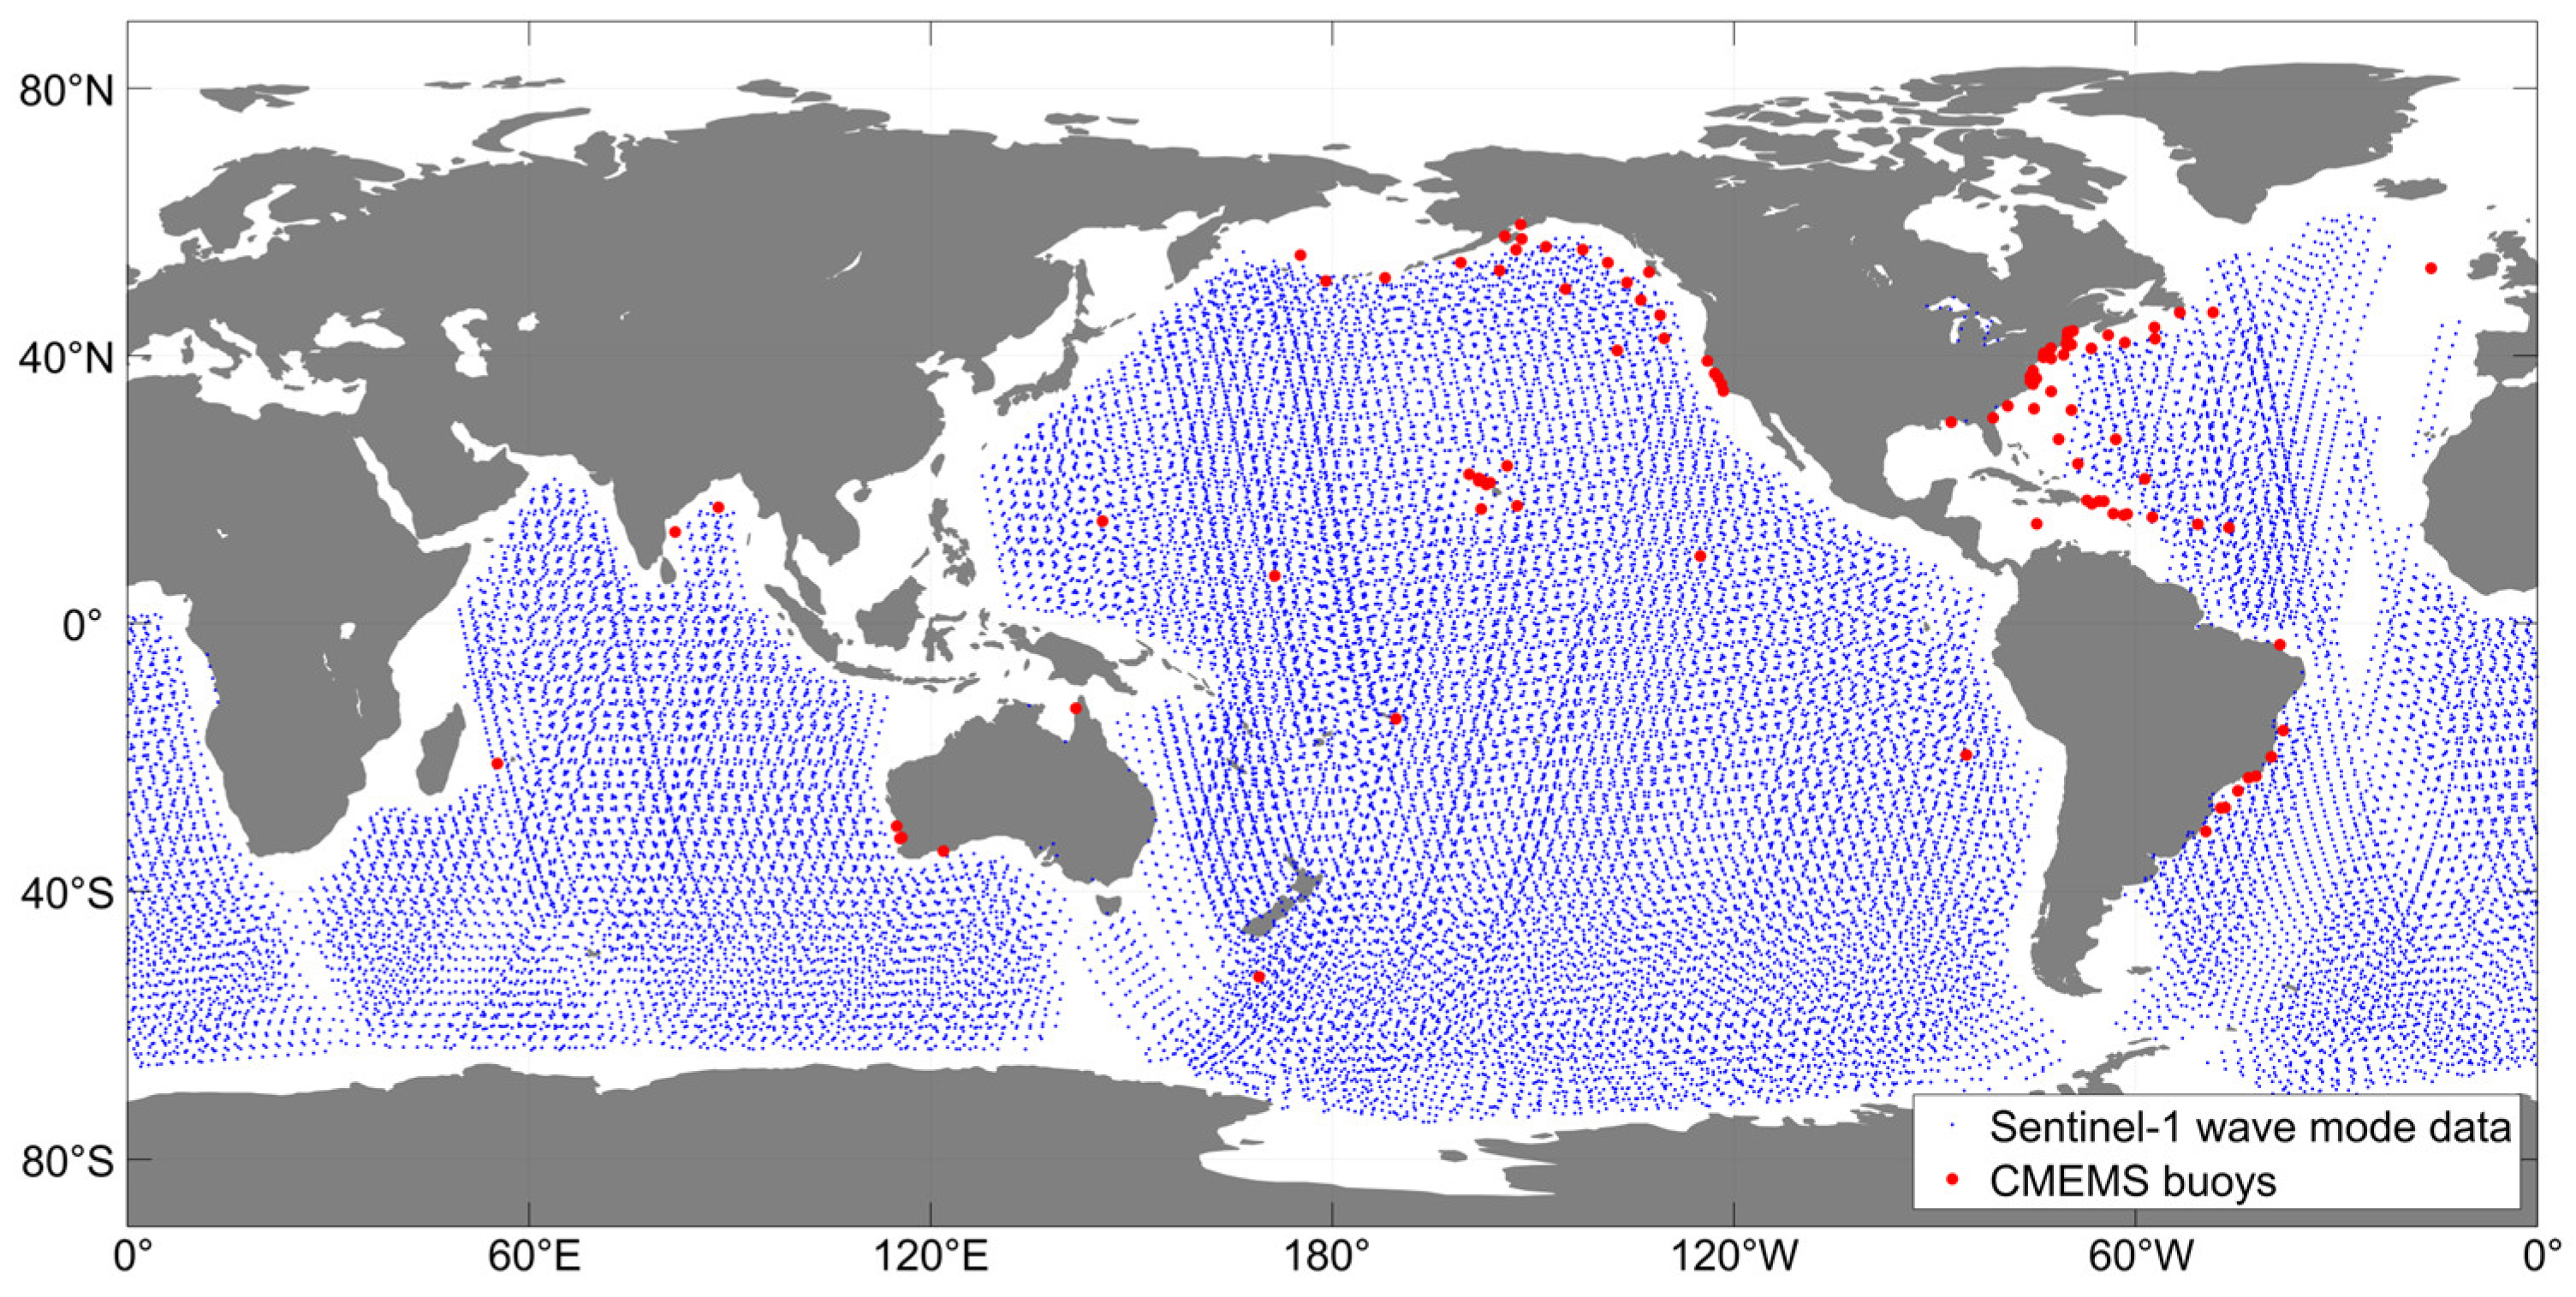
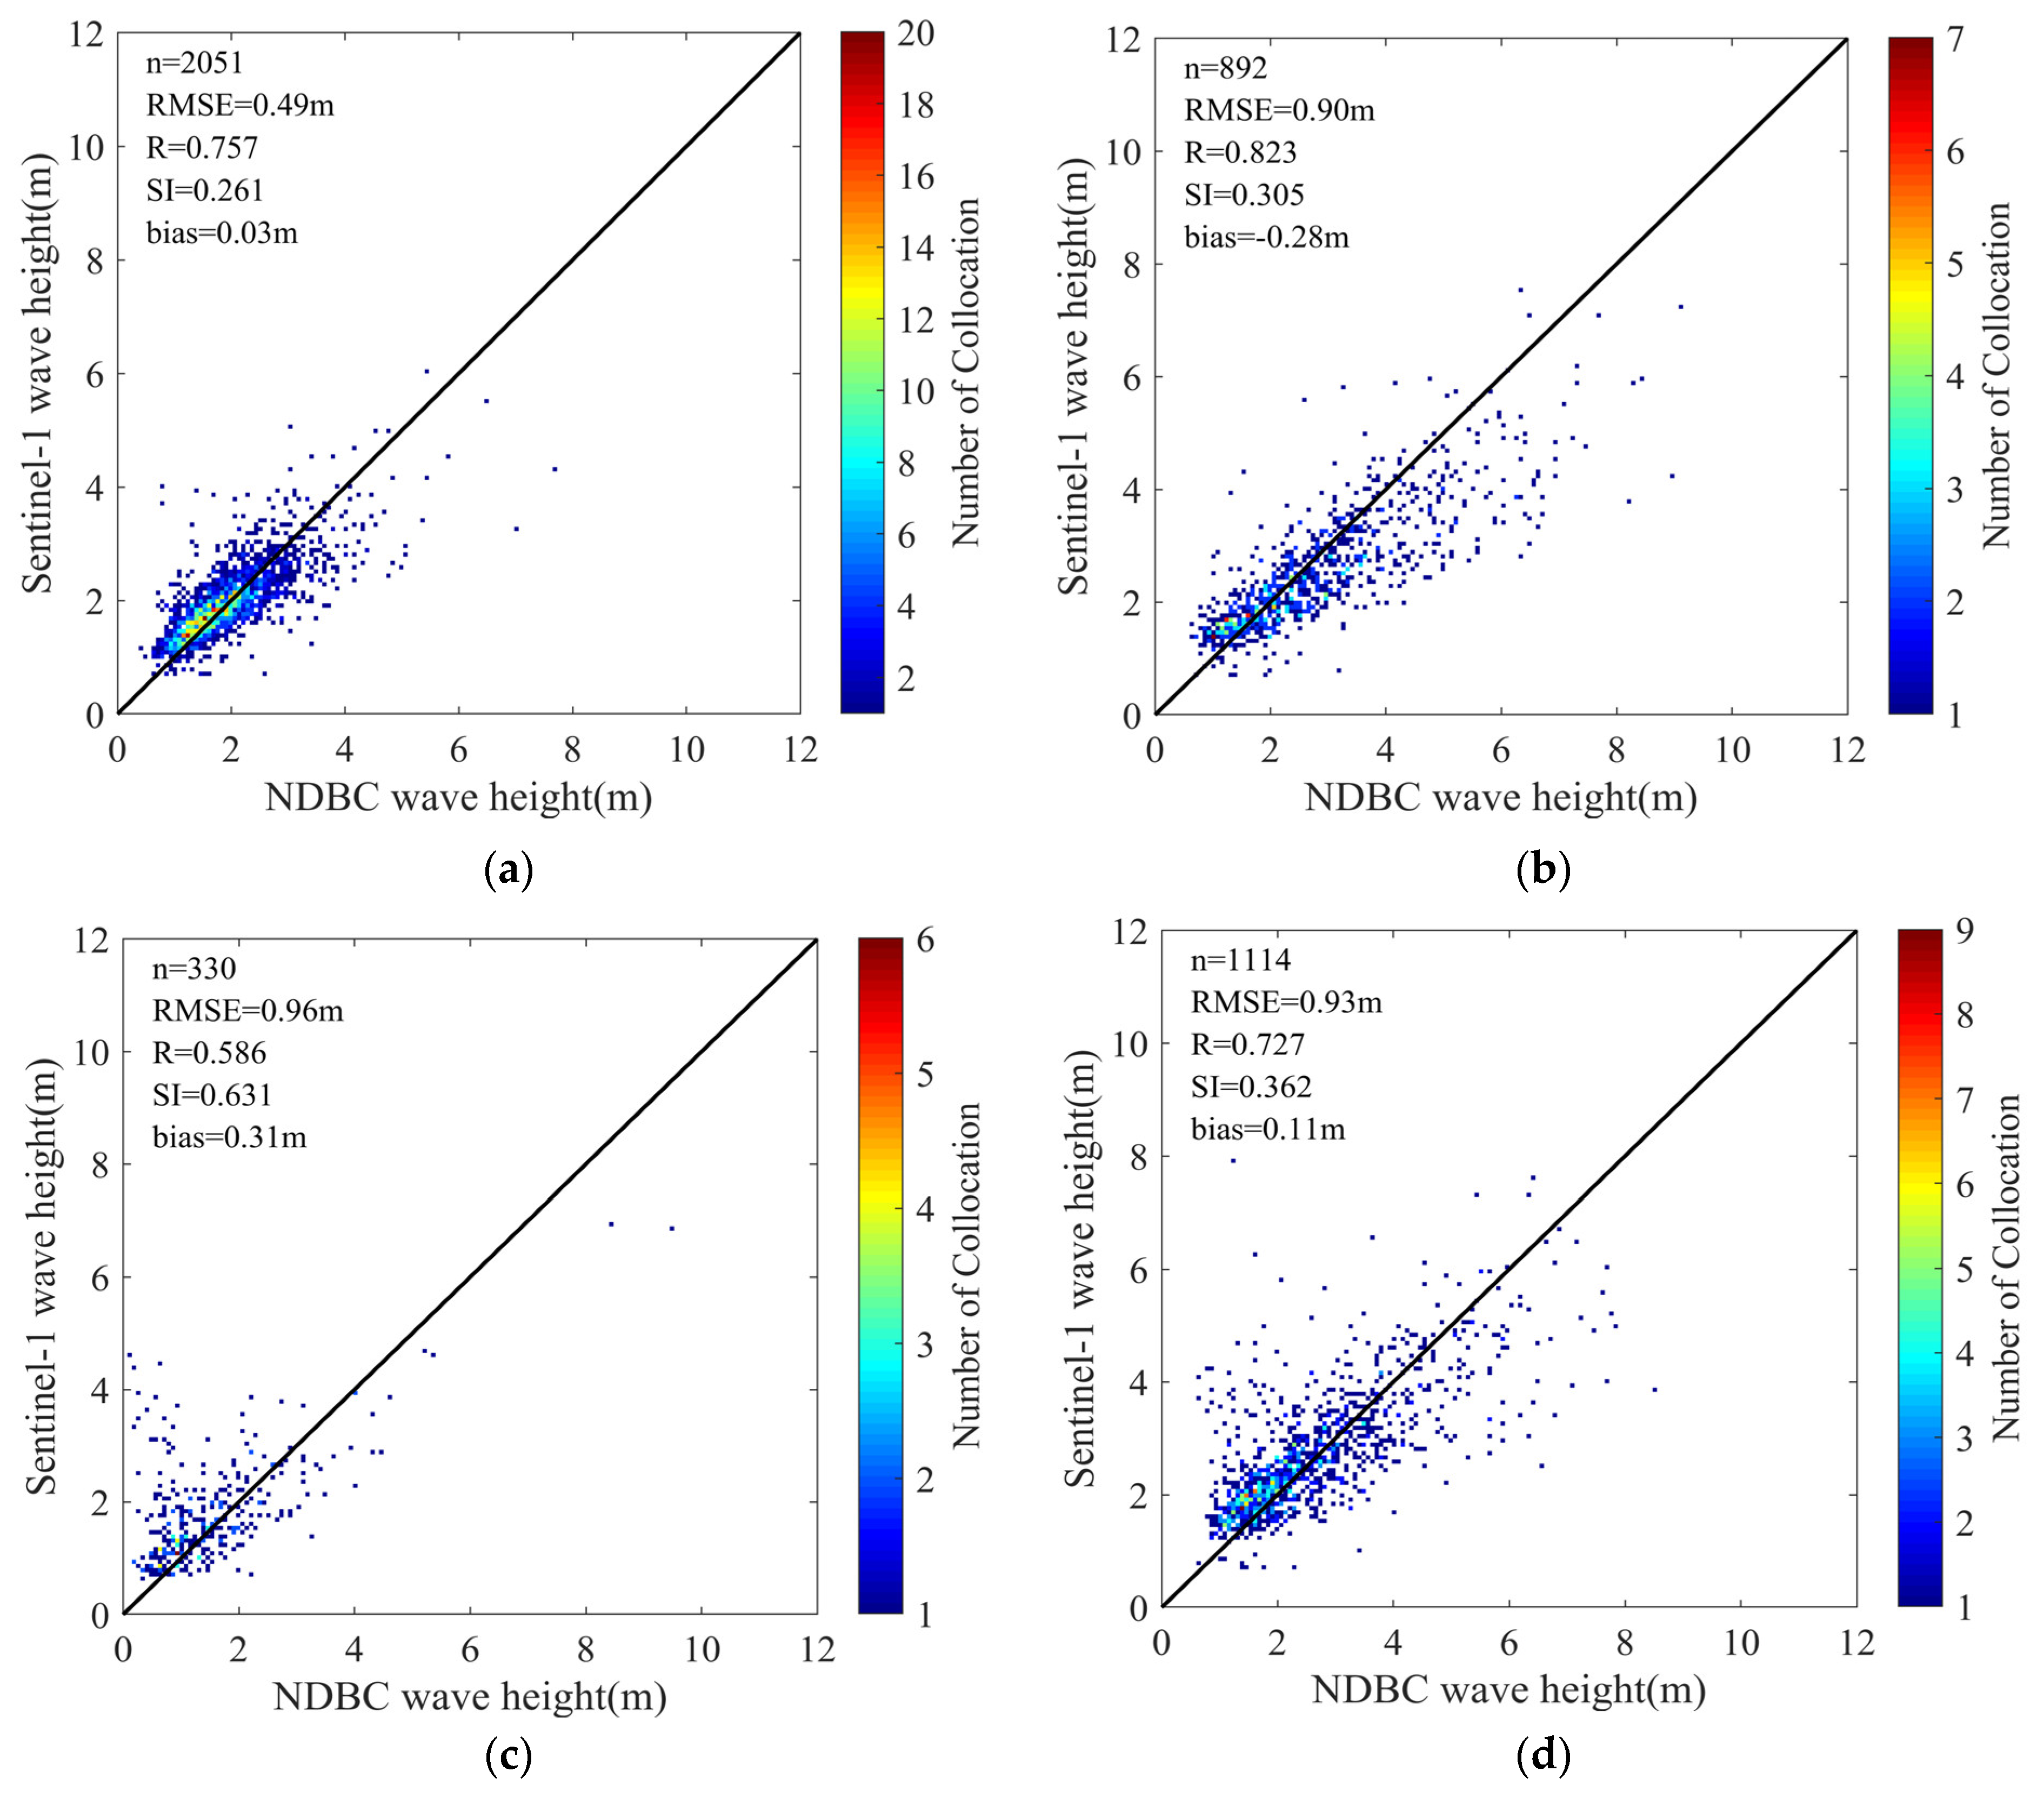
Affected by various factors such as water depth, geographical location and sea surface wind field, the characteristics of waves will be different from region to region. In order to evaluate the accuracy of Sentinel-1 wave height in different regions after removing the systematic bias from Sentinel-1 wave heights, this study divided the data into four regions (high latitude regions, the west coast of the United States, the east coast of the United States, and the open ocean region) based on NDBC buoy location to implement the evaluation of Sentinel-1 wave height in different regions. The division of NDBC buoys in different regions are shown in Figure 2. The circles in Figure 2 represent buoys in the open ocean region, the squares represent buoys in high latitude region, the diamonds represent buoys in the east coast of the United States, and the triangles represent buoys in the west coast of the United States. The accuracy evaluation results of Sentinel-1 wave height data in different regions are shown in Figure 9.
It can be seen from Figure 9 that the accuracy of data in the open ocean region, which the RMSE is 0.49 m and the wave heights are mainly distributed below 4 m, is significantly better than that of the other three regions. This means that Sentinel-1 has the best accuracy in the open ocean areas at low or middle latitudes relatively. Sentinel-1 has the worst accuracy in high latitudes, where the data distribution is relatively dispersed and its original RMSE is 1.16 m while reducing to 0.9 m after removing the systematic bias. The accuracy of data of the US east coast and the US west coast are basically the same, with the RMSE of 0.96 m and 0.93 m respectively. However, the wave value of the east coast area is significantly smaller than that of the west coast area.

3.3. The Assessment of Sentinel-1 Wave Height Based on ERA5 Wave Height

According to the spatial-temporal matching and wave height evaluation methods introduced in Section 2.2.1 and 
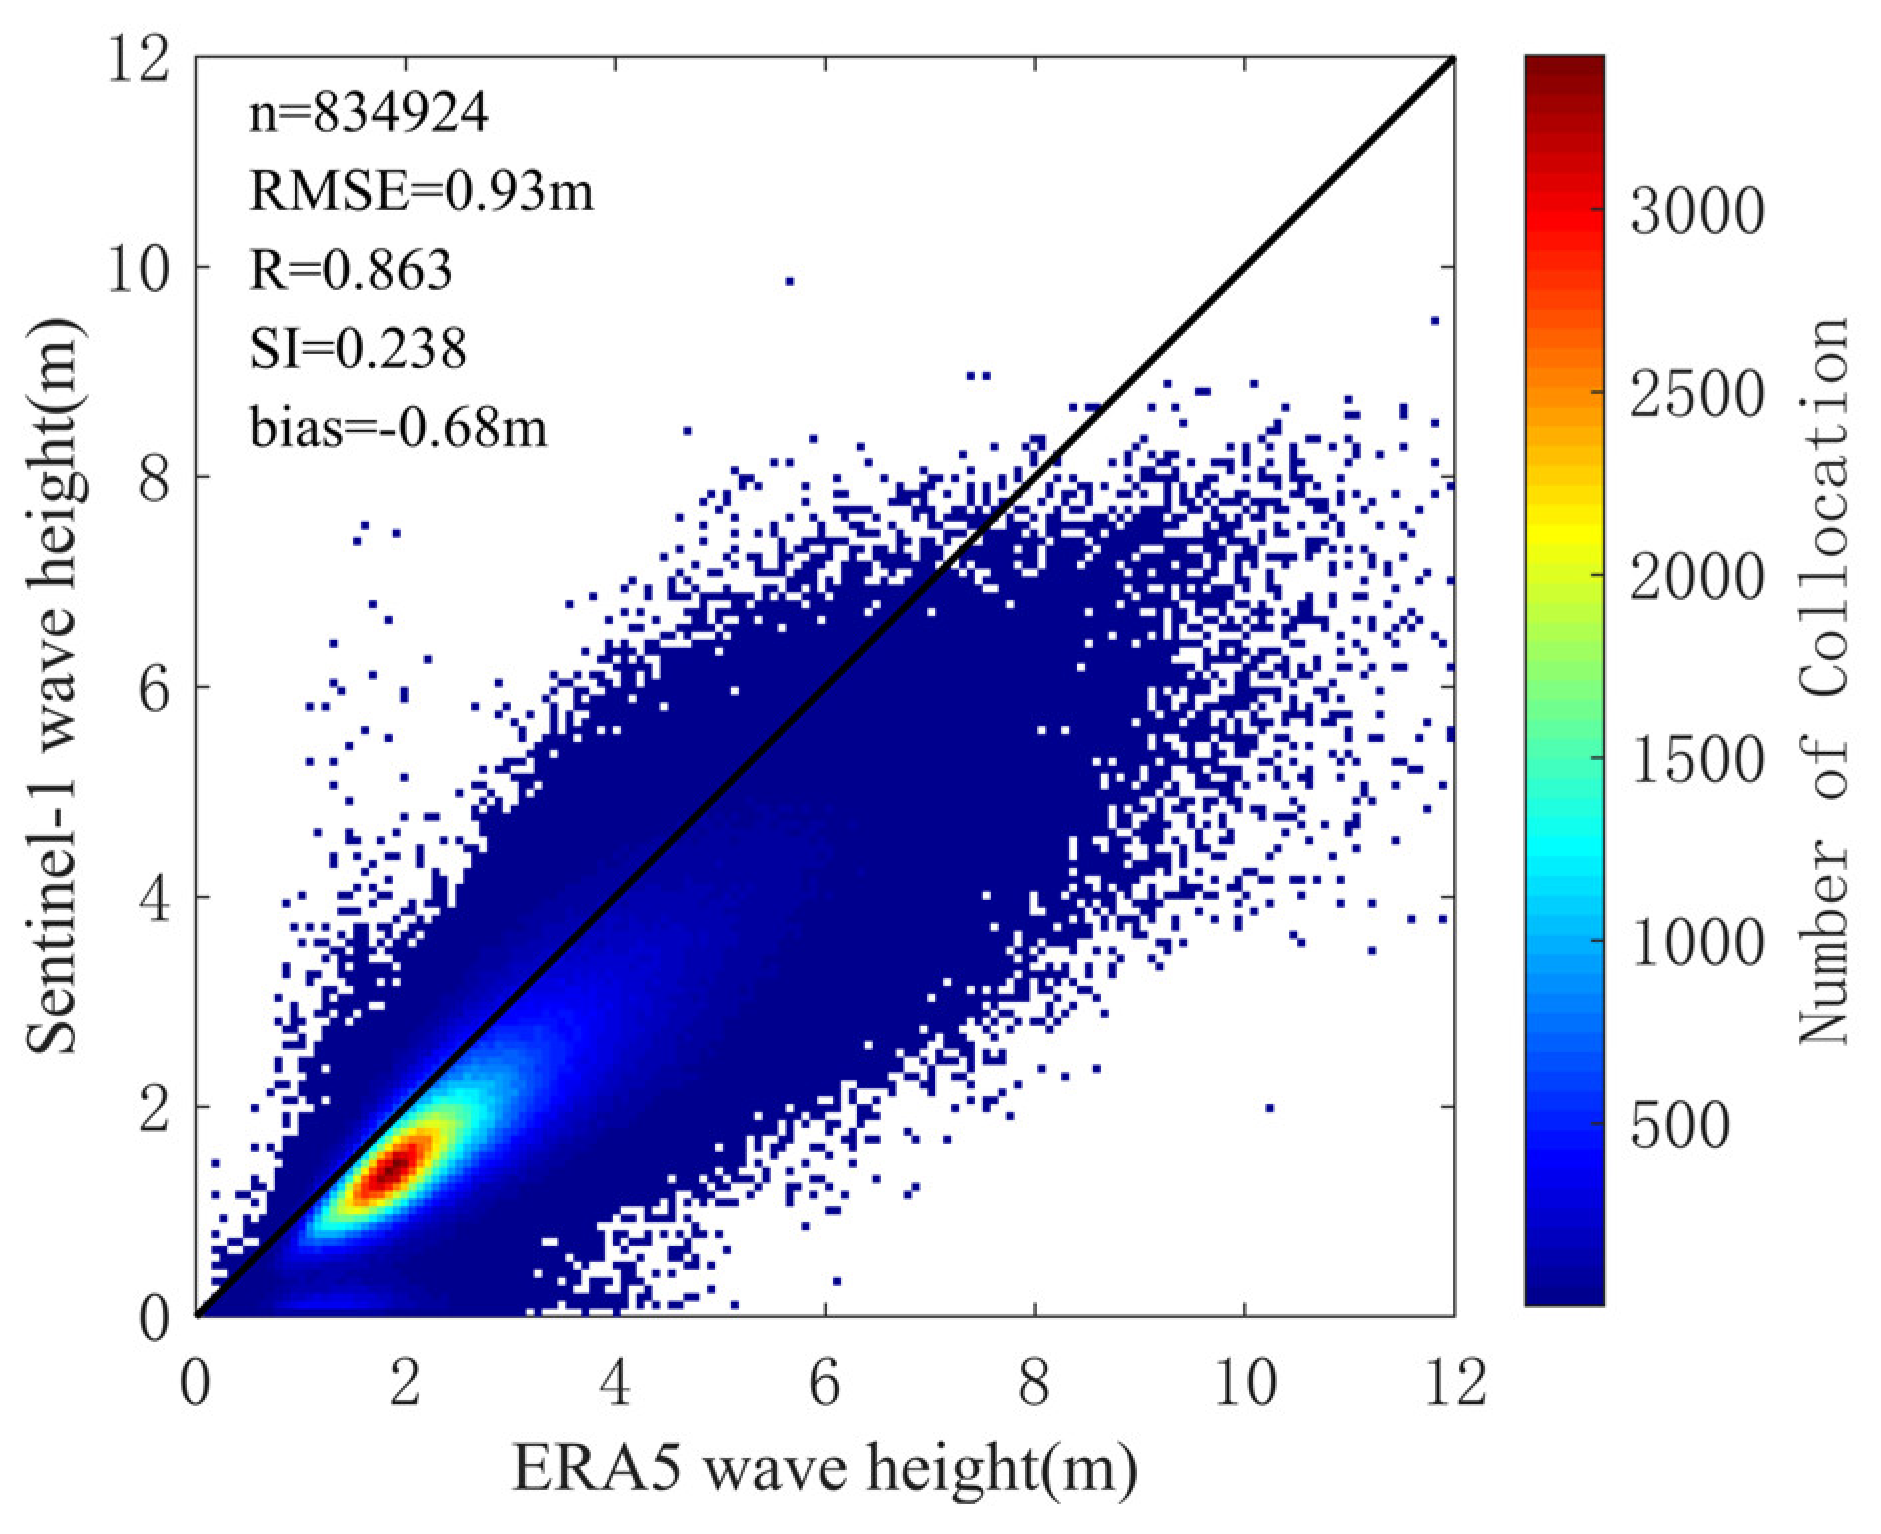
Section 2.2.3, this study implemented the evaluation of Sentinel-1 wave height based on the ERA5 wave height during 2021. A total of 834,962 pairs of matching results are obtained and the comparison of wave height between ERA5 and Sentinel-1 wave height is shown in Figure 10.
It can be seen from Figure 10 that the wave height of Sentinel-1 is mostly smaller than that of ERA5 with an RMSE of 0.93 m. As the wave height increases, the deviation of the collocated data gradually become larger. The main reason is that Sentinel-1 is sensitive to swells while insensitive to wind waves. The ocean waves are composed of wind waves and swell, so the Sentinel-1 wave height is mostly smaller than that of ERA5.
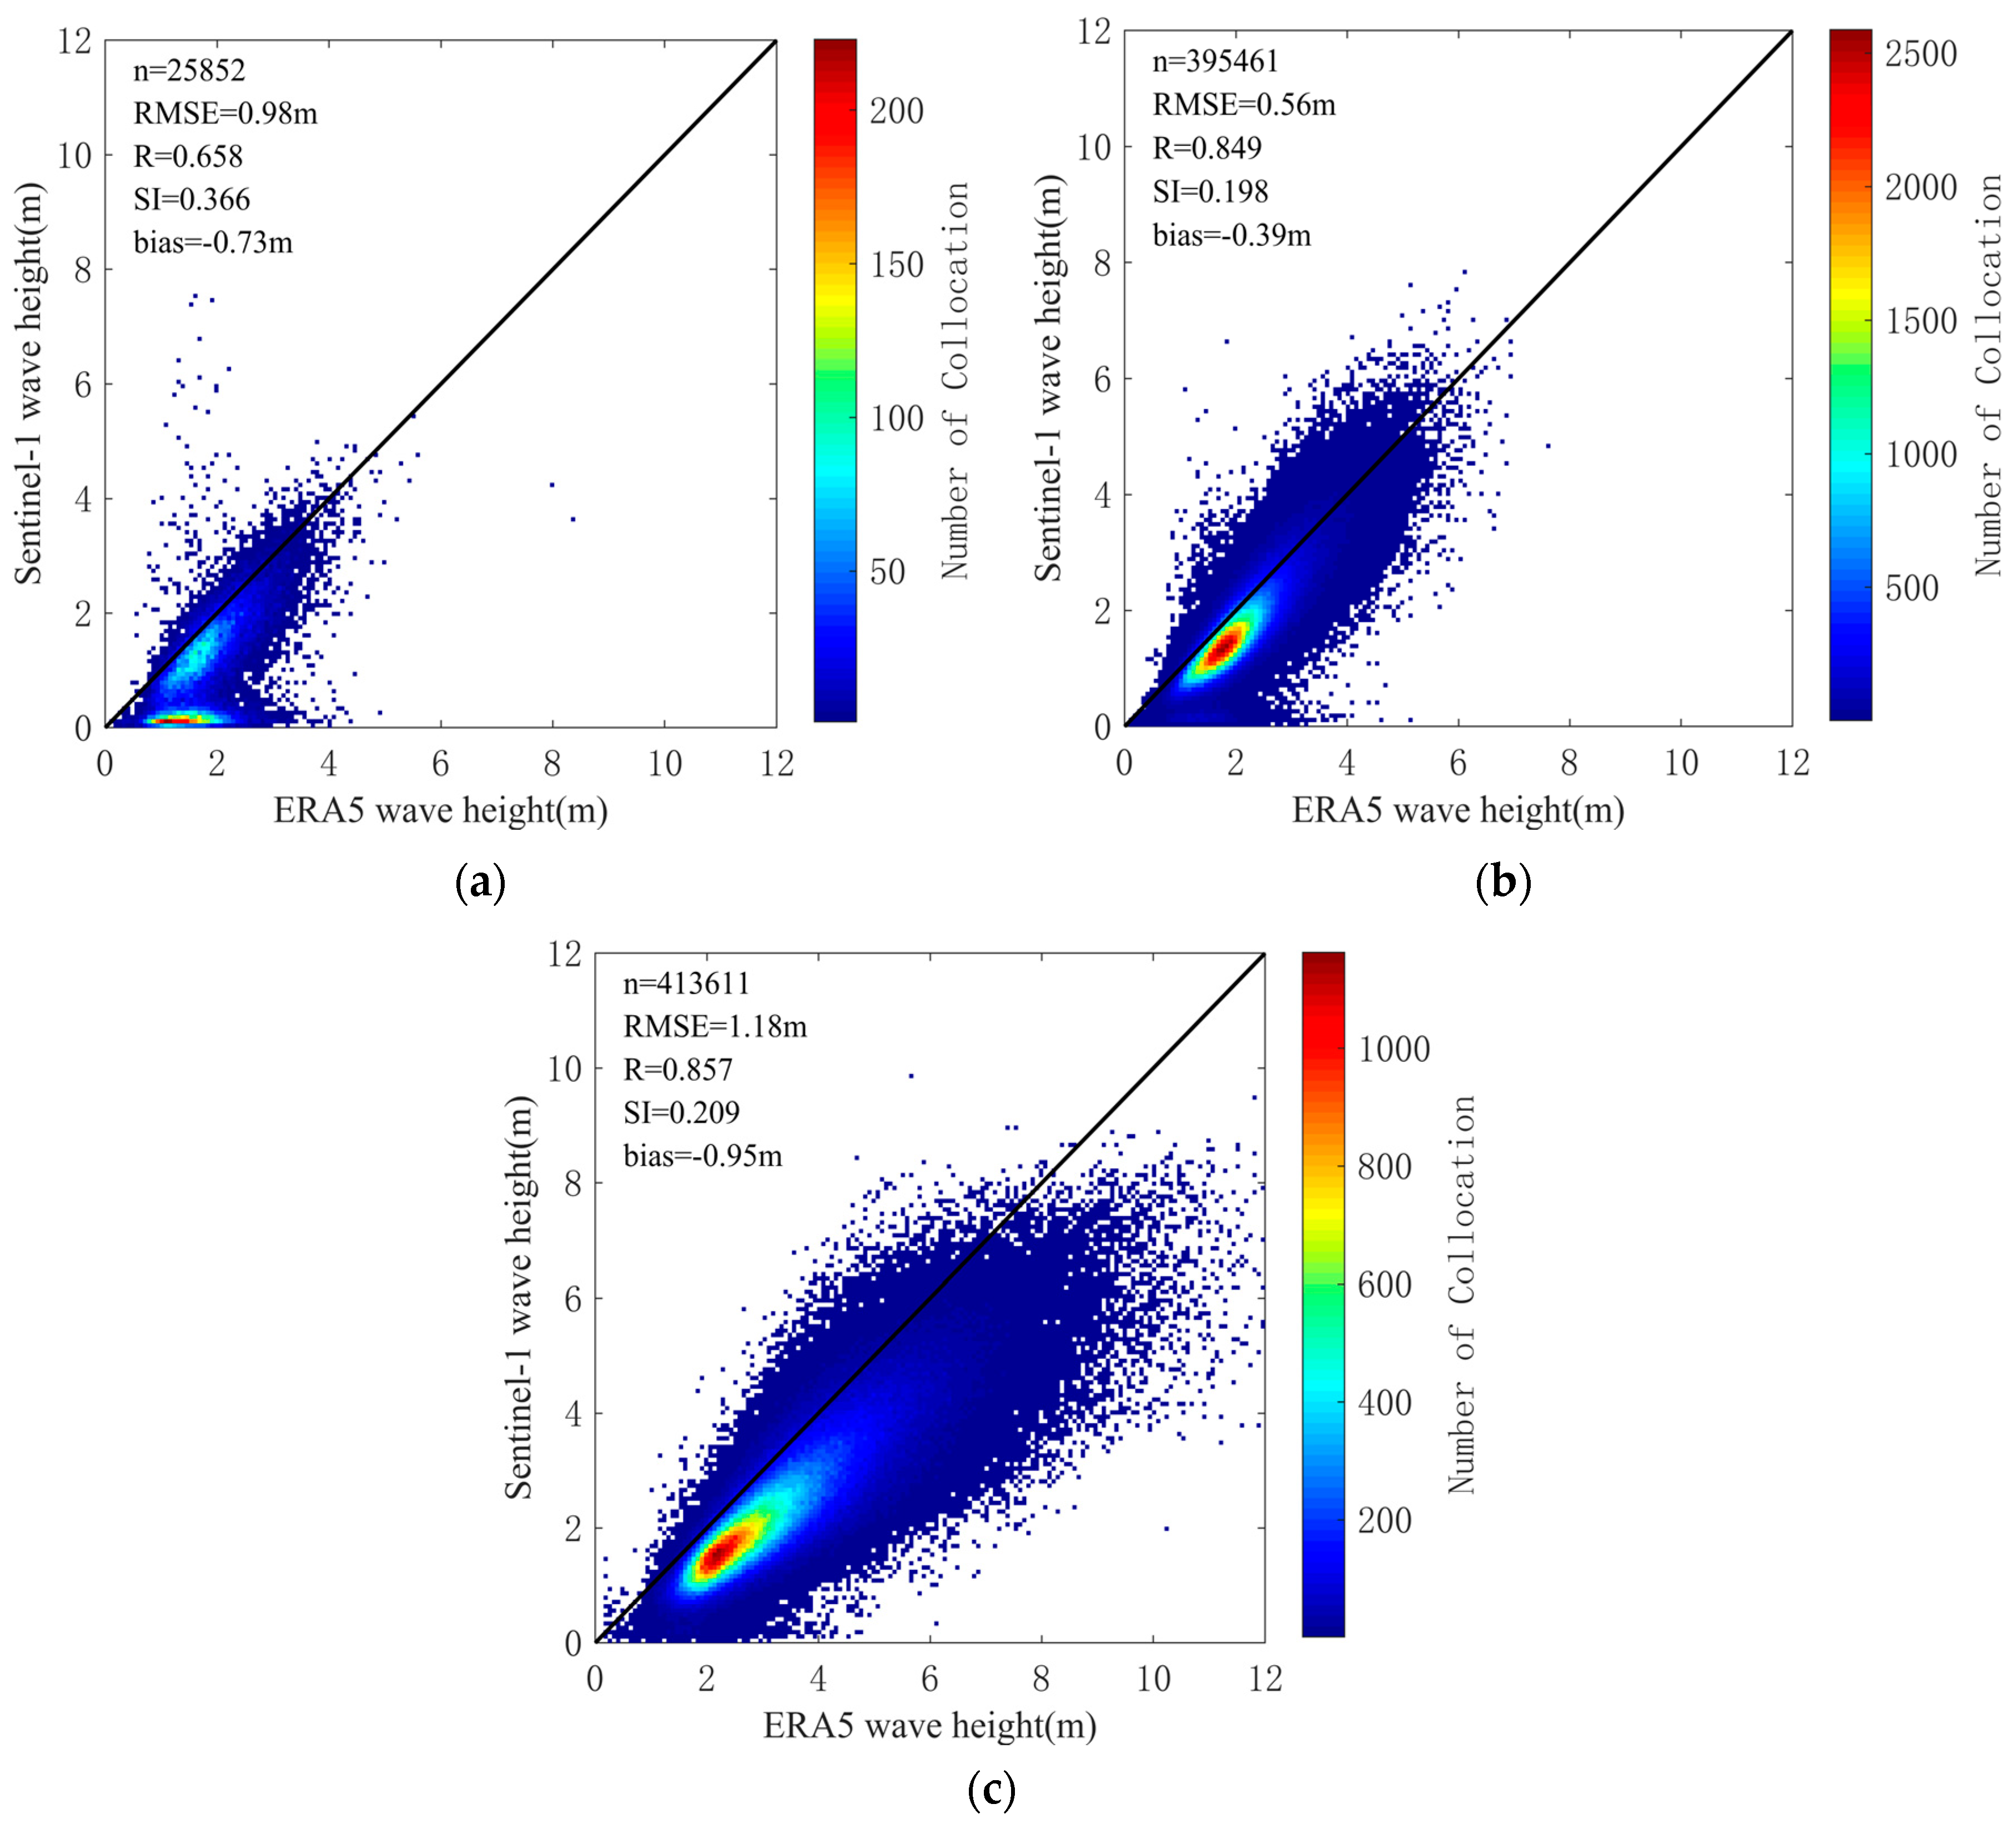
Wind is a crucial factor in influencing the variation of wave height, which is also a significant factor in affecting SAR observation. In order to evaluate the accuracy of Sentinel-1 wave height under different wind speed conditions, the evaluation was carried out under the same wind speed situations that mentioned in Section 3.2. The comparison results are shown in Figure 11.
It can be seen from Figure 11 that the accuracy of Sentinel-1 wave height data is relatively poor at low and high wind speeds with an RMSE of 0.98 m and 1.18 m separately and the best result show under medium wind speeds with an RMSE of 0.56 m, which reach the similar conclusion when comparing Sentinel-1 wave height to that of NDBC buoys. However, a difference shows that there are two densely distributed areas of col-located wave heights under the low wind speed condition, one is relatively good results while the other shows clear observation errors, which indicates that observations from Sentinel-1 under low wind speed condition dominated by swell may still exhibit significant errors. Overall, the error of Sentinel-1 gradually become more pronounced as the wind speed increases.
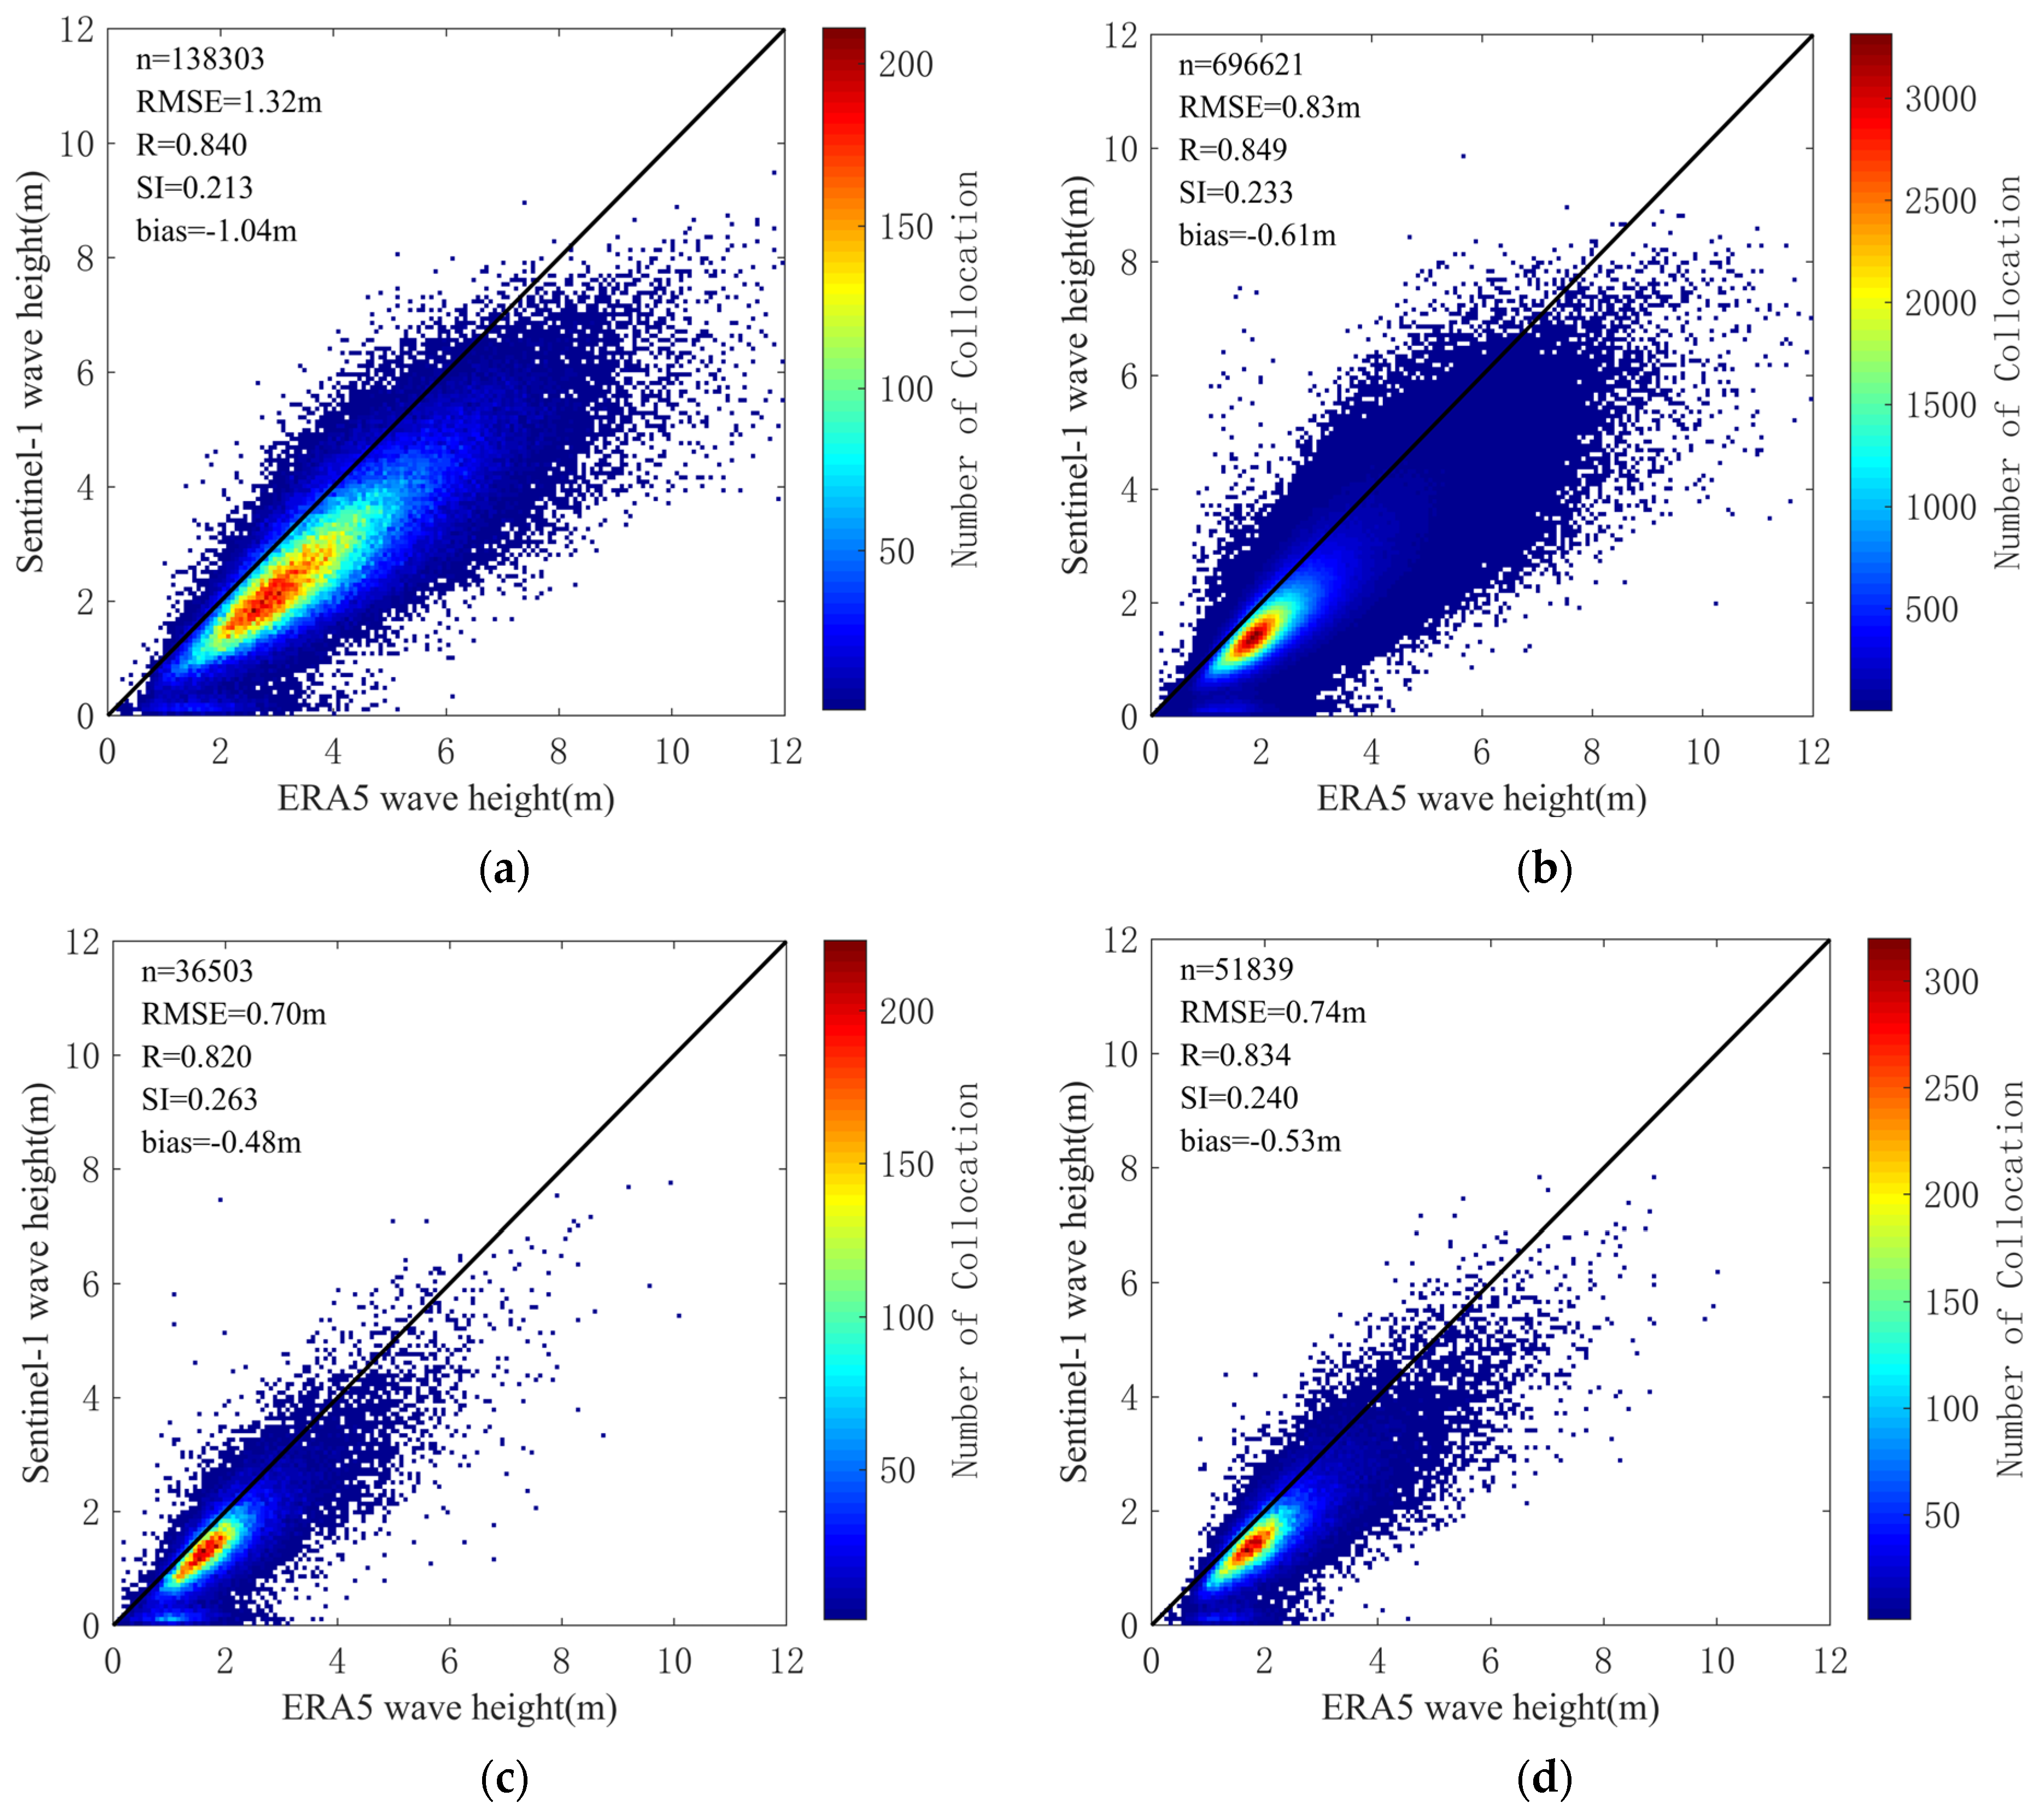
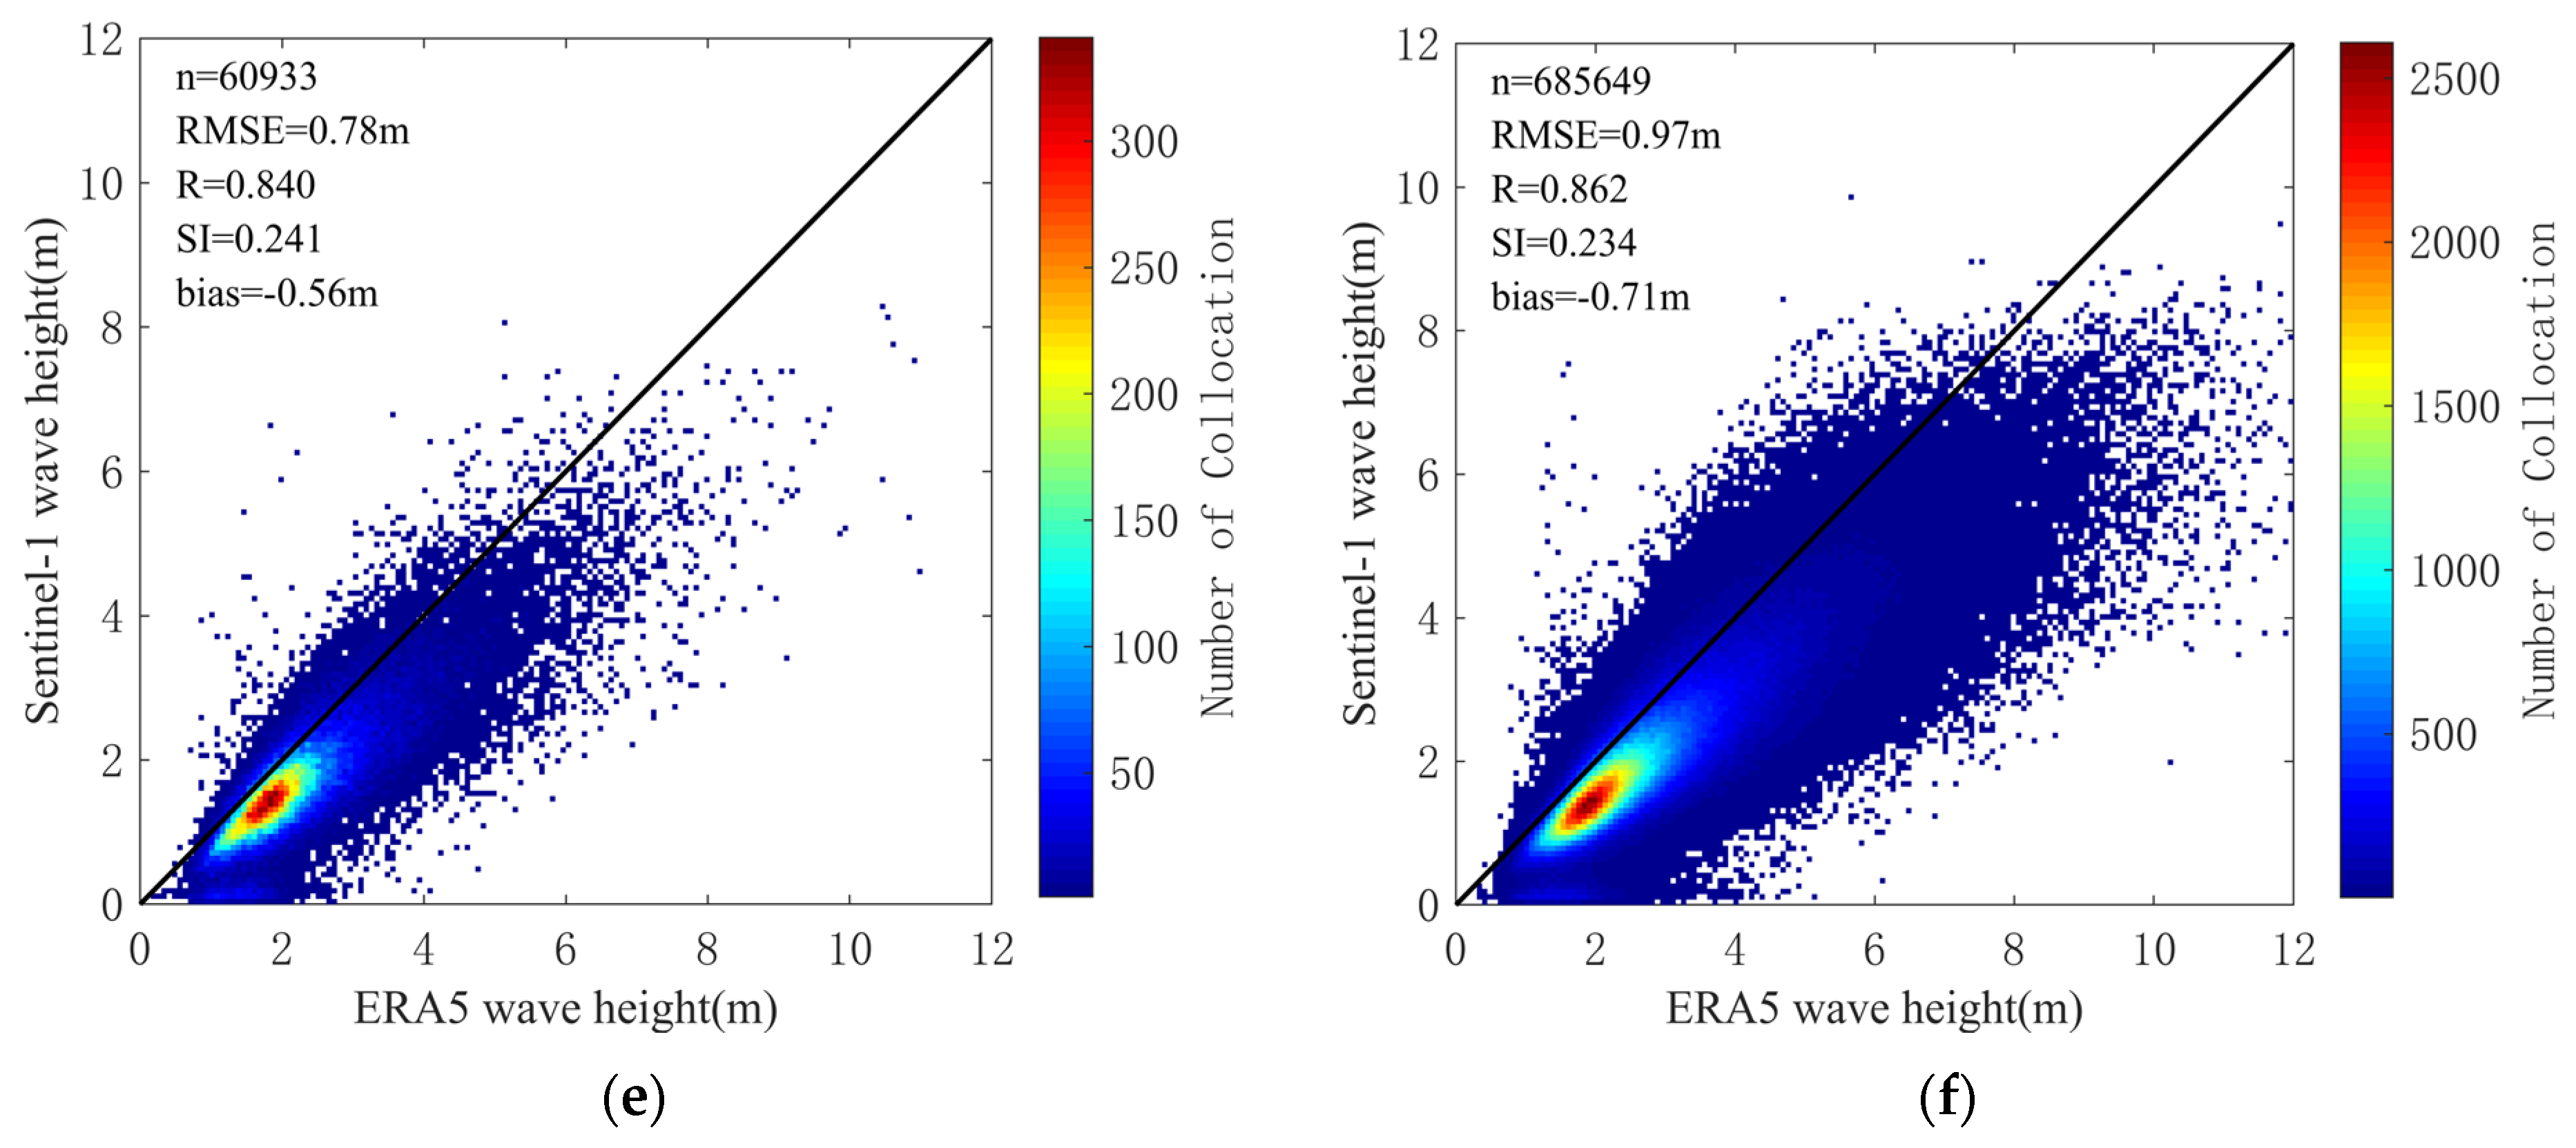
In order to evaluate the accuracy of Sentinel-1 wave height in different offshore distances and latitudes, this study divided the data into six regions (high regions with latitude greater than 50°, mid-low latitude regions with latitude less than 50°, offshore regions with offshore distance less than 100 km, 200 km, 300 km, and open ocean regions with offshore distance more than 300 km) based on ERA5 wave height The accuracy evaluation results of Sentinel-1 wave height data in different regions are shown in Figure 12.
It can be seen from Figure 12 that the accuracy of Sentinel-1 wave height in the mid-low latitude regions, which the RMSE is 0.83 m, is significantly better than that of the high latitude regions with an RMSE of 1.32 m. This indicates that Sentinel-1 has better observations in mid-low latitude regions than in high latitude regions. This may be related to the frequent high wind speed in high latitude regions. Besides, the RMSE value of Sentinel-1 wave height gradually increases as the offshore distance increases. The accuracy of Sentinel-1 wave height is optimal with an RMSE of 0.70 m when the offshore distance is less than 100 km while the maximum error occurs when the offshore distance exceeds 300 km. The reason may be that the high wind speed areas increase as the offshore distance increases.

3.4. The Assessment of Sentinel-1 Wave Height Based on CMEMS Wave Height

According to the spatial-temporal matching and wave height evaluation methods introduced in Section 2.2.1 and 
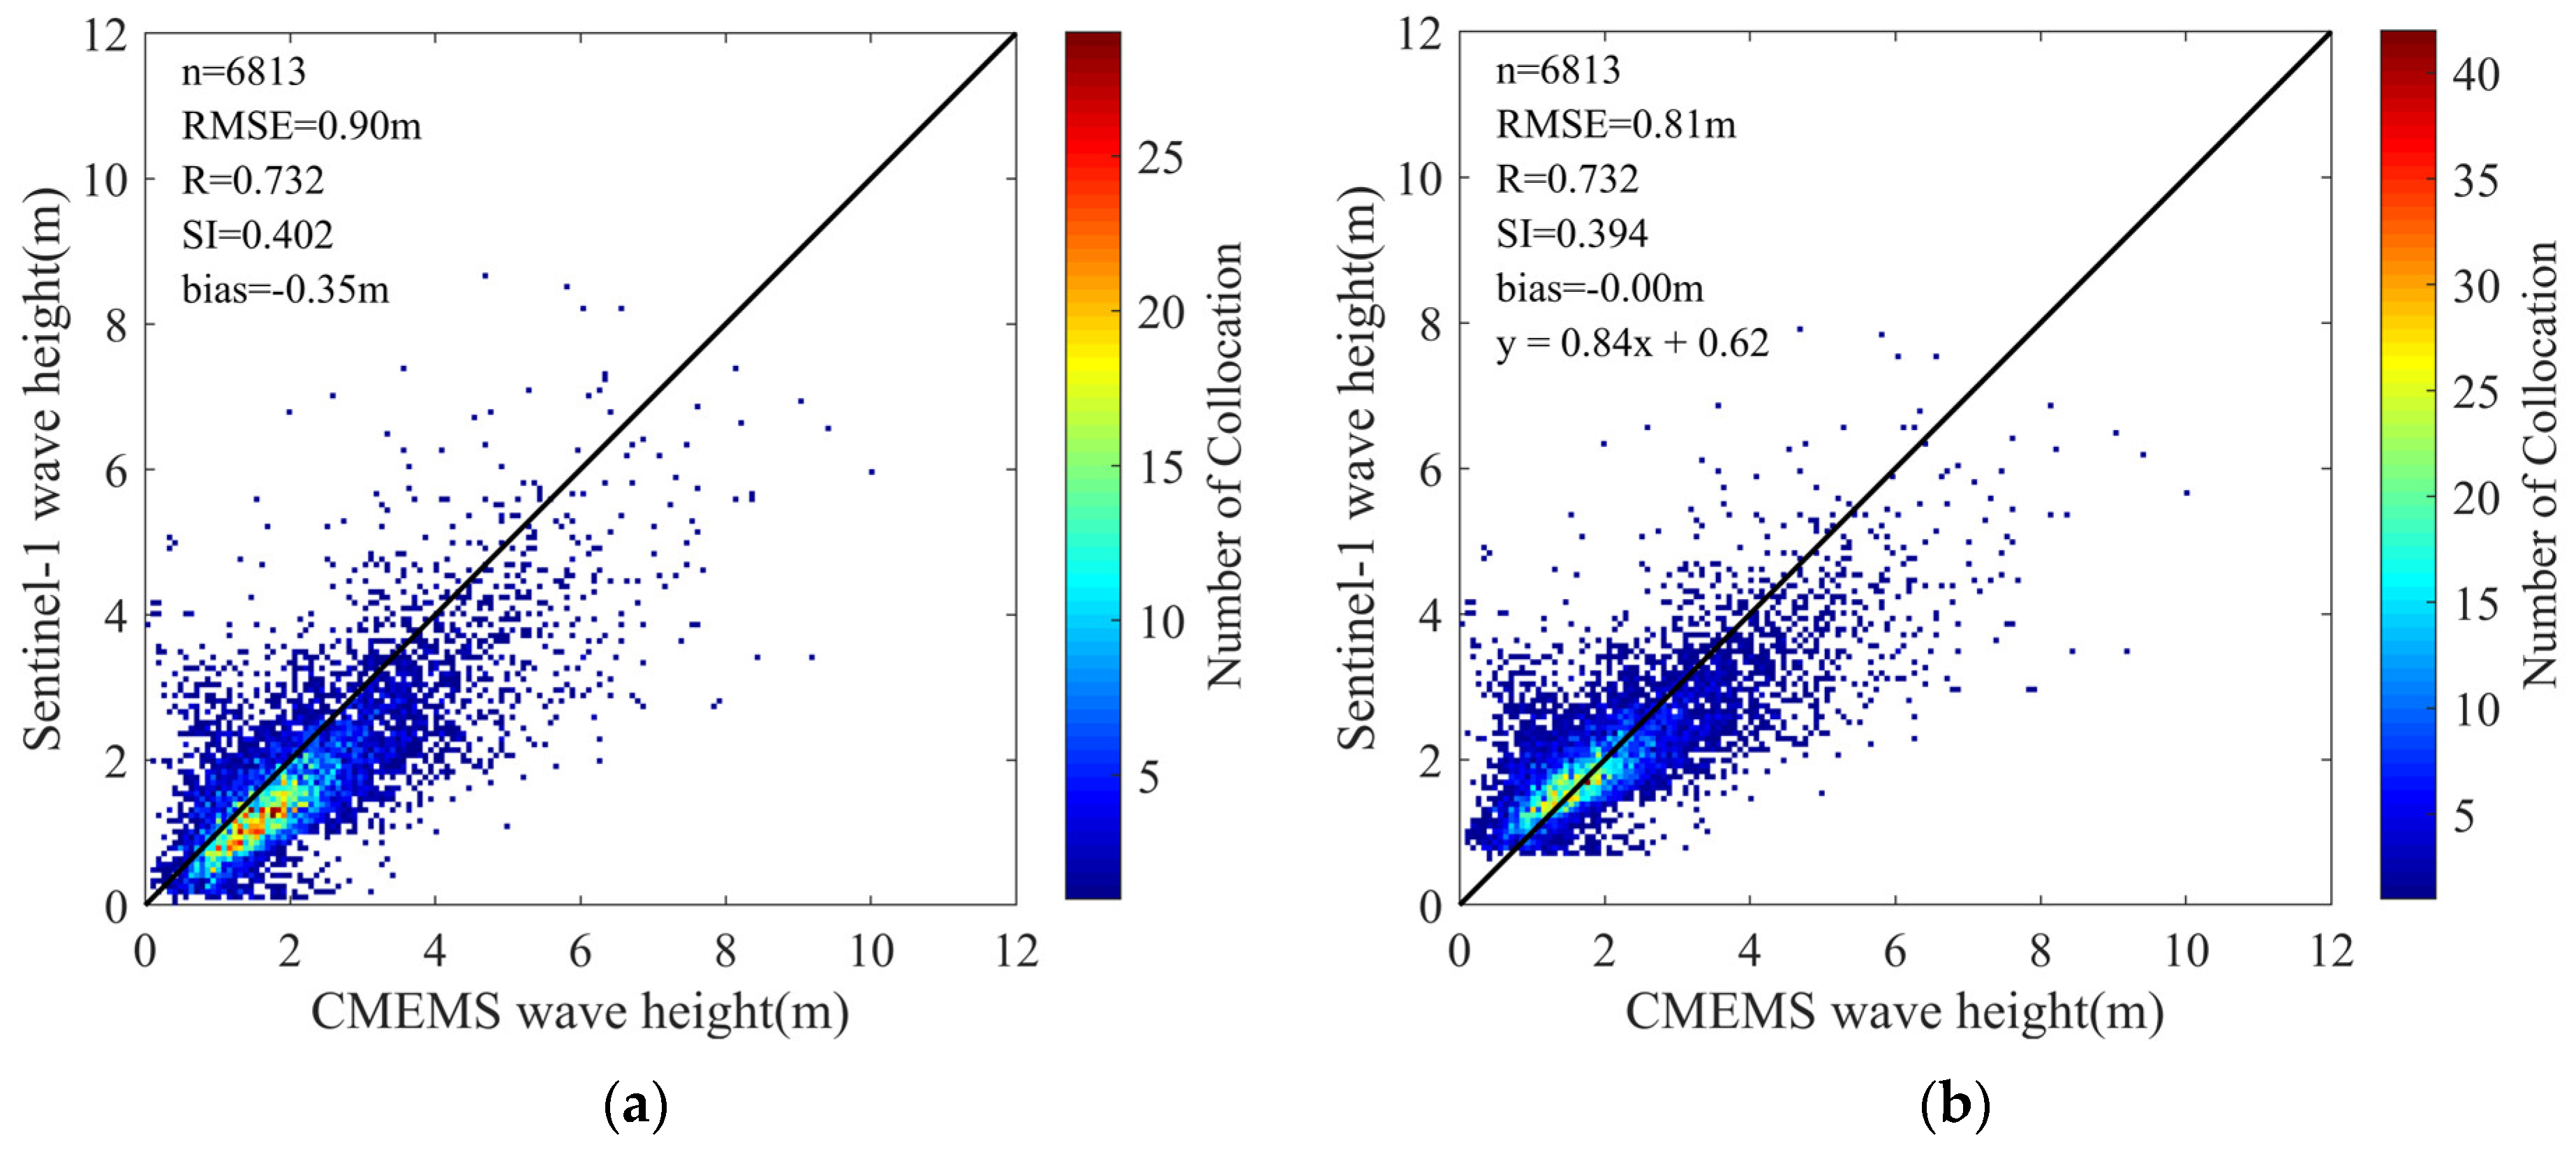
Section 2.2.3, this study implemented the global Sentinel-1 wave height evaluation based on the quality-controlled CMEMS wave height. A total of 6813 pairs of matching data were obtained. During the spatial-temporal matching, the buoy data with the closest spatial-temporal distance is selected as the target. The evaluation results of Sentinel-1 and CMEMS wave height are shown in Figure 13.
It can be seen from Figure 13 that the wave height of Sentinel-1 is mostly smaller than that of CMEMS buoys and the degree of dispersion between them becomes larger as the wave height increases, which is consistent with the comparison between Sentinel-1 and NDBC buoy spectra wave height. The Sentinel-1 wave height correction is implemented by linear regression based on the matching points. Compared with the CMEMS wave height, the accuracy of the corrected Sentinel-1 wave height is improved, and the RMSE is reduced from 0.9 m to 0.81 m.
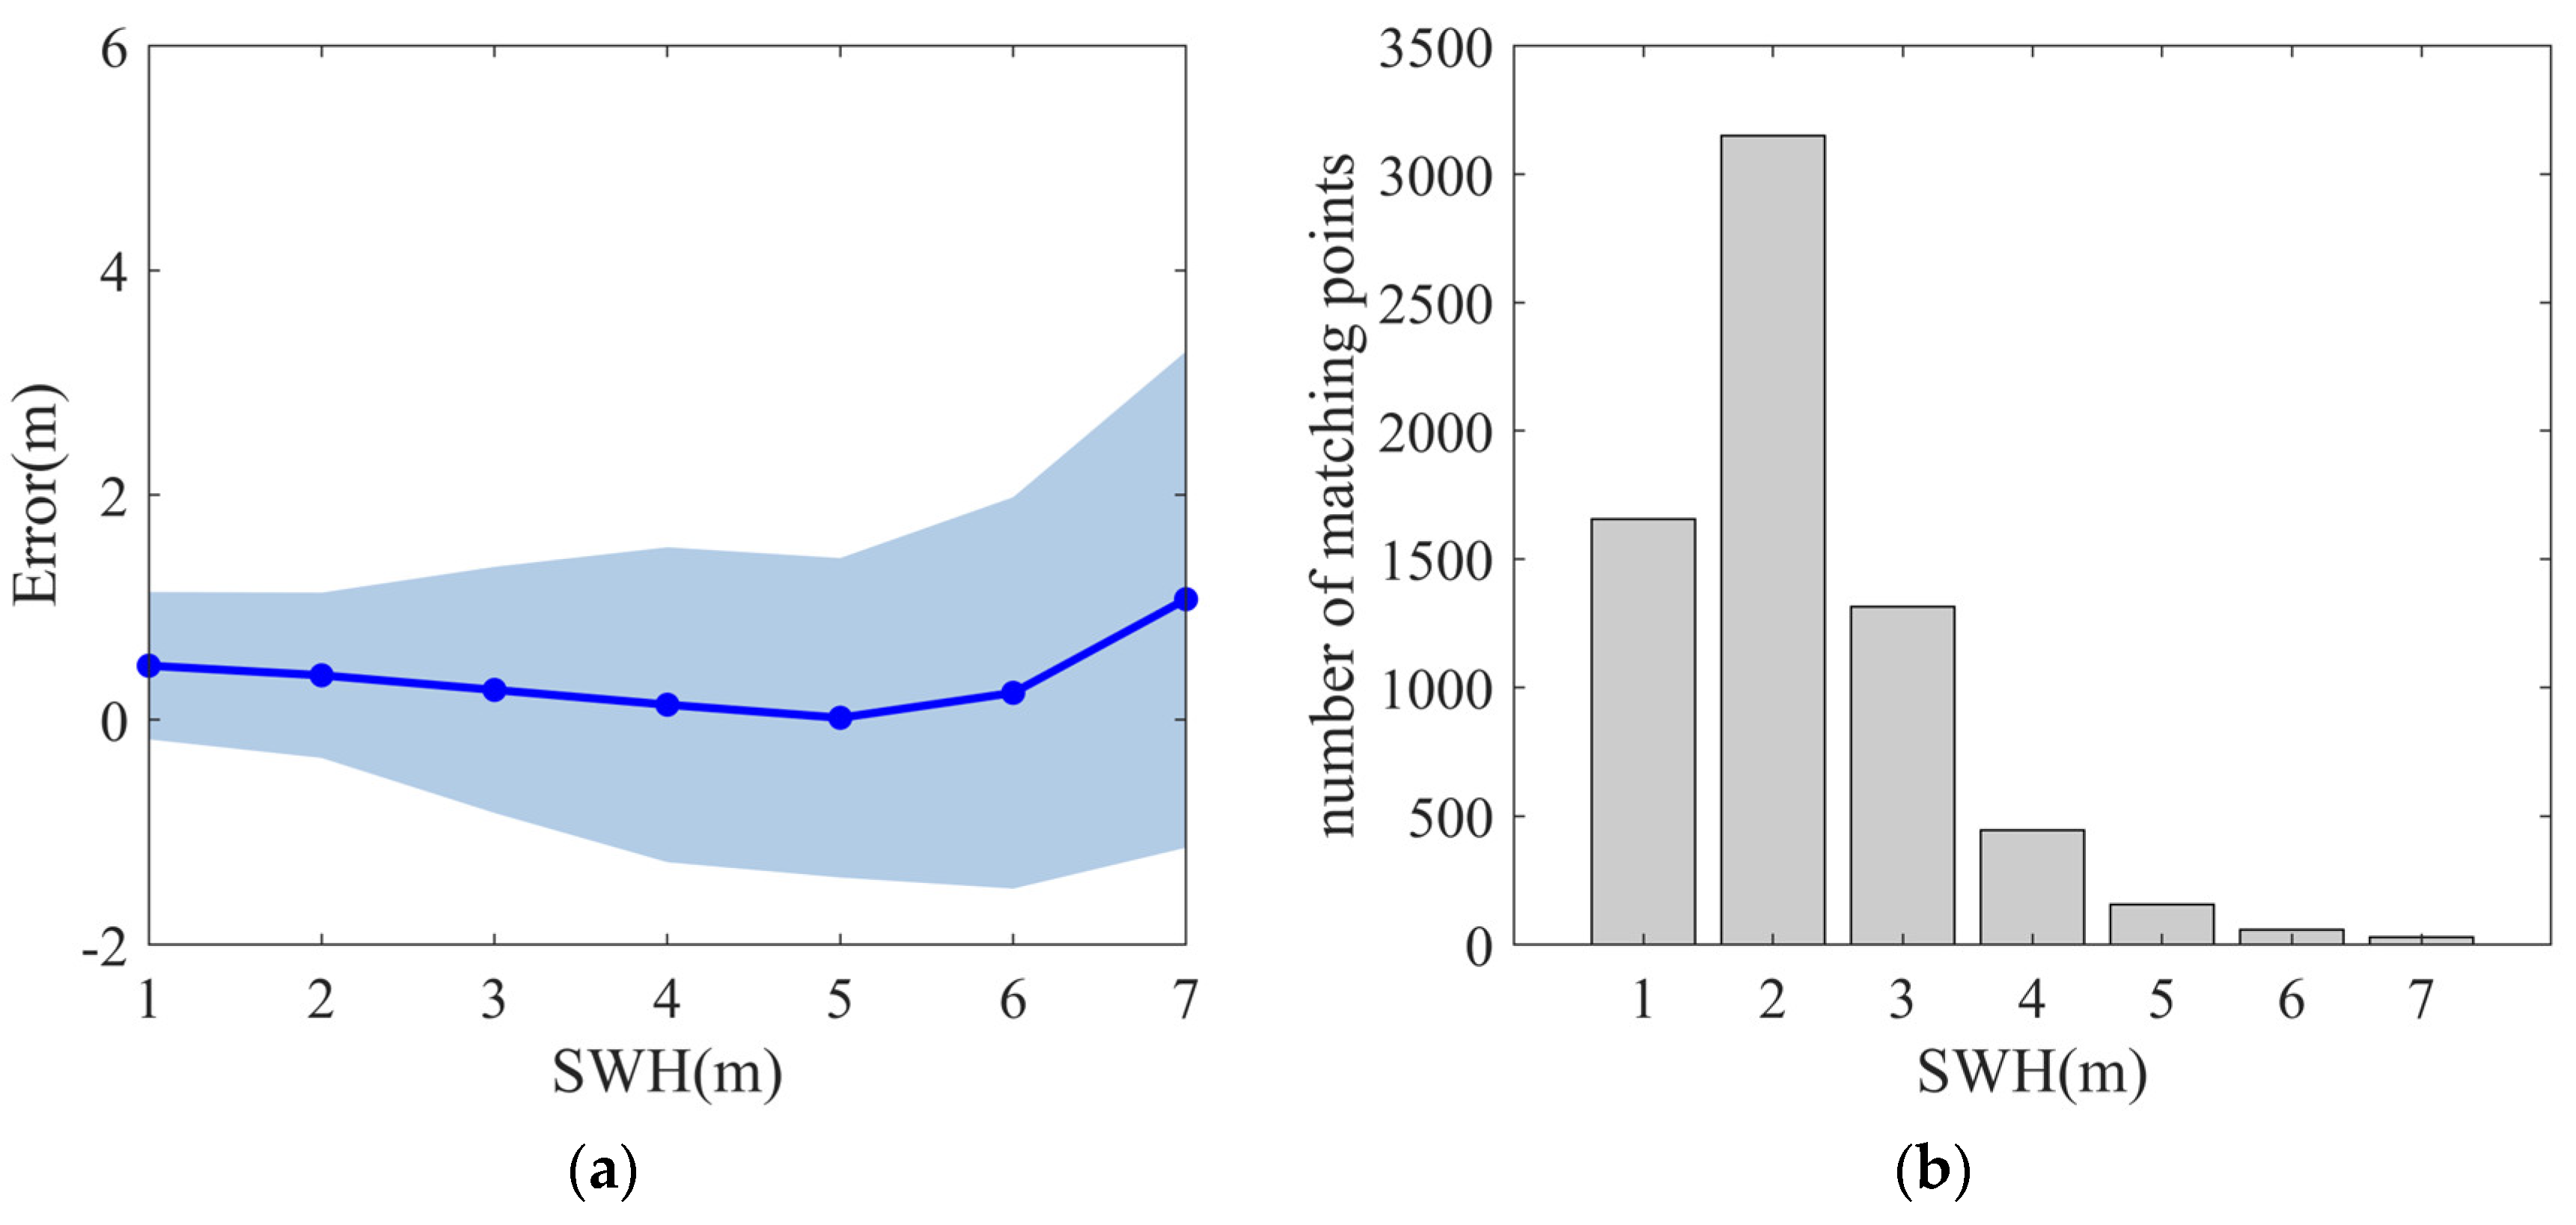
In order to analyze the variation of Sentinel-1 wave height data accuracy with wave height, the evaluation of Sentinel-1 wave height is carried out with 1 m intervals, and error statistical parameters are calculated, respectively. The results are shown in Figure 14. The X-axis represents the segmentation range in the figure. For example, 1 means that the wave height value is between 0 and 1 m, and 7 means the wave height is greater than 6 m. Figure 14a is the error map of the wave height segment, the center point is the bias value, and the upper and lower limits are the RMSE value, respectively. Figure 14b shows the matching data volume of wave height segment.
It can be seen from Figure 14 that the bias gradually decreases within 0–5 m, reaches the minimum value at 4–5 m and then increases. The value of RMSE is the smallest at the wave height of 0–1 m, and the value of RMSE becomes larger as the wave height increases. The Sentinel-1 wave height error shows a trend of increasing with the increase of wave height. When the wave height is greater than 4 m the error increases obviously, which may be related to the obvious reduction of matching data or wind waves.

4. Conclusions

The accuracy of the Sentinel-1 wave spectra of wave mode L2 product from 2016 to 2021 was evaluated in terms of wave spectra and wave height based on the wave spectra of NDBC buoys, ERA5 wave height and wave height of CMEMS buoys The main content includes the evaluation of Sentinel-1 ocean wave spectra, the evaluation of Sentinel-1 ocean wave height and its precision in different sea areas, different sea conditions, different seasons, wind speed conditions, and wave height ranges. The main conclusions are as follows.
For the evaluation of Sentinel-1 spectra data, the comparisons of ocean wave spectra between Sentinel-1 and NDBC buoys show that the spectral shape of Sentinel-1 is relatively accurate, and the CORR of the matching results in the 0.1° and 0.2° spatial windows accounted for 56.7% and 55.9% respectively. However, the accuracy of the spectra value is not good, the proportions of MR less than 0.5 are 27.5% and 24.9%, respectively, which indicates that the accuracy of spectral value of the wave spectra need to be further improved. Furthermore, the observations of Sentinel-1 wave spectra have best accuracy in season autumn and worst accuracy in season summer. The ‘surfboard sampling’ has an obvious effect on Sentinel-1 wave spectra and the accuracy of Sentinel-1 wave spectra improved when implementing the spectra shift. In addition, limited by the working principle of its instruments, Sentinel-1 is more accurate in the observation of low-frequency swells and there is a large error in the observation of wind waves with high frequency.
For the evaluations of Sentinel-1 wave height data, the comparison between Sentinel-1 wave height and NDBC buoy spectral wave height shows that the wave height of Sentinel-1 is generally smaller than that of NDBC buoys, and the RMSE is 0.91 m, which indicated that there is an error in the wave height data of Sentinel-1. In addition, the accuracy of Sentinel-1 wave heights is relatively good at medium wind speeds and low-middle latitude areas, while the accuracy in high wind speeds, high latitudes, is relatively poor.
The comparison results between Sentinel-1 wave height and ERA5 wave height show that the wave height of Sentinel-1 is smaller than that of ERA5 with an RMSE of 0.93 m. Furthermore, Sentinel-1 has the best observation accuracy under 3–8 m/s wind speed condition and the RMSE is 0.56 m. Although the observations of swell are more accurate, there are two densely distributed areas of col-located wave heights under the 0–3 m/s wind speed conditions, which indicates observations from Sentinel-1 under low wind speed condition dominated by swell may still exhibit significant errors. Besides, the offshore distance is also related to the observation accuracy of Sentinel-1 and the RMSE of the assessment results increases as the offshore distance increases, which may be related to the greater occurrence of high wind speed areas.
The comparison results between Sentinel-1 wave height and CMEMS buoy wave height show that the wave height of Sentinel-1 is generally smaller than that of CMEMS buoy wave height and the RMSE is 0.9 m, which is consistent with the comparison result of Sentinel-1 and NDBC buoy wave spectra data. After linear regression correction, the accuracy of the corrected Sentinel-1 wave height is improved compared with the CMEMS wave height, and the RMSE is reduced from 0.9 m to 0.81 m. The evaluation results of wave height in bins of buoy wave height of 1 m show that the wave height error of Sentinel-1 generally presents a trend of increasing with the increasing of wave height. In general, the Sentinel-1 spectra data at low-middle latitude areas and open ocean areas under moderate wind speeds should be given priority to selecting in data applications, and the Sentinel-1 spectra data at high latitude areas and under the excessively high or low wind speeds should be avoided.

Author Contributions

Conceptualization, F.S. and J.Y.; formal analysis, F.S., J.Y. and W.C.; funding acquisition, J.Y.; investigation, F.S., J.Y. and W.C.; methodology, F.S.; validation, F.S. and J.Y.; writing—original draft, F.S.; writing—review and editing, J.Y. All authors have read and agreed to the published version of the manuscript.

Funding

This research was funded by National Natural Science Foundation of China (Grant No. 62231028 & 51839002) and Dragon 5 Project (ID. 58900).

Data Availability Statement

The authors confirm that the data supporting the research of this study are available online. The Sentinel-1 Level 2 OCN Measurement Data can be downloaded from Copernicus website (https://dataspace.copernicus.eu, accessed on 5 July 2022); The NDBC buoy data can be download from National Data Buoy Center (NDBC) of National Oceanic and Atmospheric Administration (NOAA) (https://www.ndbc.noaa.gov/data/historical/swden, accessed on 22 July 2022); The CMEMS Buoys Wave Height Data can be downloaded from https://data.marine.copernicus.eu/product/INSITU_GLO_WAV_DISCRETE_MY_013_045 (accessed on 5 April 2022). The ERA5 wave height data can be downloaded from ECMWF website (https://www.ecmwf.int/en/forecasts/dataset/ecmwf-reanalysis-v5, accessed on 26 December 2023).

Acknowledgments

The authors would like to thank Copernicus for the distribution of the Sentinel-1 Level 2 OCN measurement data and CMEMS buoy data, the NOAA for the distribution of NDBC buoy data and the ECMWF for the distribution of ERA5 wave height data.

Conflicts of Interest

The authors declare no conflict of interest.

References

  1. Amarouche, K.; Akpınar, A.; Rybalko, A.; Myslenkov, S. Assessment of SWAN and WAVEWATCH-III models regarding the directional wave spectra estimates based on Eastern Black Sea measurements. Ocean Eng. 2023, 272, 113944. [Google Scholar] [CrossRef]
  2. Collins, C.O.; Vincent, C.L.; Graber, H.C. A statistical method for correlating paired wave spectra. J. Atmos. Ocean. Technol. 2015, 32, 2130–2146. [Google Scholar] [CrossRef]
  3. Liang, G.Z.; Yang, J.G.; Wang, J.C. Accuracy Evaluation of CFOSAT SWIM L2 Products Based on NDBC Buoy and Jason-3 Altimeter Data. Remote Sens. 2021, 13, 887. [Google Scholar] [CrossRef]
  4. Lotfi, A.; Jean, M.L. On the Impact of the Assimilation of SARAL/AltiKa Wave Data in the Operational Wave Model MFWAM. Mar. Geod. 2015, 38 (Suppl. 1), 381–395. [Google Scholar]
  5. Beal, R.C.; Tilley, D.G.; Monaldo, F.M. Large-and small-scale spatial evolution of digitally processed ocean wave spectra from SEASAT synthetic aperture radar. J. Geophys. Res. Oceans 1983, 88, 1761–1778. [Google Scholar] [CrossRef]
  6. Kerbaol, V.; Chapron, B.; Vachon, P.W. Analysis of ERS-1/2 synthetic aperture radar wave mode imagettes. J. Geophys. Res. Oceans 1998, 103, 7833–7846. [Google Scholar] [CrossRef]
  7. Hauser, D.; Soussi, E.; Thouvenot, E.; Rey, L. SWIMSAT: A real-aperture radar to measure directional spectra of ocean waves from space—Main characteristics and performance simulation. J. Atmos. Ocean. Technol. 2001, 18, 421–437. [Google Scholar] [CrossRef]
  8. Xu, Y.; Hauser, D.; Liu, J.; Si, J.; Yan, C.; Chen, S.; Meng, J.; Fan, C.; Liu, M.; Chen, P. Statistical comparison of ocean wave directional spectra derived from SWIM/CFOSAT satellite observations and from buoy observations. IEEE Trans. Geosci. Remote Sens. 2022, 60, 1–20. [Google Scholar] [CrossRef]
  9. Jiang, H.; Mironov, A.; Ren, L.; Babanin, A.V.; Wang, J.; Mu, L. Validation of wave spectral partitions from SWIM instrument on-board CFOSAT against in situ data. IEEE Trans. Geosci. Remote Sens. 2021, 60, 4204013. [Google Scholar] [CrossRef]
  10. Hauser, D.; Tourain, C.; Hermozo, L.; Alraddawi, D.; Aouf, L.; Chapron, B.; Dalphinet, A.; Delaye, L.; Dalila, M.; Dormy, E.; et al. New observations from the SWIM radar on-board CFOSAT: Instrument validation and ocean wave measurement assessment. IEEE Trans. Geosci. Remote Sens. 2020, 59, 5–26. [Google Scholar] [CrossRef]
  11. Li, S.; Yu, H.; Wu, K.; Yin, X.; Lang, S.; Ye, J. Validation of the Ocean Wave Spectrum from the Remote Sensing Data of the Chinese–French Oceanography Satellite. Remote Sens. 2023, 15, 3918. [Google Scholar] [CrossRef]
  12. Ramon, T.; Paul, S.; Dirk, G.; David, B.; Malcolm, D.; Evert, A.; Pierre, P. GMES Sentinel-1 mission. Remote Sens. Environ. 2012, 120, 9–24. [Google Scholar]
  13. ESA. Sentinel-1 Annual Performance Report for 2021. ESA. 04 March 2022. Available online: https://sentinel.esa.int/documents/247904/4776206/DI-MPC-APR-523-1-1-Annual%20Performance%20Report%202021.pdf/9a5bf9a7-b8b7-4b6b-e3c0-ce23bdb565b8 (accessed on 7 July 2023).
  14. Khan, S.S.; Echevarria, E.R.; Hemer, M.A. Ocean Swell Comparisons Between Sentinel-1 and WAVEWATCH III Around Australia. J. Geophys. Res. Oceans 2021, 126, e2020JC016265. [Google Scholar] [CrossRef]
  15. Wang, X.; Husson, R.; Jiang, H.; Chen, G.; Gao, G. Evaluation on the capability of revealing ocean swells from Sentinel-1A wave spectra measurements. J. Atmos. Ocean. Technol. 2020, 37, 1289–1304. [Google Scholar] [CrossRef]
  16. Wang, H.; Mouche, A.; Husson, R.; Grouazel, A.; Chapron, B.; Yang, J. Assessment of ocean swell height observations from Sentinel-1A/B wave mode against buoy in situ and modeling hindcasts. Remote Sens. 2022, 14, 862. [Google Scholar] [CrossRef]
  17. ESA. Sentinel-1 Ocean Swell Wave Spectra (OSW) Algorithm Definition. Available online: https://sentinel.esa.int/documents/247904/4872200/S1-TN-NRT-52-7450_1_5_OSWAlgorithmDefinition.pdf/fda8787e-468c-d295-6604-22d7db24de2e (accessed on 10 November 2022).
  18. Hersbach, H.; Bell, B.; Berrisford, P.; Hirahara, S.; Horányi, A.; Muñoz-Sabater, J.; Nicolas, J.; Peubey, C.; Radu, R.; Schepers, D.; et al. The ERA5 global reanalysis. Q. J. R. Meteorol. Soc. 2020, 146, 1999–2049. [Google Scholar] [CrossRef]
  19. Liu, J.; Li, B.; Chen, W.; Li, J.; Yan, J. Evaluation of ERA5 wave parameters with in situ data in the South China Sea. Atmosphere 2022, 13, 935. [Google Scholar] [CrossRef]
  20. Wang, J.; Wang, Y. Evaluation of the ERA5 significant wave height against NDBC buoy data from 1979 to 2019. Mar. Geod. 2022, 45, 151–165. [Google Scholar] [CrossRef]
  21. Mouche, A.; Wang, H.; Husson, R.; Guitton, G.; Chapron, B.; Li, H. 2D ocean waves spectra from space: A challenge for validation and synergetic use. In Proceedings of the Remote Sensing of the Oceans and Inland Waters: Techniques, Applications, and Challenges, New Delhi, India, 4–7 April 2016; SPIE: Bellingham, WA, USA, 2016; Volume 9878, pp. 80–95. [Google Scholar]
  22. Peral, E.; Rodríguez, E.; Esteban-Fernández, D. Impact of surface waves on SWOT’s projected ocean accuracy. Remote Sens. 2015, 7, 14509–14529. [Google Scholar] [CrossRef]
Figure 1. The spatial coverage of Sentinel-1 SAR wave mode data during January 2017 and the location of CMEMS buoys used in this study.
Remotesensing 16 00987 g001
Figure 2. The location of NDBC buoys used in this study.
Remotesensing 16 00987 g002
Figure 3. Comparison of 1D ocean wave spectra between Sentinel-1 and No. 41046 NDBC buoys at different times. (a) 17 October 2016; (b) 5 November 2017; (c) 27 May 2019; (d) 19 October 2021.
Remotesensing 16 00987 g003
Figure 4. CORR and MR statistical histogram for the comparisons of wave spectra; (a) MR statistical histogram; (b) CORR statistical histogram.
Remotesensing 16 00987 g004
Figure 5. CORR and MR statistical histogram for the comparisons of wave spectra under different sea conditions; (a) CORR statistical histogram under condition of 0–1 m; (b) MR statistical histogram under condition of 0–1 m; (c) CORR statistical histogram under condition of 1–4 m; (d) MR statistical histogram under condition of 1–4 m; (e) CORR statistical histogram under condition of larger than 4 m; (f) MR statistical histogram under condition of larger than 4 m.
Remotesensing 16 00987 g005
Figure 6. CORR and MR statistical histogram for the comparisons of wave spectra before and after the spectra shift; (a) CORR statistical histogram before spectra shift; (b) CORR statistical histogram after spectra shift; (c) MR statistical histogram before spectra shift; (d) MR statistical histogram after spectra shift.
Remotesensing 16 00987 g006
Figure 7. Comparison of wave height obtained by Sentinel-1 and NDBC buoys. (a) Sentinel-1 and NDBC buoys. (b) Linear rectified Sentinel-1 and NDBC buoys.
Remotesensing 16 00987 g007
Figure 8. Comparison of wave height between linear rectified Sentinel-1 and NDBC buoys at different wind speeds. (a) low wind speeds; (b) medium wind speeds; (c) high wind speeds.
Remotesensing 16 00987 g008
Figure 9. The comparison of linear rectified Sentinel-1 and NDBC wave height in different sea regions. (a) open ocean region; (b) high latitude region; (c) the east coast of the United States; (d) the west coast of the United States.
Remotesensing 16 00987 g009
Figure 10. The comparison of Sentinel-1 and ERA5 wave height during 2021.
Remotesensing 16 00987 g010
Figure 11. Comparison of wave height between Sentinel-1 and ERA5 at different wind speeds. (a) low wind speeds; (b) medium wind speeds; (c) high wind speeds.
Remotesensing 16 00987 g011
Figure 12. The comparison of Sentinel-1 and ERA5 wave height in different regions. (a) regions with latitude greater than 50°; (b) regions with latitude less than 50°; (c) regions with offshore distance less than 100 km; (d) regions with offshore distance less than 200 km. (e) regions with offshore distance less than 300 km; (f) open ocean regions with offshore distance more than 300 km.
Remotesensing 16 00987 g012aRemotesensing 16 00987 g012b
Figure 13. Comparison of wave height obtained by Sentinel-1 and CMEMS buoys. (a) Sentinel-1 and CMEMS buoys. (b) Linear rectified Sentinel-1 and CMEMS buoys.
Remotesensing 16 00987 g013
Figure 14. Comparison between Sentinel-1 and CMEMS buoy wave height in the bin of 1 m. (a) The error map of the wave height segment; (b) The matching data volume of wave height segment.
Remotesensing 16 00987 g014
Table 1. The comparison of wave spectra between NDBC buoys and Sentinel-1 under different seasons and different spatial window.
SeasonSpringSummerAutumnWinter
Spatial Window0.10.20.10.20.10.20.10.2
CORR > 0.760.0%60.2%48.8%46.4%62.2%59.8%55.3%61.5%
MR < 0.750.0%48.0%44.2%41.2%68.9%60.7%59.6%61.5%
MR < 0.526.0%25.2%16.3%12.4%33.3%29.1%27.6%32.8%
Disclaimer/Publisher’s Note: The statements, opinions and data contained in all publications are solely those of the individual author(s) and contributor(s) and not of MDPI and/or the editor(s). MDPI and/or the editor(s) disclaim responsibility for any injury to people or property resulting from any ideas, methods, instructions or products referred to in the content.

