Technical Note

A Single Data Extraction Algorithm for Oblique Photographic Data Based on the U-Net

1
Faculty of Geomatics, Lanzhou Jiaotong University, Lanzhou 730070, China
2
Aerospace Information Research Institute, Chinese Academy of Sciences, Beijing 100094, China
3
STATE GRID Location-Based Service Co., Ltd., Beijing 100015, China
4
SuperMap Software Co., Ltd., Beijing 100015, China
5
Institute of Geographic Sciences and Natural Resources Research, Chinese Academy of Sciences, Beijing 100101, China
6
China Academy of Urban Planning & Design, Beijing 100044, China
7
China Railway Construction Bridge Engineering Bureau Group Co., Ltd., Tianjin 300300, China
8
Faculty of Geographical Science, Beijing Normal University, Beijing 100875, China
9
The Bartlett Centre for Advanced Spatial Analysis, University College London, London W1T 4TJ, UK
*
Author to whom correspondence should be addressed.
These authors contributed equally to this paper.
Remote Sens. 2024, 16(6), 979; https://doi.org/10.3390/rs16060979
Submission received: 1 November 2023 / Revised: 6 December 2023 / Accepted: 12 December 2023 / Published: 11 March 2024

Abstract

:
In the automated modeling generated by oblique photography, various terrains cannot be physically distinguished individually within the triangulated irregular network (TIN). To utilize the data representing individual features, such as a single building, a process of building monomer construction is required to identify and extract these distinct parts. This approach aids subsequent analyses by focusing on specific entities, mitigating interference from complex scenes. A deep convolutional neural network is constructed, combining U-Net and ResNeXt architectures. The network takes as input both digital orthophoto map (DOM) and oblique photography data, effectively extracting the polygonal footprints of buildings. Extraction accuracy among different algorithms is compared, with results indicating that the ResNeXt-based network achieves the highest intersection over union (IOU) for building segmentation, reaching 0.8255. The proposed “dynamic virtual monomer” technique binds the extracted vector footprints dynamically to the original oblique photography surface through rendering. This enables the selective representation and querying of individual buildings. Empirical evidence demonstrates the effectiveness of this technique in interactive queries and spatial analysis. The high level of automation and excellent accuracy of this method can further advance the application of oblique photography data in 3D urban modeling and geographic information system (GIS) analysis.

Graphical Abstract

1. Introduction

Three-dimensional (3D) building modeling involves selecting a single building in the aerial image and the queries for building information, which has significant implications in various fields [1,2]. For instance, 3D building modeling can aid architects, urban planners, and policymakers in making informed decisions about the development, design, and sustainability of buildings and urban spaces [3,4,5]. The accurate 3D models of buildings can help in civil engineering and construction by detecting potential design conflicts, and in disaster management and emergency response by assessing vulnerability or planning evacuation routes [6,7,8]. Three-dimensional modeling is closer to human visual habits, providing more information than two-dimensional (2D) modeling and expressing more spatial relationships. Both group users and individual users have an urgent need for a 3D geographic information system (GIS) [9,10,11]. Three-dimensional building modeling is one of the major functions in 3D GIS applications, the development of which is affected by various factors [12]. The economic cost and time cost of 3D data acquisition were the most critical constraints affecting the wide application of 3D GIS in the early days. With the continuous development of various theories and technologies, such as computer graphics, virtual reality technology, and mapping technology, 3D GIS has gradually become one of the mainstream directions of GIS research in recent years. Instead of manual modeling of 3D data production, new 3D data acquisition methods, such as oblique photogrammetry, have emerged. Oblique photogrammetry uses aircraft to move from vertical to tilt, with multiple sensing devices capturing images simultaneously. The oblique photographic model is generated by automatic batch modeling. The oblique photographic model has the potential to become an important data source of 3D GIS with the advantages of high precision, high efficiency, high realism, and low cost [13,14,15].
The oblique photographic model constructs a continuous triangulated irregular network (TIN) grid. The objects, such as buildings, roads, trees, etc., cannot be selected and expressed singularly in this model [16]. Thus, the basic GIS capabilities, such as query attributes, topical expressions, and spatial queries, are challenging to operate on oblique photographic modeling data. Resolving the problem of building monomer construction using oblique photography has become a hurdle for oblique photographic modeling data used in 3D GIS applications [17]. The traditional method to select a singular building from oblique photography is to separate individual objects by a cutting algorithm [18]. However, this cutting method faces several dilemmas: (1) The cutting operation of the enormous volume of data in the oblique photographic model takes time. The data are often larger than tens or even hundreds of GB. (2) The cutting algorithm brings a lot of redundant data, which affects the performance of browsing. (3) The segmentation of the buildings is difficult because of the unclear boundary between the building and its surrounding environment. (4) Most importantly, after partitioning or segmenting a three-dimensional model or geographic data, the triangulation of the resulting individual three-dimensional model does not meet the topological closure requirements, rendering it unsuitable for spatial computational analysis [16]. Therefore, there is a need for a more efficient and feasible method of building monomer construction using oblique photography.
This study proposes a dynamic virtual method of building monomer construction using oblique photography, which addresses two technical problems: the need to automatically obtain the polygonal building footprint from the oblique photography and the need to visualize the selected building dynamically. Some researchers proposed a semi-automatic human–computer interaction method to detect the objects [19], such as an improved Canny edge detection operator [20], and extraction of building information in 3D data based on the random forest algorithm [21]. However, the semi-automatic human–computer interaction method has a large labor cost. In addition, the extraction accuracy based on the edge detection operator and the random forest algorithm cannot fully meet the application requirements [22,23].
In the field of computer vision, deep convolutional neural networks are widely applied to tasks such as image classification [24], image target detection [25], target tracking [26], and segmentation [27]. The deep convolutional neural network extracts low-level visual features through the alternate connection of multiple convolutional and pooled layers [28]. Its feature extraction and feature expression capabilities have been greatly improved compared to the previous traditional methods [29,30]. The deep convolutional neural network has provided new and effective solutions for some problems in earth science and remote sensing (RS) [31]. Several researchers proposed remote sensing image target recognition and pixel-level classification based on deep convolutional neural networks so as to automatically obtain the semantic information of remote sensing images and realize the query and analysis of remote sensing images [32,33,34]. Like extracting information from remote sensing images, building modeling aims to acquire semantic information from oblique photographs and visualize and analyze the 3D data. Therefore, inspired by the successful application of deep convolutional neural networks in computer vision and remote sensing, this study constructs a deep convolutional neural network to automatically calculate the underside polygon of the building and then dynamically highlight the singular buildings chosen in oblique photographs.
In addition to the building footprint extraction by deep learning method, Section 2 provides a summary and overview of current related work. Section 3 introduces the shadow volume rendering technique, which is used to attach and correlate the vector bottom surface obtained by deep learning to the surface of the building generated by the oblique photographic model. Section 4 presents the results of three algorithms for building footprint extraction. Section 5 visualizes the monomer building, discusses the advantage and disadvantages of the dynamic virtual method of building monomer construction using oblique photography based on a deep convolution neural network, and provides some perspectives on future work. Section 6 concludes the findings of this study.

2. Literature Review

2.1. Evolution of Three-Dimensional Reconstruction and Extraction

Three-dimensional reconstruction and extraction are ground object information extraction technologies based on remote sensing data [35]. They mainly realize the extraction and reconstruction of three-dimensional spatial information of ground objects by processing and analyzing remote sensing images. In the past few decades, 3D reconstruction and extraction have undergone rapid development from traditional manual interpretation to semi-automatic and fully automated algorithms. With the continuous advancement of aerial photography and satellite technology, high-resolution orthophotos, digital surface model images, panoramic images, and other data sources can obtain more accurate 3D information. At the same time, the algorithm method has also been greatly developed. The early 3D reconstruction and extraction mainly relied on manual interpretation, which required a lot of time and energy. From semi-automatic and fully automatic algorithms to the application of deep learning and artificial intelligence technology in recent years, some algorithms based on point clouds have emerged, such as light detection and ranging (LiDAR) and Synthetic Aperture Radar (SAR) technology [36]. Through the application of these technologies, three-dimensional information of the ground can be directly obtained and processed and analyzed using computer programs. The emergence of these technologies greatly simplifies the process of data acquisition and improves the efficiency of data acquisition.

2.2. Advancements in Remote Sensing Technology for 3D Data Acquisition

Since the 1960s, people have used remote sensing data such as aerial photography and satellite images to extract ground feature information and established some basic remote sensing image classification methods. Subsequently, in the 1970s, LiDAR technology was applied to 3D data acquisition and gradually became one of the main 3D data sources [37]. With the rapid development of computer vision technology, people began to study remote sensing image classification and target detection methods based on computer vision. In the 1980s, SAR was widely used in fields such as topographic elevation measurement and land cover classification and became an important means of remote sensing image processing. By the 1990s, due to the rapid development of computer technology, these remote sensing image classification and target detection methods based on computer vision were further studied and applied. For example, in satellite image classification, people started to use support vector machines (SVM) [38], neural networks, and other algorithms for image classification. In the early 21st century, deep learning has been widely used in remote sensing image classification and object detection. In recent years, with the continuous development and popularization of technologies such as big data and cloud computing [39], 3D point cloud processing technology and remote sensing technology combined with artificial intelligence algorithms have also been developing rapidly [40]. The 3D point cloud automation algorithm based on deep learning has gradually become mainstream and can process large amounts of data quickly and accurately. For example, using a convolutional neural network (CNN) [41] and recurrent neural network (RNN) [42] in deep learning algorithms can identify and classify different ground objects in 3D point cloud data.

2.3. Applications of 3D Reconstruction and Extraction and RS AI Algorithms across Various Fields

Three-dimensional reconstruction and extraction and remote sensing technology combined with artificial intelligence algorithms have been widely used in urban planning, smart transportation, smart security, smart agriculture, and other fields. In urban planning, 3D building models can be used for urban renewal and environmental planning; in the field of smart transportation, 3D reconstruction and remote sensing technology combined with artificial intelligence algorithms can be used to optimize road network planning and management and realize traffic flow prediction and regulation. For example, in urban transportation planning, 3D building models and digital terrain models can be used to design and optimize road networks to improve the efficiency and reliability of transportation systems [43]. In addition, in terms of traffic safety monitoring, according to the existing foundation pit excavation construction plan and the situation of the subway tunnel structure, a three-dimensional, large-scale numerical calculation model was established to calculate the internal force and deformation changes of the tunnel structure during the foundation pit excavation preparation stage law. The model can guide the construction process and provide a reference for the corresponding safety monitoring program [44]. In the field of smart security, 3D reconstruction and remote sensing technology combined with artificial intelligence algorithms can be used for real-time monitoring and early warning of the security situation in an area. For example, in urban public places, commercial areas, industrial parks, and other areas, 3D reconstruction can be used to monitor and analyze the density of people, action paths, abnormal situations, etc., to warn and deal with potential safety risks in a timely manner [45]. In the field of smart agriculture, 3D reconstruction and extraction and remote sensing technology combined with artificial intelligence algorithms can be used for the precise management and monitoring of farmland. For example, the monitoring and analysis of farmland soil quality, moisture content, and crop growth status can be realized through 3D models to accurately implement agricultural production management and improve agricultural production efficiency and quality [46]. In the future, with the continuous development of deep learning and artificial intelligence technology, these algorithms will further improve accuracy, speed, and precision, and will be applied to more fields and industries, such as traffic flow prediction in smart city construction, urban green coverage monitoring, and other aspects.

3. Materials and Methods
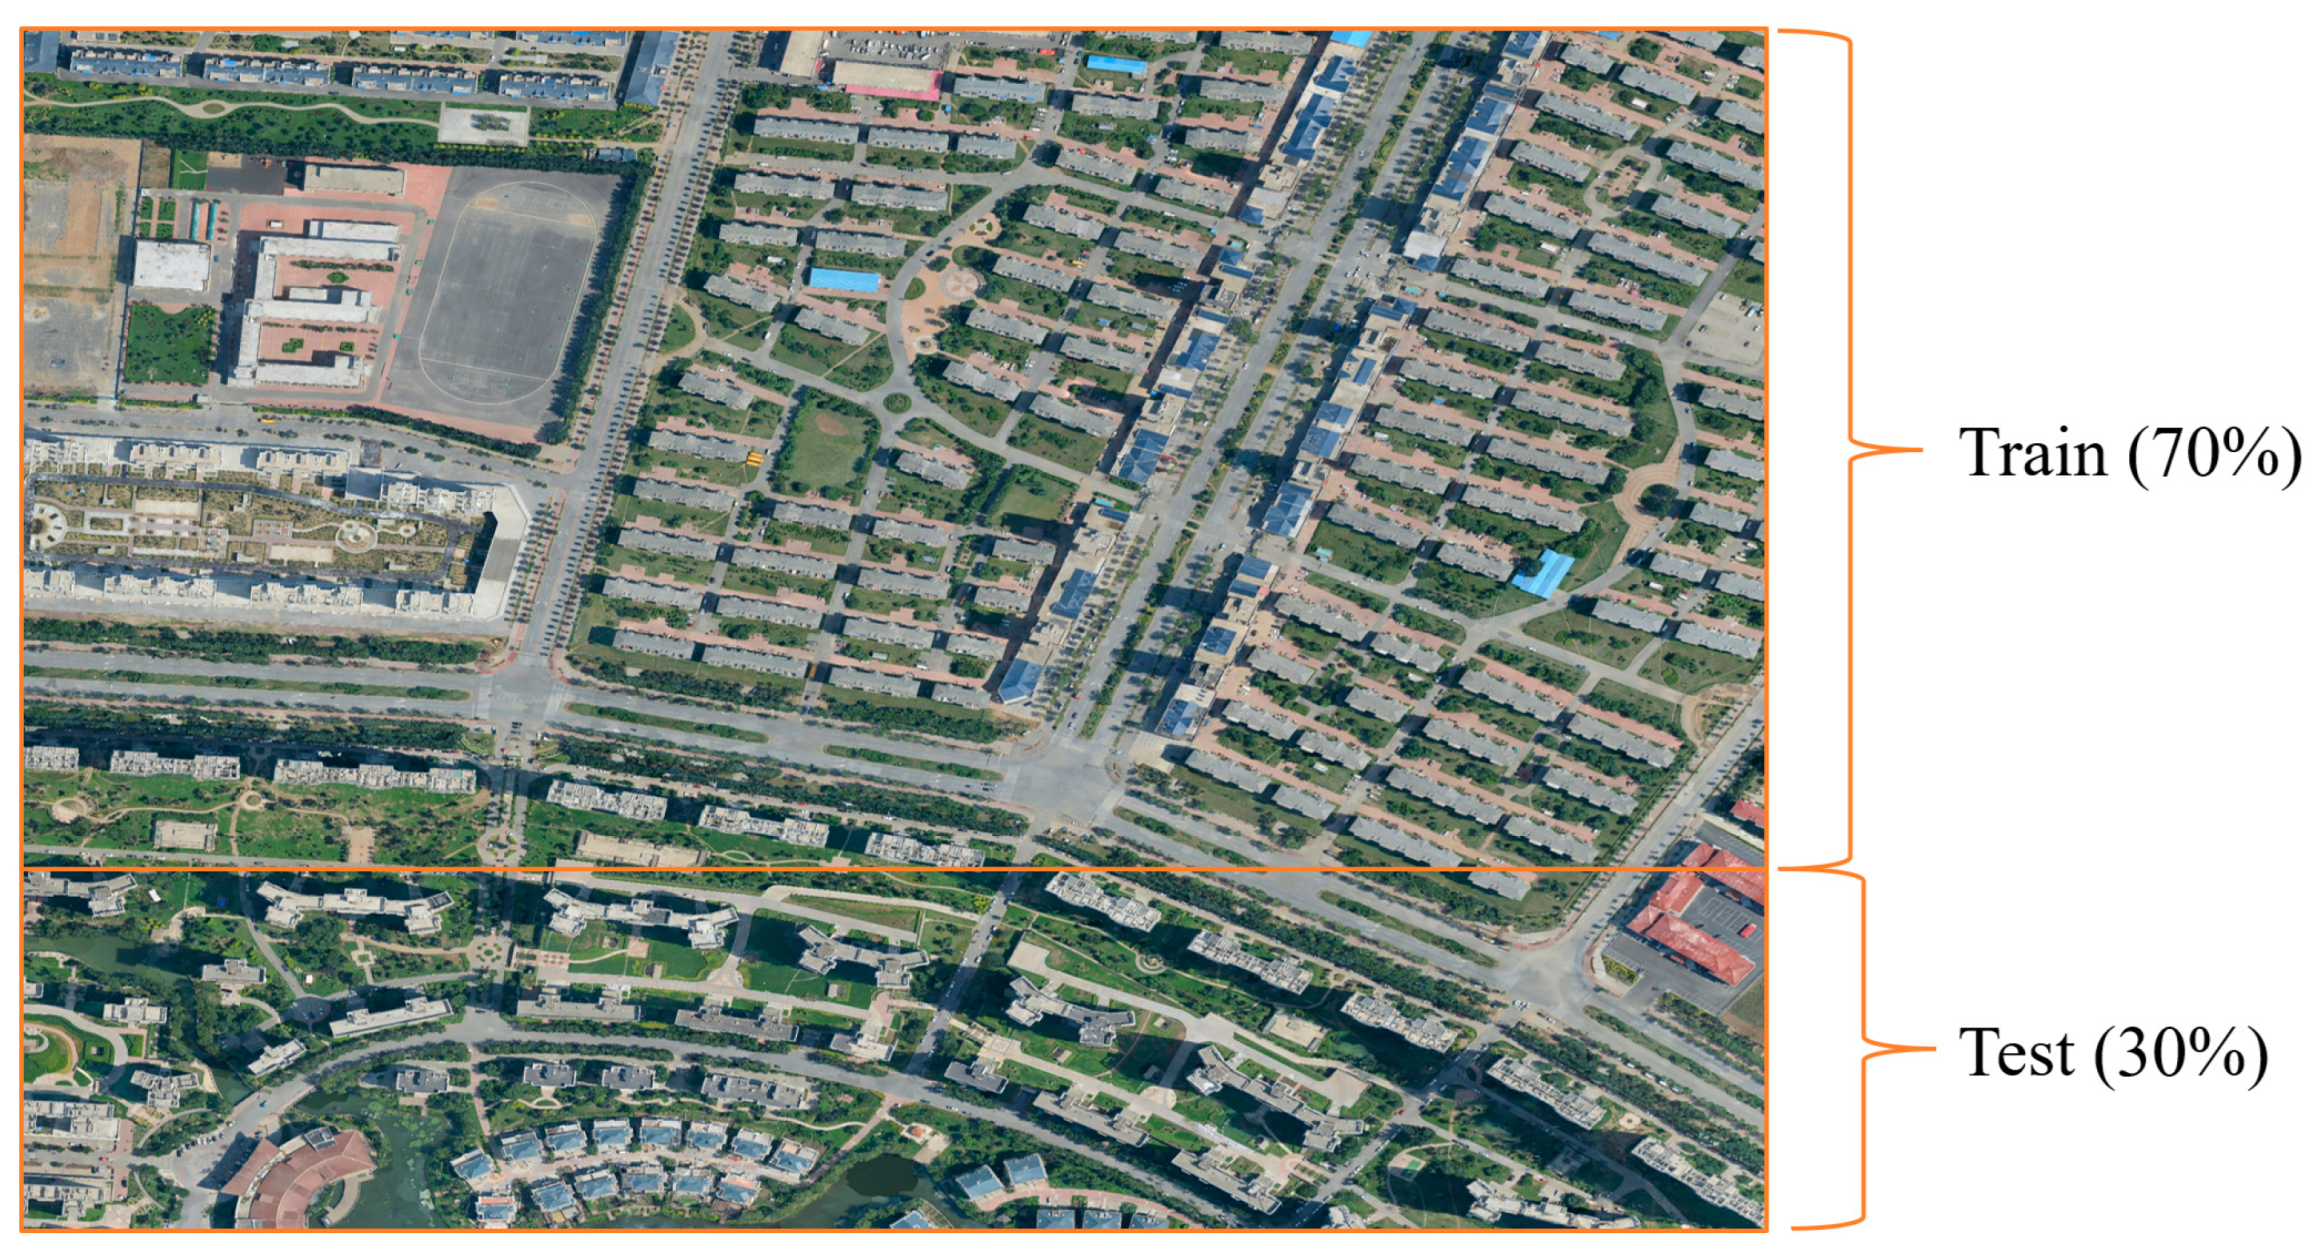
The buildings could be selected and queried within the overlayed area between the created polygon and the remote sensing image on Google Earth, as shown in Figure 1. This selection and query approach inspired the research on improving the oblique photographic model. The oblique photographic dynamic virtual method of building monomer construction proposed in this study conceives that 3D buildings can be selected singularly by underlying polygon data with attributes under the oblique photographic data in the oblique photographic model.
The deep convolution neural network was applied for building bottom extraction, and the shadow volume rendering technique was proposed for attaching the bottom polygon to the building surface provided by the oblique photographic model.
Firstly, the oblique photography model data was preprocessed by conversion into DOM and digital surface model (DSM) raster data, serving as the input for a deep convolutional neural network. Then, a deep convolutional neural network based on U-Net was constructed, with ResNeXt50 serving as the backbone network. It was employed to automatically extract building outlines from oblique aerial photography data, comparing its accuracy with that of different algorithms. Following this, shadow volume rendering techniques were utilized to bind the extracted vector base data to the building surfaces of the oblique photography model, thereby realizing the dynamic virtual method of building monomer construction using oblique photography (Figure 2).

3.1. Study Area

The research area of this study is located in Tieling County, Tieling City, Liaoning Province, China. All the data used by the research institution were captured from high-precision oblique aerial imagery taken by unmanned aerial vehicles (UAVs) over the study area. During the data collection process, both the along-track and across-track overlaps were set at 80%, with a flying height of 500 m, achieving a spatial resolution of 1 m. The oblique photography model includes images captured from five different angles, with an image resolution of 1 m and horizontal and vertical positioning accuracies both at 1 m, ensuring the accuracy of the data. To enhance the information value of the data, manual annotation was performed, categorizing targets in the images into two classes: “buildings” and “non-buildings”. The annotation process strictly followed the definition of buildings and excluded targets not belonging to the building category, such as vehicles and vegetation. The images were divided into two parts, with one used for training and the other for testing and evaluation. The training area represents 70% of the total area, while the testing area represents 30%, as shown in Figure 3.

3.2. Deep Convolution Neural Network for Automatic Acquisition of the Polygonal Underside of a Building

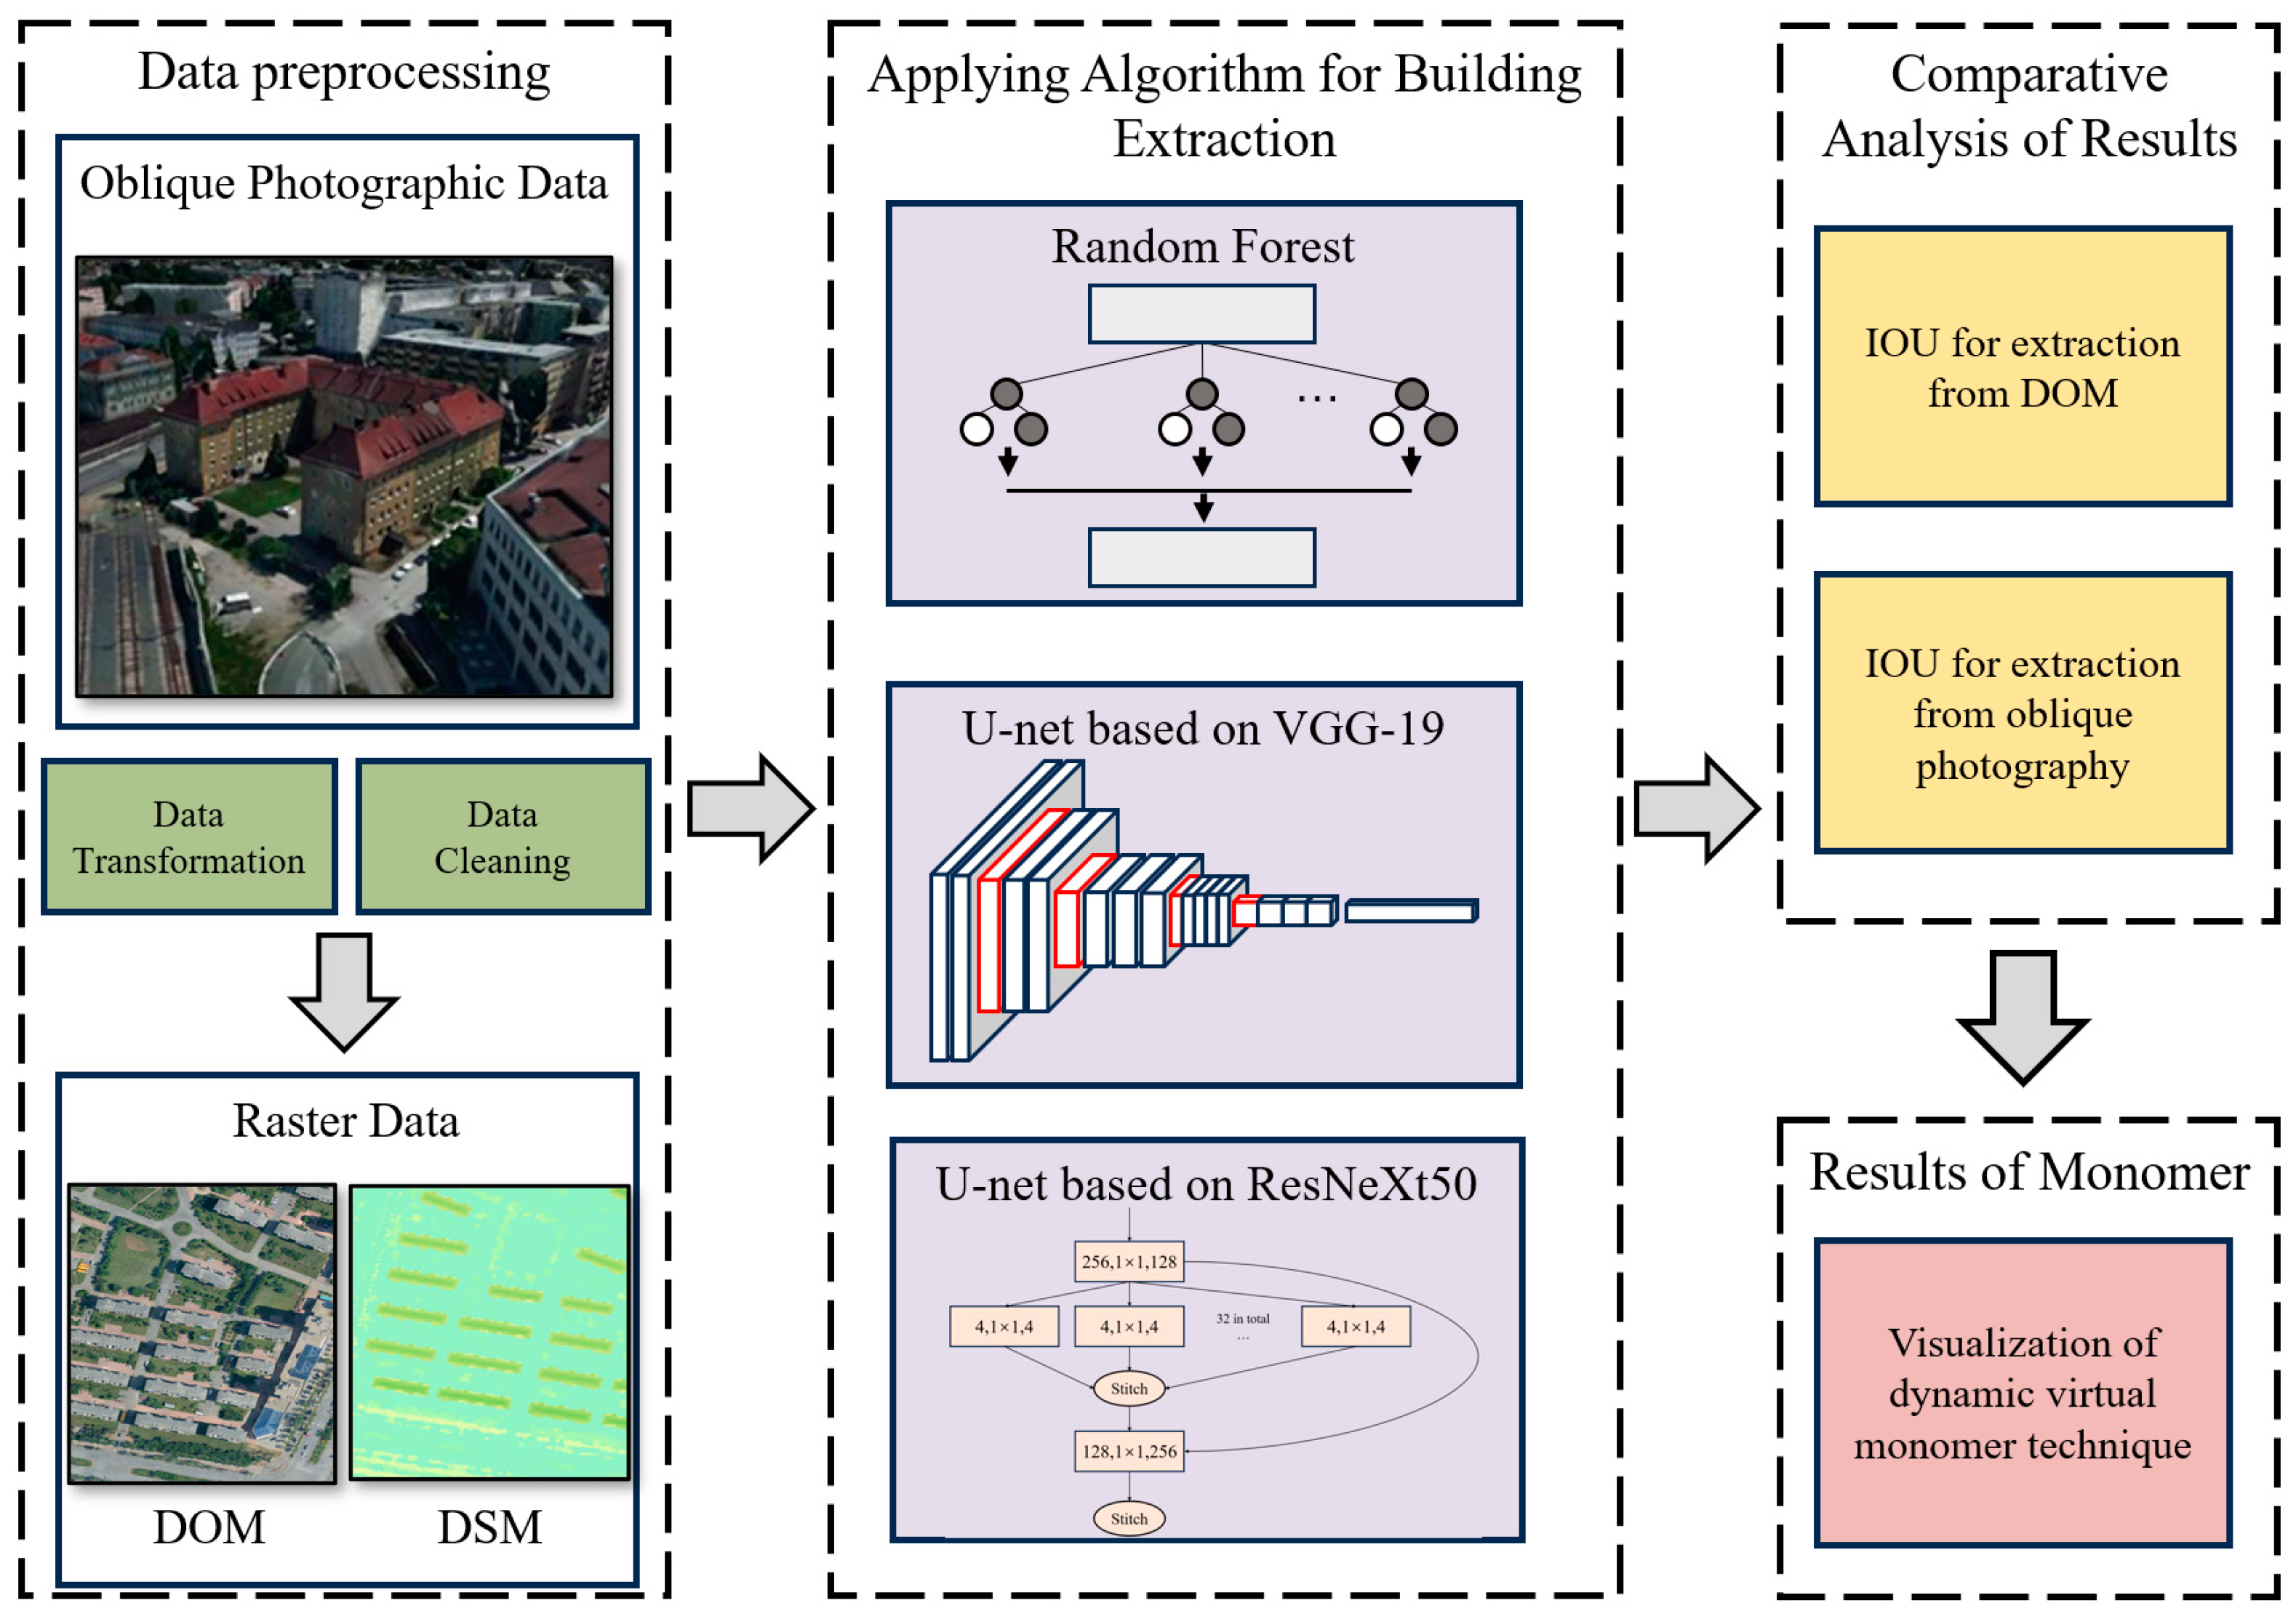
3.2.1. Oblique Photographic Data Preprocessing

Oblique photographic data are in the form of a triangulated irregular network (TIN) and are created with a multi-level detail grid (LOD) [47,48]. The distribution of these grids is irregular and difficult to input directly as a deep convolutional neural network. Therefore, the oblique photographic data have to be converted into a regular grid pixel format that is easily processed by the convolutional neural network. In order to preserve the original features of oblique photographic data to the maximum extent during conversion, the oblique photographic modeling data were transformed into a visible light-based DOM and DSM with a similar resolution to the original oblique geographic modeling data. The pixel format of the DOM and DSM is suitable as an input to the convolutional neural network; in addition, these data include both visual and elevation features of the oblique data.

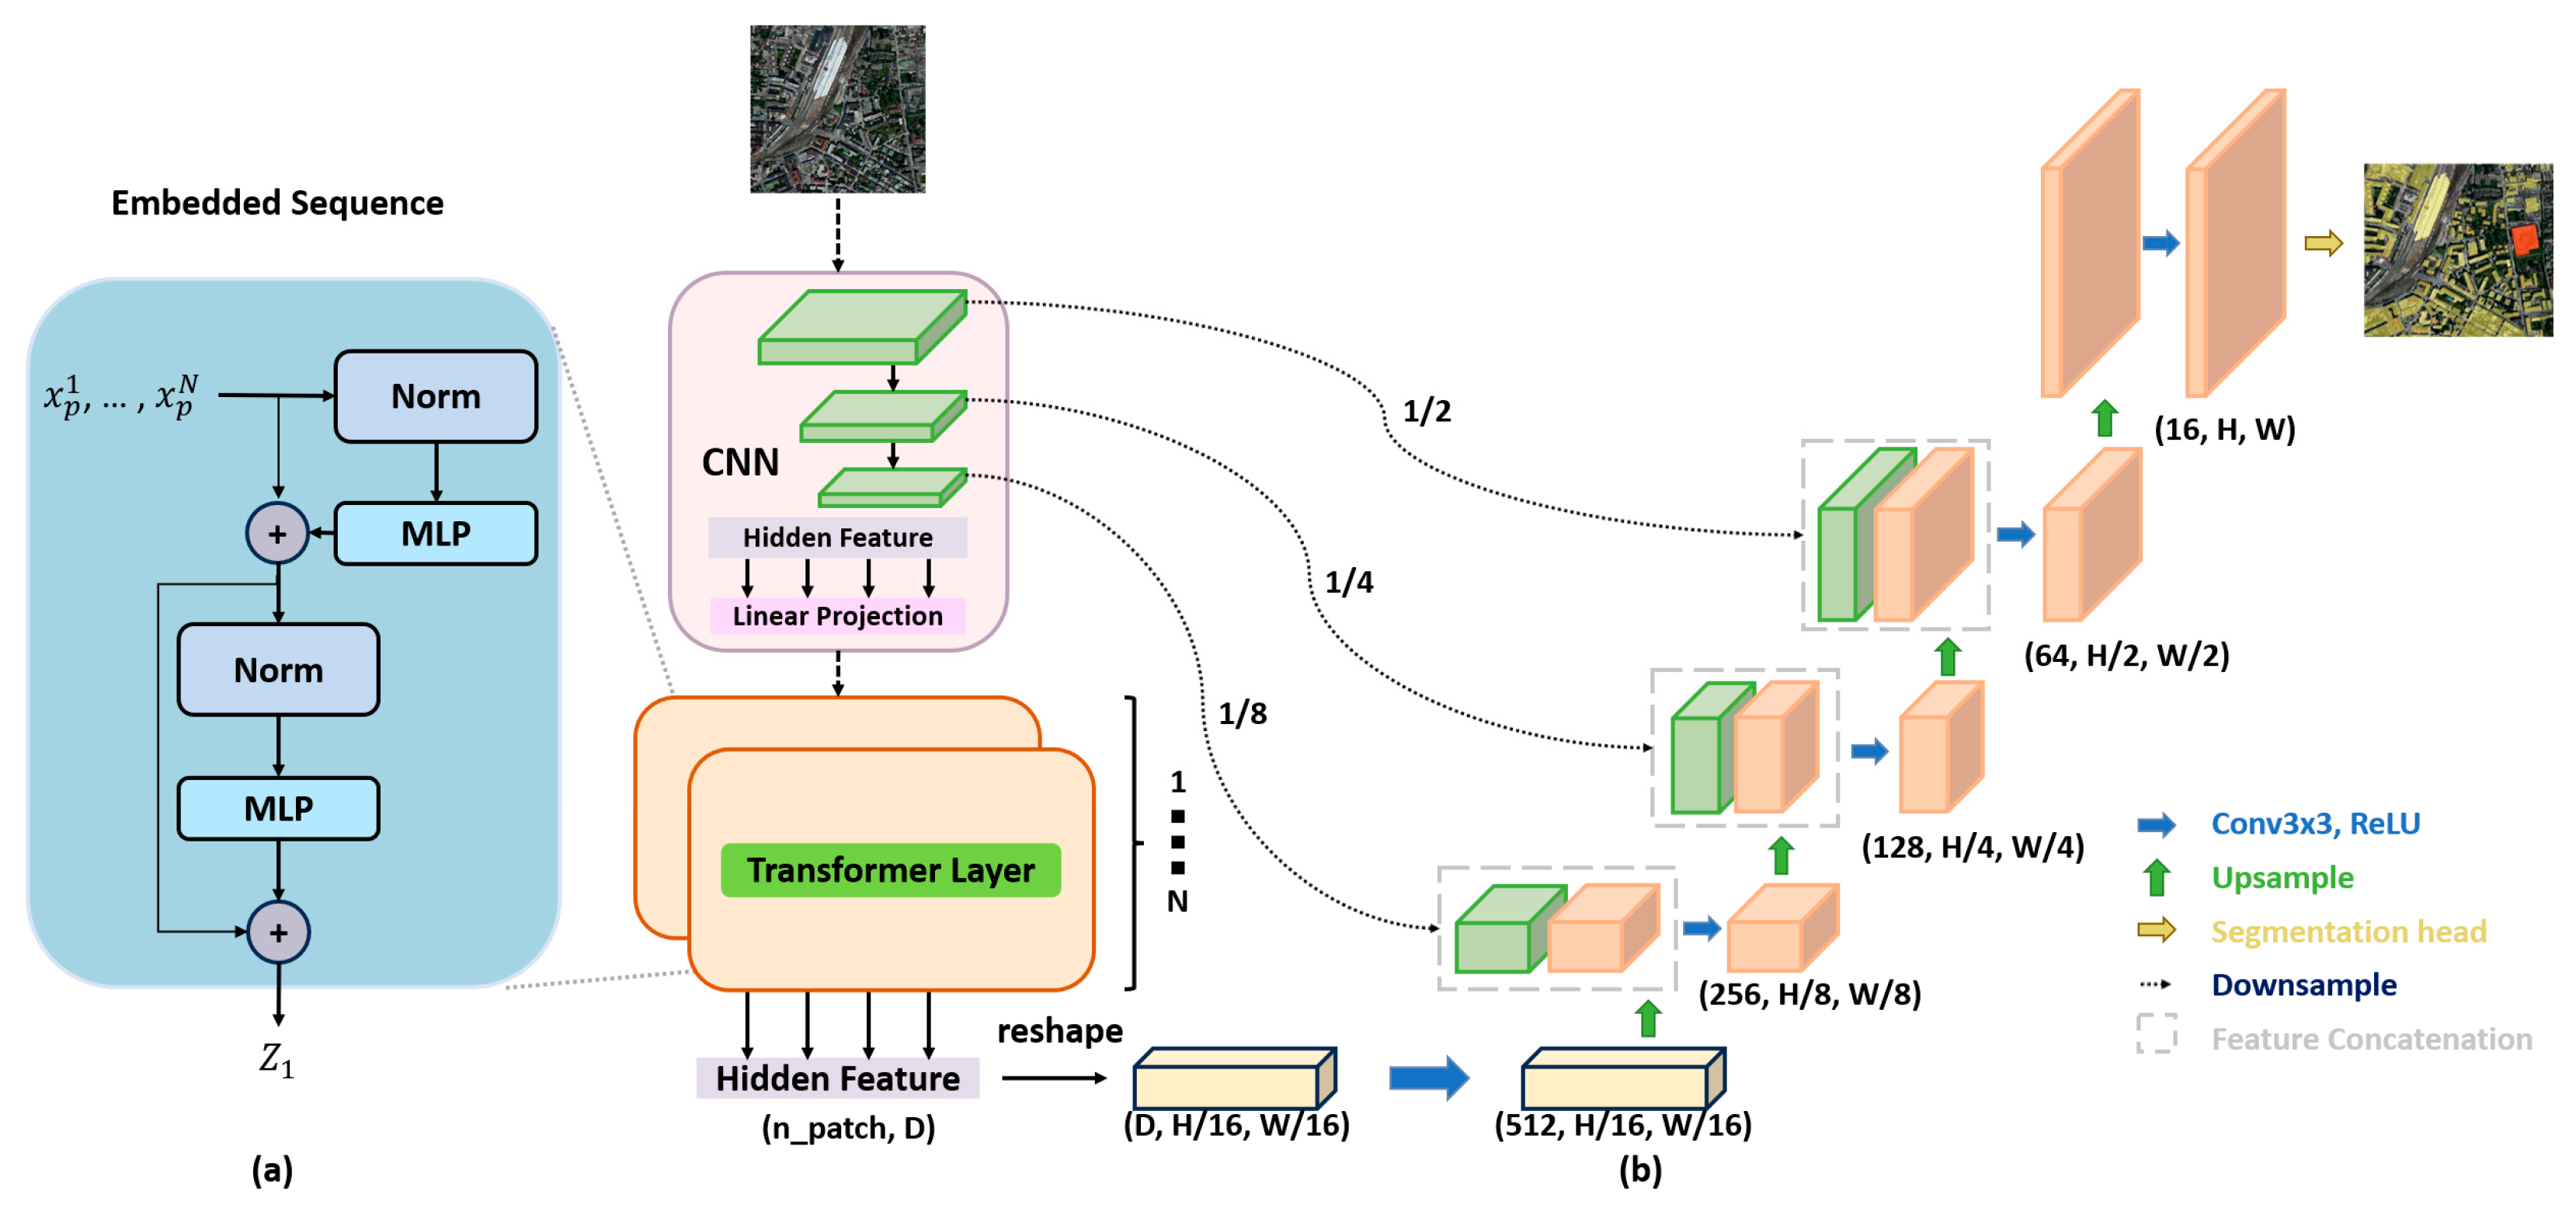
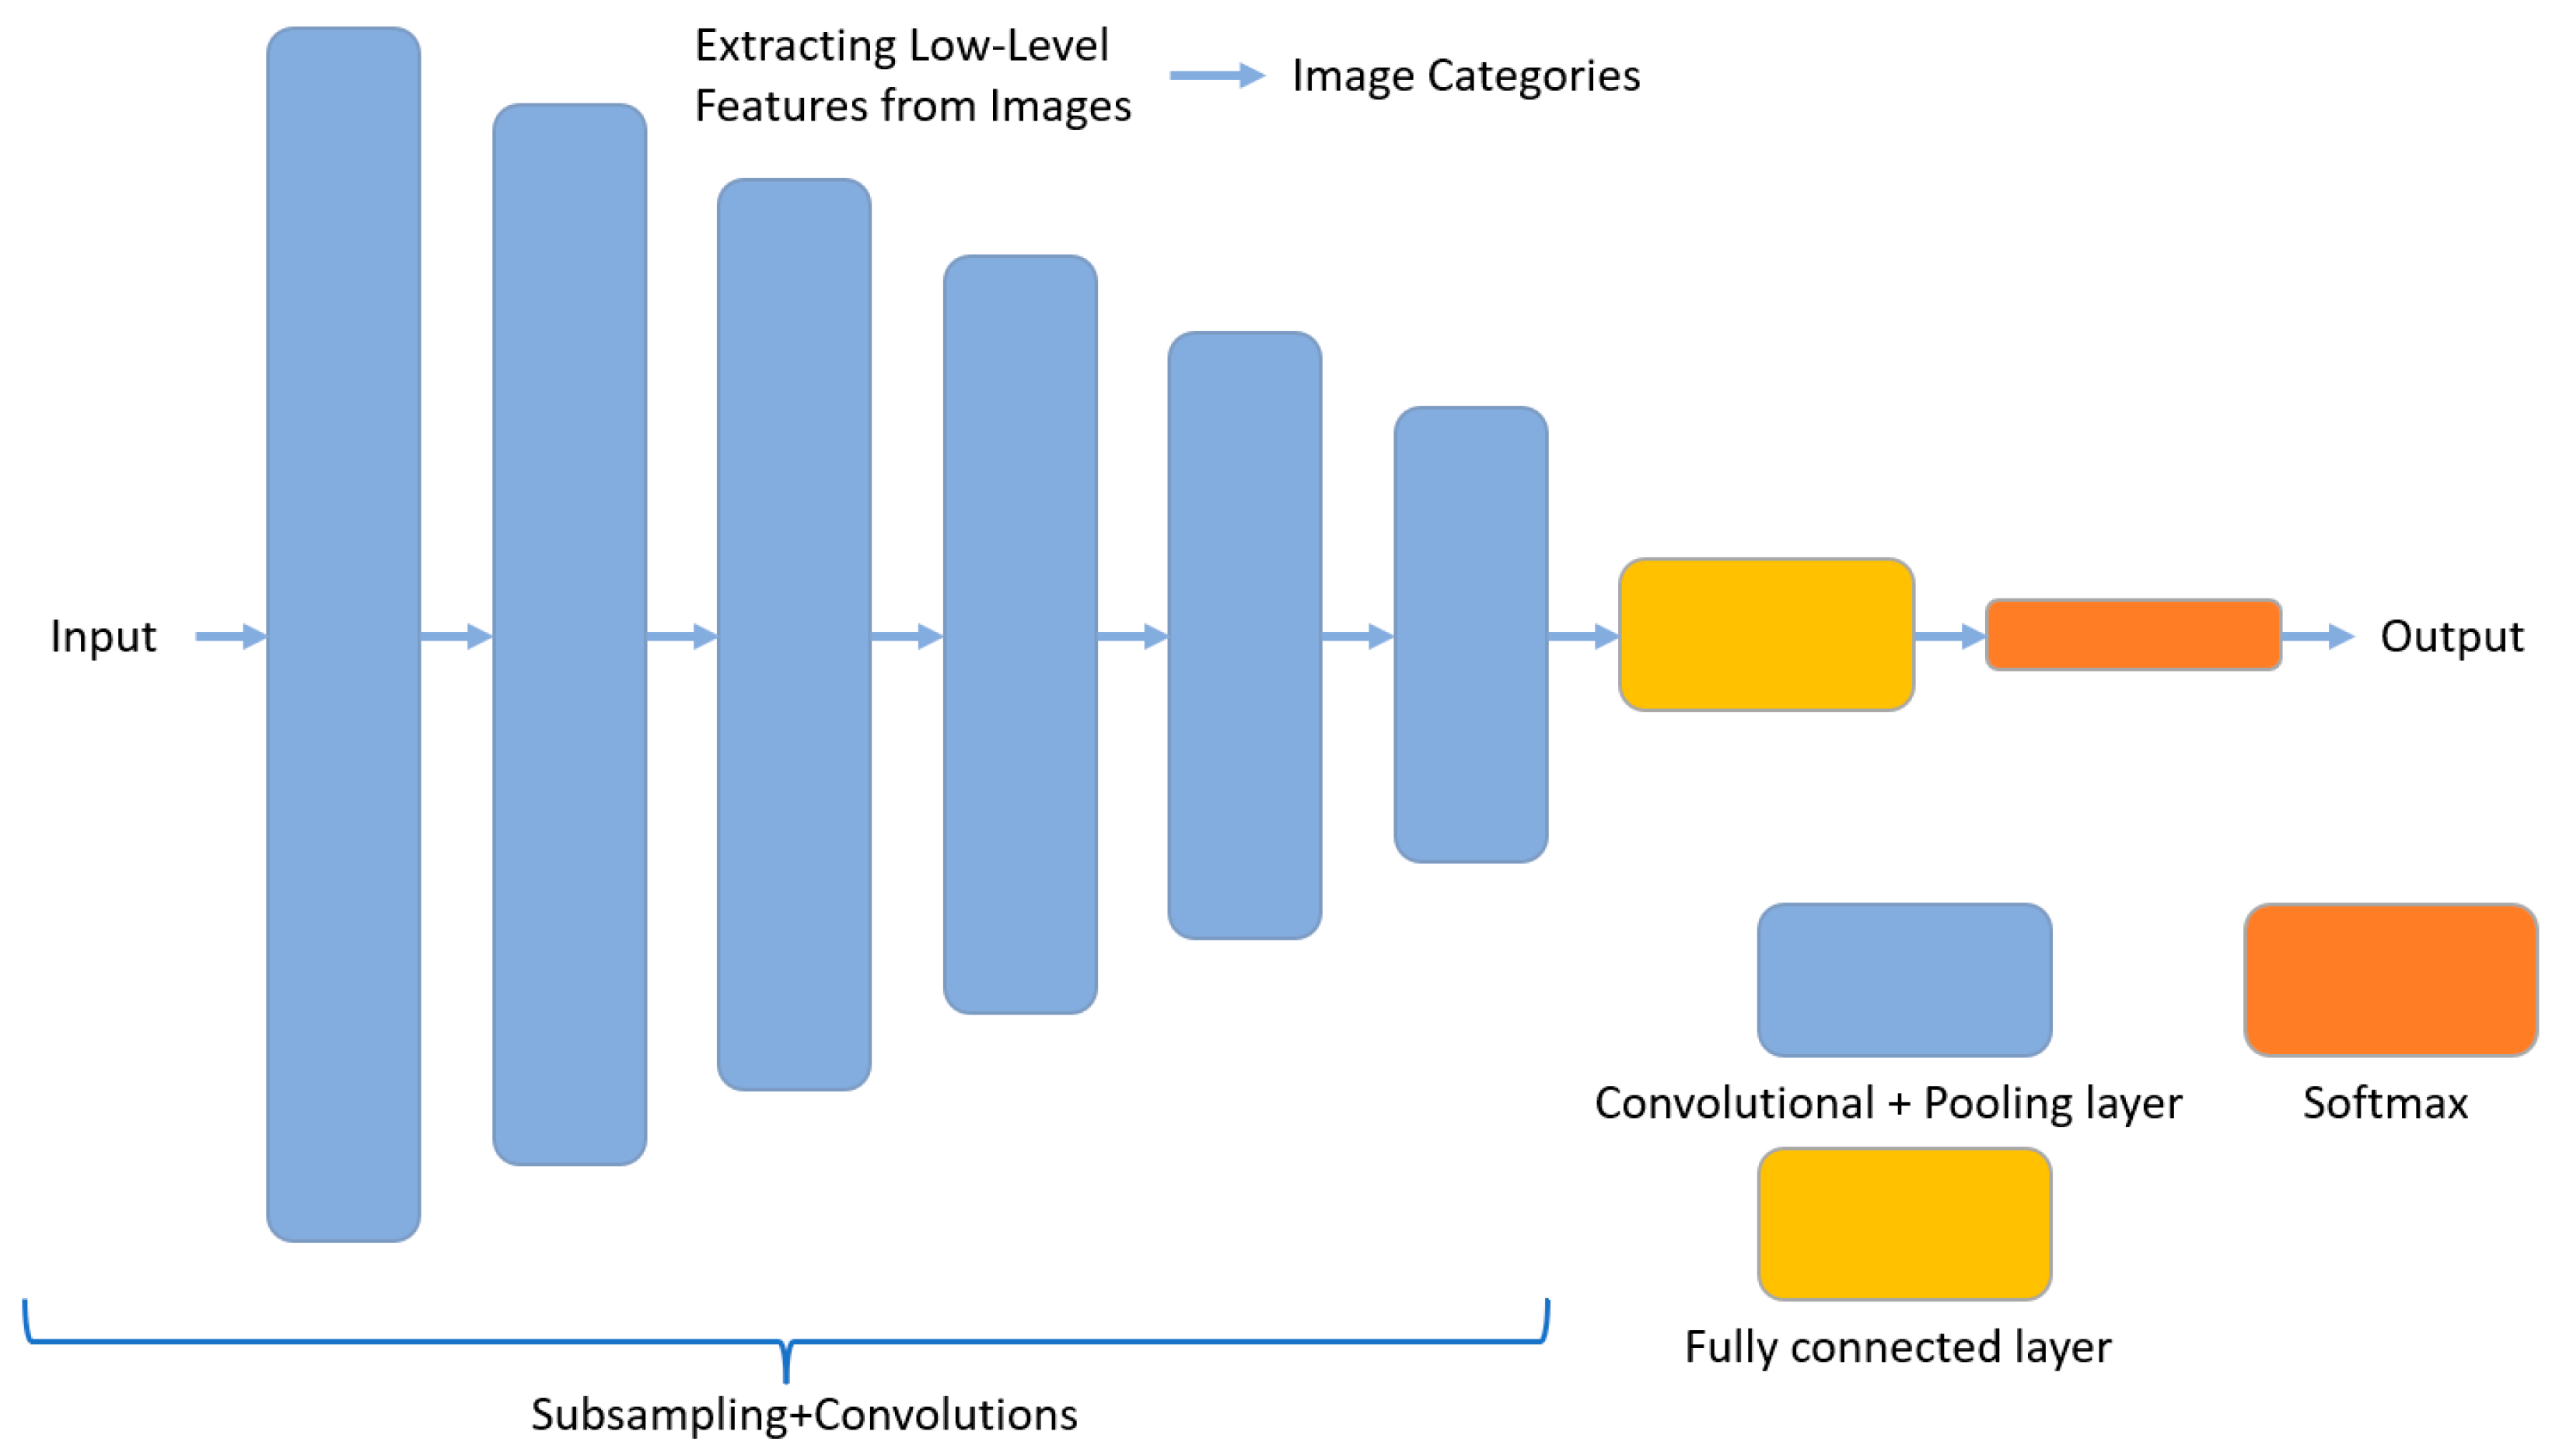
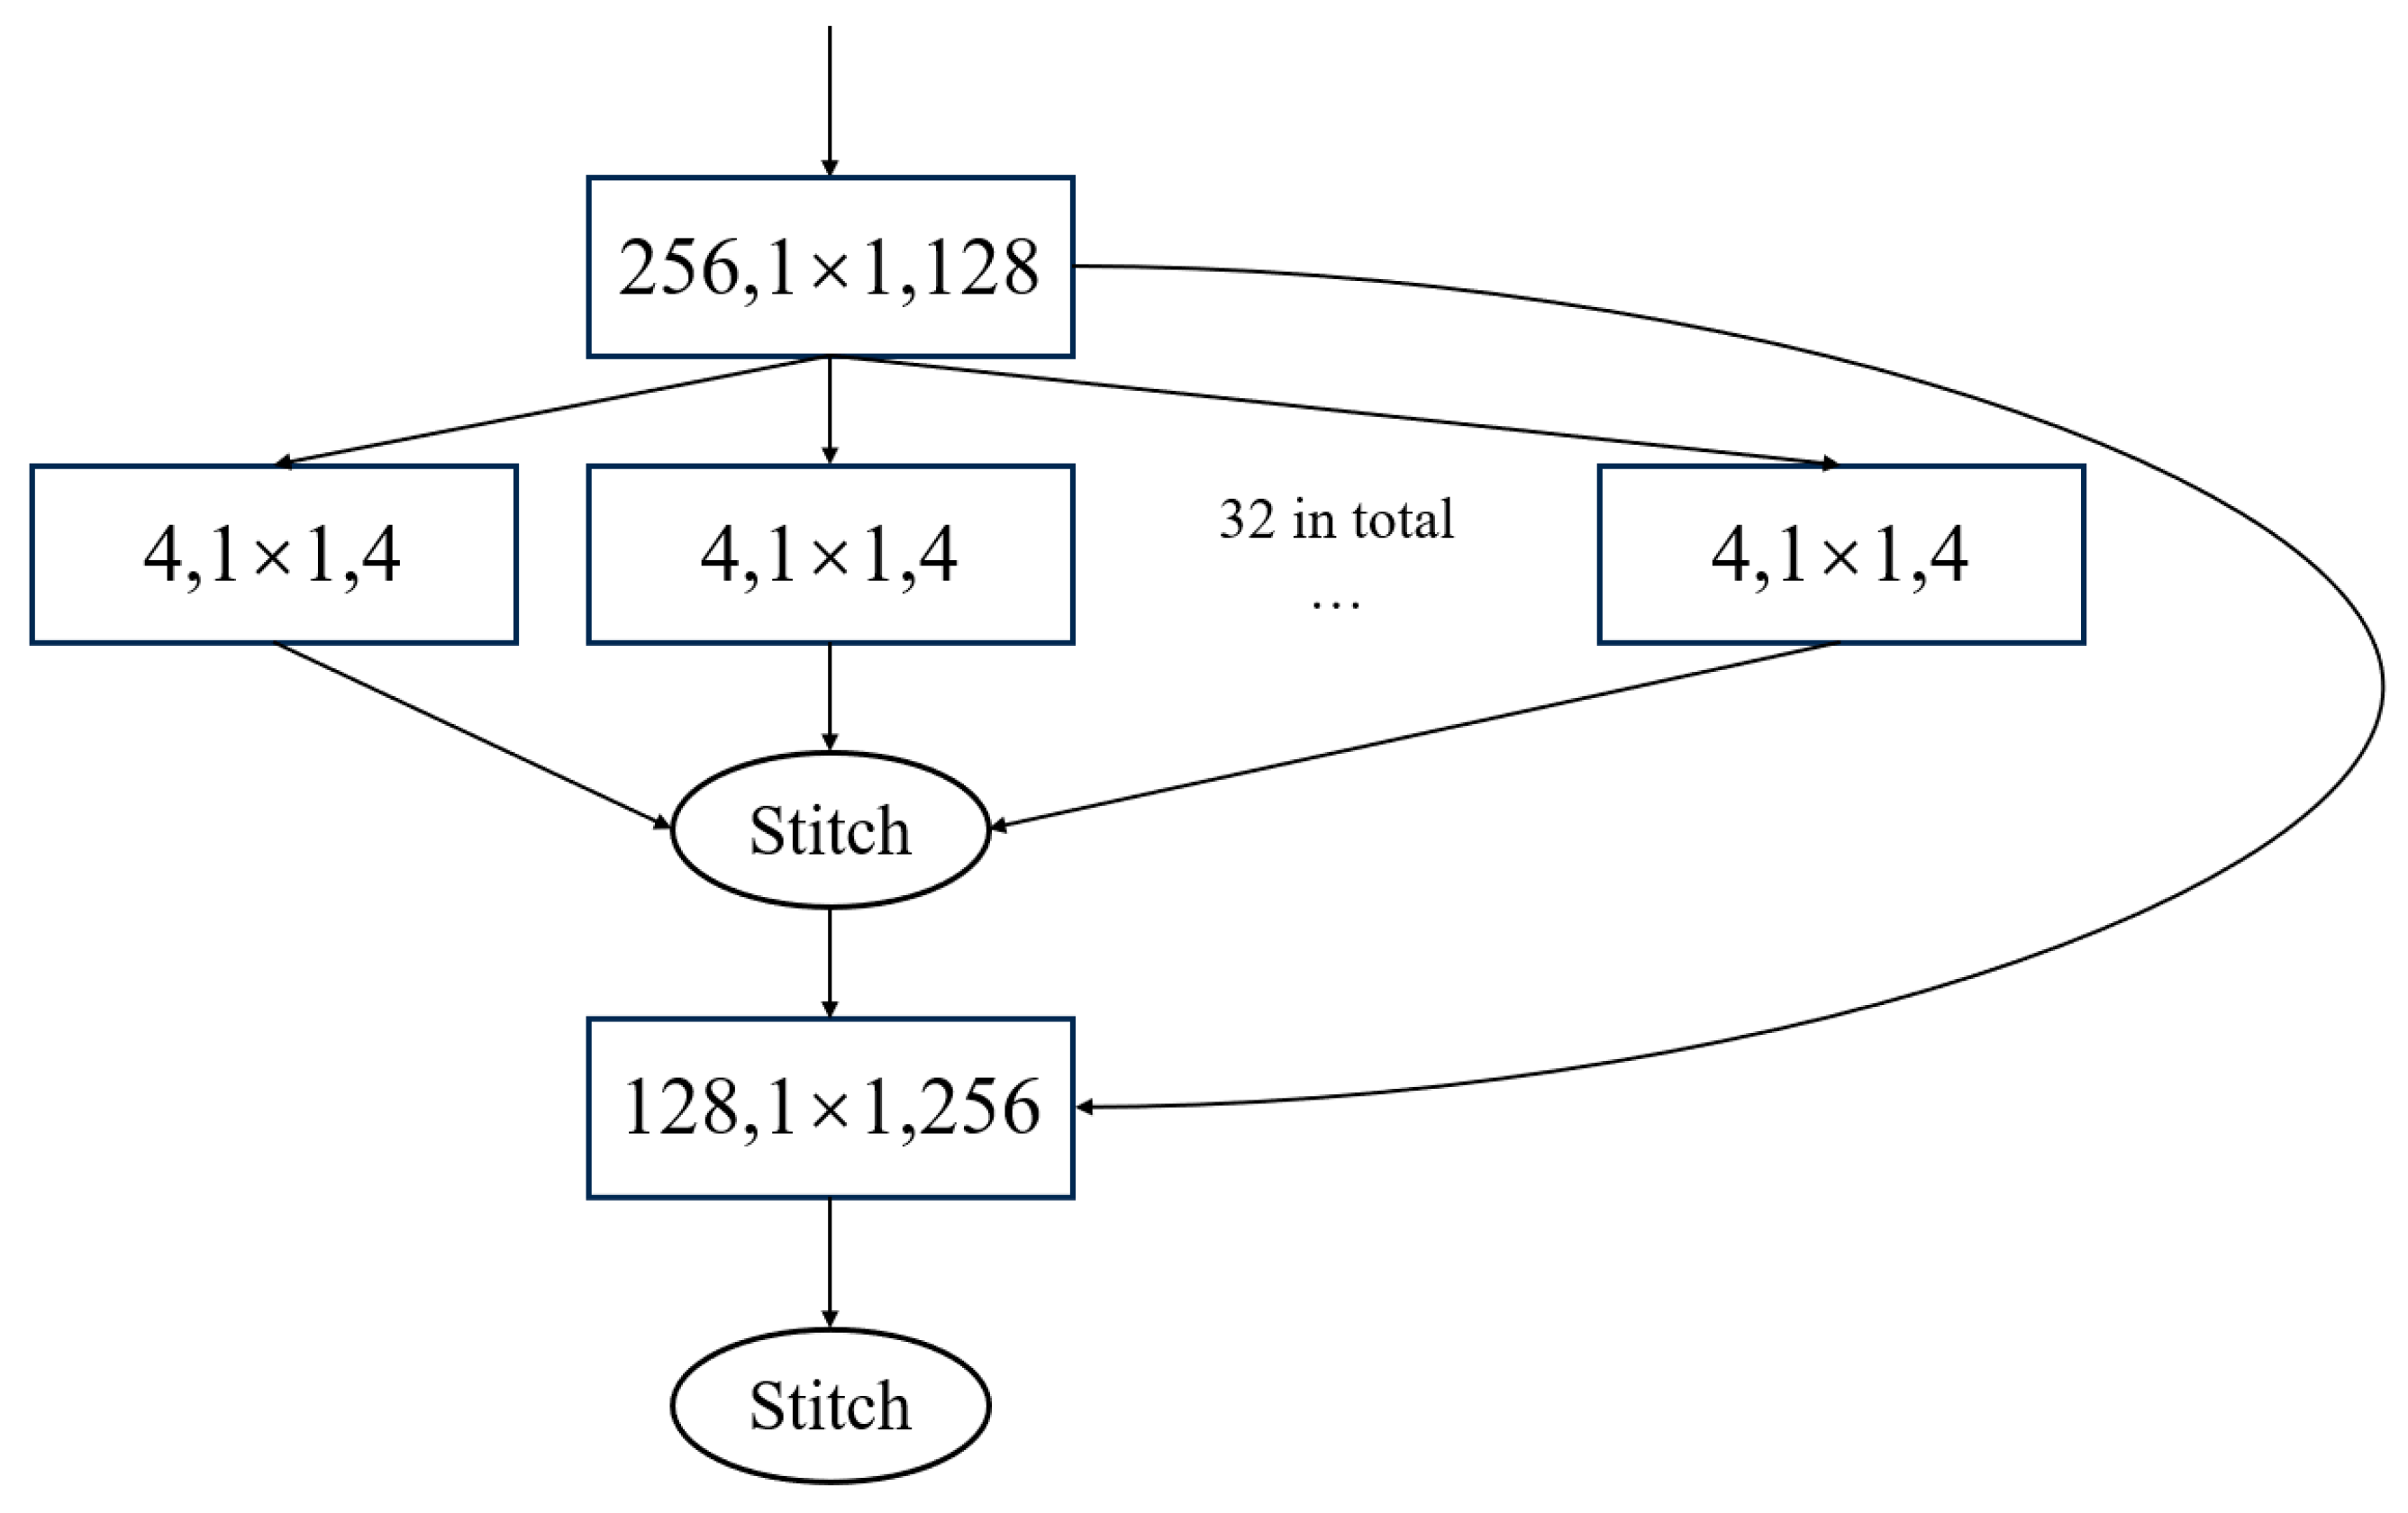
3.2.2. Convolutional Neural Network

A convolutional neural network (CNN) is a regularized version of the multi-layer perceptron, which is a fully connected network [49,50]. The upper layer of neurons is completely connected to the next layer of neurons, and it is often prone to over-fitting. A CNN, through local connections and weight sharing, using hierarchical patterns in data, combines smaller and simpler patterns into complex patterns. Figure 4 shows the basic structure of a commonly used picture classification network, which extracts the low-level features of the image to obtain the picture category by combining the convolutional layer and the pooling layer [24].
A CNN was initially used to solve the image classification problem. However, many problems in the field of computer vision need to rely on semantic segmentation [51]. U-Net [52] is a network structure based on a CNN for image semantic segmentation (as shown in Figure 5). Adding upsampling layers in very deep convolutional networks for large-scale image recognition (VGG) can provide more accurate semantic segmentation results on less training data. U-Net architecture constructs the connections between its upsampling layer and the corresponding feature layer in the classification network [53,54].
The backbone network, which refers to the initial layers of a neural network, is responsible for feature extraction from input data [55,56]. These features are then passed on to the subsequent layers for further processing and prediction. The choices of backbone networks in U-Net architecture are various. The VGG-19 network, one of the major CNN architectures developed by the Visual Geometry Group, is popular because of its simplicity and effectiveness [57]. VGG-19 contains multiple convolutional layers followed by pooling layers and a fully connected layer, known for its deep architecture with up to 19 layers [58]. VGG networks are used for various image processing tasks, including image classification, object detection, and image generation, which could be used in U-Net architecture as a backbone classification network for providing extracted features.
Figure 5. Basic framework of Trans-UNet (the image is adapted from “TransUNet: Transformers Make Strong Encoders for Medical Image Segmentation”) [59]. (a) schematic diagram of the Transformer layer; (b) architecture of TransUNet.
Remotesensing 16 00979 g005
However, the VGG-based network faces the problems of gradient disappearance and gradient explosion when there are too many layers. ResNeXt (Residual Next) is a new network structure generated by the combination of Resnet [60,61] and Inception network structure. With the same parameter quantity of Resnet, ResNeXt can obtain higher precision in the image classification task. Figure 6 illustrates the basic structural unit of ResNeXt. Compared with the VGG network, ResNeXt is a more complex architecture with parallel paths or branches within each residual block. The multiple paths with different filter sizes allow ResNeXt to capture diverse and discriminative features, which can enhance the model’s representation capacity. This study used ResNeXt50 as the backbone network of the U-Net network. ResNeXt50 [62] is a specific variant of the ResNeXt architecture, a deep CNN architecture that introduces the number of branches in the residual blocks. ResNeXt50 has 50 layers and is known for its good trade-off between accuracy and computational efficiency, making it a popular choice for various computer vision tasks.
The combination of the classification network, i.e., VGG-19 and ResNeXt50, with the segmentation network U-Net, was designed for this study to acquire the polygonal footprint of the building from the oblique photographic model automatically. This combined deep convolution neural network architecture replaces the fully connected layer in the original classification network structure with a convolutional layer, which has an encoder–decoder structure with skip connections, allowing it to capture both local and global contextual information for accurate segmentation. The input layer is extended from the RGB visible band to RGB+DSM, the corresponding upsampling layer is added, and the corresponding feature extraction layer is connected. Finally, logistic regression is used to classify pixels based on the extracted image features to obtain the building area in the image, as shown in Figure 7.

3.2.3. Loss Function

The binary cross entropy (BCE) loss function is used to train the U-Net network, which can quickly fit the training data [63,64,65]. However, in the unbalanced data, the BCE results often cannot reflect the actual results of less data. In oblique photography, the building area usually only accounts for 20% or less of the whole image; that is, the ratio of the building area to the non-building area is highly unbalanced, and thus it is difficult to obtain the optimal building extraction results using only the BCE loss function. Dice loss can establish the balance between different categories correctly based on the distribution of training data [66], so the BCE loss and dice loss function were combined to ensure that the loss function could obtain the optimal result faster in this study.
The loss function is as follows:
L o s s = B c e L o s s + D i c e L o s s
B c e L o s s = i = 1 n ( p i l o g g i + ( 1 p i ) l o g ( 1 g i ) )
D i c e L o s s = 1 2 i = 1 n p i g i i = 1 n p i 2 + i = 1 n g i 2
where p i and g i are the corresponding predicted values and true values, respectively.

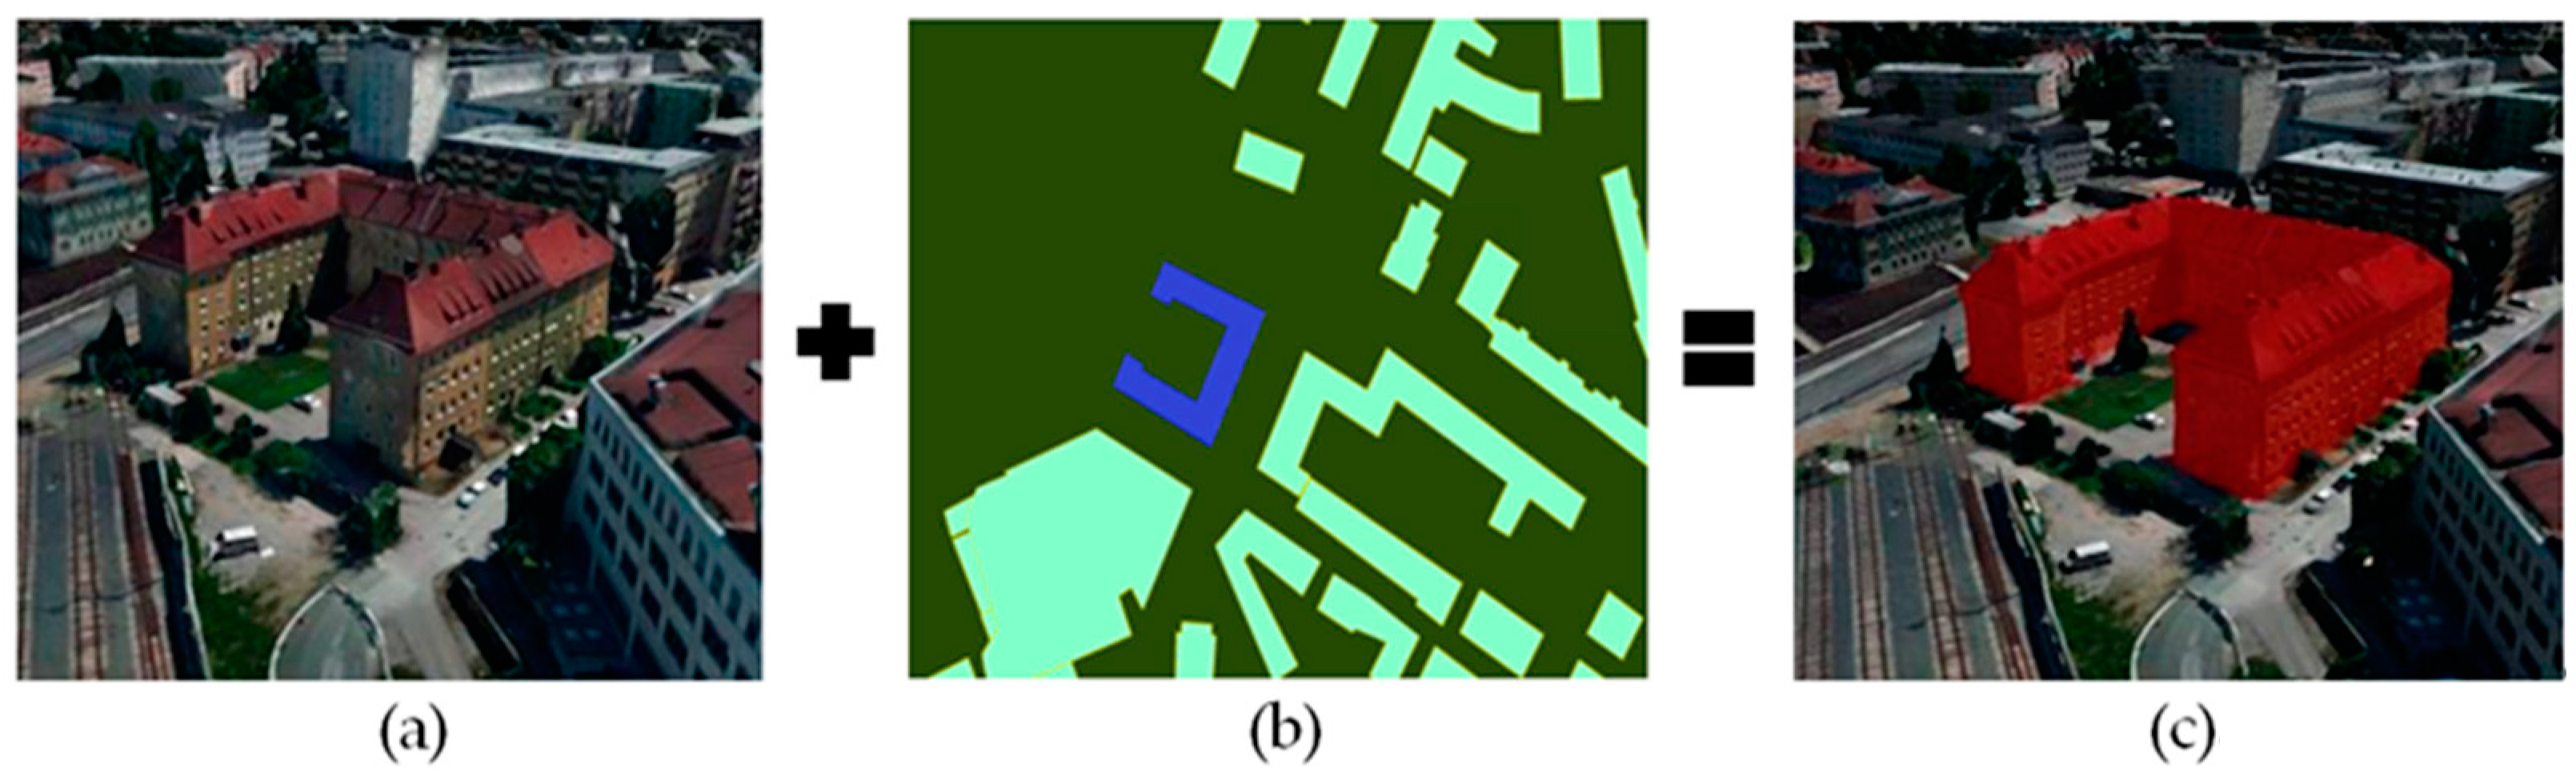
3.3. Oblique Photographic Dynamic Virtual Method of Building Monomer Construction

On the visualization level, the oblique photographic dynamic virtual method of building monomer construction uses the shadow volume rendering technique to attach the vector building footprint to the building surface and realizes the monomer of the oblique photographic modeling data without cutting the data. In addition, at the data level, the dynamic association between the vector building footprint and oblique photographic modeling data facilitates data updating and enables oblique photographic modeling data to be associated with business data by using attribute query and spatial query capabilities on the underside of the vector. This oblique photographic dynamic virtual method of building monomer construction solves the problem of applying oblique photographic modeling data in GIS. This technique also effectively promotes the broad application of oblique photographic modeling data in surveying, planning, smart cities, and other industries.
One key step of the oblique photographic dynamic virtual method of building monomer construction is the connection between the polygonal building footprint and the building surface. The polygon and the core of the earth are connected to form a closed shadow volume. Through the stencil shadow volume rendering technique, the bottom surface of the polygon is attached to the building surface, as recorded by the oblique photographic model. Thereby the surface of the selected building is highlighted, and the identity document (ID) and the attribute information are returned simultaneously, thus realizing the goal of 3D building selection. This technique could help produce object segmentation maps and other thematic maps. The set of polygons expressed by the classification is attached to the oblique photographic modeling data by rendering the stencil shadow volume, and the classified color is mixed with the corresponding building surface, thereby realizing the single value and segmentation of the oblique photographic modeling data expression.

4. Results

The extraction of buildings by different algorithms, including random forest and deep convolution neural networks, are compared, and the optimal extraction method is applied in the dynamic virtual method of building monomer construction. The results of the comparison and building monomer effect visualization are presented.

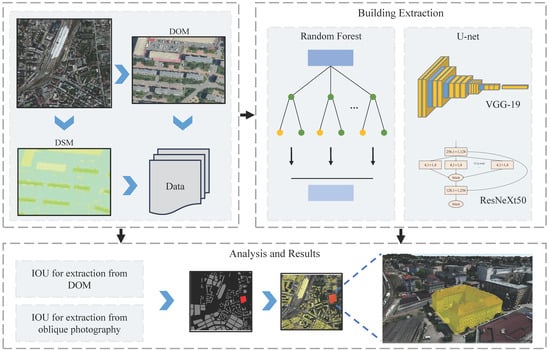
4.1. The Comparision of Building Extraction Method

The comparison experiments are designed to examine the feasibility of applying a CNN on oblique photographic modeling data. The experimental data are sourced from geometrically corrected satellite imagery (DOM) and the oblique photographic image. The algorithms, including random forests [67,68], U-Net architecture based on VGG-19, and the ResNeXt50, are applied to the experimental data for building bottom extraction. The Jakarta index is used as the experimental evaluation index. Random forest and VGG19-based U-Net represent two different categories: traditional machine learning and deep learning. They demonstrate the advantages of deep learning in image semantic segmentation tasks. When compared to U-Net based on ResNeXt50, they provide a more comprehensive assessment of the effectiveness of deep learning models. The Jakarta index, also known as the intersection over union (IOU), is widely used in the remote sensing image feature extraction data competition [69]. The formula is as follows:
J a c c a r d = T P T P + F P + F N = A B A B
T P is the predicted building area, F P is the false reported building area, and F N is the unpredicted building area.
Table 1 presents the results of using different methods to extract buildings from different experimental data.
From the experimental results in Table 1, it can be seen that, for each algorithm, the accuracy of extracting buildings based on oblique photographic modeling data is higher than that of extracting buildings using DOM alone. The gap of IOU between the DOM and oblique photographic modeling data in random forest experiments is larger than in the other two algorithms. The gap of IOU under U-Net based on the ResNeXt50 experiment has the smallest number. Since the oblique photographic modeling data can provide a more detailed feature for deep learning, the IOU of three algorithms for oblique photographic data are compared. The IOU for the extraction building footprint using U-Net based on the ResNeXt50 has a value of 0.8255, which is higher than the 0.8143 in U-Net based on the VGG-19 and also higher than that in random forest, which is 0.7532. This result indicates that the accuracy of extracting the building footprint polygon using the U-Net based on the ResNeXt50 is higher than the accuracy of the other two algorithms. The above findings prove that the extraction from an oblique photograph by U-Net based on the ResNeXt50 would be the most accurate and optimal.

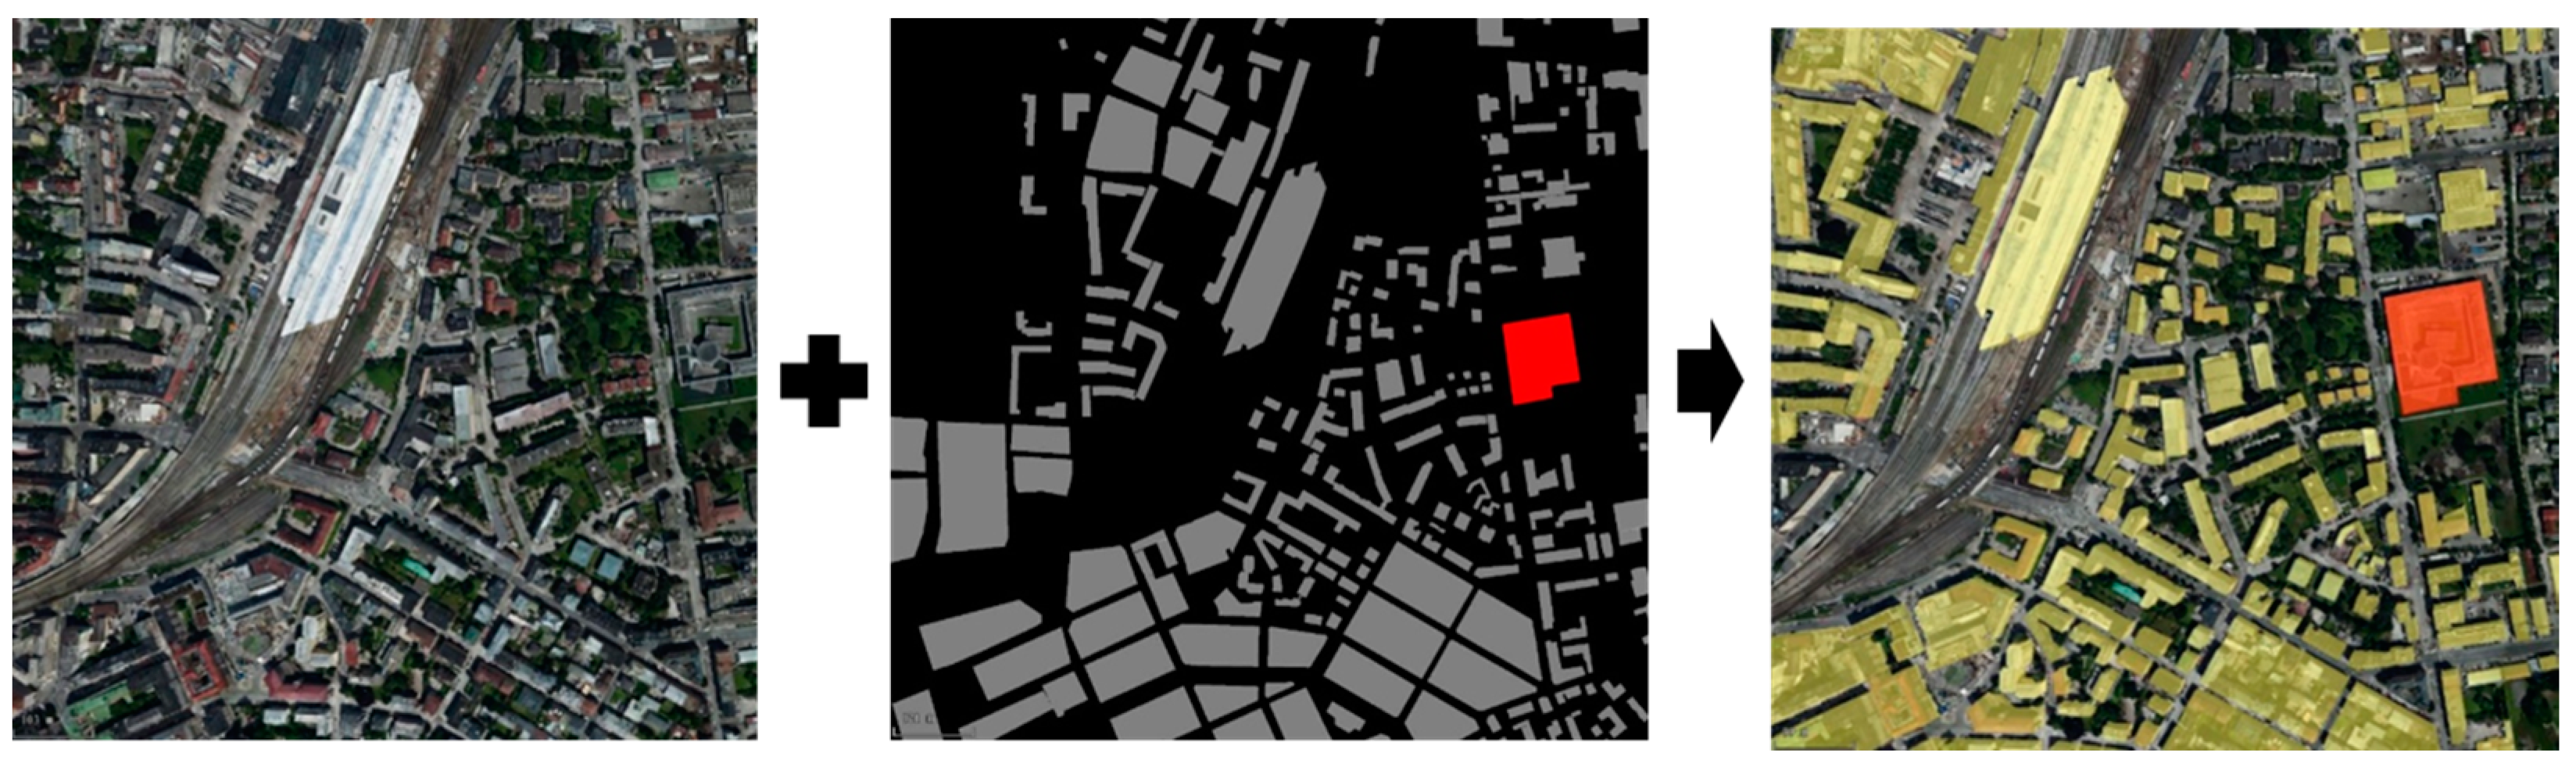
4.2. Visualization of Dynamic Virtual Building Monomer Construction

Since the U-Net based on the ResNeXt50 performs better than the other two algorithms in accuracy, it is chosen as the building extraction method in the dynamic virtual building monomer construction. The initial idea of highlighting a singular building in oblique photography by selecting the underlaid polygon is achieved. Figure 8a displays oblique photographic modeling data as a 3D scene base map, which cannot support selection, editing, etc. Figure 8b illustrates the extraction of buildings by U-Net based on the ResNeXt50. Each polygon bottom surface datum corresponds to a building on the oblique photographic model that needs to be selected, and the polygon bottom surface data have attribute information. The blue polygon is the target building which is expected to be selected in the oblique photograph. Figure 8c demonstrates that the polygonal bottom surface and the oblique photographic modeling data are matched.
The successful selection of the building by the dynamic virtual method of building monomer construction using oblique photography proposed in this study provides a solid base for its various applications with different functions. One of the applications is the interactive query of the oblique photographic model. Clicking the building in the 3D scene with the mouse obtains the intersection point O. The point O in the Cartesian coordinate system is converted into the point P in the geographic coordinate system. The geometric data, including ID value and attribute information of the found polygon, are returned by finding the underlying polygon where point P is located (as shown in Figure 9a).
In addition, the implementation of the structured query language (SQL) query and spatial query of the oblique photographic model can also be realized by the dynamic virtual method of building monomer construction using oblique photography (as shown in Figure 9b,d). The set of polygon objects satisfying the SQL query and the spatial query condition in the database is selected, the polygons are attached to the oblique photographic modeling data by rendering the stencil shadow volume, and the corresponding building surface is highlighted with a specific color. This function contributes to the thematic map and other productions (as shown in Figure 9c).

5. Discussion

With several advantages, the oblique photographic dynamic virtual method of building monomer construction using oblique photography realized the dynamic selection and expression of singular buildings in oblique photographs. The workflow designed in this research, which proposes an alternative method to avoid processing the oblique photographic model data, is effective and efficient.
Distinguishable from traditional oblique photography, which cuts the data to extract individual buildings, this method has many problems. Deep-convolutional-neural-network-based dynamic virtual whole technology for tilt images uses deep learning methods to extract building footprints, associates polygonal building footprints with the building surface construction of the image, and forms a closed shadow body within the 3D image extraction to ensure the overall realization of the data, which has the advantages of easy segmentation, data streamlining, and automation. In addition, unlike the traditional, straightforward cutting algorithm, the virtual method of building monomer construction using oblique photography saves data processing time. By dynamically extracting the building footprint from the oblique photographs, updating the polygon becomes more convenient, and the whole monomer process becomes flexible. Additionally, as shown in Section 3, the dynamic virtual method of building monomer construction using oblique photography can fully use the attribute query, spatial query, and spatial computing capabilities of the polygon bottom surface, which support more powerful two-dimensional integrated GIS applications and can conduct more advanced analysis.
Furthermore, as shown in Figure 5, the visualization effect shows high quality. U-Net is a simple, structured extraction method commonly used for semantic segmentation, consisting of upsampling and downsampling to form a left–right symmetric network structure. The edge of the complete translucent wrapping of the object calculated by the model is accurate to the pixel level, and the edge is straight and has no jaggedness. Theoretically, the dynamic virtual method of building monomer construction applies to oblique photographic model data and the single representation of point cloud data.
In order to find the most suitable backbone network for a U-Net architecture, this study designs experiments to extract the bottom of buildings by random forest algorithm and VGG-19-based and ResNeXt50 algorithms and rates them by Jakarta index to compare the extraction results. VGG-19 and ResNeXt50 are both convolutional neural network architectures used in deep learning, but they have some key differences in architecture, cardinality, computational efficiency, training and loss function, and applications. The differences are revealed by the results as listed in Table 1. VGG is a series of CNN architectures with a fixed and simple structure, while ResNeXt has a deeper architecture with multiple branches or pathways, each with different filter sizes. Compared to the limited layers in VGG, the complex architecture of ResNeXt enhances its representation capacity. The computational efficiency of ResNeXt is higher than that of VGG because of its complex structure. Although VGG can be computationally expensive due to its deeper architecture with a large number of parameters, the architecture of ResNeXt can lead to improved performance compared to traditional deep networks with a similar number of parameters by utilizing parallel paths with reduced filter sizes. By analyzing the differences from the view of theory and comparing the differences by the remote sensing image feature extraction data competition index, the ResNeXt50 is more suitable for being the backbone network of U-Net architecture in this technique.
U-Net has a U-shaped network structure and utilizes skip connections that connect corresponding encoder and decoder layers. The choice of backbone network depends on various factors such as the specific task, dataset, and computational resources available and should be evaluated and optimized for the specific use case. In this research, by using ResNeXt50 as the backbone network of a U-Net architecture, the features extracted by the ResNeXt50 encoder can be used as the input to the U-Net decoder for segmentation. The encoder–decoder path allows the network to preserve fine-grained spatial information and capture both local and global contextual information, which helps in improving the accuracy and localization of segmentation masks. The other CNN architectures with high accuracy and efficiency could be tested by combining with U-Net for image segmentation in future work, such as DenseNet (Densely Connected Convolutional Networks), a CNN architecture with the features of dense connections [71,72] where each layer receives input from all previous layers, allowing for efficient feature reuse and reducing the number of parameters.

6. Conclusions and Future Work

Fully automated oblique photographic modeling technology solves the problem of 3D data sources for 3D GIS applications. However, oblique photographic modeling data are full-element slice data, which makes it impossible to operate on a single building. This research proposes a dynamic virtual monomer method for oblique photographic modeling data. The vector building footprint is attached to the surface of the oblique photographic modeling data by the shadow volume rendering technique, and the dynamic correlation between the vector underlying data and the oblique photographic modeling data is built. In the case of not cutting data, the singular expression and object-oriented query of oblique photographic modeling data are realized. A deep convolutional neural network based on a U-Net deep convolution neural network structure is proposed to extract the underside of the building from the oblique geographic image and thus improve the effectiveness of the fully automated oblique photographic model monomer process. This study proposes a deep-learning-based approach for extracting monomeric data from oblique photography, thereby achieving dynamic virtual monomerization of oblique photographic modeling data. The deep learning network employed in this method is based on the U-Net architecture, with ResNeXt50 serving as the backbone network for the U-Net structure. Comparative experiments indicate that this method is efficient and feasible, with higher extraction accuracy compared to traditional algorithms. It achieves full automation in representing oblique photography singularly, supports the two-dimensional integration of oblique photographic modeling data into GIS applications, and effectively promotes the widespread application of oblique photographic modeling data in industries such as surveying, planning, and smart cities.
U-Net, with its distinctive U-shaped network structure, is a convolutional neural network. The choice of backbone network can be influenced by various factors such as specific applications, dataset characteristics, and computational resource availability, and should be assessed and optimized based on individual use cases. In this study, by employing ResNeXt50 as the backbone network for the U-Net architecture, the features extracted by the ResNeXt50 encoder can be utilized as input for the U-Net decoder to perform segmentation. In future work, other CNN architectures with high accuracy and efficiency could be tested for integration with U-Net to enhance image data extraction. Improvements could focus on reducing model size and computational complexity, as well as enhancing U-Net’s performance in handling complex details.

Author Contributions

S.W. and H.L. contributed equally to this paper. Conceptualization, S.W. and X.L.; methodology, S.W., H.L., J.Y. and L.L.; validation, Y.J., W.W. and Z.L.; data resources, S.W. and L.L.; data curation, J.Y. and N.Z.; writing—original draft preparation, X.L. and L.L.; writing—review and editing, S.W., X.L., H.L. and N.Z.; visualization, Y.J. and N.Z.; supervision, S.W. and H.L.; project administration, H.L.; funding acquisition, S.W. All authors have read and agreed to the published version of the manuscript.

Funding

The research was financially supported by the Beijing Chaoyang District Collaborative Innovation Project (E2DZ050100).

Data Availability Statement

Data are contained within the article.

Conflicts of Interest

Authors Liming Lin and Ying Jiang were employed by the company STATE GRID Location-Based Service Co., Ltd. Author Hao Lu was employed by the company SuperMap Software Co., Ltd. Author Wenda Wang was employed by the company China Railway Construction Bridge Engineering Bureau Group Co., Ltd. The remaining authors declare that the research was conducted in the absence of any commercial or financial relationships that could be construed as a potential conflict of interest.

References

  1. Suveg, I.; Vosselman, G. Reconstruction of 3D building models from aerial images and maps. ISPRS J. Photogramm. Remote Sens. 2004, 58, 202–224. [Google Scholar] [CrossRef]
  2. Yin, X.; Wonka, P.; Razdan, A. Generating 3D Building Models from Architectural Drawings: A Survey. IEEE Comput. Graph. Appl. 2009, 29, 20–30. [Google Scholar] [CrossRef] [PubMed]
  3. El-Mekawy, M.; Östman, A.; Hijazi, I. A Unified Building Model for 3D Urban GIS. ISPRS Int. J. Geo-Inf. 2012, 1, 120–145. [Google Scholar] [CrossRef]
  4. Danilina, N.; Slepnev, M.; Chebotarev, S. Smart city: Automatic reconstruction of 3D building models to support urban development and planning. MATEC Web Conf. 2018, 251, 03047. [Google Scholar] [CrossRef]
  5. Schrotter, G.; Hürzeler, C. The Digital Twin of the City of Zurich for Urban Planning. J. Photogramm. Remote Sens. Geoinf. Sci. 2020, 88, 99–112. [Google Scholar] [CrossRef]
  6. Baarimah, A.O.; Alaloul, W.S.; Liew, M.S.; Kartika, W.; Al-Sharafi, M.A.; Musarat, M.A.; Alawag, A.M.; Qureshi, A.H. A Bibliometric Analysis and Review of Building Information Modelling for Post-Disaster Reconstruction. Sustainability 2022, 14, 393. [Google Scholar] [CrossRef]
  7. Li, Q.; Shi, Y.; Huang, X.; Zhu, X.X. Building Footprint Generation by Integrating Convolution Neural Network with Feature Pairwise Conditional Random Field (FPCRF). IEEE Trans. Geosci. Remote Sens. 2020, 58, 7502–7519. [Google Scholar] [CrossRef]
  8. Cha, H.S.; Kim, J. A study on 3D/BIM-based on-site performance measurement system for building construction. J. Asian Archit. Build. Eng. 2020, 19, 574–585. [Google Scholar] [CrossRef]
  9. Song, G. The dilemma and way out of 3D GIS. China Surv. Mapp. 2010, 1, 32–39. [Google Scholar]
  10. Ahmed, R.; Mahmud, K.H.; Tuya, J.H. A GIS-based mathematical approach for generating 3d terrain model from high-resolution UAV imageries. J. Geovi. Spat. Anal. 2021, 5, 24. [Google Scholar] [CrossRef]
  11. Zhou, L.; Yuan, B.; Hu, F.N.; Wei, C.Z.; Dang, X.W.; Sun, D.Q. Understanding the effects of 2D/3D urban morphology on land surface temperature based on local climate zones. Build. Environ. 2022, 208, 108578. [Google Scholar] [CrossRef]
  12. Zhang, C.; Fan, H.; Kong, G. VGI3D: An interactive and low-cost solution for 3D building modelling from street-level VGI images. J. Geovi. Spat. Anal. 2021, 5, 18. [Google Scholar] [CrossRef]
  13. Li, D.; Xiao, X.; Guo, B.; Jiang, W.; Shi, Y. Oblique Image Based Automatic Aerotriangulation and Its Application in 3D City Model Reconstruction. Geomat. Inf. Sci. Wuhan Univ. 2016, 41, 711–721. [Google Scholar] [CrossRef]
  14. Song, G.; Zhong, E.; Wu, Z.; Li, S.; Cai, W.; Wang, S. Four Key Technologies of the Next Generation GIS Platform. J. Geomat. 2019, 44, 1–8. [Google Scholar] [CrossRef]
  15. Feng, Z.; Li, M.; Yang, Y.; Li, N. Research and Practice on Key Technologies of New Generation 3D GIS. Geomat. Spat. Inf. Technol. 2017, 40, 85–87. [Google Scholar] [CrossRef]
  16. Meng, C.; Song, Y.; Ji, J.; Jia, Z.; Zhou, Z.; Gao, P.; Liu, S. Automatic classification of rural building characteristics using deep learning methods on oblique photography. Build. Simul. 2022, 15, 1161–1174. [Google Scholar] [CrossRef]
  17. Xu, W.; Zeng, Y.; Yin, C. 3D City Reconstruction: A Novel Method for Semantic Segmentation and Building Monomer Construction Using Oblique Photography. Appl. Sci. 2023, 13, 8795. [Google Scholar] [CrossRef]
  18. Ma, X.Y.; Zhang, X.P.; Shi, L. Research on the Algorithm of Building Object Boundary Extraction Based on Oblique Photographic Model. In Proceedings of the IEEE 3rd Advanced Information Technology, Electronic and Automation Control Conference (IAEAC), Chongqing, China, 12–14 October 2018. [Google Scholar] [CrossRef]
  19. Cheng, H. A Monolithic Approach to BIM with UAV Remote Sensing Tilt Imagery; Beijing University of Architecture: Beijing, China, 2018. [Google Scholar]
  20. Yang, C. Building Extraction and Parametric 3D Reconstruction Based on Tilt Images; Xi’an University of Science and Technology: Xi’an, China, 2016. [Google Scholar]
  21. Zhao, L.; Wang, H.; Guo, Z.; Guan, J. A study of classification of point clouds generated by oblique imagery based on random forest. Eng. Surv. Mapp. 2018, 27, 16–21. [Google Scholar] [CrossRef]
  22. Yao, J.; Cao, X.Y.; Hong, D.F.; Wu, X.; Meng, D.Y.; Chanussot, J.; Xu, Z.B. Semi-Active Convolutional Neural Networks for Hyperspectral Image Classification. IEEE Trans. Geosci. Remote Sens. 2022, 60, 5537915. [Google Scholar] [CrossRef]
  23. Xin, W.; Hong, D.F.; Chanussot, J. Convolutional Neural Networks for Multimodal Remote Sensing Data Classification. IEEE Trans. Geosci. Remote Sens. 2021, 60, 5517010. [Google Scholar] [CrossRef]
  24. Krizhevsky, A.; Sutskever, I.; Hinton, G.E. Imagenet classification with deep convolutional neural networks. In Proceedings of the Advances in Neural Information Processing Systems, Lake Tahoe, CA, USA, 3–6 December 2012; Volume 25, pp. 1097–1105. [Google Scholar] [CrossRef]
  25. Gao, F.; Huang, T.; Sun, J.; Wang, J.; Hussain, A.; Yang, E. A New Algorithm for SAR Image Target Recognition Based on an Improved Deep Convolutional Neural Network. Cogn. Comput. 2019, 11, 809–824. [Google Scholar] [CrossRef]
  26. Yuan, D.; Fan, N.; He, Z. Learning target-focusing convolutional regression model for visual object tracking. Knowl.-Based Syst. 2020, 194, 105526. [Google Scholar] [CrossRef]
  27. Ghosh, S.; Das, N.; Das, I.; Maulik, U. Understanding Deep Learning Techniques for Image Segmentation. ACM Comput. Surv. 2019, 52, 73. [Google Scholar] [CrossRef]
  28. Rawat, W.; Wang, Z. Deep Convolutional Neural Networks for Image Classification: A Comprehensive Review. Neural Comput. 2017, 29, 2352–2449. [Google Scholar] [CrossRef] [PubMed]
  29. Swalpa, K.R.; Purbayan, K.; Hong, D.F.; Xin, W.; Antonio, P.; Chanussot, J. Revisiting Deep Hyperspectral Feature Extraction Networks via Gradient Centralized Convolution. IEEE Trans. Geosci. Remote Sens. 2021, 60, 5516619. [Google Scholar] [CrossRef]
  30. Behnood, R.; Hong, D.F.; Hang, R.L.; Ghamisi, P.; Kang, X.D.; Chanussot, J.; Benediktsson, J.A. Feature Extraction for Hyperspectral Imagery: The Evolution from Shallow to Deep: Overview and Toolbox. IEEE Geosci. Remote Sens. Mag. 2020, 8, 60–88. [Google Scholar] [CrossRef]
  31. Hong, D.F.; Gao, L.R.; Wu, X.; Yao, J.; Zhang, B. Revisiting Graph Convolutional Networks with Mini-Batch Sampling for Hyperspectral Image Classification. In Proceedings of the 2021 11th Workshop on Hyperspectral Imaging and Signal Processing: Evolution in Remote Sensing (WHISPERS), Amsterdam, The Netherlands, 14–16 January 2021. [Google Scholar] [CrossRef]
  32. Yi, Y.; Zhang, Z.; Zhang, W.; Zhang, C.; Li, W.; Zhao, T. Semantic Segmentation of Urban Buildings from VHR Remote Sensing Imagery Using a Deep Convolutional Neural Network. Remote Sens. 2019, 11, 1774. [Google Scholar] [CrossRef]
  33. Yang, Q.; Shi, L.; Han, J.; Zha, Y.; Zhu, P. Deep convolutional neural networks for rice grain yield estimation at the ripening stage using UAV-based remotely sensed images. Field Crops Res. 2019, 235, 142–153. [Google Scholar] [CrossRef]
  34. Kattenborn, T.; Leitloff, J.; Schiefer, F.; Hinz, S. Review on Convolutional Neural Networks (CNN) in vegetation remote sensing. ISPRS J. Photogramm. Remote Sens. 2021, 173, 24–49. [Google Scholar] [CrossRef]
  35. Sportouche, H.; Tupin, F.; Denise, L. Extraction and Three-Dimensional Reconstruction of Isolated Buildings in Urban Scenes from High-Resolution Optical and SAR Spaceborne Images. IEEE Trans. Geosci. Remote Sens. 2011, 49, 3932–3946. [Google Scholar] [CrossRef]
  36. Sui, H.G.; Liu, C.X.; Huang, L.H.; Hua, L. Application of Remote Sensing Technology in Earthquake-Induced Building Damage Detection. Geomat. Inf. Sci. Wuhan Univ. 2019, 44, 1008–1019. [Google Scholar] [CrossRef]
  37. Wang, S.B.; Li, M.X.; Li, H.R. Research on obstacle detection of transmission line corridor based on 3D laser radar technology. Electron. Technol. 2019, 32, 81–84. [Google Scholar] [CrossRef]
  38. Manthira, S.M.; Misra, I.; Kaur, R.; Darji, N.P.; Ramakrishnan, R. Kernel Based Learning Approach for Satellite Image Classification Using Support Vector Machine. In Proceedings of the 2011 IEEE Recent Advances in Intelligent Computational Systems, Trivandrum, India, 22–24 September 2011. [Google Scholar] [CrossRef]
  39. Sun, Y.; Du, Y. Big data and sustainable cities: Applications of new and emerging forms of geospatial data in urban studies. Open Geospat. Data Softw. Stand. 2017, 2, 24. [Google Scholar] [CrossRef]
  40. Goebbels, S. 3D reconstruction of bridges from airborne laser scanning data and cadastral footprints. J. Geovis. Spat. Anal. 2021, 5, 10. [Google Scholar] [CrossRef]
  41. Zhu, J.P.; Zhao, H.L.; Yang, H.T. Disparity map generation technology based on convolutional neural network. J. Comput. Appl. 2018, 38, 255. [Google Scholar] [CrossRef]
  42. Liu, X.L.; Zhao, X.S.; Lu, F.; Sun, W.B. A GA-SVM based model for throwing rate prediction in the open-pit cast blasting. J. China Coal Soc. 2012, 37, 1999–2005. [Google Scholar] [CrossRef]
  43. Li, X.Z. Construction Research and Application Practice of 3D High Precision Map-Take 5G + Intelligent Transportation Field as an Example. Mod. Inf. Technol. 2021, 5, 57–61. [Google Scholar] [CrossRef]
  44. Luo, H.T. Research on Safety Monitoring and Evaluation of Urban Rail Transit Based on “BIM+GIS”. Railw. Investig. 2021, 47, 33–36+47. [Google Scholar] [CrossRef]
  45. Alcaraz, C.; Lopez, J. Digital Twin: A Comprehensive Survey of Security Threats. IEEE Commun. Surv. Tutor. 2022, 24, 1475–1503. [Google Scholar] [CrossRef]
  46. Zhu, R.S.; Li, S.; Sun, Y.Z.; Cao, Y.Y.; Sun, K.; Guo, Y.X.; Jiang, B.F.; Wang, X.Y.; Li, Y.; Zhang, Z.G.; et al. Research advances and prospects of crop 3D reconstruction technology. Smart Agric. 2021, 3, 94. [Google Scholar] [CrossRef]
  47. Gan, L.L.; Li, J.; Jing, N. Hybrid organization and visualization of the DSM combined with 3D building model. In Proceedings of the 2nd International Conference on Image, Vision and Computing (ICIVC), Chengdu, China, 2–4 June 2017; pp. 566–571. [Google Scholar] [CrossRef]
  48. Ma, R. Building Model Reconstruction from LiDAR Data and Aerial Photographs; The Ohio State University: Columbus, OH, USA, 2005. [Google Scholar]
  49. Li, Z.; Liu, F.; Yang, W.; Peng, S.; Zhou, J. A survey of convolutional neural networks: Analysis, applications, and prospects. IEEE Trans. Neural Netw. Learn. Syst. 2021, 33, 6999–7019. [Google Scholar] [CrossRef] [PubMed]
  50. Kim, P.; Kim, P. Convolutional neural network. In MATLAB Deep Learning: With Machine Learning, Neural Networks and Artificial Intelligence; Apress: Berkeley, CA, USA, 2017; pp. 121–147. [Google Scholar] [CrossRef]
  51. Long, J.; Shelhamer, E.; Darrell, T. Fully convolutional networks for semantic segmentation. In Proceedings of the IEEE conference on Computer Vision and Pattern Recognition, Boston, MA, USA, 7–12 June 2015. [Google Scholar] [CrossRef]
  52. Ronneberger, O.; Fischer, P.; Brox, T. U-net: Convolutional networks for biomedical image segmentation. In Proceedings of the Medical Image Computing and Computer-Assisted Intervention, Munich, Germany, 5–9 October 2015. [Google Scholar] [CrossRef]
  53. Wu, X.; Hong, D.F.; Chanussot, J. UIU-Net: U-Net in U-Net for Infrared Small Object Detection. IEEE Trans. Image Process. 2022, 32, 364–376. [Google Scholar] [CrossRef]
  54. Wu, X.; Hong, D.F.; Huang, Z.C.; Chanussot, J. Infrared Small Object Detection Using Deep Interactive U-Net. IEEE Geosci. Remote Sens. Lett. 2022, 19, 6517805. [Google Scholar] [CrossRef]
  55. Szegedy, C.; Toshev, A.; Erhan, D. Deep neural networks for object detection. In Proceedings of the Advances in Neural Information Processing Systems, Lake Tahoe, NV, USA, 5–10 December 2013; p. 26. [Google Scholar] [CrossRef]
  56. Benali, A.A.; Amrouch, M. Convolutional neural networks backbones for object detection. In Proceedings of the Image and Signal Processing: 9th International Conference, ICISP 2020, Marrakesh, Morocco, 4–6 June 2020. [Google Scholar] [CrossRef]
  57. Habib, N.; Hasan, M.M.; Reza, M.M.; Rahman, M.M. Ensemble of CheXNet and VGG-19 feature extractor with random forest classifier for pediatric pneumonia detection. SN Comput. Sci. 2020, 1, 359. [Google Scholar] [CrossRef] [PubMed]
  58. Mateen, M.; Wen, J.; Nasrullah; Song, S.; Huang, Z. Fundus image classification using VGG-19 architecture with PCA and SVD. Symmetry 2018, 11, 1. [Google Scholar] [CrossRef]
  59. Chen, J.; Lu, Y.; Yu, Q.; Luo, X.; Adeli, E.; Wang, Y.; Lu, L.; Yuille, A.L.; Zhou, Y. TransUNet: Transformers Make Strong Encoders for Medical Image Segmentation. arXiv 2021, arXiv:2102.04306. [Google Scholar] [CrossRef]
  60. Simonyan, K.; Zisserman, A. Very deep convolutional networks for large-scale image recognition. In Proceedings of the International Conference on Learning Representions, San Diego, CA, USA, 7–9 May 2015. [Google Scholar] [CrossRef]
  61. He, K.; Zhang, X.Y.; Ren, S.Q. Deep residual learning for image recognition. In Proceedings of the IEEE Conference on Computer Vision and Pattern Recognition, Las Vegas, NV, USA, 27–30 June 2016. [Google Scholar] [CrossRef]
  62. Xie, S.; Girshick, R.; Dollár, P. Aggregated Residual Transformations for Deep Neural Networks. In Proceedings of the IEEE Conference on Computer Vision and Pattern Recognition, Honolulu, HI, USA, 21–26 July 2017. [Google Scholar] [CrossRef]
  63. Zwartjes, P.; Yoo, J. First break picking with deep learning–evaluation of network architectures. Geophys. Prospect. 2022, 70, 318–342. [Google Scholar] [CrossRef]
  64. Wang, E.; Wang, D. Using U-Net to Detect Buildings in Satellite Images. J. Comput. Commun. 2022, 10, 132–138. [Google Scholar] [CrossRef]
  65. Xu, J.J.; Zhang, H.; Tang, C.S.; Cheng, Q.; Liu, B.; Shi, B. Automatic soil desiccation crack recognition using deep learning. Geotechnique 2022, 72, 337–349. [Google Scholar] [CrossRef]
  66. Milletari, F.; Navab, N.; Ahmadi, S.A. V-net: Fully convolutional neural networks for volumetric medical image segmentation. In Proceedings of the Fourth International Conference on 3D Vision(3DV), Stanford, CA, USA, 25–28 October 2016. [Google Scholar] [CrossRef]
  67. Biau, G. Analysis of a random forests model. J. Mach. Learn. Res. 2012, 13, 1063–1095. [Google Scholar] [CrossRef]
  68. Breiman, L. Random forests. Mach. Learn. 2001, 45, 5–32. [Google Scholar] [CrossRef]
  69. Dstl Satellite Imagery Feature Detection. Available online: https://www.kaggle.com/competitions/dstl-satellite-imagery-feature-detection (accessed on 5 February 2023).
  70. Vharkate, M.N.; Musande, V.B. Fusion based feature extraction and optimal feature selection in remote sensing image retrieval. Multimed. Tools Appl. 2022, 81, 31787–31814. [Google Scholar] [CrossRef]
  71. Huang, G.; Liu, Z.; Pleiss, G.; Maaten, L.V.D.; Weinberger, K.Q. Convolutional networks with dense connectivity. IEEE Trans. Pattern Anal. Mach. Intell. 2022, 44, 8704–8716. [Google Scholar] [CrossRef] [PubMed]
  72. Song, G.; Zhong, E.; Zhou, Q.; Feng, Z. Research and Practice on General 3D Field Data Model in GIS. J. Geomat. 2020, 45, 1–7. [Google Scholar] [CrossRef]
Figure 1. Building selection by overlaying of polygon on remote sensing images.
Remotesensing 16 00979 g001
Figure 2. Overall workflow.
Remotesensing 16 00979 g002
Figure 3. Division of training and testing areas.
Remotesensing 16 00979 g003
Figure 4. Commonly used image classification network structure.
Remotesensing 16 00979 g004
Figure 6. Basic structural unit of ResNeXt.
Remotesensing 16 00979 g006
Figure 7. Building extraction from oblique photographic data based on U-Net.
Remotesensing 16 00979 g007
Figure 8. 3D building selection by overlapping polygon as building bottom with oblique photographic model. (a) oblique photography(b) extracted building results, (c) data matching.
Remotesensing 16 00979 g008
Figure 9. Dynamic virtual monomer of oblique photographic model: (a) query properties, (b) buffer query, (c) thematic map representation, (d) peripheral query.
Remotesensing 16 00979 g009
Table 1. Experimental results.
AlgorithmIOU for Extraction from DOMIOU for Extraction from Oblique Photography
Random forest [21]0.50240.7532
U-Net based on VGG-19 [70]0.71630.8143
U-Net based on ResNeXt50 (Ours)0.76520.8255
Disclaimer/Publisher’s Note: The statements, opinions and data contained in all publications are solely those of the individual author(s) and contributor(s) and not of MDPI and/or the editor(s). MDPI and/or the editor(s) disclaim responsibility for any injury to people or property resulting from any ideas, methods, instructions or products referred to in the content.

