Abstract
The Inverse Synthetic Aperture Radar (ISAR) has been proven to be an effective tool for space target sensing due to its capability of performing high-resolution imaging. Since the component information of the spacecraft is key to the identification of the target and diagnosis of its status, ISAR images with a clear and complete representation of the typical components are much desired. This requires a selection of the imaging time, during which a certain spacecraft component has a good projection on the ISAR image plane with the shape feature well conserved and a high resolution. In addition, a fully automated implementation with a high computational efficiency is also highly preferred for on-orbit operations so as to improve the intelligence level of the space-borne system. We propose a bicriterion-based automated optimal imaging time-selection method for the space-borne ISAR, which is seeking the slow time section of the data that result in the best image. A good image means a high azimuth resolution and the best presentation of the solar panels. One criterion is the Maximum Doppler Spread (MDS), which indicates the maximum Effective Rotational Velocity (ERV) leading to high image resolution, but it is influenced by the satellite attitude. of the spacecraft. The other is the Maximum Component Area (MCA), which is defined to indicate the completeness of the component considered. The radar echoes are processed sequentially by way of a sliding window. The interval with the co-maximization of the DS and CA is selected, and fine processing is performed further to obtain the best images. The results of the simulation experiments show that the proposed method can achieve spacecraft images with the solar panels presented the best. The computational complexity is low.
1. Introduction
With the increasing human space activities, the number of on-orbit spacecrafts increases significantly. To ensure the safety of the spacecraft flight, which is important for both civil and military missions, possessing the Situational Awareness (SA) ability is crucial for the current spacecrafts.
The ability of radars to make images regardless of weather conditions, day and night, clearly makes the sensor important for national security concerns since the movement of targets can be clearly seen [1]. Noticeably, space-borne radars present some relevant advantages with respect to the ground-based ones: wider accessibility on the global scale and not reliance on potentially vulnerable infrastructures [2]. Space-borne radar have higher data rates, larger processing capacities, and more complex imaging algorithms than optical remote sensing satellites [3]. As compared to the ground-based space SA (SSA) systems, the space-borne SSA is gaining much attention since the observation time, range, and angles are not limited anymore, leading to a faster response time and stronger detection ability.
The Inverse Synthetic Aperture Radar (ISAR) has the capability of performing high-resolution imaging on non-cooperative targets [4,5]. Imaging algorithms have been deeply investigated in the past few decades. All the time, the ISAR imaging algorithm attaches importance to the high-resolution, multi-dimension, and intelligence capability, which has guided the progress and development of the ISAR imaging technique. As for the high resolution, a large observation angle is divided into several sub-apertures to obtain the images from different perspectives, which shows that the different scatterers appear in different sub-aperture images and demonstrates the essentiality of high-performance space observation for space target recognition [6]. As for the multi-dimension, a promising and reliable attempt reported is the Polarimetric Interferometry ISAR (Pol-InISAR)-based approach that performs 3D imaging in the form of a point cloud indicating the actual shape of the target [7], which takes full polarimetry back-scattered information into account. As for intelligence, CNNs have been proven as useful tools in ISAR data analysis in military applications such as automatic target recognition, classification, segmentation, and image denoising [8].
The space-borne ISAR has been proven to be an essential part of complementing the optical sensor in the future spacecraft SSA system. Since the component information of the spacecraft is key to the identification of the target and diagnosis of its status, the ISAR images with a clear and complete representation of the typical components are much desired. The optimal time selection is necessary to reduce the waste of storage resources and achieve a high sensing efficiency, during which the typical components of the spacecraft have good projections and high-resolution presentations.
The available methods for ISAR optimal time selection can be divided into two main categories: one based on image graphical analysis [9,10] and the other based on estimating the Doppler information [11,12,13,14,15,16]. The former estimates the motion characteristics of the target by extracting the ISAR image features, which does not need any prior knowledge of the target. The latter estimates the motion characteristics of the target by calculating the Doppler Spread (DS) or Doppler center of the target. Both of them are based on the information of Doppler frequency.
The DS of the target is related to the Effective Rotational Velocity (ERV), which determines the cross-range resolution of the image. To obtain a high-resolution and well-focused image, a time interval in which the ERV is large and stable should be selected. The Image Projection Plane (IPP) selection is also one of the tricky parts and needs attention, which can select the image with an appropriate resolution and useful shape information at the same time. Considering the need for subsequent identification and measurement, the single-criterion processing of the existing methods is limited.
In this paper, we proposed a bicriterion-based imaging time-selection method. The radar echoes during the whole observation period are processed coarsely in a sliding window way with high efficiency, where the range alignment [17] and phase compensation [18] are performed with conventional methods and the images are formed by using the simple Range-Doppler method [5]. After obtaining the images, the DS value is calculated for each image, and the satellite Component Area (CA) of the solar panels is calculated. In addition, we employ the Constant False Alarm Rate (CFAR) to extract the target area to improve the DS calculation accuracy and efficiency. Finally, we select the data that satisfy the co-maximization of the DS and CA for fine motion compensation, from which we can obtain clear and well-focused optimal ISAR imaging results.
The organization of this paper is as follows: the IPP under different relative motions for the space-borne ISAR system are analyzed in Section 2. The optimal time-selection method for the combined DS and CA calculation is described in Section 3. The performance of the proposed method is evaluated by a series of simulation experiments in Section 4.
2. Signal Model and Imaging Projection Plane Analysis
2.1. Imaging Geometry
The geometric model of a space-borne ISAR imaging system is shown in Figure 1. The radar center A is the origin of the radar observation coordinate system . The coordinate of radar center A can be represented as .
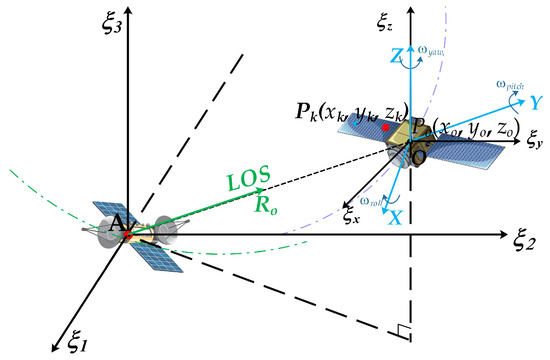
Figure 1.
System geometry of the space-borne ISAR system.
is the target body coordinate system, which is parallel to initially. The other coordinate system is established based on the target center O. The X-axis is the direction of the target flight and the Y-axis is along the direction of the radar Line Of Sight (LOS). The origin is located at in the radar coordinates at the starting time. Thus, the initial range between the radar and the target is . denotes an arbitrary k-th scatterer in the target body coordinate system at the starting time. The initial range from the radar to is expressed as . The space target is rotating around the axes X, Y, and Z. The three-dimensional (3D) (roll, pitch, and yaw) rotation velocities can be denoted as , , and , respectively. In the imaging interval, the 3D rotation angles are denoted as , , and .
2.2. Signal Model
The received signal after range compression is denoted as
where sinc(·) denotes the envelope of the compressed echo, is the amplitude function, is the slow time, is the pulse width, c represents the speed of light, is the chirp rate, is the carrier frequency, and is the range frequency. denotes the range difference between the k-th scatterer and the radar A, which can be expressed as
where
where is the rotation matrix
where
2.3. Analysis of IPP
The ISAR image is a projection of the target onto the IPP, which is composed of a range dimension and cross-range dimension. The range dimension is defined by radar LOS, and the cross-range dimension is perpendicular to the direction of both the ERV and radar LOS [5].
According to the orbit altitude, targets can be divided into Low Earth Orbit (LEO) targets, Medium Earth Orbit (MEO) targets, and High Earth Orbit (HEO) targets. According to the target altitude, targets can be divided into high-speed spin targets, three-axis stabilized targets, and slow-tumbling targets with uncontrolled altitudes.
For the target in the altitude adjustment state or out of control, the three rotation components (, , and ) cause the satellite to rotate relative to the radar center. The geometry of the target relative to the radar is as shown in Figure 2, in which the pitch angle is small. In addition, coincides with , which is parallel to . As defined in Section II-A, the radar LOS is along the Y-axis. In this scenario, the angle of rotation of the target with respect to the radar is generated by a combination of orbit motion and its own rotation. When is far bigger than , the ISAR image with the target’s side view is obtained as shown in plane B in Figure 2. Otherwise, the ISAR image presents a hybrid view of the target.
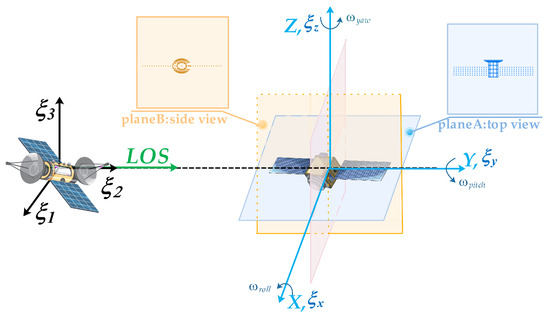
Figure 2.
IPPs under different rotation conditions.
For the three-axis stabilized target, the rotation angle with respect to the radar is generated by the combination of the orbital motions of the radar and the target. When the radar and the target are in the same orbit plane such as the scenario in Figure 2, the pitch angle of the target relative to the radar is small. In this case, the top view of the target is usually obtained as shown in plane A in Figure 2. Otherwise, a mixed view consisting of the top view and front view is usually obtained.
3. Bicriteria-Based Optimal Time Selection
The “optimal imaging” in our proposed method is referred to as the complete representation of a certain key component and high image resolution. Figure 3 presents the flowchart of our proposed method. Firstly, the radar echoes are processed in a sliding window way, during which the motion compensation and FFT are performed in the cross-range to obtain a sequence of coarsely focused images of the target. Secondly, the DS and CA curve is obtained by the improved DS calculation and proposed CA calculation. The extreme points at which the synthetic DS-CA has relatively large values are determined and selected as the optimal imaging time instants. At last, the data around the selected imaging time are processed by finer motion compensation than those used for the initial sliding window processing, and images are formed by using PFA-LPFT [19]. The details of each step are given below.
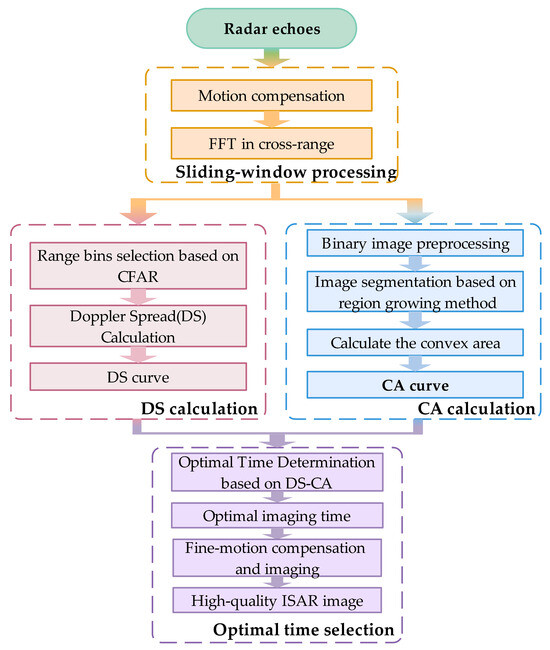
Figure 3.
The flowchart of the proposed optimal space-borne ISAR imaging method.
3.1. Problem Statement
The DS of the target is related to the ERV, which determines the azimuth resolution of the image. One of the selection conditions for the optimal imaging time is selecting the time when the ERV of the target is maximum and stable. From the relationship between the ERV and Doppler frequency, the problem can be equated to solving for the time when the target DS is maximum and stable. The root-mean-square deviation from the mean value where the amplitude at each Doppler frequency is normalized to a probability density function can be used to measure the degree of deviation of a random variable from its mathematical expectation. Thus, the root-mean-square deviation serves as a measure of the mean DS of the target.
The step of the existing optimal imaging time method based on DS is as follows: Firstly, the range-compressed echo data are used for motion compensation, and the compensated data are divided into consecutive sub-intervals. Then, each piece of sub-interval data is summed in the azimuth dimension to obtain a one-dimensional range envelope, and the range cell with the largest amplitude is found. Additionally, a part of the range cell is selected near the range cell with the largest amplitude. Finally, this part of the data is summed in the range direction to obtain a one-dimensional azimuth envelope, and the DS of the image is calculated according to the standard deviation.
The existing DS method still has limitations. Firstly, the range cell with the maximum value of the amplitude may exist far from the center of the target image, and selecting the distance gate around the maximum value of the amplitude to calculate the DS will result in the loss of range cells that contain a large amount of target information. Summing the selected data in the distance direction to obtain a one-dimensional azimuth envelope yields the DS instead of the DS of the entire target, leading to inaccurate results. Secondly, when the azimuth envelope of the target is closer to the impulse function, the DS is higher.
Thus, target detection is necessary to select the data containing the target. DS calculations are more accurate when using the selected data. The Cell Averaging Constant False Alarm Rate (CA-CFAR) algorithm realized the optimal detection in a uniform environment. The core of the Mean Level (ML) CFAR algorithm is to calculate the mean value of the reference cells on both sides of the detection cell as the power estimate of the background clutter [20]. To avoid the problem of power leakage, the protection cells are left between the reference cells and the detection cells, as shown in Figure 4. The CA-CFAR algorithm calculates the background clutter power estimate by averaging the reference cells on both sides.
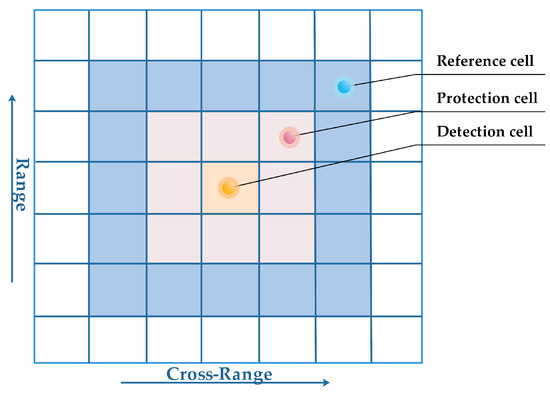
Figure 4.
CFAR Detection reference window.
at the front edge of the protection cells and at the back edge of the protection cells are reference cells, and n is the number of reference cells on one side. Z is the estimated background clutter power, which can be expressed as
T is the detection threshold, which can be expressed as
where is the threshold factor.
The probability density function (PDF) of each reference cell is
where is the power of each cell and x is the amplitude. Substituting into Equations (7) and (8), the PDF of can be expressed as
The PDF of the detection threshold T is
Thus, the false alarm rate is obtained by
Once the false alarm rate is known, the threshold factor can be obtained
In order to verify the performance of the CA-CFAR algorithm, we experiment with the algorithm under different SNRs when and . The results of the CFAR under different SNRs are shown in Figure 5. As expected, the obtained results have shown that the CA-CFAR detector has good performance in homogeneous backgrounds under different SNRs, which provides the basis for subsequent DSs.
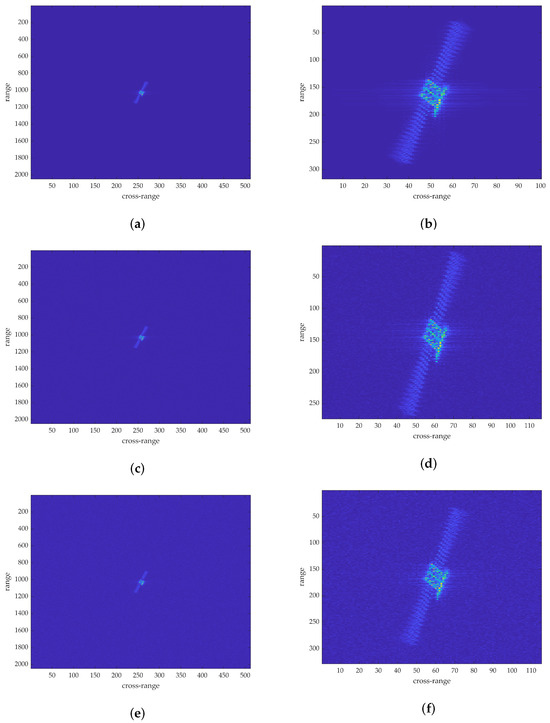
Figure 5.
Results of CFAR under different SNR. (a) ISAR image. (b) Result of CFAR. (c) ISAR image under SNR = −5 dB. (d) Result of CFAR under SNR = −5 dB. (e) ISAR image under SNR = −10 dB. (f) Result of CFAR under SNR = −10 dB.
3.2. CFAR-Based DS Calculation
The DS is the bandwidth of the Doppler spectrum. The DS of the scatterer on the target depends on the ERV. The larger the ERV is, the higher the Doppler frequency results, leading to a larger DS value of the target image. In fact, the accuracy of the DS calculation depends on the range bins of the target. A certain number of range bins on the two sides of the strongest scattering center are used in the existing DS methods, which may be away from the real target center in the range dimension. The CFAR is a commonly used target-detection method, which detects the target signal in the background. We employ the CFAR to extract the target area to improve the DS calculation accuracy and efficiency, which is described as follows:
Step 1: For each image obtained by way of the sliding window, we perform a projection along the cross-range and obtain an average range profile, which is expressed as Equation (13). In Equation (13), represents the amplitude of the range-compressed pulses, is the number of processed pulses, and is the number of range bins:
Step 2: the data are selected by the CFAR after the smoothing processing is performed, which is expressed as
Step 3: The synthesized range envelope is shown in Figure 6a, which can be used to extract the target area by utilizing the CFAR. represents the region of greater than the threshold, which is selected to obtain the range bins occupied by the target, as shown in Figure 6b. Only the range bins in the range gate are summed up to obtain a cross-range profile for the DS calculation. Figure 6c shows the smoothed curve of Figure 6b.

Figure 6.
Schematic diagram of the region growth method (a) target area detection (b) target area extraction (c) smoothed curve.
Step 4: The standard deviation of the envelope amplitude is employed to estimate the DS value [14], which is written as
The DS is expressed as
3.3. CA Calculation for IPP Selection
Except for the inaccurate DS value of the existing method, we cannot select the IPP of the image at the same time. The selection of the IPP is the key to obtaining information about the component. The solar panel is an important structure in a spacecraft with more typical features and is a key component used for identification and measurement. Therefore, in addition to the DS calculation, we need to calculate the Component Area of the solar panel and combine the DS value to determine the optimal imaging time.
The DS change indicates the ERV variation when the IPP does not change. The IPP determines the presentation of the target in the ISAR image. IPP selection is crucial to obtain the component information. Solar panels are key components of a spacecraft, which provide the power of the whole system and have typical rectangular features in their shape. We define the area of the solar panels in the IPP as the CA, which represents the projections of typical components. A larger CA means that more information on the solar panels is presented.
This step needs to calculate the area of the solar panel after obtaining the coarse imaging results, which requires image segmentation, i.e., separating the solar panel from the main body of the satellite, and then calculating the area of the solar panel separately. Region growth is a common image-segmentation method [21]. There are generally two ways to perform this method, one is to give a small block or seed region within the target object to be segmented in the image and then keep adding the pixels around it with certain rules based on the seed region, which achieves the purpose of finally combining all the pixels representing the object into a region. The other is to split the image into a lot of strong consistencies, such as the same gray value of the pixels within the region. Then, the image is split into several small regions by certain rules, such as the same gray value of the pixels in the region. Finally, fuse the small regions into a large region according to certain rules to achieve the purpose of segmenting the image.
Region growth is the process of aggregating pixels or sub-regions into larger regions according to predefined criteria. The basic idea is to start with a set of growth points (the growth point can be a single pixel or a small region) and merge neighboring pixels or regions with similar properties to the growth point with the growth point. These new pixels are then treated as new growth points, and the process is repeated until there are no pixels that fulfill the conditions to be included, at which point the growth point is no longer able to grow so that a region is grown. The similarity between the growth point and the similar region can be based on the gray value, texture, color, and other image information. The schematic diagram of the region growth method is shown in Figure 7. The CA calculation is described as follows:

Figure 7.
Step of the region growth method.
Step 1: The region growth method is used for image segmentation based on the similarity of the image gray values. We employ the region growth method to segment solar panels from the main body after image pre-processing. The adaptive image pre-processing is performed, i.e., gray level transformation, median filter, erosion, expansion, and so on.
Due to the relatively strong backscattering of the spacecraft’s main body, we extract the region of solar panels by recognizing the main body and masking it. Thus, only solar panels remain in the ISAR image. Figure 8a,b show the two segmentation processes based on the region growth method under different IPPs. It can be seen that our method can extract the region of solar panels well.
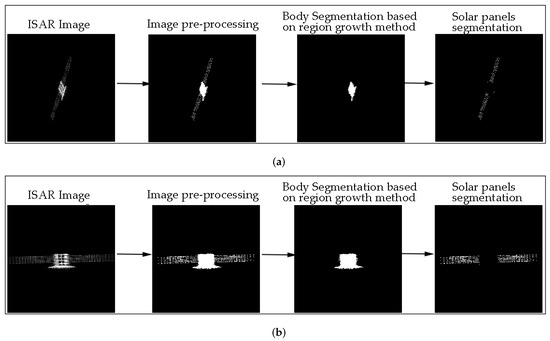
Figure 8.
Segmentation result based on region growth method of (a) IPP 1. (b) IPP 2.
Step 2: Binary image expansion and hole filling are employed in the segmented solar panels. The linked area is for subsequent area calculations.
Step 3: Computing the area of an arbitrary polygon by using the Shoelace Theorem (ST) is popular in pure mathematics [22]. We regard the linked area of the right and left solar panels as two arbitrary polygons, where and represent the vertex coordinates of two polygons. N and M are the number of vertices of each polygon. It is noted that all vertices or are labeled clockwise. The CA of the solar panels is calculated as
3.4. Optimal Time Determination
In this section, we propose a bicriterion-based automated optimal imaging time-selection method, which seeks the slow time section of the data that result in the best image. A good image means a high azimuth resolution and the best presentation of the solar panels, which is defined by the MDS and MCA.
Let and be the DS and CA curves generated by the sliding window processing, respectively. We synthesize them by using a max operation defined as follows:
where denotes the new curve that indicates the maximum of both and . The extreme points with the DS-CA curve are selected as the optimal imaging time. By using this new bicriterion-based curve, not only high-resolution images but also images with much information about the component can be obtained.
4. Experimental Analysis
In this section, we perform numerical simulations for a variety of scenarios to demonstrate the performance of the proposed method. To better explain the authenticity of the experiment, we verify our proposed method by using the scatterer model based on real satellite size. We consider a satellite target that is 12 m long and 3.2 m wide modeled by 679 scatterers, as shown in Figure 9. The ISAR system parameters are listed in Table 1.
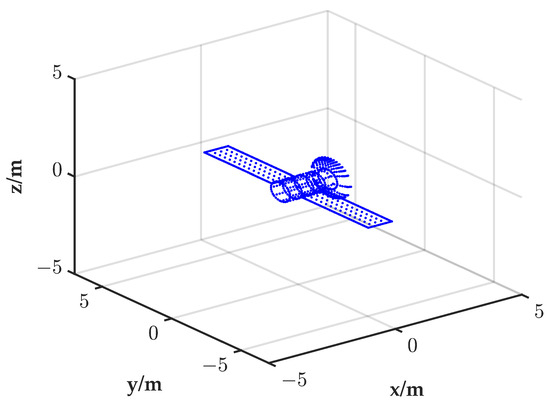
Figure 9.
Target model.

Table 1.
Parameters.
For all experiments in this section, the target altitude in the target body coordinate system is shown in Figure 9. The orbital motion of the radar satellite and observed satellite is simulated by using the Satellite Tool Kit (STK) [23]. In our experiments, we assume the radar satellite and observed satellite orbit in HEO. Figure 10a presents the 3D view of the simulated scenario. The 2D locally enlarged view of Figure 10a is shown in Figure 10b, where the red line represents the radar motion orbit and the yellow dashed line represents the target motion orbit.
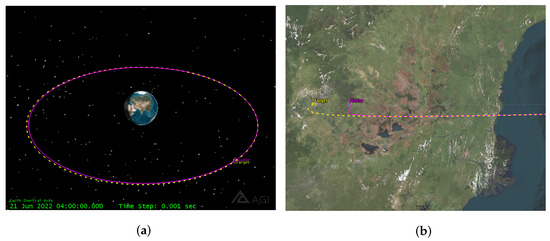
Figure 10.
(a) 3D view of the simulated scenario and (b) 2D locally enlarged view.
In experiment I, we assume that the satellite to be imaged does not have altitude change during the radar observation, while in experiment II, the target’s altitude changes, which correspond to the practical case where the satellite maneuvers intentionally or its altitude is out of control. To evaluate the quality of the ISAR images quantitatively, we use the image contrast and the Image Entropy (IE) as evaluation indexes to examine the performance.
4.1. Experiment I
In the simulated scenario, the observed satellite approaches the radar satellite gradually until 8 km and then departs. When the range is below 20 km, the equivalent rotation is sufficient for forming an ISAR image. We perform the ISAR imaging in the range of 20 km–8 km because in this period, the equivalent rotation generated by the relative orbital motion is sufficient for imaging.
As described earlier in Figure 3, the radar echoes are processed in a sliding window way, during which the echoes are processed every 4096 pulses in sequence with an overlapping of 2048 pulses. The DS and CA are calculated for each image obtained, as shown in Figure 11. The yellow solid line shows the CA variation in the solar panels. The green dash–dot line shows the CFAR-based DS result. The result of the DS estimated by [11] and the proposed DS-CA method are shown by the cyan dashed line and blue dashed line, respectively. The real ERV is shown by the red dash–dot line. As shown in Figure 11, we also insert some of the ISAR images obtained by the sliding window operation, from which the DS and CA are calculated. By this presentation, the reason for the DS and CA change is visually shown.
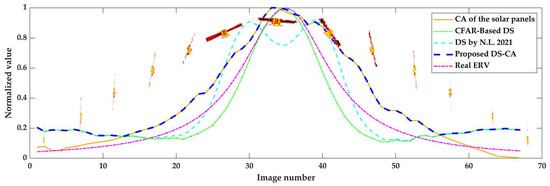
Figure 11.
Curves of DS and CA during the whole observation (The result of the DS estimated by [11]).
As shown by the yellow solid line and green dash–dot line, the DS and CA curves almost coincide. Thus, the synthesized DS-CA curve has almost the same variations with both the DS and CA. In this case, the image obtained at the optimal time selected based on the DS-CA curve has a high resolution as well as the most complete shape of the solar panel. In addition, it can be seen that the green dash–dot line obtained by our CFAR-based DS method fits better with the real ERV curve than the cyan dashed line curve obtained by the DS in [11]. Among the DS calculation methods, in [11], the authors take the strongest scattering center in the ISAR image as the target center. A certain number of range bins on the two sides of the target center are used in the DS calculation. However, the range bins occupied by the target determined by this means may be inaccurate since the strongest scattering center may be away from the real target center in the range dimension leading to the missing range bins containing much target information. Our improved DS method extracts the target area in the image based on the CFAR, which determines the target area more accurately than the DS method in [11].
4.2. Experiment II
In experiment I, the target has no altitude change and the orbit heights of both the radar and target are almost the same. The generated ISAR image shows the top view of the target. In this section, we demonstrate the performance of the proposed method when the satellite has unknown rotations, as shown in Table 2. Scenario 1, Scenario 3, and Scenario 4 represent the spin around the y-axis, x-axis, and z-axis at a low velocity, respectively. And, Scenario 2 represents the three-dimensional spin at a moderate velocity.

Table 2.
Rotation parameters.
The DS and CA are calculated for each image obtained in the four scenarios, as shown in Figure 12a–d. In Figure 12, the comparison of the green dash–dot line with the cyan dashed line verifies the superiority of the CFAR-based DS method. From the green dash–dot line and yellow solid line, we see that the DS and CA curves have different variations. The co-maximization of the DS and CA is necessary to select the optimal time in these scenarios.
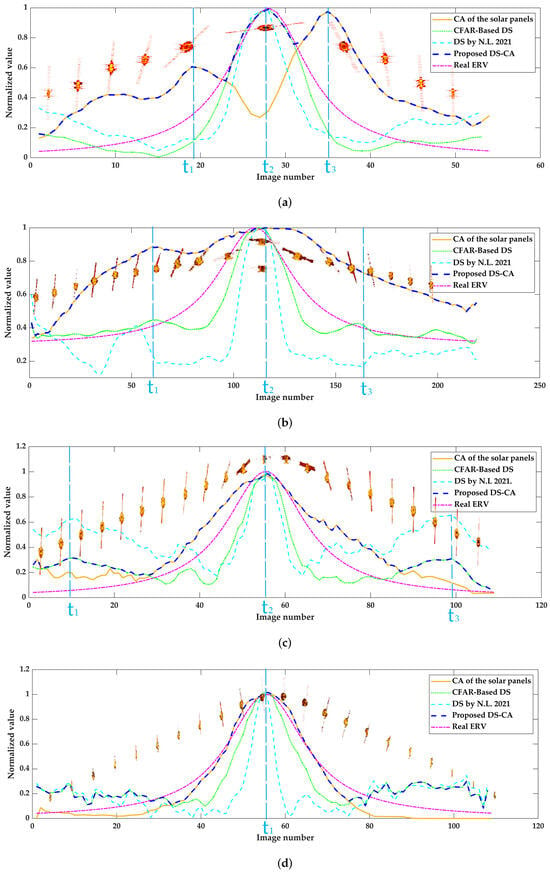
Figure 12.
Curves of DS and CA during the whole observation under (a) Scenario 1, (b) Scenario 2, (c) Scenario 3, and (d) Scenario 4 (The result of the DS estimated by [11]).
Figure 12a corresponds to the IPP changing from a mixed view to a side view and then to a mixed view, during which the ERV gradually becomes larger and then decreases, as shown in the red dash–dot line. According to the DS method, is selected as the optimal imaging time. The ISAR image corresponding to is shown in Figure 13b, which does not contain solar panel information. Thus, it is inadequate for subsequent identification and measurement. The obtained synthesized DS-CA curve exhibits three obvious peaks. We select the extreme points , , and of the synthesized DS-CA curve as the optimal imaging time. The ISAR images and solar panel area extractions corresponding to , , and are presented in Figure 13a–c and Figure 13d–f. The images obtained after the finer motion compensation of , , and are shown in Figure 13g–i. The Image Entropy (IE) is used to evaluate the image quality.
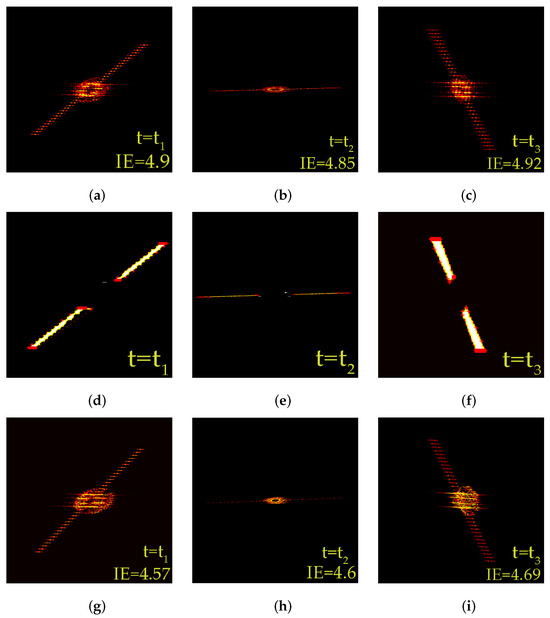
Figure 13.
Imaging result of time selection in Figure 12a, during which (a–c) Coarse imaging result of times and , (d–f) Solar panel area calculation of times and , (g–i) fine imaging result of times and .
The IPPs in Figure 12b present mixed views of the satellite, during which the image resolution gradually increases and then decreases. According to the DS method, is selected as the optimal imaging time. As for our proposed method, the extreme points , , and of the synthesized DS-CA curve are selected as the optimal imaging time. The images corresponding to , , and are presented in Figure 14a–c. The images obtained after fine motion compensation are presented in Figure 14d–f. The images after fine motion compensation show that the shape of the target and the components are much clearer. Comparing Figure 14d,f with Figure 14e, we see that the ISAR images at and have already presented the main feature of the solar panels, but with a lower DS due to the altitude. Thus, more appropriate imaging intervals can be determined by our proposed method, which can provide more images for subsequent target identification and measurement to improve accuracy.
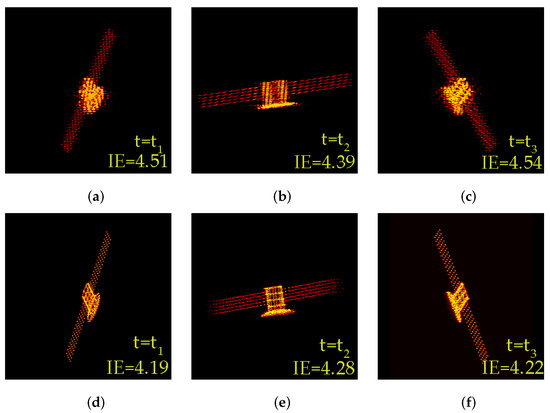
Figure 14.
Imaging result of time selection in Figure 12b, during which (a–c) Coarse imaging result of times and , (d–f) fine imaging result of times and .
Figure 12c corresponds to the IPP changing from a mixed view to a side view and then to a mixed view, during which the ERV gradually becomes larger and then decreases. According to the DS method, , , and are selected as the optimal imaging times. As for our proposed method, the extreme point of the synthesized DS-CA curve is selected as the optimal imaging time, which reduces unnecessary storage waste. Figure 12d shows the optimal time-selection result of Scenario 4. Under this scenario, the imaging time is selected as the optimal imaging time by using the proposed method and DS method. It can be seen that the proposed method works well when the DS-CA is consistent with the DS curve.
The running time for the sub-data in Scenarios 1–4 is shown in Table 3. The proposed method still satisfies the real-time performance. By introducing the CA criterion, the selection of the optimal imaging time does not only lead to the acquirement of high-resolution images but also the images with complete component information, the latter of which are also much desired in real applications.

Table 3.
Running time.
5. Conclusions
The single-criterion processing of the existing methods is limited, which cannot select the appropriate resolution and IPP at the same time. We proposed a bicriterion-based method for selecting the optimal ISAR imaging time of a spacecraft. In this method, the area information of the interested component is employed except for the Doppler Spread information used in existing methods. Thus, the IPP influence on the ISAR image presentation is taken into account in the imaging time selection, which is highly beneficial for the subsequent recognition task. We perform three experiments under different scenarios to verify the effectiveness of the proposed method. The experiments showed that whether the DS and CA curves almost coincide or the DS and CA curves exhibit different variations, our synthesized DS-CA curve could find the optimal imaging time intervals, leading us to obtain the high-resolution image with the most complete shape of the solar panels.
Author Contributions
Conceptualization, R.G. and L.W.; methodology, R.G. and L.W.; software, R.G.; validation, R.G., L.W. and G.Z.; resources, B.W. and D.Z.; data curation, R.G.; writing—original draft preparation, R.G.; writing—review and editing, R.G. and L.W.; project administration, L.W. All authors have read and agreed to the published version of the manuscript.
Funding
This work was supported in part by the Fundamental Research Funds for Central Universities under Grant NZ2020007, the National Natural Science Foundation of China under Grant 61871217, the Shanghai Aerospace Science and Technology Innovation Fund under Grant SAST2021-026, and the Fund of Prospective Layout of Scientific Research for NUAA (Nanjing University of Aeronautics and Astronautics) under Grant ILA220581A22.
Data Availability Statement
The data presented in this study are available on request from the corresponding author. The data are not publicly available due to privacy.
Conflicts of Interest
Author Bin Wu was employed by the Research Institution Aerospace System Engineering Shanghai. The remaining authors declare that the research was conducted in the absence of any commercial or financial relationships that could be construed as a potential conflict of interest.
References
- Inggs, M. Synthetic Aperture Radar During the 50 Years of the Aerospace and Electronic Systems Society. IEEE Aerosp. Electron. Syst. Mag. 2023, 38, 22–31. [Google Scholar] [CrossRef]
- Colone, F.; Filippini, F.; Pastina, D. Passive Radar: Past, Present, and Future Challenges. IEEE Aerosp. Electron. Syst. Mag. 2023, 38, 54–69. [Google Scholar] [CrossRef]
- Gao, G.; Yao, L.; Li, W.; Zhang, L.; Zhang, M. Onboard Information Fusion for Multisatellite Collaborative Observation: Summary, challenges, and perspectives. IEEE Geosci. Remote Sens. Mag. 2023, 11, 40–59. [Google Scholar] [CrossRef]
- Yong, W.; Yicheng, J. Inverse Synthetic Aperture Radar Imaging of Maneuvering Target Based on the Product Generalized Cubic Phase Function. IEEE Geosci. Remote Sens. Lett. 2011, 10, 958–962. [Google Scholar]
- Chen, V.C.; Martorella, M. Inverse Synthetic Aperture Radar Imaging: Principles, Algorithms and Applications. Scitech 2014, 55, 56. [Google Scholar]
- Anger, S.; Jirousek, M.; Dill, S.; Peichl, M. ISAR imaging of space objects using large observation angles. In Proceedings of the 2021 21st International Radar Symposium (IRS), Berlin, Germany, 21–22 June 2021; pp. 1–7. [Google Scholar]
- Kumar, A.; Giusti, E.; Mancuso, F.; Ghio, S.; Lupidi, A.; Martorella, M. Three-Dimensional Polarimetric InISAR Imaging of Non-Cooperative Targets. IEEE Trans. Comput. Imaging 2023, 9, 210–223. [Google Scholar] [CrossRef]
- Oveis, A.H.; Giusti, E.; Ghio, S.; Martorella, M. A Survey on the Applications of Convolutional Neural Networks for Synthetic Aperture Radar: Recent Advances. IEEE Aerosp. Electron. Syst. Mag. 2022, 37, 18–42. [Google Scholar] [CrossRef]
- Martorella, M.; Berizzi, F. Time windowing for highly focused ISAR image reconstruction. IEEE Trans. Aerosp. Electron. Syst. 2005, 41, 992–1007. [Google Scholar] [CrossRef]
- Gaffar, A.; Yunus, M.; Nel, W.; Inggs, M. Selecting Suitable Coherent Processing Time Window Lengths for Ground-Based ISAR Imaging of Cooperative Sea Vessels. IEEE Trans. Geosci. Remote Sens. 2009, 10, 3231–3240. [Google Scholar] [CrossRef]
- Li, N.; Shen, Q.; Wang, L.; Wang, Q.; Guo, Z.; Zhao, J.T. Optimal Time Selection for ISAR Imaging of Ship Targets Based on Time-Frequency Analysis of Multiple Scatterers. IEEE Geosci. Remote Sens. Lett. 2021, 19, 4017505. [Google Scholar] [CrossRef]
- Li, G.; Zhang, T.; Li, Y.; Ding, Z.; Ke, M. A Modified Imaging Interval Selection Method Based on Joint Time-Frequency Analysis for Ship ISAR Imaging. In Proceedings of the EUSAR 2018; 12th European Conference on Synthetic Aperture Radar, Aachen, Germany, 4–7 June 2018. [Google Scholar]
- Wang, Y.; Cao, R.; Huang, X. ISAR Imaging of Maneuvering Target Based on the Estimation of Time Varying Amplitude with Gaussian Window. IEEE Sens. J. 2019, 19, 11180–11191. [Google Scholar] [CrossRef]
- Wang, L.; Cao, Z.; Li, N.; Jin, T.; Zhu, D. Optimal ship imaging for shore-based ISAR using DCF estimation. J. Syst. Eng. Electron. 2015, 4, 7. [Google Scholar]
- Zhou, P.; Zhang, X.; Dai, Y.; Sun, W.; Wan, Y. Time Window Selection Algorithm for ISAR Ship Imaging Based on Instantaneous Doppler Frequency Estimations of Multiple Scatterers. IEEE JSTARS 2019, 11, 3799–3812. [Google Scholar] [CrossRef]
- Li, R.; Tao, J.; Shi, W. Time selection for ISAR imaging based on time-frequency analysis. In Proceedings of the SPIE—The International Society for Optical Engineering, Singapore, 6–7 October 2012; Volume 8768. [Google Scholar]
- Wang, J.; Kasilingam, D. Global range alignment for ISAR. IEEE Trans. Aerosp. Electron. Syst. 2003, 39, 351–357. [Google Scholar] [CrossRef]
- Victor, C.; Martorella, M. ISAR Autofocus Algorithms. 2014. Available online: https://digital-library.theiet.org/content/books/10.1049/sbra504e_ch5 (accessed on 14 January 2024).
- Gong, R.; Wang, L.; Zhu, D. High Resolution 3D InISAR Imaging of Space Targets Based on PFA Algorithm with Single Baseline. In Proceedings of the 2023 24th International Radar Symposium (IRS), Berlin, Germany, 24–26 May 2023; pp. 1–10. [Google Scholar]
- Baadeche, M.; Soltani, F. Performance analysis of mean level constant false alarm rate detectors with binary integration in Weibull background. IET Radar Sonar Navig. 2015, 9, 233–240. [Google Scholar] [CrossRef]
- Jiang, H.; Feng, R. Image Segmentation Method Research Based on Improved Variational Level Set and Region Growth. Acta Electron. Sin. 2012, 40, 1659–1664. [Google Scholar]
- Lee, Y.; Lim, W. Shoelace Formula: Connecting the Area of a Polygon and the Vector Cross Product. Math. Teach. 2017, 110, 631–636. [Google Scholar] [CrossRef]
- Fang, X.; Geng, Y. Simulations of spacecraft attitude control for tracking maneuvers with MATLAB and STK. In Proceedings of the 2014 IEEE International Conference on Information and Automation (ICIA), Hailar, China, 28–30 July 2014; pp. 1160–1165. [Google Scholar]
Disclaimer/Publisher’s Note: The statements, opinions and data contained in all publications are solely those of the individual author(s) and contributor(s) and not of MDPI and/or the editor(s). MDPI and/or the editor(s) disclaim responsibility for any injury to people or property resulting from any ideas, methods, instructions or products referred to in the content. |
© 2024 by the authors. Licensee MDPI, Basel, Switzerland. This article is an open access article distributed under the terms and conditions of the Creative Commons Attribution (CC BY) license (https://creativecommons.org/licenses/by/4.0/).