Article

Satellite-Based Water Quality Assessment of the Beijing Section of the Grand Canal: Implications for SDG11.4 Evaluation

1
School of Earth Sciences and Resources, China University of Geosciences, Beijing 100083, China
2
Key Laboratory of Digital Earth Science, Aerospace Information Research Institute, Chinese Academy of Sciences, Beijing 100094, China
3
Beijing Institute of Surveying and Mapping, Beijing 100038, China
4
Beijing Key Laboratory of Urban Spatial Information Engineering, Beijing 100038, China
5
International Research Center of Big Data for Sustainable Development Goals, Beijing 100094, China
6
Shaanxi Institute of Surveying and Mapping of Land Ltd., Xi’an 710054, China
7
College of Resources and Environment, University of Chinese Academy of Sciences, Beijing 100049, China
8
School of Electronic, Electrical and Communication Engineering, University of Chinese Academy of Sciences, Beijing 100049, China
*
Author to whom correspondence should be addressed.
Remote Sens. 2024, 16(5), 909; https://doi.org/10.3390/rs16050909
Submission received: 12 January 2024 / Revised: 27 February 2024 / Accepted: 28 February 2024 / Published: 4 March 2024

Abstract

:
The Beijing-Hangzhou Grand Canal in China became a World Cultural Heritage Site in 2014, and the water quality of this ancient man-made canal has increasingly attracted societal attention. This study focuses on monitoring the water quality of the Beijing section of the Grand Canal (BGC) using remote sensing technology. Analysis of the comprehensive trophic level index (TLI) indicates that the water in the Canal was predominantly light eutrophic from 2016 to 2022. The annual average results of the TLI reveal that the water quality in the Kunming Lake and North Canal of BGC is generally good, characterized by some mesotrophic waters, and others are in light eutrophication. The TLI for the entire BGC water body decreased from 64.7 in 2016 to 60.3 in 2022, indicating an improvement trend in water quality. Notably, the proportion of good water with TLI less than 60 increased from 50% in 2016 to 83% in 2022. This improvement of water quality may be attributed to the reduced use of fertilizers and pesticides and the implementation of various environmental policies by Beijing Municipal government. These findings offer valuable insights for the management and protection of the water resources of the BGC, and further contribute to the evaluation of the United Nations Sustainable Development Goal (SDG) 11.4.

1. Introduction

As a World Cultural Heritage Site, the Beijing-Hangzhou Grand Canal is the earliest and longest man-made canal in the world, with a history of over 2500 years [1]. It has played a critical role in facilitating the development and exchange of agricultural, economic, and cultural aspects between the northern and southern regions of China [2]. However, the Beijing section of the Grand Canal (BGC), once thriving through several dynasties, has experienced a sharp decline in modern times [3]. Factors such as natural changes, human impact, and insufficient conservation efforts have led to the deterioration of its transportation utility. Consequently, this section now grapples with significant challenges, including the loss of water sources, rampant algae growth, and hyper eutrophic water pollution [4,5]. Before 2018, the water quality in the BGC was categorized as inferior Class V according to the Water Quality Standards for Surface Water. This was mainly due to the poor water quality, with a high pollution load primarily from nutrients like nitrates, leading to evident eutrophication [6]. To address this issue, the government of Beijing departments implemented targeted regulatory measures and enacted a series of water environment management policies. These initiatives were designed to protect the ecological environment and restore BGC original balance. Gradually, these measures have improved the water quality of the BGC. Ongoing maintenance and repair of the river channel have also played a crucial role in this enhancement [7,8]. Currently, the water quality of the BGC is improving to meet the Class IV water standard, effectively eliminating the previously common inferior Class V water bodies. The ecological environment of the water in the BGC is vital for the holistic development of the entire Beijing-Hangzhou Grand Canal. This segment has earned distinguished recognition from the United Nations Sustainable Development Goals. Thus, monitoring of the water quality in the BGC is paramount, and ensuring the health and sustainability of this waterway is vital in the efforts to safeguard and cherish global heritage sites [9,10,11]. It plays a significant role in assessing the progress towards Sustainable Development Goal 11.4, which focuses on the preservation and protection of the world cultural and natural heritage [12].
Eutrophication, a common state of water pollution in urban areas, arises from an ecological imbalance triggered by nutrient enrichment in water bodies. This leads to the excessive proliferation of planktonic algae, posing significant threats to both the regional ecological environment and human safety [13,14]. Therefore, operational monitoring of urban river water quality is particularly important for evaluating the ecological health of rivers [15]. The monitoring of the comprehensive trophic level index (TLI) in the BGC primarily utilizes traditional methods, with monthly assessments of specific water sections. The TLI was calculated using chlorophyll-a and transparency. Compared to individual parameters of chlorophyll-a and transparency, TLI provides a more comprehensive assessment [16,17,18,19]. Additionally, TLI serves as an official indicator for evaluating water quality [20]. Some water bodies in the BGC have in situ measurement data, which can be compared with this research. Although this data reflects the local trophic level, it falls short of providing the comprehensive information necessary for large-scale and spatial continuous monitoring. This limitation makes it challenging to determine the trophic level in areas between monitoring points. Furthermore, there is a relative scarcity of research on the spatiotemporal changes of the water body in the canal. This lack of detailed and expansive data significantly complicates the understanding of the overall water quality of the canal. Additionally, obtaining field measurements is often time-consuming, expensive, and limited by spatial and temporal constraints, thereby hindering effective water quality management and improvement efforts [21]. To address these challenges, utilizing satellite remote sensing to monitor river water quality is an economical, efficient, and large-scale approach to monitoring water bodies [22]. In light of these challenges, quantitative remote sensing research to evaluate the TLI of rivers holds substantial practical value [15]. Research has demonstrated that combining remote sensing monitoring with conventional ground-based monitoring techniques can offer a more comprehensive view of water environmental conditions, crucial for effective watershed management [22,23,24]. This integrated approach enables more effective monitoring of the trophic level of water bodies, with remote sensing serving acting as a vital supplement to the design and enhancement of ground-based monitoring systems [25,26]. Currently, in the study of water quality distribution in the BGC, there is a notable absence of this combined methodology, merging ground monitoring data with remote sensing data products. Consequently, the exploration of water quality in the BGC, leveraging both remote sensing and traditional monitoring data, holds significant theoretical and practical importance. Currently, the surface water quality in this section is monitored by the Beijing Municipal Water Bureau, with set monitoring points across various segments of the canal. However, each monitoring point only represents a specific area of the water body, leading to limited representativeness of the overall water quality data. This limitation poses challenges in accurately depicting the spatial distribution of water quality. Furthermore, with data collection occurring only once a month, the ability to conduct real-time monitoring is significantly hampered.
To address these issues, in this study, Sentinel-2 MultiSpectral Instrument (MSI) satellite imagery was utilized to monitor the TLI of water bodies in the BGC. Sentinel-2 satellite data has been widely utilized in water quality monitoring due to its extensive coverage [27,28]. The imagery covers a large area, including lakes, reservoirs, and wide river in the BGC, exceeding the scope of conventional ground-based monitoring. Moreover, each lake and river are monitored comprehensively, providing a more representative depiction of water quality in the study area compared to conventional point-based monitoring. With the satellite passing over every 5 days, filtering images with cloud cover, the frequency of monitoring water quality from the remaining images far exceeds that of conventional field-based water quality monitoring. The extensive coverage of this imagery is a significant advantage, as one scene is capable of encompassing all the water bodies within this section of the canal. Sentinel-2A was launched on 23 June 2015, as we used Sentinel-2 to monitor the water quality of BGC from 2016 to 2022. Because the United Nations set the 2030 SDG target in 2015, monitoring the water quality of BGC from 2016 to 2022 is equivalent to conducting a mid-term progress assessment of typical regions of SDG11.4. This study employs a combined approach using ground measurement data and remote sensing images to examine the water body in the BGC. The specific objectives of this study are as follows: (1) Quantitatively derive a comprehensive tropical level index for BGC, using Sentinel-2 MSI images along with data on chlorophyll-a concentration (Chl-a), transparency (Zsd); (2) Conduct a detailed analysis of the changes in water quality from 2016 to 2022; (3) Identify the factors influencing these changes in water quality; (4) Apply the derived index from Sentinel-2 MSI to assess the progress towards SDG 11.4 for the BGC over the past seven years.

2. Study Area and Data Acquisition
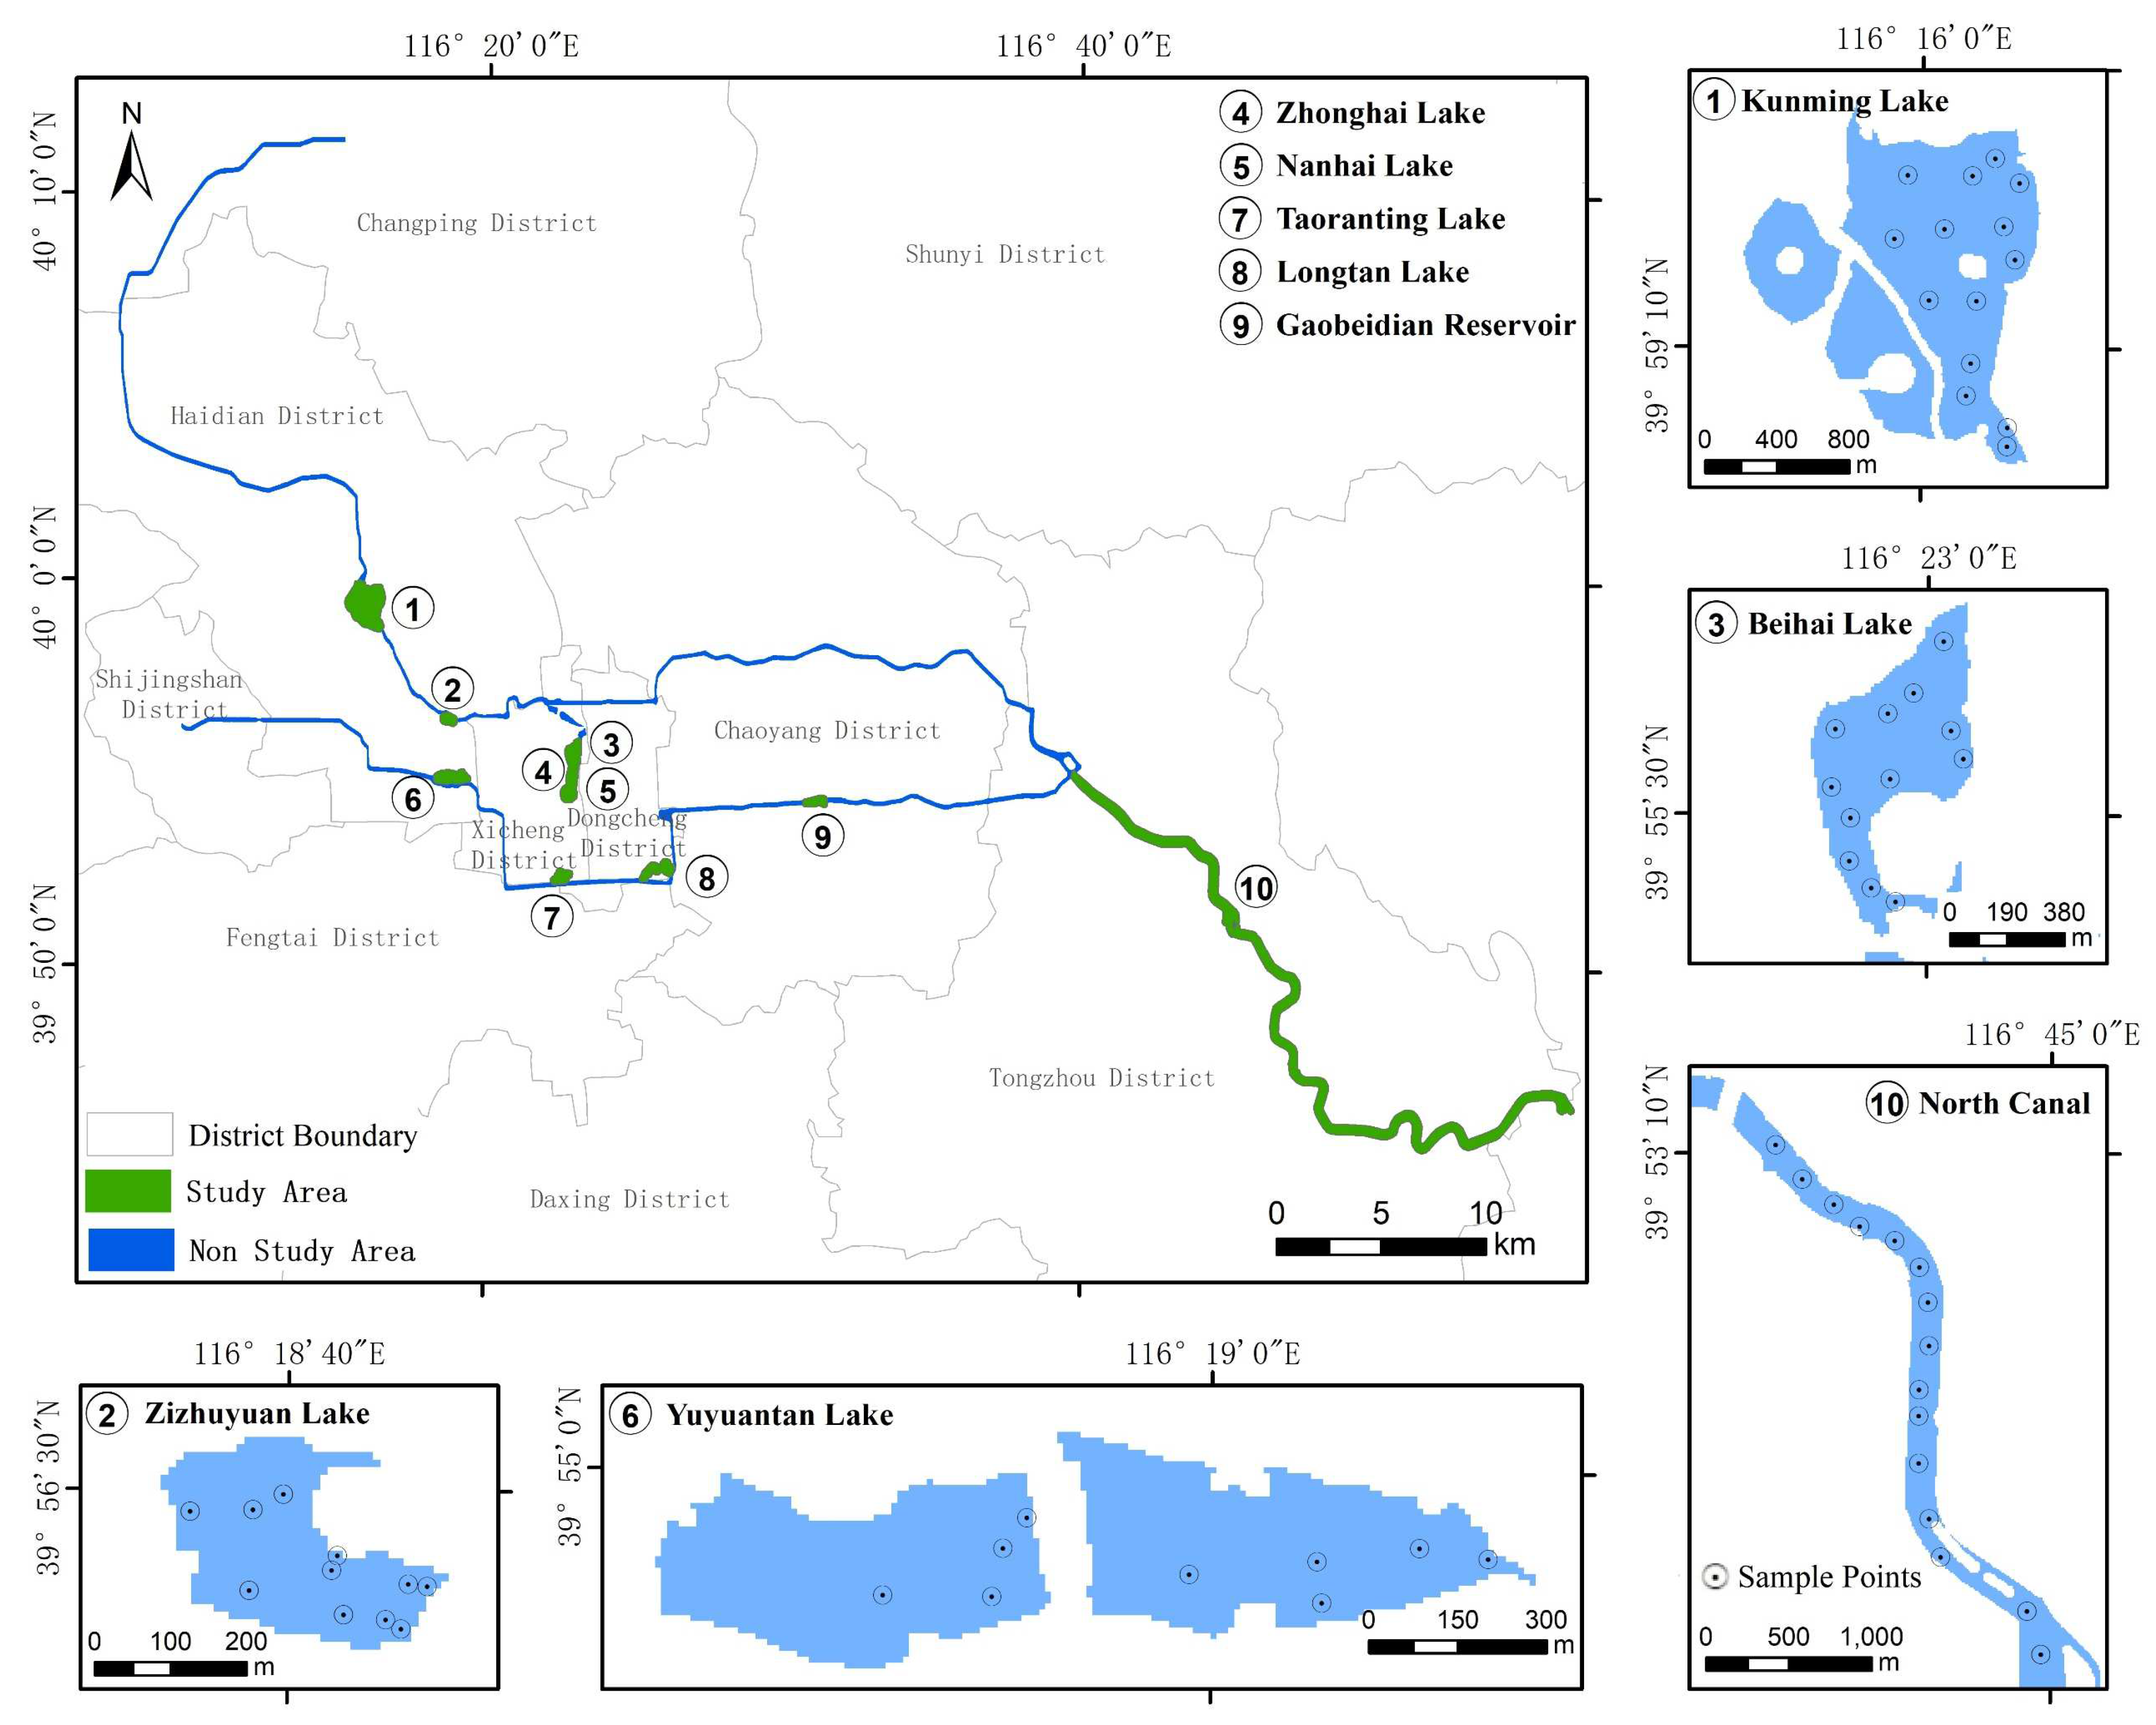
2.1. Study Area

The BGC, a historic and once heavily utilized waterway in China, played a crucial role in material transportation, storage, and trading. While it no longer functions as a goods transportation route due to historical developments, parts of the canal are well-preserved and primarily serve as drainage channels in Beijing. This section encompasses several key waterways running north to south: the Jingmi Diversion Canal, the Nanchang River, the Ba River, the Tonghui River [29], and the five main rivers of North Canal. The focus of this study is on the portions of the Grand Canal of Beijing section that are wider than 100 m and observable via 10 m resolution Sentinel-2 MSI remote sensing data. Within this area, the water bodies of interest for research include ten specific locations: the Kunming Lake, Zizhuyuan Lake, Yuyuantan Lake, Beihai Lake, Zhonghai Lake, Nanhai Lake, Taoranting Lake, Longtan Lake, Gaobeidian Reservoir, and the North Canal (Figure 1).

2.2. Data Acquisition

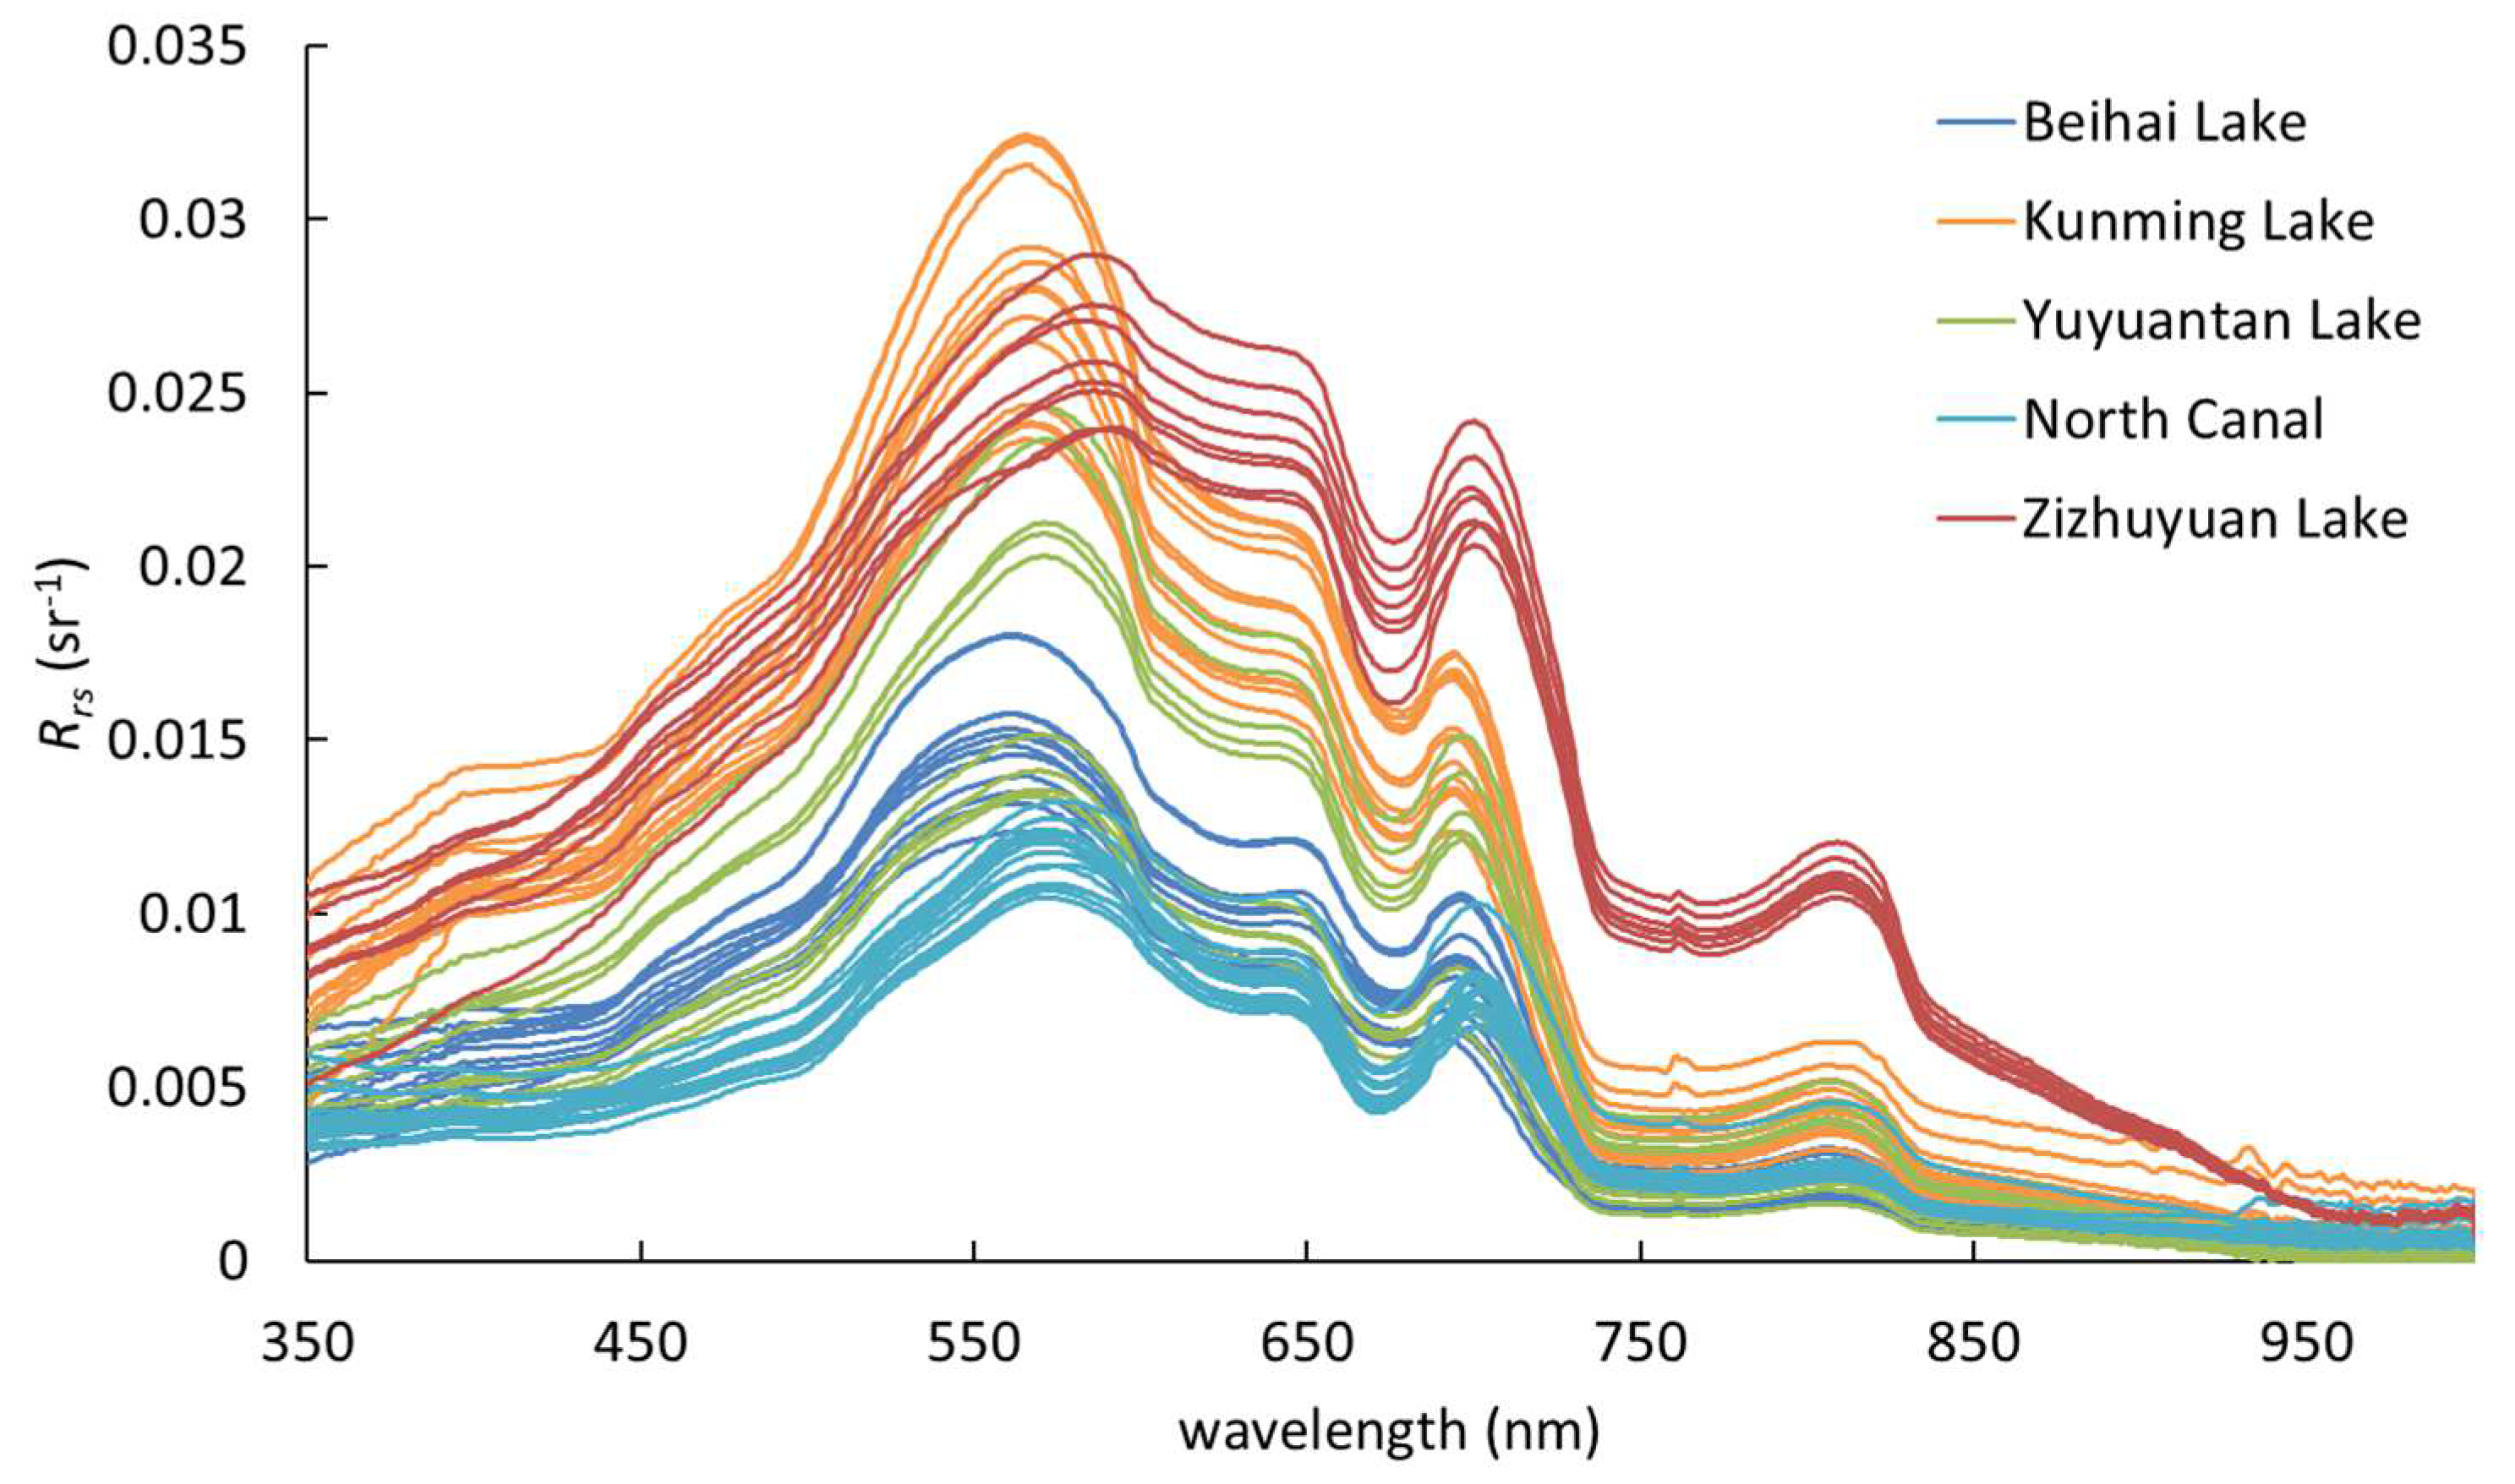
2.2.1. In Situ Data Acquisition

To calibrate and recommend water quality remote sensing monitoring models, we carried out five field experiments in the BGC on August to October 2019, covering 58 sampling points throughout the year (Figure 1). Five experiments were conducted between August and October 2019, specifically on 21 August, 16 September, 18 September, 15 October, and 25 October. Among these, the experiments on 21 August, 15 October, and 25 October were synchronized with the acquisition time of the Sentinel-2 MSI images, and were used for validation of water quality parameter retrieval. The in situ measured remote sensing reflectance spectra, after band equivalent to Sentinel-2 MSI bands, together with the water quality parameter data obtained from all of these five experiments were utilized to calibrate the water quality parameter retrieval model. Then, the in situ measured water quality parameter data from the three synchronized experiments were used to validate the retrieved water quality parameter results from Sentinel-2 MSI images. At each location, remote sensing reflectance (Rrs) measurements were precisely conducted using an ASD FieldSpec spectroradiometer (Analytical Spectral Devices, Inc., Boulder, CO, USA), following the established above-water method [30,31]. The Rrs data collected from these 58 points are detailed in Figure 2. Surface water samples were collected from up to 0.5 m depth and meticulously preserved under low temperature and dark conditions until their analysis in the laboratory. These samples were filtered using Whatman GF/F (0.7 μm pore size, Φ47 mm) filters to extract Chl-a samples. Subsequently, the concentration of Chl-a was determined using the hot ethanol method [32,33], complemented with spectrophotometric (Shimadzu, Kyoto, Japan) analysis. The transparency of the water was assessed using the Secchi disk method. A standard black and white Secchi disk, about 30 cm in diameter, was attached to a rope and slowly submerged. The depth at which the disk was no longer visible from the surface was recorded as the Zsd [34,35,36]. The collected data, including mean, standard deviation (stdv), minimum (min) and maximum (max) of Chl-a and Zsd, are comprehensively presented in Table 1. Furthermore, TLI data, spanning from 2016 to 2022, was sourced from the Beijing Water Statistics Yearbook (https://swj.beijing.gov.cn/, accessed on 9 December 2022).

2.2.2. Satellite Data Acquisition
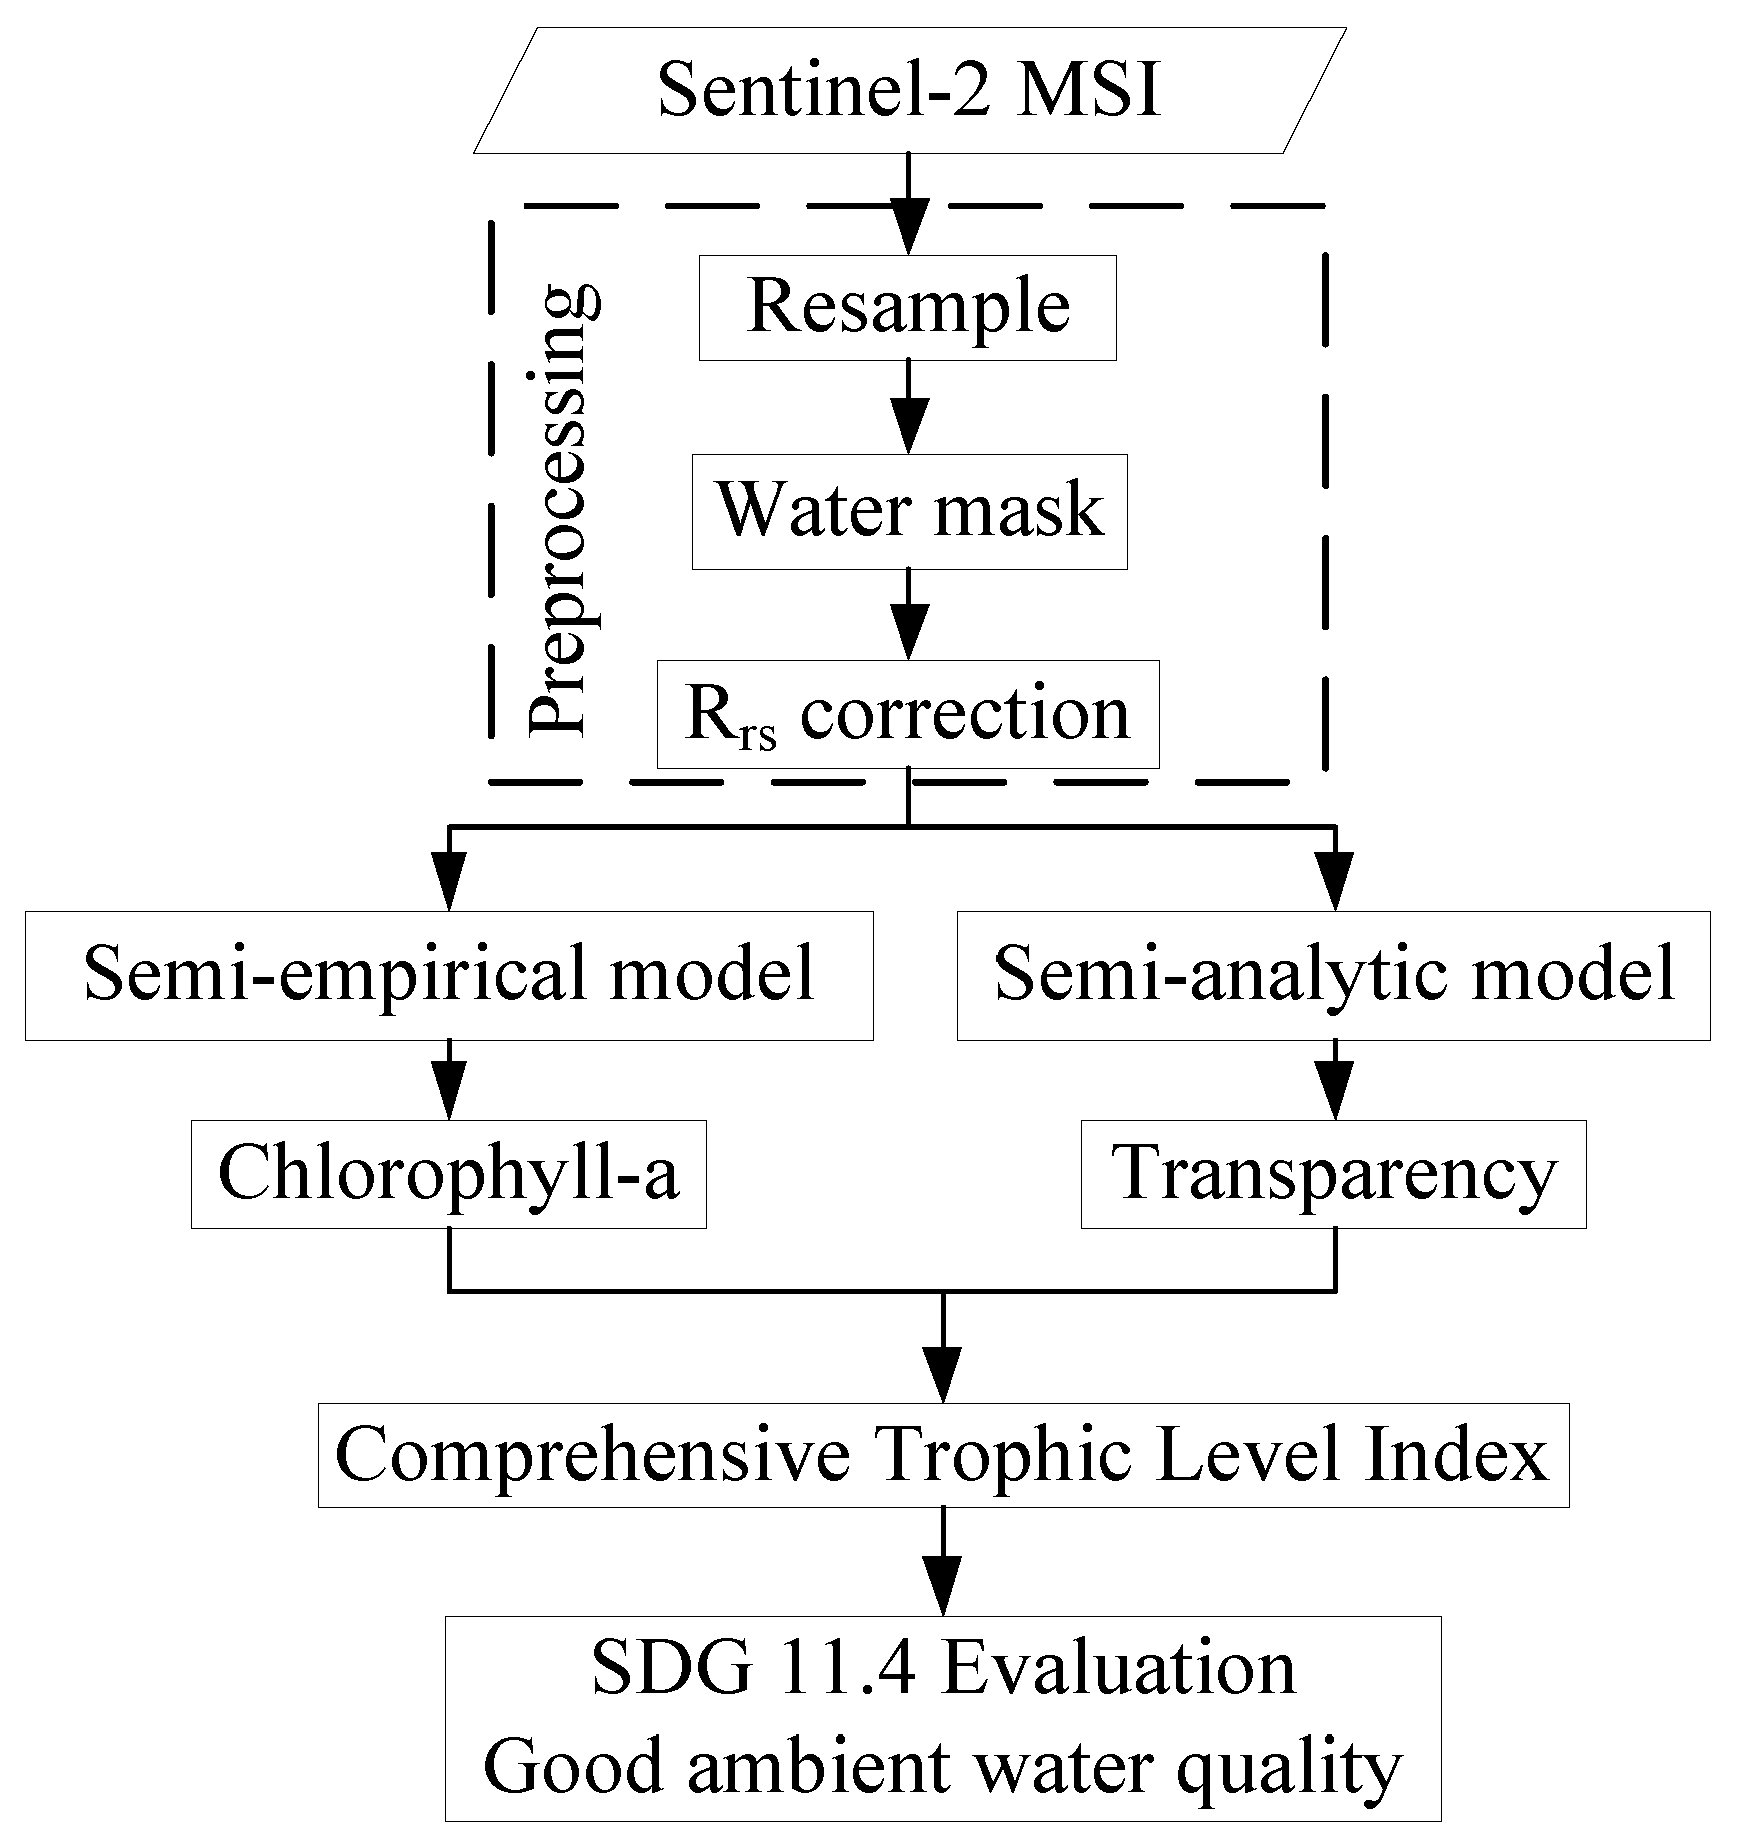
In this study, we utilized Sentinel-2 MSI satellite imagery to observe and assess the TLI within the BGC. Sentinel-2 images were obtained from the official website of the European Space Agency (ESA) (https://dataspace.copernicus.eu, accessed on 3 January 2023). The choice of Sentinel-2 MSI for this task was driven by several key factors: (1) The configuration of satellite includes 13 spectral bands, notably featuring the 665 nm and 705 nm bands. These bands are particularly effective for retrieving Chl-a and Zsd in eutrophic waters, making them ideal for this study. (2) Sentinel-2 MSI boasts 10 bands with a high spatial resolution ranging from 10 to 20 m. This level of detail is particularly suited for monitoring the relatively narrow confines of the BGC. (3) The system, comprising Sentinel-2A and Sentinel-2B satellites, enables a 5-day return cycle, which is highly advantageous for dynamic and frequent monitoring of water quality changes [37]. We used Sentinel-2 MSI L2A level surface reflectance product for subsequent water quality monitoring. The ESA provided L2A level data after 2019, but the previous ones only had L1C level atmospheric top radiance images, which needed to be locally corrected to L2A surface reflectance using the Sen2Cor v2.8 software provided by the ESA [38]. In this study, we acquired a substantial dataset consisting of 103 scenes L2A product images from the years 2019 to 2022 and 86 scenes L1C product images from 2016 to 2018. In total, these 189 scenes of Sentinel-2 MSI images, which consisted of 25, 34, 27, 29, 21, 33, and 20 scenes each year, respectively, spanned the seasons of spring (March, April, May), summer (June, July, August), and autumn (September, October, November) across the seven-year period from 2016 to 2022.

3. Methods

This study is mainly based on Sentinel-2 images, and after preprocessing, TLI is calculated to comprehensively understand the trophic condition of BGC water bodies. The key parameters Chl-a and Zsd of TLI, and evaluate Sustainable Development Goal 11.4 (Figure 3). To accurately determine the concentration of Chl-a, we implemented a semi-empirical model. For assessing Zsd, we utilized a sophisticated approach by employing a Quasi-Analytical Algorithm (QAA) [39] based semi-analytical model, specifically the QAA_RGB [40] algorithm, to ascertain the transparency of water bodies. Additionally, this study aims to contribute to the evaluation of Sustainable Development Goal (SDG) 11.4, which focuses on safeguarding cultural and natural heritage.

3.1. Satellite Data Preprocessing

3.1.1. Data Resampled

Sentinel-2 images were obtained from the official website of the ESA. Considering the constrained scope of the BGC, the 20 m resolution bands of the Sentinel-2 MSI in Level 2A products have been consistently upgraded to a finer 10 m resolution, meanwhile, using band subset preserves the 12 bands that can be used after resampling. This preprocessing was implemented using the Sentinel Application Platform-7.0 software, a tool furnished by the European Space Agency.

3.1.2. Water Mask Extraction

The water surface of the BGC presents a unique challenge due to its irregular shape and distribution within various city parks. While a portion of these water bodies consists of river segments, they are often surrounded by greenery and interspersed with recreational facilities like boats, leading to a dynamic and inconsistent water surface. Consequently, utilizing the Normalized Difference Water Index for automatic water body detection yields suboptimal results in this complex environment. To enhance accuracy, this study combines the results of automatic extraction with manual visual analysis to more precisely define the water body boundaries [41]. Furthermore, to mitigate the impact of adjacent land pixels, we adopt a strategy of eroding one pixel from the edge of the extracted water bodies [42].

3.1.3. Rrs Correction of Sentinel-2 MSI L2A Products

Sentinel-2 L2A surface reflectance data undergo corrections for aerosol, Rayleigh scattering, and cirrus clouds [43]. However, for accurate Rrs in lake and reservoir water, additional corrections for water surface skylight reflection and sunlight are necessary. To achieve this, we implemented a straightforward correction method utilizing the Near-Infrared (NIR) and Short-Wave Infrared (SWIR) bands, effectively extracting Rrs [44].
R r s   ( λ ) = ( R ( λ ) m i n ( R ( N I R ) : R ( S W I R ) ) ) / π
where R(λ) represents the surface reflectance spanning from visible light to the red edge band, and min (R(NIR): R(SWIR)) indicates the lowest value of surface reflectance across five specific bands (842, 865, 945, 1610, and 2190 nm) within the NIR to SWIR range.

3.2. Inversion and Evaluation Methods for Water Quality Parameters

3.2.1. Inversion Modelling of Chl-a

In this study, we used in situ measured Rrs values at 58 points to simulate the spectral bands of the Sentinel-2 MSI satellite. Concurrently, Chl-a measured at these same locations formed the training dataset. We then leveraged these combined measurements to develop semi-empirical models specifically designed for estimating Chl-a.
The primary objective in developing semi-empirical model for Chl-a inversion was to identify the most effective spectral index. Through the analysis of the Rrs spectrum from the BGC, shown in Figure 2, we noted specific spectral features characteristic of water eutrophication. These features include reflectance peaks around 565 nm and 700 nm, and valleys near 670 nm and 740 nm (Figure 2), commonly used for constructing the Chl-a spectral index in eutrophic waters [45,46,47]. The Sentinel-2 MSI data closely matches these spectral features, including four bands at central wavelengths of 560 nm, 665 nm, 705 nm, and 740 nm. Furthermore, the Rrs measured data are utilized for band equivalent to the Sentinel-2 MSI bands, which are then used in combine with the in situ Chl-a data to build a semi-empirical model for the inversion of Chl-a. We explored several spectral indices known for Chl-a retrieval in eutrophic waters, such as the slope index (SL) [48], fluorescence line height (FLH) [49], maximum chlorophyll index (MCI) [50], and normalized difference chlorophyll-a index (NDCI) [51], as outlined in Table 2. Employing these four spectral indices, we developed a semi-empirical model for Chl-a inversion. Furthermore, we conducted comparative analyses to assess the effectiveness of each index within the models, ensuring an optimized approach for accurate Chl-a estimation.

3.2.2. Zsd Estimation

In this study, we employed both empirical and semi-analytical modelling methods to estimate water transparency in the BGC. The empirical modelling approach primarily focused on examining the correlation between the spectral data from satellite images and in situ surface measurements at 58 synchronized experimental points. This method involved selecting appropriate spectral bands or combinations thereof for the model. Specifically, we analyzed the spectral characteristics of water bodies, opting to use a combination of red, green, and blue bands. For empirical modelling, we selected a green to red/blue light ratio model [52] and a blue/green to red/green light model [53]. On the other hand, the semi-analytical model utilized was based on the QAA_RGB [39] (Table 3). This model effectively harnesses the red, green, and blue bands of the spectral data, which are vital for a detailed and accurate analysis of water clarity. This method estimates inherent optical properties, specifically the total absorption and backscattering coefficients. From these, we inverted the diffuse attenuation coefficient. Finally, water transparency was determined by correlating this diffuse attenuation coefficient with Rrs [54,55,56,57,58].

3.2.3. Evaluation of the Accuracy of Chl-a and Zsd Inversion

The semi-empirical Chl-a estimation model, together with the Zsd model derived from empirical data, was implemented on Sentinel-2 MSI images taken on 21 August, 15 October, and 25 October 2019. We evaluated the models accuracy by comparing their results with simultaneously measured Chl-a and Zsd values of the water surface, using two statistical metrics: root mean square error (RMSE) and mean relative error (MRE) [45].
R M S E = 1 N i = 1 N ( Y i X i ) 2
M R E = 1 N i = 1 N Y i X i X i × 100 %
where, Xi denotes the Chl-a or Zsd as derived from the satellite images. Yi represents the Chl-a or Zsd obtained from in situ measurements. The variable N signifies the total number of sample points utilized in the evaluation process.

3.3. Method for Calculating TLI and Evaluating Water Quality

3.3.1. Method for Calculating TLI

The calculation of the TLI is conducted following the eutrophication evaluation and grading technical regulations for lakes and reservoirs, as issued by the China Environmental Monitoring Station [20]. Eutrophication in water bodies is affected by a variety of environmental factors. Zsd represents the clarity of the water, which is an important indicator for assessing water quality. In addition to Zsd [59], Chl-a is also a crucial indicator for evaluating water quality [60]. To facilitate a comprehensive analysis of water quality conditions, we utilize Zsd and Chl-a to calculate the TLI. The TLI can synthesize the information provided by both Zsd and Chl-a [61]. The TLI of each indicator (Chl-a and Zsd) is calculated individually. After determining the relevant weight index for each, the TLI is then computed.
T L I C h l - a = 10 × 2.5 + 1.086 × ln C h l - a
T L I Z s d = 10 × 5.118 1.94 × l n ( Z s d
T L I = 1 1 + 0.6889 × T L I C h l - a + 0.6889 1 + 0.6889 × T L I Z s d
whereas TLIChl-a indicates the chlorophyll-a based trophic level index. T L I Z s d denotes the transparency based trophic level index. The comprehensive trophic level index is represented by TLI, which is calculated based on the weight of Chl-a and Zsd [62].

3.3.2. Evaluation Methods for Good Water Quality

In this study, we classify water bodies in the BGC as good water quality based on their TLI. By differentiating between these categories and conducting an annual analysis of the results, we can effectively monitor trends in water quality changes within the canal. The trophic level of these water bodies is evaluated against standards typically used for lakes and reservoirs. A scale ranging from 0 to 100 is employed, divided into five distinct levels. Within this scale, a trophic level index between 30 and 50 indicates mesotrophic nutrition, a range of 50 to 60 indicates light eutrophication, and a score from 60 to 70 indicates middle eutrophic [20]. In large urban environment, achieving mesotrophic condition in water bodies is challenging. Therefore, light eutrophication has been adopted as the benchmark for classifying a good proportion of urban water bodies. According to the clean water is defined in the research as having a transparency greater than 0.5 m [63,64]. Corresponding to this transparency level, this study calculates the TLI to be 64. We have set a TLI of 60 as classification threshold, meaning that urban water bodies demonstrating light eutrophic are deemed good water.

3.4. Spatiotemporal Analysis Method of TLI and Good Ambient Water Quality

This study inverted Sentinel-2 MSI images from 2016 to 2022, with a focus on evaluating the average TLI and the proportion of good water quality. Analysis is divided into two main dimensions: spatial analysis and temporal analysis. Temporally, the daily, monthly, seasonal, and annual average values of BGC were calculated, and the interannual changes in water quality were analyzed [57,65]. Spatially, this study calculated the average TLI from 2016 to 2022 and analyzed the spatial distribution characteristics of the average TLI for BGC. Based on the definition of the proportion of good water bodies, the changes in good water bodies were evaluated.

4. Results

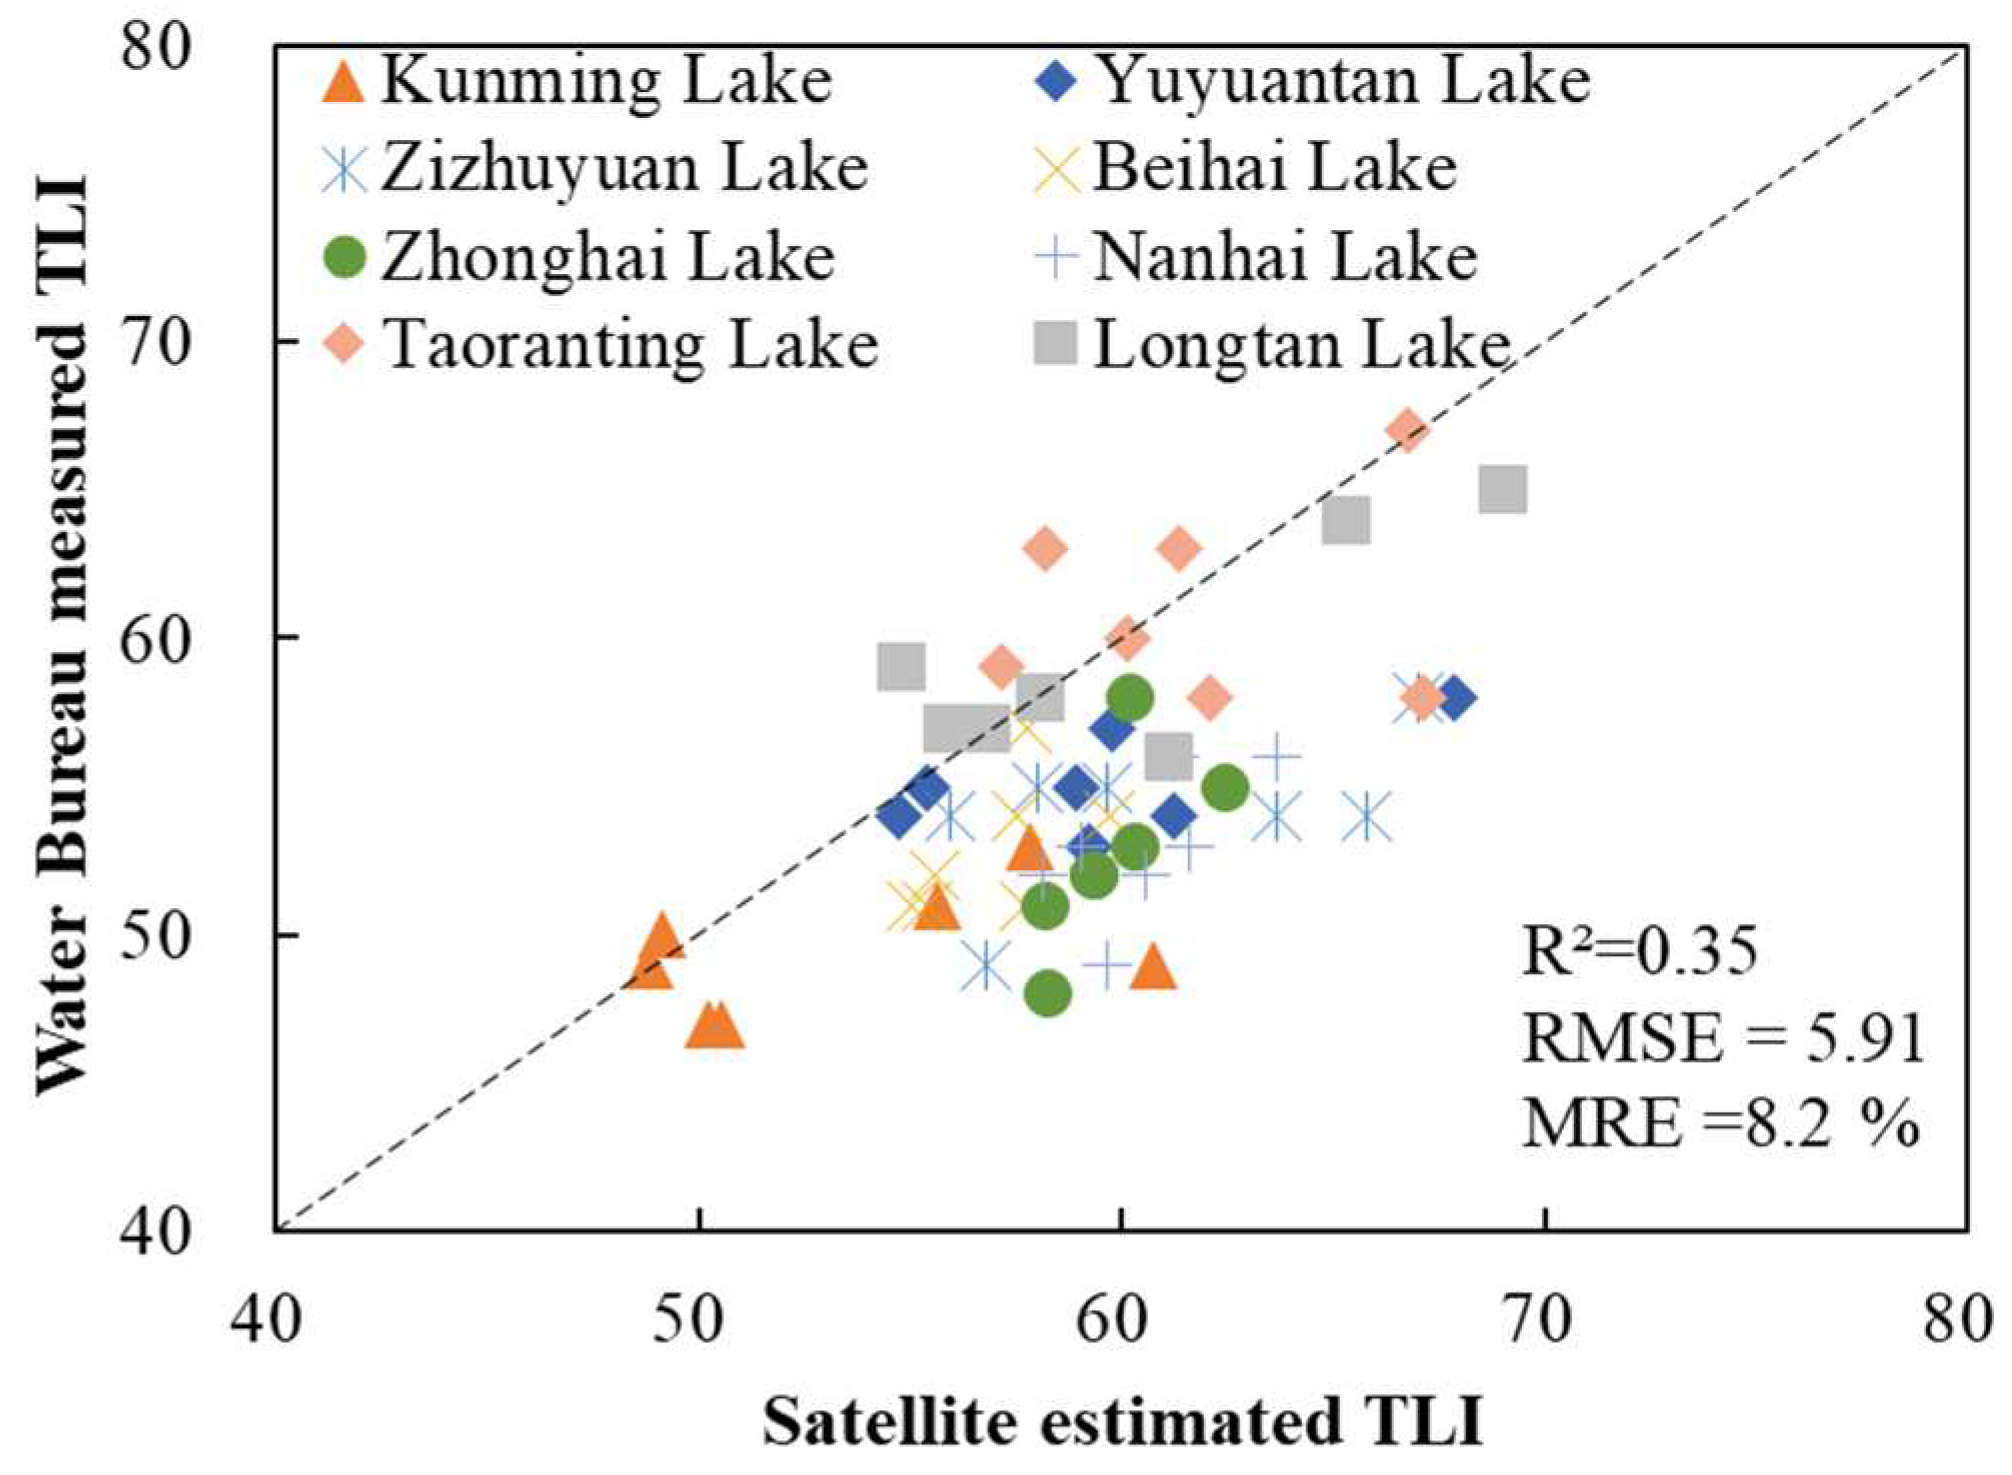
4.1. Calibration and Validation of Water Quality Estimation Model

4.1.1. Calibration and Validation of Chl-a Estimation Model

We refined four semi-empirical models for estimating Chl-a, using Sentinel-2 MSI band-equivalent in situ Rrs values from 32 synchronous sample points, and corresponding Chl-a (Table 4). The optimization of these models resulted in high R2 values, indicating their efficacy. Particularly, the model employing the NDCI achieved the highest R2 value of 0.85, signifying a strong correlation between predicted and observed values (Table 4).
The four optimized models were applied to quasi-synchronous Sentinel-2 MSI satellite images. We assessed their performance using RMSE and MRE, with detailed results presented in Table 4. Among these models, the one utilizing the NDCI showed the lowest MRE and RMSE, along with the highest R2 value. Based on these metrics, the NDCI model was chosen for estimating Chl-a in the BGC using Sentinel-2 MSI imagery [66,67,68].

4.1.2. Calibration and Validation of Zsd Estimation Model

Utilizing Sentinel-2 MSI band-equivalent in situ Rrs values and corresponding Zsd data, we calibrated two semi-empirical models for estimating Zsd. The optimization of these models demonstrated high R2 values, indicating their effectiveness (Table 5). In addition to the semi-empirical model, we also need to compare a semi analytical model based on QAA for RGB. It does not require optimization, there is no calibration R2, only validation results are needed.
We applied both semi empirical and analytical models to quasi-synchronous Sentinel-2 MSI satellite images. The performance of these three models was evaluated by comparing their RMSE and MRE against measured values and image derived estimates, as detailed in Table 5. The QAA-RGB model demonstrated superior accuracy, evidenced by the lowest MRE and RMSE, and the highest R2 value. Based on these results, the QAA-RGB model was selected for inverting the water transparency in the BGC using Sentinel-2 MSI imagery.

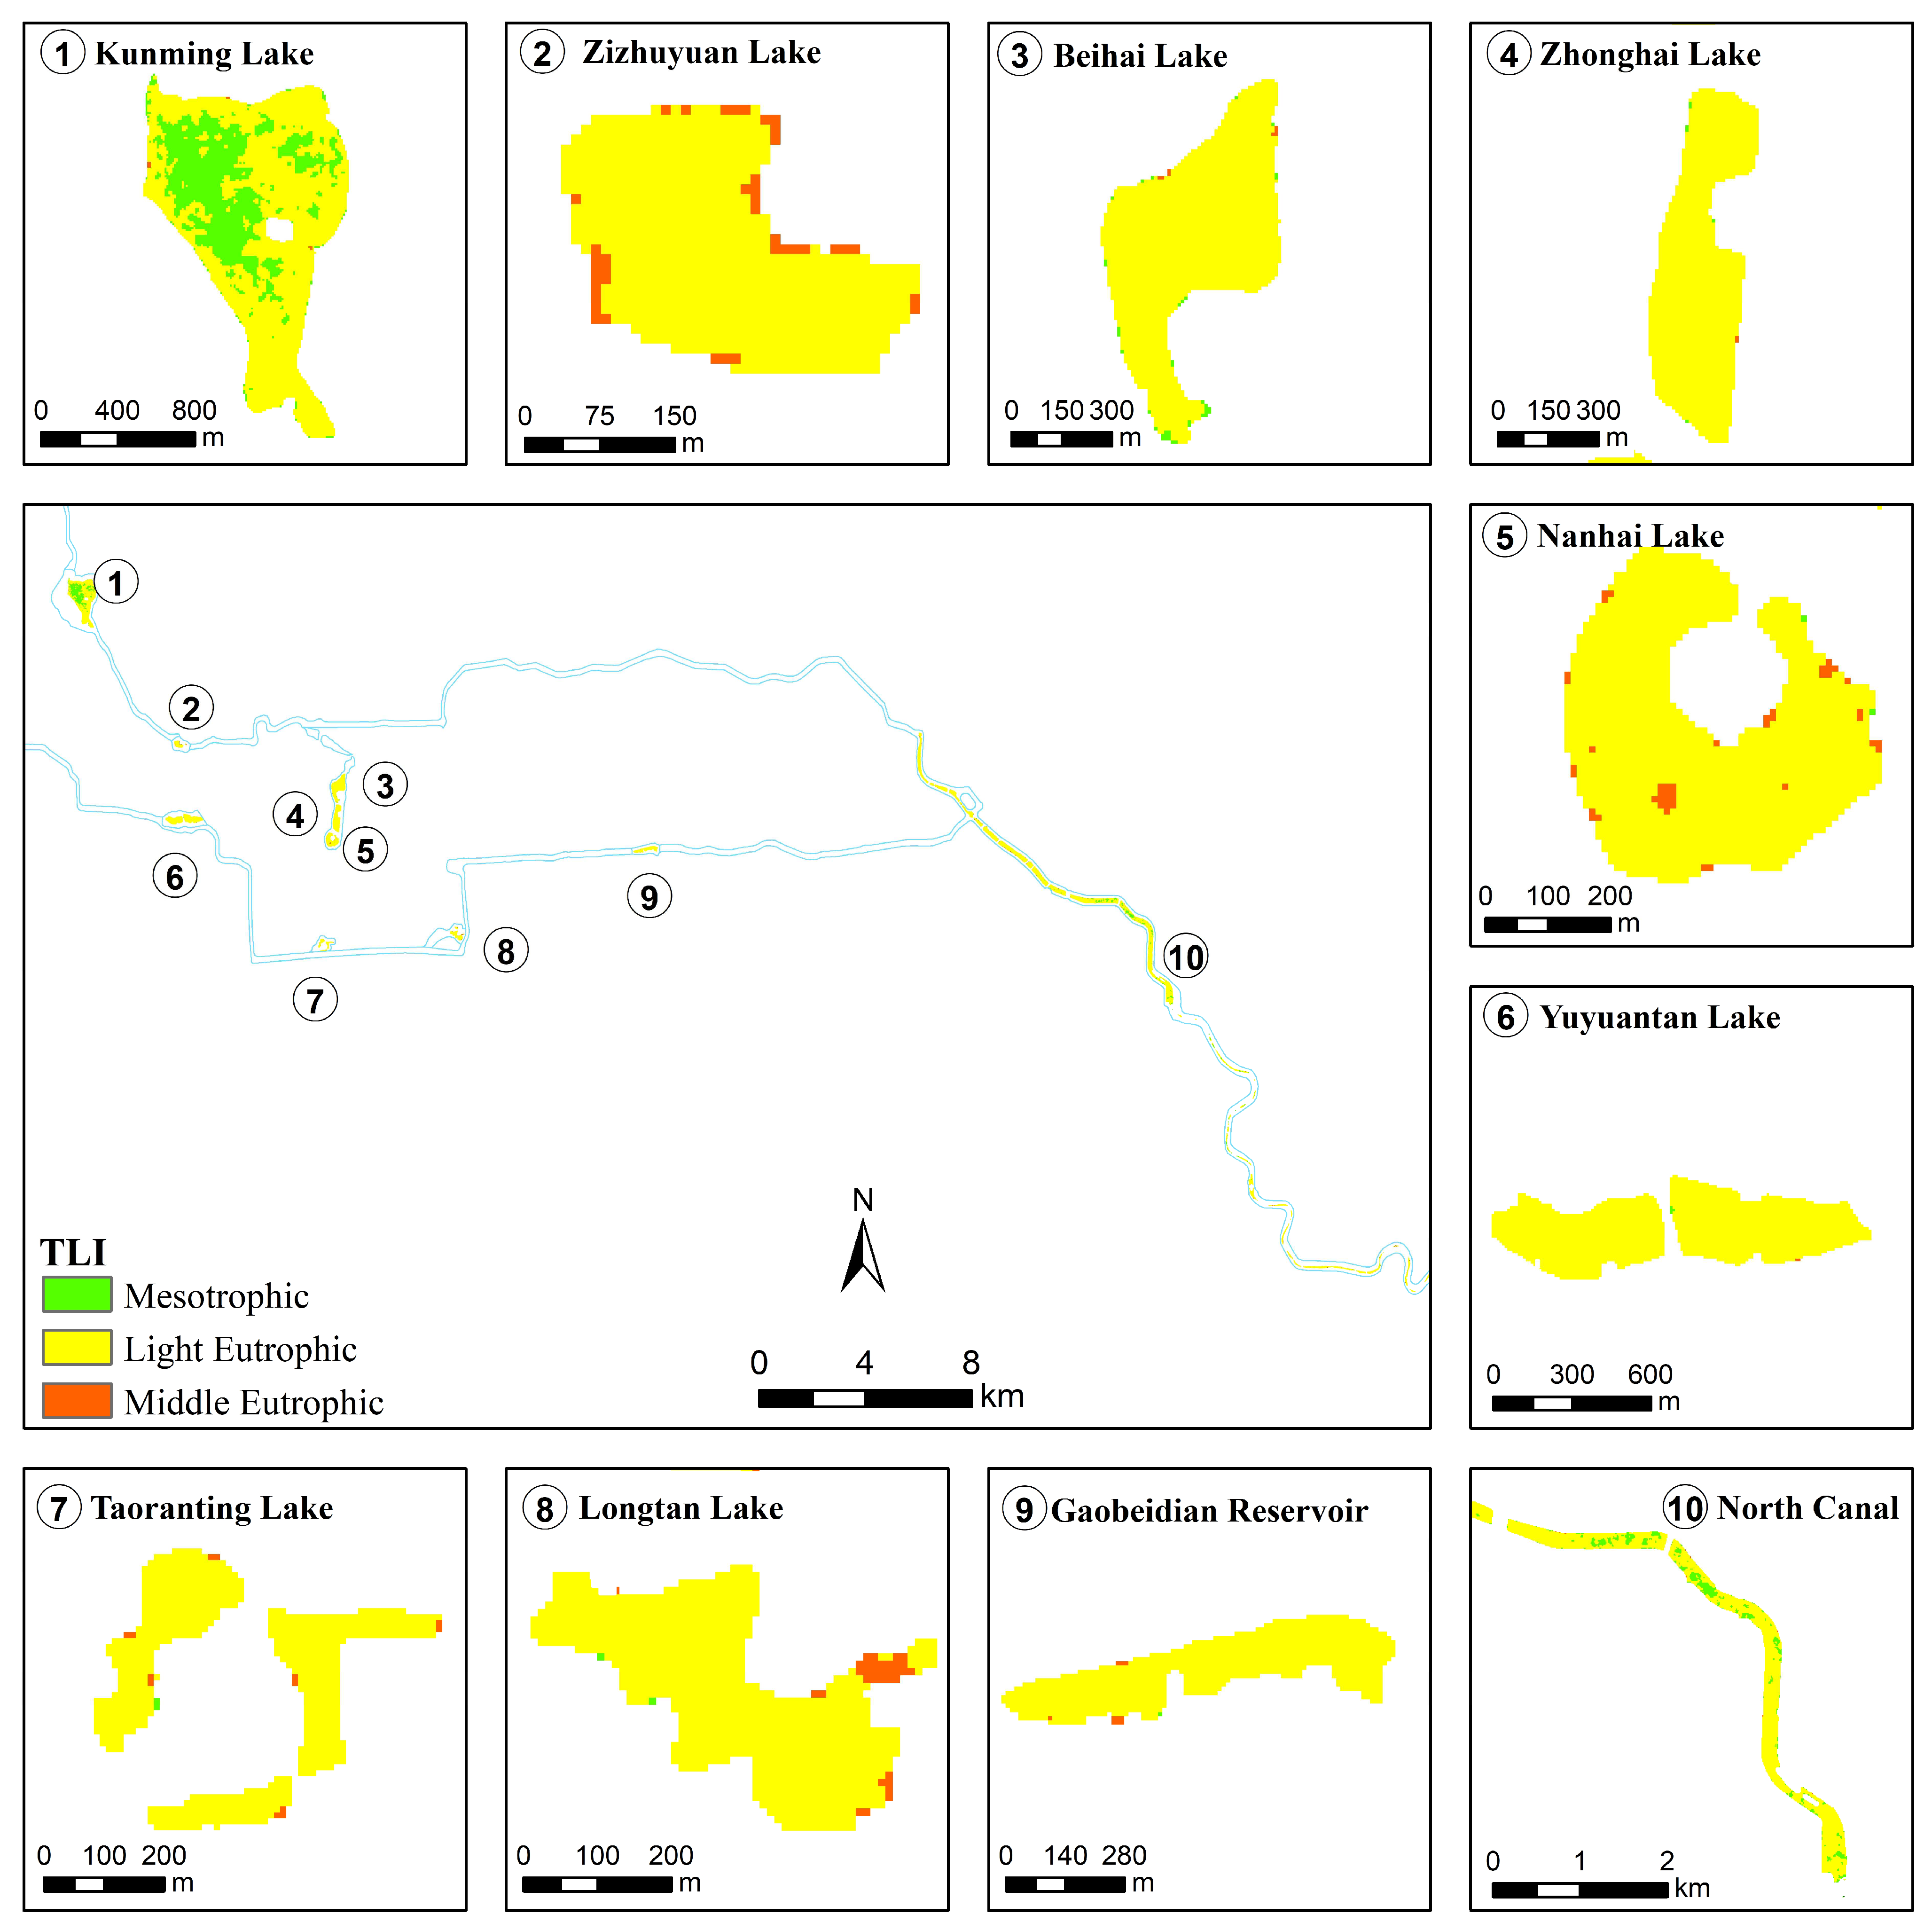
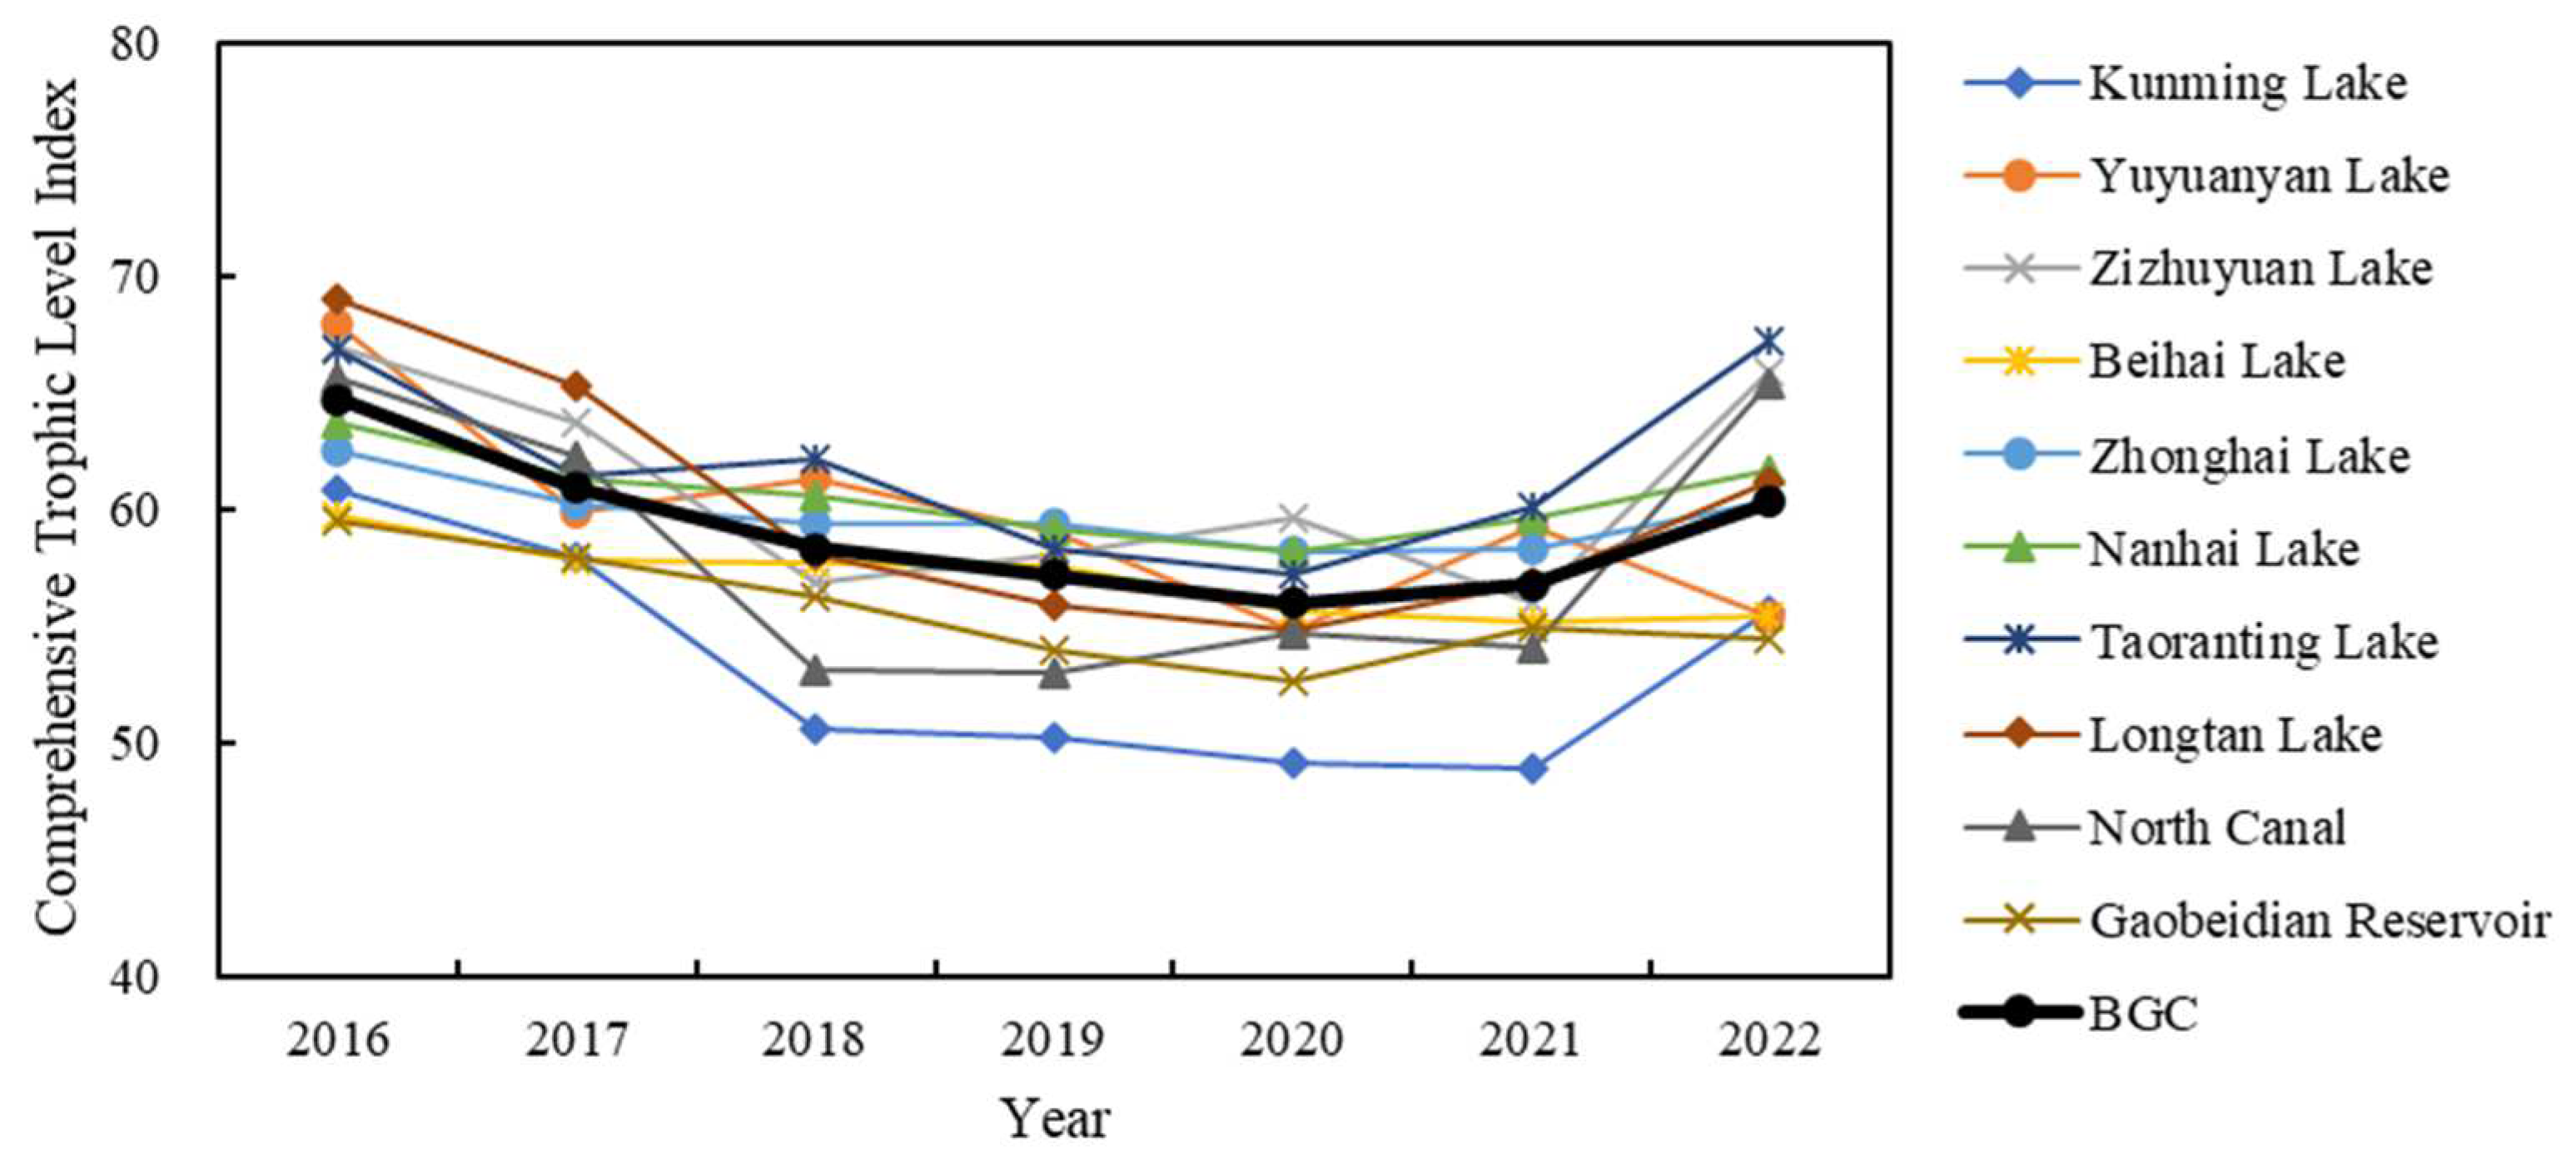
4.2. Spatiotemporal Analysis of the Comprehensive Trophic Level Index

Based on the established classification standards for assessing the trophic level of lakes and reservoirs, we graded the comprehensive trophic level index of the water bodies in the BGC. The results of all image inversions are initially averaged on a monthly basis, subsequently aggregated into seasonal means, and finally calculated as annual averages. The line graph of TLI dynamic changes is shown in the Figure 4. It reveals that, during this period, The TLI for the entire BGC water body decreased from 64.7 in 2016 to 60.3 in 2022, indicating an improvement trend in water quality. There were no instances of poor or hyper eutrophication in the BGC; the prevalent condition was mainly light and middle eutrophic. Notably, the water quality at the Kunming Lake was relatively better, consistently maintaining a mesotrophic condition from 2018 to 2021. Other water bodies demonstrated a fluctuating trophic level, varying from mesotrophic to light eutrophic and then back to mesotrophic over the monitored years. The Zhonghai Lake and North Canal areas consistently exhibited a light eutrophic.
In order to analyze the spatial distribution characteristics of BGC water quality, we computed the seven-year average of TLI. First, the process involves calculating the monthly average of the TLI for each year. Then, based on the monthly averages, the seasonal averages are calculated. Then, the annual averages are calculated based on the seasonal averages. Finally, based on the annual averages from 2016 to 2022, the overall average is calculated. These water bodies were then categorized based on the classification standards for the TLI. The spatial distribution results are shown in Figure 5. It visualizes the spatial distribution of the average water quality values in the BGC from 2016 to 2022. Through analysis of the figure, the spatial variation of water quality in BGC lakes, reservoirs, and rivers can be observed. In this study, the water quality of the upstream Kunming Lake and the down-stream North Canal is relatively good, with some bodies of water being mesotrophic. In the middle reaches, other lakes and reservoirs are mainly light eutrophic, with some bodies of water being middle eutrophic. In the Nanhai Lake and Longtan Lake areas, only some of the water bodies are classified as middle eutrophic, while the majority are in a light eutrophication. This indicates that, overall, the water quality in the BGC has been maintained at a relatively satisfactory level.
In this study, we compared and analyzed the TLI of water bodies in the Beijing Municipal Water Bureau Yearbook with the corresponding values obtained in this research (Figure 6). While the Environmental Index [69] used in the Beijing Water Bureau Yearbook differs from the results of this study, the disparity between the two sets of data is relatively minor, with MRE of only 8.2% and RMSE of 5.91. The RMSE of 5.91 is relatively small to the TLI range of 0 to 100. It suggests that the disparity between the two data sources is minimal. The narrow range can be attributed to the concentrated distribution of TLI values within the study area, primarily falling between 50 and 70, with minor fluctuations and absence of large variations.

5. Discussion

5.1. Influencing Factors Analysis of the Annual Change of Water Quality of BGC

5.1.1. Meteorological Factors

Previous research has indicated that meteorological factors, such as temperature and precipitation, can significantly influence the TLI of water bodies [70]. Building on this understanding, we conducted an analysis of the impact of these meteorological factors on the TLI (Figure 4) of the BGC. Due to the absence of water quality data during the winter freeze, this comparative analysis focused on data from March to November. Figure 7a shows the average air temperature and total precipitation from 2016 to 2022, obtained from Beijing meteorological observation station (116°28′0″ E, 39°48′0″ N, station no. 54511), provided by China meteorological science data sharing service (http://data.cma.cn/, accessed on 3 January 2023), which is the nearest meteorological observation station to the BGC.
We analyzed the relationship between the average TLI and the average air temperature of the BGC over the period from 2016 to 2022. Findings revealed no significant correlation between these two parameters (R2 = 0.07, p > 0.05). This suggests that average air temperature does not have a notable impact on the TLI in the BGC. Similarly, when comparing total precipitation with the annual average TLI, we found that the correlation between total precipitation and the index was also insignificant (R2 = 0.27, p > 0.05). Consequently, this implies that total precipitation has a relatively minor effect on the TLI. Overall, meteorological factors have a relatively minor effect on the TLI.

5.1.2. Human Activities Factors

Previous research on water eutrophication has highlighted the contributory role of human pollution and economic development in exacerbating this issue [71,72,73]. In the BGC, the primary water sources are the Miyun Reservoir and the Yongding River, which supply major park lakes through the Jingmi and Yongding River Water Diversion Canals. Additional water contributions come from natural rainfall and recycled water. Notably, the main canal of the Jingmi Water Diversion Canal, extending 110 km and passing through five districts, plays a crucial role. It supports industrial production, farmland irrigation, and urban domestic water needs in suburbs of Beijing, and also channels water to major lakes of parks. In particular, the water quality of the upstream Kunming Lake and the downstream North Canal is relatively good, with some bodies of water being mesotrophic. In the middle reaches, other lakes and reservoirs are mainly light eutrophic, with some bodies of water being middle eutrophic. Additionally, the entirety of the BGC water bodies exhibits a light eutrophication. To further investigate this, we procured social data from the Beijing Water Resources Bulletin, provided by the Beijing Municipal Water Bureau. This data of Beijing includes figures on fertilizer application (10,000 t) and pesticide use (10,000 t). Utilizing this data, we conducted a correlation analysis between the annual average of the TLI (Figure 4) of the BGC from 2016 to 2021 and human activity data. The aim was to explore the relationship between the annual average TLI and various aspects of human activity (Figure 7b).
We compared the application rates of chemical fertilizers and pesticide use with the annual average TLI (Figure 4) from 2016 to 2021. The results revealed that both the application of chemical fertilizers and pesticide use exhibited a downward trend over these years. Their correlation with the TLI was found to be significant. Specifically, the correlation between the application of chemical fertilizers and the annual average TLI was markedly significant (R2 = 0.97, p < 0.001). Similarly, the relationship between pesticide application and the annual average index was also significant (R2 = 0.87, p < 0.01). These findings showed that the fertilizer and pesticides usage may be the affecting factors on the eutrophication of water bodies. As the use of fertilizers and pesticides has declined in recent years, it may have a contribution of the improvement in the water quality of the BGC. This suggests that changes in human activities, particularly in agricultural practices, may be linked to the health and eutrophication levels of water bodies in this area.

5.1.3. Water Environment Protection Policies

The release of the Water Pollution Prevention and Control Action Plan, on 16 April 2015, marked a significant step in enhancing efforts towards water pollution prevention and control, drawing public attention to urban water environments [74,75]. This initiative has had a positive impact on the water environment of the BGC, an important water system in the city. Further progress was made on 12 July 2018, with the release of opinions on strengthening ecological environment protection and combating pollution in Beijing. These measures initiated stricter control over the sources of water pollution in the BGC, leading to gradual improvements in water quality [76]. In May 2019, the Outline of the Plan for Cultural Protection, Inheritance, and Utilization of the Grand Canal was published. This plan emphasized the management of the system of BGC and aimed to rejuvenate its historical and ecological significance [77]. Subsequently, the ‘Regulations on the Protection and Management of Rivers and Lakes in Beijing’, issued on 26 July 2019, further reinforced the efforts in maintaining the water quality of the Grand Canal, enhancing the water ecology and environment of rivers in the region [78].
The last decade has witnessed significant developments, including the opening of the middle route of the South to North Water Diversion Project, bringing water from the south to Beijing [79]. The coordinated development strategy of the Beijing-Tianjin-Hebei region, emphasizing ecological methods and the rule of law for water management, has fundamentally transformed the Grand Canal rivers [80]. The North Canal achieved a milestone of maintaining a continuous water supply throughout the year, realizing the goal of a ‘flowing river’ in 2020. The ‘Beijing Grand Canal National Cultural Park Construction and Protection Plan’, officially released on 9 October 2021, aims to restore the ecological environment of the Grand Canal. It is projected that by 2025, the comprehensive treatment of the North Canal will be largely completed, revitalizing the river water body [81]. Additionally, the ‘Beijing Water Resources Guarantee Plan (2020–2035)’, announced on 16 September 2022, focuses on improving the main stream water quality of the North Canal, restoring ecological flows, and protecting and rejuvenating the water ecosystem [82]. Through these targeted and comprehensive management efforts, the water quality of the BGC is steadily improving.
The policies for water environment protection in Beijing generally include a series of measures and policy documents aimed at improving water quality, protecting water resources, and controlling water pollution. Here are some of the main policies and measures: (1) Water Pollution Control Policy (16 April 2015). Beijing has implemented measures to control water pollution, such as setting up sewage treatment plants and promoting advanced technologies, alongside enforcing standards for sewage discharge and emission limits [6,74]; (2) Water Resources Conservation and Utilization Policy (May 2019). Beijing aims to enhance water resource efficiency through policies promoting water-saving technologies, bolstering management, and establishing quantitative resource management systems [82,83]. The implementation of these policies has contributed in a declining trend in the TLI of the BGC in recent years, improving the ecological environment and reducing in eutrophication of the BGC.

5.2. Implications for the SDG 11.4 Evaluation

On 22 June 2014, the Beijing-Hangzhou Grand Canal was recognized as a World Cultural Heritage Site. This recognition includes the BGC, which is the starting section of the Beijing-Hangzhou Grand Canal. The water quality of this section is not only crucial for its heritage status but also an integral part of preserving world heritage sites. In this context, the TLI emerges as a key parameter for evaluating overall water quality. It serves as an indicator reflecting the health and condition of the water body. This evaluation aligns with the UN 2020 Agenda SDG 11.4, which focuses on ‘Further efforts to protect and safeguard world cultural and natural heritage’. The direct evaluation of this indicator is quite difficult. Therefore, we attempt to indirectly evaluate. The TLI, derived from Sentinel-2 satellite imagery, proves to be an effective tool for assessing the water quality of the BGC. This assessment not only contributes to the preservation of the Grand Canal as a World Heritage site but also provides valuable data for the evaluation of SDG 11.4, supporting global efforts in sustainable development and heritage conservation.
In this study, we defined urban water bodies with a TLI less than 60 as having good environmental water quality, indicating a light level of eutrophic. This benchmark is roughly based on a simple criterion that categorizes water bodies with a transparency greater than 0.5 m as eutrophic inland waters [63], and it can be indirectly used as a standard for assessing the quality of urban water bodies. We conducted a statistical analysis of water bodies in the BGC with a TLI less than 60 from 2016 to 2022. The results revealed that in 2016, the proportion of water bodies within the BGC classified as having good water quality was relatively low (50%). However, from 2017 to 2022, there was a fluctuating increase and decrease in the percentage of water bodies meeting this standard. The proportion of water bodies classified as having good water quality in the BGC reached 83% in 2022. This demonstrates a significant improvement in the overall water quality of the BGC from 2016 to 2022.
The UN 2030 Agenda SDG11.4 goal aims to further enhance the protection and preservation of the and natural heritage of the world cultural [12]. This objective is assessed through evaluating the total per capita expenditure dedicated to preserving both cultural and natural heritage [9,84]. However, acquiring evaluation data for SDG11.4 is challenging, leading to difficulties in the assessment. Subsequently, this study adopts a novel approach by assessing the conservation of the Grand Canal, a natural water heritage, through water quality conditions. By calculating the proportion of clean water bodies, the water quality compliance rate for the BGC stood at 50% in 2016 and improved to 83% in 2022. If this rate is sustained, reaching 100% compliance before 2023 is feasible, thereby aligning with the SDG11.4 target by 2030 for the BGC.

6. Conclusions

In this study, we utilized Sentinel-2 MSI data to identify water bodies wider than 100 m along the Beijing section of the Grand Canal (BGC) and assess their comprehensive trophic level (TLI). The data included 189 cloud-free, high-quality images spanning 2016 to 2022. We established empirical and semi-analytical models tailored to this canal section, based on measured chlorophyll-a concentrations (Chl-a), transparency (Zsd). These models facilitated the calculation of the TLI for ten water bodies in the BGC.
During the monitoring period of 2016 to 2022, none of the ten study areas in the BGC exhibited poor or hyper eutrophic. The overall trend indicated a decline in eutrophic levels, predominantly featuring light eutrophic conditions. Notably, the water quality at the Kunming Lake remained in a mesotrophic condition from 2018 to 2021, reflecting good conditions of water. Other water bodies fluctuated between mesotrophic and light condition, except for Zhonghai Lake and the North Canal, which consistently exhibited light eutrophic. The TLI for the entire BGC water body decreased from 64.7 in 2016 to 60.3 in 2022, indicating a declining trend in water quality improvement. Spatially, over the seven-year average, the overall water quality of the Beijing section was favorable. Mesotrophic condition was found in the part near the Kunming Lake and North Canal. Some water bodies in the Nanhai Lake and Longtan Lake were middle eutrophic, but most were light eutrophic. The decreasing trend in TLI showed low correlation with meteorological factors and may be attributed the improvement in water quality to the reduction of fertilizer and pesticide use by the Beijing Municipal Government, along with the implementation of various environmental policies. Remarkably, the proportion of clean water in the canal increased from 50% in 2016 to 83% in 2022, likely due to reduced fertilizer and pesticide usage and various water environment management policies by Beijing Municipal Government. This research offers valuable insights for managing and protecting the water resources of the BGC and contributes to the evaluation of the United Nations Sustainable Development Goal SDG11.4 indicator.

Author Contributions

Conceptualization, Y.X., J.L., Q.Z., X.X., F.C. and S.W.; methodology, Y.X., F.Z. and J.L.; validation, Y.X., M.G. and Y.H.; investigation, W.S. and M.G.; data curation, Y.X. and Y.D.; writing—original draft preparation, Y.X. and J.K.; writing—review and editing, Y.X., Y.H. and S.W.; visualization, F.Z., Y.D. and J.K.; supervision, W.S. and J.L.; project administration, Q.Z., X.X. and F.C. All authors have read and agreed to the published version of the manuscript.

Funding

This work was funded by National Key Research and Development Program of China (grant no. 2022YFC3800703).

Data Availability Statement

The original contributions presented in the study are included in the article material, further inquiries can be directed to the corresponding author.

Acknowledgments

The authors acknowledge the European Space Agency for supplying Sentinel-2 MSI data, China meteorological science data sharing service for supplying meteorological data, and the Surface Water Quality Data of the Beijing Municipal Water Bureau for supplying yearbook data.

Conflicts of Interest

Author Jinlong Kang was employed by the company Shaanxi Institute of Surveying and Mapping of Land Ltd. The remaining authors declare that the research was conducted in the absence of any commercial or financial relationships that could be construed as a potential conflict of interest.

Abbreviations

BGCBeijing section of the Grand Canal
TLIComprehensive Trophic Level Index
SDGSustainable Development Goal
Chl-aChlorophyll-a concentration
ZsdTransparency
RrsRemote sensing reflectance
ASDAnalytical Spectral Devices
StdvStandard Deviation
MinMinimum
MaxMaximum
ESAEuropean Space Agency
QAAQuasi-Analytical Algorithm
NIRNear-Infrared
SWIRShort-Wave Infrared
SLSlope Index
FLHFluorescence Line Height
MCIMaximum Chlorophyll Index
NDCINormalized Difference Chlorophyll-a Index
RMSERoot Mean Square Error
MREMean Relative Error

References

  1. Pan, X.T. Millennium Canal Welcomes Century Revival. People’s Daily Overseas Edition, 26 May 2022. [Google Scholar] [CrossRef]
  2. Yang, J. Study on the Ecological Environmental Change of the Jing-Hang Grand Canal; Nanjing Forestry University: Nanjing, China, 2012. [Google Scholar]
  3. Xie, W.X.; Zhu, X.K.; Zhang, Y.R.; Ding, Y.; Qi, J.Y. Land Cover Change and Landscape Pattern Evolution in Beiing Section of the Grand Canal. Beijing Surv. Mapp. 2021, 35, 5. [Google Scholar]
  4. Ye, N.; Cui, Q. Present the Culture the Preservation Plan of JingHang Grand Canna (BeiJing Part). China Anc. City 2011, 5, 49–53. [Google Scholar]
  5. Wei, X.F.; Zhao, Y.W.; Peng, K.Y.; Wang, J.; Ren, S.Y. Phytoplankton Evaluation and Cluster Analysis of 5 Landscape-lakes in Beijing. Res. Soil Water Conserv. 2009, 16, 4. [Google Scholar]
  6. Zhao, J.J. Current Situation Existing Problems and Improvement Path of Water Environment Governance in Beijing; Beijing University of Technology: Beijing, China, 2022. [Google Scholar]
  7. Xu, H. Landscape Changes and Heritage Protection of the Beijing Section of the Grand Canal. Yanhuang Geogr. 2020, 4, 86–89. [Google Scholar]
  8. Cao, X.W. Study on the Spatial Characteristics of the Traditional Settlement in the BeijingSection of the Grand Canal; Beijing University of Architecture: Beijing, China, 2020. [Google Scholar]
  9. Wang, X.Y.; Ren, H.G.; Wang, P.; Yang, R.X.; Cheng, F.L. A preliminary study on target 11.4 for UN Sustainable Development Goals. Int. J. Geoherit. Parks 2018, 6, 18–24. [Google Scholar] [CrossRef]
  10. Liu, Q.Y. Grand Canal heritage protection and utilization under the background of applying for world heritage. Soc. Sci. Beijing 2012, 5, 8–13. [Google Scholar] [CrossRef]
  11. Li, Y. The Grand Canal steps into the world heritage. Openings 2014, 28, 14–15. [Google Scholar]
  12. United Nations. Transforming our World: The 2030 Agenda for Sustainable Development; United Nations: New York, NY, USA, 2015. [Google Scholar]
  13. Chen, T.Y.; Liu, C.Q.; Shi, X.L.; Li, Y.; Fan, Z.W.; Jia, B.Y.; Liao, Y.P. Ten-year Trend Analysis of Eutrophication Status and the Related Causes in Lake Hongze. Environ. Sci. 2022, 43, 3523–3531. [Google Scholar]
  14. Du, Y.C.; Wang, C.; Wang, M.Q.; Zhao, H.; Yan, K.; Mu, Y.C.; Zhang, W.Z.; Zhang, F.F.; Wang, S.L.; Li, J.S. Spatiotemporal variation of cyanobacterial harmful algal blooms in China based on literature and media information. Int. J. Digit. Earth 2023, 16, 3905–3922. [Google Scholar] [CrossRef]
  15. Asadollah, S.B.H.S.; Sharafati, A.; Motta, D.; Yaseen, Z.M. River water quality index prediction and uncertainty analysis: A comparative study of machine learning models. J. Environ. Chem. Eng. 2021, 9, 104599. [Google Scholar] [CrossRef]
  16. Cui, M.; Zhang, C. Eutrophication of Wetland Water in Fenhe River Scenic Area Based on Comprehensive Nutritional State Index. Soil Water Conserv. China 2023, 4, 49–52. [Google Scholar] [CrossRef]
  17. Zhao, K.P.; Yang, W.J.; Sha, J.; Shang, Y.T.; Li, X. Spatial characteristics of nutrient status in Danjiangkou Reservoir. Environ. Sci. Technol. 2020, 43, 51–58. [Google Scholar] [CrossRef]
  18. Zou, W.; Zhu, G.W.; Cai, Y.J.; Xu, H.; Zhu, M.Y.; Gong, Z.J.; Zhang, Y.L.; Qin, B.Q. The limitations of comprehensive trophic level index (TLI) in the eutrophication assessment of lakes along the middle and lower reaches of the Yangtze River during summerseason and recommendation for its improvement. J. Lake Sci. 2020, 32, 36–47. [Google Scholar]
  19. Wang, L.; Wang, X.; Zhou, C.; Wang, X.X.; Meng, Q.H.; Chen, Y.L. Remote sensing quantitative retrieval of Chlorophyll a and trophie level index in main sagoing rivers of Lianyungang. Spectrosc. Spectr. Anal. 2023, 43, 3314–3320. [Google Scholar]
  20. Wang, M.C.; Liu, X.Q.; Zhang, J.H. Evaluate method and classification standard on lake eutrophication. Environ. Monit. China 2002, 18, 3. [Google Scholar]
  21. Cai, Q. Remote Sensing Study on the Spatio-Temporal Variation of Water Quality Distribution in the Jing-Hang Grand Canal over the Past Forty Years; Jiangsu Normal University: Xuzhou, China, 2020. [Google Scholar]
  22. Naimaee, R.; Kiani, A.; Jarahizadeh, S.; Haji Seyed Asadollah, S.B.; Melgarejo, P.; Jodar-Abellan, A. Long-Term Water Quality Monitoring: Using Satellite Images for Temporal and Spatial Monitoring of Thermal Pollution in Water Resources. Sustainability 2024, 16, 646. [Google Scholar] [CrossRef]
  23. Fehri, R.; Khlifi, S.; Vanclooster, M. Disaggregating SDG-6 water stress indicator at different spatial and temporal scales in Tunisia. Sci. Total Environ. 2019, 694, 133766. [Google Scholar] [CrossRef] [PubMed]
  24. Zhang, B.; Li, J.S.; Shen, Q.; Wu, Y.H.; Zhang, F.F.; Wang, S.L.; Yao, Y.; Guo, L.N.; Yin, Z.Y. Recent research progress on long time series and large scale optical remote sensing of inland water. Nat. Remote Sens. Bull. 2021, 25, 16. [Google Scholar] [CrossRef]
  25. Gitelson, A.A.; Schalles, J.F.; Hladik, C.M. Remote chlorophyll-a retrieval in turbid, productive estuaries: Chesapeake Bay case study. Remote Sens. Environ. 2007, 109, 464–472. [Google Scholar] [CrossRef]
  26. Olmanson, L.G.; Brezonik, P.L.; Bauer, M.E. Airborne hyperspectral remote sensing to assess spatial distribution of water quality characteristics in large rivers: The Mississippi River and its tributaries in Minnesota. Remote Sens. Environ. 2013, 130, 254–265. [Google Scholar] [CrossRef]
  27. Tian, S.; Guo, H.; Xu, W.; Zhu, X.; Wang, B.; Zeng, Q.; Huang, J.J. Remote sensing retrieval of inland water quality parameters using Sentinel-2 and multiple machine learning algorithms. Environ. Sci. Pollut. Res. 2023, 30, 18617–18630. [Google Scholar] [CrossRef]
  28. Quang, N.H.; Dinh, N.T.; Dien, N.T.; Son, L.T. Calibration of Sentinel-2 Surface Reflectance for Water Quality Modelling in Binh Dinh’s Coastal Zone of Vietnam. Sustainability 2023, 15, 1410. [Google Scholar] [CrossRef]
  29. Zhu, Y.F. Analysis and Optimization Strategy of Typical Waterfront and Water front Landscape of Grand Canal (Beijing Section); Tianjin University of Technology: Tianjin, China, 2021. [Google Scholar]
  30. Mueller, J.L.; Morel, A.; Frouin, R.; Davis, C.; Arnone, R.; Carder, K.; Lee, Z.P. Ocean Optics Protocols for Satellite Ocean Color Sensor Validation, Revision 4. In Volume III: Radiometric Measurements and Data Analysis Protocols; Goddard Space Flight Space Centre: Greenbelt, MD, USA, 2003. [Google Scholar]
  31. Tang, J.W.; Tian, G.L.; Wang, X.Y.; Wang, X.M.; Song, Q.J. The methods of water spectra measurement and analysis I: Above-water method. Nat. Remote Sens. Bull. 2004, 8, 8. [Google Scholar]
  32. Sartory, D.P.; Grobbelaar, J.U. Extraction of chlorophyll a from freshwater phytoplankton for spectrophotometric analysis. Hydrobiologia 1984, 114, 177–187. [Google Scholar] [CrossRef]
  33. Zhang, Y.L.; Qin, B.Q.; Liu, M.L. Temporal–spatial variations of chlorophyll a and primary production in Meiliang Bay, Lake Taihu, China from 1995 to 2003. J. Plankton Res. 2007, 29, 707–719. [Google Scholar] [CrossRef]
  34. Yin, Z.Y.; Li, J.S.; Huang, J.; Wang, S.L.; Zhang, F.F.; Zhang, B. Steady increase in water clarity in Jiaozhou Bay in the Yellow Sea from 2000 to 2018: Observations from MODIS. J. Oceanol. Limnol. 2020, 39, 800–813. [Google Scholar] [CrossRef]
  35. Qiu, R.T.; Wang, S.L.; Shi, J.K.; Shen, W.; Zhang, W.Z.; Zhang, F.F.; Li, J.S. Sentinel-2 MSI Observations of Water Clarity in Inland Waters across Hainan Island and Implications for SDG 6.3.2 Evaluation. Remote Sens. 2023, 15, 1600. [Google Scholar] [CrossRef]
  36. Ivanda, A.; Šerić, L.; Žagar, D.; Oštir, K. An application of 1D convolution and deep learning to remote sensing modelling of Secchi depth in the northern Adriatic Sea. Big Earth Data 2023, 1–33. [Google Scholar] [CrossRef]
  37. Xu, N.; Xiang, C.C. Extraction of Rivers and Lakes Based on Sentinel-2 Remote Sensing lmages. Geomat. Spatial Inf. Tech. 2023, 46, 120–123. [Google Scholar]
  38. Xie, Y.; Zhao, H.L.; Li, J.S.; Zhang, F.F.; Wang, S.L.; Yin, Z.Y.; Shen, W. Phytoplankton biomass variation after cage aquaculture removal from the Daheiting Reservoir, China: Observations from satellite data. Hydrobiologia 2022, 849, 4759–4775. [Google Scholar] [CrossRef]
  39. Lee, Z.P.; Shang, S.L.; Hu, C.M.; Du, K.P.; Weidemann, A.; Hou, W.L.; Lin, J.F.; Lin, G. Secchi disk depth: A new theory and mechanistic model for underwater visibility. Remote Sens. Environ. 2015, 169, 139–149. [Google Scholar] [CrossRef]
  40. Pitarch, J.; Vanhellemont, Q. The QAA-RGB: A universal three-band absorption and backscattering retrieval algorithm for high resolution satellite sensors. Development and implementation in ACOLITE. Remote Sens. Environ. 2021, 265, 112667. [Google Scholar] [CrossRef]
  41. Wang, G.L.; Li, J.S.; Zhang, B.; Shen, Q.; Zhang, F.F. Monitoring cyanobacteria-dominant algal blooms in eutrophicated Taihu Lake in China with synthetic aperture radar images. Chin. J. Oceanol. Limnol. 2015, 33, 139–148. [Google Scholar] [CrossRef]
  42. Hou, X.J.; Feng, L.; Duan, H.T.; Chen, X.L.; Sun, D.Y.; Shi, K. Fifteen-year monitoring of the turbidity dynamics in large lakes and reservoirs in the middle and lower basin of the Yangtze River, China. Remote Sens. Environ. 2017, 190, 107–121. [Google Scholar] [CrossRef]
  43. Mueller-Wilm, U.; Devignot, O.; Pessiot, L. Sen2Cor Configuration and User Manual; European Space Agency: Paris, France, 2018. [Google Scholar]
  44. Wang, S.L.; Li, J.S.; Bing, Z.; Qian, S.; Zhang, F.; Iu, Z. A simple correction method for the MODIS surface reflectance product over typical inland waters in China. Int. J. Remote Sens. 2016, 37, 6076–6096. [Google Scholar] [CrossRef]
  45. Le, C.F.; Hu, C.M.; Cannizzaro, J.; English, D.; Muller-Karger, F.; Lee, Z.P. Evaluation of chlorophyll-a remote sensing algorithms for an optically complex estuary. Remote Sens. Environ. 2013, 129, 75–89. [Google Scholar] [CrossRef]
  46. Watanabe, F.; AlcÂNtara, E.; Rodrigues, T.; Rotta, L.; Bernardo, N.; Imai, N. Remote sensing of the chlorophyll-a based on OLI/Landsat-8 and MSI/Sentinel-2A (Barra Bonita reservoir, Brazil). An. Acad. Bras. Cienc. 2018, 90, 1987–2000. [Google Scholar] [CrossRef]
  47. Gons, H.J.; Rijkeboer, M.; Ruddick, K.G. Effect of a waveband shift on chlorophyll retrieval from MERIS imagery of inland and coastal waters. J. Plankton Res. 2005, 27, 125–127. [Google Scholar] [CrossRef]
  48. Mishra, D.R.; Mishra, S. Plume and bloom: Effect of the Mississippi River diversion on the water quality of Lake Pontchartrain. Geocarto Int. 2010, 25, 555–568. [Google Scholar] [CrossRef]
  49. Letelier, R.M.; Abbott, M.R. An analysis of chlorophyll fluorescence algorithms for the moderate resolution imaging spectrometer (MODIS).pdf. Remote Sens. Environ. 1996, 58, 215–223. [Google Scholar] [CrossRef]
  50. Gower, J.; King, S.; Borstad, G.; Brown, L. Detection of intense plankton blooms using the 709 nm band of the MERIS imaging spectrometer. Int. J. Remote Sens. 2005, 26, 2005–2012. [Google Scholar] [CrossRef]
  51. Mishra, S.; Mishra, D.R. Normalized difference chlorophyll index: A novel model for remote estimation of chlorophyll-a concentration in turbid productive waters. Remote Sens. Environ. 2012, 117, 394–406. [Google Scholar] [CrossRef]
  52. Olmanson, L.G.; Brezonik, P.L.; Bauer, M.E. Evaluation of medium to low resolution satellite imagery for regional lake water quality assessments. Water Resour. Res. 2011, 47, 1–14. [Google Scholar] [CrossRef]
  53. Setiawan, F.; Matsushita, B.; Hamzah, R.; Jiang, D.; Fukushima, T. Long-Term Change of the Secchi Disk Depth in Lake Maninjau, Indonesia Shown by Landsat TM and ETM+ Data. Remote Sens. 2019, 11, 2875. [Google Scholar] [CrossRef]
  54. Lee, Z.P.; Shang, S.L.; Qi, L.; Yan, J.; Lin, G. A semi-analytical scheme to estimate Secchi-disk depth from Landsat-8 measurements. Remote Sens. Environ. 2016, 177, 101–106. [Google Scholar] [CrossRef]
  55. Shang, S.L.; Lee, Z.P.; Shi, L.H.; Lin, G.; Wei, G.M.; Li, X.D. Changes in water clarity of the Bohai Sea: Observations from MODIS. Remote Sens. Environ. 2016, 186, 22–31. [Google Scholar] [CrossRef]
  56. Feng, L.; Hou, X.J.; Zheng, Y. Monitoring and understanding the water transparency changes of fifty large lakes on the Yangtze Plain based on long-term MODIS observations. Remote Sens. Environ. 2019, 221, 675–686. [Google Scholar] [CrossRef]
  57. Yin, Z.Y.; Li, J.S.; Liu, Y.; Xie, Y.; Zhang, F.F.; Wang, S.L.; Sun, X.; Zhang, B. Water clarity changes in Lake Taihu over 36 years based on Landsat TM and OLI observations. Int. J. Appl. Earth Obs. 2021, 102, 102457. [Google Scholar] [CrossRef]
  58. Shi, W.; Wang, M.H.; Li, J.S. Water property in high-altitude Qinghai Lake in China. Sci. Remote Sens. 2020, 2, 100012. [Google Scholar] [CrossRef]
  59. Zhou, B.T.; Zhang, Y.Y.; Shi, K. Research progress on remote sensing assessment of lake nutrient status and retrieval algorithms ofcharacteristic parameters. Nat. Remote Sens. Bull. 2022, 26, 77–91. [Google Scholar]
  60. Wang, Q.; Lu, Q.; Fan, Z.P.; Li, F.Y. Eutrophication and spatial distribution of N, P and chlorophyl-a in the Taizihe River Basin, LiaoheRiver Catchment. J. Lake Sci. 2017, 29, 11. [Google Scholar]
  61. Yang, Y.P.; Wang, Q.; Xiao, Q. Eutrophication evaluation of Taihu Lake based on quantitative remotesensing inversion. Geogr. Geoinf. Sci. 2007, 23, 5. [Google Scholar]
  62. Jin, X.C. Chinese Lake Environment Volume One; Ocean Press: Beijing, China, 1995; pp. 275–278. [Google Scholar]
  63. Bigham Stephens, D.L.; Carlson, R.E.; Horsburgh, C.A.; Hoyer, M.V.; Bachmann, R.W.; Canfield, D.E. Regional distribution of Secchi disk transparency in waters of the United States. Lake Reserv. Manag. 2015, 31, 55–63. [Google Scholar] [CrossRef]
  64. Guo, H.D. Big Earth Data in Support of the Sustainable Development Goals (2020); EDP Sciences: Beijing, China, 2021. [Google Scholar]
  65. Zhao, D.; Li, J.S.; Hu, R.M.; Shen, Q.; Zhang, F.F. Landsat-satellite-based analysis of spatial–temporal dynamics and drivers of CyanoHABs in the plateau Lake Dianchi. Int. J. Remote Sens. 2018, 39, 8552–8571. [Google Scholar] [CrossRef]
  66. Ansper, A.; Alikas, K. Retrieval of Chlorophyll a from Sentinel-2 MSI Data for the European Union Water Framework Directive Reporting Purposes. Remote Sens. 2018, 11, 64. [Google Scholar] [CrossRef]
  67. Ambrose-Igho, G.; Seyoum, W.M.; Perry, W.L.; O’Reilly, C.M. Spatiotemporal Analysis of Water Quality Indicators in Small Lakes Using Sentinel-2 Satellite Data: Lake Bloomington and Evergreen Lake, Central Illinois, USA. Environ. Prog. 2021, 8, 637–660. [Google Scholar] [CrossRef]
  68. Elhag, M.; Gitas, I.; Othman, A.; Bahrawi, J.; Gikas, P. Assessment of Water Quality Parameters Using Temporal Remote Sensing Spectral Reflectance in Arid Environments, Saudi Arabia. Water 2019, 11, 556. [Google Scholar] [CrossRef]
  69. Qian, C.; Wang, X.D.; Luo, F.; Xu, D.D.; Wu, B.W.; Xue, Y.H.; Ju, X.H.; Wen, X.L. Application limitations and improvement recommendations of trophic state indices in theeutrophication level assessment of small shallow lakes along the lower reach of the Yangtze. J. Lake Sci. 2023, 35, 1173–1182. [Google Scholar]
  70. An, G.Y.; Guo, Z.C.; Ye, P. Climatic Changes and Impacts on Water Quality of Erhai Lake in Dali Area, Yunnan Province over the Period from 1989 to 2019. Geoscience 2022, 36, 406. [Google Scholar]
  71. Sun, X.H.; Liu, J.Q.; Wang, J.R.; Tian, L.Q.; Zhou, Q.; Li, J. Integrated monitoring of lakes’ turbidity in Wuhan, China during the COVID-19 epidemic using multi-sensor satellite observations. Int. J. Digit. Earth 2020, 14, 443–463. [Google Scholar] [CrossRef]
  72. Duan, H.T.; Ma, R.H.; Xu, X.F.; Kong, F.X.; Zhang, S.X.; Kong, W.J.; Hao, J.Y.; Shang, L.L. Two-Decade Reconstruction of Algal Blooms in China’s Lake Taihu. Environ. Sci. Technol. 2009, 43, 3522–3528. [Google Scholar] [CrossRef] [PubMed]
  73. Lai, G.; Yu, G. A Numerical Simulation of Nutrient Transport in Taihu Basin. In Hydrology and Management of Forested Wetlands, Proceedings of the International Conference, New Bern, NC, USA, 8–12 April 2006; American Society of Agricultural and Biological Engineers: St. Joseph, MI, USA, 2006. [Google Scholar] [CrossRef]
  74. State Council. Water Pollution Prevention and Control Action Plan. Available online: https://www.gov.cn/zhengce/content/2015-04/16/content_9613.htm (accessed on 16 April 2015).
  75. Qiu, J. Safeguarding China’s water resources. Natl. Sci. Rev. 2018, 5, 102–107. [Google Scholar] [CrossRef]
  76. Beijing Municipal Ecology and Environment Bureau. Opinions on Strengthening Ecological Environment Protection and Combating Pollution in Beijing. Available online: https://sthjj.beijing.gov.cn/bjhrb/index/xxgk69/sthjlyzwg/wrfzgjz/1707132/ (accessed on 14 July 2018).
  77. State Council. Outline of the Plan for Cultural Protection, Inheritance, and Utilization of the Grand Canal. Available online: https://www.gov.cn/zhengce/2019-05/09/content_5390046.htm?eqid=c4a5704700006a04000000046486b5a3 (accessed on 9 May 2019).
  78. Standing Committee of Beijing Municipal People’s Congress. Regulations on the Protection and Management of Rivers and Lakes in Beijing. Available online: https://www.beijing.gov.cn/zhengce/zhengcefagui/201907/t20190729_102510.html (accessed on 29 July 2019).
  79. Xu, B.; Yang, Y.; Sun, C.Y.; Huang, Z.F.; Wang, J.Y.; Zhao, H.L. Quality and quantity characteristics of the middle route of South-to-North Water Diversion Projectin Beijing area and its effect on the local rivers and lakes. J. China Hydrol. 2023, 43, 101–107. [Google Scholar] [CrossRef]
  80. Wu, M. Analysis on spatial-temporal differences and influencing factors of industrial water resourcesreen efficiency in the South-to-North Water Diversion Project’s Central Route. Ecol. Econ. 2023, 39, 174–181. [Google Scholar]
  81. Xu, X.L. Release of the Construction and Protection Plan for the Grand Canal National Cultural Park in Beijing. China Cultural Relics Daily, 12 October 2021; p. 002. Available online: https://en.planning.org.cn/nua/view?id=506 (accessed on 29 July 2019).
  82. Beijing Municipal Water Bureau. Beijing Water Resources Guarantee Plan (2020–2035). Available online: https://swj.beijing.gov.cn/swdt/tzgg/202209/t20220916_2816811.html (accessed on 16 September 2022).
  83. Cai, Y. The Evaluation Index System of Water-Saving Society Construction Researchof Beijing; Beijing University of Civilengineering and Architecture: Beijing, China, 2019. [Google Scholar]
  84. Transforming Tourism. 2023-SDG Midterm Stocktaking. Available online: http://www.transforming-tourism.org/2023-sdg-midterm-stocktaking.html (accessed on 19 February 2023).
Figure 1. Study areas and the sampling points for the five in situ experiments performed in the BGC.
Remotesensing 16 00909 g001
Figure 2. In situ measured Rrs spectra from the five field experiments performed at the BGC. These Rrs spectra include reflectance peaks around 565 nm and 700 nm, and valleys near 670 nm and 740 nm.
Remotesensing 16 00909 g002
Figure 3. Flowchart illustrating satellite data monitoring of TLI in the BGC.
Remotesensing 16 00909 g003
Figure 4. TLI interannual variation dynamic in ten study areas of BGC and the average of ten study areas.
Remotesensing 16 00909 g004
Figure 5. Classification of the mean TLI for the BGC from 2016 to 2022.
Remotesensing 16 00909 g005
Figure 6. Comparison TLI between Beijing Municipal Water Bureau measured and Sentinel-2 MSI estimated.
Remotesensing 16 00909 g006
Figure 7. The BGC with meteorological factors of average air temperature and total precipitation from March to November 2016–2022 (a). Fertilizer application amount (10,000 t) and pesticide use amount (10,000 t) in Beijing from 2016 to 2021 (b).
Remotesensing 16 00909 g007
Table 1. In situ measurements of chlorophyll-a and transparency from the five field experiments performed in the BGC in 2019.
Study AreaExperiment DateSampling PointsChl-a (mg/m3)Zsd (m)
MaxMinMeanStevMaxMinMeanStev
Yuyuantan Lake21 August926.6514.3521.180.200.940.400.620.20
Kunming Lake16 September1414.6010.1412.881.130.580.480.530.04
Beihai Lake18 September1218.885.0513.974.301.050.550.730.18
North Canal15 October1568.4738.7347.997.820.800.580.660.06
Zizhuyuan Lake25 October837.3915.3622.786.750.250.200.220.02
Table 2. Four spectral indices employed for developing the chlorophyll-a estimation model in the Beijing Section of the Grand Canal.
Reference Spectra Index AbbreviationSpectra Index Formula
[48]SLX = (Rrs (705) − Rrs (665))/(705 − 665)
[49]FLHX = Rrs (665) − Rrs (560) − ((665 − 560)/(705 − 560)) × (Rrs (705) − Rrs (665))
[50]MCIX = Rrs (705) − Rrs (665) − ((705 − 665)/(740 − 665)) × (Rrs (740) − Rrs (665))
[51]NDCIX = (Rrs (705) –Rrs (665))/(Rrs (705) + Rrs (665))
Table 3. Procedure for extracting the total absorption coefficient (a), backscattering coefficient (bb), and diffuse attenuation coefficient (Kd) using the QAA_RGB algorithm [39,40].
StepPropertyCalculation Formula
1 r r s λ r r s λ = R r s λ 0.52 + 1.7 R r s λ
2 u λ u λ = g 0 + g 0 2 + 4 g 1 r r s λ 2 g 1 , g0 = 0.089, g1 = 0.1245
3 α ( λ 0 ) If R r s (665) < 0.02 sr−1
α λ 0 = a w 560 + 10 P
P = −1.085 − 1.110   χ − 0.234   χ 2 − 0.102   χ 3
χ = log 2 B G + 5 R 2 B
Else
α λ 0 = a w 665 + 0.39 r r s 665 r r s * 443 + r r s 490 1.14
r r s * 443 = r r s 560 × Q B G
Q B G = q 2 r r s 490 r r s 560 2 + q 1 r r s 490 r r s 560 2 + q 0
4 b b p ( λ 0 ) b b p ( λ 0 ) = u ( λ 0 ) × α ( λ 0 ) 1 u ( λ 0 ) b b w ( λ 0 )
5 η η = 2.0 1 1.2 exp 0.9 Q B G
6 b b p ( λ ) b b p ( λ ) = b b p λ 0 λ 0 λ η
7 α ( λ ) α ( λ ) = ( 1 u λ ) ( b b w λ + b b p ( λ ) ) / u ( λ )
8 K d K d = 1 + 0.005 × θ s a λ + 1 0.265 b b w λ b b p λ × 4.26 1 0.52 e 10.8 a λ b b p ( λ )
9 Z s d Z s d = 1 2.5 M i n K d ( 490,560,665 ) ln 0.14 R r s t r 0.013
Notes: Rrs: this term refers to the above-surface remote-sensing reflectance. rrs: it denotes the below-surface remote-sensing reflectance. u(λ): the ratio of the total absorption coefficient a to the sum of a and the total backscattering coefficient bbp. P: intermediate variable. λ0: this is the reference wavelength. aw: represents the absorption coefficient of pure water. r*rs (443): the original QAA method, rrs (443) is utilized, which is substituted with an RGB expression in the QAA_RGB approach. bbp: the backscattering coefficient of suspended particles. bbw: it stands for the backscattering coefficient of pure seawater. η: this is the spectral power of the particle-scattering coefficient. θs: denotes the solar zenith angle. Sentinel 2A: q0 = −0.0209, q1 = 0.5402, q2 = 0.2269. Sentinel 2B: q0 = 0.0684, q1 = 0.5398, q2 = −0.0255. RGB represents Rrs (665), Rrs (560), Rrs (490). Rtrrs: Represents the remote sensing reflectance at this specific wavelength.
Table 4. Optimization semi-empirical models of Chl-a inversion model for the BGC based on measured spectra and Chl-a.
Index (X)Optimized Chl-a ModelCalibrationValidation
RMSE
(mg/m³)
MRE (%)
SL10^ (35,748,887,305.13X3 − 28,085,209.05X2 + 6714.07X + 1.37)0.840.1613.8342.8
FLH10^ (−3,190,137.93X3 − 77,772.4X2 − 588.52X + 0.48)0.780.0814.8540.1
MCI10^ (28.19X3 − 9.17 X2 + 2.07X + 1.69)0.840.0417.5754.0
NDCI10^ (3.37X + 1.34)0.850.7311.5432.1
Table 5. Model comparison of the various Zsd retrieval models.
ReferenceBand or Spectral IndexZsd ModelCalibrationValidation
RMSE (m)MER (%)
[52]X1 = Rrs (560) 1.941 − 11.069X1 − 1.27X20.810.830.118.2
X2 = Rrs (665)/Rrs (490)
[53]X1 = Rrs (490)/Rrs (560)0.913 − 2.069X1 + 1.378X20.710.80.1120.8
X2 = Rrs (665)/Rrs (560)
[40]QAA_RGB 0.870.0918.1
Disclaimer/Publisher’s Note: The statements, opinions and data contained in all publications are solely those of the individual author(s) and contributor(s) and not of MDPI and/or the editor(s). MDPI and/or the editor(s) disclaim responsibility for any injury to people or property resulting from any ideas, methods, instructions or products referred to in the content.

