Abstract
Using the SWAN (Severe Weather Automatic Nowcasting) maximum reflectivity mosaic product and the lightning positioning observations (LPOs) from the ADTD (Advanced Direction and Time of Arrival Detection) system obtained during the 2018–2020 warm season (May to September), adding multi-characteristic LPO parameters in addition to lightning density, the retrieval relationship between lightning and maximum proxy reflectivity, deemed FRST, is constructed by using random forest. The FRST is compared with two empirical relationships from the GSI (Gridpoint Statistical Interpolation) assimilation system, and the results show that the FRST retrieved result better reflects the frequency distribution structure and peak interval of maximum reflectivity. The correlation coefficient between the FRST retrieved result and the observed maximum reflectivity is 0.7037, which is 3.38 (3.12) times greater than that of empirical GSI relationships. The root mean square error and the mean absolute error are 50.85% (28.05%) and 57.15% (35.19%) lower than those for the empirical GSI relationships, respectively. The equitable threat score (ETS) and bias score (BIAS) for FRST are better than those of the empirical GSI relationships in all three maximum reflectivity intervals.
1. Introduction
Lightning positioning observations (LPOs) can provide effective convective activity information, and lightning data assimilation studies can improve the forecasting of disaster weather [1,2]. Lightning is a good indicator of thunderstorms [2,3]. With the advantages of high spatial resolution, wide coverage, low influence of topography, and continuous monitoring, LPOs can be used to monitor the development of thunderstorms [4] and to carry out lightning data assimilation in numerical models, thus improving the ability to forecast disaster weather [5,6]. Therefore, lightning data assimilation has certain research value in disaster weather forecasting [7,8,9,10,11].
Since an LPO is not a conventional model variable that cannot be applied to model initialization directly, it is necessary to convert LPO to a model variable or related diagnostic variable using empirical or semiempirical relationships. Part of the previous studies analyzed the relationship between lightning and related variables [12,13] or compared the related variables with and without lightning [14] but did not give a retrieval relationship between them. Some studies found a retrieval relationship between lightning and related variables in order to assimilate the lightning data [15,16,17]. Lightning density is the number of LPO records within a certain area in a certain period. In recent studies, lightning density was correlated with three-dimensional (3D) proxy reflectivity [6], precipitation rate [18], specific humidity [19], relative humidity [20], vertical velocity [15], ice-phase particle content [21], water vapor and graupel mixing ratio [22], ice-phase particle concentration, and water vapor content [23]. Through these relationships, LPOs were assimilated into numerical models to improve disaster weather forecasting. Notably, the conversion of lightning density to 3D proxy reflectivity was performed with the GSI assimilation system of the Rapid Update Cycle operational forecasting system in the USA [16,17]. The specific steps were as follows: (1) The lightning was converted to the maximum proxy reflectivity based on the empirical relationship between the lightning density and maximum proxy reflectivity; (2) the maximum proxy reflectivity was multiplied by the vertical profile coefficient to obtain the 3D proxy reflectivity. Many studies have used empirical GSI relationships to convert lightning density to 3D proxy reflectivity [5,24,25,26,27], and some scholars have established retrieval relationships between lightning density and maximum proxy reflectivity or 3D proxy reflectivity. Sun et al. [28] used LPO and radar mosaic products from 2014 to 2018 in Central China to establish a retrieval relationship between lightning density and maximum proxy reflectivity on a 13 km grid and a 3 km grid; they noted that the maximum proxy reflectivity for the 3 km grid was more accurate than that for the 13 km grid, and the maximum proxy reflectivity for the 13 km grid was closer to the observations than that retrieved from the empirical GSI relationship. Chen et al. [6] established a logarithmic relationship between lightning density and maximum proxy reflectivity through six disaster cases in Beijing in the summer of 2017. The maximum proxy reflectivity was retrieved by the relationship and converted to 3D proxy reflectivity through a real-time profile retrieval scheme. The results showed that the 3D proxy reflectivity well reflected the actual observations. Previous studies have used lightning density to establish a relationship between lightning and maximum proxy reflectivity, which was obtained by fitting [6,28]. In particular, in the GSI system, there are two empirical relationships between lightning density and the maximum proxy reflectivity [16,17].
In addition to the lightning density, time, location, intensity, and polarity of lightning can be used to identify complex thermodynamic processes in thunderstorm clouds [29,30,31,32], which are related to the maximum reflectivity. Yang et al. [33] noted that the location of lightning did not necessarily correspond to the location of strong radar echoes and indicated that lightning density and radar echo intensity often appeared to be related in time series. Yan et al. [34] showed that there were two peaks in positive cloud-to-ground lightning density, with the primary peak occurring during the development phase of the convective system and the secondary peak occurring during the dissipation phase of the convective system. A study by Zajac and Rutledge [35] revealed that negative cloud-to-ground lightning mainly occurred in convective clouds, while positive cloud-to-ground lightning mainly occurred in stratiform clouds.
The retrieval relationship between lightning and maximum proxy reflectivity affects the accuracy of the retrieved maximum proxy reflectivity and hence the effect of lightning data assimilation. Previous studies have mainly used lightning density to construct retrieval relationships and have not considered other lightning features linked to maximum reflectivity. Therefore, we attempt to fully use information on lightning density, time, location, intensity, and polarity to study the retrieval relationships in this paper. By considering more lightning features (i.e., more complicated relationships), we learn the retrieval relationship with a random forest [36,37,38,39], a machine learning method, instead of a traditional fitting method. The SWAN maximum reflectivity mosaic product and ADTD LPOs obtained during the 2018–2020 warm season (May to September) in Hebei Province (Figure 1) are used in this paper. In addition to the lightning density, multi-characteristic LPO parameters (such as the temporal coefficient, spatial coefficient, and current intensity) are considered. These LPO parameters and the random forest are used to construct the retrieval relationship between lightning and maximum proxy reflectivity for a high-resolution model grid. The new retrieval relationship is compared with the empirical GSI relationships. The article is organized as follows: Section 1 gives the introduction. In Section 2, the materials and methods are introduced, and a new retrieval relationship between lightning and maximum proxy reflectivity is constructed. In Section 3, the effect of the new retrieval relationship is assessed in the context of the empirical GSI relationships. Section 4 discusses the results and highlights several future research directions. The conclusions are presented in Section 5. For ease of understanding, Table 1 lists all the abbreviations used in this paper and their full definitions.

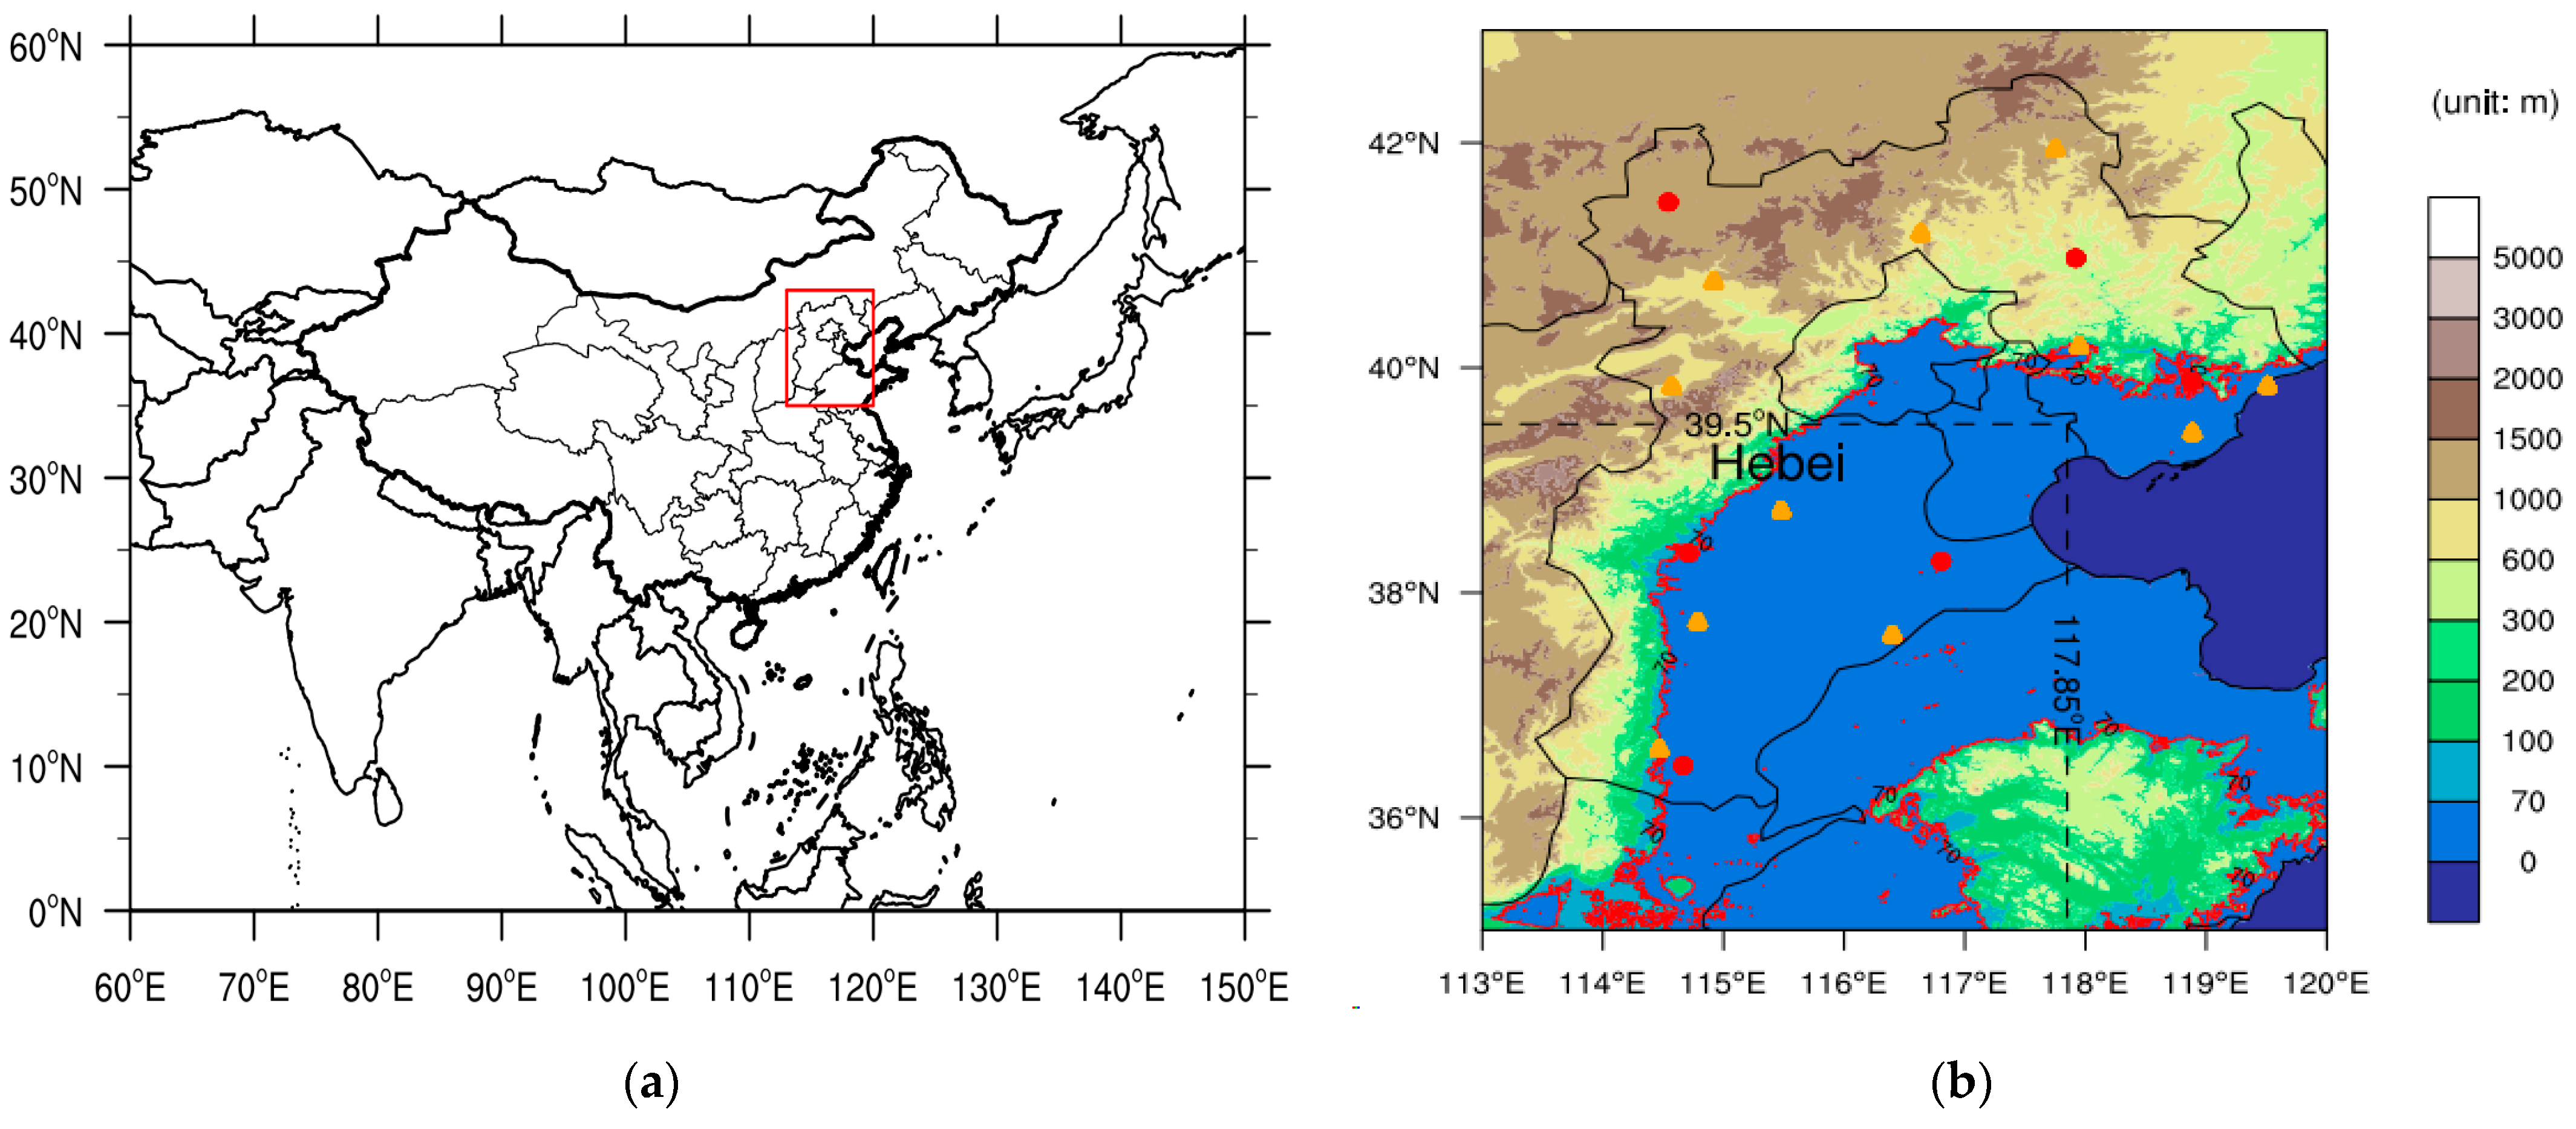
Figure 1.
(a) Geographical location of the study area. The red box shows the area displayed in (b). (b) Terrain height (unit: m). The black solid lines indicate the city/provincial borders. The black dashed lines labeled 39.5°N and 117.85°E and the red line labeled 70 are used for selecting the cases described in Section 2.1. The weather radar stations in the SWAN network are indicated with red-filled circles, and the ADTD lightning positioning stations are marked with orange-filled triangles. ‘Hebei’ represents Hebei Province.

Table 1.
Abbreviations and their full definitions.
2. Materials and Methods
2.1. Materials
The ADTD lightning positioning system was developed by the Institute of Space Science and Applications of the Chinese Academy of Sciences and mainly detects cloud-to-ground lightning [40,41]. It can detect multiple return strokes of flashes [42,43], and the detection efficiency is above 80% [27,42,43,44,45,46,47]. There are 11 ADTD lightning positioning stations in Hebei Province, and the average minimum distance between the two stations is 113 km. In this paper, elements such as time, latitude, longitude, current strength, maximum steepness of the return stroke, and the positioning methods of the ADTD LPOs are used. Referring to the quality control method of Wang et al. [48], LPO records with positioning method from 2 stations or less are excluded, and only LPO records with absolute values of the current intensity at (5, 500) kA and absolute values of the maximum steepness of the return stroke at (0, 500) kA/μs are retained. SWAN was initially developed by the State Key Laboratory of Disaster Weather of the Chinese Academy of Meteorological Sciences and was developed and applied by the Numerical Forecasting Center of the China Meteorological Administration. SWAN has been applied in real-time quality control and networking for CINRAD-SA, CINRAD-SB, and CINRAD-CB radars [49]. In this article, the maximum reflectivity mosaic product of SWAN, which has a horizontal resolution of 0.01° and a temporal resolution of 6 min, is applied. The distributions of ADTD lightning positioning stations and weather radar stations in the SWAN network are shown in Figure 1b. Considering radar data gaps and lagged values and the poor quality of radar data in some areas due to terrain blockage issues, a data set of the complete maximum reflectivity mosaic during lightning activity is obtained by focusing on the southern plain area of Hebei Province (the area south of latitude 39.5°N and west of longitude 117.85°E within Hebei Province, with a terrain height of less than 70 m, as shown in Figure 1b).
2.2. Methods
2.2.1. Two Empirical Relationships between the Lightning Density and Maximum Proxy Reflectivity in the GSI System
There are two empirical relationships between lightning density and maximum proxy reflectivity in the GSI system: linear (Weygandt et al. [16], known as GSI1) and nonlinear (Weygandt et al. [17], known as GSI2). The linear relationship is given by Equation (1), and the nonlinear relationship is shown in Table 2. LTG is the number of LPO records in a given grid cell (approximately 13 km × 13 km) summed over a 40-min period around the analysis hour (before 30 min to after 10 min), and REFL is the maximum proxy reflectivity [16,17,28].
Table 2.
The nonlinear relationship between lightning density and maximum proxy reflectivity in the GSI system.
2.2.2. Construction of the Retrieval Relationship between Lightning and Maximum Proxy Reflectivity
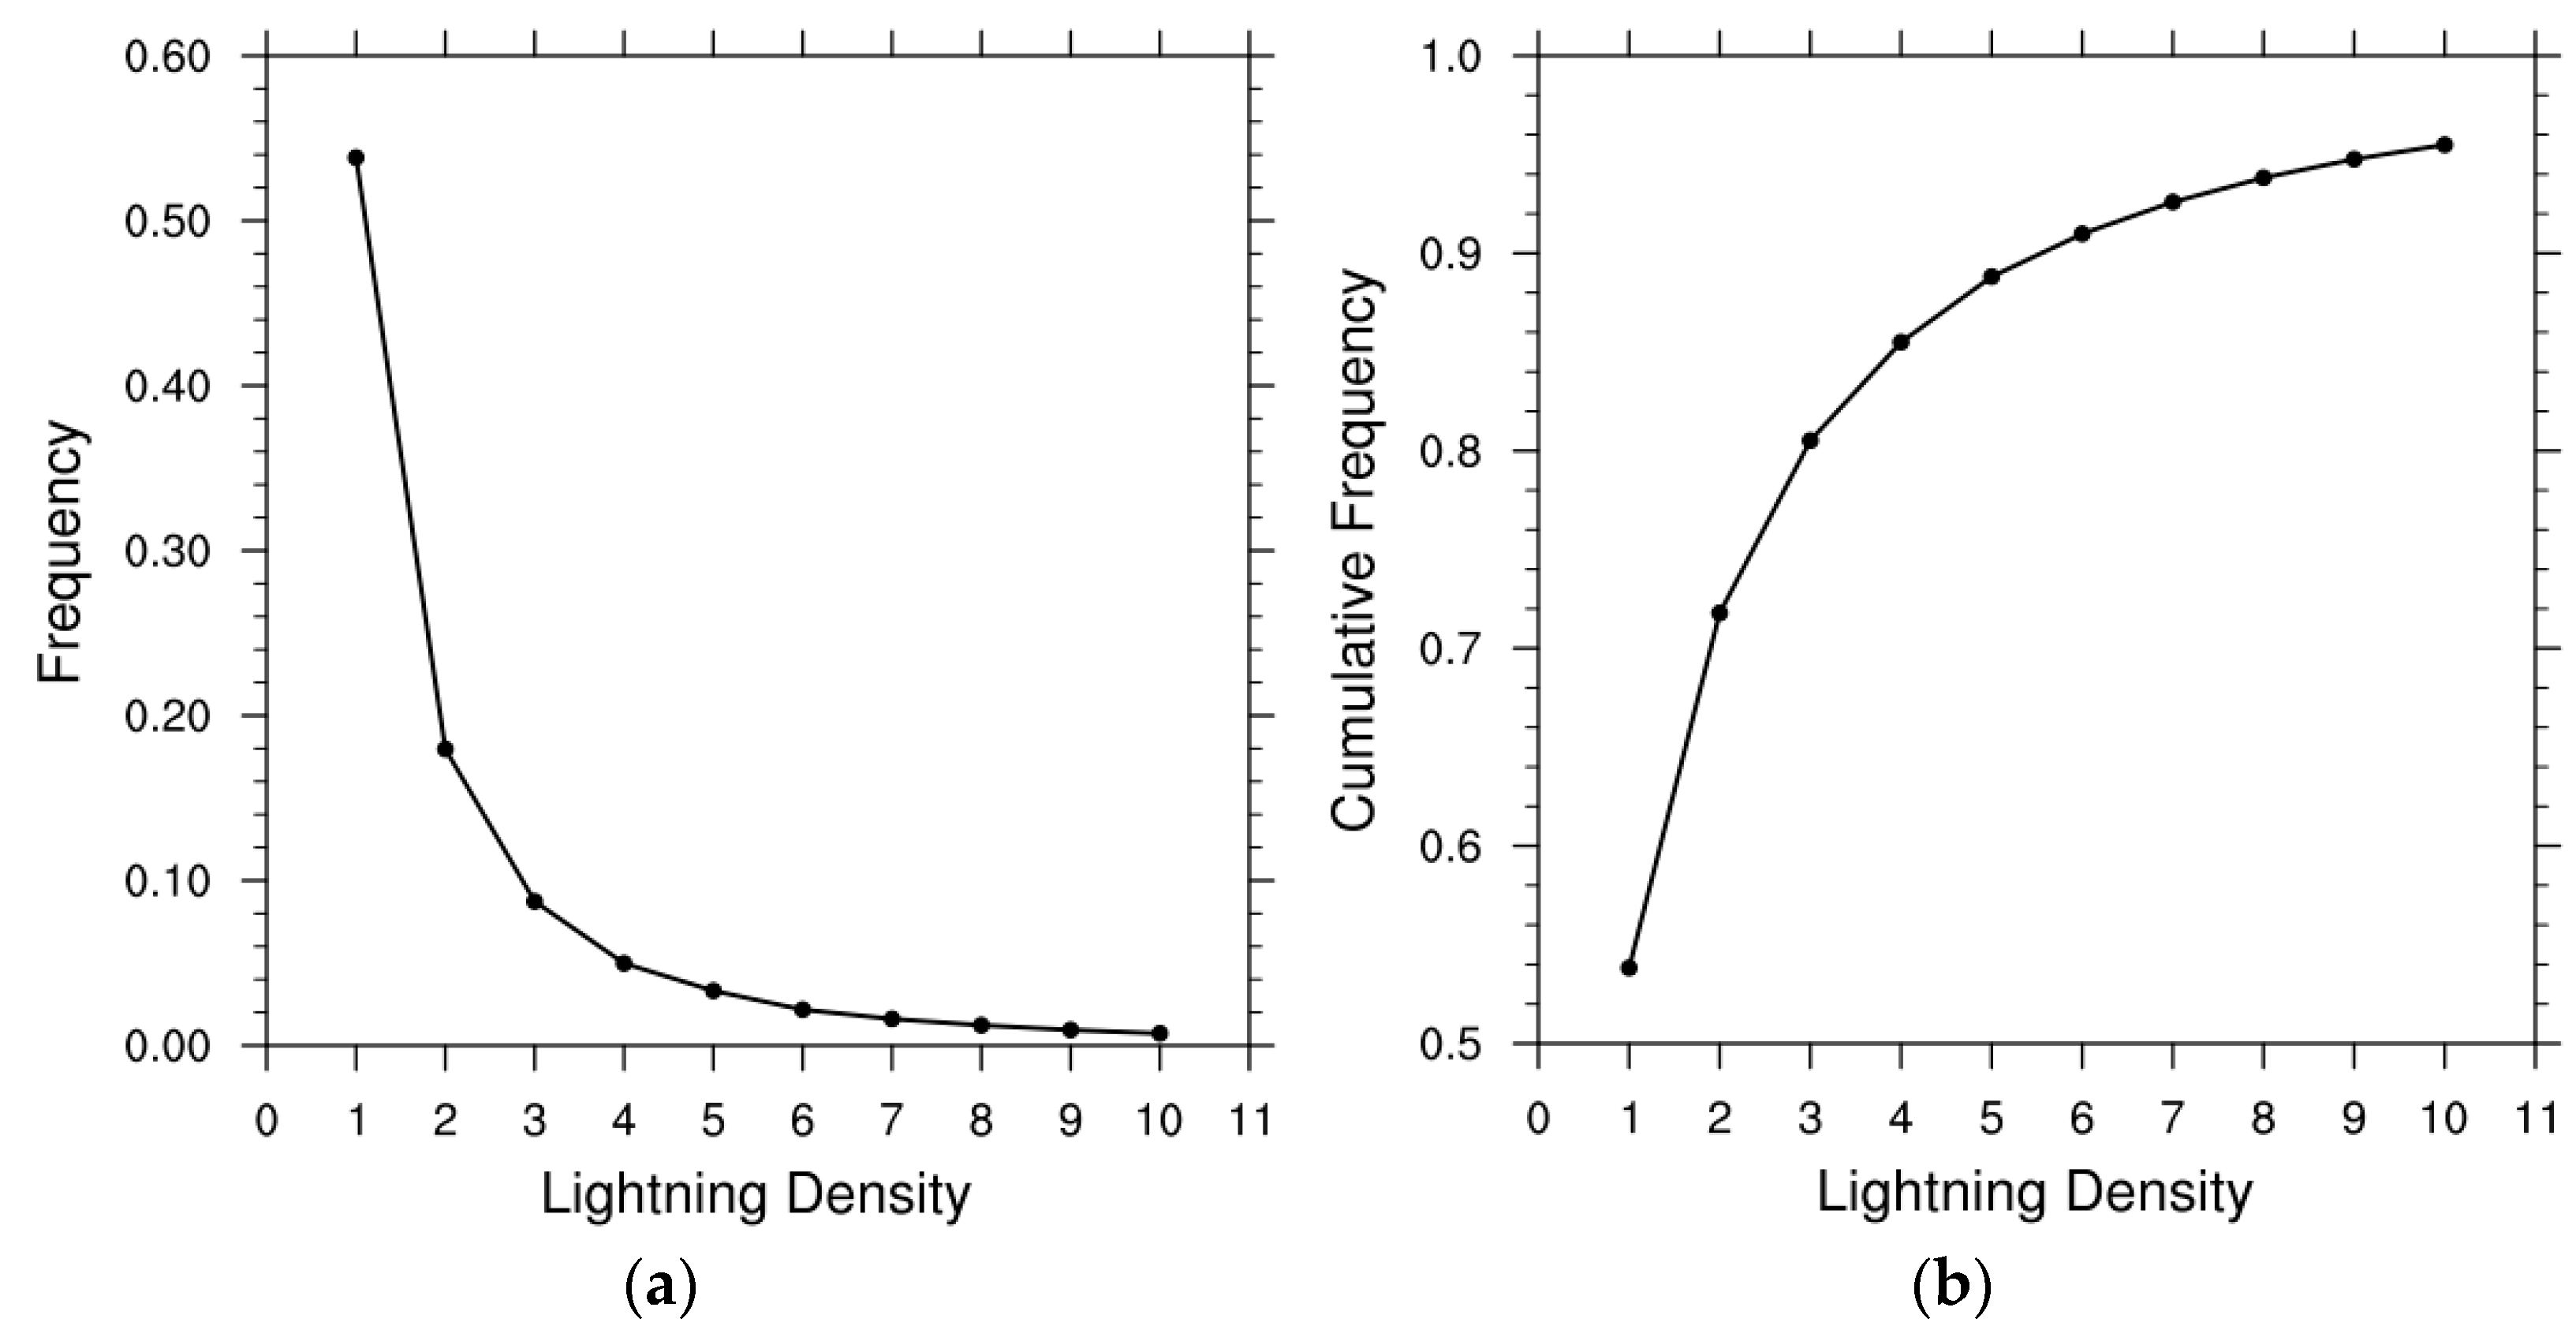
Considering the horizontal resolution of the SWAN product and the definition of lightning density LTG in the empirical GSI relationships, the lightning density is set as the number of LPO records within a radius of 0.08° centered around the grid point of maximum reflectivity during the time windows of 30 min before and 10 min after the whole hour. An analysis of the lightning density in the 2018–2020 warm season indicates that the frequency of lightning density displays an exponentially decreasing trend, with a lightning density of 1 at 53.83% and a lightning density of 9 less than 1% (Figure 2a). When the lightning density is 10, the cumulative frequency reaches 95% (Figure 2b). Thus, the 10 LPO records around a grid point effectively reflect the lightning activity near that grid point and are thus used in the process of constructing the relationship between lightning and maximum proxy reflectivity.
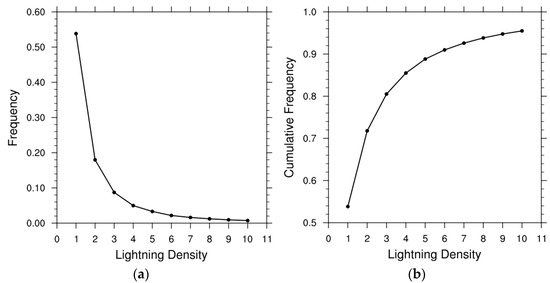
Figure 2.
(a) Frequency of the lightning density. (b) Same as (a) but for the cumulative frequency. The horizontal coordinate is the lightning density, and the vertical coordinate is the frequency (cumulative frequency).
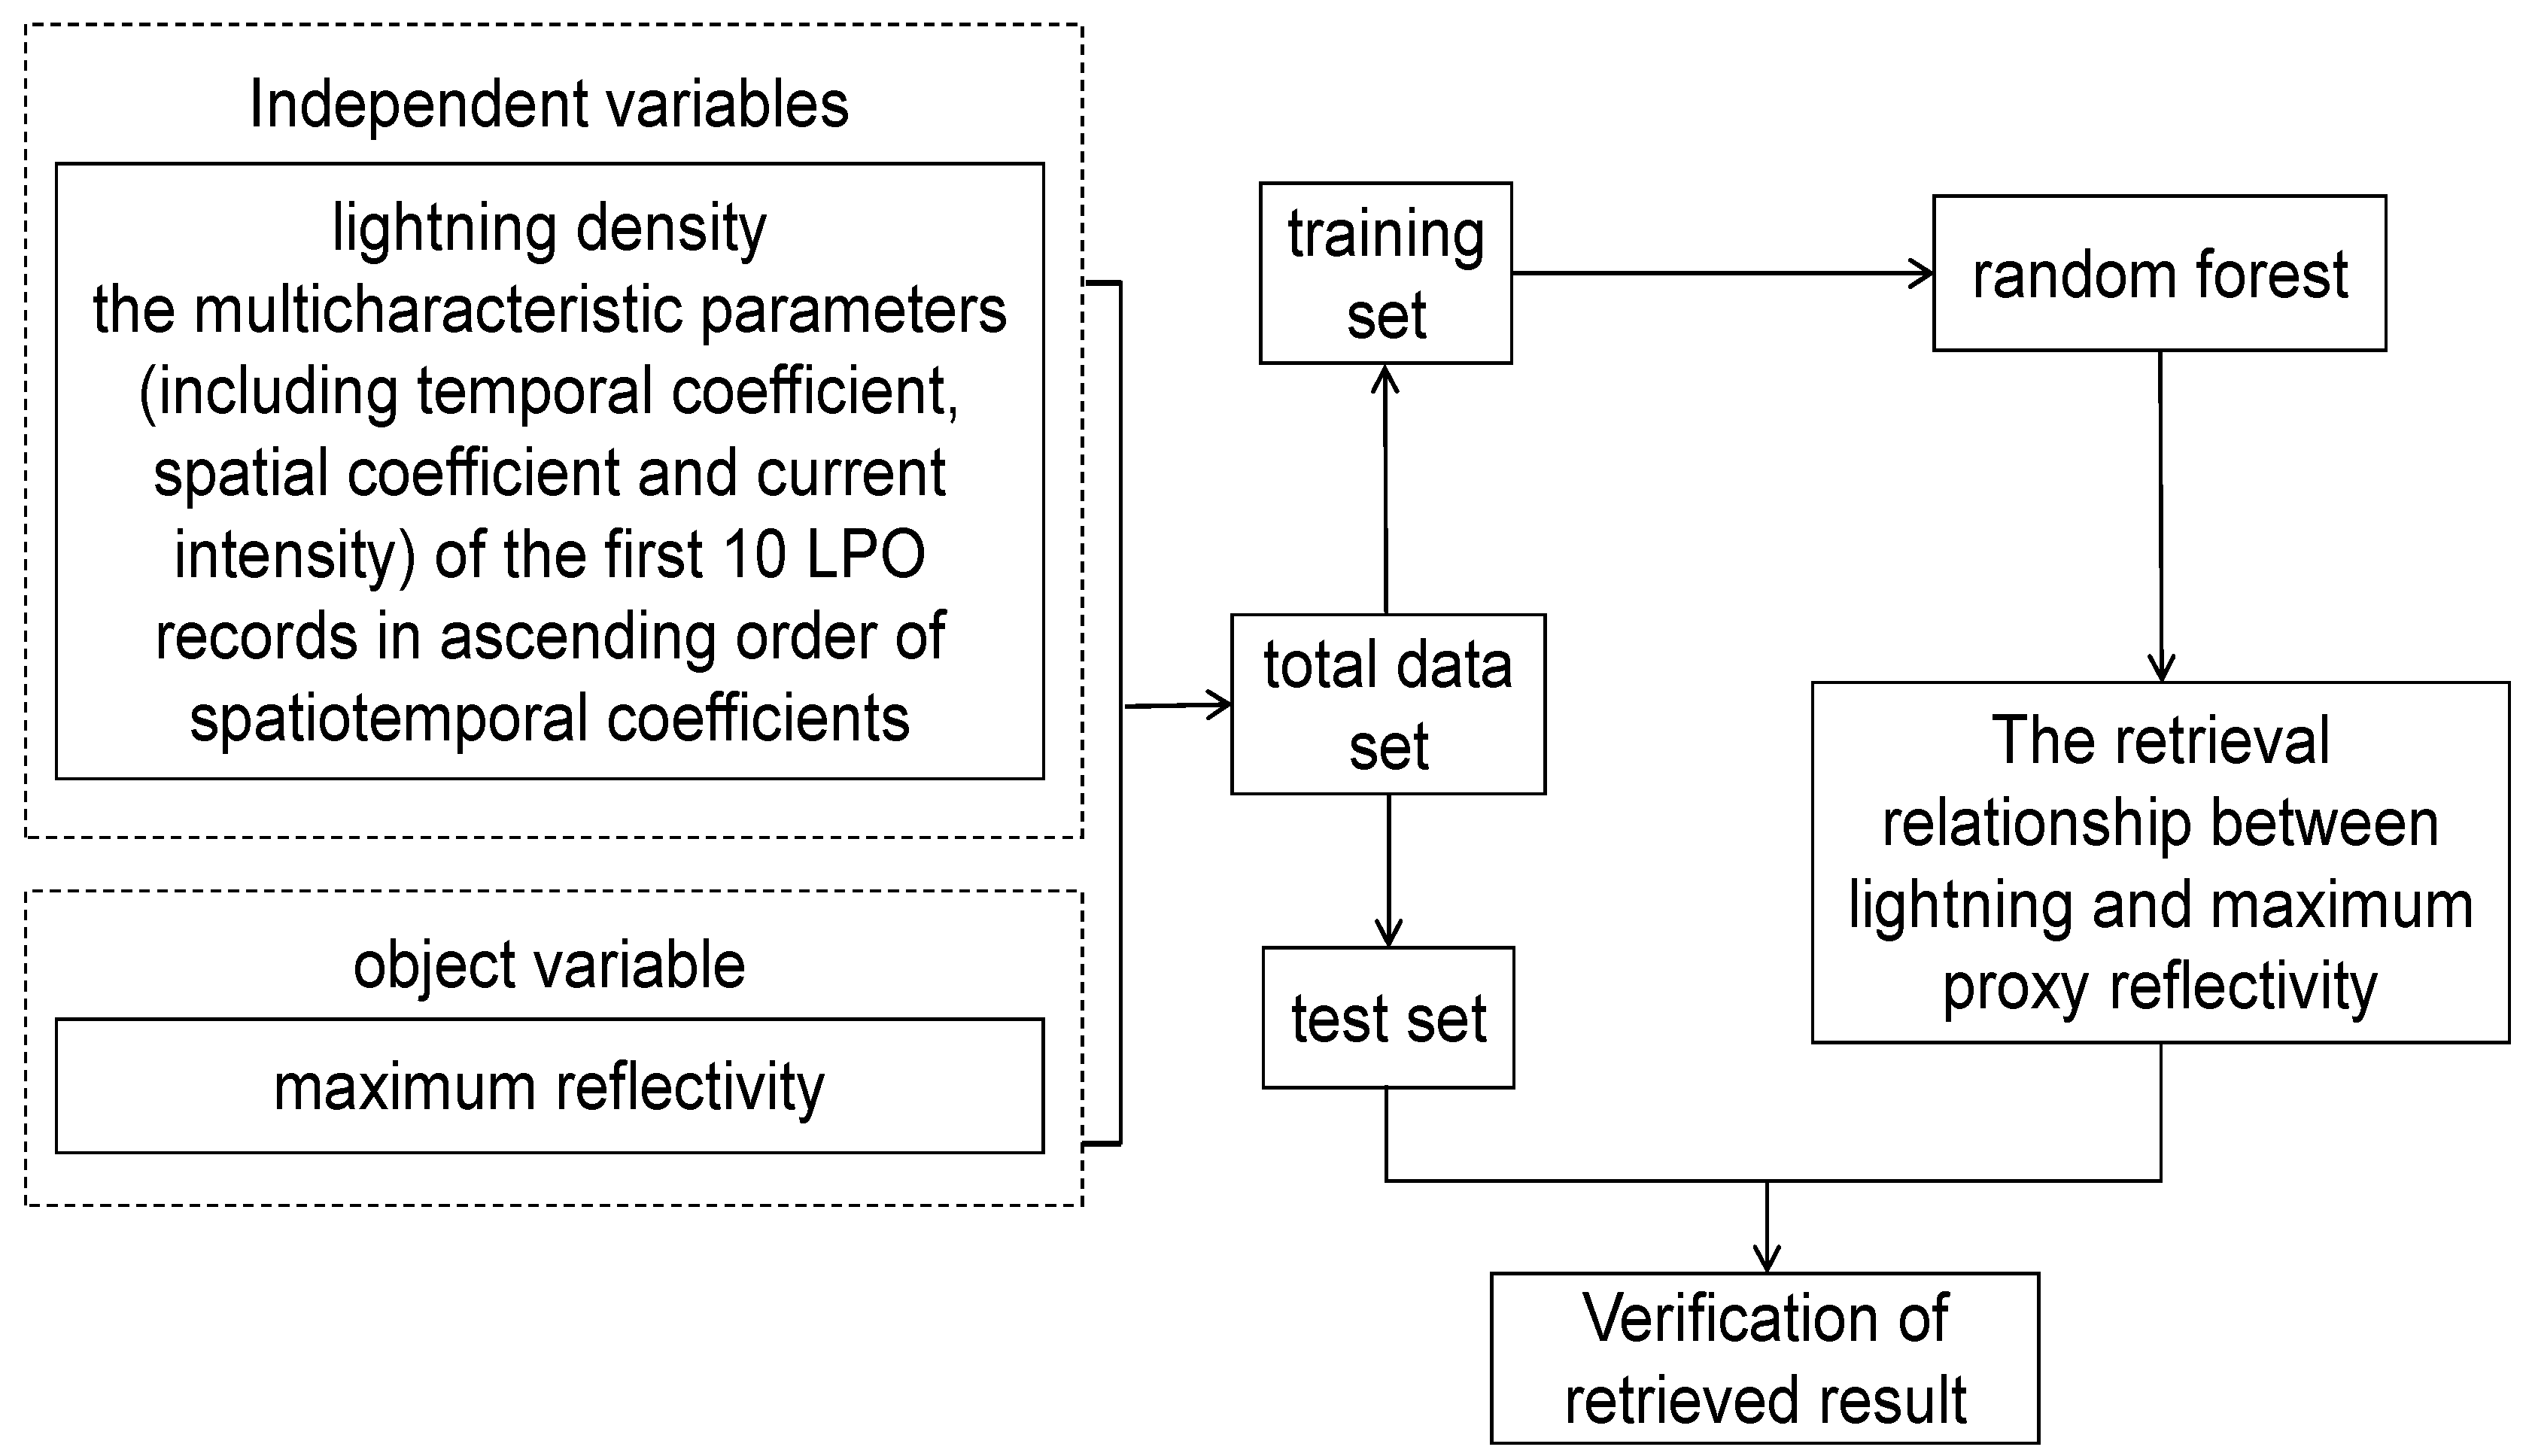
The process of constructing the relationship between lightning and maximum proxy reflectivity is shown in Figure 3. The total data set is constructed using the maximum reflectivity, lightning density, and multi-characteristic parameters of the 10 LPO records. The lightning density and multi-characteristic parameters are used as independent variables, and the maximum reflectivity is used as the object variable. The multi-characteristic parameters include temporal coefficient, spatial coefficient, and current intensity. The 10 LPO records are ranked in ascending order of spatiotemporal coefficient. A portion of the total data set is randomly selected as the test set, and the rest is selected as the training set. The training set and the random forest are used to train the retrieval relationship between lightning and maximum proxy reflectivity, and the test set is used to compare the effect of the new retrieval relationship with that of the empirical GSI relationships. The details are described below.
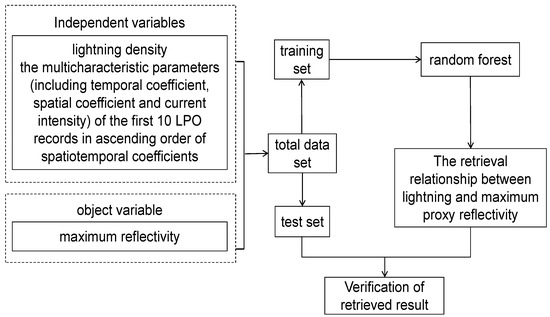
Figure 3.
Process of constructing the relationship between lightning and maximum proxy reflectivity.
Considering the time and location of lightning-related to the maximum reflectivity, a temporal coefficient (tc) and a spatial coefficient (rc) are defined on the basis of the definition of lightning density LTG in the empirical GSI relationships. The temporal coefficient is the difference in time between the time of lightning and the time of maximum reflectivity (on the whole hour) divided by the standardized duration of 30 min. The spatial coefficient is the difference in distance between the location of lightning and the maximum reflectivity grid point divided by the standardized distance of 0.08°. The current intensity is also used to reflect the intensity and polarity of lightning. A spatiotemporal coefficient (trc) is defined to consider the relationship between the time and location of lightning and the maximum reflectivity. The temporal coefficient, spatial coefficient, and spatiotemporal coefficient are calculated with Equations (2)–(4), where tlgt is the time of lightning, tradar is the time of maximum reflectivity, lonlgt is the longitude of the lightning, lonradar is the longitude of the maximum reflectivity grid point, latlgt is the latitude of the lightning, and latradar is the latitude of the maximum reflectivity grid point. The 10 LPO records around a grid point are filtered and arranged in ascending order according to the spatiotemporal coefficients, preserving the multi-characteristic LPO parameters (including temporal coefficient, spatial coefficient, and current intensity) in the process. In addition to the lightning density, the multi-characteristic parameters of 10 LPO records are added to construct a data set that includes 31 independent variables, with maximum reflectivity as the object variable. The total data set obtained for the 2018–2020 warm season contains 780,273 records.
The random forest is an integrated machine-learning algorithm that was proposed by Breiman [50] for solving classification and regression problems. The scikit-learn toolkit in Python covers nearly all mainstream machine-learning algorithms. In this paper, we use RandomForestRegressor, a random forest regressor in the toolkit; the parameter settings are shown in Table 3. A random selection of 134,524 records (approximately 17.24%) from the total data set is used as the test set, and the remaining records are used as the training set. The training set and random forest are used to train the retrieval relationship between lightning and maximum proxy reflectivity, deemed FRST, and the test set is used to compare the retrieval effects of the FRST and empirical GSI relationships (GSI1 and GSI2). A comparative analysis of the FRST, GSI1, and GSI2 results is presented in Section 3.
Table 3.
The parameter settings of the random forest.
2.2.3. Verification Methods
To compare the new retrieval relationship with the empirical GSI relationships, three verification metrics, the correlation coefficient, the root mean square error, and the mean absolute error, are used. The correlation coefficient is calculated to reflect the magnitude of the correlation between the retrieved results and the observed maximum reflectivity. The magnitude of the difference between the retrieved results and the observed maximum reflectivity is measured by root mean square error and mean absolute error. In addition, the ETS and BIAS are used to reflect the retrieval effects of different relationships in different maximum reflectivity intervals. In a given interval, the ETS can vary from poorly retrieved results (when ETS = 0) to optimally retrieved results (when ETS = 1), and the BIAS represents systematic overestimation (when BIAS > 1) or underestimation (when BIAS < 1). We use the above verification metrics to provide a comprehensive evaluation of the retrieval relationships. For example, a high ETS indicates a good retrieval effect only if it is accompanied by a BIAS close to 1, a high correlation coefficient, and a low root mean square error and mean absolute error. The correlation coefficient, root mean square error and mean absolute error are calculated with Equations (5)–(7). Based on the observations and the retrieved results, statistical analysis is conducted using a dichotomous column table (Table 4), and the ETS and BIAS are calculated using Equations (8)–(10). and are the actual observations and retrieved results, and are the means of the actual observations and retrieved results, and N is the number of samples involved in the test.
Table 4.
Dichotomous column table.
3. Results
3.1. Maximum Reflectivity Frequency
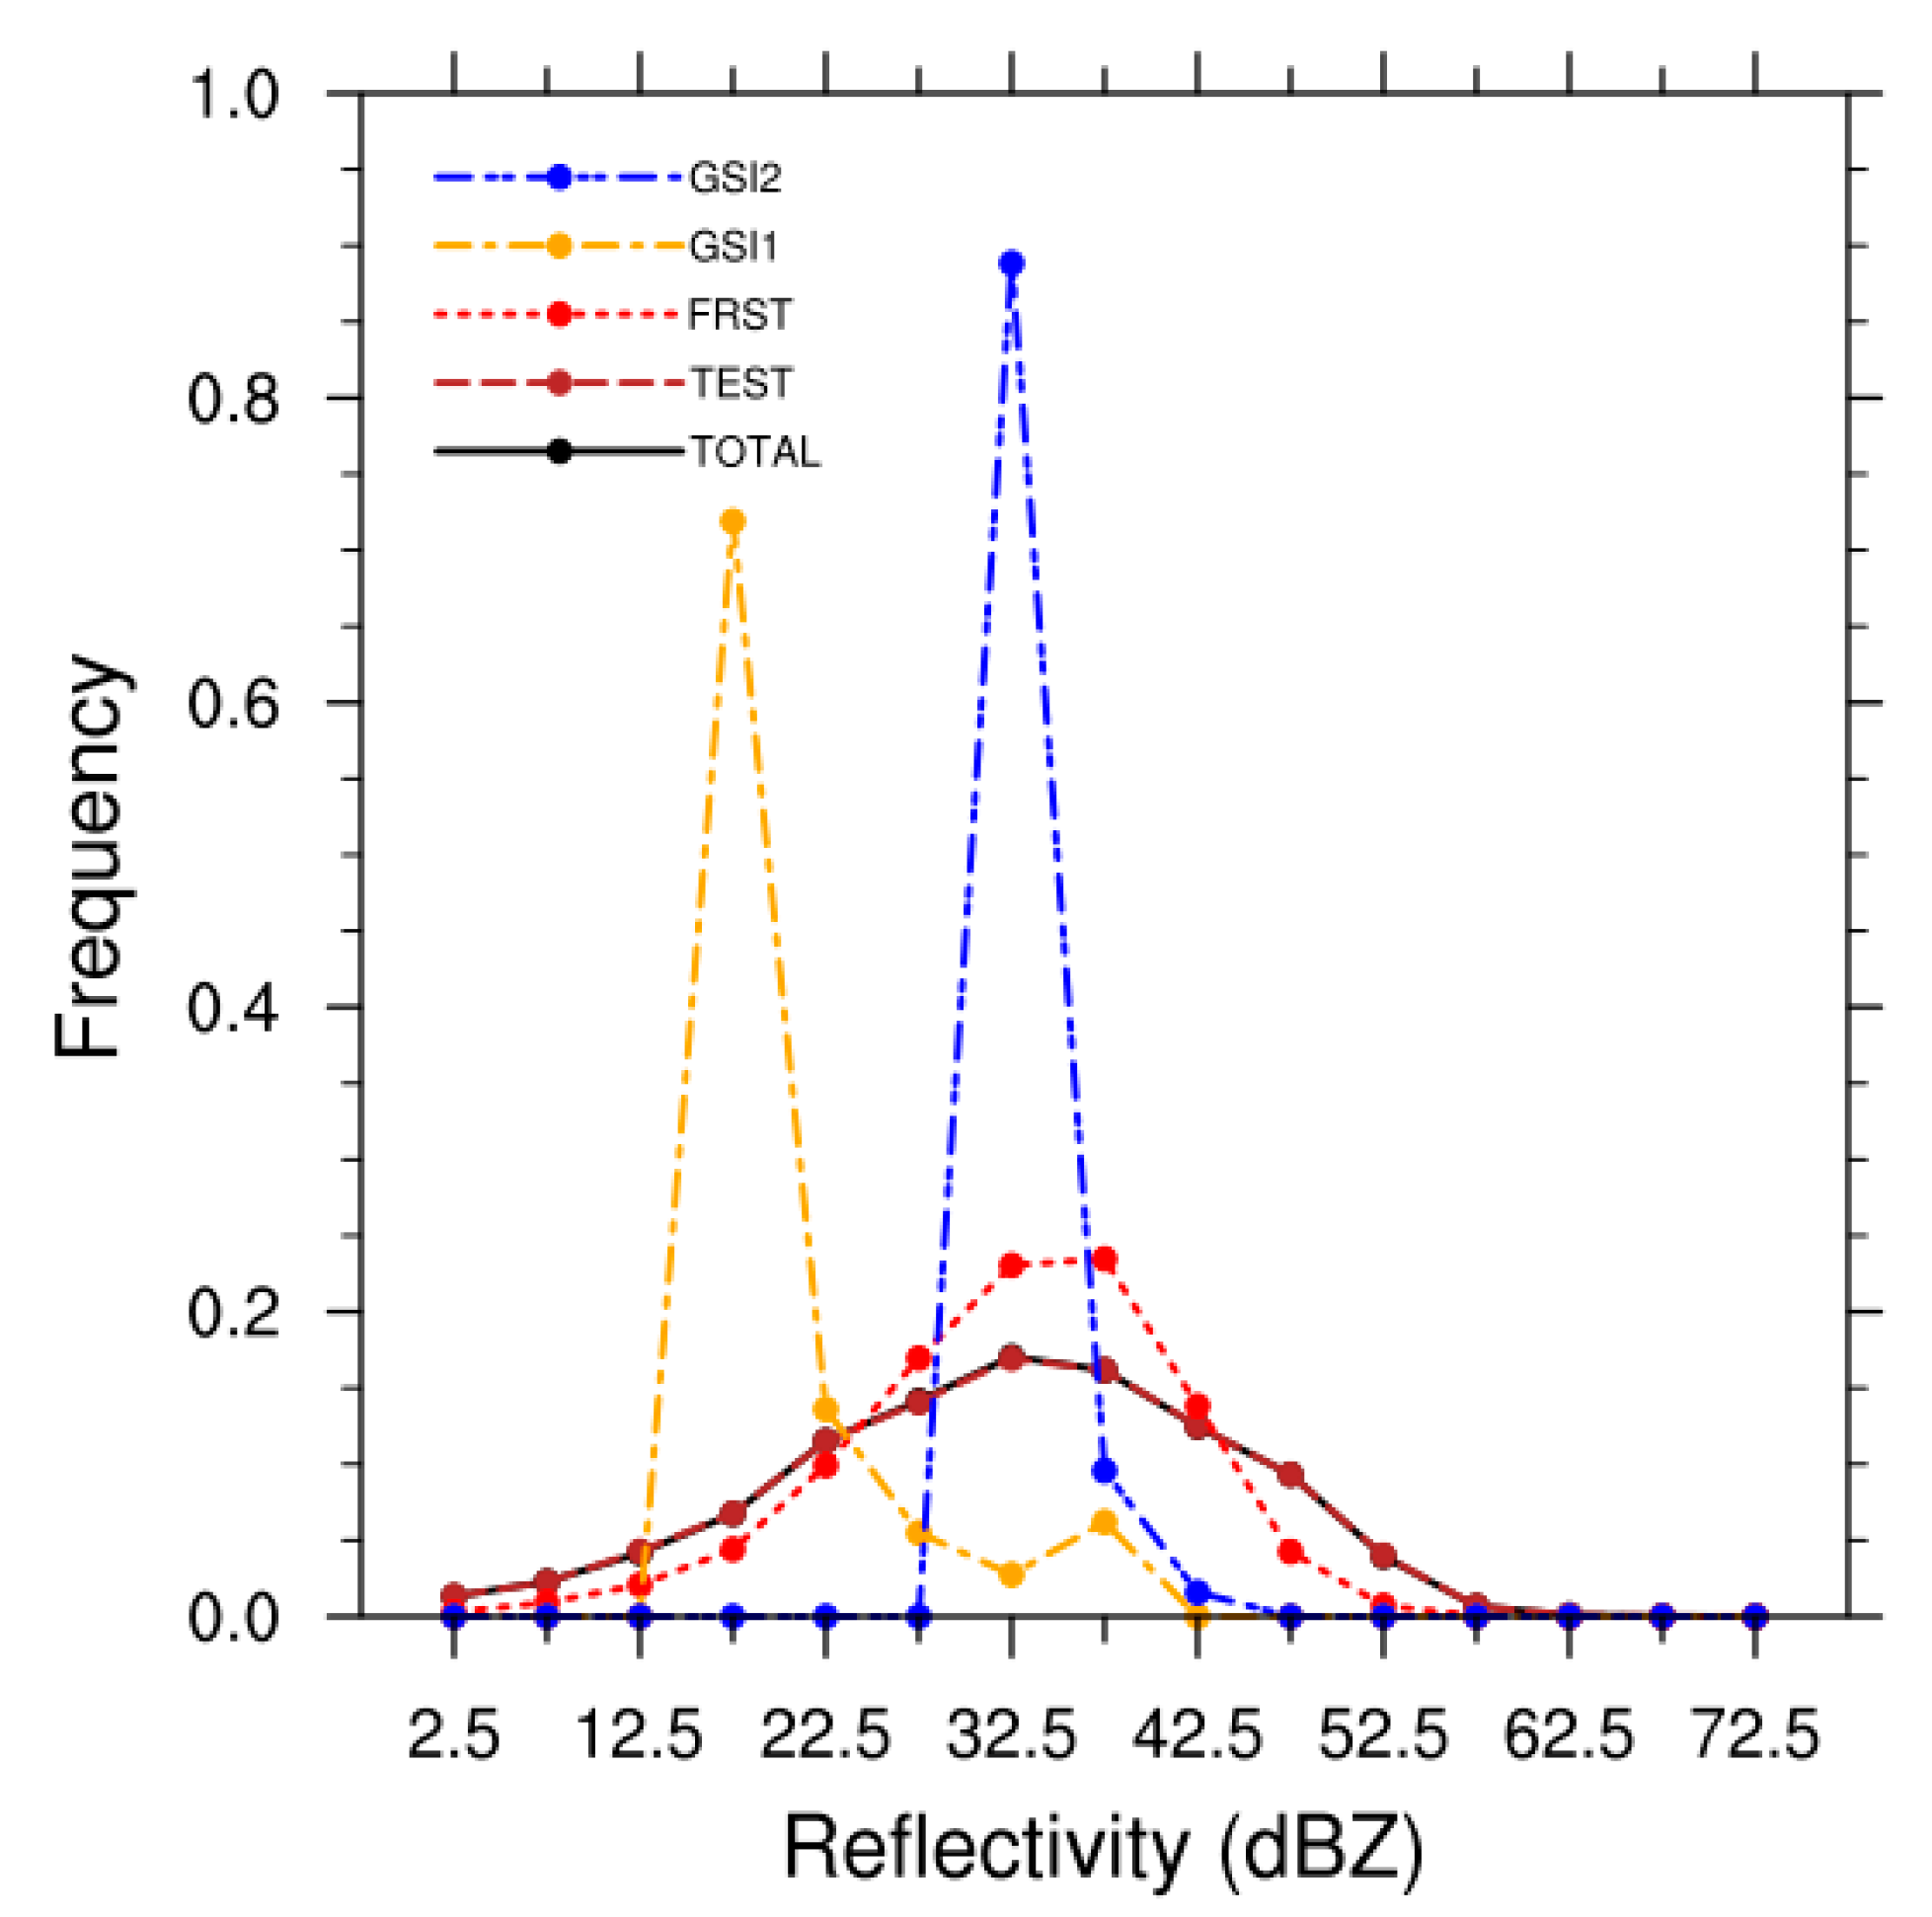
The maximum reflectivity frequency for the total data set and test set versus the maximum proxy reflectivity frequency from the retrieved results of the three relationships are shown in Figure 4. For the total data set, the maximum reflectivity ranges from 0 to 75 dBZ when lightning occurs, with a single-peak structure and a maximum frequency of 17.07% in the (30, 35] dBZ interval (where 32.5 dBZ represents the (30, 35] dBZ interval, and so on for other intervals). The test set reflects the maximum reflectivity frequency distribution of the total data set well. The FRST retrieved result not only reflects the single-peak structure but also indicates a peak interval (35, 40] dBZ similar to the actual peak interval (30, 35] dBZ. However, the frequency is higher in the (25, 45] dBZ interval and lower in other intervals. The GSI1 retrieved result shows a bimodal distribution, with the main peak interval at (15, 20] dBZ and a frequency of 71.92% in this interval, which is a large shift from the actual peak interval at (30, 35] dBZ. Although the GSI2 retrieved result reflects the actual peak interval of (30, 35] dBZ, the frequency is too high (88.85%) in this interval and too low in other intervals. The cumulative frequency of lightning density influences the peak interval and maximum frequency of the GSI1 and GSI2 retrieved results. For the test set, the cumulative frequency is 71.92% when the lightning density is 1~2, and the GSI1 retrieved result calculated from Equation (1) falls within the (15, 20] dBZ interval; the cumulative frequency is 88.85% when the lightning density is 1~5, and the GSI2 retrieved result obtained based on Table 2 is in the (30, 35] dBZ interval. In addition to the lightning density, the FRST relationship encompasses other lightning characteristics related to maximum reflectivity. This is a possible reason why the FRST retrieved result better reflects the single-peak structure and peak interval of the maximum reflectivity frequency.

Figure 4.
Frequency of the observed maximum reflectivity for the total data set (TOTAL) and test set (TEST) versus the FRST, GSI1, and GSI2 retrieved results. The horizontal coordinate is the maximum reflectivity (maximum proxy reflectivity) (unit: dBZ), and the vertical coordinate is the frequency.
3.2. Frequency Distribution of Maximum Reflectivity at Different Lightning Densities
Figure 5a shows the frequency distribution of maximum reflectivity at different lightning densities based on the total data set. For a fixed lightning density, the frequency distribution of the maximum reflectivity displays an unimodal structure, with the highest frequency occurring in the (30, 40] dBZ interval (where 35 dBZ represents the (30, 40] dBZ interval, and so on for other intervals), accounting for more than 30% of that lightning density amount. When lightning activity occurs around a grid point, the maximum reflectivity may be large (above 65 dBZ) or small (below 5 dBZ) at that grid point. The frequency distributions of the maximum reflectivity for the test set and the total data set are approximately the same for different lightning densities (Figure 5a,b). When the lightning density is 1~10, the FRST retrieved results reflect the single-peak structure of the maximum reflectivity frequency distribution, with the maximum frequency in the (30, 40] dBZ interval. However, the frequency is higher in the (30, 40] dBZ interval and lower in the (10, 30] dBZ and (40, 60] dBZ intervals (Figure 5b,c). According to the empirical GSI relationships, the lightning density and the maximum proxy reflectivity exhibit a one-to-one correspondence, such that the GSI1 retrieved result is concentrated in the (10, 20] dBZ, (20, 30] dBZ, and (30, 40] dBZ intervals when the lightning density is 1~2, 3~6, and 7~10, respectively (Figure 5d); the GSI2 retrieved result is concentrated in the (30, 40] dBZ interval when the lightning density is 1~10 (Figure 5e). For a given lightning density, the retrieved results of the empirical GSI relationships occur only within a fixed interval and not within other intervals, resulting in a frequency that is too high or too low (Figure 5b,d,e). Compared to the GSI1 and GSI2 retrieved results, the FRST retrieved results better reflect the frequency distribution structure and peak interval of the actual maximum reflectivity at different lightning densities.
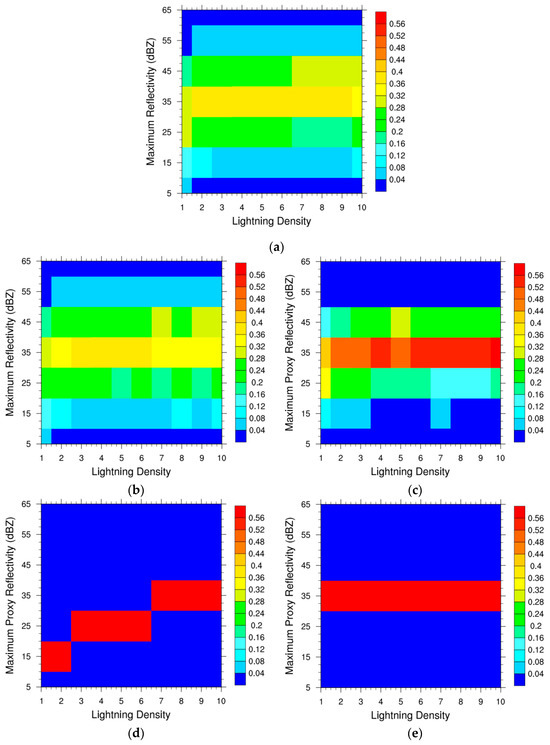
Figure 5.
(a) Frequency distribution of the maximum reflectivity at different lightning densities for the total data set. (b) Same as (a) but for the test set. (c) Same as (a) but for the FRST retrieved results. (d) Same as (a) but for the GSI1 retrieved results. (e) Same as (a) but for the GSI2 retrieved results. The horizontal coordinate is the lightning density, and the vertical coordinate is the maximum reflectivity (maximum proxy reflectivity) (unit: dBZ).
3.3. Verification
3.3.1. Correlation Coefficient
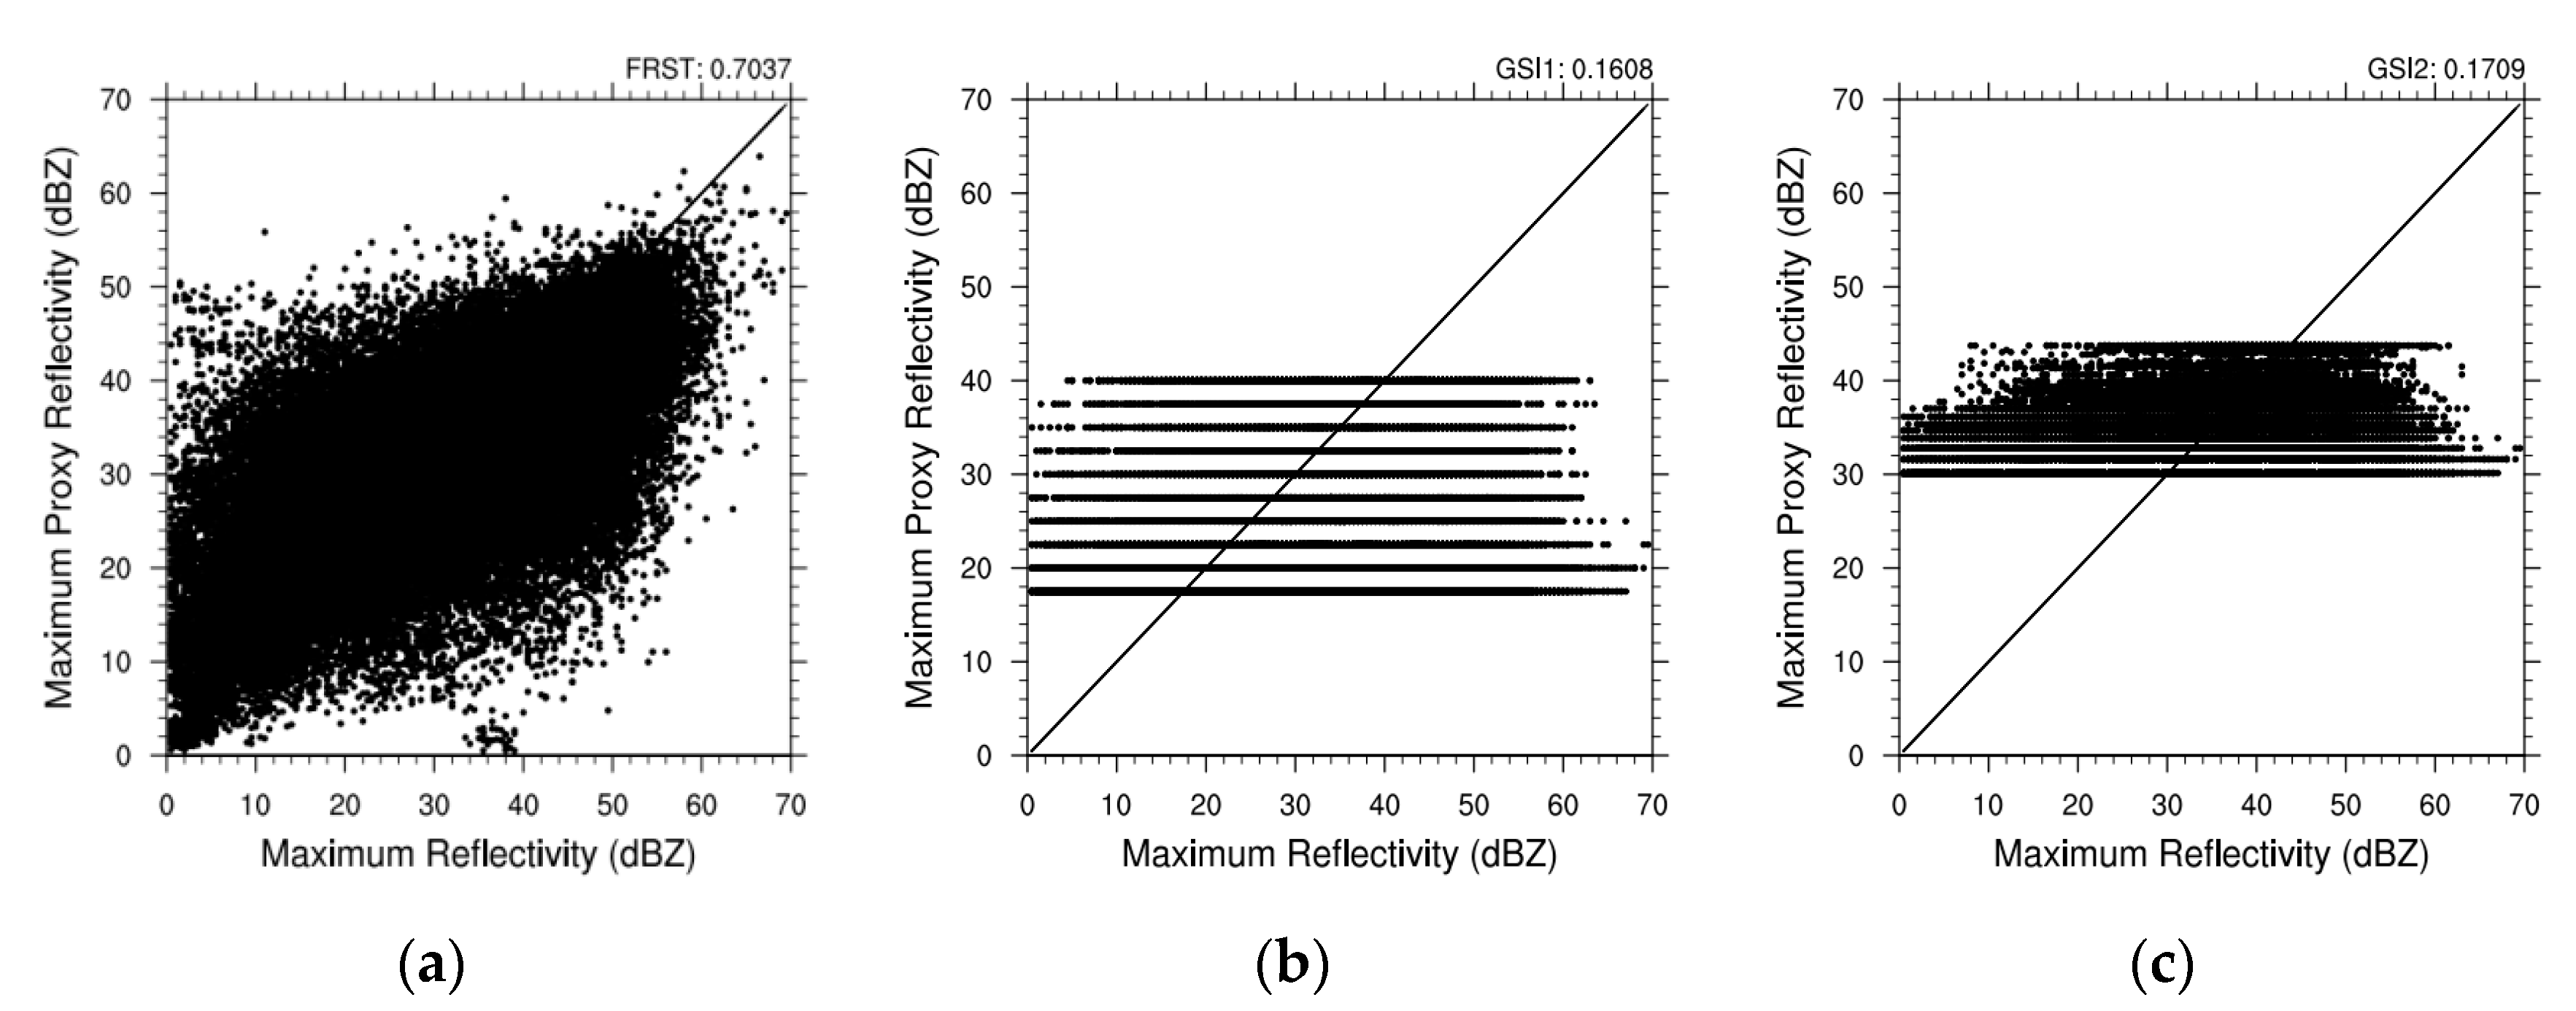
The maximum proxy reflectivity is retrieved from the test set, and the correlation coefficient between it and the observed maximum reflectivity is calculated. The comparison indicates that the correlation between the FRST retrieved result and the observed maximum reflectivity is the best. The correlation coefficients for GSI1 and GSI2 are comparable at 0.1608 and 0.1709, respectively, and the correlation coefficient for FRST is 0.7037 (Figure 6). The correlation coefficient for FRST is 3.38 and 3.12 times higher than those for GSI1 and GSI2, respectively. The empirical GSI relationships use only lightning density to construct a retrieval relationship for the maximum proxy reflectivity. Figure 5a shows that the lightning density alone does not fully reflect this relationship. Even when the lightning density is 1, the maximum reflectivity may be large (above 65 dBZ). It is not sufficient to consider only the lightning density when constructing a retrieval relationship between lightning and maximum proxy reflectivity. Unlike empirical GSI relationships, the FRST relationship adds other lightning features linked to maximum reflectivity, which improves the correlation coefficient.
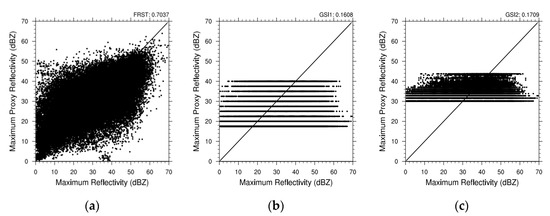
Figure 6.
(a) Scatter plot of the observed maximum reflectivity compared with the FRST retrieved results. (b) Same as (a) but for the GSI1 retrieved results. (c) Same as (a) but for the GSI2 retrieved results. The horizontal coordinate is the observed maximum reflectivity (unit: dBZ), and the vertical coordinate is the maximum proxy reflectivity (unit: dBZ).
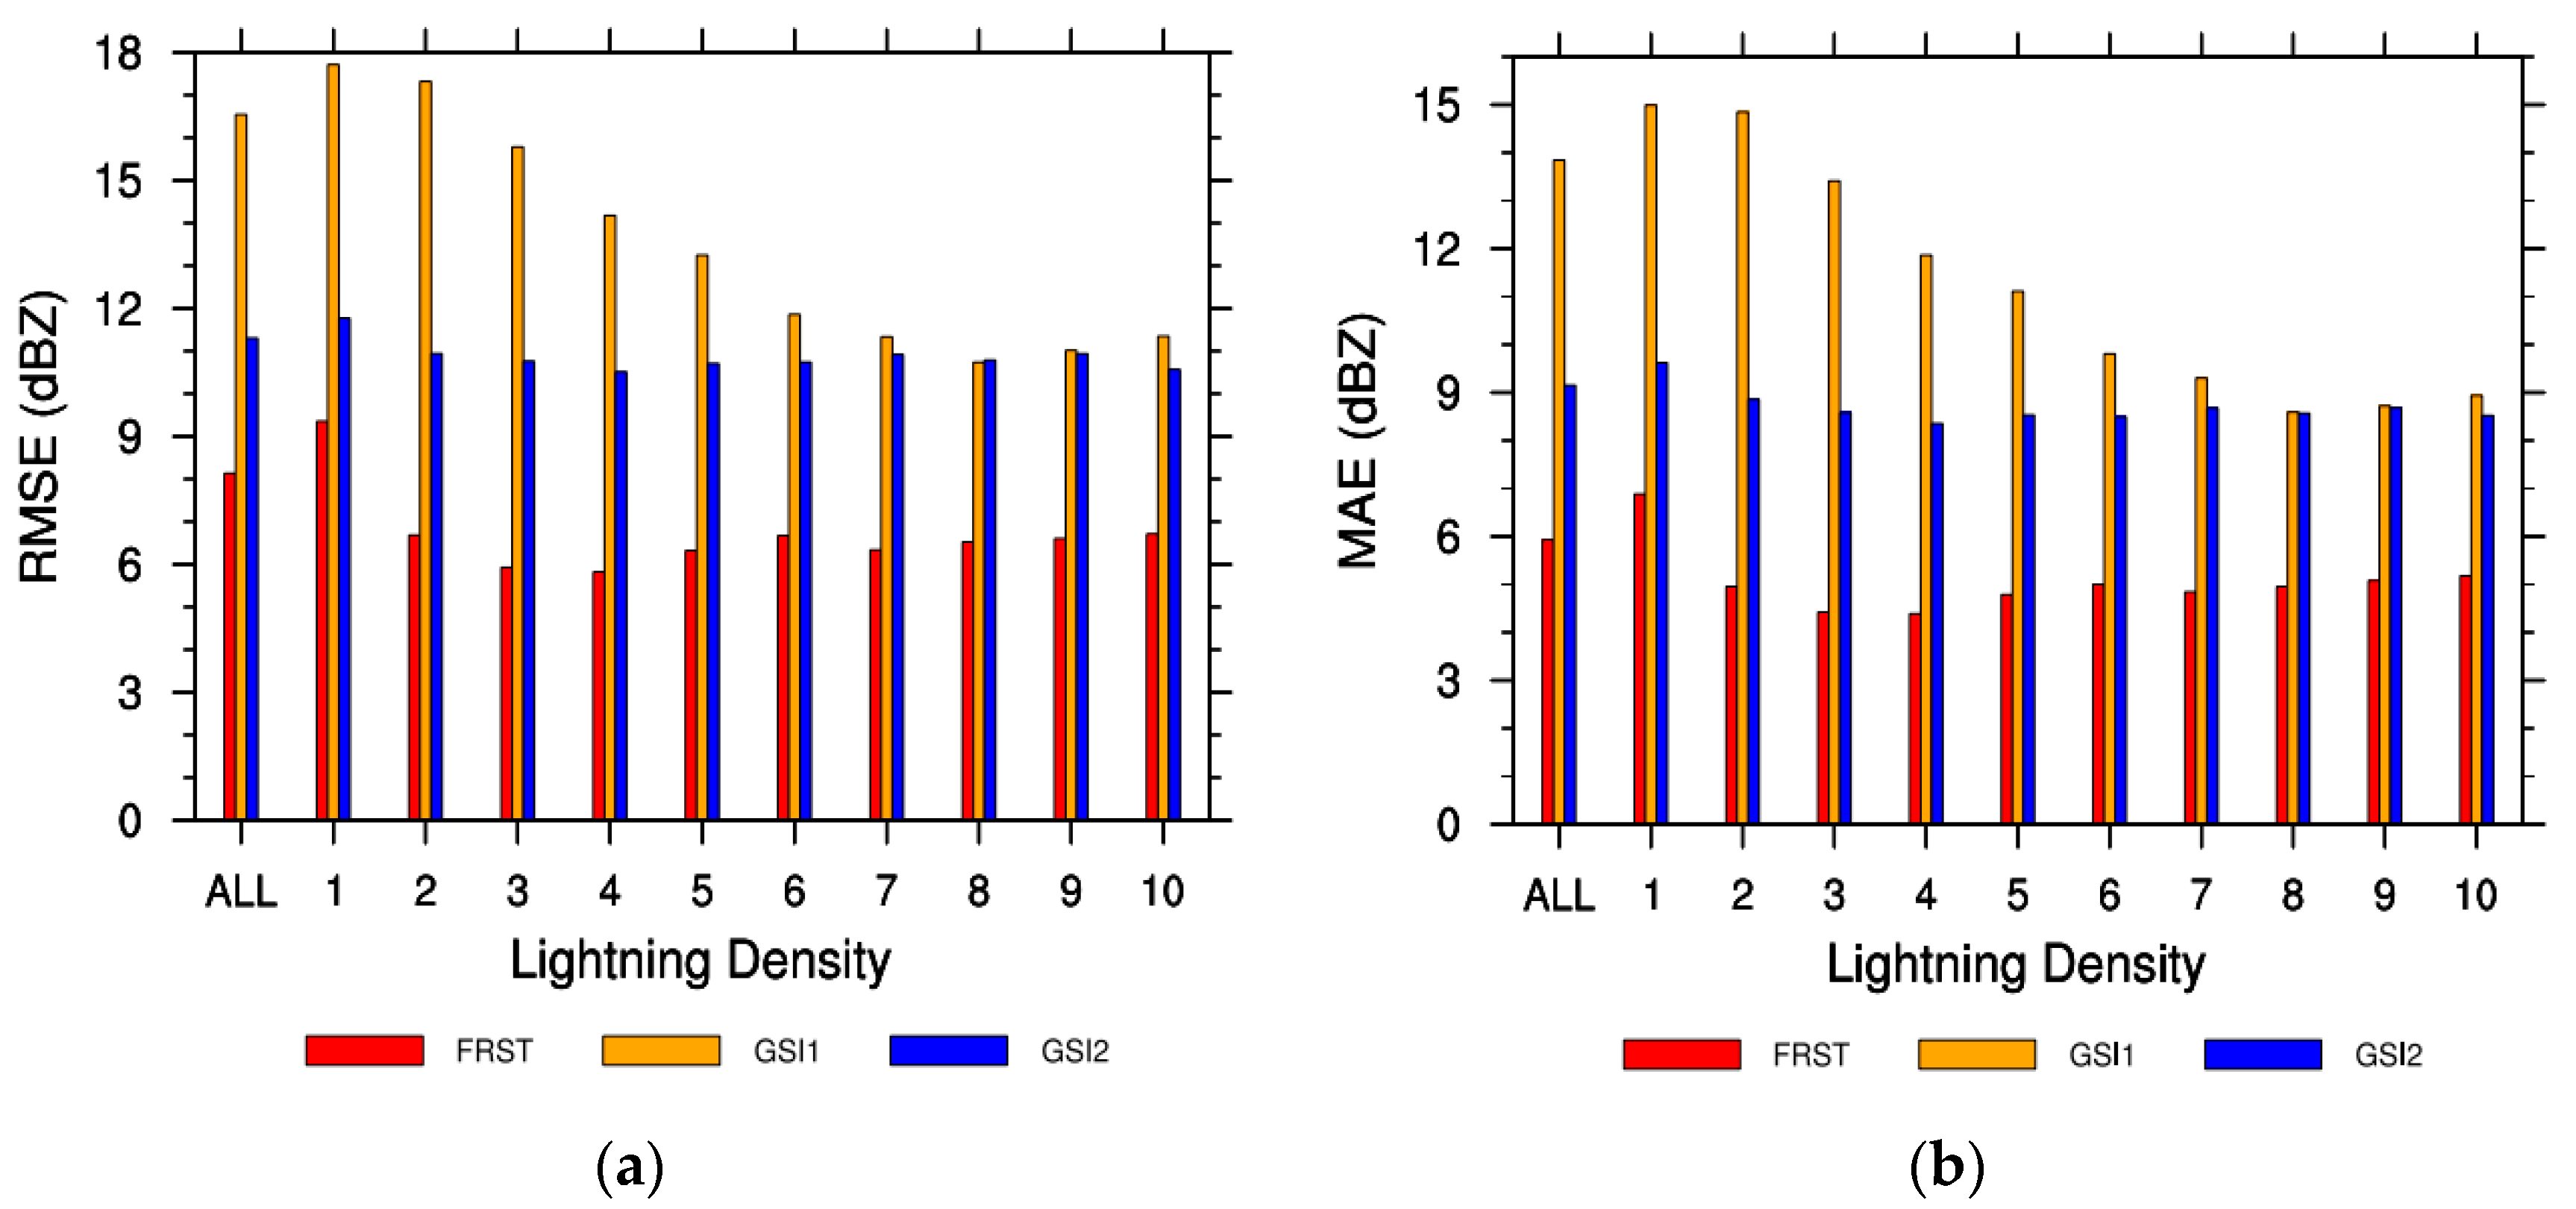
3.3.2. Root Mean Square Error and Mean Absolute Error
The root mean square error and mean absolute error of the FRST are smaller than those for the GSI1 and GSI2; notably, the root mean square error of FRST (8.13 dBZ) is 50.85% and 28.05% lower, respectively (Figure 7a). Additionally, the mean absolute error of the FRST (5.93 dBZ) is 57.15% and 35.19% lower than that of GSI1 (13.84 dBZ) and GSI2 (9.15 dBZ), respectively (Figure 7b). Both the root mean square error and mean absolute error of the FRST are also smaller than those of the empirical GSI relationships at each fixed lightning density (Figure 7a,b). Thus, considering more lightning characteristics, i.e., more complicated relationships, and learning the retrieval relationship with a machine learning method instead of the traditional fitting method could be the reason for the reduced root mean square error and mean absolute error in FRST.
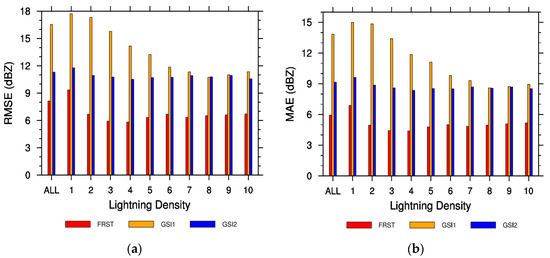
Figure 7.
(a) Root mean square errors of the FRST, GSI1, and GSI2 retrieved results with respect to the observed maximum reflectivity. (b) Same as (a) but for the mean absolute error. The horizontal coordinate is the lightning density, and the vertical coordinate is the root mean square error (mean absolute error) (unit: dBZ). ALL represents all lightning densities, with 1 to 10 corresponding to the corresponding lightning density.
3.3.3. ETS and BIAS
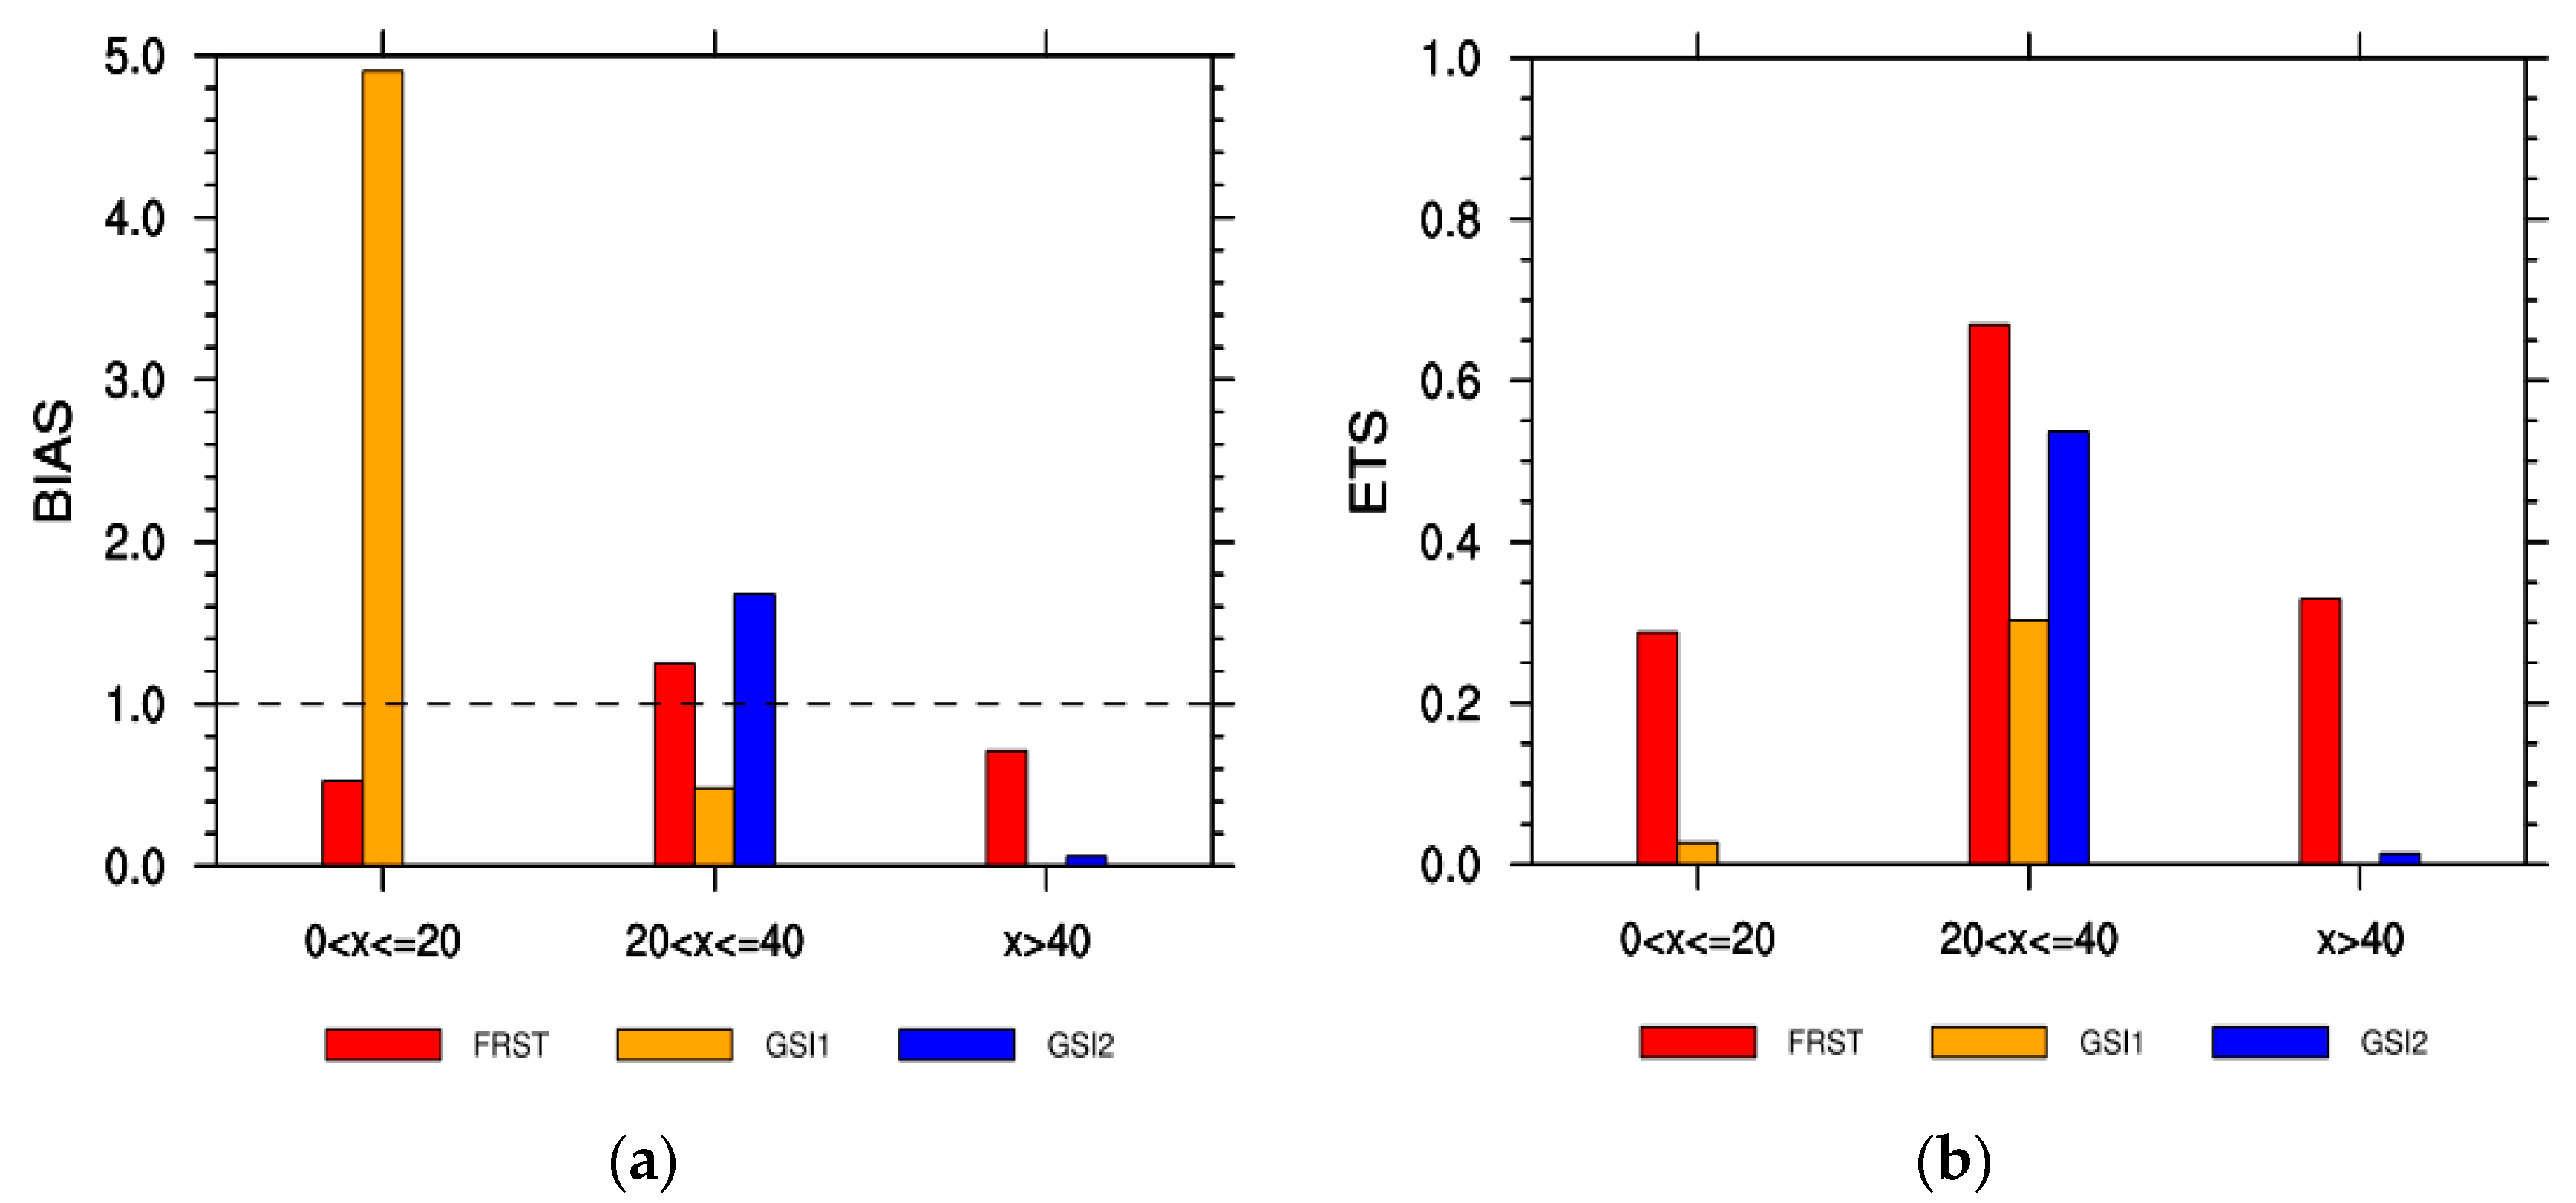
In previous studies, the regions with maximum reflectivity of 20–40 dBZ and >40 dBZ are defined as stratiform and convective cloud regions, respectively [51,52,53,54]. In this paper, maximum reflectivity is divided into three intervals, namely, (0, 20] dBZ, (20, 40] dBZ, and >40 dBZ, and BIAS and ETS are calculated in different intervals. Overall, the FRST is the best of the three relationships (Figure 8).

Figure 8.
(a) BIAS for the FRST, GSI1, and GSI2 retrieved results at intervals of (0, 20] dBZ, (20, 40] dBZ and >40 dBZ. (b) Same as (a) but for ETS.
The BIAS of the FRST is closest to 1 in the different intervals. At intervals of (0, 20] dBZ, (20, 40] dBZ and >40 dBZ, the BIAS of the FRST are 0.5250, 1.2508 and 0.7087, respectively, the BIAS of the GSI1 are 4.9038, 0.4784 and 0, respectively, and the BIAS of the GSI2 are 0, 1.6766, and 0.0593, respectively (Figure 8a). Although the FRST is overestimated in the (20, 40] dBZ interval and underestimated in the other intervals, it is more reasonable in the three intervals. The BIAS of the three relationships for the different intervals is consistent with the results of previous analyses of the maximum reflectivity frequency and the maximum reflectivity frequency distribution at different lightning densities (Figure 4 and Figure 8a; Figure 5 and Figure 8a).
The FRST displays the highest ETS. In the intervals of (0, 20] dBZ, (20, 40] dBZ, and >40 dBZ, the ETS are 0.2875, 0.6693, and 0.3285 for the FRST, 0.0268, 0.3027, and 0 for the GSI1, and 0, 0.5364 and 0.0134 for the GSI2, respectively (Figure 8b). For all three intervals, the FRST displays the highest retrieval skill, and the GSI1 and GSI2 perform well only in the (20, 40] dBZ interval.
The GSI1 cannot retrieve the maximum proxy reflectivity at >40 dBZ and completely misses in this interval. The cumulative frequency of lightning densities from 1~2 is 71.92%, corresponding to the frequency of the GSI1 retrieved results in the (0, 20] dBZ interval (Figure 4); however, the maximum reflectivity is mainly in the (20, 40] dbZ interval in reality (Figure 5b), indicating that the GSI1 excessively overestimates in the (0, 20] dBZ interval. Although the hit rate is high in the (0, 20] dbZ interval, excessive overestimation results in a low ETS for the GSI1 in this interval. The GSI2 retrieved results range from 30.13 to 43.74 dBZ, with complete misses and no skill in the (0, 20] dbZ interval. Only 1.58% of the GSI2 retrieved results (when the lightning density > 18) are in the >40 dBZ interval, with a low hit rate, severe misses, and low ETS. Possibly due to considering more lightning features, the FRST retrieved results are closer to the observed maximum reflectivity (Figure 7b), and the ETS and BIAS of the FRST are the best in all three intervals.
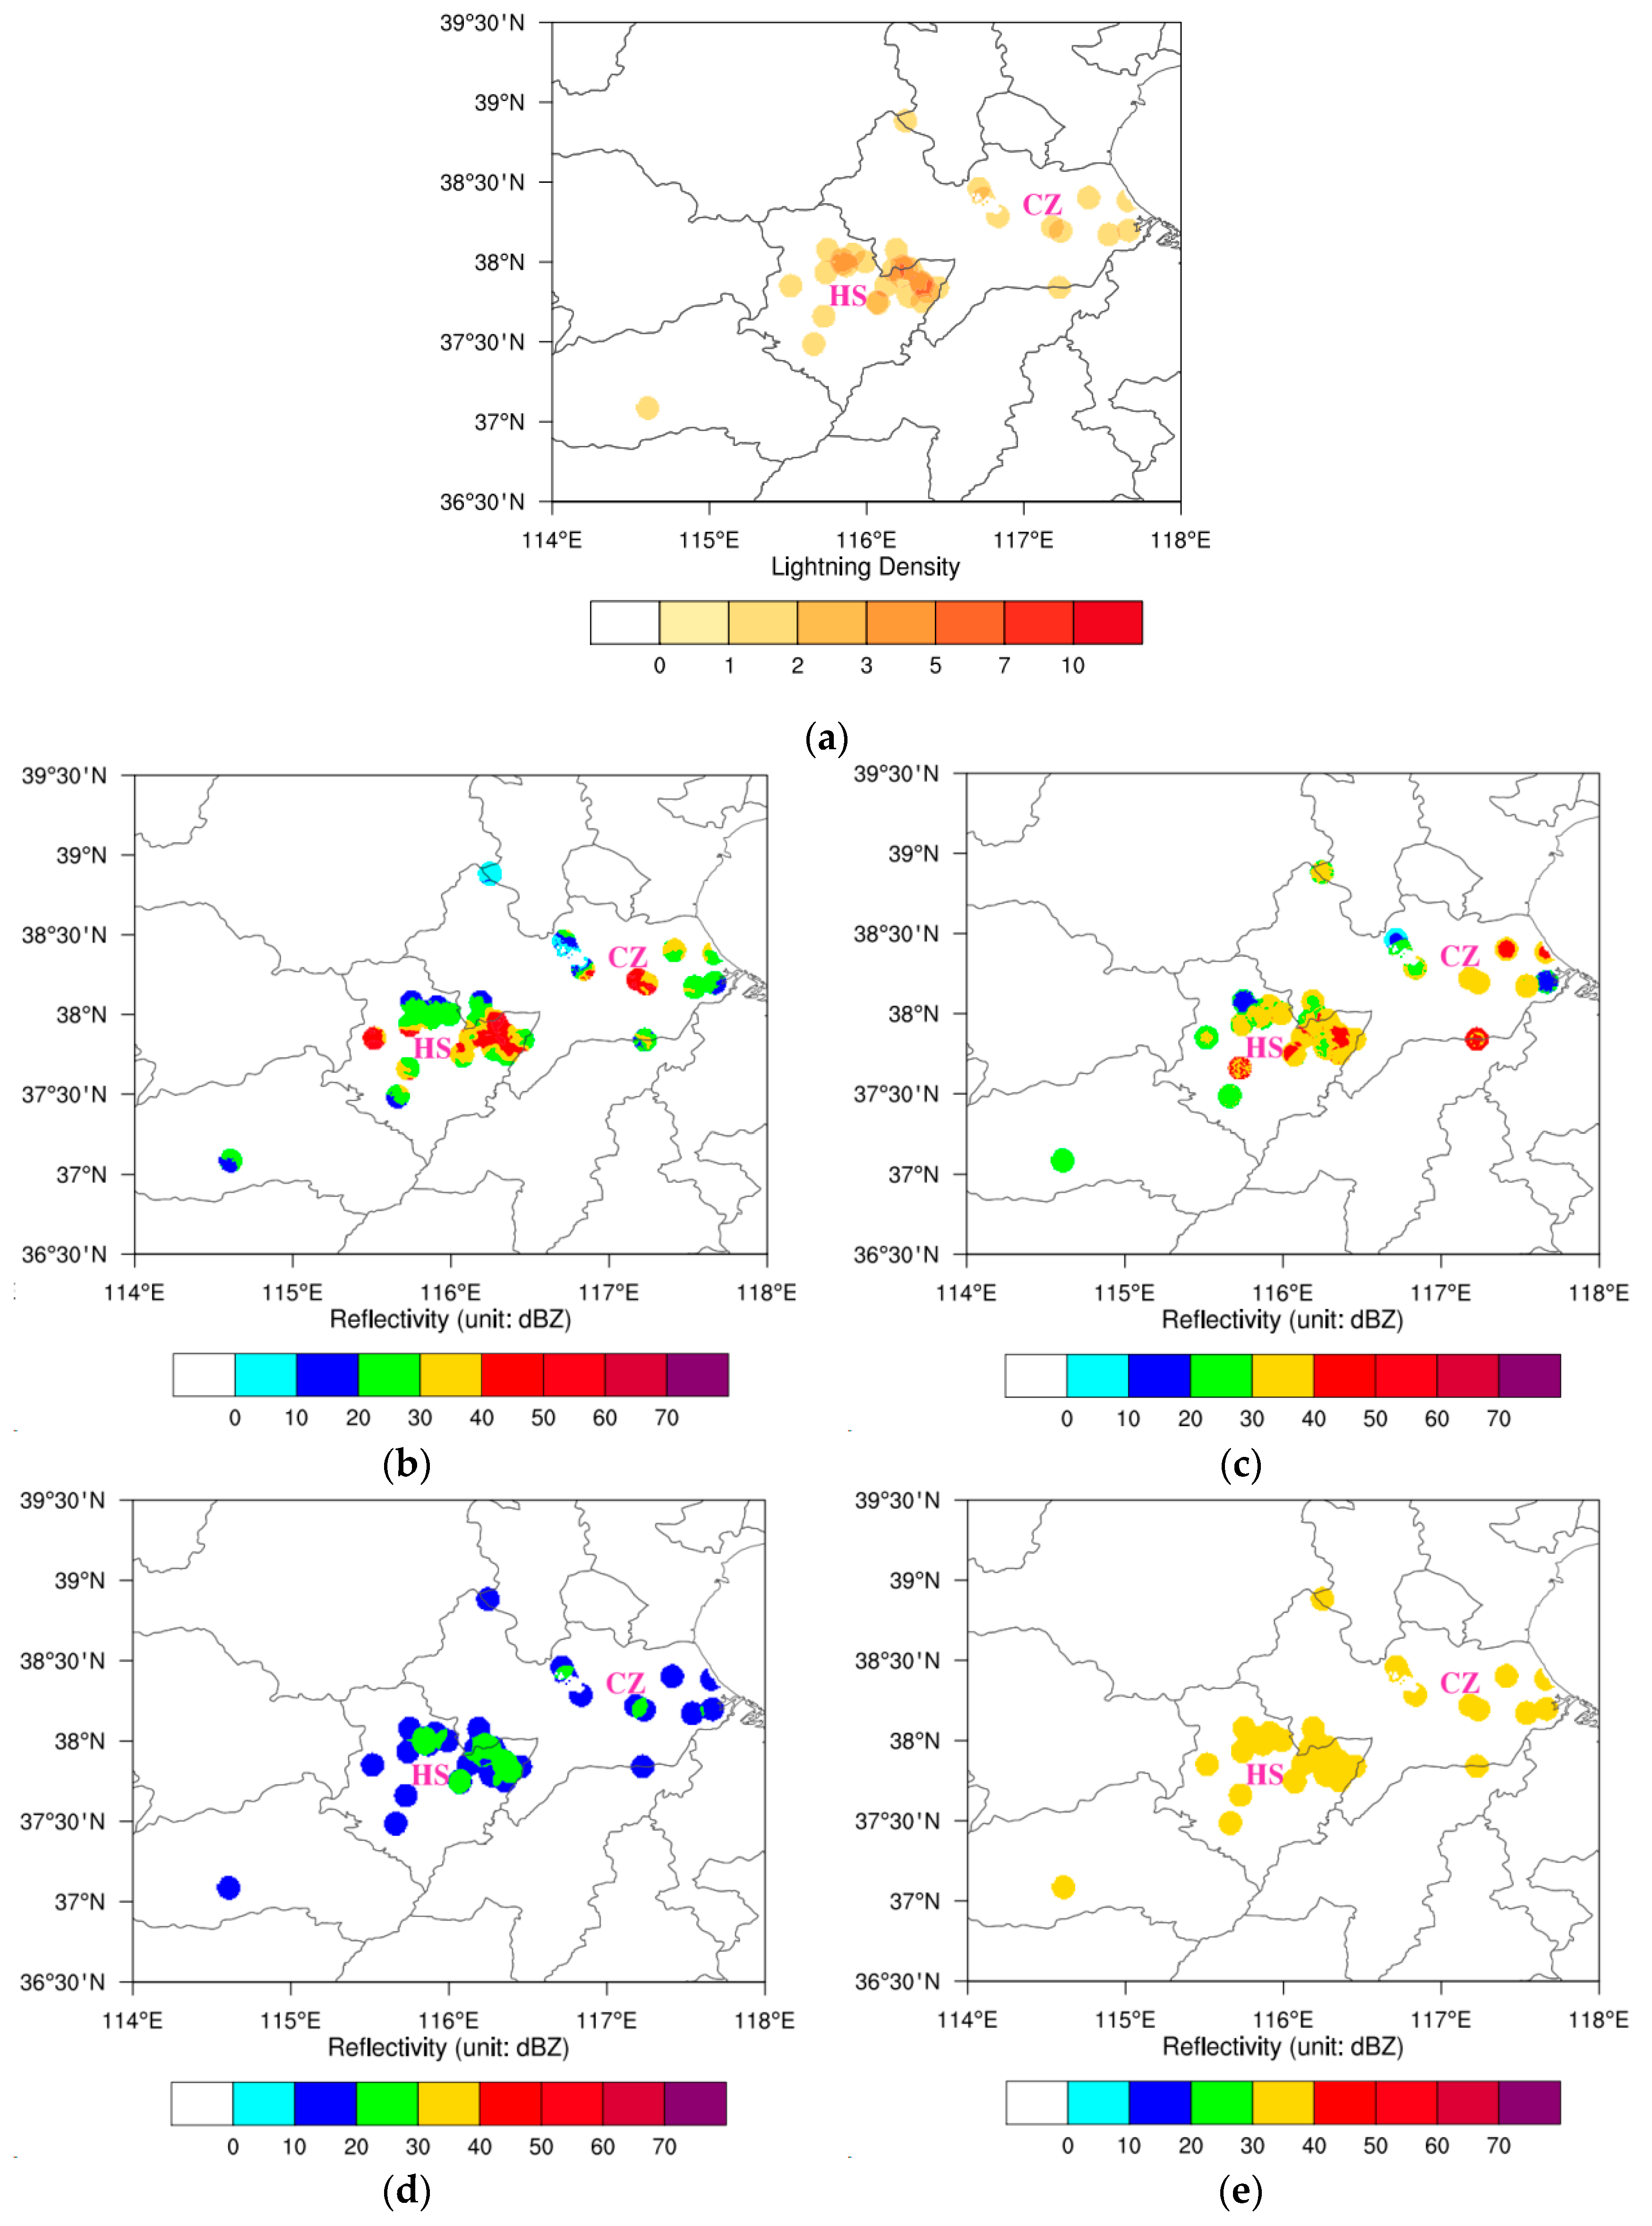
3.4. Test Case
To visualize the effects of the three relationships, a convective process at 14:00 UTC on 7 June 2022 is selected for comparative analysis. The results show that the FRST works best for this individual case. Two centers of strong maximum reflectivity were present at this time in Cangzhou City and Hengshui City, with intensities greater than 40 dBZ, and lightning was active near these strong centers (Figure 9). The lightning density distribution at this time is shown in Figure 10a. A comparison of the observed maximum reflectivity in the lightning ranges and the retrieved results of the three relationships indicate that the FRST retrieved result reflects the two strong centers well, but the intensity is comparatively weak at the strong centers and stronger in other lightning ranges (Figure 10b,c). The GSI1 reflects only the strong center in Hengshui City, and the retrieved result is weaker overall (Figure 10b,d). The GSI2 retrieved result is concentrated at (30, 40] dBZ and does not reflect the two strong centers (Figure 10b,e). For this case, the FRST retrieved result best reflects the center and intensity distribution of the maximum reflectivity, which is closest to reality in the three relationships.
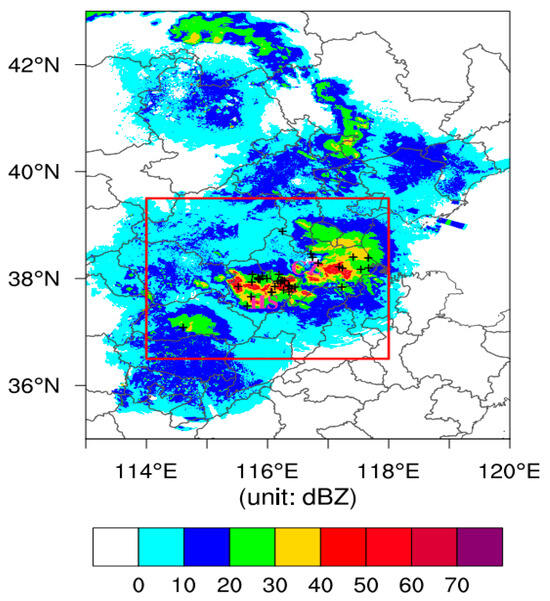
Figure 9.
Distribution of maximum reflectivity (unit: dBZ) at 1400 UTC on 7 June 2022. The gray lines indicate the city/provincial borders. The red box shows the area analyzed in Figure 10. The crosses denote the lightning locations within the time window from 1330 UTC to 1410 UTC. ‘CZ’ and ‘HS’ represent Cangzhou City and Hengshui City, respectively.
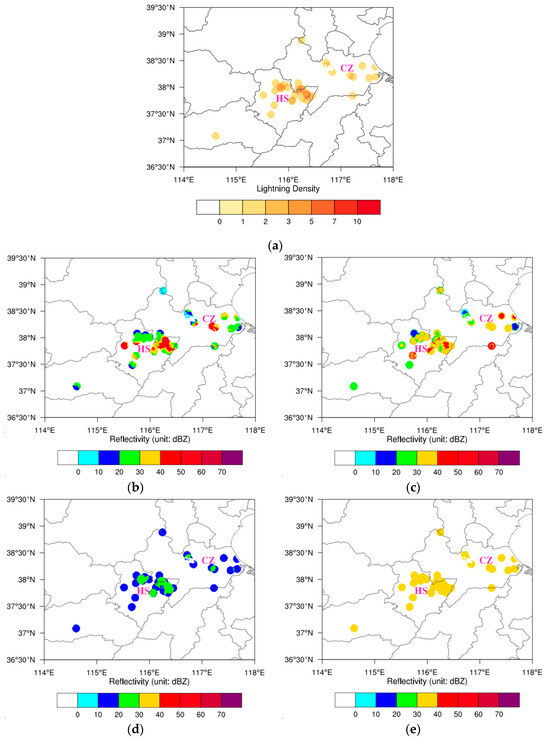
Figure 10.
(a) Lightning density within the time window from 1330 UTC to 1410 UTC on 7 June 2022. (b) Observed maximum reflectivity (unit: dBZ) at 1400 UTC on 7 June 2022. (c) Same as (b) but for the FRST retrieved results. (d) Same as (b) but for the GSI1 retrieved results. (e) Same as (b) but for the GSI2 retrieved results. The gray lines indicate the city/provincial borders. ‘CZ’ and ‘HS’ represent Cangzhou City and Hengshui City, respectively.
4. Discussion
4.1. Advantages of the FRST
The FRST yields a better retrieval effect and higher practical value, which is beneficial for monitoring and forecasting disaster weather. First, when lightning occurs around a grid point, the maximum reflectivity at that grid point ranges from 0 to 75 dBZ (Figure 4), and the maximum proxy reflectivity retrieved by the FRST best reflects this feature (Figure 5b,c), while the maximum proxy reflectivity retrieved by the GSI1 and GSI2 ranges from 17.5 to 40.0 dBZ and 30.13 to 43.74 dBZ, respectively. This is beneficial not only for monitoring thunderstorms but also for assimilating lightning data using radar reflectivity as an observation operator. In assimilation systems, such as the Weather Research and Forecasting Model Data Assimilation System, 25 dBZ is the threshold for radar reflectivity assimilation. If the reflectivity is above 25 dBZ, radar reflectivity assimilation is initiated, and lower reflectivity is not used in the assimilation system. When lightning occurs around a grid point, the maximum proxy reflectivity retrieved by the GSI2 exceeds 25 dBZ, and is used in the assimilation system, resulting in an excessively large area of reflectivity assimilation. In the FRST, a smaller maximum proxy reflectivity can be used, potentially reducing false alarms in model forecasting. The retrieved results of the empirical GSI relationships do not exceed 43.74 dBZ, and the models are unable to assimilate strong maximum proxy reflectivity, potentially forecasting weak convective centers. The FRST is able to retrieve a larger maximum proxy reflectivity, potentially enhancing forecasts of strong convective centers. Second, since the FRST retrieved result is strongly correlated with the observed maximum reflectivity (Figure 6a), with low root mean square error and mean absolute error (Figure 7), the maximum proxy reflectivity retrieved by the FRST can be considered a substitute for the observed maximum reflectivity in radar blind zones, such as mountains and oceans, compensating for the shortcomings of radar in the monitoring of thunderstorms. In addition, the FRST can retrieve maximum proxy reflectivity with a 0.01° resolution, facilitating convective-scale assimilation for high-resolution models.
4.2. Limitations of the FRST
The parameter settings in the FRST are somewhat subjective. First, the calculation of the lightning density is subjective. In this paper, the calculation period is within a 40-min window (30 min before to 10 min after the whole hour), and the calculation area is the area within a 0.08° radius centered at the grid point. Second, the selection of the number of LPO records used to construct the retrieval relationship is subjective. The 95% cumulative frequency of the lightning density is used as a cutoff for selecting the number of LPO records. Additionally, the parameter settings (e.g., n_estimators and criterion) of the random forest are subjective. The above parameters may affect the retrieval relationship and its effect, and no parameter sensitivity analysis is conducted in this paper.
4.3. Future Studies
In this paper, only the retrieval relationship between lightning and maximum proxy reflectivity is constructed. Further study on the retrieval scheme of the vertical profile is needed to convert maximum proxy reflectivity to 3D proxy reflectivity and achieve lightning data assimilation in numerical models. Focus should be placed on the impact of the FRST on model forecasting after lightning data assimilation in radar blind zones. In addition, 3D proxy reflectivity should be effectively integrated with 3D radar reflectivity before assimilation, and this topic should be explored in future work. In addition, the retrieval relationship between other lightning data (such as Lightning Mapping Imager products of Fengyun-4A) and maximum proxy reflectivity is worth investigating.
5. Conclusions
The retrieval relationship between lightning and maximum proxy reflectivity affects the effect of lightning data assimilation. Previous studies have mainly used lightning density to construct a retrieval relationship between lightning and maximum proxy reflectivity and have not considered other lightning features. In addition to the lightning density, the multi-characteristic parameters (including temporal coefficient, spatial coefficient, and current intensity) of the first 10 LPO records (in ascending order of spatiotemporal coefficients) are added in this paper. These LPO parameters and random forest are used to construct the retrieval relationship between lightning and maximum proxy reflectivity for a high-resolution model grid. A comparison of the FRST with two empirical GSI relationships shows that (i) the FRST retrieved result reflects the single-peak structure of the maximum reflectivity frequency well, and the peak interval (35, 40] dBZ is similar to the actual peak interval (30, 35] dBZ. At different lightning densities, the FRST retrieved result also reflects the frequency distribution structure and the peak interval of the maximum reflectivity. (ii) The correlation coefficient of the FRST is 3.38 (3.12) times greater than that for the empirical GSI relationships. The root mean square error and the mean absolute error of the FRST are 50.85% (28.05%) and 57.15% (35.19%) lower than those for the empirical GSI relationships, respectively. Among the three relationships, in the three maximum reflectivity intervals of (0, 20] dBZ, (20, 40] dBZ, and >40 dBZ, the ETS of the FRST is the highest, and the BIAS of the FRST is closest to 1.
Author Contributions
Conceptualization, J.Y. and L.T.; methodology, J.Y. and L.T.; software, J.Y., L.T., K.Z. and W.Z.; validation, J.Y.; formal analysis, J.Y.; investigation, J.Y., L.T., K.Z. and W.Z.; resources, J.Y., L.T. and K.Z.; data curation, J.Y. and L.T.; writing—original draft preparation, J.Y.; writing—review and editing, L.T., K.Z. and L.R.; visualization, J.Y.; supervision, L.T.; project administration, J.Y. and L.T.; funding acquisition, J.Y. and L.T. All authors have read and agreed to the published version of the manuscript.
Funding
This research was funded by Key Research and Development Projects of Hebei Province (22375404D) and Research and Development Projects of Hebei Provincial Meteorological Bureau (21kyd06).
Data Availability Statement
The data presented in this study are available on request from the corresponding author. The data are not publicly available due to permissions issues.
Acknowledgments
The authors would like to thank three anonymous reviewers for providing thorough reviews that greatly helped us improve the manuscript.
Conflicts of Interest
The authors declare no conflicts of interest. Weiguang Zhang is employed by Hebei Jiyun Meteorological Technology Service Co., Ltd.
References
- Qie, X.S.; Liu, D.X.; Sun, Z.L. Recent advances in research of lightning meteorology. Acta Meteorol. Sin. 2014, 72, 1054–1068. [Google Scholar] [CrossRef]
- Qie, X.; Yuan, S.; Chen, Z.; Wang, D.; Liu, D.; Sun, M.; Sun, Z.; Srivastava, A.; Zhang, H.; Lu, J.; et al. Understanding the dynamical-microphysical-electrical processes associated with severe thunderstorms over the Beijing metropolitan region. Sci. China Earth Sci. 2021, 51, 46–62. [Google Scholar] [CrossRef]
- Lin, X.H.; Zhang, W.J.; Fan, N.Z.; Huang, L.G.; Jiang, T.; Fu, C. Lightning activity in the Pre-TC squall line of typhoon Lekima (2019) observed by FY-4A LMI and its relationship with convective evolution. Remote Sens. Technol. Appl. 2021, 36, 873–886. [Google Scholar]
- Guo, F.X.; Lu, G.Y.; Wu, X.; Wang, H.L.; Liu, Z.P.; Bao, M.; Li, Y.W. Occurrence conditions of positive cloud-to-ground flashes in severe thunderstorms. Sci. China (Earth Sci.) 2016, 59, 1401–1413. [Google Scholar] [CrossRef]
- Xu, G.Q.; Huang, S.Y.; Zhao, C.Y. Influence of FY-4A lightning data on numerical forecast of convective weather. Meteorol. Mon. 2020, 46, 1165–1177. [Google Scholar]
- Chen, Y.D.; Yu, Z.; Han, W.; He, J.; Chen, M. Case study of a retrieval method of 3D proxy reflectivity from FY-4A lightning data and its impact on the assimilation and forecasting for severe rainfall storms. Remote Sens. 2020, 12, 1165. [Google Scholar] [CrossRef]
- Xiao, X.; Sun, J.Z.; Qie, X.S.; Ying, Z.M.; Ji, L.; Chen, M.X.; Zhang, L.N. Lightning data assimilation scheme in a 4DVAR system and its impact on very short-term convective forecasting. Mon. Weather. Rev. 2021, 149, 353–373. [Google Scholar] [CrossRef]
- Wang, H.; Liu, Y.; Cheng, W.Y.Y.; Zhao, T.; Xu, M.; Liu, Y.; Shen, S.; Calhoun, K.M.; Fierro, A.O. Improving lightning and precipitation prediction of severe convection using lightning data assimilation with NCAR WRF-RTFDDA. J. Geophys. Res. Atmos. 2017, 122, 12296–12316. [Google Scholar] [CrossRef]
- Chen, Z.X.; Qie, X.S.; Liu, D.X.; Xiong, Y.J. Lightning data assimilation with comprehensively nudging water contents at cloud-resolving scale using WRF model. Atmos. Res. 2019, 221, 72–87. [Google Scholar] [CrossRef]
- Liu, P.; Yang, Y.; Xin, Y.; Wang, C. Impact of lightning data assimilation on forecasts of a leeward slope precipitation event in the western margin of the Junggar Basin. Remote Sens. 2021, 13, 3584. [Google Scholar] [CrossRef]
- Wang, Y.; Yang, Y.; Liu, D.X.; Zhang, D.B.; Yao, W.; Wang, C.H. A case study of assimilating lightning-proxy relative humidity with WRF-3DVAR. Atmosphere 2017, 8, 55. [Google Scholar] [CrossRef]
- Abshaev, M.T.; Abshaev, A.M.; Gekkieva, J.M.; Adzhiev, A.K. Interlink between lightning activity of hailstorms and their radar characteristics. J. Phys. Conf. Ser. 2020, 1604, 012010. [Google Scholar] [CrossRef]
- Hayashi, S.; Umehara, A.; Nagumo, N.; Ushio, T. The relationship between lightning flash rate and ice-related volume derived from dual-polarization radar. Atmos. Res. 2021, 248, 105166. [Google Scholar] [CrossRef]
- Chatterjee, C.; Das, S. On the association between lightning and precipitation microphysics. J. Atmos. Sol.-Terr. Phys. 2020, 207, 105350. [Google Scholar] [CrossRef]
- Chen, Z.X.; Sun, J.Z.; Qie, X.S.; Zhang, Y.; Ying, Z.M.; Xiao, X.; Cao, D.J. A method to update model kinematic states by assimilating satellite-observed total lightning data to improve convective analysis and forecasting. J. Geophys. Res. Atmos. 2020, 125, e2020JD033330. [Google Scholar] [CrossRef]
- Weygandt, S.S.; Benjamin, S.G.; Brown, J.M.; Koch, S.E. Assimilation of lightning data into RUC model forecasting. In Proceedings of the 2nd Conference on Meteorological Applications of Lightning Data, Tucson, AZ, USA, 31 January 2006. [Google Scholar]
- Weygandt, S.S.; Hu, M.; Benjamin, S.G.; Smirnova, T.G.; Brundage, K.J.; Brown, J.M. Assimilation of lightning data using a diabatic digital filter within the Rapid Update Cycle. In Proceedings of the 12th Conference on IOAS-AOLS, New Orleans, LA, USA, 20–24 January 2008. [Google Scholar]
- Manobianco, J.; Koch, S.; Karyampudi, V.M.; Negri, A.J. The impact of assimilating satellite-derived precipitation rates on numerical simulations of the ERICA IOP 4 cyclone. Mon. Weather. Rev. 1994, 122, 341–365. [Google Scholar] [CrossRef]
- Papadopoulos, A.; Chronis, T.G.; Anagnostou, E.N. Improving convective precipitation forecasting through assimilation of regional lightning measurements in a mesoscale model. Mon. Weather. Rev. 2005, 133, 1961–1977. [Google Scholar] [CrossRef]
- Zhang, R.; Zhang, Y.J.; Xu, L.T.; Zheng, D.; Yao, W. Assimilation of total lightning data using the three-dimensional variational method at convection-allowing resolution. J. Meteorol. Res. 2017, 31, 731–746. [Google Scholar] [CrossRef]
- Qie, X.S.; Zhu, R.P.; Yuan, T.; Wu, X.K.; Li, W.L.; Liu, D.X. Application of total-lightning data assimilation in a mesoscale convective system based on the WRF model. Atmos. Res. 2014, 145–146, 255–266. [Google Scholar] [CrossRef]
- Fierro, A.O.; Mansell, E.R.; Ziegler, C.L.; Macgorman, D.R. Application of a lightning data assimilation technique in the WRF-ARW model at cloud-resolving scales for the tornado outbreak of 24 May 2011. Mon. Weather. Rev. 2012, 140, 2609–2627. [Google Scholar] [CrossRef]
- Chen, Z.X.; Qie, X.S.; Tian, Y.; Wang, D.F.; Yuan, S.F. Assimilation of lightning data through comprehensively nudging water contents at the cloud-resolving scale. Acta Meteorol. Sin. 2017, 75, 442–459. [Google Scholar]
- Wang, Y.; Yang, Y.; Qiu, X.B. Assimilating cloud-to-ground lightning data using ensemble square root filter. J. Arid. Meteorol. 2015, 33, 761–768. [Google Scholar]
- Sun, C.; Xu, G.Q. Application of lightning location and radar data in cloud analysis system and numerical experiments. Chin. J. Atmos. Sci. 2019, 43, 131–141. [Google Scholar]
- Huang, S.Y.; Xu, G.Q. Influence of LMIE lightning data of FY4A on cloud information initialization and numerical experiment. Plateau Meteorol. 2020, 39, 378–392. [Google Scholar]
- Zhao, C.; Xu, G.Q.; Huang, S.Y.; Chen, J.J. Comparative analysis and numerical simulation of lightning detection data from FY-4A satellite and ADTD for rainstorm in Mianning, Sichuan Province. Chin. J. Atmos. Sci. 2023, 47, 769–785. [Google Scholar]
- Sun, Y.T.; Lai, A.W.; Wang, M.H.; Wang, Z.B.; Zhu, C.L.; Sun, J. Analysis of the relationship between lightning flashes and radar echo based on terrain difference. Plateau Meteorol. 2019, 38, 1320–1331. [Google Scholar]
- Qie, X.; Yu, Y.; Guo, C.; Laroche, P.; Zhang, G.; Zhang, Q. Some features of stepped and dart-stepped leaders near the ground in natural negative cloud-to-ground lightning discharges. Ann. Geophys. 2002, 20, 863–870. [Google Scholar] [CrossRef]
- Qie, X.S.; Yu, Y.; Wang, D.H.; Wang, H.B.; Chu, R.Z. Characteristics of cloud-to-ground lightning in Chinese inland plateau. J. Meteorol. Soc. Jpn. 2002, 80, 745–754. [Google Scholar] [CrossRef]
- Lin, K.P.; Lin, Z.G.; Yi, Y.M.; Lin, J.L. The spatial and temporal distribution for lightning of various clouds system. J. Trop. Meteorol. 2005, 21, 383–392. [Google Scholar]
- Qie, X.; Kong, X.; Zhang, G.; Zhang, T.; Yuan, T.; Zhou, Y.; Zhang, Y.; Wang, H.; Sun, A. The possible charge structure of thunderstorm and lightning discharges in northeastern verge of Qinghai-Tibetan Plateau. Atmos. Res. 2005, 76, 231–246. [Google Scholar] [CrossRef]
- Yang, G.F.; Tang, D.Z.; Liu, X.; Zhang, Y.P. Synthetical analysis of a severe storm event using lightning and Doppler radar data. Meteorol. Sci. Technol. 2005, 33, 167–172. [Google Scholar]
- Yan, M.H.; Guo, C.M.; Qie, X.S.; Ge, Z.M.; Zhang, G.S. Observation and model analyses of positive cloud-to-ground lightning in mesoscale convective systems. Acta Meteorol. Sin. 1992, 6, 501–510. [Google Scholar]
- Zajac, B.A.; Rutledge, S.A. Cloud-to-ground lightning activity in the contiguous United States from 1995 to 1999. Mon. Weather. Rev. 2001, 129, 999–1019. [Google Scholar] [CrossRef]
- Mcgovern, A.; Gagne II, D.J.; Troutman, N.; Brown, R.A.; Basara, J.; Williams, J.K. Using spatiotemporal relational random forests to improve our understanding of severe weather processes. Stat. Anal. Data Min. 2011, 4, 407–429. [Google Scholar] [CrossRef]
- Williams, J.K. Using random forests to diagnose aviation turbulence. Mach. Learn. 2014, 95, 51–70. [Google Scholar] [CrossRef] [PubMed]
- Ahijevych, D.; Pinto, J.O.; Williams, J.K.; Steiner, M. Probabilistic forecasts of mesoscale convective system initiation using the random forest data mining technique. Weather. Forecast. 2016, 31, 581–599. [Google Scholar] [CrossRef]
- Li, W.J.; Zhao, F.; Li, M.J.; Chen, L.; Peng, X.Y. Forecasting and classification of severe convective weather based on numerical forecast and random forest algorithm. Meteorol. Mon. 2018, 44, 1555–1564. [Google Scholar]
- Tian, F.; Xiao, W.A.; Feng, M.X.; Wei, H.R. Amendment and analysis of observation data for lightning positioning devices. East China Electr. Power 2008, 36, 38–42. [Google Scholar]
- Zeng, Q.F.; Zhang, Q.L.; Lai, X.; Xu, D.P.; Wang, H. Error analysis and correction of lightning location data in Shenzhen. Meteorol. Sci. Technol. 2015, 43, 530–536+542. [Google Scholar]
- Li, J.X.; Guo, F.X.; Hu, H.B.; Li, R.J.; Qian, M.H.; Xiao, W.A. Comparative analysis of SAFIR and ADTD lightning location data over Beijing and its circumjacent regions. Plateau Meteorol. 2017, 36, 1115–1126. [Google Scholar]
- Cui, X.D.; Zhang, W.B.; Gu, Y.; Tian, D.B. Characteristic analysis of multi-return strokes of cloud-to-ground lightning in Zhejiang based on ADTD data. Meteorol. Sci. Technol. 2021, 49, 491–497. [Google Scholar]
- Liu, Y.; Wang, Z.H.; Kang, F.Q.; Zhang, H.L.; Xiao, W.A.; Li, Z.R. Characteristics of cloud-to-ground flashes in Zhejiang and Gansu areas. Plateau Meteorol. 2009, 28, 669–674. [Google Scholar]
- Wang, J.; Chen, Y. Analysis of the 2009-2012 lightning distribution characteristics in China. Meteorol. Mon. 2015, 41, 160–170. [Google Scholar]
- Wang, Z.C.; Pang, W.J.; Liang, L.; Xu, C.H.; Lei, Y. Self-evaluation on detection efficiency of ADTD lightning location network in Beijing. Meteorol. Sci. Technol. 2018, 46, 638–643+664. [Google Scholar]
- Ren, Z.H.; Li, W.P.; Zeng, Y.; He, J.; Qin, B.Q.; Xu, W. Analysis of characteristics of ground flash in Chongqing based on ADTD lightning location data. J. Meteorol. Environ. 2022, 38, 144–149. [Google Scholar]
- Wang, X.L.; Yu, T.Y.; He, S.; Zhang, K.J. Influence of regional altitude on the distribution of cloud-to-ground lightning parameters. High Volt. Eng. 2020, 46, 1206–1215. [Google Scholar]
- Zhu, L.J.; Gong, J.D.; Huang, L.P.; Chen, D.H.; Jiang, Y.; Deng, L.T. Three-dimensional cloud initial field created and applied to GRAPES numerical weather prediction nowcasting. J. Appl. Meteorol. Sci. 2017, 28, 38–51. [Google Scholar]
- Breiman, L. Random forests. Mach. Learn. 2001, 45, 5–32. [Google Scholar] [CrossRef]
- Houze, R.A. Cloud Dynamics; Academic Press: San Diego, CA, USA, 1993; p. 573. [Google Scholar]
- Steiner, M.; Houze, R.A.; Yuter, S.E. Climatological characterization of three-dimensional storm structure from operational radar and rain gauge data. J. Appl. Meteorol. 1995, 34, 1978–2007. [Google Scholar] [CrossRef]
- Geerts, B. Mesoscale convective systems in the southeast United States during 1994-95: A survey. Weather. Forecast. 1998, 13, 860–869. [Google Scholar] [CrossRef]
- Parker, M.D.; Johnson, R.H. Organizational modes of midlatitude mesoscale convective systems. Mon. Weather. Rev. 2000, 128, 3413–3436. [Google Scholar] [CrossRef]


Disclaimer/Publisher’s Note: The statements, opinions and data contained in all publications are solely those of the individual author(s) and contributor(s) and not of MDPI and/or the editor(s). MDPI and/or the editor(s) disclaim responsibility for any injury to people or property resulting from any ideas, methods, instructions or products referred to in the content. |
© 2024 by the authors. Licensee MDPI, Basel, Switzerland. This article is an open access article distributed under the terms and conditions of the Creative Commons Attribution (CC BY) license (https://creativecommons.org/licenses/by/4.0/).