
Assessment of Surface Inundation Monitoring and Drivers after Major Storms in a Tropical Island
Abstract
1. Introduction
2. Methods
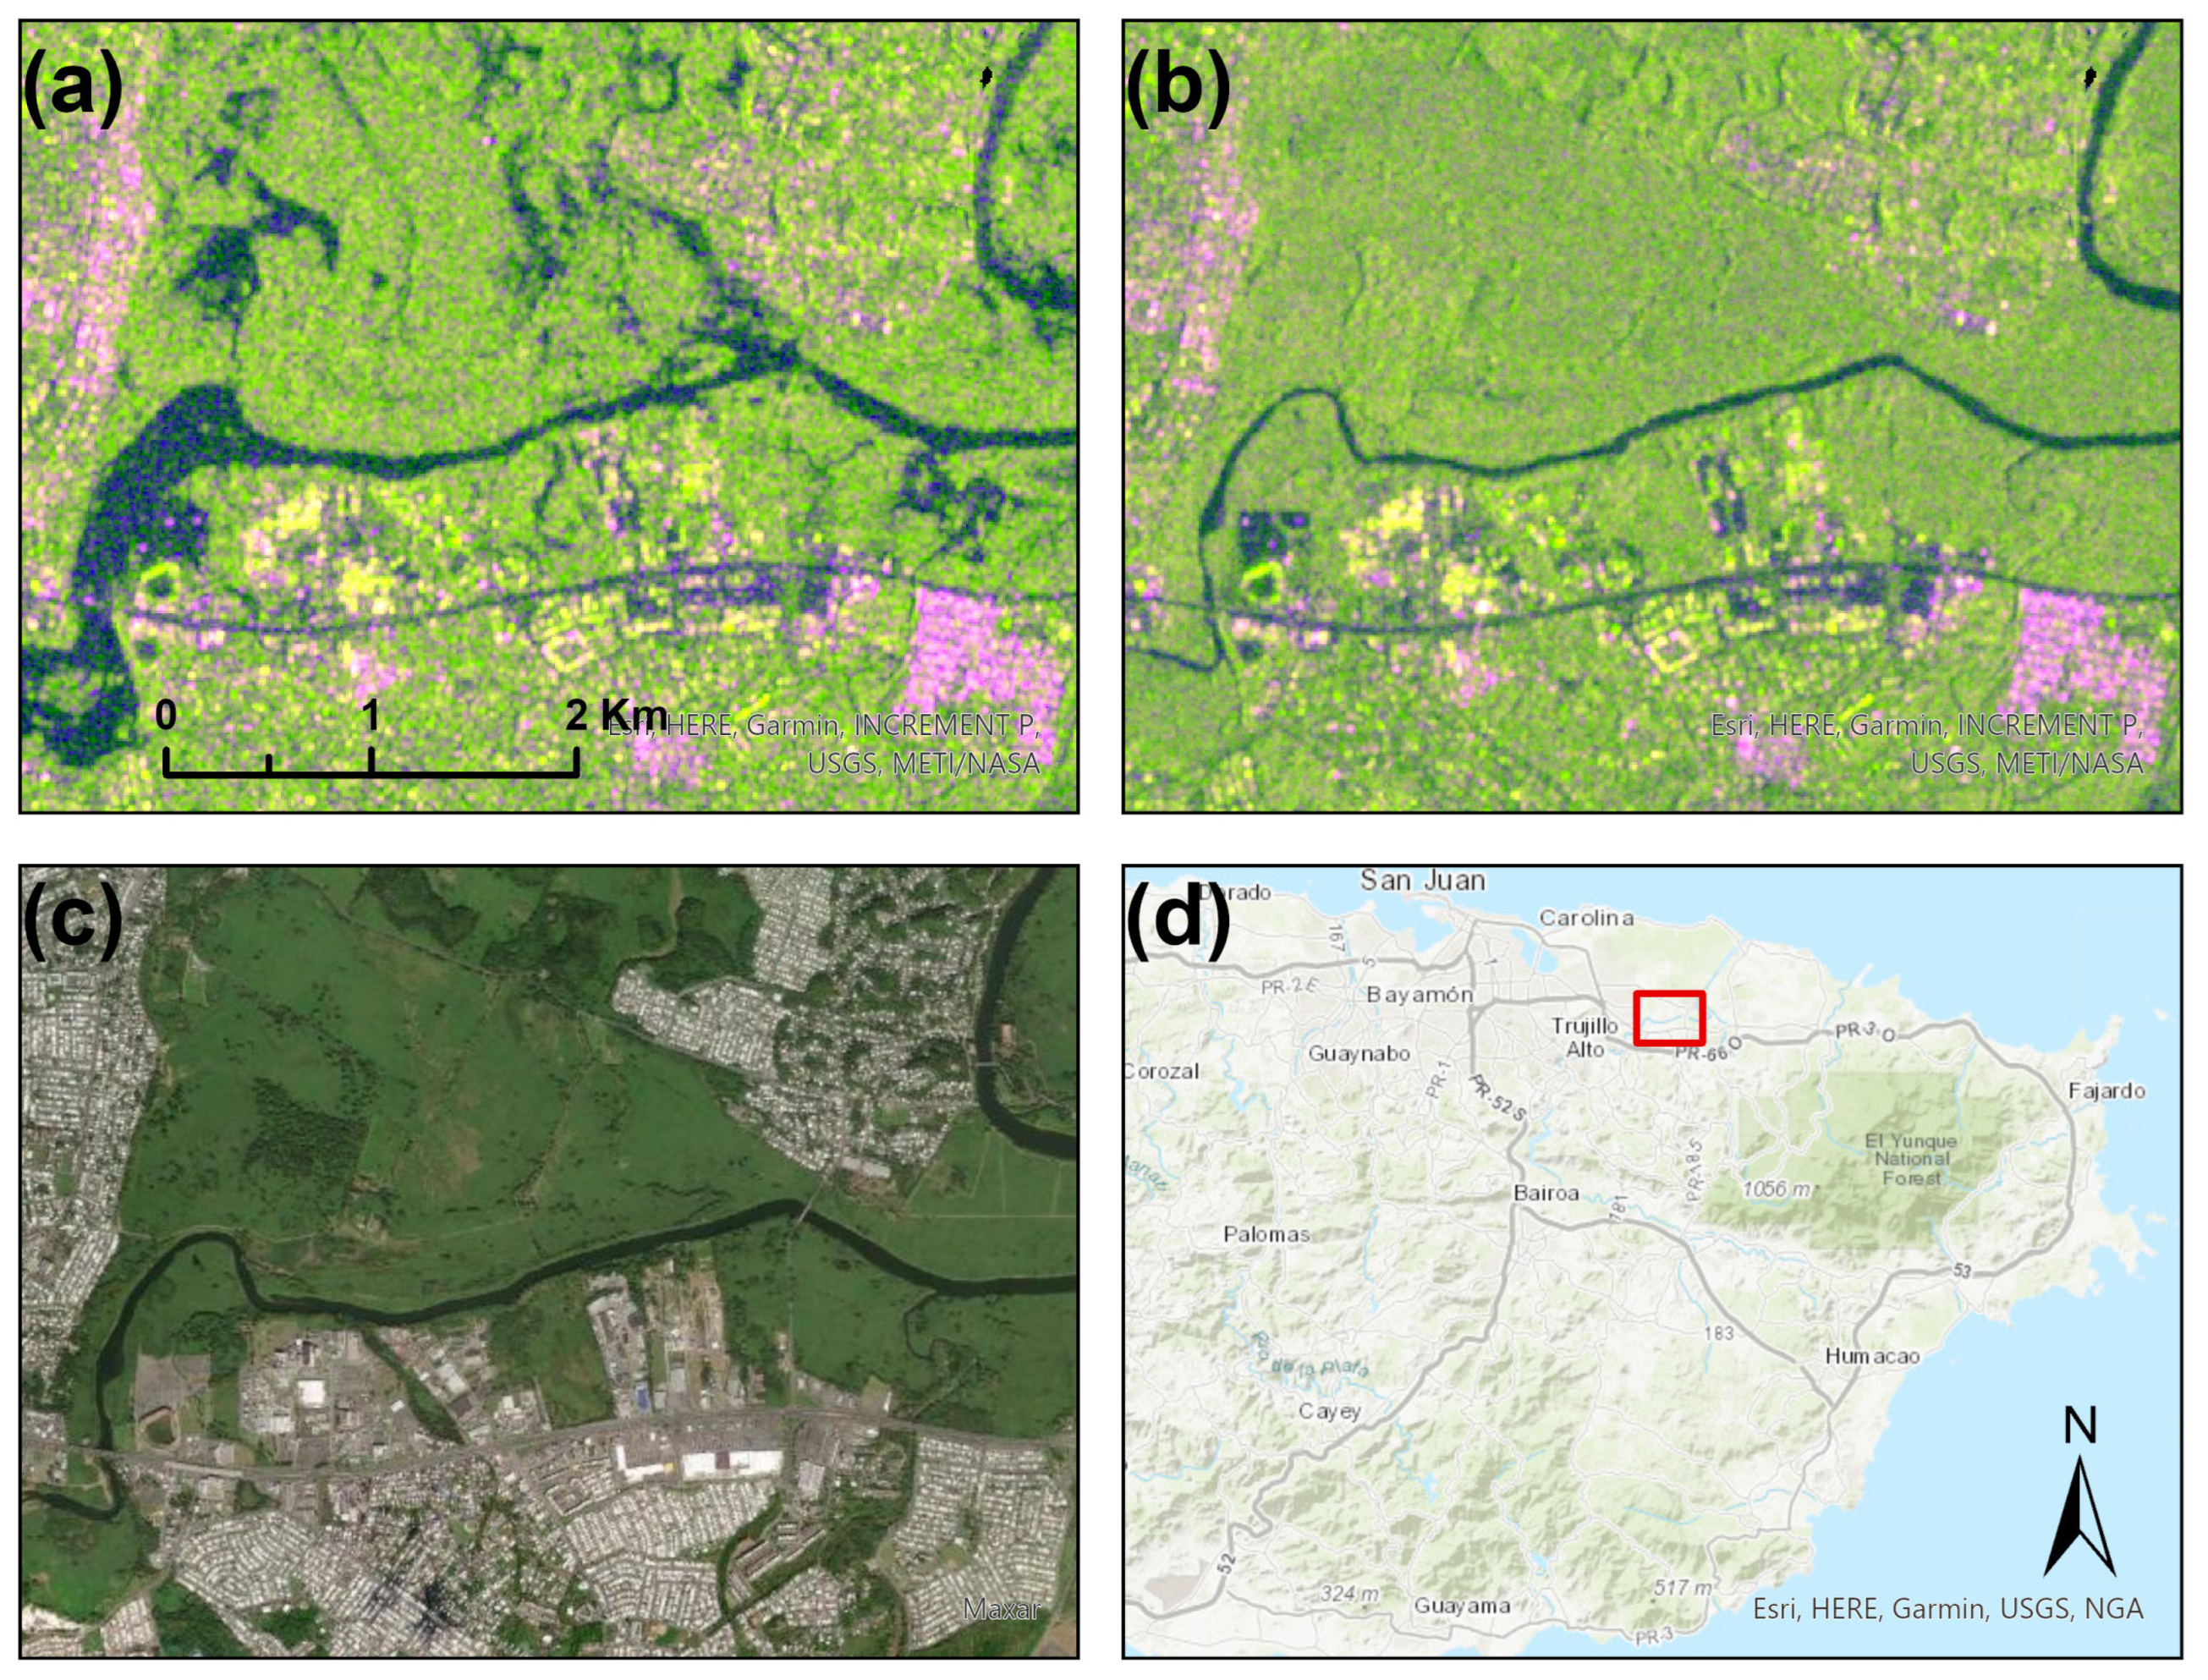
2.1. Study Areas
2.2. SAR Image Analyses
2.3. Exploration of Drivers of Surface Inundation
3. Results
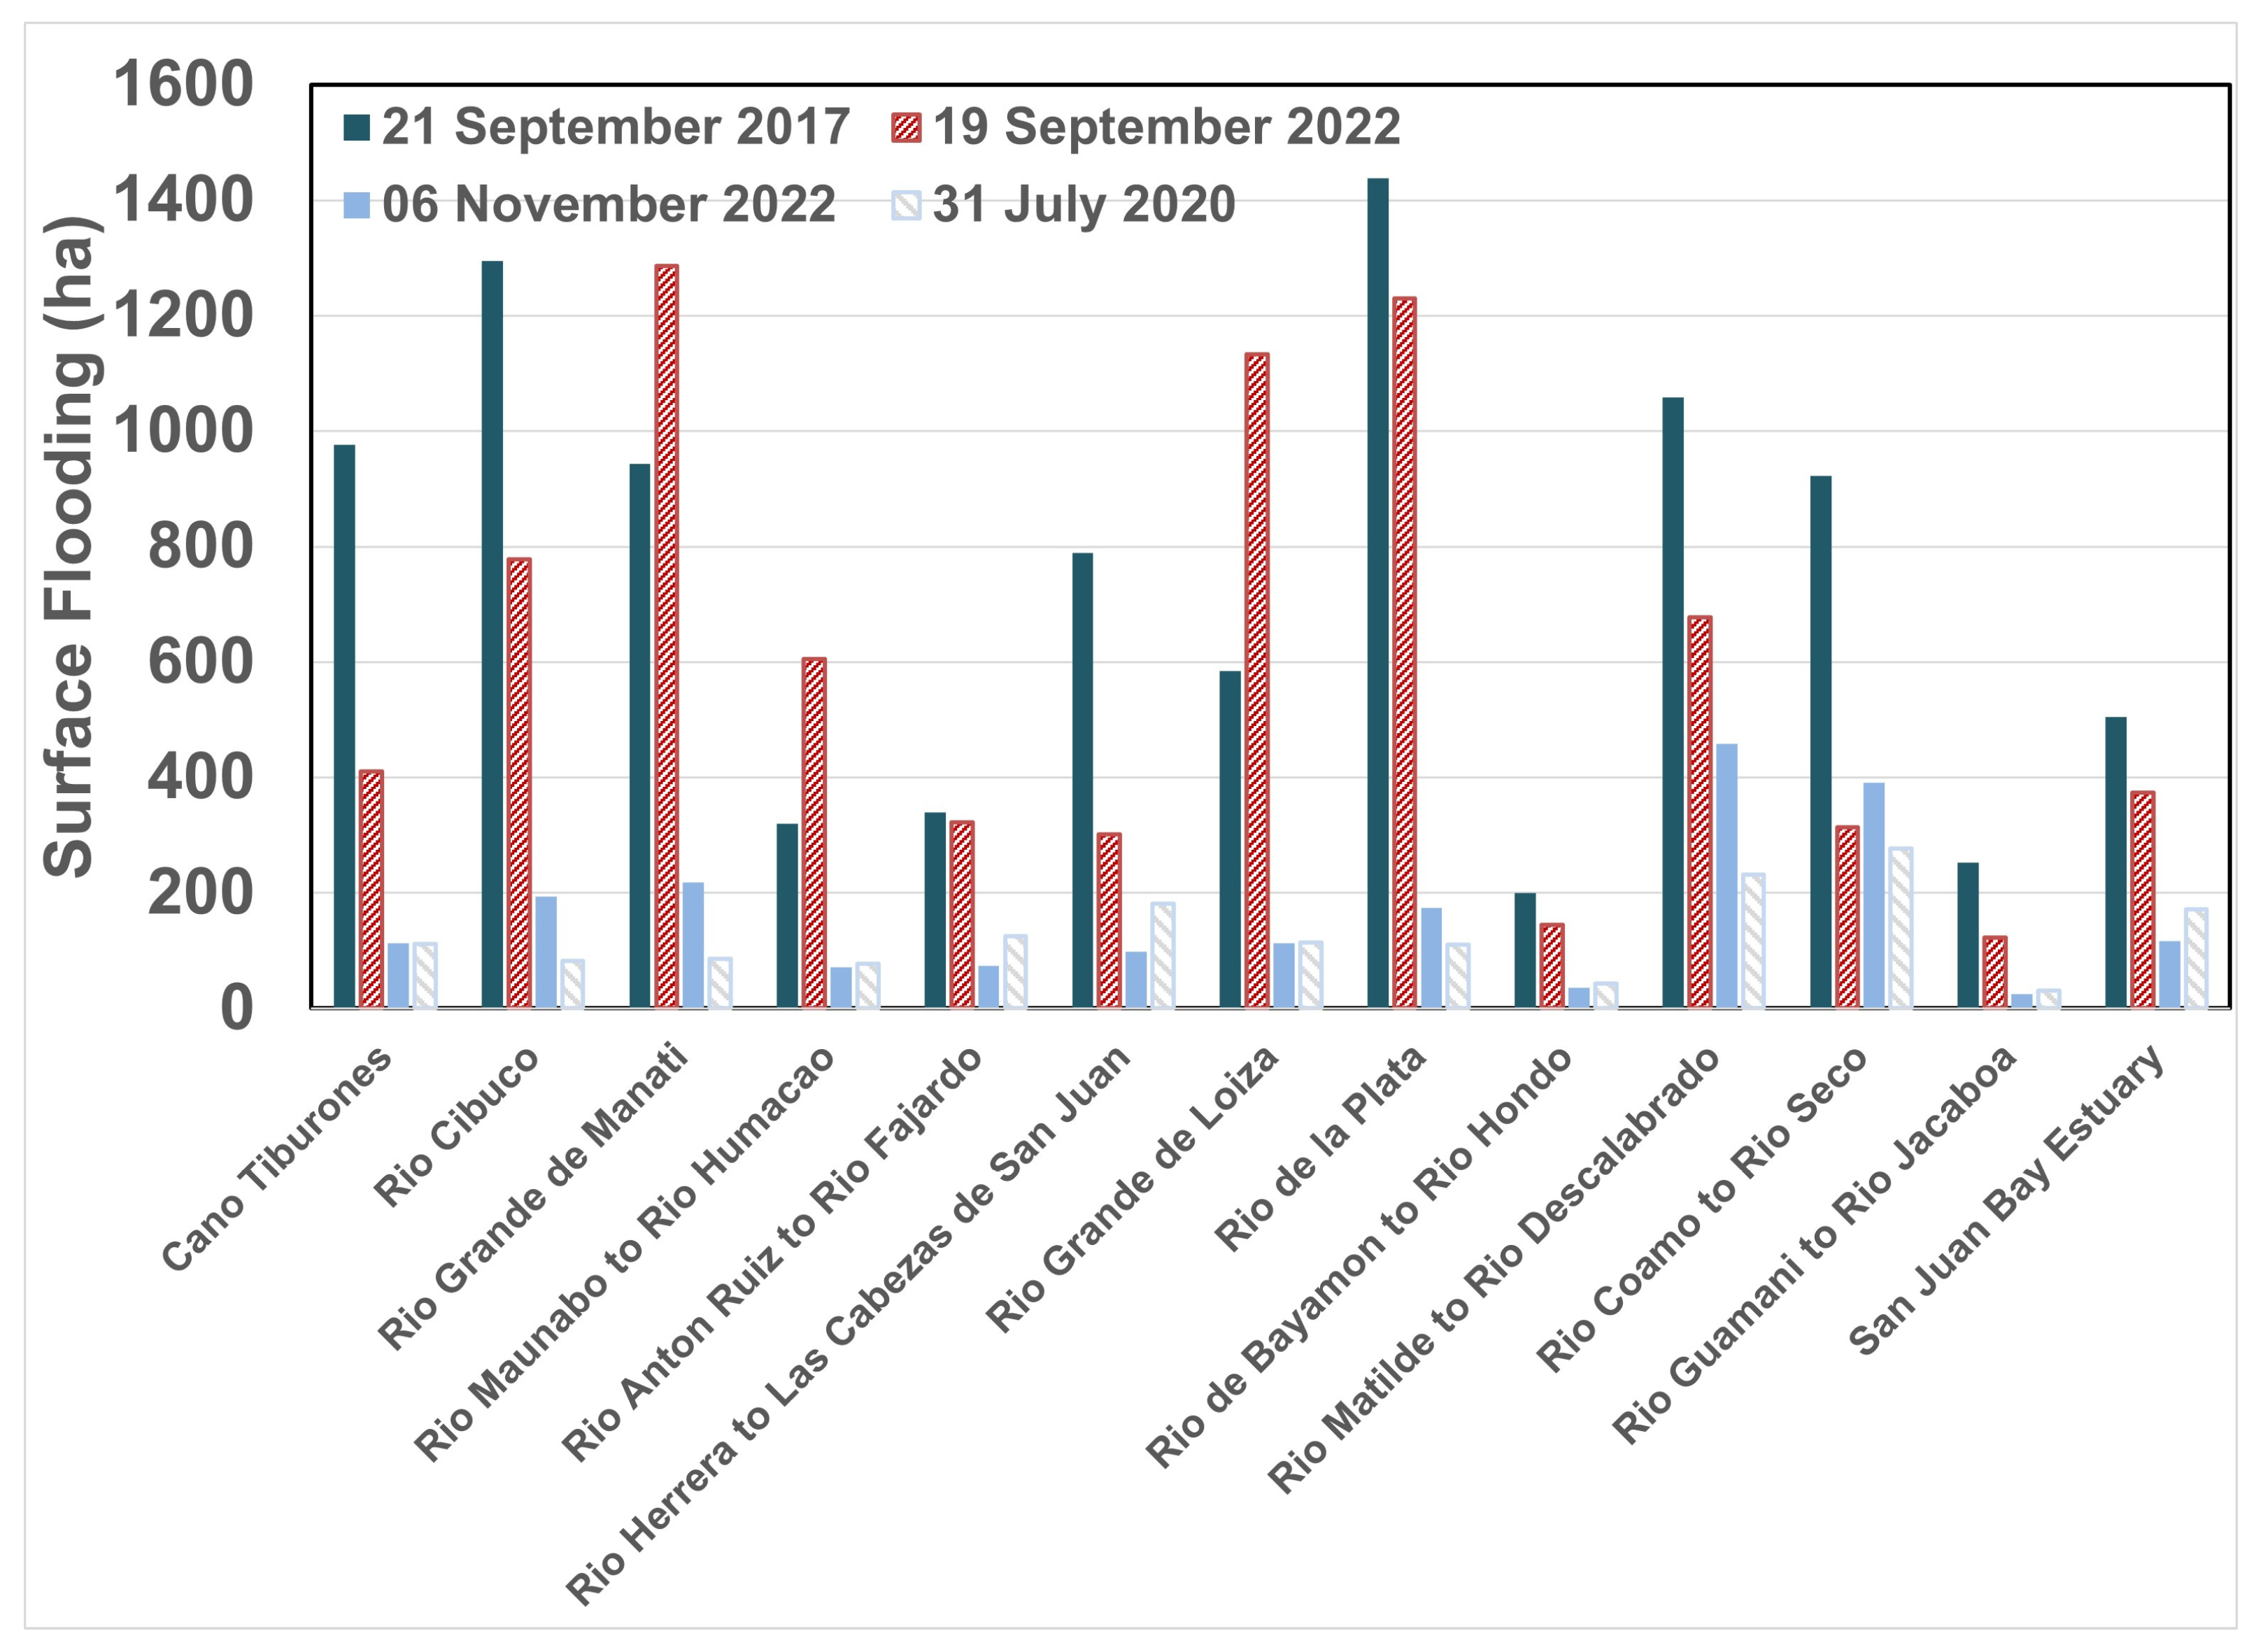
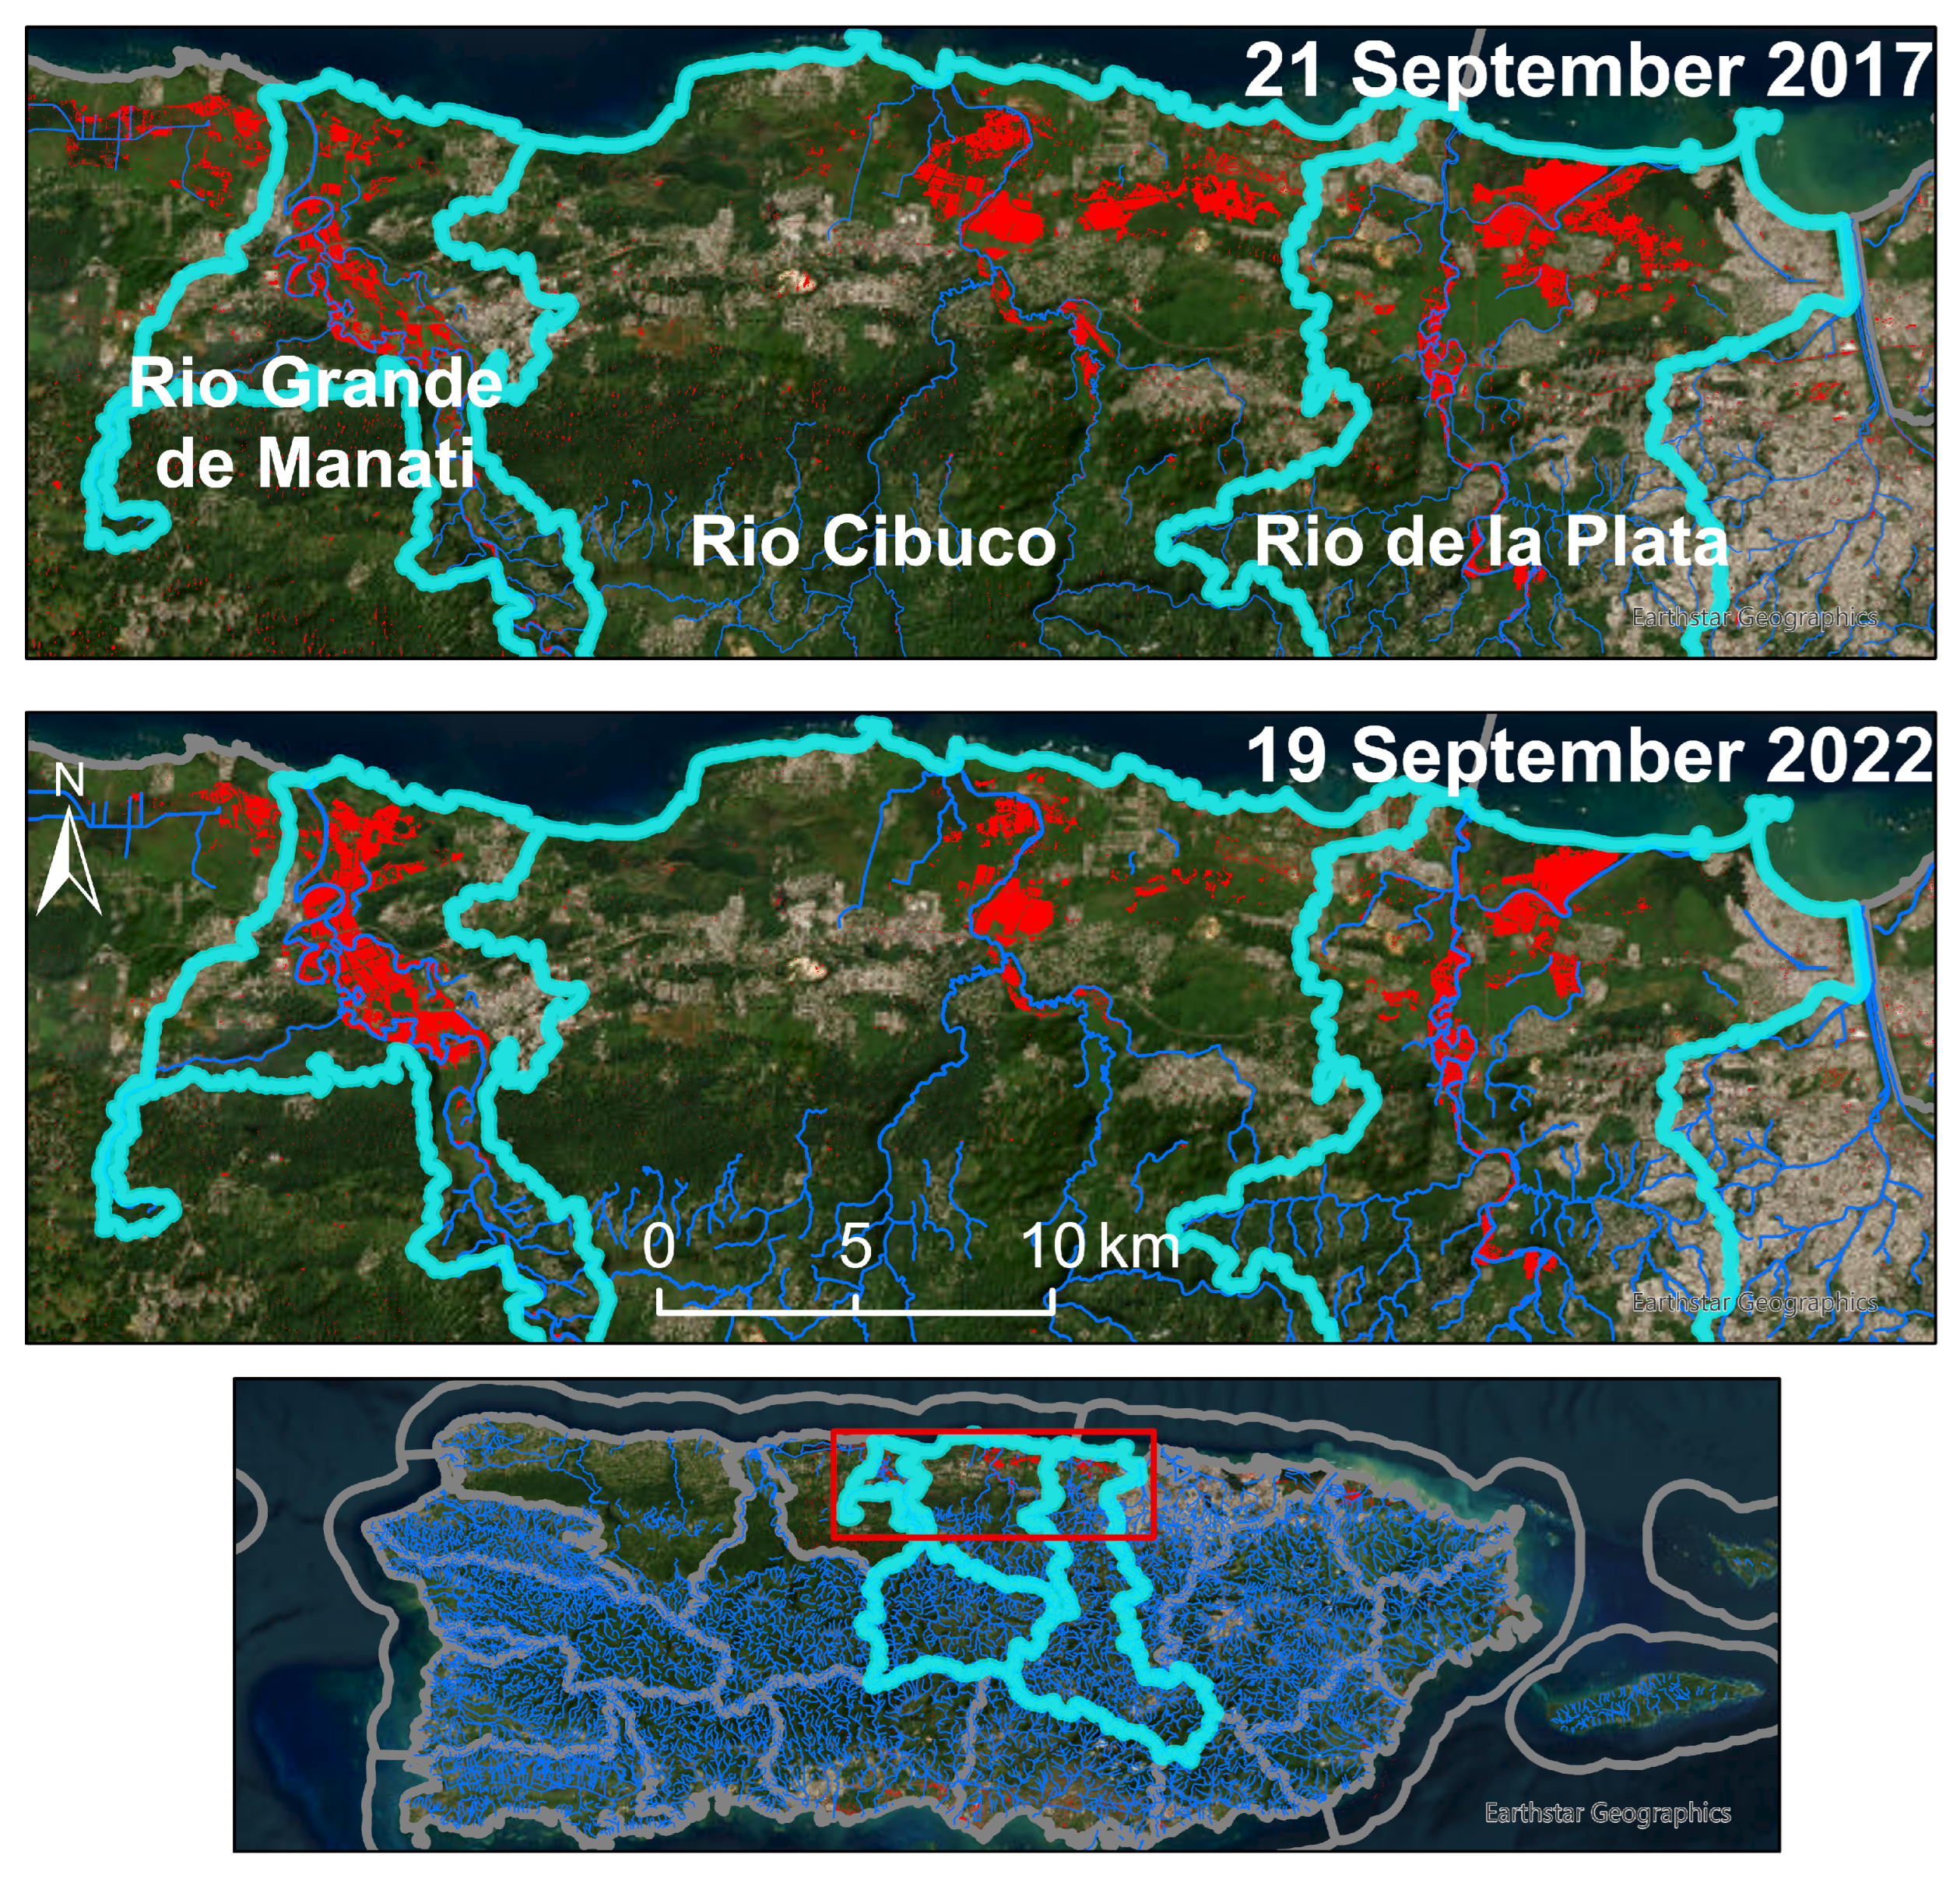
3.1. Detection of Surface Inundation Extent
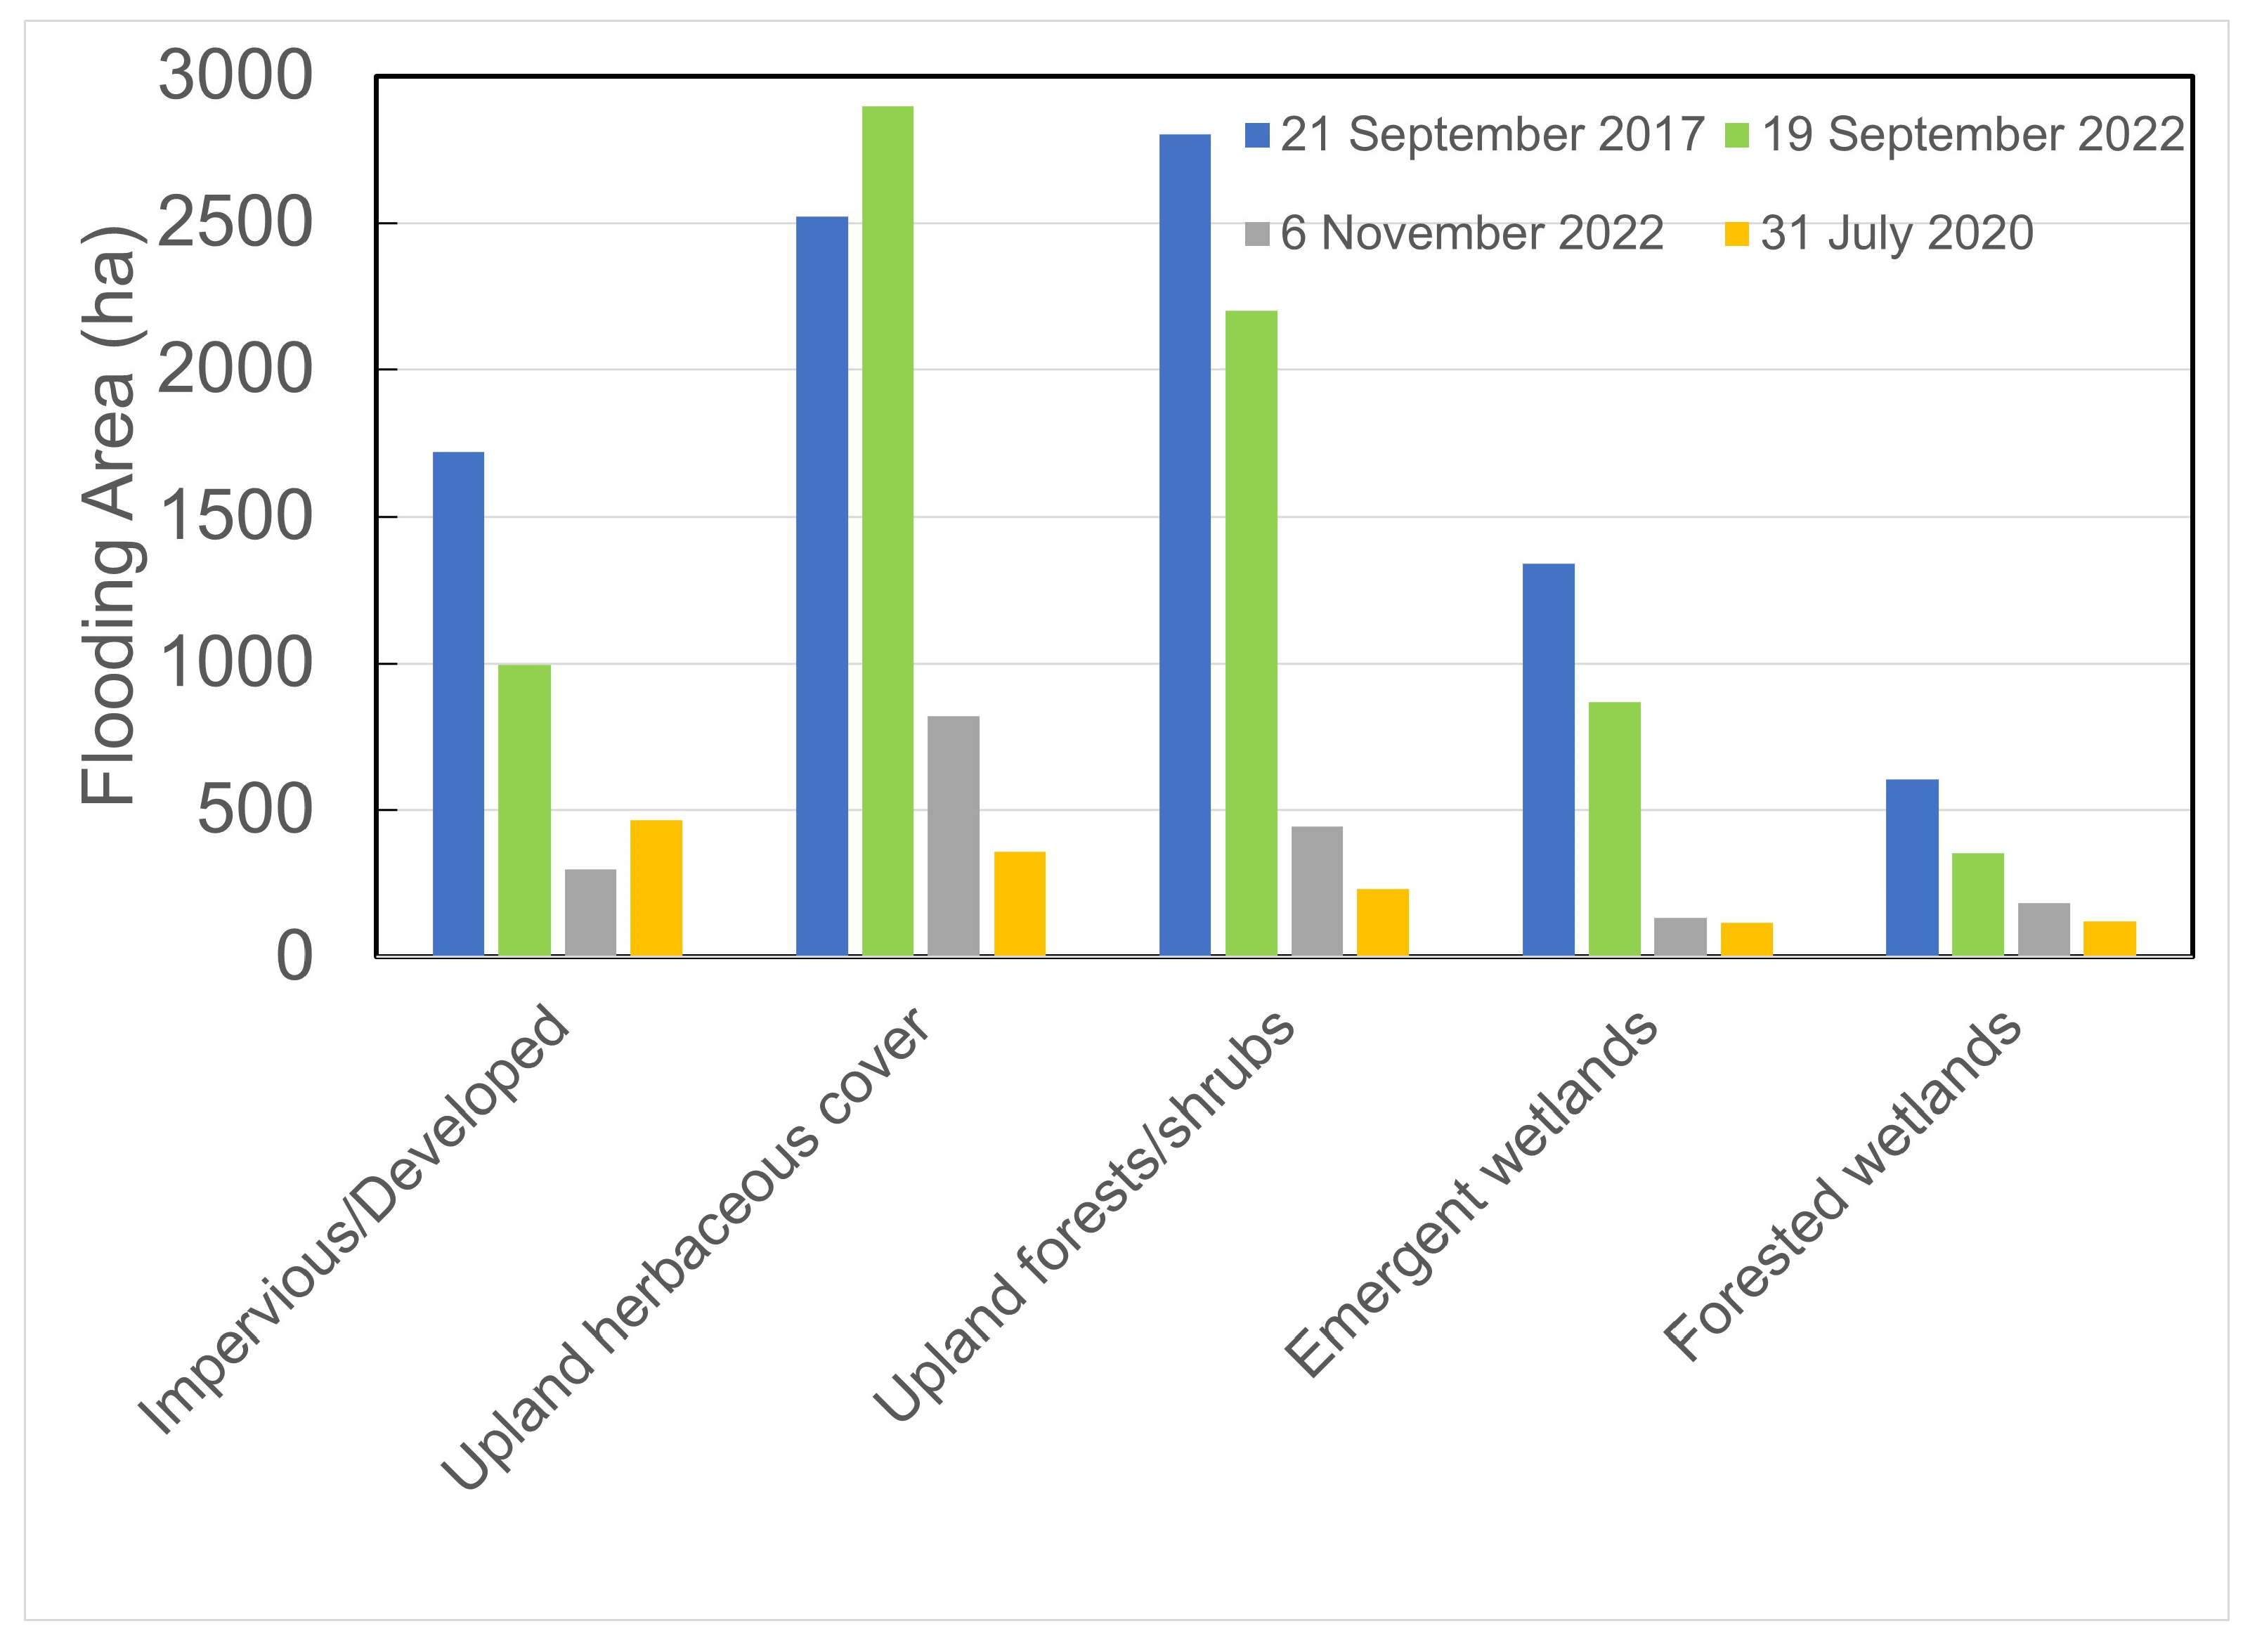
3.2. Topography and Land Cover in Detected Surface Inundation Areas
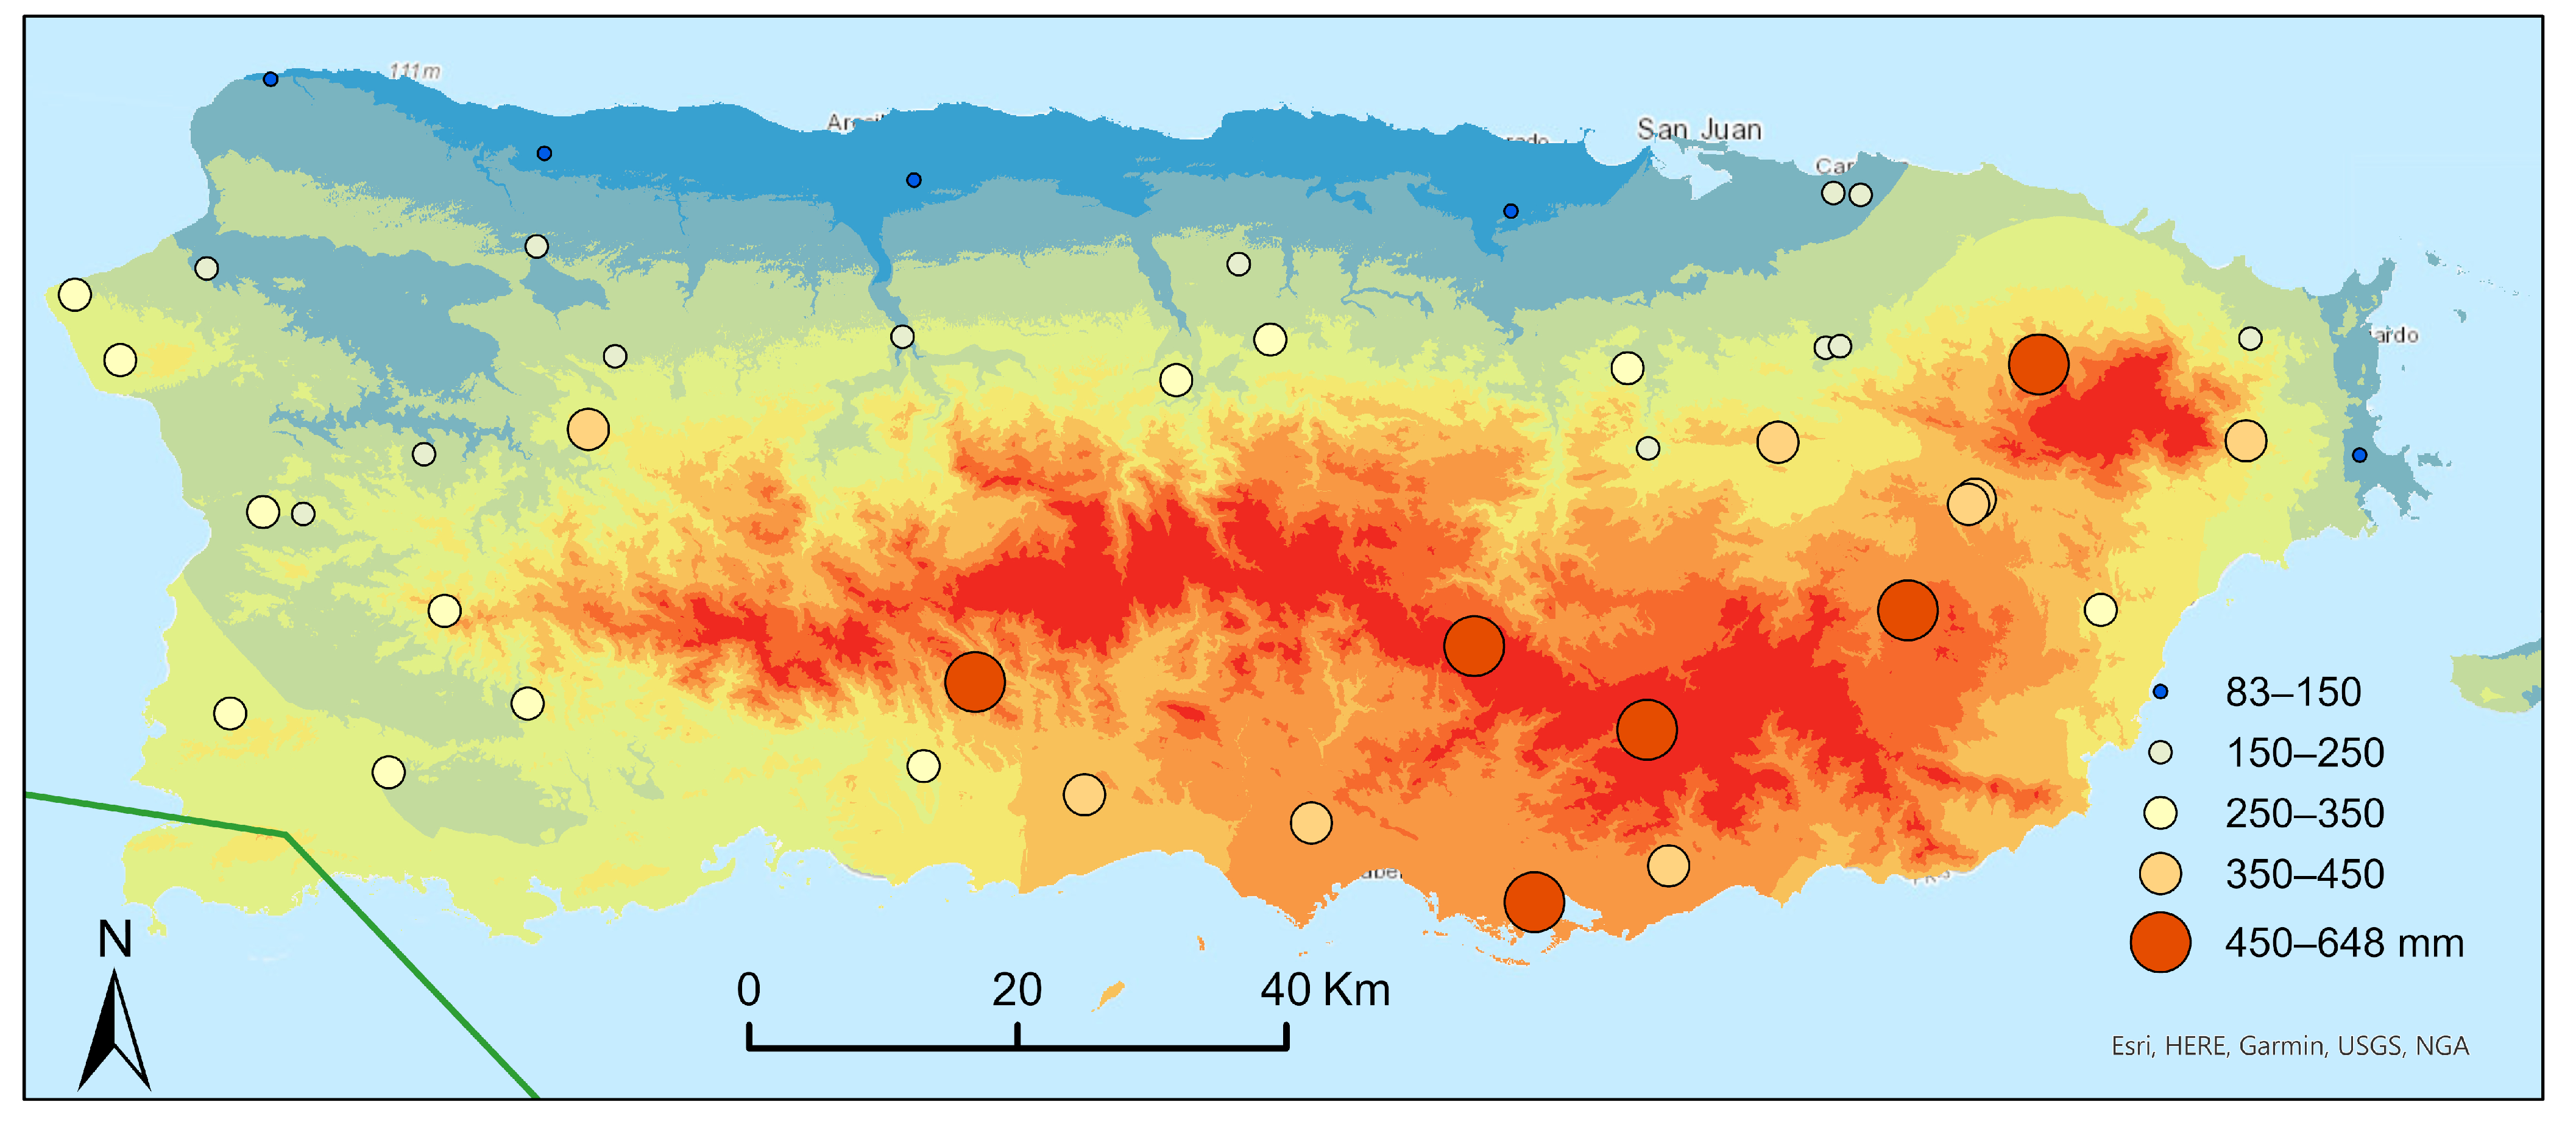
3.3. Fiona Rainfall Interpolation and Flow Accumulation Compared to Observed Stream Discharge
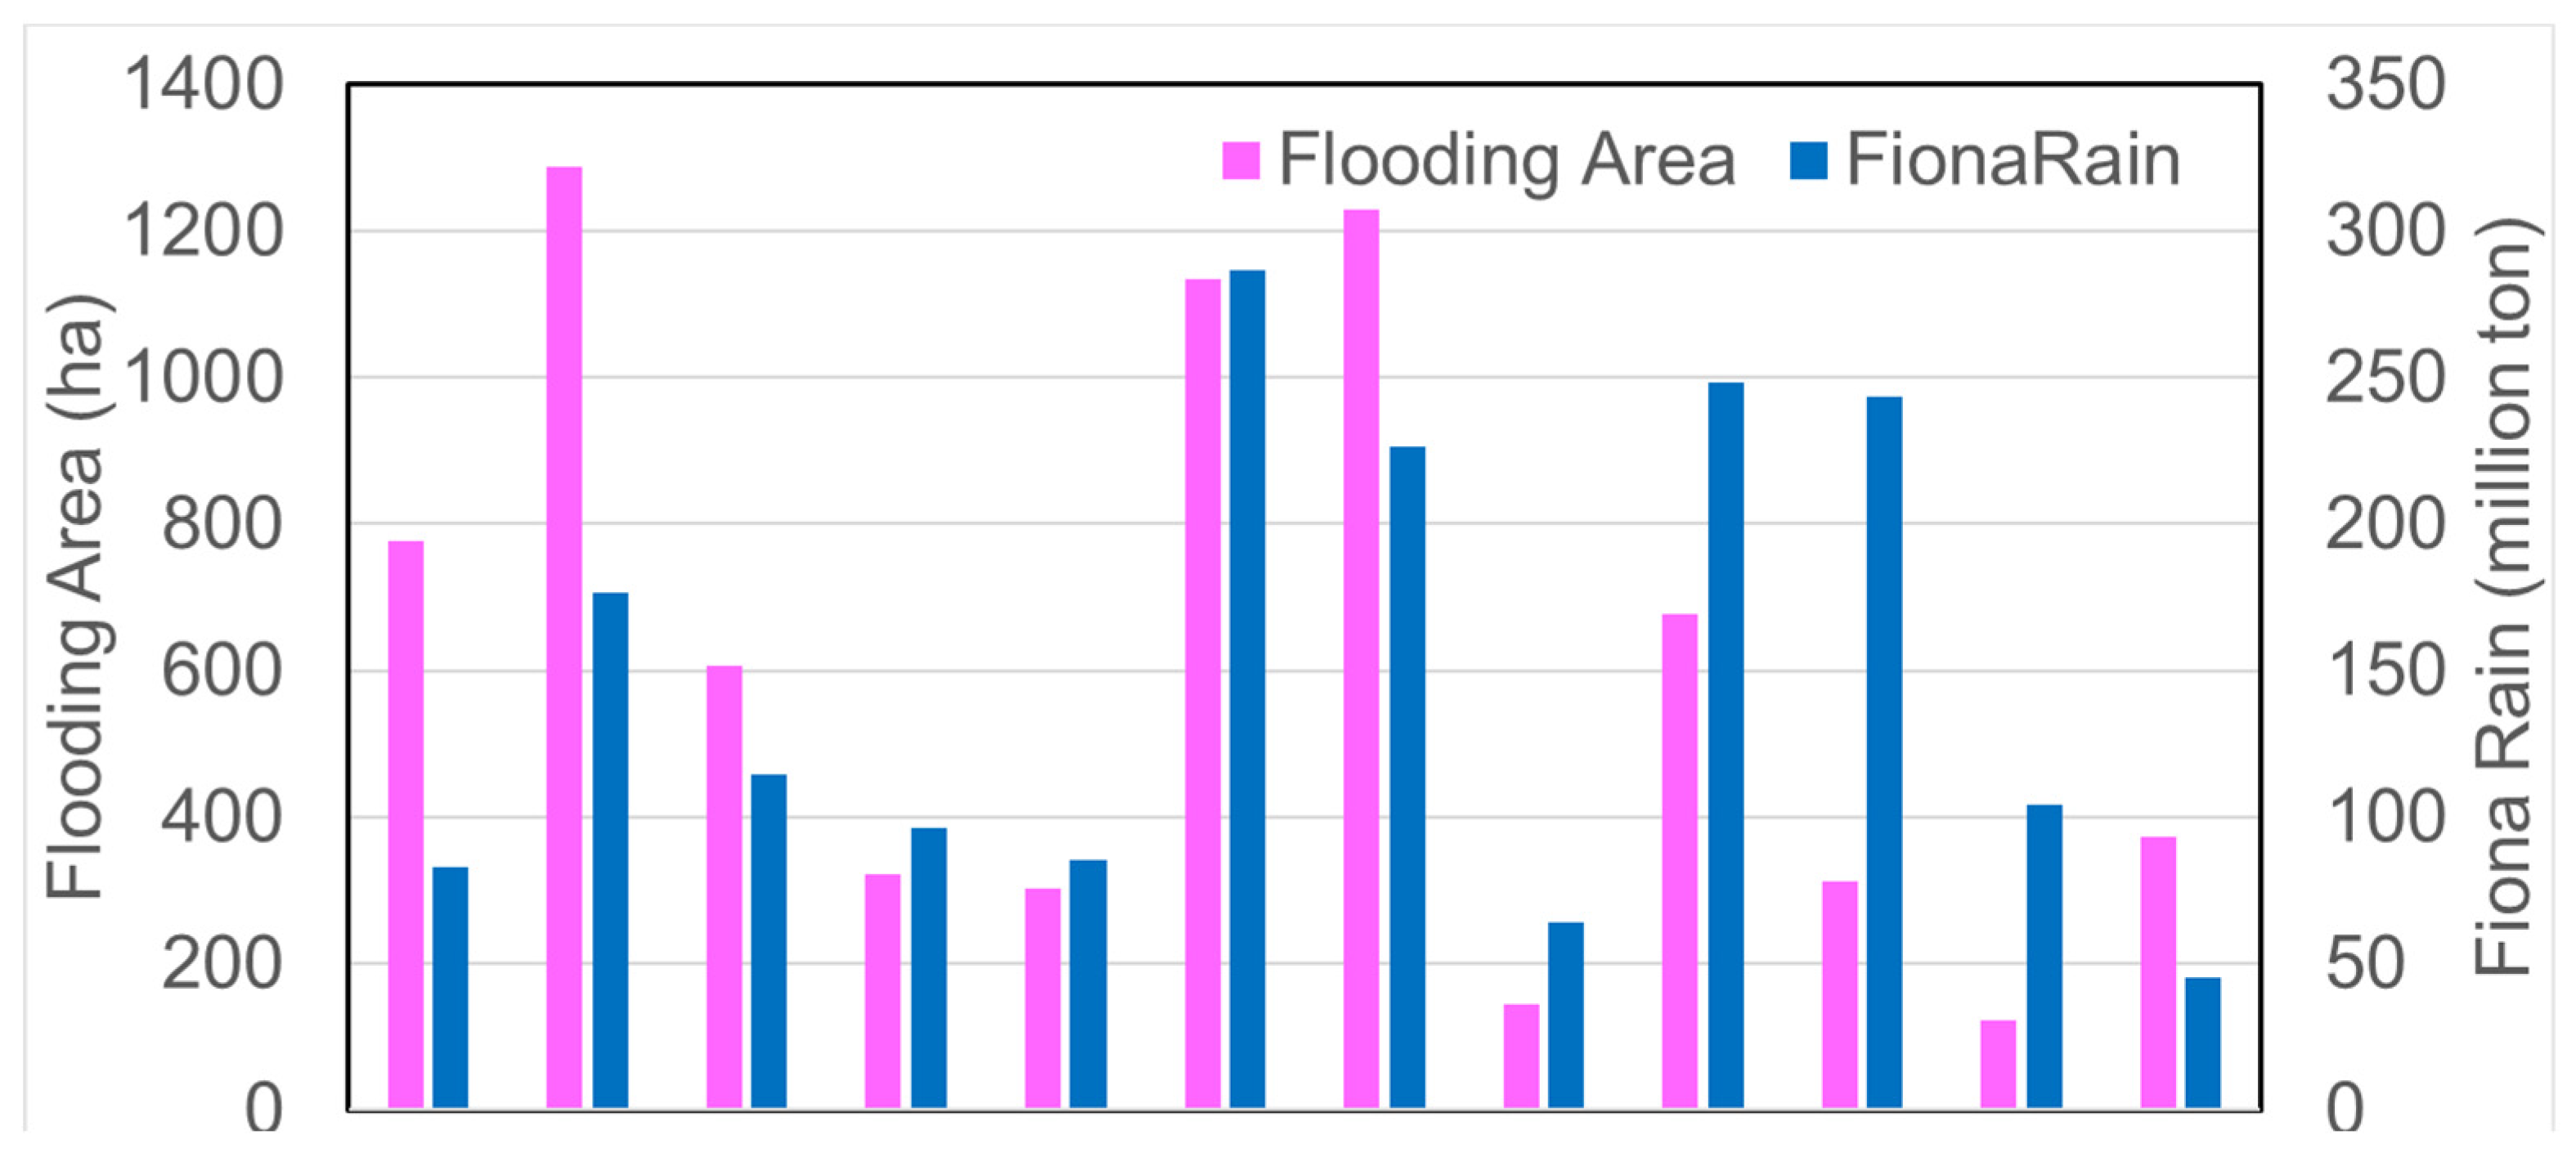
3.4. Exploration of Potential Drivers to Surface Inundation
4. Discussion
5. Conclusions
Author Contributions
Funding
Data Availability Statement
Conflicts of Interest
Appendix A. Classification Accuracies for Surface Inundation

| Permanent Water | Flooding | Mangroves | Herbaceous Cover | Forests | Urban | Producer Accuracy | |
|---|---|---|---|---|---|---|---|
| Permanent Water | 30 | 0 | 0 | 0 | 0 | 0 | 1 |
| Flooding | 0 | 26 | 0 | 0 | 0 | 0 | 1 |
| Mangroves | 0 | 0 | 29 | 2 | 3 | 0 | 0.85 |
| Herbaceous Cover | 0 | 0 | 5 | 45 | 4 | 0 | 0.83 |
| Forests | 0 | 0 | 2 | 3 | 9 | 0 | 0.64 |
| Urban | 0 | 0 | 1 | 2 | 4 | 21 | 0.75 |
| User Accuracy | 1 | 1 | 0.78 | 0.87 | 0.45 | 1 |
| Date | Kappa | User Accuracy for Flooding | Producer Accuracy for Flooding | Overall Accuracy | SAR Image Coverage |
|---|---|---|---|---|---|
| 21 September 2017 (Maria, independent validation) | 0.83 | 1 | 1 | 0.86 | 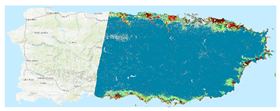 |
| 31 July 2020 (after a big rainfall event) | 0.95 | 1 | 0.98 | 0.96 | 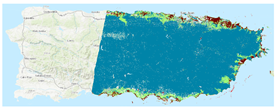 |
| 19 September 2022 (Fiona) | 0.93 | 1 | 1 | 0.94 | 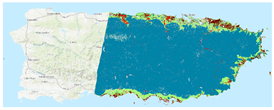 |
| 6 November 2022 (after a big rainfall event) | 0.95 | 1 | 0.99 | 0.96 | 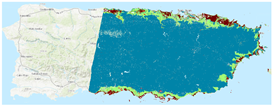 |

References
- USGCRP. Fifth National Climate Assessment; U.S. Global Change Research Program: Washington, DC, USA, 2023.
- Cai, W.J.; Wang, G.J.; Santoso, A.; McPhaden, M.J.; Wu, L.X.; Jin, F.F.; Timmermann, A.; Collins, M.; Vecchi, G.; Lengaigne, M.; et al. Increased frequency of extreme La Nina events under greenhouse warming. Nat. Clim. Chang. 2015, 5, 132–137. [Google Scholar] [CrossRef]
- Cai, W.J.; Borlace, S.; Lengaigne, M.; van Rensch, P.; Collins, M.; Vecchi, G.; Timmermann, A.; Santoso, A.; McPhaden, M.J.; Wu, L.X.; et al. Increasing frequency of extreme El Nino events due to greenhouse warming. Nat. Clim. Chang. 2014, 4, 111–116. [Google Scholar] [CrossRef]
- Sippo, J.Z.; Lovelock, C.E.; Santos, I.R.; Sanders, C.J.; Maher, D.T. Mangrove mortality in a changing climate: An overview. Estuar. Coast. Shelf Sci. 2018, 215, 241–249. [Google Scholar] [CrossRef]
- Duke, N.C.; Kovacs, J.M.; Griffiths, A.D.; Preece, L.; Hill, D.J.E.; van Oosterzee, P.; Mackenzie, J.; Morning, H.S.; Burrows, D. Large-scale dieback of mangroves in Australia’s Gulf of Carpentaria: A severe ecosystem response, coincidental with an unusually extreme weather event. Mar. Freshw. Res. 2017, 68, 1816–1829. [Google Scholar] [CrossRef]
- Hauer, M.E.; Fussell, E.; Mueller, V.; Burkett, M.; Call, M.; Abel, K.; McLeman, R.; Wrathall, D. Sea-level rise and human migration. Nat. Rev. Earth Environ. 2020, 1, 28–39. [Google Scholar] [CrossRef]
- Neumann, B.; Vafeidis, A.T.; Zimmermann, J.; Nicholls, R.J. Future Coastal Population Growth and Exposure to Sea-Level Rise and Coastal Flooding—A Global Assessment. PLoS ONE 2015, 10, e0118571. [Google Scholar] [CrossRef] [PubMed]
- Uriarte, M.; Thompson, J.; Zimmerman, J.K. Hurricane María tripled stem breaks and doubled tree mortality relative to other major storms. Nat. Commun. 2019, 10, 1362. [Google Scholar] [CrossRef]
- Yu, M.; Gao, Q. Prolonged coastal inundation detected with synthetic aperture radar significantly retarded functional recovery of mangroves after major hurricanes. Landsc. Ecol. 2023, 38, 169–183. [Google Scholar] [CrossRef]
- Patrick, C.J.; Yeager, L.; Armitage, A.R.; Carvallo, F.; Congdon, V.M.; Dunton, K.H.; Fisher, M.; Hardison, A.K.; Hogan, J.D.; Hosen, J.; et al. A System Level Analysis of Coastal Ecosystem Responses to Hurricane Impacts. Estuaries Coasts 2020, 43, 943–959. [Google Scholar] [CrossRef]
- Ye, F.; Huang, W.; Zhang, Y.J.; Moghimi, S.; Myers, E.; Pe’eri, S.; Yu, H.C. A cross-scale study for compound flooding processes during Hurricane Florence. Nat. Hazards Earth Syst. Sci. 2021, 21, 1703–1719. [Google Scholar] [CrossRef]
- Gori, A.; Lin, N.; Xi, D.; Emanuel, K. Tropical cyclone climatology change greatly exacerbates US extreme rainfall–surge hazard. Nat. Clim. Chang. 2022, 12, 171–178. [Google Scholar] [CrossRef]
- Teng, J.; Jakeman, A.J.; Vaze, J.; Croke, B.F.W.; Dutta, D.; Kim, S. Flood inundation modelling: A review of methods, recent advances and uncertainty analysis. Environ. Model. Softw. 2017, 90, 201–216. [Google Scholar] [CrossRef]
- Huang, C.; Chen, Y.; Zhang, S.; Wu, J. Detecting, Extracting, and Monitoring Surface Water from Space Using Optical Sensors: A Review. Rev. Geophys. 2018, 56, 333–360. [Google Scholar] [CrossRef]
- Heimhuber, V.; Tulbure, M.G.; Broich, M. Modeling multidecadal surface water inundation dynamics and key drivers on large river basin scale using multiple time series of Earth-observation and river flow data. Water Resour. Res. 2017, 53, 1251–1269. [Google Scholar] [CrossRef]
- DeVries, B.; Huang, C.; Armston, J.; Huang, W.; Jones, J.W.; Lang, M.W. Rapid and robust monitoring of flood events using Sentinel-1 and Landsat data on the Google Earth Engine. Remote Sens. Environ. 2020, 240, 111664. [Google Scholar] [CrossRef]
- Wulder, M.A.; Loveland, T.R.; Roy, D.P.; Crawford, C.J.; Masek, J.G.; Woodcock, C.E.; Allen, R.G.; Anderson, M.C.; Belward, A.S.; Cohen, W.B.; et al. Current status of Landsat program, science, and applications. Remote Sens. Environ. 2019, 225, 127–147. [Google Scholar] [CrossRef]
- Pahlevan, N.; Chittimalli, S.K.; Balasubramanian, S.V.; Vellucci, V. Sentinel-2/Landsat-8 product consistency and implications for monitoring aquatic systems. Remote Sens. Environ. 2019, 220, 19–29. [Google Scholar] [CrossRef]
- Torres, R.; Snoeij, P.; Geudtner, D.; Bibby, D.; Davidson, M.; Attema, E.; Potin, P.; Rommen, B.; Floury, N.; Brown, M.; et al. GMES Sentinel-1 mission. Remote Sens. Environ. 2012, 120, 9–24. [Google Scholar] [CrossRef]
- Jiang, X.; Liang, S.; He, X.; Ziegler, A.D.; Lin, P.; Pan, M.; Wang, D.; Zou, J.; Hao, D.; Mao, G.; et al. Rapid and large-scale mapping of flood inundation via integrating spaceborne synthetic aperture radar imagery with unsupervised deep learning. ISPRS J. Photogramm. Remote Sens. 2021, 178, 36–50. [Google Scholar] [CrossRef]
- Gorelick, N.; Hancher, M.; Dixon, M.; Ilyushchenko, S.; Thau, D.; Moore, R. Google Earth Engine: Planetary-scale geospatial analysis for everyone. Remote Sens. Environ. 2017, 202, 18–27. [Google Scholar] [CrossRef]
- Liang, J.; Liu, D. A local thresholding approach to flood water delineation using Sentinel-1 SAR imagery. ISPRS J. Photogramm. Remote Sens. 2020, 159, 53–62. [Google Scholar] [CrossRef]
- Shen, X.; Wang, D.; Mao, K.; Anagnostou, E.; Hong, Y. Inundation Extent Mapping by Synthetic Aperture Radar: A Review. Remote Sens. 2019, 11, 879. [Google Scholar] [CrossRef]
- Cian, F.; Marconcini, M.; Ceccato, P. Normalized Difference Flood Index for rapid flood mapping: Taking advantage of EO big data. Remote Sens. Environ. 2018, 209, 712–730. [Google Scholar] [CrossRef]
- Clement, M.A.; Kilsby, C.G.; Moore, P. Multi-temporal synthetic aperture radar flood mapping using change detection. J. Flood Risk Manag. 2018, 11, 152–168. [Google Scholar] [CrossRef]
- Zhan, P.; Zhu, W.; Li, N. An automated rice mapping method based on flooding signals in synthetic aperture radar time series. Remote Sens. Environ. 2021, 252, 112112. [Google Scholar] [CrossRef]
- Huang, W.; DeVries, B.; Huang, C.; Lang, M.W.; Jones, J.W.; Creed, I.F.; Carroll, M.L. Automated Extraction of Surface Water Extent from Sentinel-1 Data. Remote Sens. 2018, 10, 797. [Google Scholar] [CrossRef]
- Leauthaud, C.; Belaud, G.; Duvail, S.; Moussa, R.; Grünberger, O.; Albergel, J. Characterizing floods in the poorly gauged wetlands of the Tana River Delta, Kenya, using a water balance model and satellite data. Hydrol. Earth Syst. Sci. 2013, 17, 3059–3075. [Google Scholar] [CrossRef]
- Ogilvie, A.; Belaud, G.; Delenne, C.; Bailly, J.-S.; Bader, J.-C.; Oleksiak, A.; Ferry, L.; Martin, D. Decadal monitoring of the Niger Inner Delta flood dynamics using MODIS optical data. J. Hydrol. 2015, 523, 368–383. [Google Scholar] [CrossRef]
- López-Marrero, T.; Heartsill-Scalley, T.; Rivera-López, C.F.; Escalera-García, I.A.; Echevarría-Ramos, M. Broadening Our Understanding of Hurricanes and Forests on the Caribbean Island of Puerto Rico: Where and What Should We Study Now? Forests 2019, 10, 710. [Google Scholar] [CrossRef]
- Pasch, R.J.; Penny, A.B.; Berg, R. National Hurricane Center Tropical Cyclone Report: Hurricane Maria; (AL152017); National Hurricane Center: Miami, FL, USA, 2019; pp. 1–48.
- Pasch, R.J.; Reinhart, B.J.; Alaka, L. National Hurricane Center Tropical Cyclone Report Hurricane Fiona; (AL072022); National Hurricane Center: Miami, FL, USA, 2023; p. 60.
- NOAA National Centers for Environmental Information (NCEI). U.S. Billion-Dollar Weather and Climate Disasters. 2023. Available online: https://www.ncei.noaa.gov/access/metadata/landing-page/bin/iso?id=gov.noaa.nodc:0209268 (accessed on 10 January 2024).
- Hoekman, D.H.; Reiche, J. Multi-model radiometric slope correction of SAR images of complex terrain using a two-stage semi-empirical approach. Remote Sens. Environ. 2015, 156, 1–10. [Google Scholar] [CrossRef]
- Vollrath, A.; Mullissa, A.; Reiche, J. Angular-Based Radiometric Slope Correction for Sentinel-1 on Google Earth Engine. Remote Sens. 2020, 12, 1867. [Google Scholar] [CrossRef]
- Breiman, L. Random Forests. Mach. Learn. 2001, 45, 5–32. [Google Scholar] [CrossRef]
- Office for Coastal Management. C-CAP Land Cover, Puerto Rico, 2010; NOAA Office for Coastal Management: North Charleston, SC, USA, 2020.
- Yu, M.; Gao, Q. Topography, drainage capability, and legacy of drought differentiate tropical ecosystem response to and recovery from major hurricanes. Environ. Res. Lett. 2020, 15, 104046. [Google Scholar] [CrossRef]
- R Core Team. R: A Language and Environment for Statistical Computing; R Core Team: Vienna, Austria, 2020. [Google Scholar]
- Yu, M.; Gao, Q.; Gao, C.; Wang, C. Extent of Night Warming and Spatially Heterogeneous Cloudiness Differentiate Temporal Trend of Greenness in Mountainous Tropics in the New Century. Sci. Rep. 2017, 7, 41256. [Google Scholar] [CrossRef] [PubMed]
- Zhu, X.X.; Montazeri, S.; Ali, M.; Hua, Y.; Wang, Y.; Mou, L.; Shi, Y.; Xu, F.; Bamler, R. Deep Learning Meets SAR: Concepts, models, pitfalls, and perspectives. IEEE Geosci. Remote Sens. Mag. 2021, 9, 143–172. [Google Scholar] [CrossRef]
- Kim, J.-W.; Lu, Z.; Jones, J.W.; Shum, C.K.; Lee, H.; Jia, Y. Monitoring Everglades freshwater marsh water level using L-band synthetic aperture radar backscatter. Remote Sens. Environ. 2014, 150, 66–81. [Google Scholar] [CrossRef]
- Sagin, J.; Sizo, A.; Wheater, H.; Jardine, T.D.; Lindenschmidt, K.-E. A water coverage extraction approach to track inundation in the Saskatchewan River Delta, Canada. Int. J. Remote Sens. 2015, 36, 764–781. [Google Scholar] [CrossRef]
- Frazier, P.; Page, K. A reach-scale remote sensing technique to relate wetland inundation to river flow. River Res. Appl. 2009, 25, 836–849. [Google Scholar] [CrossRef]
- Gao, Q.; Yu, M. Canopy Density and Roughness Differentiate Resistance of a Tropical Dry Forest to Major Hurricane Damage. Remote Sens. 2021, 13, 2262. [Google Scholar] [CrossRef]
- Garner, A.J. Observed increases in North Atlantic tropical cyclone peak intensification rates. Sci. Rep. 2023, 13, 16299. [Google Scholar] [CrossRef]


Disclaimer/Publisher’s Note: The statements, opinions and data contained in all publications are solely those of the individual author(s) and contributor(s) and not of MDPI and/or the editor(s). MDPI and/or the editor(s) disclaim responsibility for any injury to people or property resulting from any ideas, methods, instructions or products referred to in the content. |
© 2024 by the authors. Licensee MDPI, Basel, Switzerland. This article is an open access article distributed under the terms and conditions of the Creative Commons Attribution (CC BY) license (https://creativecommons.org/licenses/by/4.0/).
Share and Cite
Yu, M.; Gao, Q. Assessment of Surface Inundation Monitoring and Drivers after Major Storms in a Tropical Island. Remote Sens. 2024, 16, 503. https://doi.org/10.3390/rs16030503
Yu M, Gao Q. Assessment of Surface Inundation Monitoring and Drivers after Major Storms in a Tropical Island. Remote Sensing. 2024; 16(3):503. https://doi.org/10.3390/rs16030503
Chicago/Turabian StyleYu, Mei, and Qiong Gao. 2024. "Assessment of Surface Inundation Monitoring and Drivers after Major Storms in a Tropical Island" Remote Sensing 16, no. 3: 503. https://doi.org/10.3390/rs16030503
APA StyleYu, M., & Gao, Q. (2024). Assessment of Surface Inundation Monitoring and Drivers after Major Storms in a Tropical Island. Remote Sensing, 16(3), 503. https://doi.org/10.3390/rs16030503