Technical Note

Advanced Detection of Invasive Neophytes in Agricultural Landscapes: A Multisensory and Multiscale Remote Sensing Approach

1
School of Engineering and Computer Science, Bern University of Applied Sciences, 2501 Biel, Switzerland
2
Umwelt- und GeodatenManagement GbR, 06108 Halle (Saale), Germany
3
Institute for Geo-Information and Land Surveying, Anhalt University of Applied Sciences, Seminarplatz 2a, 06846 Dessau, Germany
*
Author to whom correspondence should be addressed.
Remote Sens. 2024, 16(3), 500; https://doi.org/10.3390/rs16030500
Submission received: 19 December 2023 / Revised: 23 January 2024 / Accepted: 25 January 2024 / Published: 28 January 2024
(This article belongs to the Special Issue Remote Sensing for Management of Invasive Species)

Abstract

:
The sustainable provision of ecological products and services, both natural and man-made, faces a substantial threat emanating from invasive plant species (IPS), which inflict considerable economic and ecological harm on a global scale. They are widely recognized as one of the primary drivers of global biodiversity decline and have become the focal point of an increasing number of studies. The integration of remote sensing (RS) and geographic information systems (GIS) plays a pivotal role in their detection and classification across a diverse range of research endeavors, emphasizing the critical significance of accounting for the phenological stages of the targeted species when endeavoring to accurately delineate their distribution and occurrences. This study is centered on this fundamental premise, as it endeavors to amass terrestrial data encompassing the phenological stages and spectral attributes of the specified IPS, with the overarching objective of ascertaining the most opportune time frames for their detection. Moreover, it involves the development and validation of a detection and classification algorithm, harnessing a diverse array of RS datasets, including satellite and unmanned aerial vehicle (UAV) imagery spanning the spectrum from RGB to multispectral and near-infrared (NIR). Taken together, our investigation underscores the advantages of employing an array of RS datasets in conjunction with the phenological stages, offering an economically efficient and adaptable solution for the detection and monitoring of invasive plant species. Such insights hold the potential to inform both present and future policymaking pertaining to the management of invasive species in agricultural and natural ecosystems.

1. Introduction

The introduction of non-indigenous species into previously undisturbed ecosystems is recognized as a primary threat to global biodiversity, leading to the homogenization of flora and fauna through competition and habitat modification [1,2]. In the specific context of agriculture, the presence of IPS can have detrimental consequences, including reduced crop yields, elevated management expenses, and potential threats to food security, as indicated in several studies [3,4,5,6,7]. Furthermore, the encroachment of IPS into agricultural areas can also result in adverse ecological impacts, such as alterations in soil properties and nutrient cycling [8]. The monetary cost of invasive species in Germany alone is estimated to be a substantial $829.11 million, with $213.95 million attributed to plants [9]. Despite the gravity of this issue, there remains a significant gap in comprehending the full extent of IPS spread in agricultural landscapes and the implementation of effective management strategies to control them [9]. In this context, the development of innovative tools for their detection and monitoring in agricultural areas is of paramount importance. RS techniques such as classification algorithms of datasets including aerial and satellite imagery, have exhibited remarkable potential for providing a cost-effective and efficient means of monitoring the spread of IPS over vast geographical areas [10,11,12,13].
The primary objective of this study was twofold: (1) to identify the phenological traits of specific IPS that might be suitable for RS classification approaches and (2) to design a novel tool for the automated processing of RS data to enable the precise mapping of the spatial distribution of IPS in agricultural areas. While terrestrial mapping approaches can deliver highly precise datasets on a small scale, analyzing large-scale distributions necessitates the utilization of RS data and methodologies due to constraints related to time, cost, and personnel [14]. The assessment of RS data is a well-established and effective methodology in biotope mapping and biodiversity research, offering consistent data coverage over extensive areas when calibrated via terrestrial mapping [15,16]. The detection and mapping of plant species, including IPS, have been demonstrated using datasets such as aerial photography, hyperspectral RS data, and radar data [17,18,19,20]. Furthermore, the utilization of UAVs for efficient IPS detection is on the rise [11,21,22,23,24]. For instance, a combination of UAV imagery and classification software such as eCognition Developer 9.0 was used to determine the suitability of such for the detection of Asian knotweed (Fallopia japonica, Fallopia × bohemica), determining that it is possible that this specific IPS can be satisfactorily mapped and monitored via RS [21]. However, systematic studies on the suitability of multisensory and multiscale RS datasets and RS approaches for the detection and mapping of invasive neophytes on agricultural land in Germany have yet to be conducted. To address this gap, study areas were selected based on known occurrences of nine relevant neophytes for central Germany. These study areas were meticulously surveyed, to collect ground control data to train and validate our classification algorithm. We employed segment-based classification approaches to evaluate high-resolution aerial and satellite imagery, as well as multispectral and NIR cameras. For each neophyte, optimal time frames for their detection based on RS sensitive phenological traits were determined and evaluated [25]. This knowledge enables the adaptation of the optimal detection time frame and classification parameters used in our approach for varying climatic conditions and landscapes. Additionally, this study yielded fundamental knowledge regarding the minimum spectral and geometric requirements necessary for the detection and classification of the researched IPS.
The significance of our study is founded in the necessity of the early detection and monitoring of IPS on agricultural land to prevent the displacement of native species and associated negative impacts such as erosion [26]. Once IPS such as Giant hogweed (Heracleum mantegazzianum) become established in an ecosystem, their removal becomes increasingly challenging [26,27]. Moreover, these species can be easily transported from one region to another, often unintentionally. A small quantity of seeds or rhizomes in contaminated soil material can facilitate the rapid spread of species such as Asian knotweed (Fallopia japonica) or Turkish warty cabbage (Bunias orientalis) over large distances [28]. Therefore, the prevention, detection, monitoring, and management of IPS are vital for the preservation of biodiversity and ecological services, and RS, particularly the utilization of UAVs, holds significant promise for future sustainable management strategies [21,25,29].

2. Materials and Methods

2.1. Research into Critical Neophytes for Agriculture in Germany

The European Commission bears the responsibility of publishing the Union list, which formally designates invasive animal and plant species capable of posing a threat to biodiversity across Europe [30]. This Union list carries the weight of legal obligation and is devised with the overarching goals of averting, identifying, monitoring, and managing such species, thereby mitigating their potential repercussions on the natural and man-made ecosystems and ecological services of Europe [31]. As it currently stands, this list encompasses 88 distinct species, at least 48 of which, comprising 22 plant species and 26 animal species, are confirmed to be present within the territory of Germany [30,32,33]. One source of IPS occurrence reports for parts of Germany is the KORINA database, a repository of location-based data drawing from various sources [34]. Furthermore, the project’s website and mobile application serve as platforms for registered users to contribute location-based sightings of neophytes [34]. To streamline our list of potential species, we intersected these occurrence reports with geospatial data containing agricultural areas, thereby distilling the roster to those IPS that are confirmed to occur in significant numbers and possess the potential to significantly impact agricultural lands not only in Germany but also across the broader European context. These nine neophytes are succinctly enumerated in Table 1.

2.2. Setting up the Study Areas

The foundation for identifying suitable study areas was established through the intersection of occurrence reports from the KORINA database and the national plant atlas FloraWeb with data related to agricultural regions and land use in the federal state of Saxony-Anhalt [35,36].
In this process, specific criteria were applied to select these study areas. These criteria included the frequency of occurrence reports per site, the specific land use categories associated with individual agricultural areas (such as grassland, arable land, organic farmland, etc.), and the regional landscape type in which the area was situated. The objective was to encompass as wide a spectrum of morphological and ecological scenarios as possible. Following this initial pre-selection of prospective study areas, on-site field inspections were conducted. This step was imperative, as the occurrence reports could potentially be outdated, necessitating verification of the continued presence of the targeted IPS in sufficient numbers. Additional criteria for this selection phase included the uniformity of the vegetation stand and the precise location of individual plants, with an emphasis on minimizing obstructions like canopy cover. For sites meeting these stringent criteria, precise measurements were taken using a sub-meter accurate GNSS to ensure the precise spatial assignment of neophytes within the RS datasets. Furthermore, these study areas depicted in Figure 1 were subdivided into training and control sites situated near each other, facilitating comparability between them. For each IPS, a minimum of five training sites and five control sites were selected, ensuring a comprehensive and balanced dataset for our analysis. It is noteworthy that, in some instances, substantial neophyte populations were not found in the field. This was the case for three specific species, namely Cyperus esculentus, Abutilon theophrasti, and Datura stramonium. For these species, it was necessary to simulate a plant stand model within controlled spring barley and maize fields to gather extensive data concerning their phenological characteristics and suitability for deployment within an RS-based classification model.

2.3. Data Collection

The terrestrial dataset, integral for validating the classification algorithm and establishing the optimal time frames for RS detection based on the phenological stages, encompasses a multitude of variables we measured during our surveys of each study area. These variables include the dimensions and geographical coordinates of training or control sites, the predominant land use within the surveyed area, the prevailing environmental conditions during the survey, the collective coverage of both shrub and herbaceous layers as well as the extent of open ground coverage, the mean and maximum vegetation heights, the extent of neophyte coverage, an inventory of the plant species present along with information on species richness, and meticulous observations pertaining to the phenology of each neophyte. The latter factor proves particularly pivotal in the process of detecting and classifying these species, enabling their distinction from other plants. Furthermore, alongside the terrestrial surveys of each study area, we carried out photographic documentations to acquire both full-view and detailed imagery of the occurring plant species and their phenotype. For the species Cyperus esculentus, Abutilon theophrasti, and Datura stramonium, this documentation proved necessary due to the necessity of simulating occurrences using a plant stand model causing the absence of suitable RS datasets such as satellite imagery. Using a ladder and a Nikon D3100 RGB camera, high-angle imagery was captured at regular intervals, resulting in a comprehensive dataset documenting the phenological changes and traits for these three IPS.
In our preliminary investigations concerning the presence of neophytes on agricultural land in Germany, we delved into the selection of suitable RS datasets and methodologies. The suitability of a particular dataset for the classification approach hinged significantly on the occurrence of detectable phenological traits of the surveyed IPS. To streamline our data accusation approach, we hierarchically organized suitable RS datasets based on their presumed utility for detecting the targeted neophytes, following this order: airborne digital orthophotos (DOP) > WorldView02 (WV02) and WorldView03 (WV03) satellite imagery > RGB and hyperspectral camera (HySpex) gyrocopter datasets > RGB datasets acquired via unmanned aerial vehicles (UAVs). If a given dataset was unavailable or the occurrence of detectable phenological traits proved unsatisfactory, the subsequent data source (according to this hierarchy) was selected as a substitute. Table 2 depicts the RS data source used for each species and highlights a unique challenge when dealing with highly time-sensitive attributes such as phenological characteristics. Matching the occurrence of the phenological traits of an IPS with the availability of suitable data proved difficult for the preferred data sources: DOP and satellite imagery. For instance, only two of the nine neophytes were significantly represented in DOP or satellite imagery due to unsatisfactory weather conditions or a misalignment of the acquisition date of these datasets and the necessary occurrence of RS sensitive phenological traits. To ensure the latter, while minimizing temporal discrepancies between the terrestrial surveys and the acquisition date of the RS datasets, we attempted to align them as closely as possible. This further necessitated the inadequacy of specific datasets such as satellite imagery for the detection of these highly time-sensitive traits.

2.4. Detection Algorithm and Field Application

Our research, driven by the initial studies and the aspiration to establish a standardized classification methodology for the identification of neophytes using high-resolution RS data, prompted our exploration of software solutions capable of aggregating individual pixels into segments sharing similar spectral properties. Throughout the course of this study, we devised two distinct methodologies. The first method relied on eCognition, a versatile software capable of analyzing a diverse range of geospatial data, including satellite imagery, aerial photography, and LiDAR data [25,37]. Our preference for a segment-based classification approach over a pixel-based one was influenced by the former’s general tendency to yield greater accuracy and enhanced resilience to errors [38]. Pixel-based approaches traditionally employ individual pixels for training the classification model. However, it is essential to recognize that an object is not singularly represented by a solitary pixel, and the spectral signals of these individual pixels may exhibit subtle variations while still constituting parts of the same object [39,40]. In contrast, segmentation classification groups pixels with alike spectral properties into segments before executing the image classification [39,40]. This segmentation strategy enhances the precision and robustness of the classification results by mitigating noise, a characteristic especially pertinent to high-resolution datasets, characterized by a dense pixel distribution and intricate details, which can pose challenges for pixel-based approaches [39].
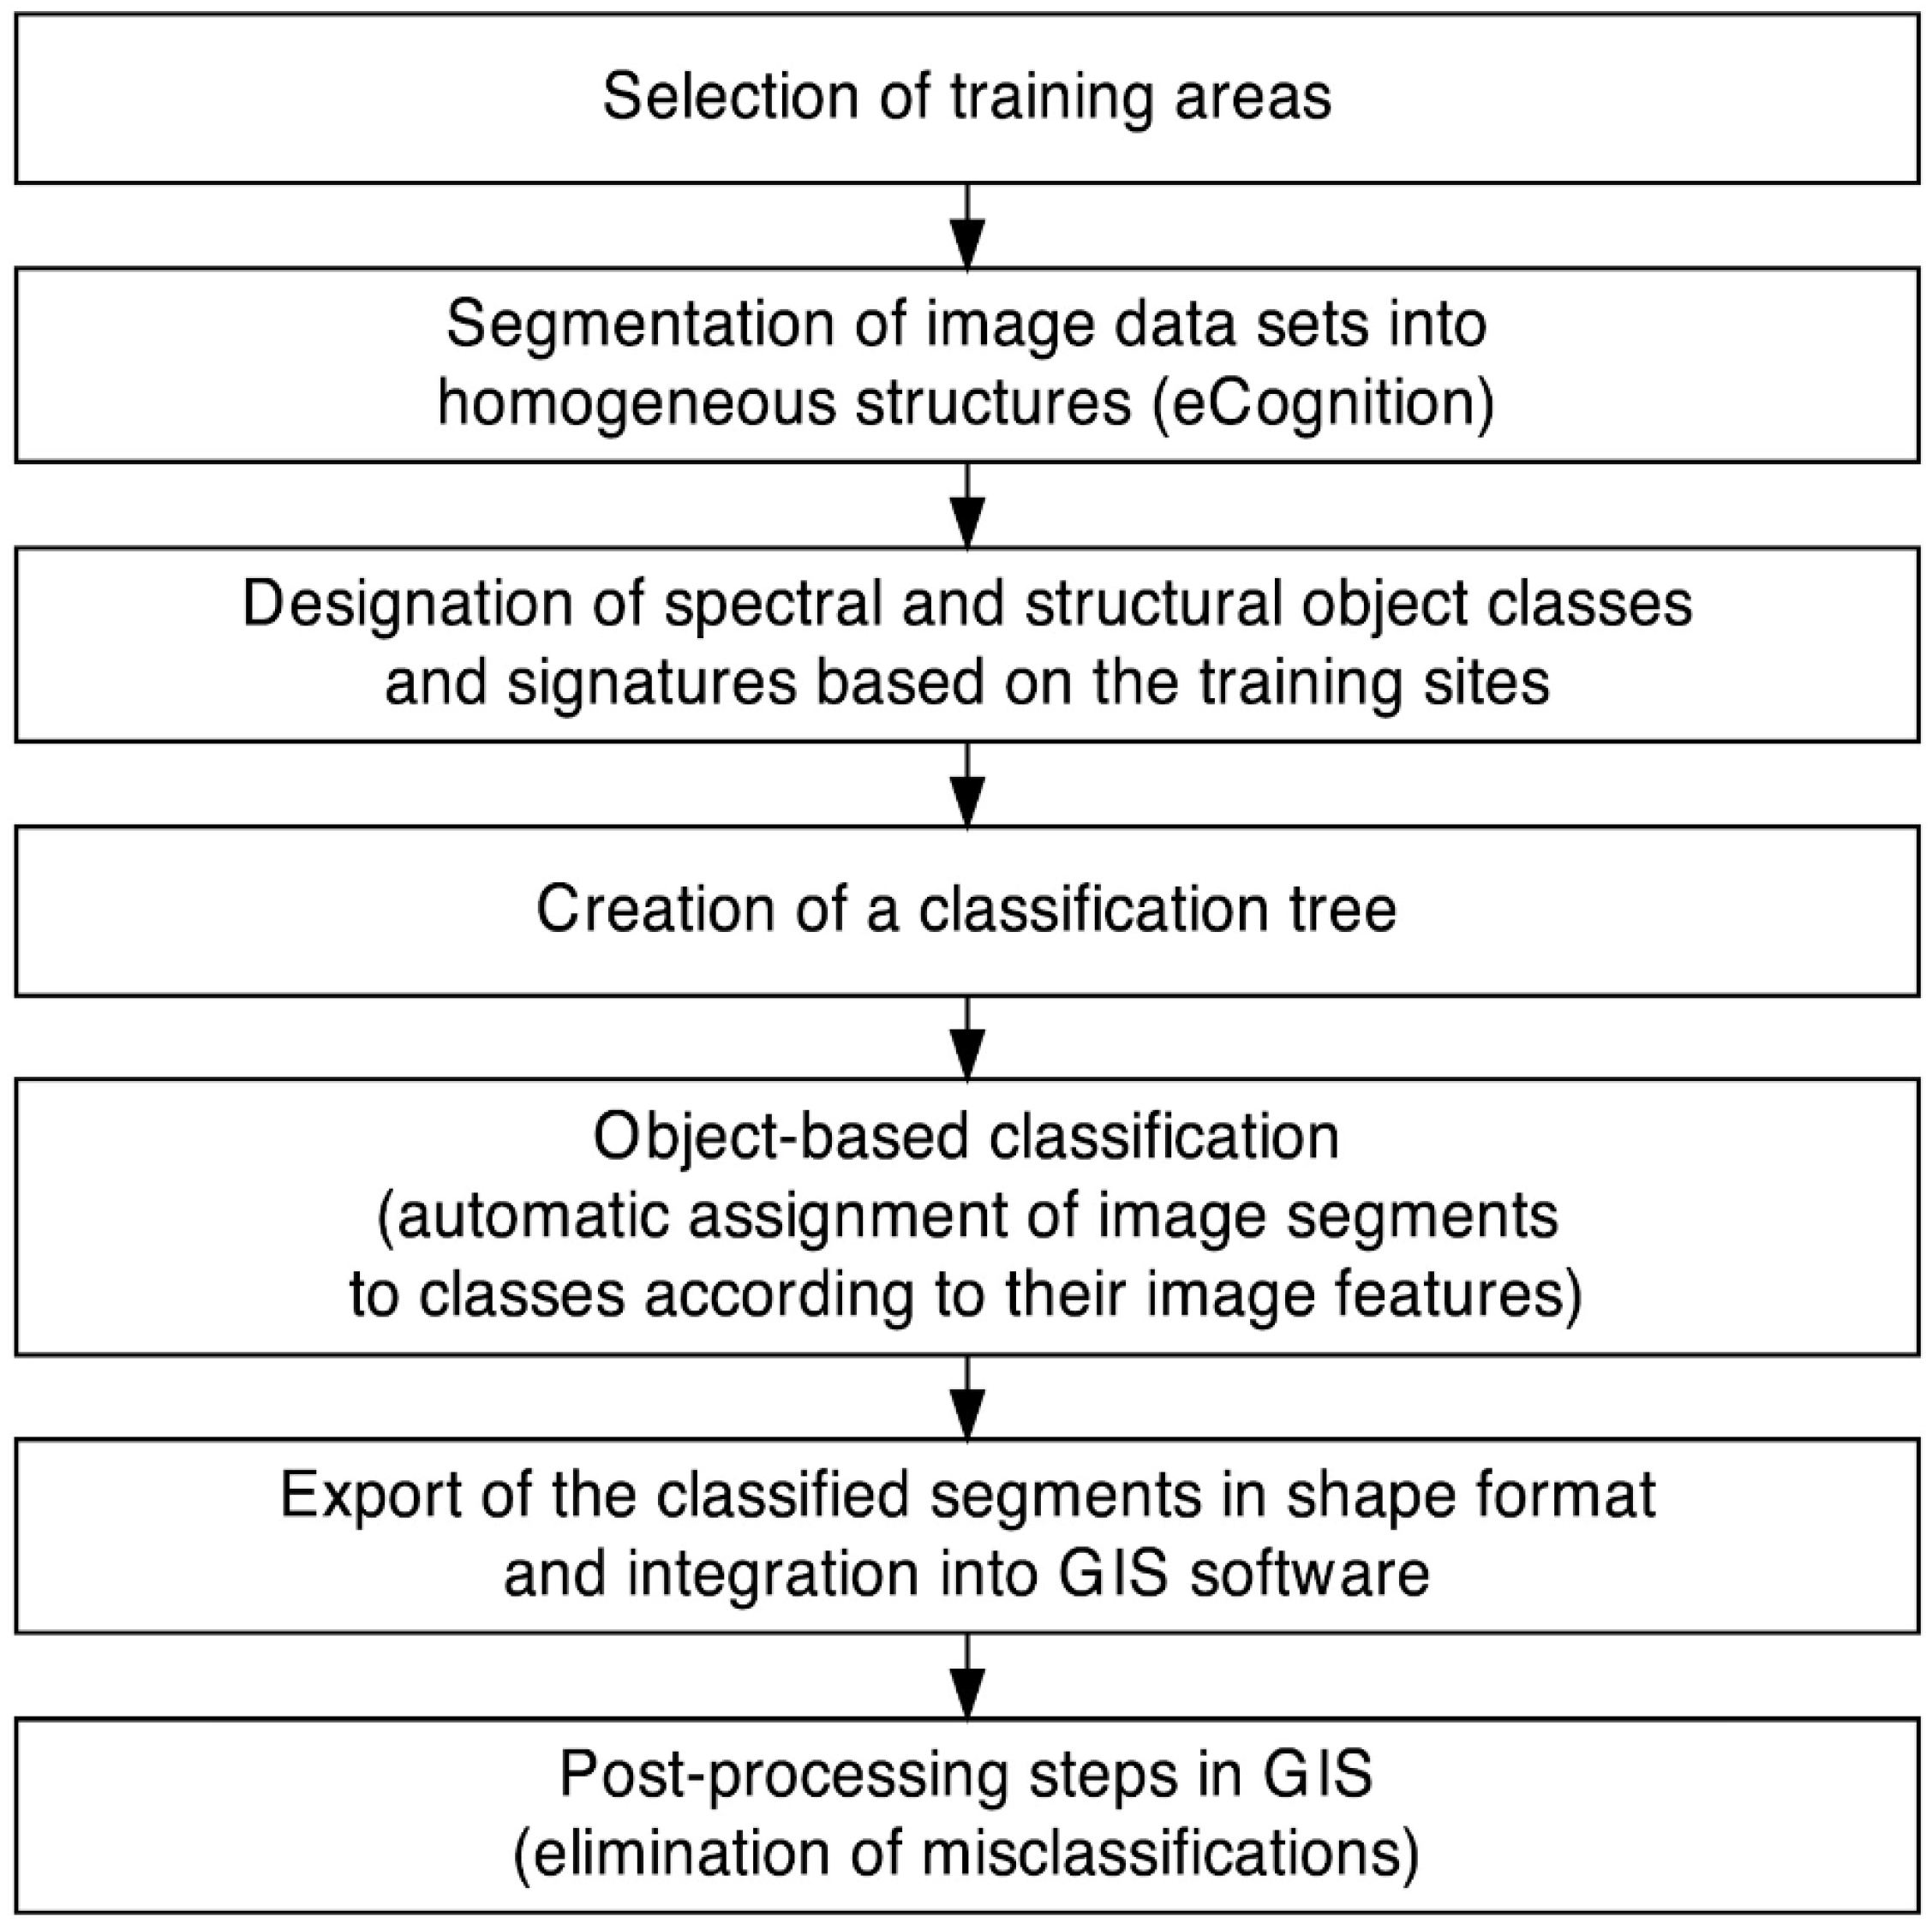
As depicted in Figure 2, our eCognition approach entailed several steps. Initially, we selected training areas and identified suitable RS datasets. Using eCognition, these datasets, such as satellite imagery, were segmented into coherent structures characterized by analogous spectral properties. Drawing from our predefined training areas and the information gathered about the phenology and distinctive plant features of each neophyte, we designated spectral and structural object classes and constructed classification trees. Possible classes were water, agricultural land, trees, grassland, and the targeted neophyte. After defining and training these classes, object- and segment-based classification were carried out. Using QGIS 2.8.0 and the ground truth data acquired through our terrestrial surveys the classification accuracy was calculated. These classification results were further validated using the control areas to verify the detection results based on the segment-based classification in size and position with real occurrences and to ascertain possible causes such as casted shadows for misclassifications. If necessary, we further optimized the classification trees inside of eCognition for species such as Heracleum mantegazzianum by adjusting the segmentation parameter and the spectral class thresholds. Detected misassignments can be easily excluded from a class when using a segment-based approach. For instance, Figure 3 depicts the classification result of a HySpex image for the targeted class Fallopia spec. highlighted in red. The two objects outlined in red on the right-hand side represent misassignments identified as tree species, which were excluded in the described post-processing steps to further improve the classification algorithm.
This streamlined process as depicted in Figure 2 served as the foundation of our workflow for each of the nine neophytes. Given consistent input datasets and sensors, this classification approach can be readily transferred to various regions, facilitating swift application. To validate this claim, we employed our trained segmentation classification automatically on a grassland area in the federal state of Thuringia where large occurrences of Bunias orientalis were reported.

3. Results

As expounded upon by researchers such as Müllerová et al. and others, the effectiveness of utilizing RS datasets for the detection of invasive plant species is intricately tied to the assessment of their phenological attributes [25,41,42,43,44]. Throughout our field surveys, comprehensive data regarding the phenological traits of each neophyte were gathered to ascertain the most appropriate features for the RS classification methodology. Additionally, we identified and researched the temporal window during which these botanical characteristics ought to be discernible within the RS datasets. By aligning the data acquisition process with the optimal time frame for detecting RS-applicable phenological characteristics, we aim to achieve the highest possible level of discrimination between invasive and indigenous species. The crucial findings stemming from our terrestrial surveys and remote sensing investigations are succinctly summarized in Table 3. For each neophyte, Table 3 depicts the most suitable phenological traits and their corresponding optimal and sub-optimal detection time frame for RS classification. Note that these results are based on our segmentation approach and are highly dependent on the used RS datasets depicted in Table 2.

3.1. Heracleum mantegazzianum

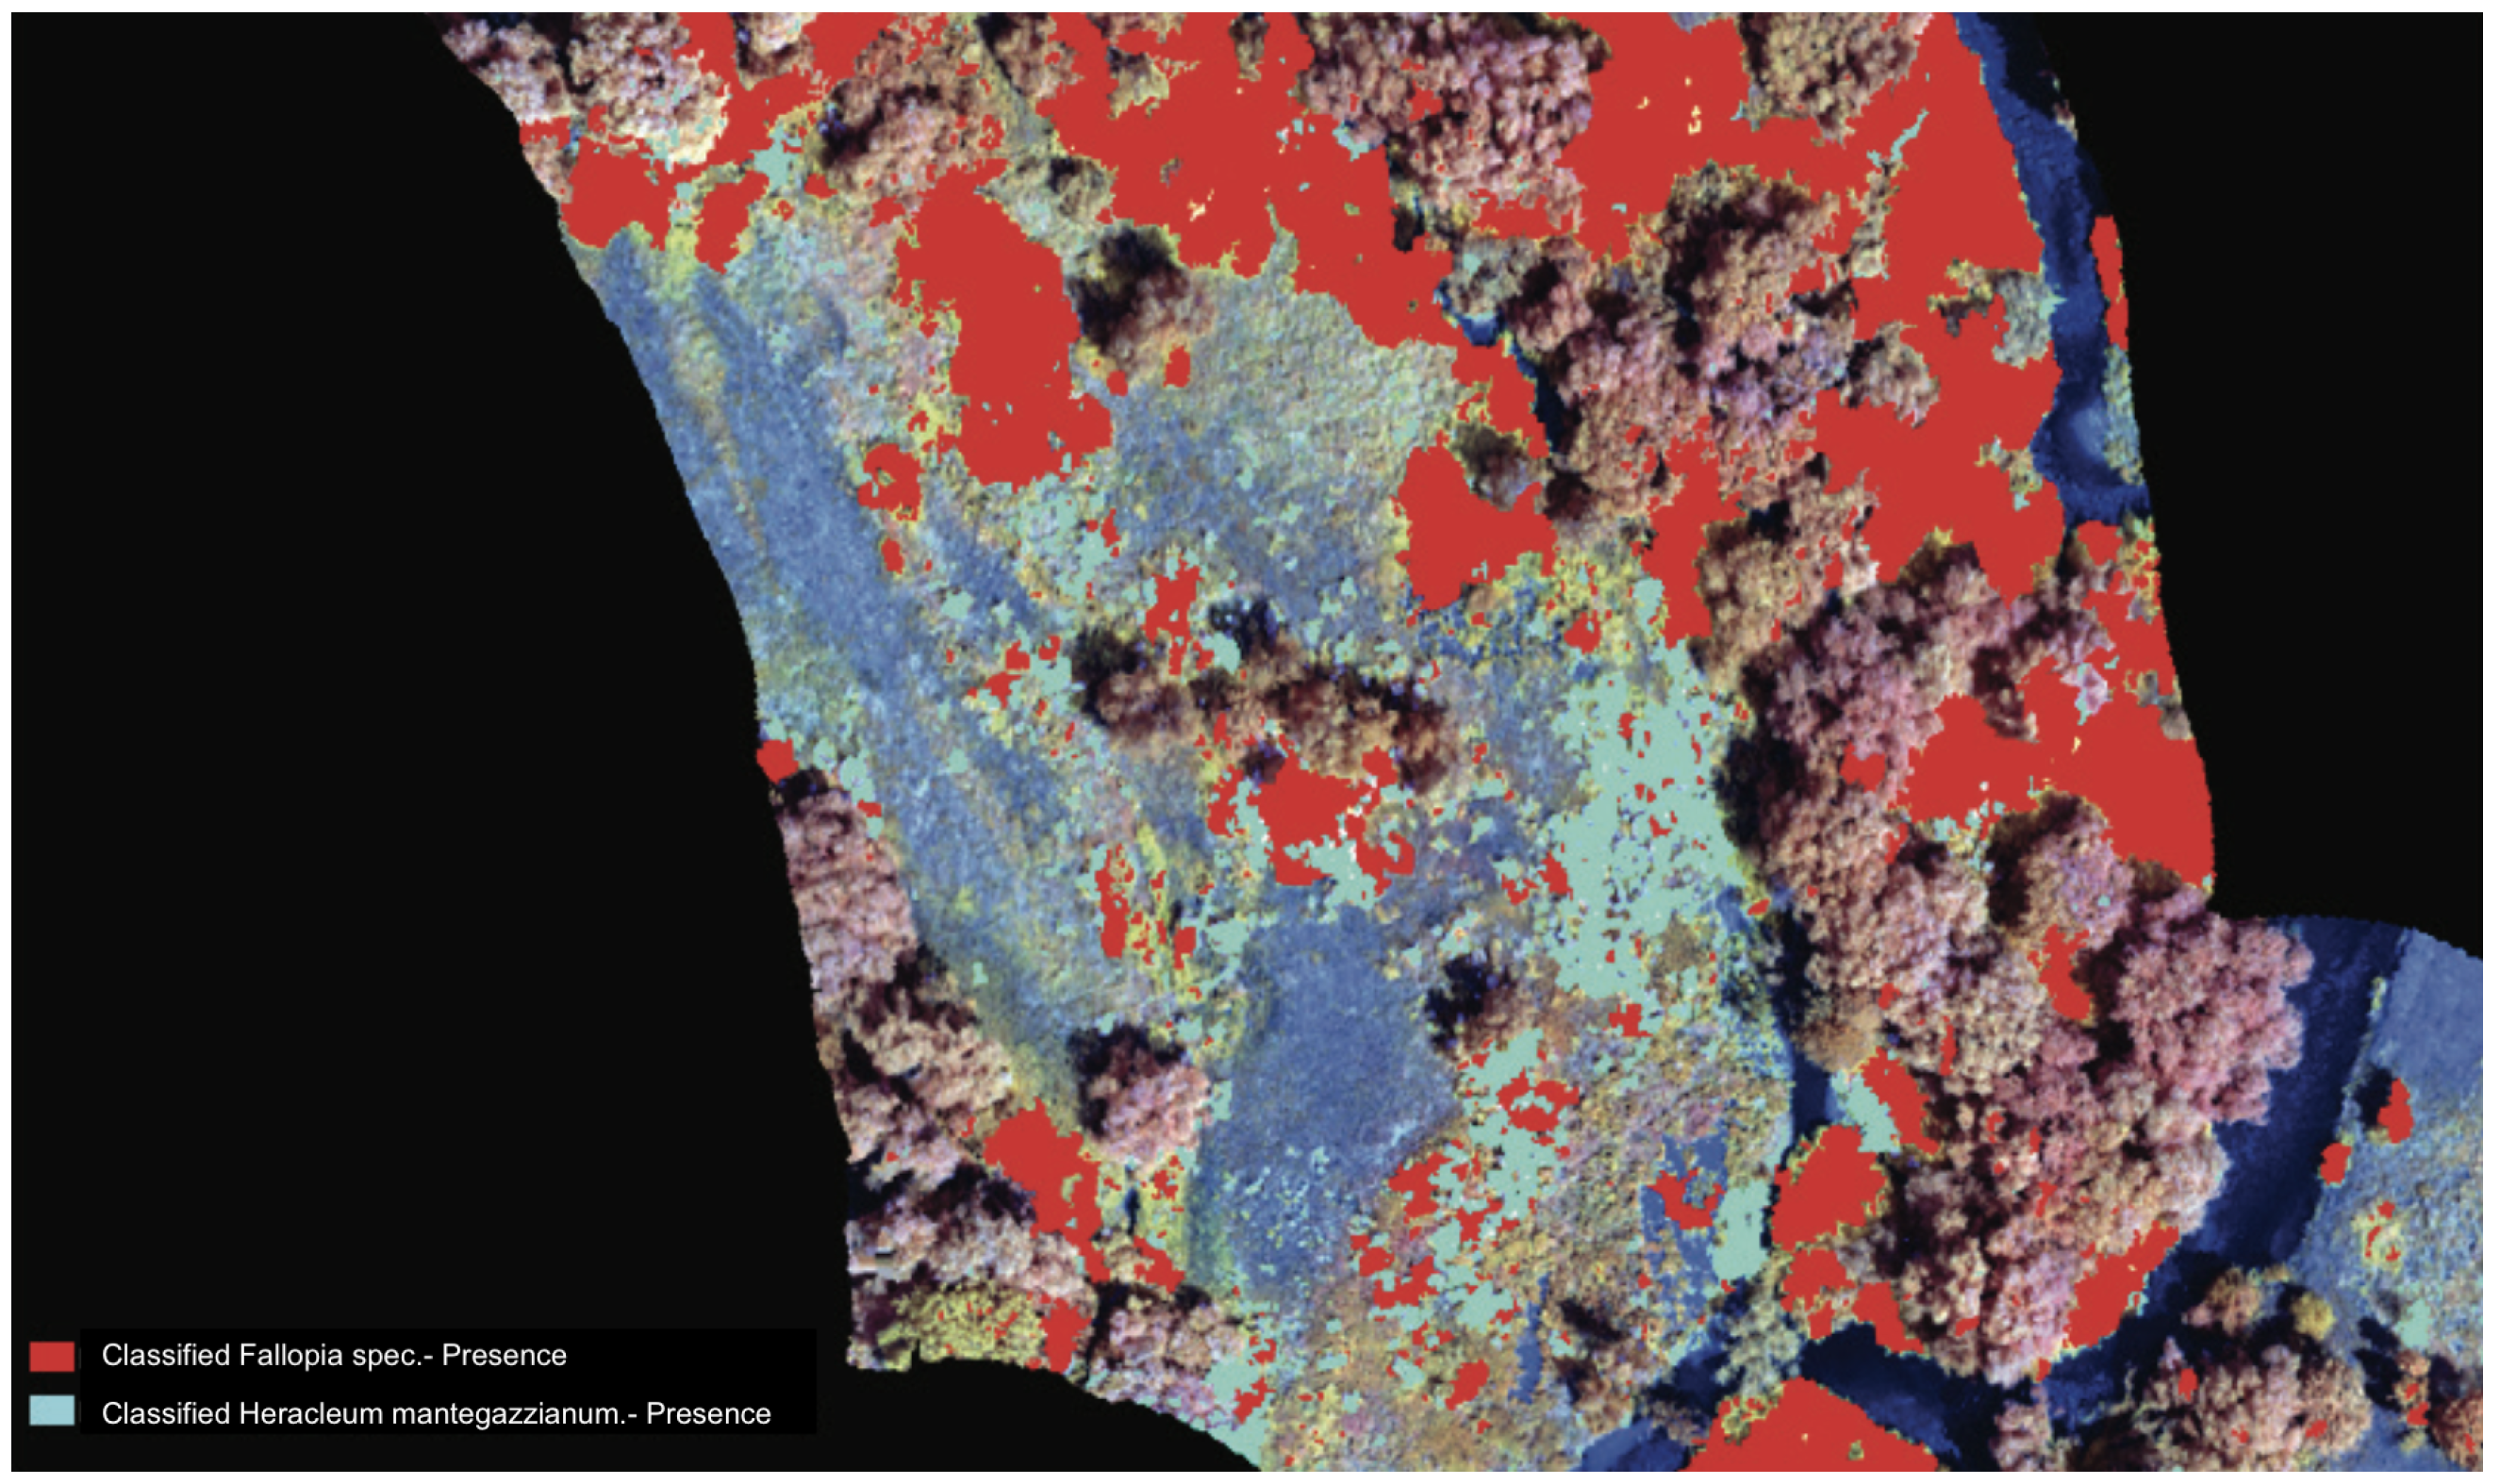
The biennial to perennial Heracleum mantegazzianum can attain heights ranging from 2 to 5 m, exhibiting leaves with lengths spanning 1 to 3 m [45]. The blossoms are white and undergo flowering from the middle of June to August [46,47]. In the absence of available DOP or suitable satellite imagery, we conducted an aerial survey employing a gyrocopter. This survey was carried out around the outset of August, by which time the Heracleum mantegazzianum stands had concluded their flowering period. Nevertheless, these stands remained distinctly discernible within the dataset and were amenable to segmentation into homogenous clusters. In our initial endeavor, the segment-based classification approach yielded an overall accuracy of 72%, which was subsequently enhanced to 83%. While surveying Fallopia spec. with a gyrocopter, we identified hitherto unknown occurrences of Heracleum mantegazzianum in full bloom. Employing the automated segment-based classification approach for this plant stand yielded an accuracy of 84% without necessitating post-processing (see Figure 4). Based on these discoveries, the most suitable phenological characteristic for remote sensing is evidently the inflorescence in full bloom, characterized by diameters of up to 80 cm and a white coloration. This culminates in an optimal detection time frame from the latter half of June to the first half of July.

3.2. Fallopia spec.

The genus Fallopia includes several species, among which Japanese knotweed (Fallopia japonica), bastard knotweed (Fallopia x bohemica), and Sakhalin knotweed (Fallopia sachalinensis) were simultaneously subject to analysis during the survey due to their shared morphological traits. The survey encompassed extensive stands representing various age stages, with data acquisition conducted via a gyrocopter. These stands, distinguished by their robust vitality and a high proportion of fully extended leaf mass, exhibited a vivid yellow hue in the RGB imagery and displayed a distinctive concentric growth pattern. Our segment-based classification algorithm demonstrated exceptional performance, achieving a classification accuracy of 93%. The most relevant phenological attributes for RS purposes are the unfolded leaf surface combined with the concentric growth pattern of the plants. The optimal window for detection spans from June to the early days of August.

3.3. Bunias orientalis

For Bunias orientalis, three distinct datasets were available and subjected to rigorous testing. The most significant phenological feature suitable for RS applications was identified to be the inflorescence, characterized by its semi-rosette formation and conspicuous bright yellow pigmentation. Leveraging DOPs, our classification approach exhibited the capability to identify Bunias orientalis with a commendable accuracy of 92% within a grassland test site. However, it is noteworthy that at the peripheries of these densely populated stands individual plants were occasionally not reliably detected. Considering the infrequent availability of appropriate DOP or satellite imagery, we explored the suitability of UAV survey strategies. Control points were meticulously measured with high-precision GPS technology to rectify the image data. The segment-based classification method excelled in detecting Bunias orientalis stands across varying coverages, extending down to individual plants, and achieved a remarkable accuracy of 95%. Additionally, an assessment was conducted using satellite imagery from WV02. Utilizing the classification algorithm, the stands of Bunias orientalis were observable with an accuracy of 78%. It is imperative to note that predominantly compact Bunias orientalis stands were discernible in the satellite images, attributable to the comparatively lower geometric resolution of the dataset. In summation, the detection of Bunias orientalis is feasible through the examination of fully expanded inflorescences. The most favorable detection time frame corresponds to the latter half of May to the early days of June, coinciding with the conclusion of the rapeseed blooming period and the commencement of the Bunias orientalis blooming season. Further spectral overlaps were identified with Sisymbrium species such as Sisymbrium loeseli and Sisymbrium altissimum. Despite these spectral overlaps, it is possible to distinguish between these species by harnessing the spectral data encapsulated within the RGB datasets.
To further validate the accuracy of our segmentation classification approach, we employed the trained model of Bunias orientalis on a previously unknown area, located in the federal state of Thuringia. Figure 5 depicts a DOP imagery before (left side) and after (right side) running the previously trained classification model unsupervised. The classification result for Bunias orientalis is highlighted in red. The overall accuracy achieved for this DOP is 90%. Shadows cast by surrounding buildings and trees had a slight negative impact on the overall accuracy.

3.4. Elaeagnus angustifolia

Elaeagnus angustifolia, originating from Asia [48], has been extensively planted in central Germany, primarily for the purpose of rehabilitating post-mining landscapes and along highways. This versatile species is known to thrive in various forms, manifesting as either a tree or a shrub, capable of attaining heights ranging from 8 to 15 m [49]. Elaeagnus angustifolia’s distinctive features include leathery leaves, measuring between 4 to 8 cm in length, characterized by their narrow and lanceolate shape. Of significance, this neophyte is demonstrating invasive tendencies by colonizing grassland areas. Within the study area, an open-cast mining site rehabilitated for alternate use, this species was observed in patchy distributions across agriculturally utilized grassland areas. These patches exhibit variations in densities, ages, and growth heights. DOP imagery facilitated the distinction of this neophyte from other tree species. Our segment-based classification approach yielded an accuracy rate of 83%. The availability of numerous datasets spanning different years and the constant landscape alterations induced by agricultural activities such as grazing and mulching have enabled us to periodically repeat this classification process. This multitemporal analysis has afforded us the opportunity to trace the spread and development of the species over time. In addition to DOP, we explored the use of satellite imagery, specifically WV03 data. Among the 12 satellite imagery scenes scrutinized, only one proved suitable for our intended use. Regrettably, the application of the segment-based classification approach for detecting Elaeagnus angustifolia was thwarted by weather conditions. The night before the data recording, rainfall occurred, leaving the leaves of the target species in a damp state. As a result, the typical silvery green hue of Elaeagnus angustifolia leaves, a remotely sensed characteristic chiefly attributed to the hairy leaf surface, was absent from the scene. Consequently, the leaves of Elaeagnus angustifolia no longer exhibited stark distinctions from those of other tree species. Based on our comprehensive surveys, the optimal window for detection falls between the end of May and the beginning of July, with suboptimal opportunities extending up to the beginning of October. These time frames present the most favorable conditions for the accurate detection of Elaeagnus angustifolia within the specified region.

3.5. Acer negundo

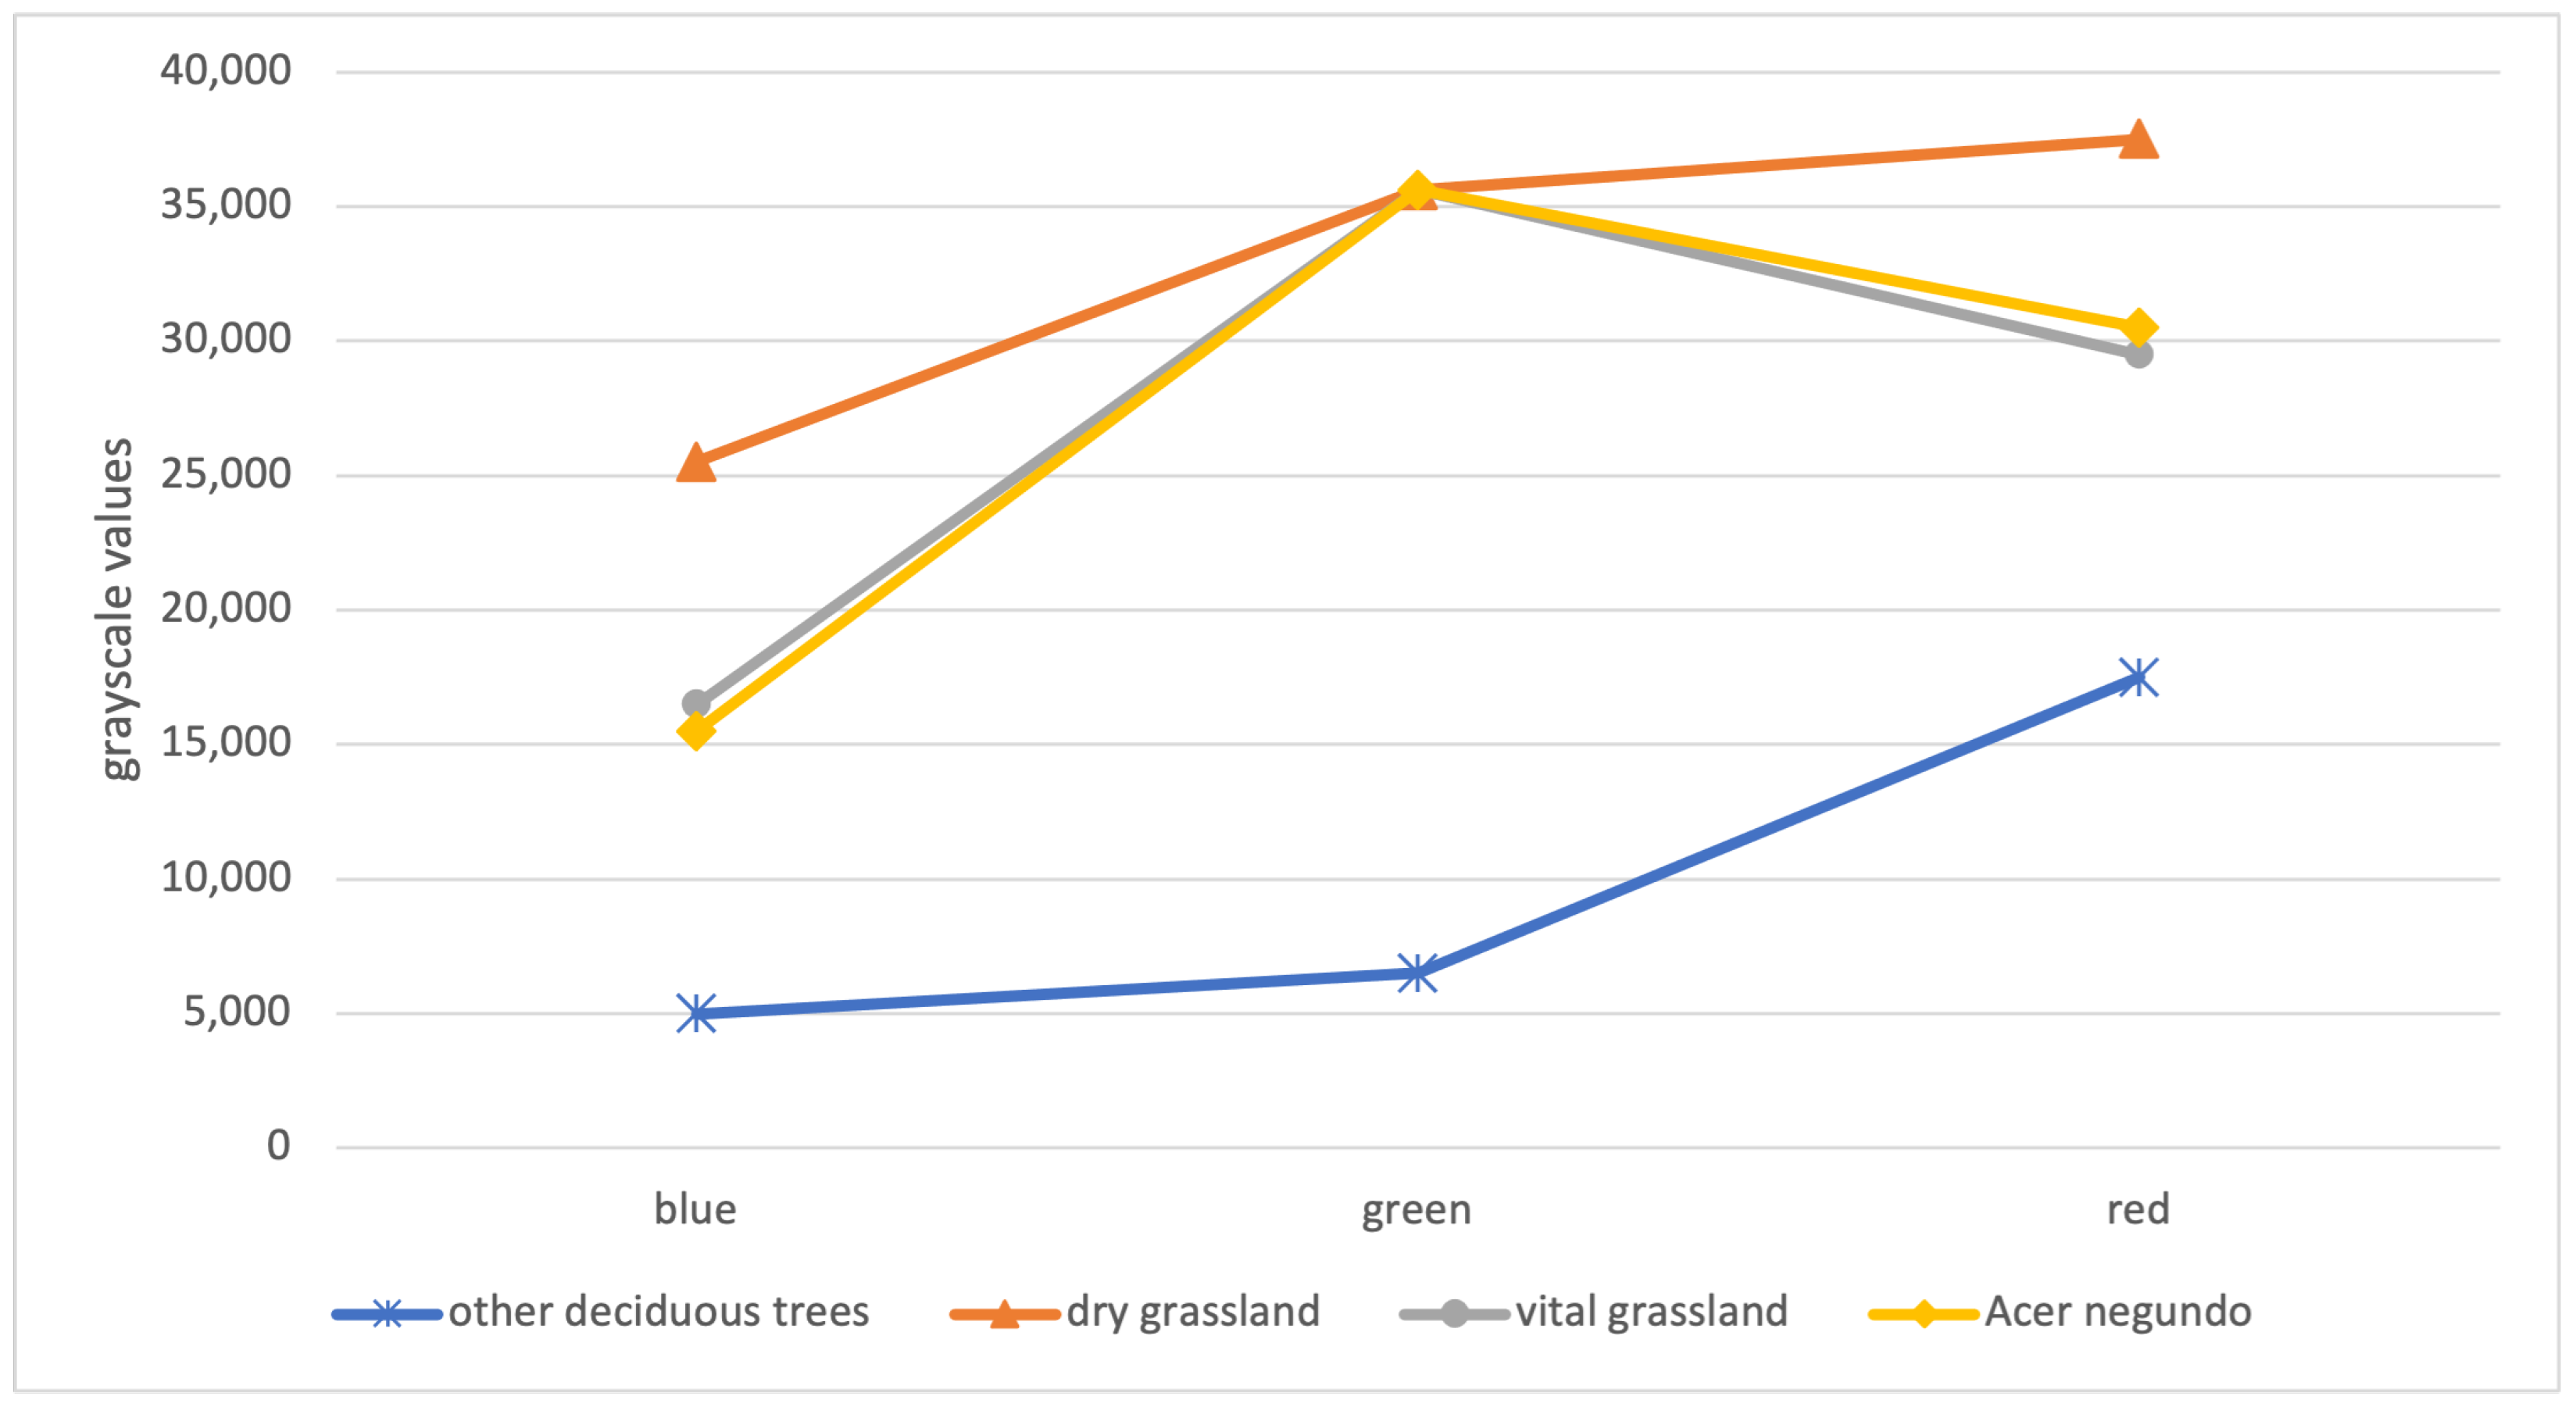
The tree species Acer negundo, native to North America, exhibits a considerable height range, typically growing from 6 to 25 m [45]. It is important to note that currently, there are no large-scale occurrences of Acer negundo reported on agricultural land within Saxony-Anhalt. Instead, the species is primarily found within windbreaks, hedges, and tree lines. Given the absence of Acer negundo on agricultural land, our study shifted its focus to a grassland site. Data acquisition for this endeavor was conducted via a gyrocopter. However, the segment-based classification approach yielded unsatisfactory results. The spectral composition of Acer negundo’s leaf surfaces closely resembled the surrounding grassland, hindering effective differentiation (see Figure 6).
Nevertheless, it was possible to distinguish Acer negundo from other tree species in the vicinity. Additionally, attempts were made to detect Acer negundo using a WorldView-03 scene. However, the limited geometric resolution of this satellite dataset rendered it impossible to detect and classify the target species accurately. Instead, a visual photointerpretation of the RGB dataset enabled the successful detection of Acer negundo during the optimal detection window, spanning from the end of May to the beginning of August.

3.6. Echinops sphaerocephalus

Echinops sphaerocephalus, a shrub species, typically exhibits heights ranging from 50 to 200 cm, with leaves capable of growing up to 40 cm in length [50]. Its defining feature is the presence of distinctive spherical inflorescences, which are gray–blue and can attain diameters of up to 6 cm. The flowering period for this species commences in June and concludes in August. Echinops sphaerocephalus is known to occur in loose stands, making the use of satellite imagery or DOP for detection challenging. Instead, our approach incorporated the utilization of a gyrocopter and a UAV system. Regrettably, when employing the inflorescence as the remote sensing plant characteristic, our classification method failed to yield satisfactory results. This outcome was primarily attributed to a substantial spectral overlap between our target species and the dry reed and wheat in the surrounding environment. Additionally, the vegetation in the study area had already been severely affected by an extended period of drought. However, by implementing a knowledge-based visual interpretation approach, we successfully achieved favorable results. Subsequently, we conducted a UAV survey at a height of 14 m, but, once again, this dataset was exclusively suitable for the visual interpretation approach.

3.7. Datura stramonium

Datura stramonium, an annual plant known to reach heights of up to 2 m, typically blooms in Germany between June and October [51]. Notably, within the KORINA database, no occurrence reports on agricultural land were found, with the limited available reports primarily focusing on urban areas. Consequently, our study aimed to assess the detectability of this species using a plant stand model. Our experimental findings indicate that Datura stramonium can be readily distinguished from wheat, especially shortly before the harvest, leveraging leaves as the detection characteristic. During this period, wheat assumes a yellowish appearance, while Datura stramonium appears green in RGB imagery. In the plant model experiment, Datura stramonium exhibited competitive growth with spring barley in terms of height, rendering it detectable through remote sensing. Subsequently, we serendipitously discovered occurrences of Datura stramonium within various crops on the arable land of an organically managed farm. To test the detectability of these occurrences, we conducted a UAV survey in combination with our segment-based classification approach. However, due to the similarity in spectral characteristics between the targeted species and others, the classification yielded a high error rate. This limitation could potentially be mitigated through the application of a high-end UAV system equipped with more precise sensors. In parallel with the segment-based classification, we also implemented a visual knowledge-based approach to the dataset, successfully identifying 49 individual plants within a 27 square meter area. The optimal window for detection of Datura stramonium falls between the end of June and throughout July, aligning with its typical growth and flowering period.

3.8. Abutilon theophrasti

Similar to Datura stramonium, isolated occurrence reports for Abutilon theophrasti on agricultural land in Saxony-Anhalt are limited. Consequently, we conducted tests to assess its detectability using a modeled plant stand within maize and spring barley crops. Our research revealed that the successful detection of Abutilon theophrasti was only achievable through knowledge-based visual approaches, as segment-based classifications proved unreliable under these conditions. It is worth noting that Abutilon theophrasti typically does not coexist with maize, barley, or wheat. Instead, it poses more of a problem in root crop fields, such as potato and sugar beet fields. The potential for detecting Abutilon theophrasti within such crops using satellite imagery, differential optical pathlength spectroscopy (DOP), or UAV systems remains plausible. However, this could not be tested, as such stands were not present in the field for our study.

3.9. Cyperus esculentus

Cyperus esculentus presented a unique challenge, as we had to simulate its occurrence in other crops. According to the KORINA database, this species is relatively rare in Germany. Like Abutilon theophrasti, we grew the targeted species alongside maize and spring barley. This experiment aimed to identify the plant characteristics suitable for Cyperus esculentus detection. From this experiment, we deduced two potential optimal detection windows. The first window occurs in crops sown during spring, characterized by a lengthy time for the canopy to close. The second window lies between harvest and tillage. Notably, Cyperus esculentus did not develop beyond the formation of a maximum of nine broad leaves in either experiment when under competition. Consequently, no other remotely detectable traits, such as flowers, were available. Images from Switzerland, where this species has already impacted extensive cropland areas, suggest a high potential for detection using remote sensing datasets based on leaf color and dispersal patterns. Furthermore, we identify significant potential in detection using UAV systems. These platforms enable timely aerial surveys during the brief optimal windows of opportunity for Cyperus esculentus detection, spanning from the end of June to the end of September and the beginning of October.

4. Discussion

To effectively manage the proliferation of IPS within agricultural landscapes, the critical role of early detection cannot be overstated [52]. Endeavors to avert, identify, monitor, and manage IPS and their negative impact on natural and man-made ecosystems and ecological services as stated by the European Commission [31] are most effective on small infestations and become less effective the further an IPS can increase in number [52,53]. However, traditional manual monitoring approaches are labor-intensive and cost-prohibitive [14], necessitating the adoption of contemporary methodologies and the research into the role of the phenology of IPS on the quality and accuracy of RS detections [25].
In this study, building upon antecedent studies [42,43,44,54], we focused on the assessment of RS sensitive phenological traits pertaining to the nine most prevalent IPS relevant to agriculture in Germany and Europe. Our investigation delved into the identification of optimal windows for detecting these traits and validated the suitability of a trained object-based segmentation classification approach for this purpose. Notably, the systematic assessment of plant features amenable to RS classifications, along with the identification of their optimal detection time frames, has not hitherto constituted a focal point within IPS management practices in Germany. Leveraging the acquired insights, we employed a segment-based classification algorithm to assess the appropriateness of multiple widely used RS datasets. Simultaneously, our emphasis was directed towards achieving comprehensive coverage over extensive geographical areas. Monitoring IPS nationwide is only feasible using datasets such as DOP and satellite imagery [29]. However, the deployment of these datasets proved challenging due to adverse weather conditions or untimely data acquisition dates [25]. Suitable DOP or satellite datasets were only available for two of the nine targeted IPS. Despite these challenges, employing suitable DOPs yielded promising results, achieving accuracies of 92% for Bunias orientalis and 83% for Elaeagnus angustifolia. Considering the infrequent availability of suitable DOP and satellite imagery, our focus shifted towards the data acquisition leveraging gyrocopter and UAV systems. On a local scale, the challenges associated with satellite imagery and DOPs can be mitigated through the deployment of UAVs and gyrocopters, which can offer enhanced spatial and temporal resolutions [55]. For instance, deploying a gyrocopter for the classification and detection of Heracleum mantegazzianum and Fallopia japonica resulted in accuracies of 83% and 93%, respectively. Comparable studies, employing similar classification approaches using UAV datasets achieved remarkably high classification accuracies for these species of up to 100% [25]. To further emphasize the advantages of employing gyrocopters and UAVs, our classification results of Bunias orientalis are noteworthy. Even in the presence of rapeseed, a species with a similar spectral signature (both develop bright yellow inflorescence), our classification algorithm achieved an accuracy of 95% when leveraging UAV imagery. To finalize the evaluation of the applicability of our methodology, we implemented it in a heretofore unexplored region within the federal state of Thuringia. This approach was undertaken with the intention of verifying the transferability of our approach. Using the pretrained classification model for Bunias orientalis a classification accuracy of 90% could be achieved. The successful implementation of our methodology in the unexplored region of Thuringia further supports the transferability of our approach (at least for Bunias orientalis), showcasing its potential applicability in diverse geographical contexts.
Looking ahead, the integration of artificial intelligence (AI) technology, particularly deep learning methodologies, emerges as a promising avenue for the automated IPS classification and detection [54,56]. Leveraging diverse datasets, including UAV, aerial, and satellite imagery, in conjunction with a nuanced understanding of optimal temporal windows, holds great potential for significant advancements in IPS surveillance methodologies. As AI technology continues to evolve, future research endeavors should capitalize on these advancements to enhance the efficiency and accuracy of IPS detection and management strategies.

Author Contributions

Writing—original draft, F.T.; Writing—review & editing, C.G.L. and M.P.; Supervision, J.B. All authors have read and agreed to the published version of the manuscript.

Funding

This research received no external funding.

Data Availability Statement

Data are contained within the article.

Conflicts of Interest

Authors Christopher Günter Lorenz and Jens Birger were employed by the company Umwelt- und GeodatenManagement GbR. The remaining authors declare that the research was conducted in the absence of any commercial or financial relationships that could be construed as a potential conflict of interest.

References

  1. Blackburn, T.M.; Bellard, C.; Ricciardi, A. Alien versus native species as drivers of recent extinctions. Front. Ecol. Environ. 2019, 17, 203–207. [Google Scholar] [CrossRef]
  2. Manchester, S.J.; Bullock, J.M. The impacts of non-native species on UK biodiversity and the effectiveness of control. J. Appl. Ecol. 2000, 37, 845–864. [Google Scholar] [CrossRef]
  3. Huang, C.y.; Asner, G. Applications of Remote Sensing to Alien Invasive Plant Studies. Sensors 2009, 9, 4869–4889. [Google Scholar] [CrossRef]
  4. Jones, B.A. Tree Shade, Temperature, and Human Health: Evidence from Invasive Species-induced Deforestation. Ecol. Econ. 2019, 156, 12–23. [Google Scholar] [CrossRef]
  5. Aerts, R.; Honnay, O.; Van Nieuwenhuyse, A. Biodiversity and human health: Mechanisms and evidence of the positive health effects of diversity in nature and green spaces. Br. Med. Bull. 2018, 127, 5–22. [Google Scholar] [CrossRef]
  6. Bajwa, A.A.; Farooq, M.; Nawaz, A.; Yadav, L.; Chauhan, B.S.; Adkins, S. Impact of invasive plant species on the livelihoods of farming households: Evidence from Parthenium hysterophorus invasion in rural Punjab, Pakistan. Biol. Invasions 2019, 21, 3285–3304. [Google Scholar] [CrossRef]
  7. Cook, D.C.; Fraser, R.W.; Paini, D.R.; Warden, A.C.; Lonsdale, W.M.; De Barro, P.J. Biosecurity and Yield Improvement Technologies Are Strategic Complements in the Fight against Food Insecurity. PLoS ONE 2011, 6, e26084. [Google Scholar] [CrossRef]
  8. Mullin, B.; Anderson, L.; DiTomaso, J.; Eplee, R.; Getsinger, K. Invasive Plant Species; Council for Agricultural Science and Technology: Ames, IA, USA, 2000; Issue Paper 13 February 2000; pp. 1–18. [Google Scholar]
  9. Haubrock, P.J.; Cuthbert, R.N.; Sundermann, A.; Diagne, C.; Golivets, M.; Courchamp, F. Economic costs of invasive species in Germany. NeoBiota 2021, 67, 225–246. [Google Scholar] [CrossRef]
  10. Dark, S.J. The biogeography of invasive alien plants in California: An application of GIS and spatial regression analysis: Invasive alien plants in California. Divers. Distrib. 2004, 10, 1–9. [Google Scholar] [CrossRef]
  11. Hill, D.J.; Tarasoff, C.; Whitworth, G.E.; Baron, J.; Bradshaw, J.L.; Church, J.S. Utility of unmanned aerial vehicles for mapping invasive plant species: A case study on yellow flag iris (Iris pseudacorus L.). Int. J. Remote Sens. 2017, 38, 2083–2105. [Google Scholar] [CrossRef]
  12. Zhang, M.; Liu, X.; O’Neill, M. Spectral discrimination of Phytophthora infestans infection on tomatoes based on principal component and cluster analyses. Int. J. Remote Sens. 2002, 23, 1095–1107. [Google Scholar] [CrossRef]
  13. Joshi, C.; De Leeuw, J.; Van Duren, I. Remote sensing and GIS applications for mapping and spatial modeling of invasive species. ISPRS 2004, 35, 4. [Google Scholar]
  14. Gaskin, J.F.; Espeland, E.; Johnson, C.D.; Larson, D.L.; Mangold, J.M.; McGee, R.A.; Milner, C.; Paudel, S.; Pearson, D.E.; Perkins, L.B.; et al. Managing invasive plants on Great Plains grasslands: A discussion of current challenges. Rangel. Ecol. Manag. 2021, 78, 235–249. [Google Scholar] [CrossRef]
  15. Walsh, S. Multi-scale Remote Sensing of Introduced and Invasive Species: An Overview of Approaches and Perspectives. In Understanding Invasive Species in the Galapagos Islands; Springer: Cham, Switzerland, 2018; pp. 143–154. [Google Scholar] [CrossRef]
  16. Khare, S.; Latifi, H.; Ghosh, S. Multi-scale assessment of invasive plant species diversity using Pléiades 1A, RapidEye and Landsat-8 data. Geocarto Int. 2017, 33, 681–698. [Google Scholar] [CrossRef]
  17. Müllerová, J.; Pyšek, P.; Jarošík, V.; Pergl, J. Aerial photographs as a tool for assessing the regional dynamics of the invasive plant species Heracleum mantegazzianum: Regional dynamics of H. mantegazzianum invasion. J. Appl. Ecol. 2005, 42, 1042–1053. [Google Scholar] [CrossRef]
  18. Lawrence, R.L.; Wood, S.D.; Sheley, R.L. Mapping invasive plants using hyperspectral imagery and Breiman Cutler classifications (RandomForest). Remote Sens. Environ. 2006, 100, 356–362. [Google Scholar] [CrossRef]
  19. Andrew, M.; Ustin, S. The role of environmental context in mapping invasive plants with hyperspectral image data. Remote Sens. Environ. 2008, 112, 4301–4317. [Google Scholar] [CrossRef]
  20. Ghulam, A.; Porton, I.; Freeman, K. Detecting subcanopy invasive plant species in tropical rainforest by integrating optical and microwave (InSAR/PolInSAR) remote sensing data, and a decision tree algorithm. ISPRS J. Photogramm. Remote Sens. 2014, 88, 174–192. [Google Scholar] [CrossRef]
  21. Martin, F.M.; Müllerová, J.; Borgniet, L.; Dommanget, F.; Breton, V.; Evette, A. Using Single- and Multi-Date UAV and Satellite Imagery to Accurately Monitor Invasive Knotweed Species. Remote Sens. 2018, 10, 1662. [Google Scholar] [CrossRef]
  22. Bolch, E.A.; Santos, M.J.; Ade, C.; Khanna, S.; Basinger, N.T.; Reader, M.O.; Hestir, E.L. Remote Detection of Invasive Alien Species. In Remote Sensing of Plant Biodiversity; Cavender-Bares, J., Gamon, J.A., Townsend, P.A., Eds.; Springer International Publishing: Cham, Switzerland, 2020; pp. 267–307. [Google Scholar] [CrossRef]
  23. Bhatt, P. Mapping Coastal Wetland and Phragmites on the Hiawatha National Forest Using Unmanned Aerial System (UAS) Imagery: Proof of Concepts. Master’s Thesis, Michigan Technological University, Hoighton, MI, USA, 2018. [Google Scholar]
  24. Samiappan, S.; Turnage, G.; Hathcock, L.A.; Casagrande, L.C.; Stinson, P.; Moorhead, R.J. Using unmanned aerial vehicles for high-resolution remote sensing to map invasive Phragmites australis in coastal wetlands. Int. J. Remote Sens. 2017, 38, 2199–2217. [Google Scholar] [CrossRef]
  25. Müllerová, J.; Brůna, J.; Bartaloš, T.; Dvořák, P.; Vítková, M.; Pyšek, P. Timing Is Important: Unmanned Aircraft vs. Satellite Imagery in Plant Invasion Monitoring. Front. Plant Sci. 2017, 8, 887. [Google Scholar] [CrossRef]
  26. Caffrey, J.M. The Management of Giant Hogweed in an Irish River Catchment. J. Aquat. Plant Manag. 2001, 39, 28–33. [Google Scholar]
  27. Weidlich, E.W.A.; Flórido, F.G.; Sorrini, T.B.; Brancalion, P.H.S. Controlling invasive plant species in ecological restoration: A global review. J. Appl. Ecol. 2020, 57, 1806–1817. [Google Scholar] [CrossRef]
  28. Payne, T. How Does Japanese Knotweed Spread? Available online: https://tpknotweed.com/guidance/how-does-japanese-knotweed-spread/#:~:text=Japanese%20knotweed%20typically%20spreads%20through,as%20small%20as%202mm%20wide (accessed on 6 November 2023).
  29. Kattenborn, T.; Lopatin, J.; Förster, M.; Braun, A.C.; Fassnacht, F.E. UAV data as alternative to field sampling to map woody invasive species based on combined Sentinel-1 and Sentinel-2 data. Remote Sens. Environ. 2019, 227, 61–73. [Google Scholar] [CrossRef]
  30. European Commission. Invasive Alien Species—Preventing and Minimising the Effects on Invasive Alien Species on Europe’s Biodiversity. Available online: https://environment.ec.europa.eu/topics/nature-and-biodiversity/invasive-alien-species_en (accessed on 2 November 2023).
  31. European Commission. Document 32014R1143. Regulation (EU) No 1143/2014 of the European Parliament and of the Council of 22 October 2014 on the Prevention and Management of the Introduction and Spread of Invasive Alien Species. Available online: http://data.europa.eu/eli/reg/2014/1143/oj (accessed on 2 November 2023).
  32. Bundesamt für Naturschutz. Neobiota.de-Handbuch: Art. 4: Die Unionsliste. Available online: https://neobiota.bfn.de/unionsliste/art-4-die-unionsliste.html (accessed on 25 October 2023).
  33. NABU. Die EU-Liste Invasiver Gebietsfremder Tier- und Pflanzenarten. Available online: https://www.nabu.de/tiere-und-pflanzen/artenschutz/invasive-arten/unionsliste.html (accessed on 25 October 2023).
  34. Korina. Info. Available online: https://www.korina.info/info/korina/ (accessed on 21 October 2023).
  35. Korina. Atlas. Available online: https://www.korina.info/funde/atlas/ (accessed on 22 October 2023).
  36. Bundesamt für Naturschutz. Informationen zu Pflanzen. Available online: https://www.floraweb.de/pflanzenarten.html (accessed on 23 October 2023).
  37. Trimble Geospatial. Trimble eCognition: Transform Data into Information. Available online: https://geospatial.trimble.com/en/products/software/trimble-ecognition (accessed on 23 October 2023).
  38. Gao, Y.; Kerle, N.; Mas, J.; Pacheco, J.; Niemeyer, I. Optimized image segmentation and its effect on classification accuracy. In Proceedings of the 5th International Symposium on Spatial Data Quality (ISSDQ 2007) “Modeling Qualities in Space and Time”, Enschede, The Netherlands, 13–15 June 2012. [Google Scholar]
  39. Clark Labs. Segmentation and Segment-Based Classification. Available online: https://clarklabs.org/segmentation-and-segment-based-classification/#:~:text=Unlike%20traditional%20pixel%2Dbased%20classification,these%20spectrally%20similar%20image%20segments (accessed on 6 November 2023).
  40. Gao, Y.; Mas, J.F. A comparison of the performance of pixel-based and object-based classifications over images with various spatial resolutions. Online J. Earth Sci. 2008, 2, 27–35. [Google Scholar]
  41. Kumar Rai, P.; Singh, J. Invasive alien plant species: Their impact on environment, ecosystem services and human health. Ecol. Indic. 2020, 111, 106020. [Google Scholar] [CrossRef]
  42. Müllerová, J.; Pergl, J.; Pyšek, P. Remote sensing as a tool for monitoring plant invasions: Testing the effects of data resolution and image classification approach on the detection of a model plant species Heracleum mantegazzianum (giant hogweed). Int. J. Appl. Earth Obs. Geoinf. 2013, 25, 55–65. [Google Scholar] [CrossRef]
  43. Ge, S.; Everitt, J.; Carruthers, R.; Gong, P.; Anderson, G. Hyperspectral Characteristics of Canopy Components and Structure for Phenological Assessment of an Invasive Weed. Environ. Monit. Assess. 2006, 120, 109–126. [Google Scholar] [CrossRef] [PubMed]
  44. Andrew, M.E.; Ustin, S.L. Spectral and physiological uniqueness of perennial pepperweed (Lepidium latifolium). Weed Sci. 2017, 54, 1051–1062. [Google Scholar] [CrossRef]
  45. Starfinger, U.; Kowarik, I. Heracleum mantegazzianum. Neobiota.de-Handbuch Gebietsfremde und Invasive Arten in Deutschland. Available online: https://neobiota.bfn.de/handbuch/gefaesspflanzen/heracleum-mantegazzianum.html (accessed on 23 October 2023).
  46. Meinlschmidt, E. Bekämpfung von Riesen-Bärenklau: Untersuchungen zu Bekämpfungsmaßnahmen von Riesen-Bärenklau (Heracleum mantegazzianum) Sowie Ihre ökonomische Bewertung—Ergebnisse der Freilandversuche der Ehem. LfL und Eines Praxisvorhabens in Sachsen—2001–2007; Schriftenreihe des Landesamtes für Umwelt, Landwirtschaft und Geologie, Saechsische Landesbibliothek- Staats- und Universitaetsbibliothek: Dresden, Germany, 2009. [Google Scholar]
  47. Nielsen, C.; Ravn, H.P.; Nentwig, W.; Wade, M. Praxisleitfaden Riesenbärenklau: Richtlinien für das Management und die Kontrolle einer Invasiven Pflanzenart in Europa; Forest & Landskape: Hoersholm, Denmark, 2005. [Google Scholar]
  48. Bartha, D.; Csiszár, Á. Russian olive (Elaeagnus angustifolia L.). In The Most Important Invasive Plants in Hungary; Institute of Ecology and Botany: Budapest, Hungary, 2008; pp. 85–93. [Google Scholar]
  49. Weyl, P.; Pasiecznik, N. Elaeagnus angustifolia (Russian Olive). Available online: http://www.cabidigitallibrary.org/doi/10.1079/cabicompendium.2071 (accessed on 2 November 2023). [CrossRef]
  50. Fiala, J. Information über die Kugeldistel. Available online: https://www.gmn-ev.de/fileadmin/website/downloads/Kugeldistel-Faltblatt_2005.pdf (accessed on 2 November 2023).
  51. Witt, A.; Luke, Q. Guide to the Naturalized and Invasive Plants of Eastern Africa; CABI: Wallingford, UK, 2017; p. 608. [Google Scholar]
  52. Welch, B.A.; Geissler, P.H.; Latham, P. Early Detection of Invasive Plants: Principles and Practices; U.S. Geological Survey Scientific Investigations Report 2012-5162; USGS: Reston, VA, USA, 2012; p. 193. [CrossRef]
  53. Kaiser, B.A.; Burnett, K.M. Spatial economic analysis of early detection and rapid response strategies for an invasive species. Resour. Energy Econ. 2010, 32, 566–585. [Google Scholar] [CrossRef]
  54. Lake, T.A.; Briscoe Runquist, R.D.; Moeller, D.A. Deep learning detects invasive plant species across complex landscapes using Worldview-2 and Planetscope satellite imagery. Remote Sens. Ecol. Conserv. 2022, 8, 875–889. [Google Scholar] [CrossRef]
  55. Satish, S. Satellite VS Drone Imagery: Knowing the Difference and Effectiveness of SuperVision Earth’s Complementary Synergy. Available online: https://medium.com/supervisionearth/satellite-vs-drone-imagery-knowing-the-difference-and-effectiveness-of-supervision-earths-90e98b78777c (accessed on 6 November 2023).
  56. James, K.; Bradshaw, K. Detecting plant species in the field with deep learning and drone technology. Methods Ecol. Evol. 2020, 11, 1509–1519. [Google Scholar] [CrossRef]
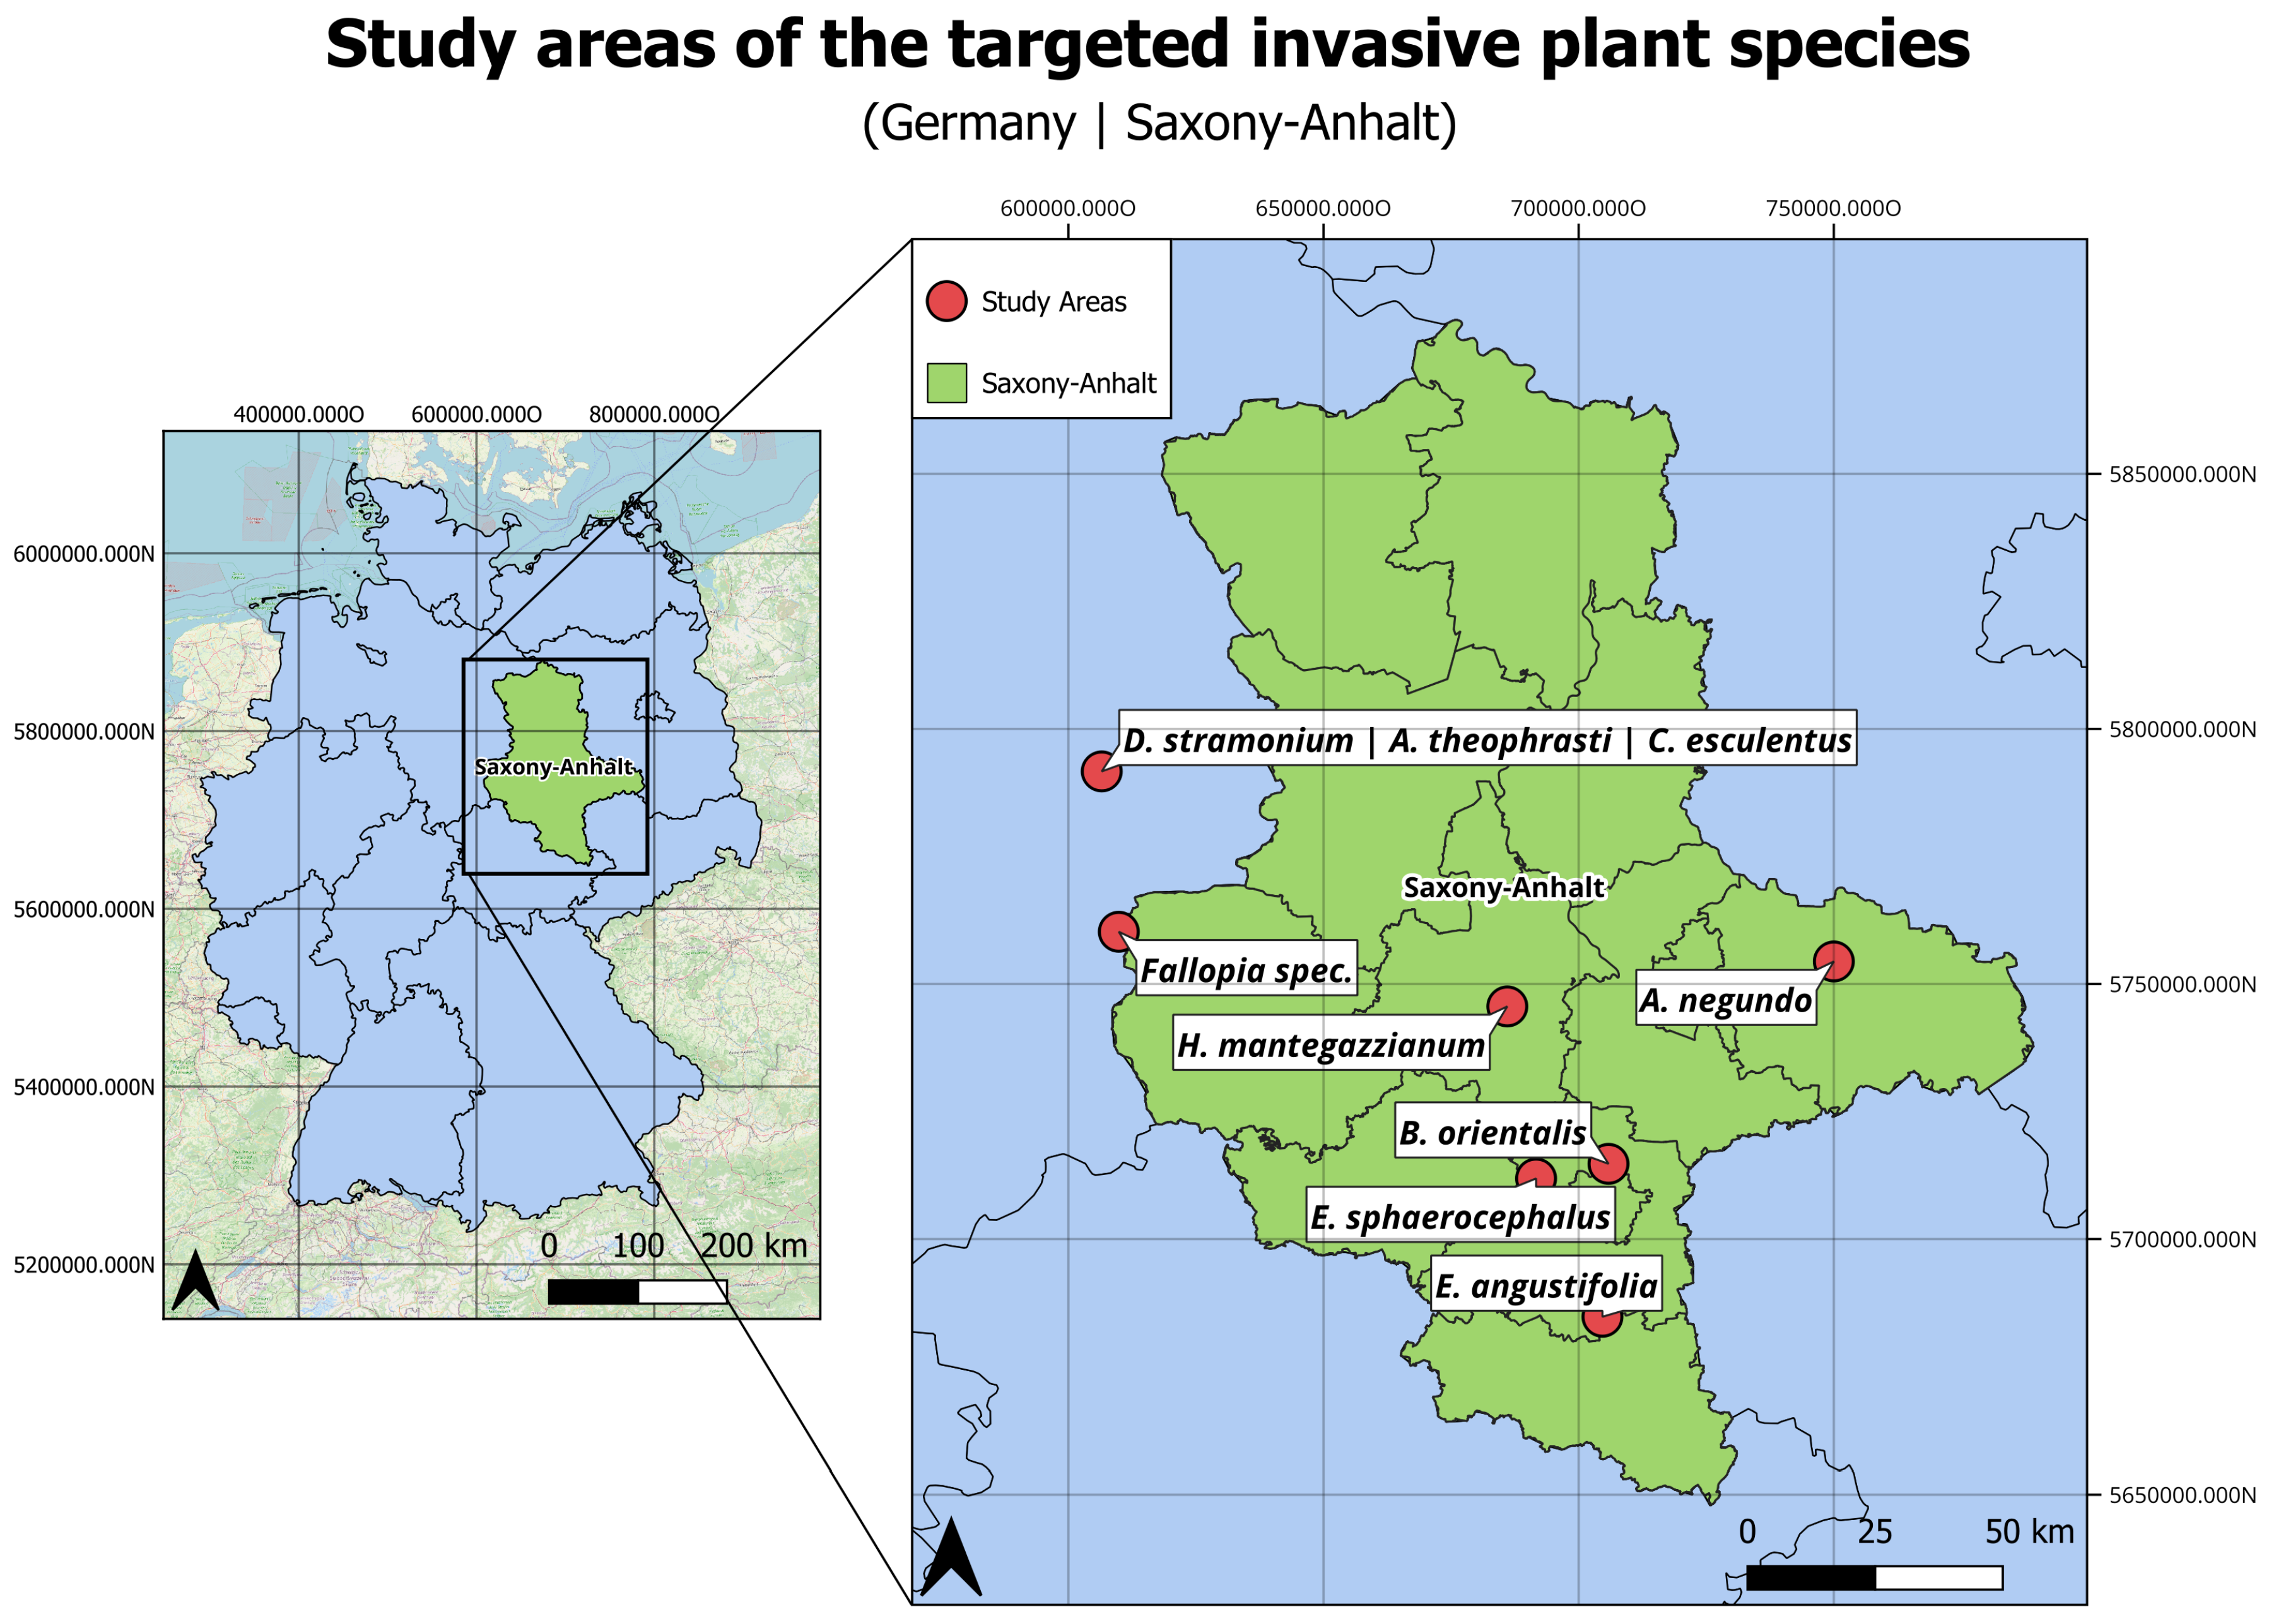
Figure 1. Geographical distribution of the selected study sites across Saxony-Anhalt, illustrating the diverse range of agricultural landscapes and neophyte occurrences.
Remotesensing 16 00500 g001
Figure 2. General workflow of the classification approach.
Remotesensing 16 00500 g002
Figure 3. Classification result of a HySpex image targeting Fallopia spec. highlighted in red. Objects outlined in red represent misassignments identified as different species (trees).
Remotesensing 16 00500 g003
Figure 4. Result of the automatic segment-based classification of Heracleum mantegazzianum and Fallopia spec. in the Wülperode study area from a Gyrocopter HySpex dataset.
Remotesensing 16 00500 g004
Figure 5. DOP captured in May near Ebeleben in Thuringia depicting occurrences of Bunias orientalis visible as yellow spots on the left side and highlighted in red after the automated segmentation classification on the right side.
Remotesensing 16 00500 g005
Figure 6. Spectra from the RGB dataset dated 2 August 2018, for the Wittenberg study area (grayscale value determination: average values from 10,000 pixels/class).
Remotesensing 16 00500 g006
Table 1. List of the relevant invasive plant species present on agricultural land for Germany.
Common NameScientific NameGerman NameEPPO-Code
Giant HogweedHeracleum mantegazzianumRiesenbärenklauHERMZ
Japanese KnotweedFallopia spec.Staudenknöterich-ArtenFOPSS
Turkish Warty-CabbageBunias orientalisOrientalisches ZackenschötchenBUNOR
Russian OliveElaeagnus angustifoliaSchmallblättrige ÖlweideELGAN
Boxelder MapleAcer negundoEschen-AhornACRNE
Glandular Globe-ThistleEchinops sphaerocephalusDrüsenblättrige KugeldistelECPSP
JimsonweedDatura stramoniumWeißer StechapfelDATST
VelvetleafAbutilon theophrastiSamtpappelABUTH
Yellow NutsedgeCyperus esculentusErdmantelCYPES
Table 2. Overview of the remote sensing sensors used, their relevant technical parameters, and the detected species.
SensorTechnical ParametersDetected Species
Airborne Digital Orthophotos
(DOP)
Spatial resolution:
0.2–0.4 m
Spectral Resolution:
400–1000 nm
Bunias orientalis,
Elaeagnus angustifolia
Satellite WorldView02 (WV02)
and WorldView03 (WV03)
Spatial resolution:
WV02: 0.46 m and 1.84 m
WV03: 0.31 m and 1.24 m
Spectral resolution:
WV02: 400–900 nm
WV03: 400–1040 nm
Bunias orientalis
Elaeagnus angustifolia
Gyrocopter RGB camera and
hyperspectral camera
(HySpex)
Spatial resolution:
0.24 m (0.05 m)
Spectral resolution:
400–1000 nm
Acer negundo,
Echinops sphaerocephalus,
Fallopia spec.,
Heracleum mantegazzianum
UAV (drone) RGB camera
Yuneec Typhoon H
1/2.3″ CMOS Sensor
Lens: 14 mm f/2.8
Spectral resolution:
400–700 nm
Bunias orientalis,
Datura stramonium,
Echinops sphaerocephalus
Nikon D3100 RGB cameraCamera cut out:
1 × 1.2 m
Focal length:
50 mm
Spectral resolution:
400–700 nm
Abutilon theophrasti,
Cyperus esculentus,
Datura stramonium
Table 3. Overview of the neophytes, their RS suitable phenological characteristics and the optimal time frame to detect these.
Scientific NamePlant Feature Suitable for RS ClassificationOptimal and Sub-Optimal 1 Detection Time Frame
Heracleum mantegazzianumBlossomsOptimal: June–July
Fallopia spec.Unfolded leaf surface,
Concentric growth
Optimal: June–August
Sub-optimal: May–August
Bunias orientalisBlossoms,
Compact structure of the inflorescence
Optimal: May–June
Elaeagnus angustifoliaUnfolded leaves under sunny circumstancesOptimal: May–July
Sub-optimal: May–September
Acer negundoUnfolded leavesOptimal: May–August
Echinops sphaerocephalusBlossomsOptimal: June–August
Datura stramoniumBlossomsOptimal: June–July
Abutilon theophrastiLeavesOptimal: June–July
Sub-optimal: June–August
Cyperus esculentusLeavesOptimal: June|September–October
Sub-optimal: June–October
1 Time frame were it might be possible to still detect some of the RS suitable features.
Disclaimer/Publisher’s Note: The statements, opinions and data contained in all publications are solely those of the individual author(s) and contributor(s) and not of MDPI and/or the editor(s). MDPI and/or the editor(s) disclaim responsibility for any injury to people or property resulting from any ideas, methods, instructions or products referred to in the content.