Article

Determining the Dominant Contributions between Direct and Indirect Impacts of Long-Term Urbanization on Plant Net Primary Productivity in Beijing

1
Precision Forestry Key Laboratory of Beijing, Beijing Forestry University, Beijing 100083, China
2
Jiangxi Rural Culture Development Research Center, Jiangxi Agricultural University, Nanchang 330045, China
*
Author to whom correspondence should be addressed.
Remote Sens. 2024, 16(3), 444; https://doi.org/10.3390/rs16030444
Submission received: 14 November 2023 / Revised: 8 January 2024 / Accepted: 21 January 2024 / Published: 23 January 2024

Abstract

:
Rapid urbanization exerts noteworthy impacts on the terrestrial ecosystem carbon budget, with pronounced effects in a metropolis such as Beijing, the capital city of China. These impacts include both Direct and Indirect Impacts. For instance, direct impacts influence regional Net Primary Productivity (NPP) by directly altering the vegetation coverage area. Concurrently, indirect impacts primarily affect regional NPP indirectly through climate change and urban vegetation management. How direct and indirect impacts contribute to the NPP is the core content of our research. Owing to that, we need to precisely assess the spatial and seasonal characteristics of the impact of urbanization in Beijing from 2000 to 2020. Firstly, a novel framework was proposed to analyze the impact of urbanization on NPP at the pixel level. Meanwhile, we employ the Proximity Expansion Index (PEI) to analyze urban expansion patterns. Results reveal that the direct impacts led to a cumulative NPP loss of 0.98 TgC, with the largest loss stemming from cropland conversion to construction land. During the last two decades, there has been a 56.87% increase in the area used for urban development in Beijing, a clear sign of swift urban expansion. Concurrently, this urban growth has had favorable indirect effects on NPP, with an average annual increase of 9.76 gC·m−2·year−1, mainly observed in urbanized regions. Moreover, the seasonal analysis underscored that indirect impacts were primarily temperature-related, exhibiting higher values during autumn and winter within urban areas, indicating enhanced vegetation growth suitability in urban areas during these seasons. Our findings quantitatively examine the numerical relationship between direct and indirect impacts at a magnitude level. The carbon gain brought about by indirect impacts surpassed the carbon loss induced by direct impacts, with indirect impacts offsetting 29.41% of the carbon loss due to direct impacts. Ultimately, we advocate for enhanced greening initiatives in areas of Beijing with higher indirect impacts to achieve optimal carbon gain. This strategy might effectively reduce the negative impact of rapid urbanization on the carbon budget of terrestrial ecosystems.

1. Introduction

Urbanization is a dynamic and complex process involving changes in the economy, population, society, and space [1]. This process usually takes many years or even decades to complete, during which time the long-term effects, both direct and indirect, on local ecosystems can be both positive and negative [2]. Each city has its own unique pattern of urbanization [3]. In contrast to well-developed cities in Europe and North America, the rate of urbanization in the peri-urban regions of East Asian metropolitan cities is relatively high, indicating a distinct development rhythm [4,5]. For example, large-scale development of single-use land in urban construction has significant negative impacts on the ecological environment, including the squandering of natural resources and the loss of biodiversity [6]. Urbanization has produced irreversible changes to the productivity of terrestrial ecological vegetation [7,8], including the massive expropriation of natural land such as cropland and grassland and the massive increase in impervious surfaces. These changes have had a significant impact on climate and atmospheric conditions, with the urban heat island effect being one of the most typical examples [9,10]. The aforementioned changes brought about by urbanization have also affected the terrestrial carbon stocks [11]. Accordingly, it is necessary to analyze the impact of intra-metropolitan urbanization on the regional carbon balance of ecosystems. What are the dominant contributions of the direct and indirect impacts of long-term urbanization on a typical metropolitan city in East Asia? This is our key research question.
Net Primary Productivity (NPP) is the quantity of carbon fixed through photosynthesis by plant communities per unit of time and area. Not only is NPP an essential indicator of the dynamic exchange of net carbon between plants and terrestrial ecosystems and the atmosphere, but it also plays a vital role in the global carbon cycle [12,13]. Therefore, NPP was employed as the key ecological indicator in this study. Moreover, as a sensitive indicator of climate and environmental changes, NPP is an efficient tool for assessing the carbon budget of terrestrial ecosystems [14]. The analysis of the long-term impacts of urbanization on NPP necessitates remote sensing datasets with adequate spatial resolution and extended time series. However, common Moderate Resolution Imaging Spectroradiometer (MODIS) NPP products do not estimate NPP in urban building land areas due to limitations [15]. Therefore, we employed the Carnegie Ames Stanford Approach (CASA) model to estimate NPP in our study area to surmount the technical challenges of inadequate spatial resolution and the absence of NPP in urban areas. Finally, an NPP dataset with a 250-m resolution was obtained for the study area, which satisfies the temporal and spatial resolution requirements of this research [16,17].
Research on the impacts of urbanization on NPP has been conducted at different scales. For example, Zhao et al. [18] classified the impact as direct and indirect. Indirect impacts are defined as natural climate impacts and human factors, while direct impacts are defined as changes in land use types that contribute to a reduction in vegetation. At the city scale, Urumqi’s urban expansion directly caused a total NPP loss of 51.45 GgC, offsetting 20.86% of the carbon gain resulting from indirect impacts [19]. At the scale of urban agglomerations, urban expansion in the key development area in China’s central plains urban agglomeration has resulted in regional carbon losses of 4.69 TgC, with indirect impacts offsetting the carbon sink loss of 0.04 TgC [20]. During the period 2000–2010, at the national level, the decline in China’s NPP due to urbanization offset 5.42 percent of climate-driven growth [21]. It is important to note that urban expansion does not diminish the carbon sequestration capacity of vegetation, but it does reduce the growth rate of that capacity [22]. Globally, metropolitan cities have more significant positive indirect impacts than small and medium-sized developing cities [1]. However, few studies have investigated the spatial and seasonal heterogeneity of urbanization’s effects on NPP, and there is a need to analyze the differential impacts of urbanization on terrestrial vegetation NPP at the spatial and seasonal levels. Moreover, many previous studies have not focused on the long-term changes in carbon budgets during urbanization, only analyzing the differences in NPP at two selected time points [23,24,25]. Therefore, it is necessary to comprehensively explore the long-term impacts of urbanization on NPP. This research focuses on Beijing, a global metropolis. Metropolis has a high pace of urbanization and significant ecological impacts, making it an ideal region to investigate the mechanisms of urbanization’s impacts on ecosystems [26]. Beijing is still transitioning from accelerated development to maturity, and this trend will persist until 2030. Throughout this process, urbanization will have an ongoing impact on the terrestrial ecosystem carbon cycle. To sum up, the goals of this paper are as follows:
(1)
Develop an improved, innovative framework to analyze the direct and indirect impacts of urbanization on NPP, specifically at the pixel level;
(2)
Analyze the temporal and spatial changes of direct and indirect impacts and their driving mechanisms. Determine which impacts of long-term urbanization contribute the most to the impacts of urbanization on the NPP of Beijing;
(3)
Estimate the carbon loss attributable to Beijing’s urbanization over the past two decades and propose a green space planning strategy that will effectively reduce this loss.

2. Materials and Methods

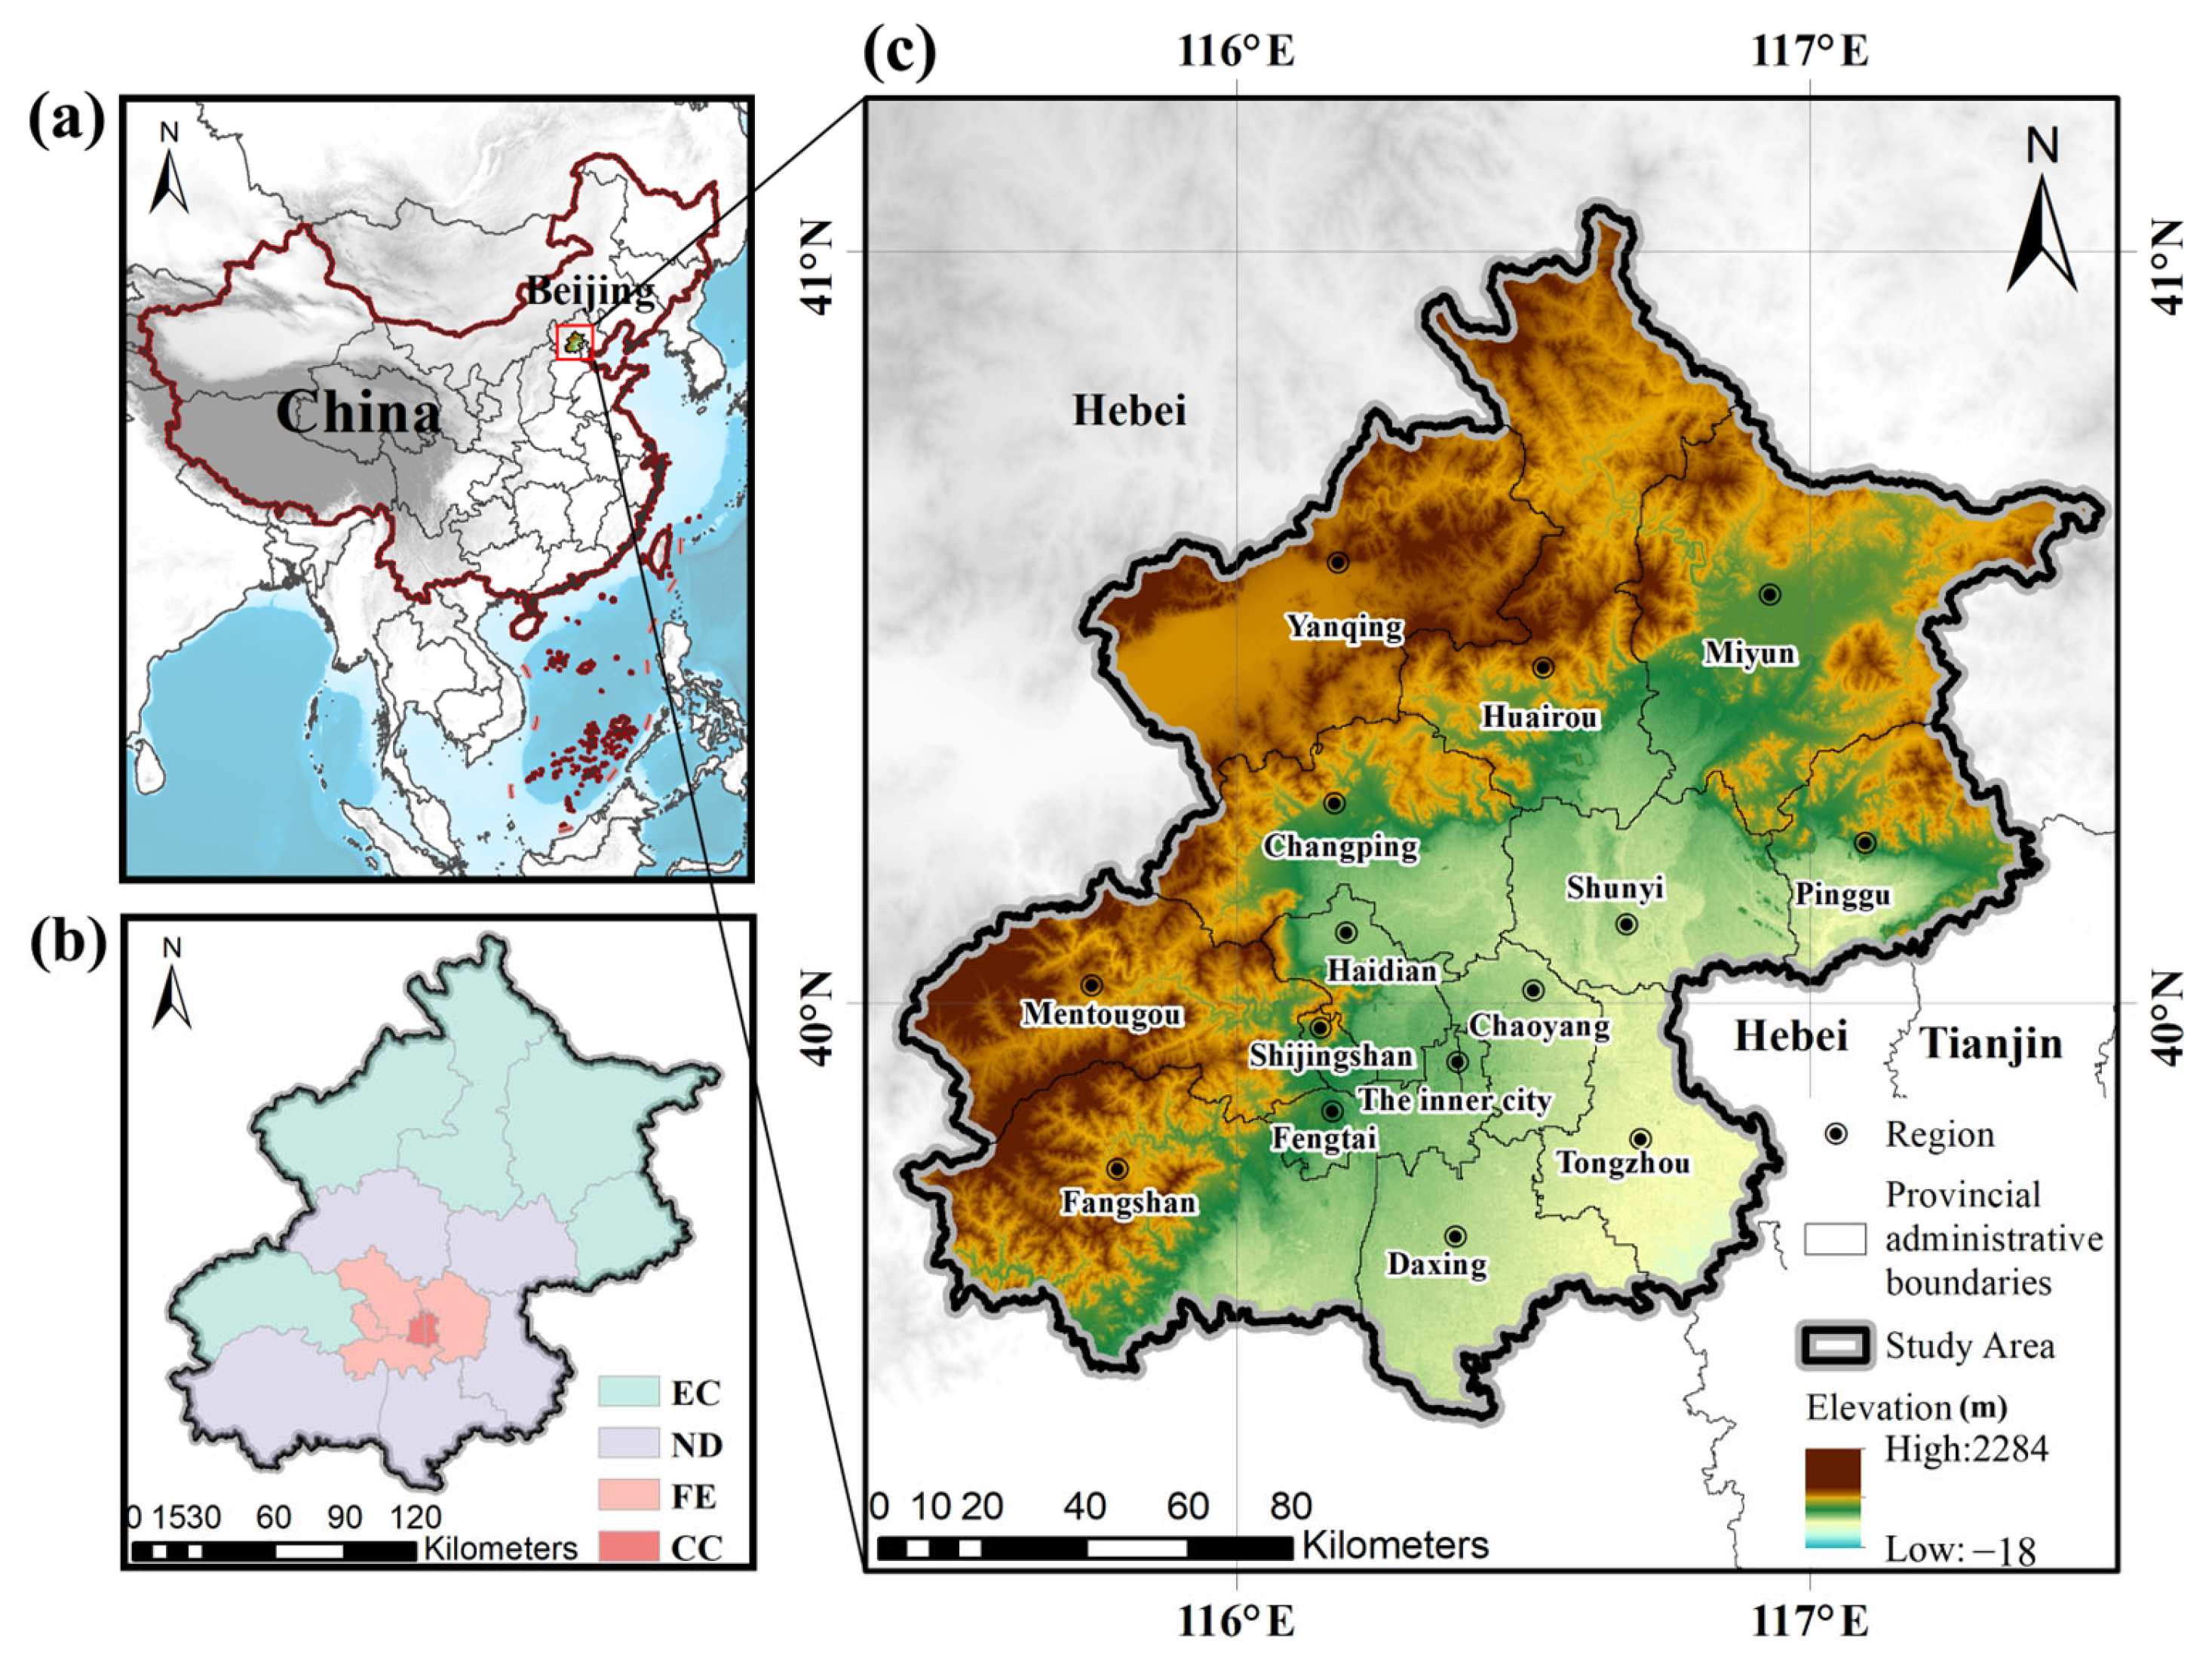
2.1. Study Area and Data Sources

Beijing (28–41°05′N, 115°25–117°30′E) is situated on the northwest border of the North China Plain. From northwest to southeast, the altitude decreases, and the Taihang Mountains border the region to the west, the Yanshan Mountains and the Inner Mongolia Plateau to the north, the Huanghuaihai Plain to the south, and the Songliao Plain to the northeast, with a total area of 16,410 km2. Beijing has a typical continental monsoon climate that is mild, temperate, and semi-humid. Spring is dry and breezy, whereas summer is humid and sweltering. 70% of annual precipitation is concentrated during the summer months. The weather in autumn is sunny, while winter is chilly and dry. Since the late 1980s, Beijing has undergone an urbanization process of international renown. Currently, Beijing is divided into four functional areas (Figure 1), namely the Capital Core (CC) area (Dongcheng District, Xicheng District); the Function Expansion (FE) area (Haidian District, Chaoyang District, Shijingshan District, Fengtai District); the New Developing (ND) area (Changping District, Shunyi District, Tongzhou District, Fangshan District, Daxing District), and the Ecological Conservation (EC) area (Yanqing District, Huairou District, Miyun District, Pinggu District, Mentougou District).
In this study, the datasets used include the MODIS NPP data set, the Normalized Difference Vegetation Index (NDVI) data, land use data, and meteorological data. The meteorological data, sourced from the China Surface Climate Data Daily Value Dataset (V3.0) provided by the National Meteorological Administration (https://data.cma.cn/, accessed on 15 June 2023.), includes monthly total precipitation, mean temperature, and solar radiation data. The land use data were obtained from the Land Use and Land Cover (LULC) dataset of Wuhan University, which covers a specific time series from 1990 to 2020 and is utilized to quantify the urban expansion process [27]. NPP and NDVI data are derived from the Google Earth Engine (GEE) platform (https://earthengine.google.com, accessed on 3 October 2023.), a geographical big data analysis, and the visual cloud platform. The NDVI data comes from the MODIS Collection6 MOD09A1 product, and monthly NDVI data were synthesized using the Maximum Value Composite (MVC) method on the GEE platform. The NPP data source is the MOD17A3HGF product, with a time series from 2001 to 2020 for subsequent accuracy verification. The Digital Elevation Model (DEM) data were downloaded from the Resource and Environmental Science Data Center (https://www.resdc.cn, accessed on 6 November 2023). The DEM was used as an input value for the calculation of the total solar radiation area.
During the data processing phase, the Ångström function was used to convert effective sunlight duration into solar radiation data to address the limited solar radiation stations in Beijing [28]. All meteorological data were processed using the ANUSPLIN specialized climatic interpolation software. Compared to spatial interpolation methods such as Kriging and Inverse Distance Weighting (IDW), ANUSPLIN yields the most accurate and applicable interpolation results with the lowest interpolation error [29]. To ensure data compatibility, the previously specified data were resampled to a resolution of 250 m using the WGS1984 coordinate system.

2.2. Methods

2.2.1. Estimating NPP Using the CASA Model

The CASA model is a light-use efficiency model that simulates the process by which vegetation absorbs photosynthetically active radiation and converts it into its own organic carbon. It estimates vegetation NPP using remote sensing data, temperature, precipitation, solar radiation, vegetation type, and land use type data [30,31]. In this model, NPP is estimated predominantly based on Absorbed Photosynthetically Active Radiation (APAR) and actual light use efficiency (ε). The equation is as follows:
N P P ( x , t ) = A P A R ( x , t ) × ε ( x , t )
where t represents time, x represents spatial position, N P P ( x , t ) represents the NPP value of pixel x at time t , and A P A R and ε value calculation equation utilizes (2)–(4).
A P A R ( x , t ) = P A R ( x , t ) × F P A R ( x , t )
P A R ( x , t ) = L ( x , t ) × 0.5
ε ( x , t ) = T ε 1 ( x , t ) × T ε 2 ( x , t ) × W ε ( x , t ) × ε
where L ( x , t ) represents the total solar radiation (MJ·m−2) at pixel x during month t . F P A R ( x , t ) denotes the fraction of incident Photosynthetically Active Radiation (PAR) absorbed by the vegetation canopy, reflecting the degree of P A R absorption by vegetation. The constant 0.5 is the proportion of solar radiation useable by vegetation (with a wavelength range of 0.4~0.7 μm) in relation to total solar radiation. T ε 1 and T ε 2 represent the impact of temperature on the light conversion rate, while W ε represents the water stress impact coefficient, which illustrates the effect of water conditions. ε is an abbreviation for the highest light conversion rate under ideal conditions. Estimating vegetation NPP requires the maximum and minimum values of NDVI and the Simple Ratio (SR) vegetation index for distinct plant types, in addition to the maximum light-use efficiency. This study cites NPP estimation parameters computed by Zhu Wenquan and others using measured data for diverse vegetation types in China [32].

2.2.2. Analysis of Urban Expansion Patterns

Urban expansion is a dynamic process of geographical spatial alteration that is typically characterized by the introduction of new urban land patches and the replacement of existing ones. The geographical link between these emerging urban patches and the existing urban areas is a critical question in studying the dynamic evolution of urban expansion. We use the Proximity Expansion Index (PEI) in this study to assess the degree of spread of new urban land patches. This offers a morphological viewpoint on the process of urban expansion [33]. The equation is as follows (5):
P E I = 1 N + ( 1 p i p n )
where PEI is an abbreviation for Proximity Expansion Index, N is the number of multi-buffers for each new patch, indicating the approximate distance between old and new patches. p n is the area of the outermost buffer zone; p i is the intersection area between the buffer zone and the old patch; p i p n represents the boundary sharing rate between the old and new patches.

2.2.3. The Dynamic Influence Framework of Urbanization on NPP

The process of urban expansion has various impacts on regional ecosystems. Zhao et al. [18] proposed a conceptual framework to quantify these impacts, breaking them down into direct impacts (conversion of vegetation land into other land uses) and indirect impacts (natural climate variations or those caused by human factors). However, this framework cannot capture the continuous changes in urban influences over a specific time period. Based on Zhao’s research, Guan et al. [34] devised an analytical framework that discerns the ongoing effects of urbanization on regional NPP within specific durations. Based on previous research, this study improved the urban impact framework to express the intensity of urban expansion at a pixel level at a specific time. The revised framework for the impact of urbanization on NPP is as follows:
If only considering the impact of changes in urban land cover, this paper postulates that the NPP of a pixel entirely covered by vegetation before urbanization is set as N P P p   (8):
N P P p ( x , t 0 ) = M x M x N ( x , t 0 ) × N P P ( x , t 0 )
N P P u ( x , t 1 ) = N P P ( x , t 0 ) + N t 0 N t 1 M x × N P P p ( x , t 0 )
where N P P ( x , t 0 ) represents the NPP estimated value for the x pixel during the t 0 period. The x pixel is divided on average into M pixel points with the total represented by M x . N ( x , t 0 ) signifies the number of non-vegetation pixels within the x pixel during the t 0 period ( N ( x , t 0 ) M x ), N P P p ( x , t 0 ) means the NPP value of the x pixel with full vegetation coverage before urbanization during the t 0 period, and N P P u ( x , t 1 ) denotes the NPP value of the x pixel after urbanization in the t 1 period (7). Based on this, according to N P P u ( x , t 1 ) during the t 1 period, the direct and indirect impacts of urbanization on NPP can be derived. The equation is as follows (8) and (9):
D i r e c t   I m p a c t ( x , t 1 ) = N P P u ( x , t 1 ) N P P ( x , t 0 )
I n d i r e c t   I m p a c t ( x , t 1 ) = N P P ( x , t 1 ) N P P u ( x , t 1 )
where N P P ( x , t 1 ) represents the actual NPP value of pixel x after urbanization in the period t 1 , N P P ( x , t 0 ) is the estimated NPP value of pixel x in the period t 0 , and N P P u ( x , t 1 ) is the NPP value of pixel x in the period t 1 post-urbanization, considering only the impacts of land cover change (direct impacts). Therefore, the difference between N P P u ( x , t 1 ) and N P P ( x , t 0 ) represents the direct impact of urbanization on NPP in pixel x during the period t 0 1 . The value of the indirect impacts is determined by subtracting N P P u ( x , t 1 ) from the actual NPP value N P P ( x , t 1 ) of pixel x during the urbanization period t 1 , representing the indirect impact of urbanization on NPP.

2.2.4. Analysis of Dynamic Changes in NPP Trend

To demonstrate the dynamic change trend in NPP in Beijing from 2000 to 2020, this study adopted the method of Sen’s slope in conjunction with the Mann-Kendall trend significance test to analyze every pixel in the research area. The computation formula for Sen’s slope is (10):
β = n × m = 1 n m × N P P m m = 1 n N P P m m = 1 n m n × m = 1 n m 2 ( m = 1 n m ) 2
where β represents the trend value of NPP changes, where 1 < m < n , n stands for the study duration ( n = 20), m represents the year’s serial number, and N P P m represents the NPP value of year m . When β > 0, it indicates an increasing trend of NPP, and the larger the value, the more NPP increases. Conversely, it signifies a decreasing trend of NPP if the value is negative.
To further analyze the significance of the simulated trends for each pixel point, the Z value of the Mann-Kendall test was used to assess the significance of the NPP change trend in Beijing [35,36]. When |Z| > 1.65, |Z| > 1.96, and |Z| > 2.58, the results pass the significance test with confidence levels of 0.9, 0.95, and 0.99, respectively.

2.2.5. Geoda Spatial Autocorrelation Analysis

To study the spatial distribution characteristics of the impact of urbanization on NPP, this article employs spatial autocorrelation analysis. Spatial autocorrelation measures whether spatial elements are clustered and includes both global and local spatial autocorrelation [37]. Global autocorrelation reflects the similarity in attribute values between a spatial element and its neighbors, represented by the Global Moran’s Index [38]. The calculation formula is as follows (11)–(14):
I = a = 1 n b a n w a b ( x a x ̄ ) ( x b x ̄ ) S 2 ( a = 1 n b a n w a b )
S 2 = 1 n a = 1 n ( x a x ̄ ) 2
I i = 1 S i 2 ( x i x ̄ ) b = 1 , b a n w a b ( x a x ̄ )
S i 2 = 1 n 1 b = 1 , b a n w a b x ̄ 2
where I represents the Global Moran’s Index; I i stands for the Local Moran’s Index; n is the total pixel count in Beijing; x a and x b are the values by which pixel a and b NPP are changed due to urbanization, respectively; x ̄ is the average value of NPP changed by urbanization; w a b is the sum of spatial weights for all pixels. If pixels a and b are adjacent, the corresponding element in w a b is 1; otherwise, it is 0.
The Global Moran’s Index can determine whether there is spatial clustering among the elements within the study area. The value range for I is from −1 to 1. If I > 0, it indicates a positive spatial correlation among the spatial elements in that area; the larger the value, the more pronounced the spatial correlation [39]. When I < 0, it indicates a negative spatial correlation, and the smaller the value, the greater the spatial disparity. Local spatial autocorrelation analysis, on the other hand, can pinpoint the locations of spatial clustering among elements and is crucial for analyzing the distribution characteristics of specific spatial attributes in the study area.

3. Results

3.1. The Urban Expansion Process of Beijing over the Last 20 Years

Over the past two decades, Beijing has undergone rapid urbanization. Based on the PEI values (Table 1), this study categorizes Beijing’s urban expansion into three distinct patterns: infill expansion, edge expansion, and leapfrog expansion. Detailed analyses were conducted for four distinct time periods. The results indicate that edge expansion dominated in all four periods. Infill expansion was particularly evident between 2000 and 2005, where new urban patches frequently emerged between existing ones, suggesting a trend toward denser urban development. The leapfrog expansion pattern was most prominent from 2005 to 2015, with new patches extending in various directions, indicating an increasingly dispersed urban morphology. Between 2015 and 2020, the number of new patches resulting from all three expansion modes exhibited varying degrees of decline, indicating a gradual slowdown in Beijing’s urban expansion rate during this period.
During the urban expansion period, the primary changes in land use types are illustrated in Figure 2a. In 2000, 2010, and 2020, the urban land area was 2290.91 km2, 3135.51 km2, and 3593.77 km2, respectively, reflecting an overall growth of 56.87%. During this period, the cropland area decreased by 1381.91 km2, accounting for 24.76% of the total cropland area. Furthermore, the forest area increased during the urbanization process. To better display the afforested areas over the past twenty years, six primary land use categories (cropland, forest, grassland, water bodies, impervious, and barren land) were generated based on the GEE platform using Landsat images and human-computer interaction interpretation, with an accuracy exceeding 94.3% [27]. Comparisons of forest areas with Global Forest Change (GFC) data reveal that the spatial distribution of forests in this study is broadly similar to GFC data. These six primary land use categories were then reclassified into forest and non-forest types, and a forest/non-forest map of the study area was drawn. Figure 2b shows significant afforestation in the EC region, with an increase of 171.11 km2, mainly concentrated in Huairou, Miyun, and other areas. During the research period, the newly afforested area and the areas of forest logging in Beijing are shown in Figure A1, Figure A2 and Figure A3 (Appendix A). The forest area increased from 47.48% in 2000 to 48.74% in 2020. This demonstrates that the afforestation plan initiated by the Beijing municipal government in 2000 has achieved noticeable success.
Based on the changes in different land use types, this study further analyzed the characteristics of land use type transformation during the urbanization process. The results show that from 2000 to 2020, approximately 12.73% of the land area underwent land use type changes, highlighting the urbanization process in Beijing. As illustrated in Figure 3a, the orange color represents the type of transformation from cropland to urban land, mainly concentrated in the FE and ND areas. Notably, the orange area is the largest, indicating that most of the newly added urban land is transformed from cropland. In the FE and ND areas, the type of transformation from cropland to urban land accounts for 86.65% and 79.45% of their total transformations, respectively, as seen in Figure 3b. This reveals that a large amount of highly productive cropland has been occupied during the urbanization process, leading to significant losses in vegetation productivity in many areas.

3.2. Spatiotemporal Changes in Net Primary Productivity

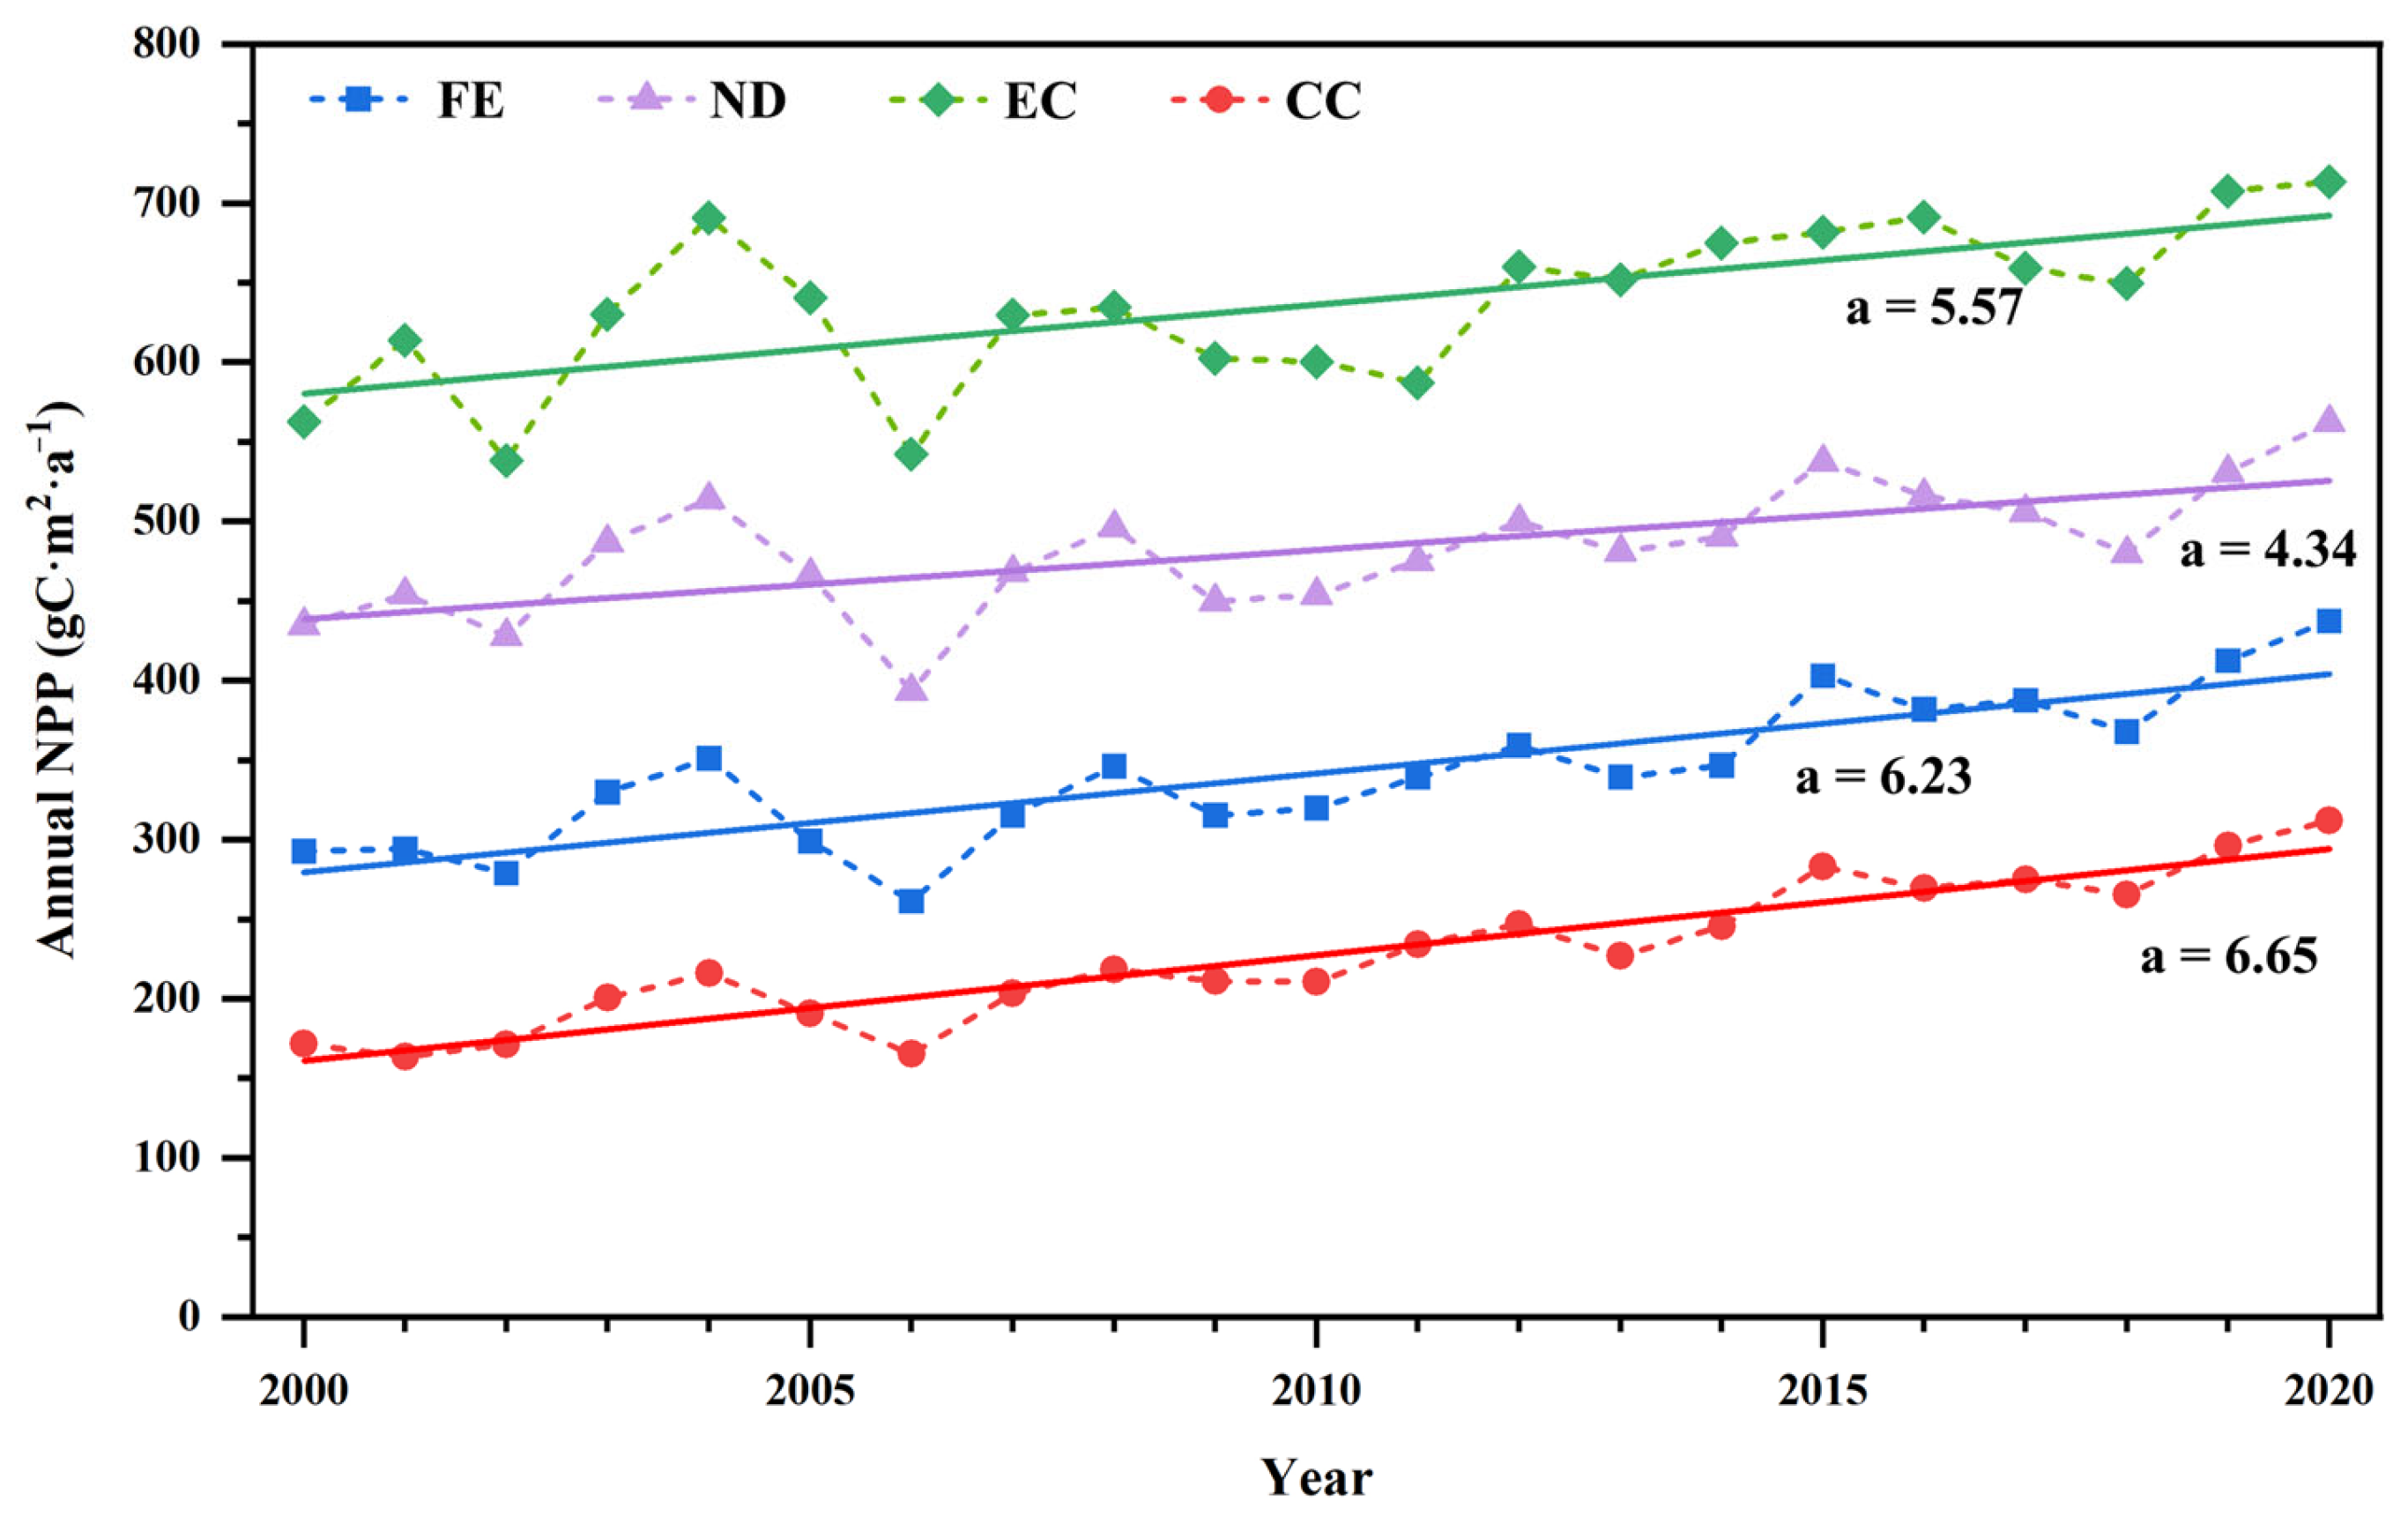
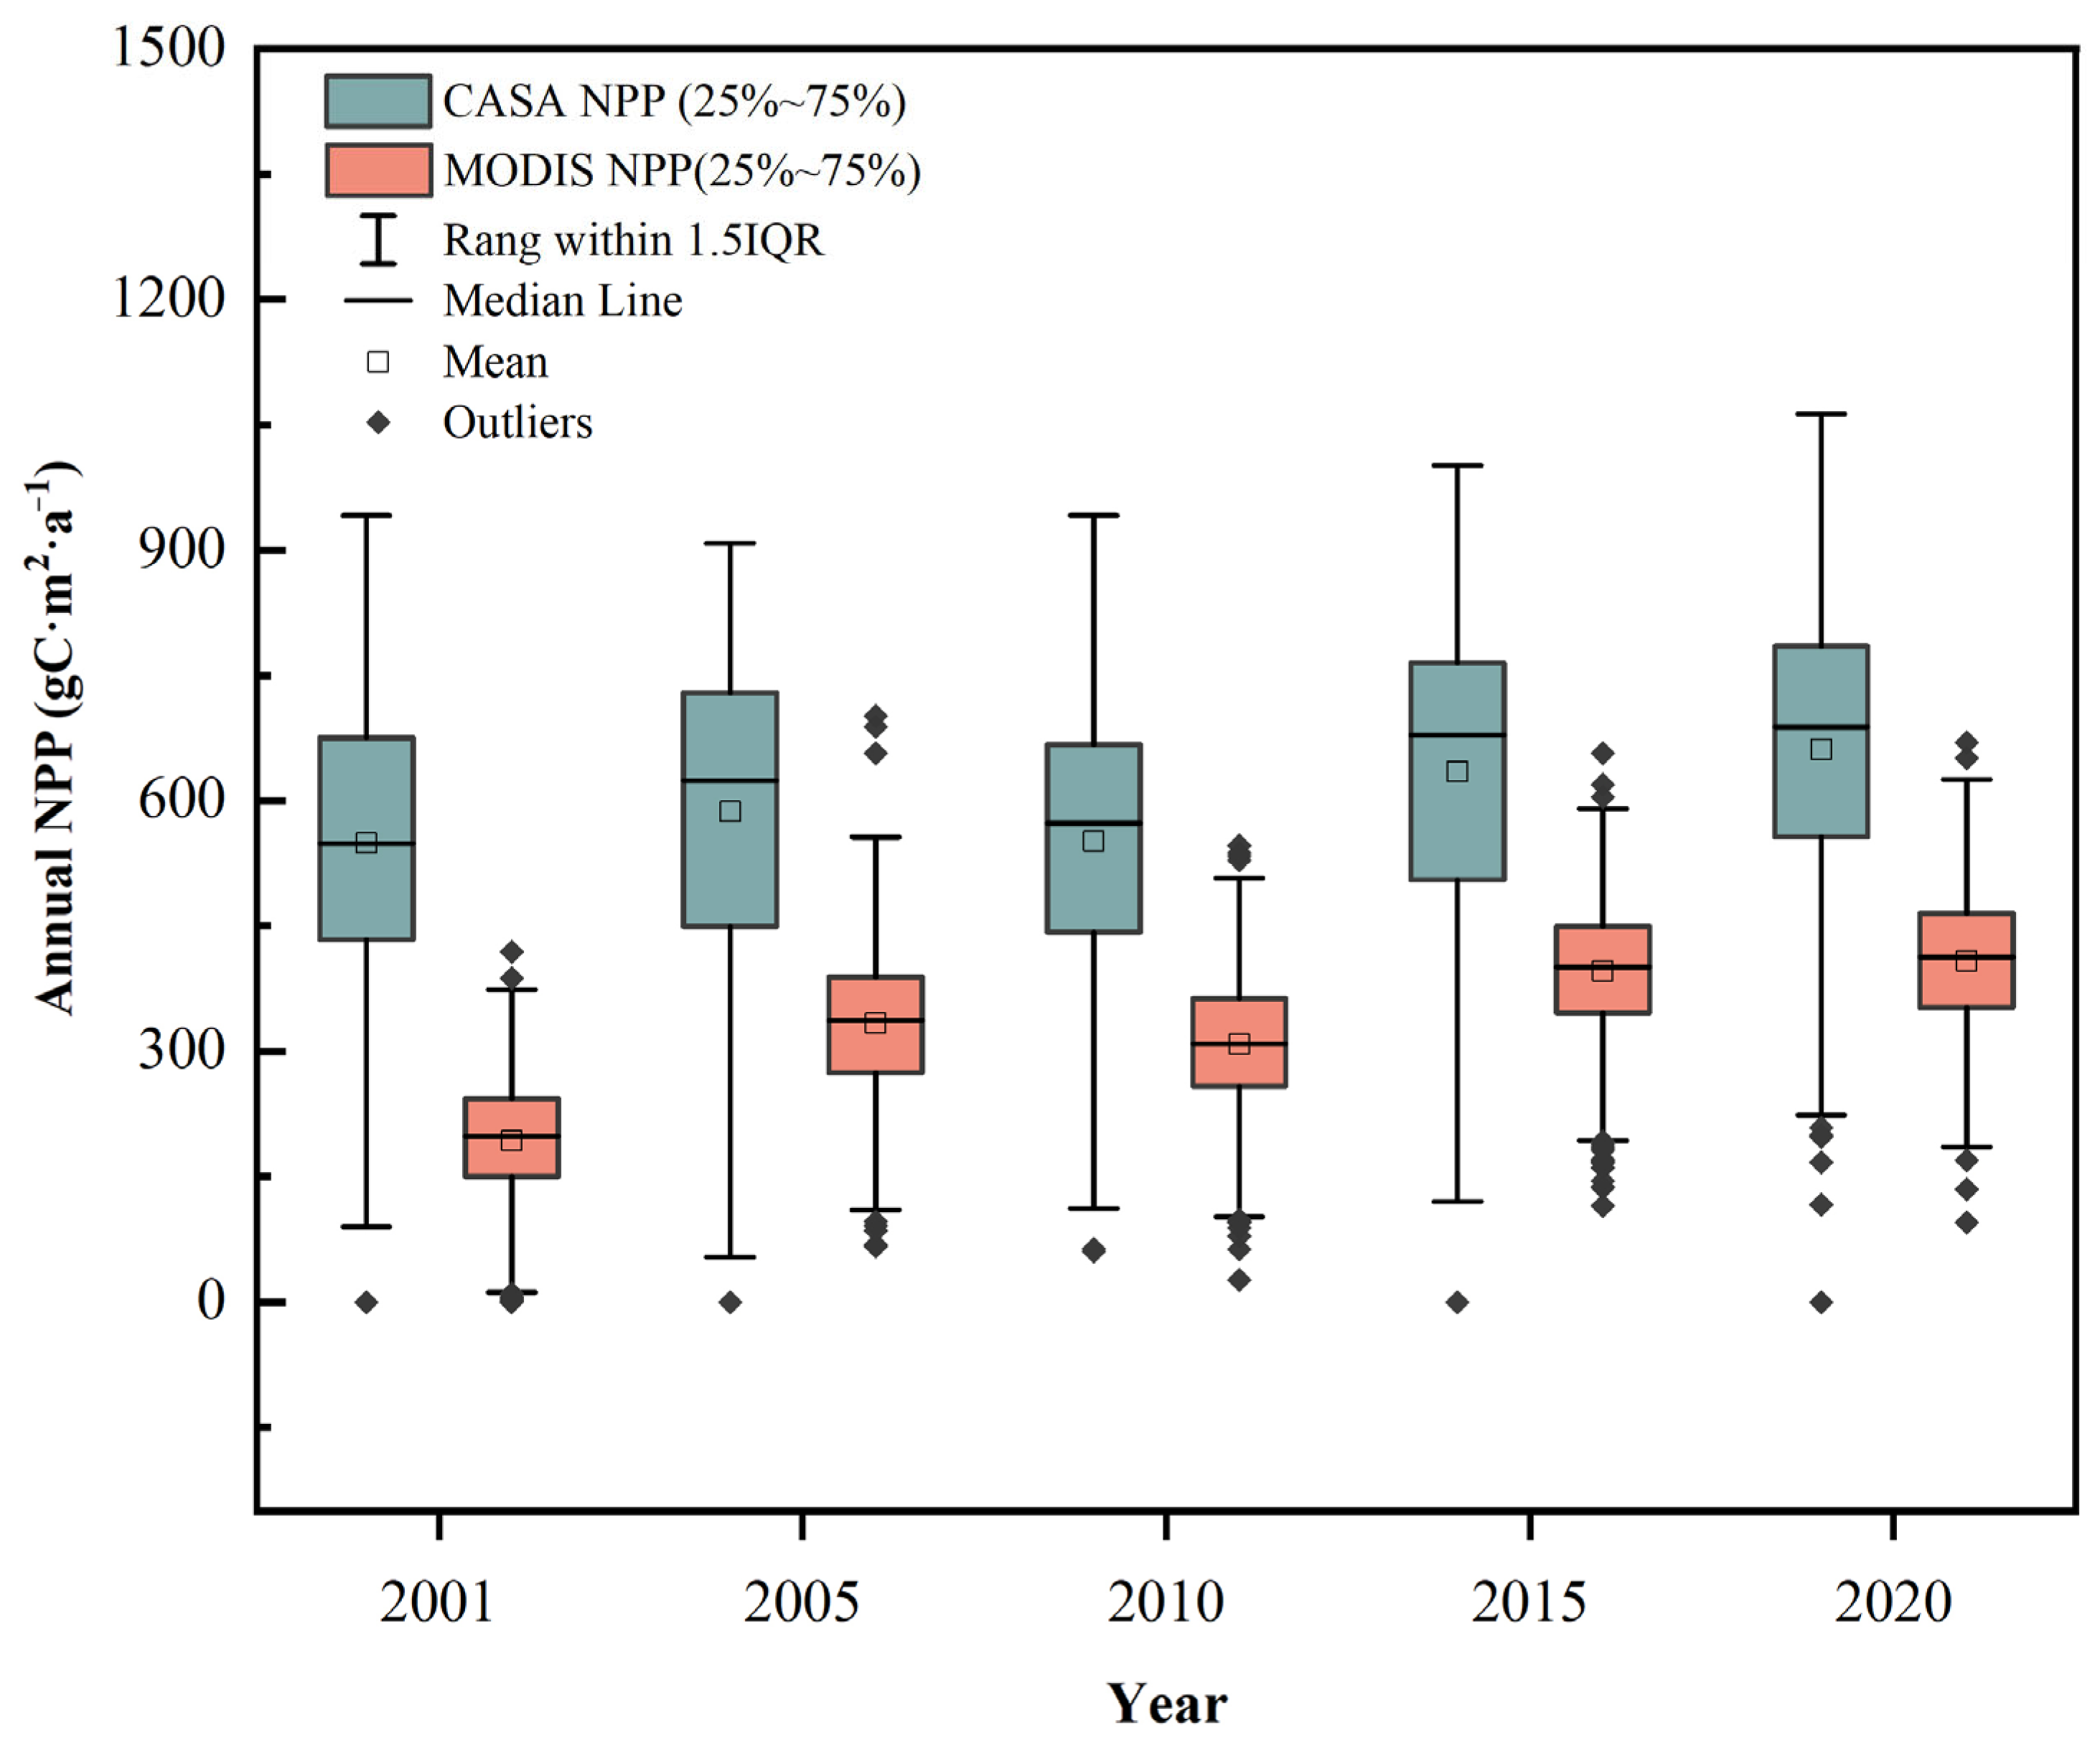
3.2.1. Temporal Characteristics of Net Primary Productivity

From 2000 to 2020, the overall annual average NPP of Beijing exhibited a wavy growth trend, with an annual growth rate of 5.16 gC·m−2·year−1. In 2020, it reached its peak, where areas with an annual average NPP exceeding 800 gC·m−2·year−1 accounted for 17% of the total study area. This is double the percentage from 2000, indicating that the vegetation’s carbon sequestration capacity within the study area is gradually strengthening year by year. Furthermore, as can be seen from Figure 4, the annual average NPP showed significant fluctuations during the period from 2000 to 2007. This is because, during this time, there was a higher prevalence of infill urban expansion, where new urban land patches often emerged between old ones, making urban development more compact. Compact cities tend to have a more significant negative impact on NPP. For example, decentralized cities, with their abundance of open spaces, facilitate the dispersion of internal pollutants [40]. However, compact cities, often associated with the heat island effect, affect the dispersion of pollutants, leading to higher concentrations of pollutants within these cities. This can easily exceed the ecosystem’s regulatory capacity, resulting in an unstable trend in the regional ecosystem state [41,42]. During this period, the disordered expansion of urban areas at the edges also severely impacted the NPP, which exhibited a fluctuating downward trend [43]. After 2007, the annual average NPP gradually stabilized, with areas having an annual average NPP of less than 400 gC·m−2·year−1 accounting for 37%. Overall, urbanization significantly reduced the regional NPP. However, with the continuous promotion of ecological construction and the constant increase of green spaces within cities, the direct negative impacts brought about by urbanization have significantly been alleviated.

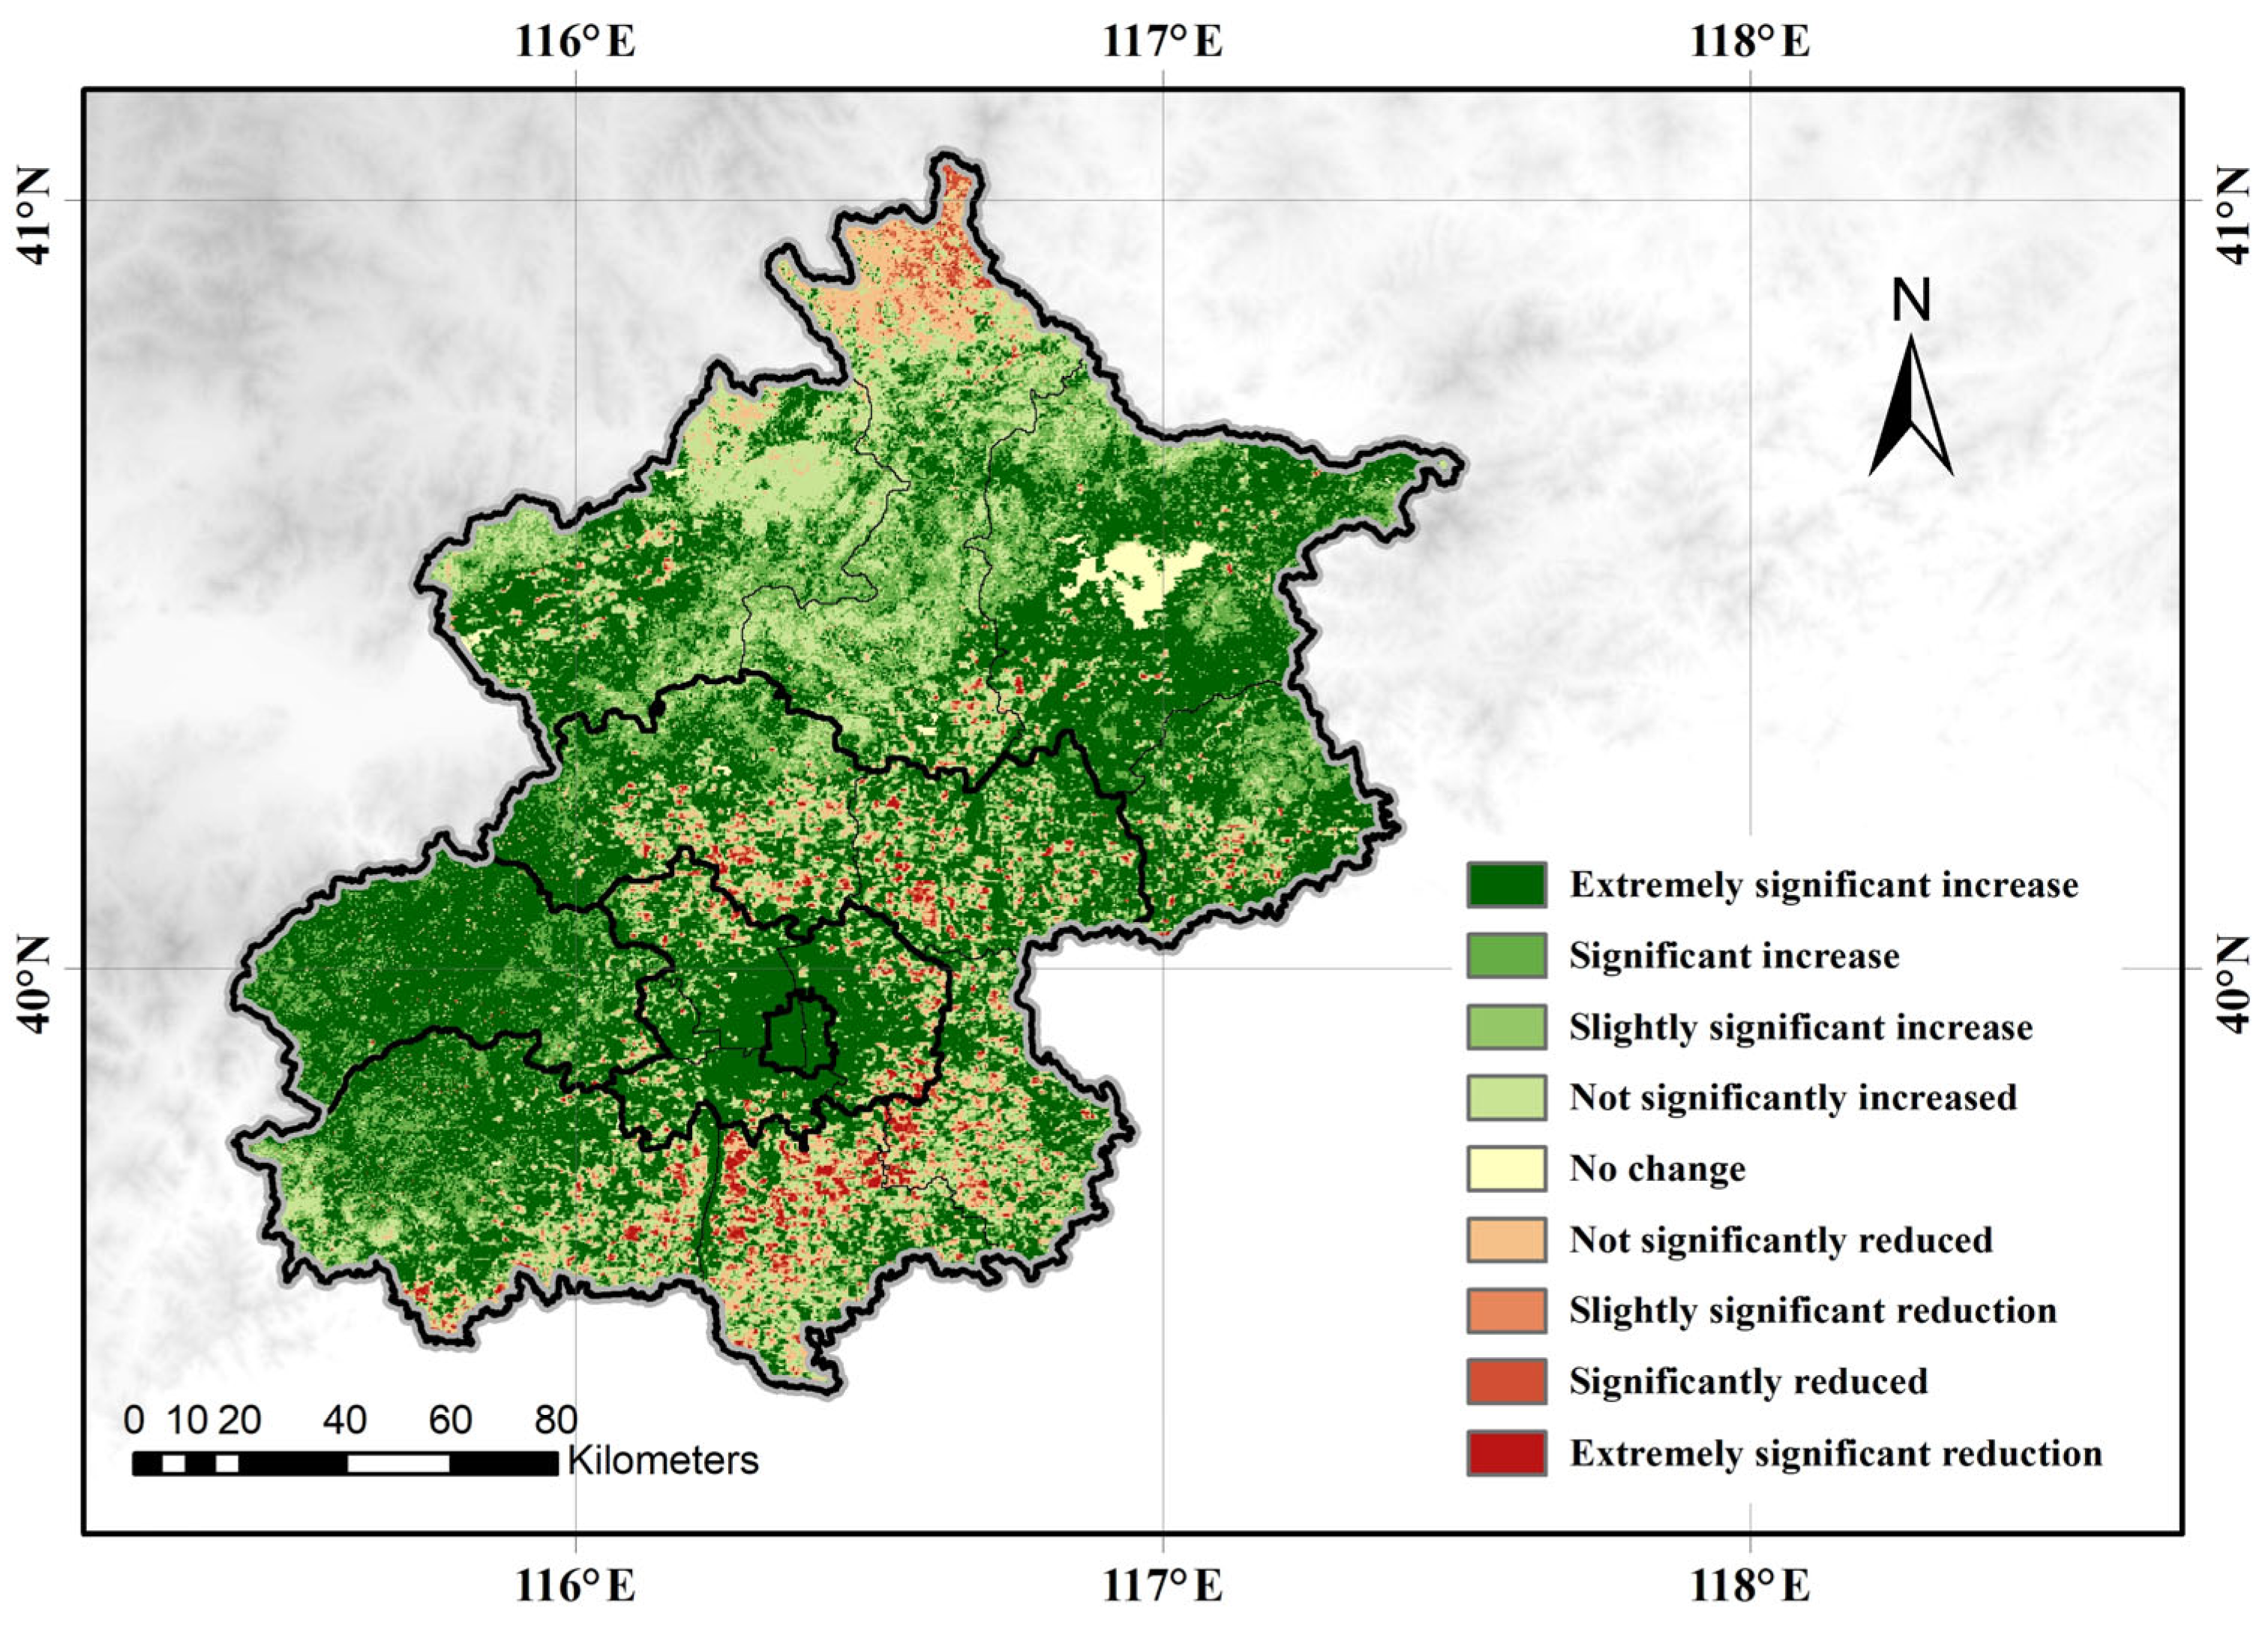
3.2.2. Spatial Characteristics of Net Primary Productivity

The spatial distribution of NPP in Beijing generally increases from east to west and from south to north. High NPP values are mainly concentrated in the EC area. To study the impact of urbanization on NPP, the spatial trend changes of NPP in Beijing from 2000 to 2020 were analyzed. The results show that 84.27% of the study area exhibits an increasing trend in NPP, of which 13.01% of the study area showed a highly significant increase in NPP. As depicted in Figure 5, the CC and FE areas have a larger area where NPP has increased significantly. For example, in the ecological management project of the Beijing-Tianjin Sand Source Control, measures such as converting farmland back to forest and afforestation of wastelands were taken. These ecological management projects have led to an increase in vegetation in urban areas, and human management has enhanced the vegetation’s carbon sequestration capacity. For instance, artificial irrigation during summer can mitigate the restrictive effects on vegetation growth due to water shortages.
Due to the influence of urbanization, the NPP levels in the four areas all showed growth trends at varying rates (Figure 6). Among them, the CC area had the fastest growth rate (6.65 gC·m−2·year−1). This is because the CC area is already highly urbanized; the urban heat island effect generated internally promotes vegetation growth in winter, while the direct negative impacts of urbanization are relatively minor. In contrast, the ND area exhibited the slowest growth rate (4.34 gC·m−2·year−1), indicating that urbanization has had a significant negative impact on the regional ecosystems of the ND area. Overall, urban expansion in Beijing has not reduced the carbon sequestration capability of vegetation, but it has slowed the growth rate of this capability.

3.3. Direct and Indirect Impacts of Urbanization on NPP

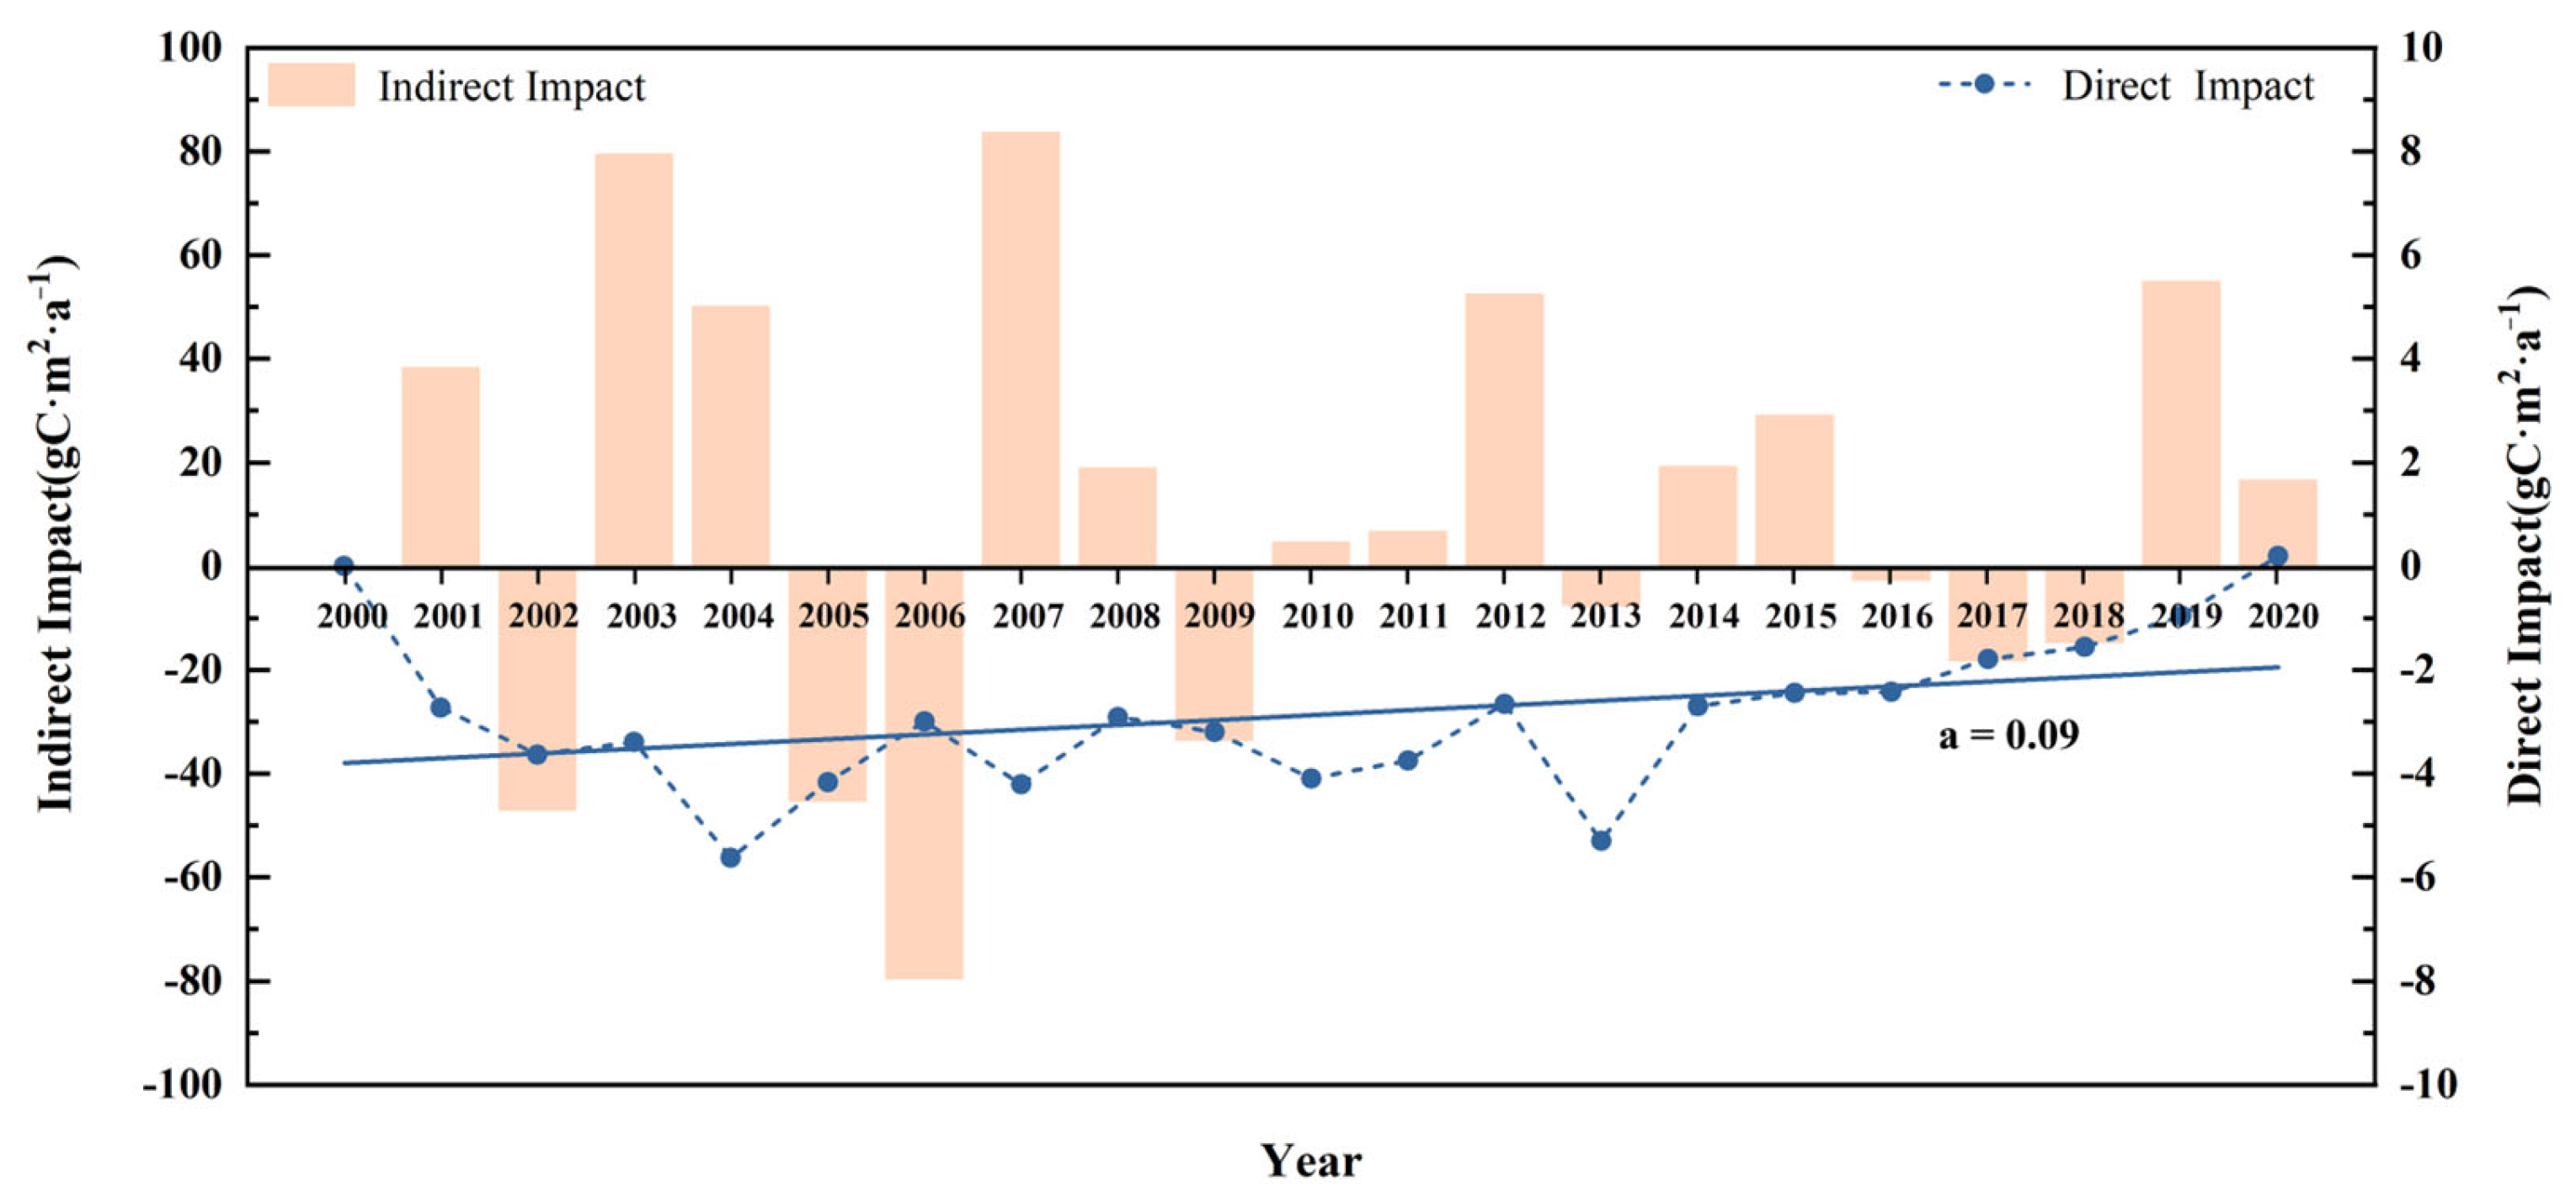
3.3.1. Inter-Annual Variation

The impact of urban expansion on NPP is complex and varies with the patterns of urban expansion. While urban land replacing vegetation cover directly damages urban NPP during urban expansion, natural climatic conditions, and human activities also positively influence the growth state of vegetation. Hence, this study categorizes the impact of urbanization on NPP into direct and indirect impacts. The mechanisms of these two impacts differ in Figure 7; the direct impact brought about by urbanization over the past two decades has consistently been negative and has been intensifying, with an annual direct impact of −2.87 gC·m−2·year−1. This means that when vegetation cover is converted to urban land due to urbanization, the regional ecosystem incurs a carbon loss of 2.87 gC·m−2·year−1. In contrast, excluding the indirect impacts caused by changes in land use types, despite fluctuations, the impacts have consistently been positive, with an annual average of 9.76 gC·m−2·year−1, resulting in a carbon gain of 9.76 gC·m−2·year−1. This indicates that the climatic changes and human activities triggered during the urbanization process have had a positive impact. In this context, the carbon loss due to urban expansion counterbalances 29.41% of the carbon gain resulting from the indirect influences.

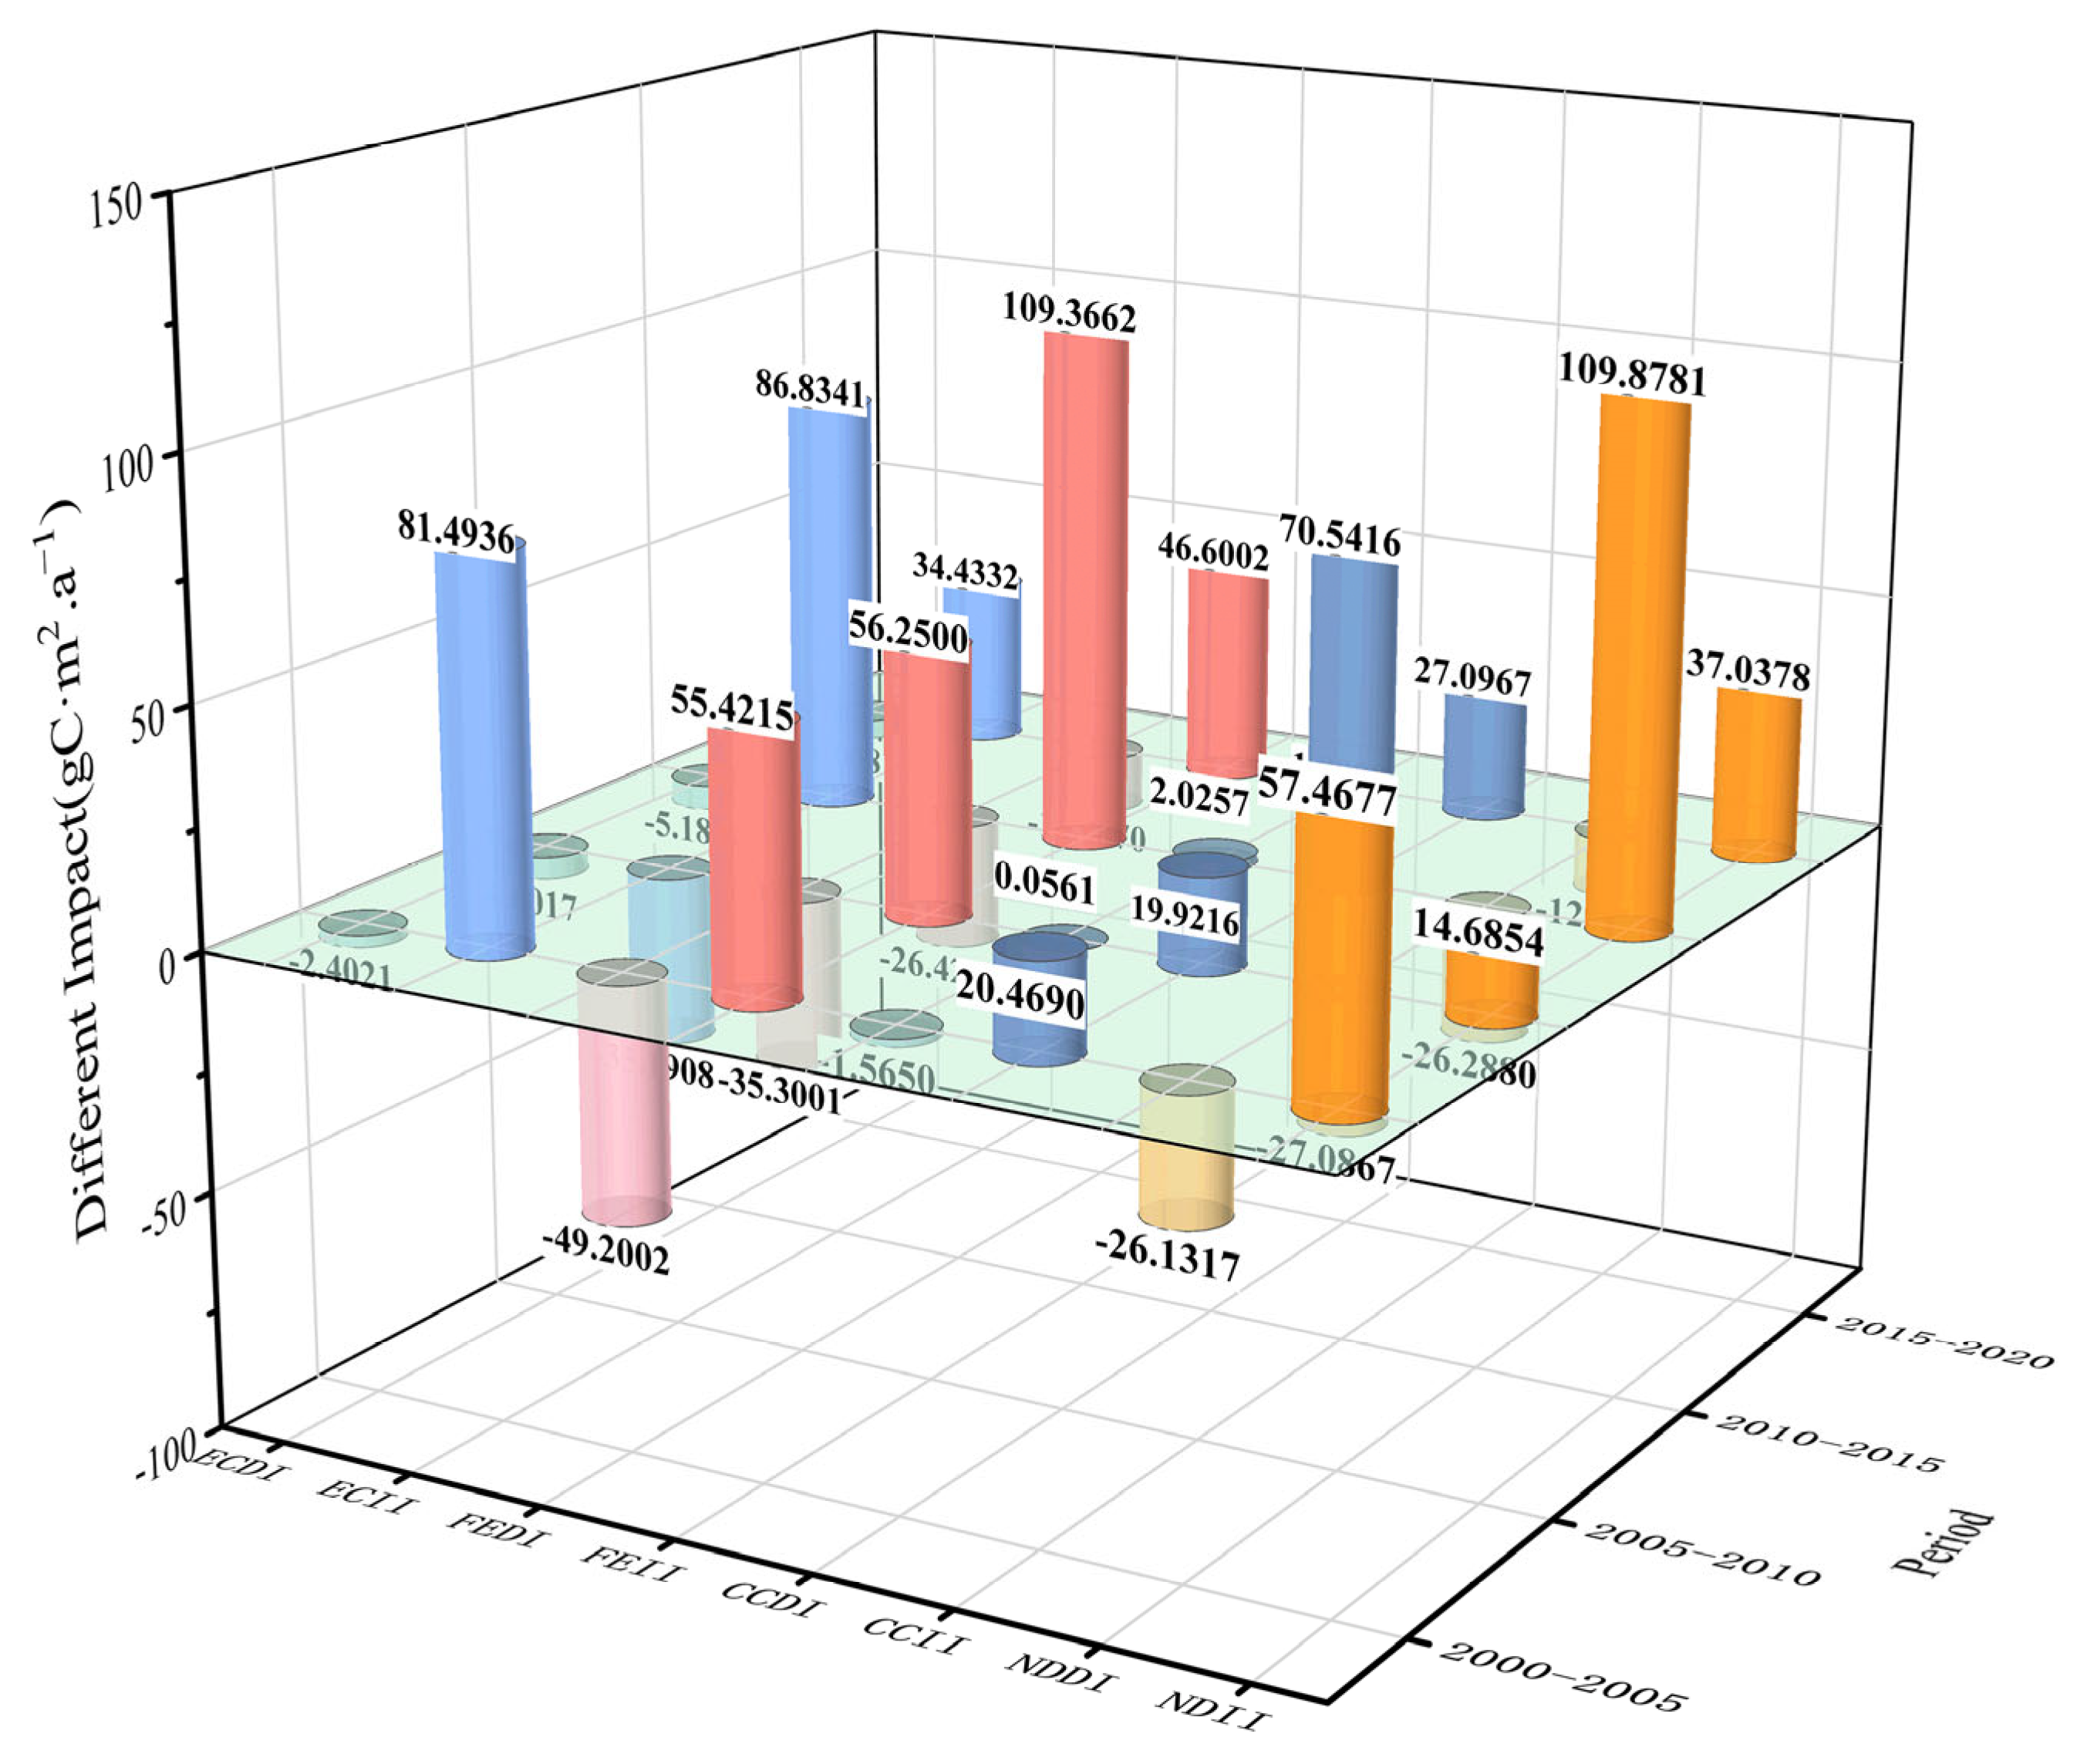
3.3.2. Regional Differences

Due to the vast spatial extent of Beijing, there are often significant spatial variations within the metropolis. This study divided the analysis into four periods (the past twenty years have been divided into four stages on average) to calculate the direct and indirect impacts in different areas (Figure 8). The results indicate that the FE and ND areas experienced the most significant direct impacts due to changes in land use types, and these impacts were negative. Between 2000 and 2005, the direct impact peaked in the FE area (49.21 gC·m−2·year−1), suggesting that the FE area underwent rapid urbanization during this period. From 2005 to 2020, the direct impact in the CC area was positive and continually increasing, indicating an increasing focus on greening efforts in the CC area and a gradual shift in land use type toward vegetation cover. In contrast, the indirect impacts were positive in most areas. Between 2010 and 2015, the indirect impact peaked in the ND area (109.87 gC·m−2·year−1). During this period, the negative direct impact offset 23.92% of the NPP gain caused by the indirect impact. The annual averages for the ND and FE areas were both higher than those of the ecological conservation areas, indicating that the positive indirect impact on vegetation within urban areas exceeds that of non-urban forested regions.

3.4. Analysis of Indirect Impact Driving Factors of Urbanization

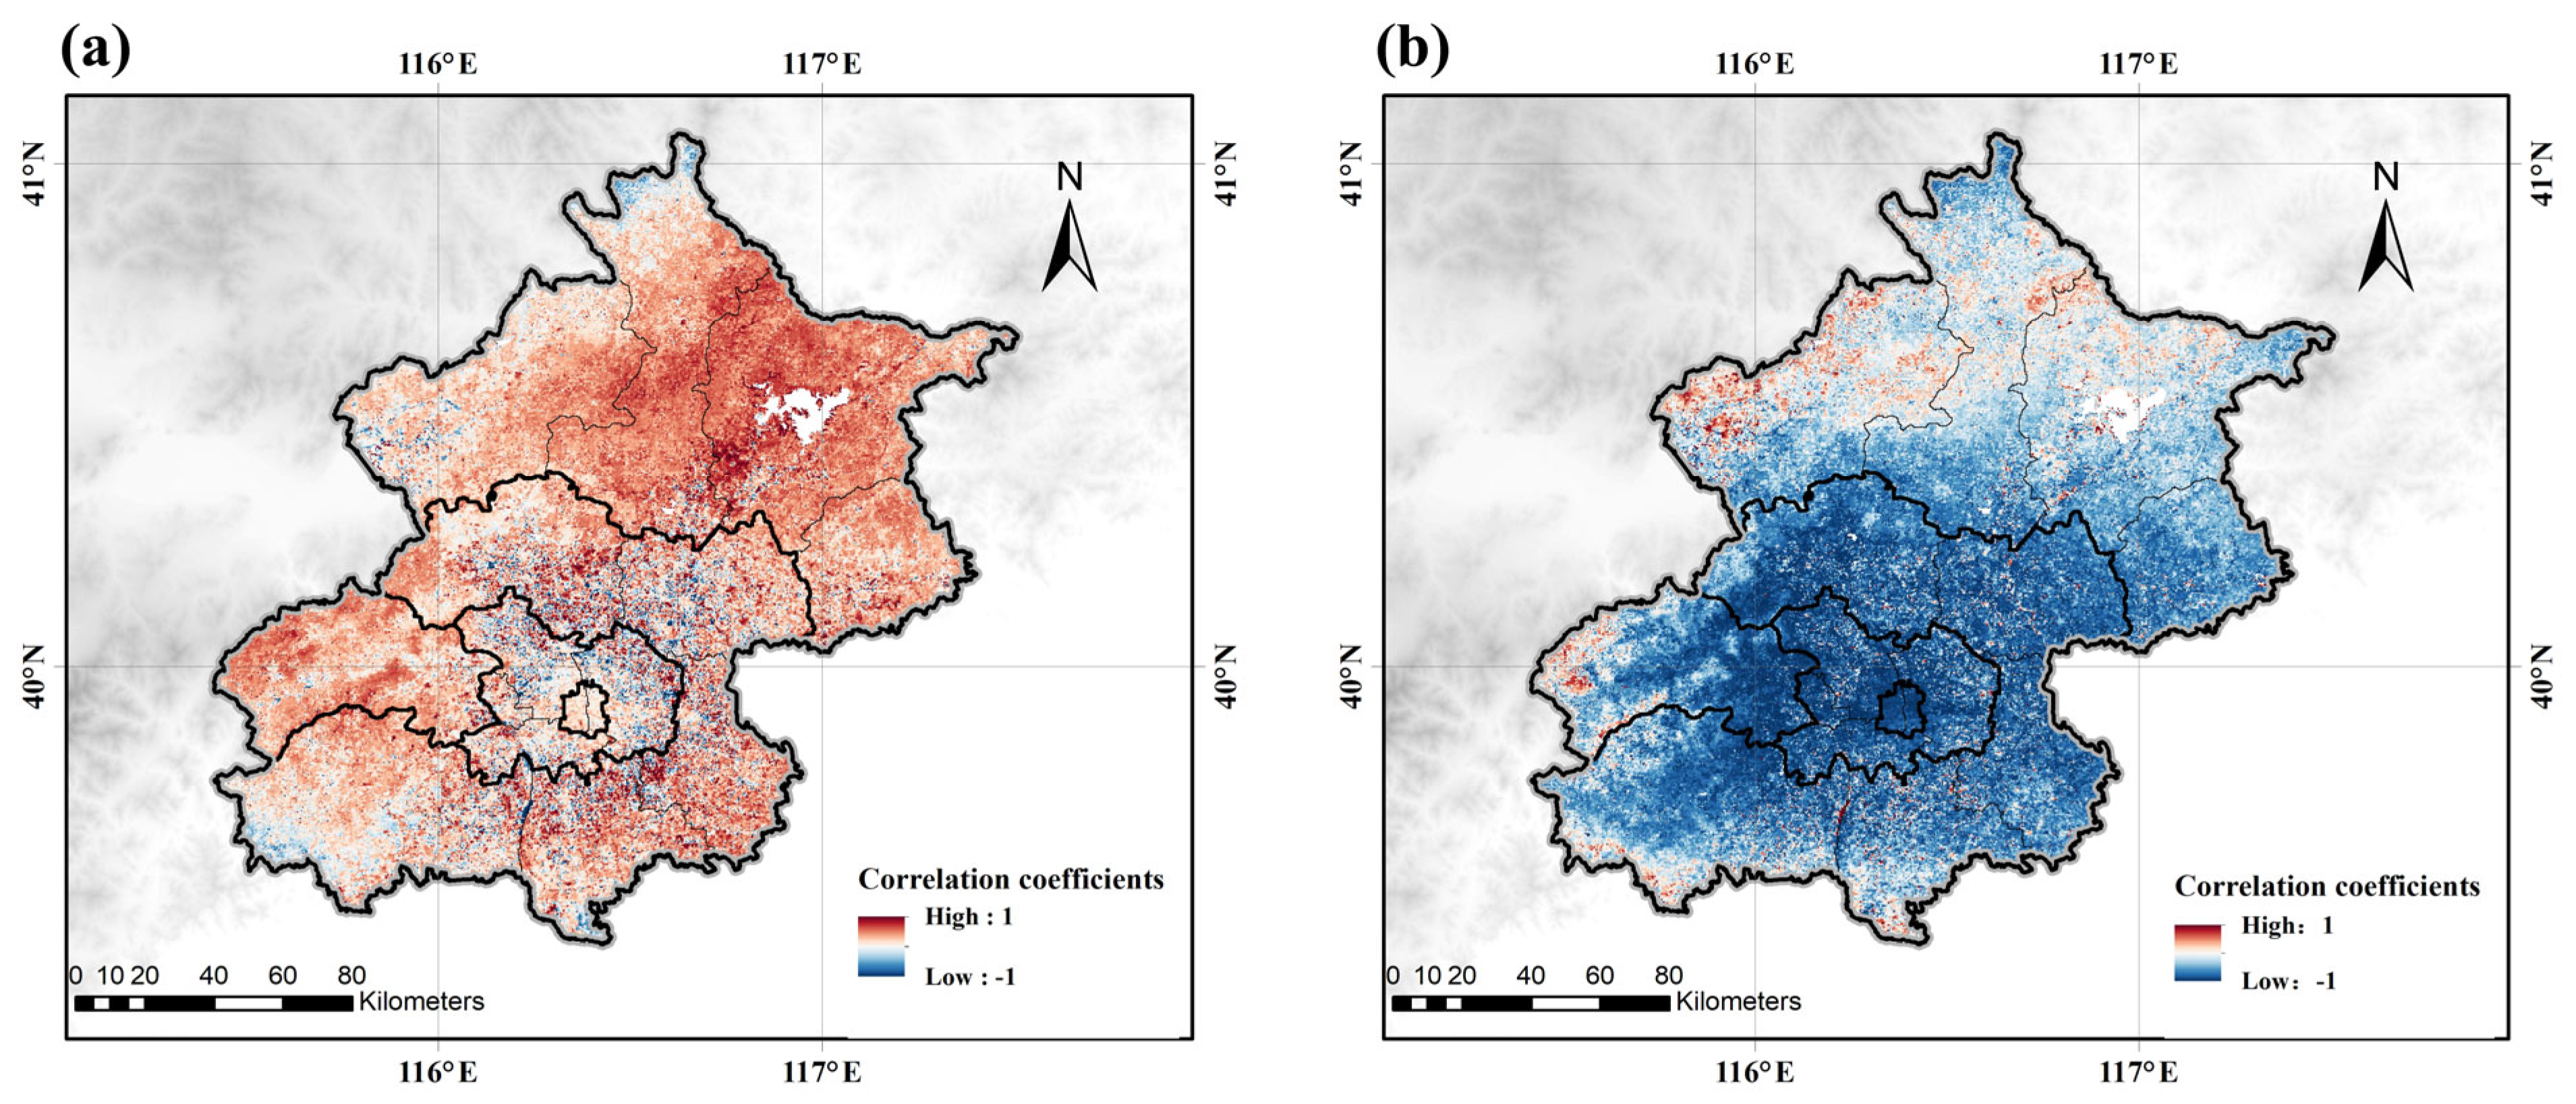
3.4.1. Correlation Analysis

The indirect impact of urbanization refers to its influence on plant growth, that is, the response of plant growth to changes in environmental conditions [18]. The direct impact of urbanization on regional NPP is theoretically a linear decline due to vegetation loss caused by land use changes. The indirect impacts of urbanization are more complex, often affecting vegetation NPP indirectly by altering the growth environment crucial for plant growth. Studies show that climate change indirectly affects regional vegetation NPP by influencing the Start of Photosynthesis Period (SOP) [44,45]. This study quantifies the indirect impacts using a modified urban impact framework, specifically the difference between actual vegetation NPP and theoretical vegetation NPP (considering only the impact of land use changes during urbanization) in a given area after urbanization [46]. Climatic factors are the dominant natural elements controlling vegetation growth, with temperature, precipitation, and solar radiation jointly determining the input of water and energy during the vegetation growth process [47]. Studies have shown that temperature and precipitation have significant effects on the growth state of plants, with these two factors making the most significant contribution to changes in the NPP [48,49,50]. Therefore, this paper selects temperature and precipitation for correlation analysis with the indirect impacts of urbanization, with the aim of determining which of these two factors is the main driving force behind the indirect impacts of urbanization. The results showed that, between 2000 and 2020, over 80% of the area exhibited a positive correlation between the indirect impact and temperature (Figure 9a). In contrast, only around 20% of the area showed such a correlation with precipitation (Figure 9b), suggesting that temperature is the primary driver of the indirect impacts. The regions showing a significant positive correlation between temperature and indirect impact were mainly concentrated in the EC and ND areas. In the ND area, vegetation growth was enhanced due to the rise in temperature brought about by rapid urbanization (including both natural climate change and the urban heat island impact) [51]. On the other hand, the EC area, being less impacted by urbanization, saw natural climate variations as the main driving force behind the indirect impacts. Notably, in some urban areas, temperature and the indirect impact showed a negative correlation, as vegetation growth can be inhibited when temperatures, exacerbated by the urban heat island impact, exceed the optimal range for plant growth.

3.4.2. Seasonal Heterogeneity

Direct impacts influence NPP by altering land use types and are, therefore, not affected by seasonal variations. Although fluctuations exist, these impacts are consistently negative. However, indirect impacts mainly affect the growth state of vegetation, where NDVI is an effective indicator reflecting the growth state of plants. As illustrated in Figure 10c, in summer and autumn (July to September), the climate is warm, and precipitation is plentiful, resulting in more significant indirect impacts and better vegetation growth. Conversely, in winter (October to January), the lower temperatures and dry conditions lead to lesser indirect impacts and poorer vegetation growth. The extent of indirect impacts is mainly influenced by seasons, necessitating further exploration of their seasonal heterogeneity. The results reveal that the peak indirect impacts for four areas predominantly occur in the summer (August), with the lowest values manifesting in the winter (February). This pattern aligns with the annual temperature distribution depicted in Figure 10b, reaffirming temperature fluctuations as the primary driver of indirect impacts. Conversely, in the CC area, the maximum indirect impact occurs in winter (January), showing a U-shaped curve with higher values in autumn and winter than in summer, indicating that urbanization’s indirect impact on vegetation growth is more pronounced during colder periods (Figure 10a). This finding is consistent with prior research conclusions, which posit that vegetation in urban areas of colder environments provides positive feedback to warming climates [52,53,54]. As observed from Figure 10b, the temperatures in urban areas (CC, FE, ND) during winter are consistently higher than in suburban areas (EC), with the FE area exhibiting the most pronounced difference, reaching its peak in autumn rather than summer. Thus, it becomes evident that during winter, when temperature is the primary limiting factor for plant growth, the elevated temperatures brought about by the urban heat island impact within the cities favor vegetation growth more than in the less urban-affected suburban areas, resulting in higher values in autumn and winter than in summer.

4. Discussion

4.1. Evaluation of NPP Simulation Results

Validation of NPP can be conducted using two methods: the empirical validation method and the relative validation method. Given the vastness of the study area and the challenges in obtaining empirical data, this study opted for the relative validation method. We compared the NPP data calculated using the CASA model directly with the MODIS NPP data downloaded from NASA’s official website. The MOD17A3 NPP data has been validated and endorsed by many studies, confirming its suitability for global and regional scale NPP research [16,55,56]. Consequently, many studies have juxtaposed model estimates with this product dataset to assess the reliability of their estimates [15]. As this study investigates the impacts of urbanization in five-year intervals and the MOD17A3 product starts from 2001, we chose the years 2001, 2005, 2010, 2015, and 2020 for accuracy verification. The data fit between the two sources has an R2 value of 0.75 (p < 0.001), indicating that the NPP data computed in this study is precise and suitable for analytical research.
The average NPP estimates of both CASA and MODIS products were extracted from 2000 random points within the study area. This is because the MODIS product does not estimate the NPP of built-up lands, necessitating the exclusion of central urban areas during accuracy verification. As illustrated in the Figure 11, the NPP absolute values estimated by the CASA model are higher than those of the MODIS product. This discrepancy might be attributed to the MODIS product’s omission of urban area NPP estimates. Moreover, previous research has compared the average MOD17A3 NPP data with observational data, finding that the former is lower than the latter, but they are closely correlated [57]. Ultimately, this study also demonstrates that the NPP growth trend in urban centers is higher than in other areas, and it cannot be overlooked.

4.2. Necessity of Separating Direct and Indirect Impacts

Urban expansion has caused irreversible changes to terrestrial ecosystems, damaging the vegetation’s carbon sequestration capability and leading to carbon loss. However, the impacts of urbanization are complex, encompassing not only urban expansion but also anthropogenic influences and the resultant environmental impacts. Urban expansion has caused irreversible changes to terrestrial ecosystems, damaging the vegetation’s carbon sequestration capability and leading to carbon loss. However, the impacts of urbanization are complex. It does not only involve urban expansion, but anthropogenic impacts and their subsequent environmental consequences are equally pivotal. Through a per-pixel analysis of NPP trends from 2000–2020 in the study area, it was found that both the CC area and FE area exhibited a significantly increasing trend in NPP. In a comparison between the CC and EC areas, there’s a growth trend discrepancy of 1.08 gC·m−2·year−1. This indicates that the positive indirect impacts of urbanization ensure an additional 1.08 gC is produced by vegetation per square meter annually. The above conclusion is consistent with findings that vegetation’s carbon sequestration capability is enhanced in urban environments under human intervention [1,58]. For instance, under the context of urban vegetation management, the rise in urban environmental temperature can advance the start of the growing season and, in colder conditions, delay its conclusion, thus resulting in longer vegetation growing season in urban areas compared to suburban regions [59,60,61]. The findings of this research, derived from considering indirect impacts, underscore their importance and indicate they should not be overlooked.
By calculating the linear trend of indirect impacts across different areas, as shown in Table 2 below, the EC area experienced the smallest increase. This suggests that vegetation in urban areas undergoes a more significant indirect influence than in natural settings. This finding aligns with previous research [58], emphasizing that the positive indirect impact of urbanization on vegetation growth is most evident in urban regions where vegetation is relatively scarce. This further underscores the many enhancing impacts urbanization brings to vegetation growth in urban areas. In summary, if only the direct impact of land use type changes is considered, overlooking the indirect positive impacts on vegetation growth, this study would only conclude that urbanization in Beijing over the past 20 years has reduced the city’s NPP. Therefore, it is necessary to dissect the impacts of urbanization on NPP.

4.3. Spatial Heterogeneity of Direct and Indirect Impacts

The impact of urbanization on NPP might vary due to differences in temporal and spatial scales; previous studies have predominantly focused on temporal scales, often neglecting the spatial impact variations caused by different areas and vegetation types. The direct impacts arise as urban land use replaces plant cover, affecting regional NPP; however, different types of vegetation result in varying carbon storage losses. For instance, Jiang et al. [62] found that urban expansion significantly reduces the NPP of areas with high NPP values, such as cropland and forests, in suburban regions.
This study utilized Geoda software to calculate the Global Moran’s I for direct and indirect impacts over four periods separately, evaluating the spatial characteristics of the direct and indirect impacts. The results show that the Global Moran’s I for both types of impacts is greater than 0 (p < 0.001), illustrating a significant spatial autocorrelation for both impacts in Beijing. For all four periods, the Global Moran’s I for indirect impacts was consistently higher than that for direct impacts (Figure 12), suggesting that indirect impacts have a stronger spatial correlation.
However, Global Moran’s I only indicates whether the two impacts are aggregated but does not reveal the location and intensity of the aggregation. Hence, the local indicators of spatial association (LISA: Local Moran’s I analysis) and significance for the two impacts were computed. The figure below further illustrates the geographic spatial distribution characteristics of the two impacts. Beijing’s urbanization process can be inferred from the LL (Low-Low) clusters of direct impacts. The LL (Low-Low) clusters, having negative values, symbolize the negative impacts brought by urbanization, mainly reflecting the changes in NPP caused by the transformation of LULC. Over the past 20 years, the expansion of Beijing’s outskirts has been dominant, mainly occurring in the ND area, where the NPP is most directly impacted (Figure 13i–l). This aligns with previous studies where the expansion primarily occurs around larger original cities [63]. It is noteworthy that the land occupied by the peripheral expansion is typically fertile and highly productive, exacerbating significant loss in suburban vegetation coverage [64,65]. Between 2015 and 2020, the number of HH (High-High) clusters of direct impacts within urban areas increased, indicating that by then, urban areas had started emphasizing the development of green spaces.
The spatial correlation of indirect impacts is stronger. From 2005 to 2010, the HH (High-High) clusters of indirect impacts were highly aggregated in urban areas. During this period, the growth of urban vegetation improved significantly due to indirect impacts (Figure 13n). From 2010 to 2020, the HH (High-High) clusters of indirect impacts were more dispersed. This is because the urban expansion pattern gradually shifted to a leapfrog mode, with new urban patches sparsely distributed around the city, far from existing patches. The leapfrog expansion may be due to human activities and living needs, such as the development of new farmland and irrigation fertilization, causing the HH (High-High) clusters of indirect impacts to spread rapidly outward (Figure 13o–p). In summary, the HH (High-High) cluster areas of indirect impacts can effectively improve the growth status of vegetation, so establishing new urban green spaces in these areas can achieve higher carbon gains.

4.4. Exploring the Impact of Urbanization on Regional Carbon Budgets

Terrestrial ecosystems, as an essential component of the global carbon cycle, possess the capability to fix and absorb carbon dioxide, playing a crucial role in offsetting a portion of industrial carbon emissions [66,67,68]. Urbanization has significantly impacted ecosystems in recent years; thus, it is necessary to analyze its impact on regional carbon budgets further. NPPD represents the total NPP directly affected by regional urbanization, indicating carbon loss post-urbanization. Research suggests that over the past two decades, vegetation covering approximately 1321.26 km2 in Beijing has been replaced by other land cover types, resulting in a carbon loss of 0.985 TgC (Table 3). Among the different areas, the ND area contributes the most, with losses reaching 66.09% (0.651 TgC), primarily due to the substantial loss of cultivated land in this area. Except for the CC area, the EC area shows the least variation, highlighting the critical position of the EC area in the sustainable development of the capital. Notably, from 2015 to 2020, carbon losses due to urbanization in Beijing were reduced by half, with the ND area showing the most significant decrease. This underscores the success of Beijing’s efforts in alleviating non-capital functions, mitigating “ metropolis syndrome” [69].
Post-urbanization, the entire area’s NPPLV rose to 359.66 gC·m−2, marking a 1.56-fold increase from 2000. This indicates that an additional 847.08 km2 of green space is needed to offset the carbon loss during urbanization. Furthermore, the higher the NPPLV after urbanization, the more apparent the positive effects of the indirect impacts of urbanization. Therefore, the vegetation requirements to offset carbon losses vary. For instance, the ND, FE, CC, and EC areas, respectively, require 748.23 km2, 766.25 km2, 779.17 km2, and 978.59 km2 of green space to compensate for carbon loss during urbanization. The ND area requires the least amount of green space. It is the ideal area for converting land into vegetation, followed by the FE area. The CC area, the central urban area, does not have much area converted into vegetation. Based on the analysis of spatial heterogeneity of indirect impacts, the ND area, particularly Tongzhou and Daxing districts, has a higher concentration of HH (high-high) clusters, indicating significant indirect impacts. In summary, urban greening should proceed according to the ND, FE, and EC areas. When constructing green spaces, the Tongzhou and Daxing districts in the ND area might be prioritized for their potential superior carbon sequestration benefits. Rational urban greening is crucial for achieving sustainable urban development. It can effectively counteract the carbon sink loss brought about by urban sprawl.

4.5. Limitations and Future Outlook

This study first uses the CASA model to estimate the NPP of terrestrial vegetation. Then, an improved urbanization impact framework is employed to analyze the impact of urbanization on NPP. This impact is further subdivided into two distinct impacts for in-depth analysis. This research contributes to a comprehensive understanding of the impact of urbanization on carbon storage. Offering insights into how to compensate for carbon storage losses during urban expansion. Urban carbon storage losses can be mitigated through more detailed green space planning. However, there are certain limitations to the study. Firstly, indirect impacts are complex, and human-induced effects can be overlooked when environmental factors dominate. Secondly, the urban heat island effect generated within cities can accelerate soil carbon decomposition while promoting vegetation growth in urban areas during winter, potentially offsetting the carbon gains from indirect impacts. Therefore, to better understand how to mitigate the impact of urbanization on carbon storage, it is necessary to incorporate the changes in soil carbon storage into further research. Lastly, due to the accuracy of the CASA model in estimating NPP being influenced by input data and model parameters, future studies should focus on higher-resolution data and optimized models.

5. Conclusions

This study dynamically analyzes the direct and indirect impacts of urbanization on regional NPP in Beijing from 2000 to 2020. It was determined that indirect impacts are the significant contributors to the impact of urbanization on NPP. The regional NPP was estimated using the CASA model, and the urban expansion process was further analyzed using PEI. We proposed a framework predicated on pixel-level analysis of urban expansion extent, aimed at dissecting the dynamic composite impacts on NPP amid urban expansion processes. Over the past 20 years, Beijing has undergone rapid urbanization, with a metropolitan area growth of 56.87%. This led to a significant loss of cropland, accounting for 24.76% of the total cropland area. During this period, NPP in Beijing showed a fluctuating upward trend with an average annual growth rate of 5.16 gC·m−2·year−1. Spatially, 32.34% of the area showed a significant increase in NPP trends. High NPP values were mainly concentrated in the northern and northwestern regions, with lower values in the southern and southeastern areas. The direct impact harms urban NPP by directly replacing vegetation cover, and this increases with the progression of urbanization. The mechanisms causing NPP changes due to indirect impacts are more complex. The study found that indirect impacts are significantly related to temperature, with evident seasonal differences within urban areas; the results are higher in autumn and winter than in summer. After urbanization, the total carbon loss in the region reached 0.985 TgC, with the highest contribution from the ND area. To further compensate for carbon sink losses, increasing the green space in development zones with significant indirect impacts will enhance the offsetting effect against direct impacts. The research results are of considerable importance in maintaining the carbon balance of urban ecosystems against the backdrop of accelerated urban development and climate change in the future.
Future urban development should avoid becoming too compact, adopting a more dispersed pattern to expand into surrounding areas and reserve space for urban greenery construction. The construction of urban green spaces should be prioritized in areas where the indirect effects of urbanization have a higher positive impact and between new and old urban land patches by creating more green spaces within the city to mitigate the pollution caused by rapid urbanization.

Author Contributions

Conceptualization, Y.C.; methodology, Y.C. and Z.W.; validation, D.L.; formal analysis, Y.C. and Z.W.; data curation, Y.C.; writing—original draft preparation, Y.C.; writing—review and editing, B.X. and R.R.; supervision, Z.W.; project administration, Z.F.; funding acquisition, Z.F. All authors have read and agreed to the published version of the manuscript.

Funding

Jiangxi Province University Humanities and Social Sciences Research Project: Study on the Path and Countermeasures for Enhancing Urban Garden Greening Carbon Sequestration Capacity under the Background of Carbon Neutrality—A Case Study of Nanchang City (JC22245). Jiangxi Province Double Thousand Talents Fund—Third Batch of Long-term Youth Projects FZK (29202000050). “Natural Science Foundation of Beijing Municipality” (Grant No.8232038) and the Foundation 55 on Beijing Forestry University (340/GK112301013).

Data Availability Statement

The data presented in this study are available on request from the corresponding authors.

Acknowledgments

Special thanks to the editors and reviewers for their helpful comments and suggestions.

Conflicts of Interest

The authors declare no conflicts of interest.

Abbreviations

CASACarnegie Ames Stanford Approach
CCCapital Core
DEMDigital Elevation Model
ECEcological Conservation
FEFunction Expansion
GEEGoogle Earth Engine
GFCGlobal Forest Change
LISALocal Indicators of Spatial Association
LULCLand Use and Land Cover
MODISModerate Resolution Imaging Spectroradiometer
NDNew Developing
NDVINormalized Difference Vegetation Index
NPPNet Primary Productivity
PEIProximity Expansion Index

Appendix A

Figure A1. New afforestation areas and deforestation areas in the study area from 2000 to 2010. Note: The gray lines represent the administrative boundaries of Beijing Municipality, while the black lines delineate the municipal boundaries of Beijing City.
Remotesensing 16 00444 g0a1
Figure A2. New afforestation areas and deforestation areas in the study area from 2010 to 2020. Note: The gray lines represent the administrative boundaries of Beijing Municipality, while the black lines delineate the municipal boundaries of Beijing City.
Remotesensing 16 00444 g0a2
Figure A3. New afforestation areas and deforestation areas in the study area from 2000 to 2020. Note: The gray lines represent the administrative boundaries of Beijing Municipality, while the black lines delineate the municipal boundaries of Beijing City.
Remotesensing 16 00444 g0a3

References

  1. Zhang, L.; Yang, L.; Zohner, C.M.; Crowther, T.W.; Li, M.; Shen, F.; Guo, M.; Qin, J.; Yao, L.; Zhou, C. Direct and Indirect Impacts of Urbanizationon Vegetation Growth across the World’s Cities. Sci. Adv. 2022, 8, eabo0095. [Google Scholar] [CrossRef]
  2. Du, J.; Fu, Q.; Fang, S.; Wu, J.; He, P.; Quan, Z. Effects of Rapid Urbanization on Vegetation Cover in the Metropolises of China over the Last Four Decades. Ecol. Indic. 2019, 107, 105458. [Google Scholar] [CrossRef]
  3. He, Q.; Zeng, C.; Xie, P.; Tan, S.; Wu, J. Comparison of Urban Growth Patterns and Changes between Three Urban Agglomerations in China and Three Metropolises in the USA from 1995 to 2015. Sustain. Cities Soc. 2019, 50, 101649. [Google Scholar] [CrossRef]
  4. Tian, Y.; Tsendbazar, N.E.; van Leeuwen, E.; Fensholt, R.; Herold, M. A Global Analysis of Multifaceted Urbanization Patterns Using Earth Observation Data from 1975 to 2015. Landsc. Urban Plan. 2022, 219, 104316. [Google Scholar] [CrossRef]
  5. Chen, W.; Zeng, J.; Li, N. Change in Land-Use Structure Due to Urbanisation in China. J. Clean. Prod. 2021, 321, 128986. [Google Scholar] [CrossRef]
  6. Arsanjani, J.J.; Helbich, M.; Kainz, W.; Boloorani, A.D. Integration of Logistic Regression, Markov Chain and Cellular Automata Models to Simulate Urban Expansion. Int. J. Appl. Earth Obs. Geoinf. 2013, 21, 265–275. [Google Scholar] [CrossRef]
  7. Luo, Q.; Zhou, J.; Li, Z.; Yu, B. Spatial Differences of Ecosystem Services and Their Driving Factors: A Comparation Analysis among Three Urban Agglomerations in China’s Yangtze River Economic Belt. Sci. Total Environ. 2020, 725, 138452. [Google Scholar] [CrossRef] [PubMed]
  8. Deng, S. Exploring the Relationship between New-Type Urbanization and Sustainable Urban Land Use: Evidence from Prefecture-Level Cities in China. Sustain. Comput. Inform. Syst. 2021, 30, 100446. [Google Scholar] [CrossRef]
  9. Liu, Y.; Li, Q.; Yang, L.; Mu, K.; Zhang, M.; Liu, J. Urban Heat Island Effects of Various Urban Morphologies under Regional Climate Conditions. Sci. Total Environ. 2020, 743, 140589. [Google Scholar] [CrossRef]
  10. Qiu, S.; Xu, C.; Wang, F.; Yu, Q. Potential Grading Refrigeration System? Based on Urban Agglomeration Thermal Environment Analysis Perspective. Sustain. Cities Soc. 2023, 97, 104736. [Google Scholar] [CrossRef]
  11. Hutyra, L.R.; Duren, R.; Gurney, K.R.; Grimm, N.; Kort, E.A.; Larson, E.; Shrestha, G. Urbanization and the Carbon Cycle: Current Capabilities and Research Outlook from the Natural Sciences Perspective. Earth’s Futur. 2014, 2, 473–495. [Google Scholar] [CrossRef]
  12. Cuo, L.; Zhang, Y.; Ri, X.; Zhou, B. Decadal Change and Inter-Annual Variability of Net Primary Productivity on the Tibetan Plateau. Clim. Dyn. 2021, 56, 1837–1857. [Google Scholar] [CrossRef]
  13. Liu, Y.; Yang, Y.; Wang, Q.; Du, X.; Li, J.; Gang, C.; Zhou, W.; Wang, Z. Evaluating the Responses of Net Primary Productivity and Carbon Use Efficiency of Global Grassland to Climate Variability along an Aridity Gradient. Sci. Total Environ. 2019, 652, 671–682. [Google Scholar] [CrossRef] [PubMed]
  14. Piao, S.; Fang, J.; Zhou, L.; Zhu, B.; Tan, K.; Tao, S. Changes in Vegetation Net Primary Productivity from 1982 to 1999 in China. Glob. Biogeochem. Cycles 2005, 19. [Google Scholar] [CrossRef]
  15. Peng, J.; Shen, H.; Wu, W.; Liu, Y.; Wang, Y. Net Primary Productivity (NPP) Dynamics and Associated Urbanization Driving Forces in Metropolitan Areas: A Case Study in Beijing City, China. Landsc. Ecol. 2016, 31, 1077–1092. [Google Scholar] [CrossRef]
  16. Sun, J.; Yue, Y.; Niu, H. Evaluation of NPP Using Three Models Compared with MODIS-NPP Data over China. PLoS ONE 2021, 16, e0252149. [Google Scholar] [CrossRef] [PubMed]
  17. Hadian, F.; Jafari, R.; Bashari, H.; Tartesh, M.; Clarke, K.D. Estimation of Spatial and Temporal Changes in Net Primary Production Based on Carnegie Ames Stanford Approach (CASA) Model in Semi-Arid Rangelands of Semirom County, Iran. J. Arid Land 2019, 11, 477–494. [Google Scholar] [CrossRef]
  18. Zhao, S.; Liu, S.; Zhou, D. Prevalent Vegetation Growth Enhancement in Urban Environment. Proc. Natl. Acad. Sci. USA 2016, 113, 6313–6318. [Google Scholar] [CrossRef]
  19. Zhuang, Q.; Shao, Z.; Li, D.; Huang, X.; Altan, O.; Wu, S.; Li, Y. Isolating the Direct and Indirect Impacts of Urbanization on Vegetation Carbon Sequestration Capacity in a Large Oasis City: Evidence from Urumqi, China. Geo-Spat. Inf. Sci. 2022, 26, 379–391. [Google Scholar] [CrossRef]
  20. Mu, W.; Zhu, X.; Ma, W.; Han, Y.; Huang, H.; Huang, X. Impact Assessment of Urbanization on Vegetation Net Primary Productivity: A Case Study of the Core Development Area in Central Plains Urban Agglomeration, China. Environ. Res. 2023, 229, 115995. [Google Scholar] [CrossRef]
  21. Wen, Y.; Liu, X.; Bai, Y.; Sun, Y.; Yang, J.; Lin, K.; Pei, F.; Yan, Y. Determining the Impacts of Climate Change and Urban Expansion on Terrestrial Net Primary Production in China. J. Environ. Manag. 2019, 240, 75–83. [Google Scholar] [CrossRef] [PubMed]
  22. Zhuang, Q.; Shao, Z.; Li, D.; Huang, X.; Li, Y.; Altan, O.; Wu, S. Impact of Global Urban Expansion on the Terrestrial Vegetation Carbon Sequestration Capacity. Sci. Total Environ. 2023, 879, 163074. [Google Scholar] [CrossRef] [PubMed]
  23. Teng, M.; Zeng, L.; Hu, W.; Wang, P.; Yan, Z.; He, W.; Zhang, Y.; Huang, Z.; Xiao, W. The Impacts of Climate Changes and Human Activities on Net Primary Productivity Vary across an Ecotone Zone in Northwest China. Sci. Total Environ. 2020, 714, 136691. [Google Scholar] [CrossRef] [PubMed]
  24. Chen, S.; Jiang, H.; Chen, Y.; Cai, Z. Spatial-Temporal Patterns of Net Primary Production in Anji (China) between 1984 and 2014. Ecol. Indic. 2020, 110, 105954. [Google Scholar] [CrossRef]
  25. Chen, T.; Huang, Q.; Liu, M.; Li, M.; Qu, L.; Deng, S.; Chen, D. Decreasing Net Primary Productivity in Response to Urbanization in Liaoning Province, China. Sustainability 2017, 9, 162. [Google Scholar] [CrossRef]
  26. Liu, T.; Huang, D.; Tan, X.; Kong, F. Planning Consistency and Implementation in Urbanizing China: Comparing Urban and Land Use Plans in Suburban Beijing. Land Use Policy 2020, 94, 104498. [Google Scholar] [CrossRef]
  27. Yang, J.; Huang, X. The 30m Annual Land Cover Dataset and Its Dynamics in China from 1990 to 2019. Earth Syst. Sci. Data 2021, 13, 3907–3925. [Google Scholar] [CrossRef]
  28. Wang, Q.; Shi, P.; Lei, T.; Geng, G.; Liu, J.; Mo, X.; Li, X.; Zhou, H.; Wu, J. The Alleviating Trend of Drought in the Huang-Huai-Hai Plain of China Based on the Daily SPEI. Int. J. Climatol. 2015, 35, 3760–3769. [Google Scholar] [CrossRef]
  29. Shu, S.; Liu, C.; Shi, R.; Gao, W. Research on Spatial Interpolation of Meteorological Elements in Anhui Province Based on ANUSPLIN. In Proceedings of the Remote Sensing and Modeling of Ecosystems for Sustainability VIII, San Diego, CA, USA, 21–25 August 2011. [Google Scholar]
  30. Pan, H.H.; Wu, S.R.; Ji, Q.Q.; Du, Z.Q.; Zhang, H. Spatio-Temporal Pattern and Driving Forces of Ecosystem Services in Coalfields of Shanxi Province, China. Chin. J. Appl. Ecol. 2021, 32, 3923–3932. [Google Scholar] [CrossRef]
  31. Wen-Quan, Z.; Yao-Zhong, P.; Jin-Shui, Z. Estimation of Net Primary Productivity of Chinese Terrestrial Vegetation Based on Remote Sensing. Chin. J. Plant Ecol. 2007, 31, 413–424. [Google Scholar] [CrossRef]
  32. Zhu, W.; Pan, Y.; He, H.; Yu, D.; Hu, H. Simulation of Maximum Light Use Efficiency for Some Typical Vegetation Types in China. Chin. Sci. Bull. 2006, 51, 457–463. [Google Scholar] [CrossRef]
  33. Jiao, L.; Liu, J.; Xu, G.; Dong, T.; Gu, Y.; Zhang, B.; Liu, Y.; Liu, X. Proximity Expansion Index: An Improved Approach to Characterize Evolution Process of Urban Expansion. Comput. Environ. Urban Syst. 2018, 70, 102–112. [Google Scholar] [CrossRef]
  34. Guan, X.; Shen, H.; Li, X.; Gan, W.; Zhang, L. A Long-Term and Comprehensive Assessment of the Urbanization-Induced Impacts on Vegetation Net Primary Productivity. Sci. Total Environ. 2019, 669, 342–352. [Google Scholar] [CrossRef] [PubMed]
  35. Li, T.; Li, M.; Ren, F.; Tian, L. Estimation and Spatio-Temporal Change Analysis of NPP in Subtropical Forests: A Case Study of Shaoguan, Guangdong, China. Remote Sens. 2022, 14, 2541. [Google Scholar] [CrossRef]
  36. Liu, Y.; Zhou, R.; Wen, Z.; Khalifa, M.; Zheng, C.; Ren, H.; Zhang, Z.; Wang, Z. Assessing the Impacts of Drought on Net Primary Productivity of Global Land Biomes in Different Climate Zones. Ecol. Indic. 2021, 130, 108146. [Google Scholar] [CrossRef]
  37. Kumari, S.; Lal, P.; Kumar, A. Spatial Heterogeneity for Urban Built-up Footprint and Its Characterization Using Microwave Remote Sensing. Adv. Sp. Res. 2022, 70, 3822–3832. [Google Scholar] [CrossRef]
  38. Li, C.; Zou, Y.; He, J.; Zhang, W.; Gao, L.; Zhuang, D. Response of Vegetation Phenology to the Interaction of Temperature and Precipitation Changes in Qilian Mountains. Remote Sens. 2022, 14, 1248. [Google Scholar] [CrossRef]
  39. Anselin, L. From SpaceStat to CyberGIS: Twenty Years of Spatial Data Analysis Software. Int. Reg. Sci. Rev. 2012, 35, 131–157. [Google Scholar] [CrossRef]
  40. Zhou, B.; Rybski, D.; Kropp, J.P. The Role of City Size and Urban Form in the Surface Urban Heat Island. Sci. Rep. 2017, 7, 4791. [Google Scholar] [CrossRef]
  41. Sarrat, C.; Lemonsu, A.; Masson, V.; Guedalia, D. Impact of Urban Heat Island on Regional Atmospheric Pollution. Atmos. Environ. 2006, 40, 1743–1758. [Google Scholar] [CrossRef]
  42. Liang, L.; Gong, P. Urban and Air Pollution: A Multi-City Study of Long-Term Effects of Urban Landscape Patterns on Air Quality Trends. Sci. Rep. 2020, 10, 18618. [Google Scholar] [CrossRef] [PubMed]
  43. Wang, Q.; Wang, H. Spatiotemporal Simulation of Land-Use/Land Cover Scenarios and Impacts on the Dynamics of Vegetation Net Primary Productivity in the Wuhan Metropolitan Area, Central China. Stoch. Environ. Res. Risk Assess. 2023, 37, 1137–1162. [Google Scholar] [CrossRef]
  44. Xue, Y.; Bai, X.; Zhao, C.; Tan, Q.; Li, Y.; Luo, G.; Wu, L.; Chen, F.; Li, C.; Ran, C.; et al. Spring Photosynthetic Phenology of Chinese Vegetation in Response to Climate Change and Its Impact on Net Primary Productivity. Agric. For. Meteorol. 2023, 342, 109734. [Google Scholar] [CrossRef]
  45. You, Y.; Wang, S.; Pan, N.; Ma, Y.; Liu, W. Growth Stage-Dependent Responses of Carbon Fixation Process of Alpine Grasslands to Climate Change over the Tibetan Plateau, China. Agric. For. Meteorol. 2020, 291, 108085. [Google Scholar] [CrossRef]
  46. Chen, Y.; Huang, B.; Zeng, H. How Does Urbanization Affect Vegetation Productivity in the Coastal Cities of Eastern China? Sci. Total Environ. 2022, 811, 152356. [Google Scholar] [CrossRef] [PubMed]
  47. Qu, S.; Wang, L.; Lin, A.; Yu, D.; Yuan, M.; Li, C. Distinguishing the Impacts of Climate Change and Anthropogenic Factors on Vegetation Dynamics in the Yangtze River Basin, China. Ecol. Indic. 2020, 108, 105724. [Google Scholar] [CrossRef]
  48. Huang, X.; Zhang, T.; Yi, G.; He, D.; Zhou, X.; Li, J.; Bie, X.; Miao, J. Dynamic Changes of Ndvi in the Growing Season of the Tibetan Plateau during the Past 17 Years and Its Response to Climate Change. Int. J. Environ. Res. Public Health 2019, 16, 3452. [Google Scholar] [CrossRef]
  49. Li, X.; Zhou, Y.; Asrar, G.R.; Meng, L. Characterizing Spatiotemporal Dynamics in Phenology of Urban Ecosystems Based on Landsat Data. Sci. Total Environ. 2017, 605–606, 721–734. [Google Scholar] [CrossRef]
  50. Zhou, Q.; Zhao, X.; Wu, D.; Tang, R.; Du, X.; Wang, H.; Zhao, J.; Xu, P.; Peng, Y. Impact of Urbanization and Climate on Vegetation Coverage in the Beijing-Tianjin-Hebei Region of China. Remote Sens. 2019, 11, 2452. [Google Scholar] [CrossRef]
  51. Piao, S.; Wang, X.; Park, T.; Chen, C.; Lian, X.; He, Y.; Bjerke, J.W.; Chen, A.; Ciais, P.; Tømmervik, H.; et al. Characteristics, Drivers and Feedbacks of Global Greening. Nat. Rev. Earth Environ. 2020, 1, 14–27. [Google Scholar] [CrossRef]
  52. Keenan, T.F.; Riley, W.J. Greening of the Land Surface in the World’s Cold Regions Consistent with Recent Warming. Nat. Clim. Chang. 2018, 8, 825–828. [Google Scholar] [CrossRef] [PubMed]
  53. Shashua-Bar, L.; Pearlmutter, D.; Erell, E. The Cooling Efficiency of Urban Landscape Strategies in a Hot Dry Climate. Landsc. Urban Plan. 2009, 92, 179–186. [Google Scholar] [CrossRef]
  54. Zhu, Z.; Piao, S.; Myneni, R.B.; Huang, M.; Zeng, Z.; Canadell, J.G.; Ciais, P.; Sitch, S.; Friedlingstein, P.; Arneth, A.; et al. Greening of the Earth and Its Drivers. Nat. Clim. Chang. 2016, 6, 791–795. [Google Scholar] [CrossRef]
  55. Li, D.K.; Fan, J.Z.; Wang, J. Variation Characteristics of Vegetation Net Primary Productivity in Shaanxi Province Based on MO17A3. Chin. J. Ecol. 2011, 30, 2776–2782. [Google Scholar]
  56. Turner, D.P.; Ritts, W.D.; Cohen, W.B.; Gower, S.T.; Running, S.W.; Zhao, M.; Costa, M.H.; Kirschbaum, A.A.; Ham, J.M.; Saleska, S.R.; et al. Evaluation of MODIS NPP and GPP Products across Multiple Biomes. Remote Sens. Environ. 2006, 102, 282–292. [Google Scholar] [CrossRef]
  57. Pan, J.; Dong, L. Spatio-Temporal Variation in Vegetation Net Primary Productivity and Its Relationship with Climatic Factors in the Shule River Basin from 2001 to 2010. Hum. Ecol. Risk Assess. 2018, 24, 797–818. [Google Scholar] [CrossRef]
  58. Jia, W.; Zhao, S.; Liu, S. Vegetation Growth Enhancement in Urban Environments of the Conterminous United States. Glob. Chang. Biol. 2018, 24, 4084–4094. [Google Scholar] [CrossRef]
  59. Elmore, A.J.; Guinn, S.M.; Minsley, B.J.; Richardson, A.D. Landscape Controls on the Timing of Spring, Autumn, and Growing Season Length in Mid-Atlantic Forests. Glob. Chang. Biol. 2012, 18, 656–674. [Google Scholar] [CrossRef]
  60. Mimet, A.; Pellissier, V.; Quénol, H.; Aguejdad, R.; Dubreuil, V.; Rozé, F. Urbanisation Induces Early Flowering: Evidence from Platanus Acerifolia and Prunus Cerasus. Int. J. Biometeorol. 2009, 53, 287–298. [Google Scholar] [CrossRef]
  61. Zhou, D.; Zhao, S.; Zhang, L.; Liu, S. Remotely Sensed Assessment of Urbanization Effects on Vegetation Phenology in China’s 32 Major Cities. Remote Sens. Environ. 2016, 176, 272–281. [Google Scholar] [CrossRef]
  62. Jiang, C.; Wu, Z.F.; Cheng, J.; Yu, Q.; Rao, X.Q. Impacts of Urbanization on Net Primary Productivity in the Pearl River Delta, China. Int. J. Plant Prod. 2015, 9, 581–598. [Google Scholar]
  63. Wilson, E.H.; Hurd, J.D.; Civco, D.L.; Prisloe, M.P.; Arnold, C. Development of a Geospatial Model to Quantify, Describe and Map Urban Growth. Remote Sens. Environ. 2003, 86, 275–285. [Google Scholar] [CrossRef]
  64. van Vliet, J. Direct and Indirect Loss of Natural Area from Urban Expansion. Nat. Sustain. 2019, 2, 755–763. [Google Scholar] [CrossRef]
  65. Zhong, J.; Liu, J.; Jiao, L.; Lian, X.; Xu, Z.; Zhou, Z. Assessing the Comprehensive Impacts of Different Urbanization Process on Vegetation Net Primary Productivity in Wuhan, China, from 1990 to 2020. Sustain. Cities Soc. 2021, 75, 103295. [Google Scholar] [CrossRef]
  66. Fang, J.Y.; Guo, Z.; Piao, S.L.; Chen, A.P. Terrestrial Vegetation Carbon Sinks in China, 1981–2000. Sci. China Ser. D Earth Sci. 2007, 50, 1341–1350. [Google Scholar] [CrossRef]
  67. Piao, S.; Fang, J.; Ciais, P.; Peylin, P.; Huang, Y.; Sitch, S.; Wang, T. The Carbon Balance of Terrestrial Ecosystems in China. Nature 2009, 458, 1009–1013. [Google Scholar] [CrossRef]
  68. Zhao, A.; Xiang, K.; Zhang, A.; Zhang, X. Spatial-Temporal Evolution of Meteorological and Groundwater Droughts and Their Relationship in the North China Plain. J. Hydrol. 2022, 610, 127903. [Google Scholar] [CrossRef]
  69. Jiansheng, L. Building a National Cultural Center in the Context of the New Beijing Urban Master Plan. In Analysis of the Development of Beijing (2018); Palgrave Macmillan: Singapore, 2019. [Google Scholar]
Figure 1. (a) Location of the study area; (b) Locations of the four functional areas in Beijing; (c) Overview and elevation of the study area.
Remotesensing 16 00444 g001
Figure 2. (a) Annual changes of main land use types in the study area, including cropland, impervious surfaces, forests, grasslands, shrubs, and barren. Where a indicates the trend in land-use type. (b) Forest/Non-Forest maps of the study area for each decade from 2000 to 2020.
Remotesensing 16 00444 g002
Figure 3. (a) Spatial distribution of different land use change types in Beijing from 2000 to 2020; (b) matrix diagram of land use transfer area proportions in the four areas.
Remotesensing 16 00444 g003
Figure 4. Inter-annual changes of NPP in Beijing, the left y-axis represents the percentage of the study area’s total area covered by regions with different NPP values.
Remotesensing 16 00444 g004
Figure 5. Spatial distribution of NPP changes in Beijing during the past 20 years of urbanization.
Remotesensing 16 00444 g005
Figure 6. Inter-annual Changes of the NPP in the Capital Core (CC) area, the Function Expansion (FE) area, the New Developing (ND) area, and the Ecological Conservation (EC) area. Note: The solid line in the figure represents the annual NPP change trend line, where a represents the slope of NPP change.
Remotesensing 16 00444 g006
Figure 7. Annual variations of direct and indirect impacts, where a denotes the variation trends of direct impact. Note: The solid line in the figure represents the direct impact change trend line, where a represents the direct impact change slope.
Remotesensing 16 00444 g007
Figure 8. Indirect and direct impacts in different areas. ECDI represents the direct impact of urbanization in the EC area; ECII stands for the indirect impact of urbanization in the EC area, and the other three areas are described in the same manner afterward.
Remotesensing 16 00444 g008
Figure 9. (a) Correlation coefficient diagram between temperature and indirect impacts; (b) Correlation coefficient diagram between precipitation and indirect impacts.
Remotesensing 16 00444 g009
Figure 10. (a) Intra-year changes in the indirect impact of urbanization, where the dotted line represents the trend of indirect impacts in the CC region; (b) Intra-year changes in meteorological factors. (c) Monthly NDVI display of the study area in 2015.
Remotesensing 16 00444 g010
Figure 11. Accuracy verification plot of random sample points of net primary productivity.
Remotesensing 16 00444 g011
Figure 12. The Global Moran’s I of direct and indirect impacts. Note: DI represents the direct impact of urbanization, and II represents the indirect impact of urbanization.
Remotesensing 16 00444 g012
Figure 13. Significance analysis of direct impacts and indirect impacts (ah) and LISA clustering maps (ip), where DI represents the direct impact of urbanization, and II represents the indirect impact of urbanization; NS represents non-significant; H-H represents high-high cluster; L-L represents low-low cluster; L-H represents low-high cluster; H-L represents high-low cluster.
Remotesensing 16 00444 g013
Table 1. Statistics of patches under different urban expansion modes.
Expansion TypePEI Value Range2000–20052005–20102010–20152015–2020
NumberProportionNumberProportionNumberProportionNumberProportion
Infilling(2/3,1]104423.79270.6350.1320.12
Edge-expansion(1/2,2/3]315771.93314373.62270170.43107465.89
Leap(0,1/2]1884.28109925.74112929.4455433.99
Table 2. Annual average growth rate of NPP and NPPII in different areas.
Unit: gC·m−2·year−1PeriodNDFECCECBJ
NPP2000–20204.346.236.655.575.16
NPPII2000–20200.410.290.480.090.22
Note: ND represents the New Development area; FE stands for the Function Expansion area; CC represents the Capital Core area; EC represents the Ecological Conservation Zone; BJ represents the entire Beijing city; NPPII is the value of NPP that changes due to the indirect impact of urbanization.
Table 3. Changes in carbon budget and NPPLV after urbanization in different areas.
PeriodNDFECCECBJ
NPPD
(TgC)
2000–2005−0.196−0.077−8.929 × 10⁻⁵−0.045−0.319
2005–2010−0.191−0.050−1.727 × 10⁻⁵−0.043−0.284
2010–2015−0.191−0.0351.439 × 10−5−0.049−0.275
2015–2020−0.073−0.016−1.067 × 10⁻⁴−0.018−0.107
2000–2020−0.651−0.179−1.988 × 10⁻⁴−0.156−0.985
NPPLV
(gC·m−2)
2000657.03800.87262.37612.69642.51
20201160.211380.96444.91827.231002.17
Note: NPPD represents the total NPP lost in the area due to urbanization; NPPLV represents the actual NPP when the area is fully covered with vegetation.
Disclaimer/Publisher’s Note: The statements, opinions and data contained in all publications are solely those of the individual author(s) and contributor(s) and not of MDPI and/or the editor(s). MDPI and/or the editor(s) disclaim responsibility for any injury to people or property resulting from any ideas, methods, instructions or products referred to in the content.

