Article

Monitoring Spatial-Temporal Variability of Vegetation Coverage and Its Influencing Factors in the Yellow River Source Region from 2000 to 2020

1
Key Laboratory of Ecohydrology of Inland River Basin, Northwest Institute of Eco-Environment and Resources, Chinese Academy of Sciences, Lanzhou 730000, China
2
University of Chinese Academy of Sciences, Beijing 100049, China
3
Faculty of Resources and Environment, Baotou Teachers’ College, Inner Mongolia University of Science and Technology, Baotou 014030, China
*
Author to whom correspondence should be addressed.
Remote Sens. 2024, 16(24), 4772; https://doi.org/10.3390/rs16244772
Submission received: 30 October 2024 / Revised: 18 December 2024 / Accepted: 19 December 2024 / Published: 21 December 2024

Abstract

:
As a vital conservation area for water sources in the Yellow River Basin, understanding the spatial-temporal dynamics of vegetation coverage is crucial, along with the factors that affect it, to ensure ecological preservation and sustainable development of the Yellow River Source Region (YRSR). In this paper, we utilized Landsat surface reflectance data from 2000 to 2020 using de-clouding and masking methods implementing the Google Earth Engine (GEE) cloud platform. We investigated spatial-temporal changes in vegetation coverage by combining the maximum value composite (MVC), the dimidiate pixel model (DPM), the Theil–Sen median slope, and the Mann–Kendall test. The influencing factors on vegetation coverage were quantitatively analyzed using a geographic detector, and future tendencies in vegetation coverage were predicted utilizing the Future Land Use Simulation (FLUS) model. The outcomes suggested the following: (1) On the temporal scale, vegetation coverage exhibited a general upward trend between 2000 and 2020, with the YRSR showing a yearly growth rate of 0.23% (p < 0.001). In comparison to 2000, the area designated as having extremely high vegetation coverage increased by 19.3% in 2020. (2) Spatially, the central and southeast regions have higher values of vegetation coverage, whereas the northwest has lower values. In the study area, 75.5% of the region demonstrated a significant improvement trend, primarily in Xinghai County, Zeku County, and Dari County in the south and the northern portion of the YRSR; conversely, a notable tendency of degradation was identified in 11.8% of the area, mostly in the southeastern areas of Qumalai County, Chenduo County, Shiqu County, and scattered areas in the southeastern region. (3) With an explanatory power of exceeding 45%, the three influencing factors that had the biggest effects on vegetation coverage were mean annual temperature, elevation, and mean annual precipitation. Mean annual precipitation has been shown to have a major impact on vegetation covering; the interconnections involving these factors have increased the explanatory power of vegetation coverage’s regional distribution. (4) Predictions for 2030 show that the vegetation coverage is trending upward in the YRSR, with a notable recovery trend in the northwestern region. This study supplies a theoretical foundation to formulate strategies to promote sustainable development and ecological environmental preservation in the YRSR.

1. Introduction

Vegetation is a fundamental part of the terrestrial environment. A comprehensive connection between soil, water, atmosphere, and biota is crucial for modulating climate, conserving water, and sustaining ecological balance [1,2,3]. Fractional vegetation coverage (FVC) is frequently used to describe the evolution of regional ecosystems as a metric for measuring the growth of regional surface vegetation [4,5,6]. With the current state of accelerated global warming [7], there are notable changes in the growth of plants. To comprehend the existing condition of the local environment and forecast future trends, it is essential to assess the long-term spatial-temporal changes of vegetation in delicate ecosystems, such as dry and semi-arid regions. This research is especially valuable in predicting the ecological stability in these regions.
In recent years, with the rapid advancement of remote sensing technology, researchers have increasingly focused on the spatial and temporal dynamics of vegetation [8]. At the global scale, a greening trend in vegetation has been observed in regions such as western Australia [9], India [10], and East Africa [11], with distinct peaks occurring between June and September. At the regional scale, studies on vegetation coverage in areas such as the Qinba Mountains [12], the Shiyang River Basin [13], the Heihe River Basin [14], the Tibetan Plateau [15], the Loess Plateau [16], and the Yellow River Basin [17] have shown a generally fluctuating upward trend in vegetation coverage [18]. Overall, although these findings have significantly enriched our understanding of vegetation coverage, research on the characteristics of vegetation dynamics under ecological engineering implementation remains somewhat limited.
Furthermore, scholars have conducted extensive research on the dynamics of vegetation change and the influencing factors [19,20]. Liu et al. [21] used partial correlation analysis to reveal a positive correlation between vegetation changes and both temperature and precipitation. Wang et al. [22] quantitatively analyzed the relationship between vegetation and extreme climate events in the arid regions of northwest China, finding a time-lag effect between the two during the growing season. Fu et al. [23] used regression analysis to demonstrate that, with increasing altitude, vegetation coverage in the temperate arid and semi-arid regions shows a fluctuating upward trend. Feng et al. [24] combined multisource data to analyze the response of vegetation in different state types to geological features such as lithology, landforms, soil, and topographic indices. The above studies primarily focus on the impact of natural factors on vegetation. However, anthropogenic factors also play a significant role in driving fluctuations in vegetation growth [25]. Xu et al. [26] used residual analysis to identify the primary factors influencing vegetation in the southwestern region. The results indicate that human activities are the primary driver of vegetation change in the region. Furthermore, land use change also plays a significant role in the long-term vegetation changes in China [27]. Therefore, vegetation dynamics are the result of the combined influence of both natural and anthropogenic factors. In the studies mentioned above, there is a common tendency to use traditional methods, such as linear regression and residual analysis, to reveal the relationships between vegetation changes and various influencing factors [28,29]. However, these methods may not adequately reveal the complex interactions and influence pathways within the system. Furthermore, the mechanisms driving specific influencing factors remain insufficiently explained, preventing a comprehensive understanding of how these factors individually or collectively affect vegetation coverage. Compared to these methods, the geographic detector model is an emerging spatial analysis model that can detect spatial differentiation. It has been widely applied to explore and quantify the nonlinear effects of influencing factors on vegetation coverage change [14]. It does not require strict adherence to the assumptions of traditional statistical methods and offers greater flexibility in parameter settings [30]. Moreover, it is not constrained by time-lag effects [31], overcoming the limitations inherent in traditional approaches.
Related research has used the Hurst exponent to analyze future patterns in vegetation covering and determine whether the features of future changes in vegetation coverage are similar to those seen in earlier eras [32]. In order to predict future patterns in vegetation coverage, the Future Land Use Simulation (FLUS) model was developed by Sun Yat-sen University’s Geographic Simulation Team [33]. There is a limitation of research utilizing the FLUS model for predicting vegetation changes, as it primarily focuses on simulating and forecasting land use changes. However, vegetation, being a crucial component of surface coverage, serves as a significant indicator of the land use change process. From this, the FLUS model can predict the evolutionary tendencies in vegetation’s spatial distribution patterns.
The Yellow River Source Region (YRSR) is a critical ecological region within the Yellow River Basin [34]. Since the 1970s, it has been confronting significant ecological and environmental challenges. These include grassland degradation [35], land desertification [36], and the degradation of perennial permafrost [37]. These issues have garnered widespread attention. To tackle these challenges, the government has put in place a number of programs aimed at restoring and protecting the environment, including the “Sanjiangyuan Ecological Protection and Construction Phase I Project” [38] from 2005 to 2012 and the “Phase II Project” [37] launched in 2014. These efforts have significantly enhanced vegetation coverage in the YRSR. Studies have found that previous research on vegetation change in the YRSR predominantly employed traditional statistical methods [39,40,41,42], which were unable to explore the synergistic effects between natural and anthropogenic factors. In the YRSR and the Yellow River Basin (YRB), the Hurst exponent is predominantly used for predicting future vegetation trends [17,43]. Additionally, these studies were mainly based on historical data and lacked consideration of the impact of environmental factors and human activities on future trends in vegetation change. In the context of ecological engineering, what are the spatial-temporal characteristics of vegetation coverage changes in the YRSR from 2000 to 2020? What key factors influence these changes? Given these factors, what are the expected trends in vegetation coverage moving forward in time? The preservation of the YRB’s ecological environment and the maintenance of ecological balance depend on answers to these questions [44,45].
To build on this, this study accesses the Google Earth Engine (GEE) cloud platform and employs the JavaScript API to access Landsat surface reflectance data from 2000 to 2020 in the YRSR. The data underwent processes for de-clouding and masking, after which methods such as maximum value composite (MVC), the dimidiate pixel model (DPM), the Theil–Sen median slope, and the Mann–Kendall test were applied. In addition, the center of gravity migration models were applied to assess the spatial-temporal changes in vegetation coverage. Simultaneously, mean annual temperature, mean annual precipitation, elevation, land use, vegetation type, and other data were utilized as foundational parameters. In order to quantitatively evaluate the factors impacting the spatial differentiation of vegetation coverage in the YRSR, geographic detectors were used. Finally, the future trend of vegetation coverage was predicted using the FLUS model. The goal was to give the YRSR a solid scientific basis for establishing a sustainable environment and promoting long-term growth.

2. Materials and Methods
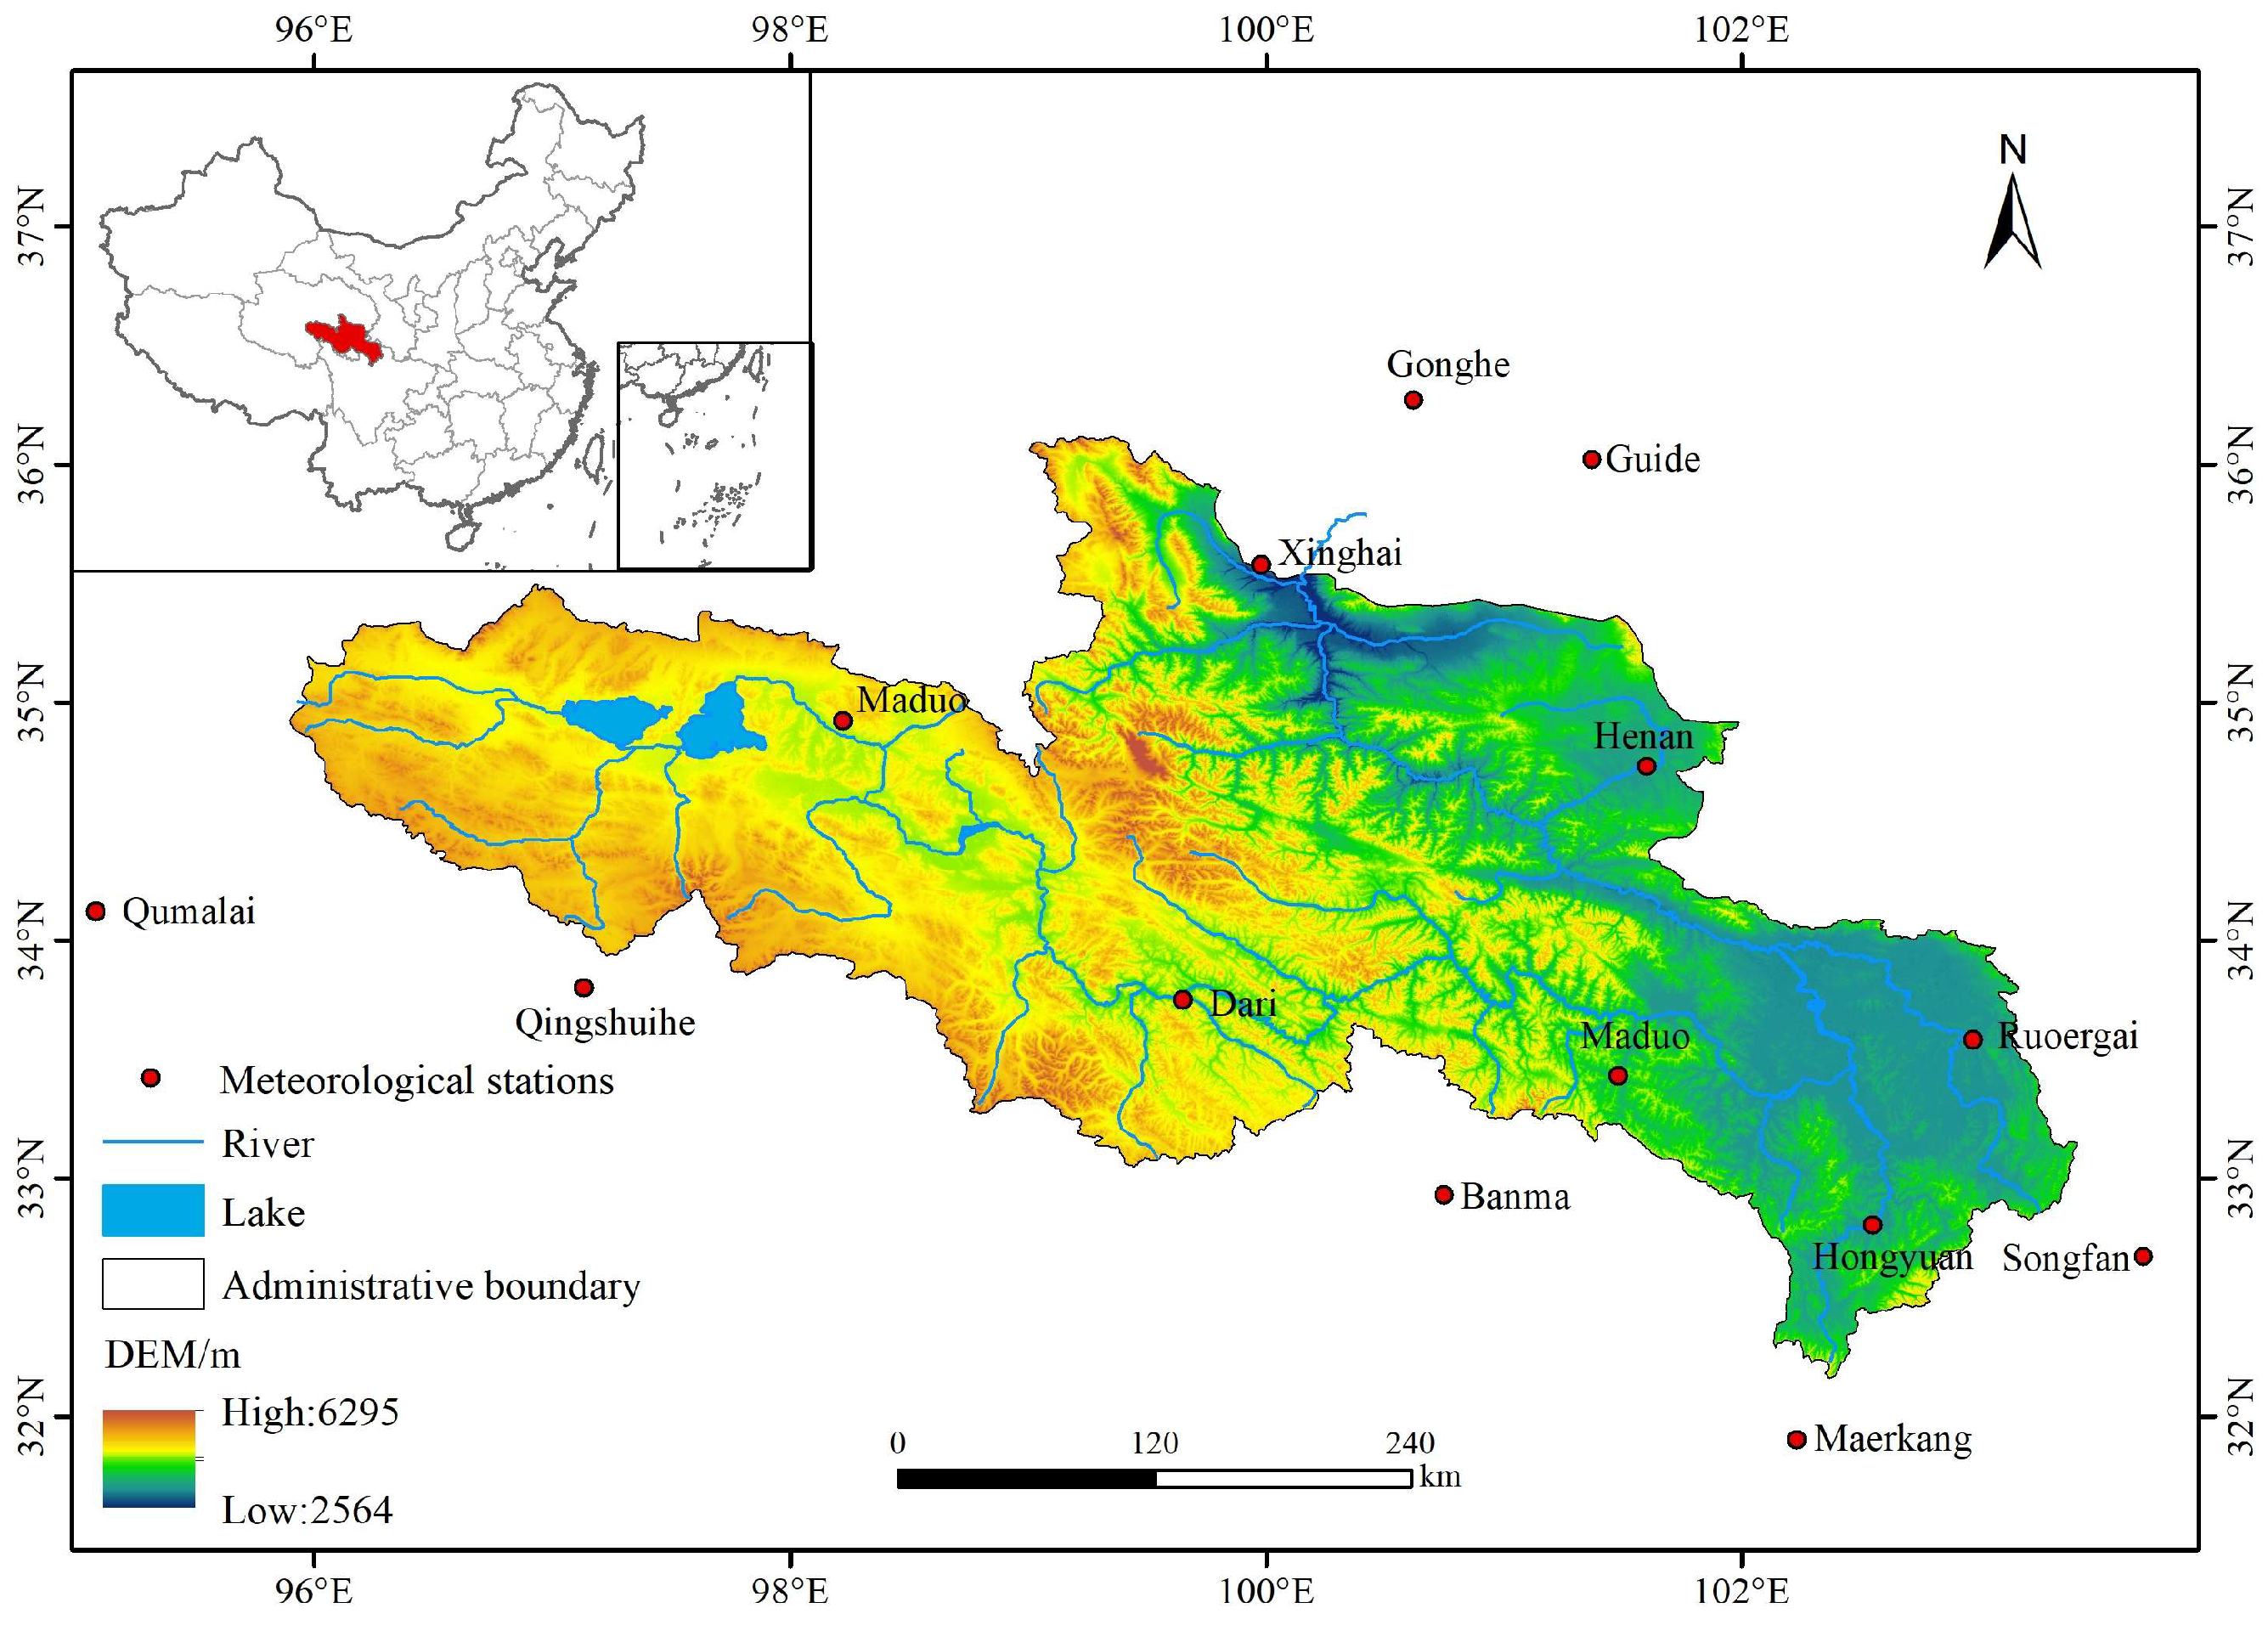
2.1. Study Area

The precise coordinates of the YRSR are 95°50′ and 103°30′E longitude and 32°02′ and 36°01′N latitude, consisting of an approximately 132,000 km2 watershed region (Figure 1). The YRSR is geographically defined by the northwestern Animaqing Mountains to the east, the Yahela Daheze Mountains to the west, the Burkhan Buda Mountains to the north, and the Bayan Kara Mountains to the south [46]. This region serves as both the watershed of the Yangtze River and the headwaters of the Yellow River, with an average elevation ranging from 4200 to 5266 m. The topography features a high northwest and low southeast gradient, exhibiting a complex and diverse landscape that includes mountains, basins, lakes, glaciers, grasslands, and swamps. While the Anyimaqing Mountains to the east, the Yahela Daheze Mountains to the west, the Burkhan Buda Mountains to the north, and the Bayan Kara Mountains to the south serve as a watershed boundary between the Yellow River and the Yangtze River, the YRSR is geographically delineated by these mountains. This area has an average elevation that ranges from 4200 to 5266 m above sea level. The landforms are complex and varied, with high mountains, basins, lakes, glaciers, grasslands, and swamps. Among these features, Zhaling Lake and Eling Lake are the two prominent alpine freshwater lakes located in the western region. In the southeast, the area is characterized by the Ruoergai Plateau swamps, alongside grassland swamps found in the adjacent Hongyuan and Aba counties. This region represents one of the largest distributions of peat swamps in China [47]. The temperature and precipitation within the basin are influenced by both latitude and altitude, with mean annual temperatures fluctuating between −4 and 2 °C and mean annual precipitation varying between 220 and 780 mm. There is a noticeable trend of gradual increases in both mean annual temperature and precipitation, generally progressing from the northwest to the southeast [48]. The vegetation types in the YRSR encompass alpine grasslands, alpine meadows, alpine swamps, and various other landscape forms [49].

2.2. Data Sources and Preprocessing

2.2.1. Remote Sensing Data

In this study, Landsat surface reflectance data are utilized to filter the Landsat TM/OLI dataset from 2000 to 2020, leveraging the GEE cloud platform. With a temporal resolution of 16 days and a spatial resolution of 30 m by 30 m, the dataset boasts superior accuracy. Initially, the image underwent de-cloud masking using the QA band. Subsequently, the remote sensing image was automatically cropped using the vector boundaries of the YRSR. Finally, to mitigate the effects of atmospheric interference and cloud cover, the MVC method was applied to derive annual NDVI data, from which the FVC of the study area was calculated using the DPM.

2.2.2. Influencing Factors Data

The variation in FVC is influenced by both natural and anthropogenic factors [50]. Climate factors (such as temperature, precipitation, solar radiation, and soil moisture) and elevation directly influence plant growth conditions. Snow cover affects plant growth cycles and biomass, while vegetation types determine the spatial distribution of vegetation cover. Meanwhile, human activities (such as land use, livestock density, and population density) promote or inhibit changes in FVC by directly altering environmental conditions [14,20,51]. Therefore, the comprehensive consideration of these influencing factors is crucial for fully understanding the driving mechanism of FVC dynamic change.
The National Earth System Science Data (http://www.geodata.cn/) provided the meteorological data used in this investigation. Vegetation type data were sourced from the Chinese Academy of Sciences’ Data Center for Resources and Environmental Sciences (https://www.resdc.cn/). Open Spatial Demographic Data and Research-WorldPop were the sources of population density data. Solar radiation data were sourced from the Earth Resource Data Cloud (http://gis5g.com/). Soil moisture data were obtained from the National Tibetan Plateau Data Center (https://data.tpdc.ac.cn/); 1 km is the spatial resolution shown above. The Chinese Academy of Sciences’ Geospatial Data Cloud (https://www.gscloud.cn/) provided the elevation data. Land use data were sourced from the Resource and Environmental Science Data Platform (https://www.resdc.cn/). The spatial resolution mentioned above is 30 m. Livestock capacity data were sourced from the National Tibetan Plateau Data Center (https://data.tpdc.ac.cn/), with a spatial resolution of 250 m. The vapor pressure deficit data were calculated based on ERA-5 reanalysis data (https://developers.google.com/), with a spatial resolution of 1 km. Snow cover data were obtained from the GEE cloud platform using the MOD10A1.061 Terra Snow Cover Daily Global dataset (https://earthengine.google.com/), with a spatial resolution of 500 m. In ArcGIS 10.8, a resampling approach was applied to the aforementioned data to ensure consistency in image element size. The eleven influencing factors were chosen to quantitatively analyze their impact on vegetation coverage in the YRSR (Table 1).
Elevation, population density, solar radiation, soil moisture, livestock capacity, vapor pressure deficit, snow cover, mean annual temperature, and precipitation were reclassified into 9 classes using the natural breaks. According to the Chinese Academy of Sciences Land Use classification system, there are 6 categories of land use type, while vegetation type was categorized into 9 classes following the classification system of the Resource and Environment Science Data Center of the Chinese Academy of Sciences (Figure 2).
A 1 km × 1 km pixel was generated within the study area, resulting in 12,984 central points as sampling locations. The data values of each impact factor at these sampling points were extracted. FVC was used as the dependent variable (Y), while the data of 11 influencing factors were used as independent variables (X) for analysis. This approach allowed for a quantitative examination of the relationship between vegetation coverage change and various influencing factors in the YRSR.

2.3. Data Analysis Method

2.3.1. Maximum Value Composite

Maximum value composite modeling (MVC) is an efficient method for the analysis of NDVI datasets that minimize atmospheric effects [52]. The formula is as follows:
N D V I n = max N D V I m
where NDVIn refers to the maximum composite NDVI value of the n-th year in the study area, representing the highest level of vegetation coverage; NDVIm refers to the NDVI value for each image of the n-th year; and m represents the total number of remote sensing images for the n-th year.

2.3.2. Dimidiate Pixel Modeling

Vegetation coverage is calculated using dimidiate pixel modeling (DPM), which assumes that the surface of a pixel is composed of both vegetated and non-vegetated parts. This model is currently the most widely used remote sensing model for estimating vegetation coverage [53]. DPM is characterized by its simplicity, reliability, and high inversion accuracy [52]. In this study, vegetation coverage in the YRSR was estimated using this model, taking advantage of the strongly correlated linear relationship between FVC and NDVI [54]. The calculation formula for FVC is as follows:
F V C = N D V I N D V I s o i l N D V I v e g N D V I s o i l
where the normalized difference NDVI and FVC are used jointly [41]. In this study, NDVIsoil and NDVIveg were established as the 5% and 95% cumulative frequency thresholds of NDVI, respectively, based on the existing literature [55].

2.3.3. Theil–Sen Median Slope and Mann–Kendall Test

This study employed a combination of Theil–Sen median slope and the Mann–Kendall test to analyze the trend and significance of FVC changes in the YRSR. The method is highly efficient, exhibits excellent robust to noise, and considers non-linearities [56,57]. The formula is as follows:
S F V C = m e d i a n F V C j F V C i j i
Z = S 1 s ( S ) ( S > 0 ) 0 ( S = 0 ) S + 1 s ( S ) ( S = 0 )
S = j = 1 n 1 i = j + 1 n sgn ( F V C j F V C i )
s ( S ) = n × ( n 1 ) × ( 2 n + 5 ) 18
where FVCi and FVCj represent the FVC values of a pixel in the i-th and j-th years, respectively, and n denotes the length of the time series. S denotes the standardized test statistic value, and sgn represents the sign function. For the test statistic Z, at a given significance level α, when the absolute value of Z exceeds U1−α/2, it indicates a significant change in the time series at the α level; conversely, there was no significant change in the time series at the α level.

2.3.4. The Center of Gravity Migration Model

The overall characteristics of regional vegetation cover changes can be effectively visualized through the analysis of the center of gravity. By examining the direction and distance of the center of gravity’s movement for each vegetation cover category we can gain insights into the spatial distribution patterns of vegetation change [58]. The direction and distance of this transfer can be quantified by calculating the changes in the center coordinates [59]:
X t = i = 1 n C t i × X t i / i = 1 n C t i
Y t = i = 1 n ( C t i × Y t i ) / i = 1 n C t i
where Xt and Yt denote the longitude and latitude coordinates of the barycenter of each vegetation cover class in year t, respectively; Cti represents the area of the i-th vegetation distribution patch for each class in year t; and Xti and Yti indicate the longitude and latitude coordinates of the geometric center of the distribution of the i-th vegetation patch in year t.

2.3.5. Geographic Detector

(1) Factor detector: The primary use of it is detecting the spatial heterogeneity as well as the degree of explanation of the spatial heterogeneity of vegetation coverage by distinct influencing factors. The magnitude of q-statistic can indicate the strength of the explanatory power of the different influencing factors on vegetation coverage, which can intuitively judge the dominant factor of vegetation coverage [30]:
q = 1 h = 1 L N h σ h 2 N σ 2 = 1 W s s T s s
W s s = h = 1 L N h σ h 2
T s s = N σ 2
Here, h denotes the stratification of the X (where h = 1, 2, 3…, L); Nh and N signify the number of cells in h and in the entire region; σ2 indicates the overall variance; and Tss stands for total regional variance, while Wss is the sum of intra-stratum variance.
(2) Interaction detector: The explanatory power of two influencing factors acting either mutually (enhancing or weakening) or independently of each other on the geographical distribution of FVC is determined by the interaction detector [60]. The assessment method involves calculating the sum of the q-statistics for the two influencing factors X1 and X2 on FVC, along with the q-statistic for X1∩X2 [61]. This allows for a comparison of the spatial differentiation of vegetation cover in the YRSR, based on whether the interaction between X1 and X2 is enhancing, weakening, or independent (Table 2). These interactions were primarily categorized into the following types.

2.3.6. The Future Land Use Simulation Model (FLUS Model)

The FLUS model, based on the traditional Cellular Automata (CA) framework, incorporates an adaptive inertia competition mechanism based on roulette selection and utilizes Artificial Neural Network (ANN) to obtain suitability probabilities. This approach effectively addresses the expansion relationships between different levels of vegetation coverage, enhancing simulation accuracy [62]. Additionally, the model offers advantages in terms of high computational efficiency and a large simulation scope.
(1) Probabilistic adaptive estimation: A variety of influencing factors and FVC data were used as the base data, including anthropogenic factors and natural factors. A homogeneous sampling mode was used, with the sampling parameter set to 20, meaning that the number of sampling points represented 20% of the total image elements in the study area. These influencing factors were standardized to a range of [0, 1].
(2) Cost matrix: This matrix shows the probability of conversion between vegetation cover levels. If there is an allowance for transformation across levels, the relevant matrix value is set to 1; if there is no allowance for transformation, the matrix value is set to 0.
(3) Neighborhood weight parameter: The neighborhood weight parameter represents the expansion capacity of each vegetation coverage level (extremely high coverage, high coverage, middle coverage, low coverage and extremely low coverage). The parameter varies between 0 and 1. The closer the neighborhood weight parameter is to 1, the stronger the expansion capacity between vegetation coverage levels; conversely, the closer the neighborhood weight parameter is to 0, the weaker the expansion capacity between vegetation coverage levels. In this study, the neighborhood weight is determined based on the dimensionless value of ΔTA:
W i = Δ T A i Δ T A min Δ T A max Δ T A min
where Wi represents the neighborhood weight of the i-th vegetation coverage level, and ΔTAi denotes the change in the expansion capacity of each vegetation coverage level. ΔTAmin is the minimum value of the changes in expansion capacity, and ΔTAmax is the maximum value of the changes in expansion capacity across all vegetation coverage levels. Since the transformation probability for each level cannot be 0 in reality, any value of 0 in the neighborhood weight is reset to 0.01 to align it more closely with practical conditions. Table 3 displays the outcomes of the domain weight setting.
(4) Verification of simulation accuracy: Using the FLUS model, the influencing factor data and FVC data were input to simulate the vegetation cover data for the YRSR in 2020. The Kappa coefficient [63] was employed to assess the spatial accuracy of the simulated vegetation cover by comparing it with the actual vegetation cover data from the YRSR for the same year. Finally, the 2020 FVC data, along with the data from influence factors, were utilized to predict the spatial change of vegetation cover in the YRSR for 2030 [64]. The formula for the Kappa coefficient is as follows:
K a p p a = P a P b 1 P b
where Pa represents the weight of the simulated correct raster and Pb denotes the weight of the preset simulated correct raster. A value of 1 signifies the weight of the simulated correct raster under ideal conditions. Kappa coefficients span from 0 to 1, with higher values signifying enhanced accuracy of the simulation.

3. Results

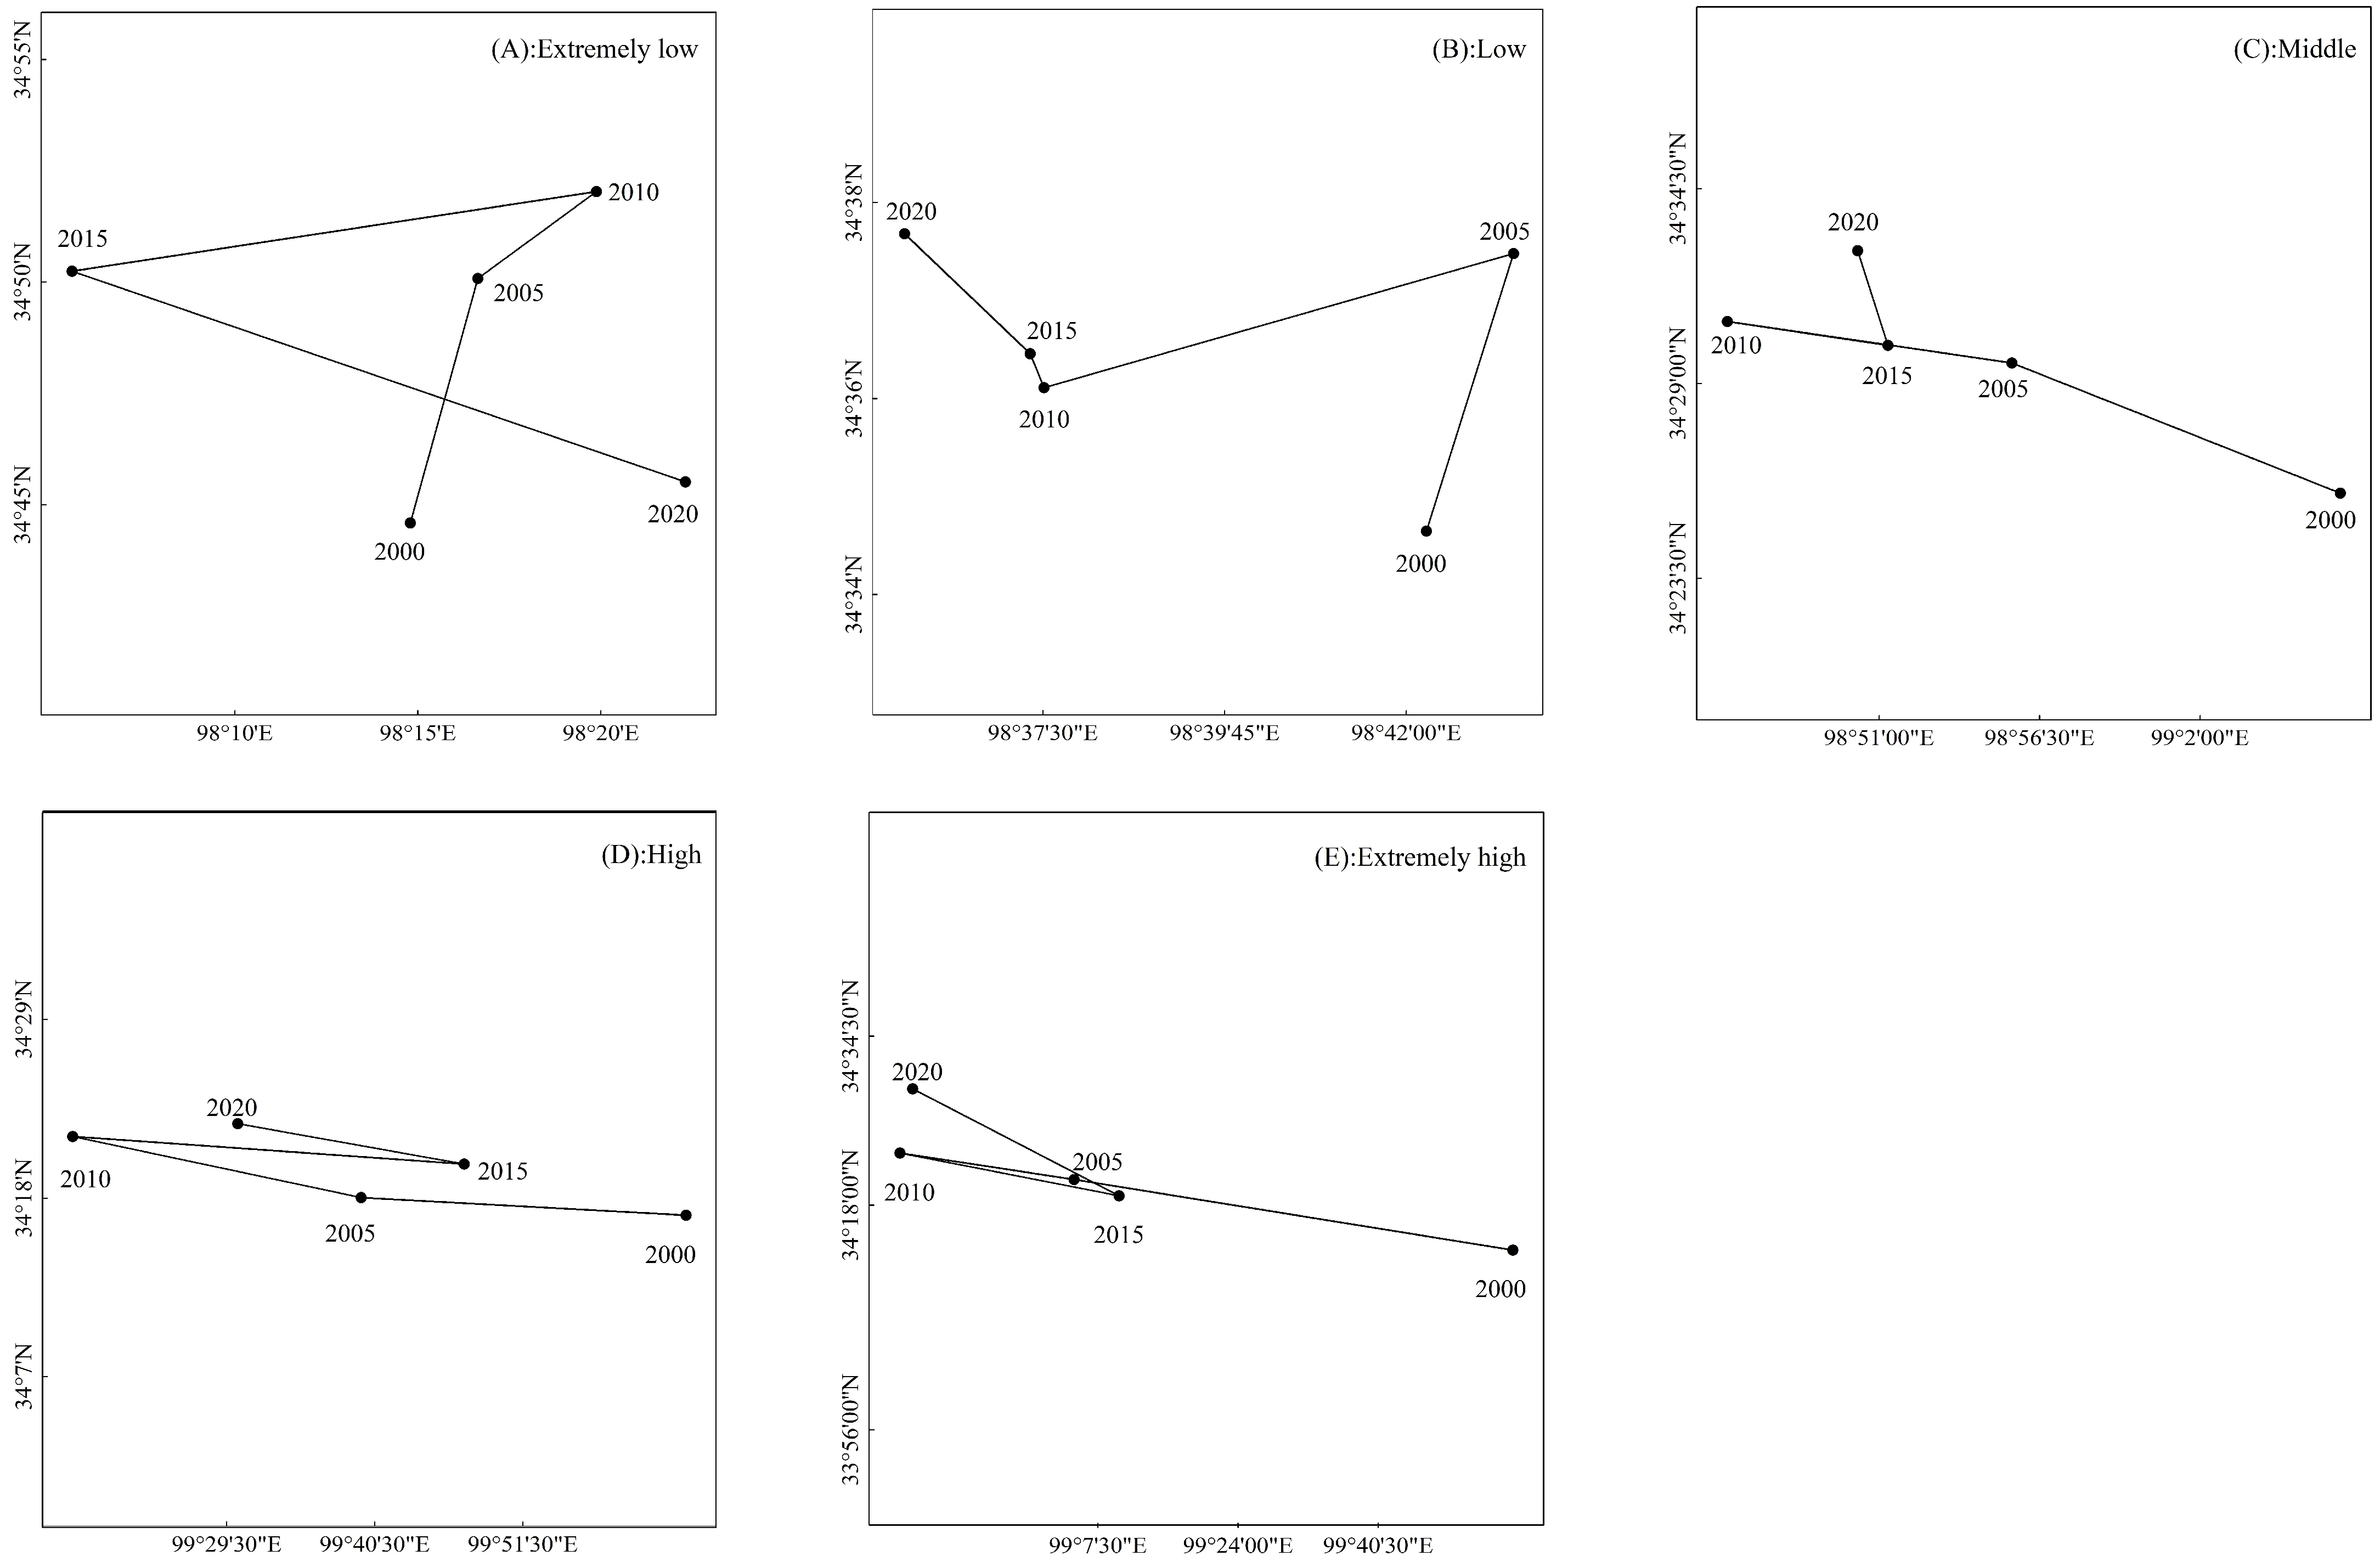
3.1. Characteristics of Spatial-Temporal Changes of FVC in the YRSR

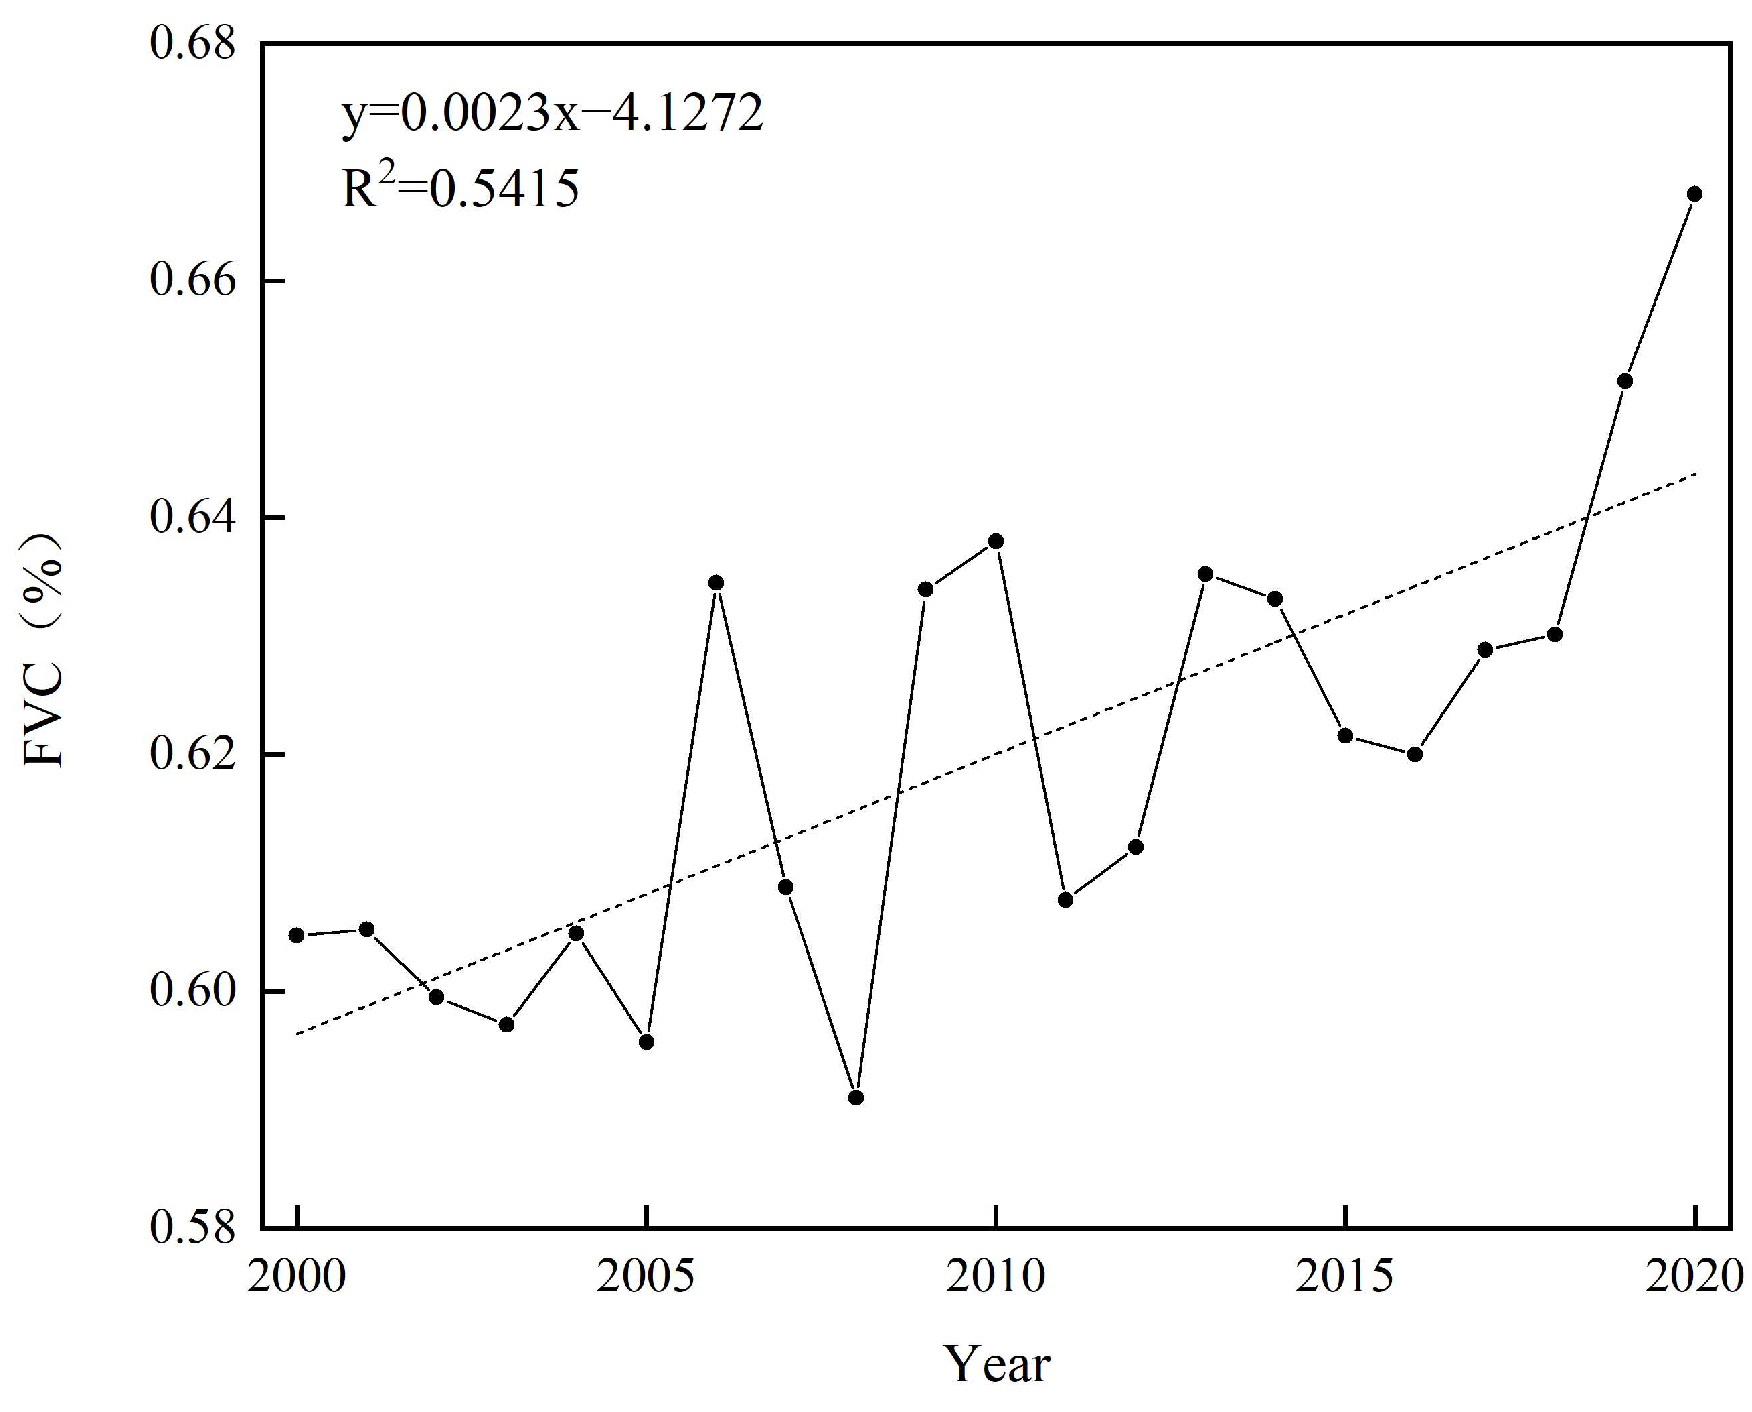
3.1.1. FVC Temporal Variation Characteristics

The mean FVC in the YRSR demonstrated a variable upward trend over the preceding 21 years (Figure 3), with a growth rate of 0.23% (p < 0.001) per year. From 2000 to 2020, the average FVC in the YRSR ranged from 0.591 to 0.667, with the lowest annual average FVC recorded in 2008 and the highest in 2020.
Figure 4 shows the area proportion of each vegetation coverage level for FVC from 2000 to 2020. The results indicate that the area of extremely high coverage in 2020 increased by 19.3% compared to 2000; the area of middle coverage remained stable, ranging from 11% to 13%; the areas of low and extremely low coverage decreased by 3.2% and 4.2%, respectively, in 2020 compared to 2000. Overall, there was an increase in the area of extremely high coverage in the YRSR, indicating an improvement in regional vegetation coverage.

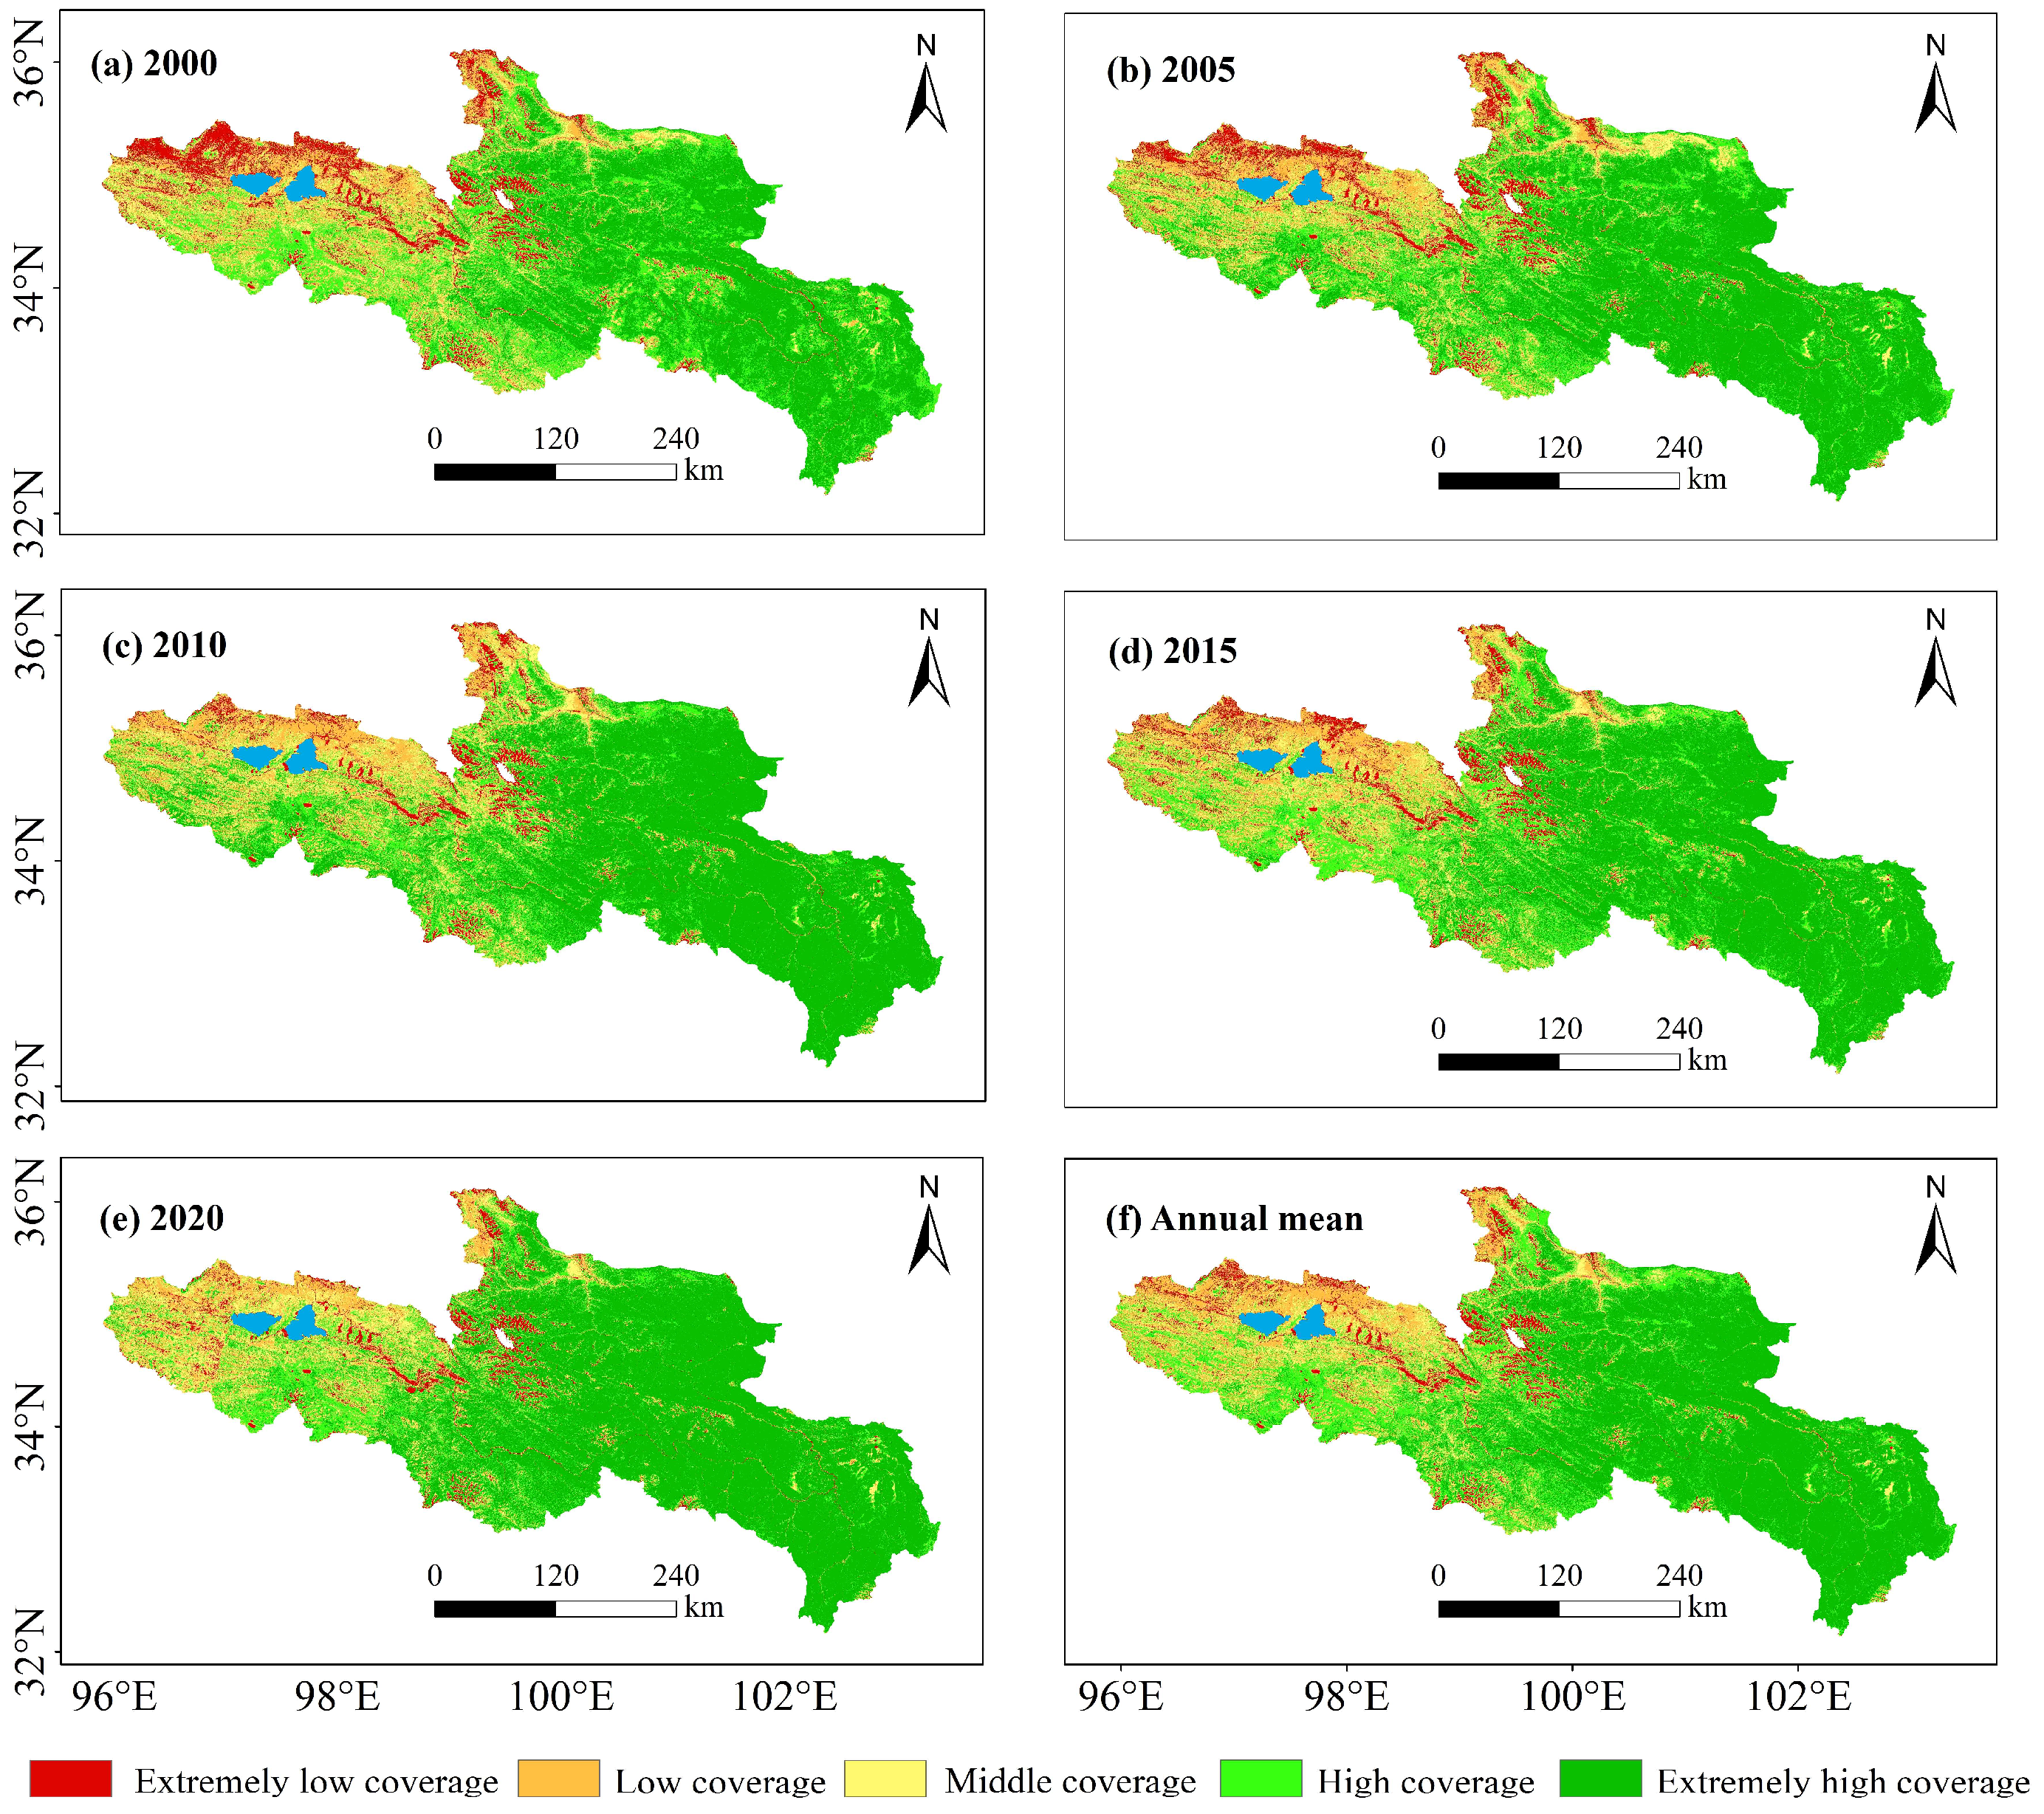
3.1.2. FVC Spatial Variation Characteristics

Overall, FVC is low in the northwest and high in the southeast of the YRSR (Figure 5). From 2000 to 2010, extremely low coverage decreased in the northwestern part of the YRSR and in northwestern Xinghai County, while extremely high coverage expanded in the southeast. Additionally, extremely low coverage increased in the northwestern part of Qumalai County, Zhaling Lake, the northern part of Eling Lake, and the western part of Chenduo County. From 2010 to 2015, a decline in the range of extremely high coverage was observed in Shiqu County and Dari County in the west. Furthermore, from 2015 to 2020, vegetation coverage gradually increased from the southeast to the northwest.
Figure 5f demonstrates that vegetation coverage in the YRSR has improved over the past 21 years, with a multi-year average value of FVC of 0.62. The northwestern part of the YRSR exhibits low coverage, particularly in the western and northern areas surrounding Zhaling Lake and Eling Lake. In contrast, Tongde County, Gande County, and Zeku County in the central part of the region demonstrate high coverage, while the western part of Maqin County and the southern part of Dari County show low coverage. The southeastern part of the region, including Maqu County, Ruoergai County, Aba County, and Hongyuan County, features the highest vegetation coverage. Overall, on a spatial scale, FVC is characterized by low values in the northwest and high values in the central and southeastern areas.
As illustrated in Figure 6, the area exhibiting a degradation trend in FVC within the YRSR from 2000 to 2020 encompasses 15,615.40 km2, accounting for 11.8% of the total area. The degraded regions are primarily situated in the western part of the YRSR, the western area of Eling Lake, the south-central region, and the northern part of the Ruoergai wetland. Vegetation coverage improved over an area of 99,670.15 km2, accounting for 75.5% of the total. Among these, 22,898.82 km2, accounting for 17.3%, experienced significant improvement, primarily concentrated in the northern part of the YRSR, Xinghai County, Zeku County, and the southern part of Dari County. The area of slight improvement was 76,772.33 km2, constituting 58.2%. The slight improvement areas exhibit a wide distribution range, predominantly located in Gande, Maqin, Hongyuan, and Maqu counties. Overall, the vegetation coverage tendency in the YRSR from 2000 to 2020 was predominantly defined by areas that experienced slight improvements. This signifies that vegetation coverage in the majority of the YRSR has demonstrated an upward trend during the past 21 years.
This gave a picture of where these types of vegetation coverage are located. The results indicated a migration trend from southeast to northwest for both low and extremely high vegetation coverage from 2000 to 2020. The straight-line migration distances were 18.71 km and 195.67 km, respectively (Figure 7B,E). The center of gravity of the extremely low coverage region migrated northeastward from 2000 to 2010, southwestward from 2010 to 2015, and southeastward from 2015 to 2020, covering a straight-line distance of 63.64 km (Figure 7A). Both middle and high vegetation coverage types exhibited migration from southeast to northwest from 2000 to 2010, then shifted southeast from 2010 to 2015, and northwest from 2015 to 2020. The straight-line migration distances were 47.36 km and 142.25 km, respectively (Figure 7C,D). The findings indicate that vegetation coverage in the southeast of the YRSR has been increasing, while some areas in the northwest have been decreasing.

3.2. Driving Mechanisms of Vegetation Coverage Change in the YRSR

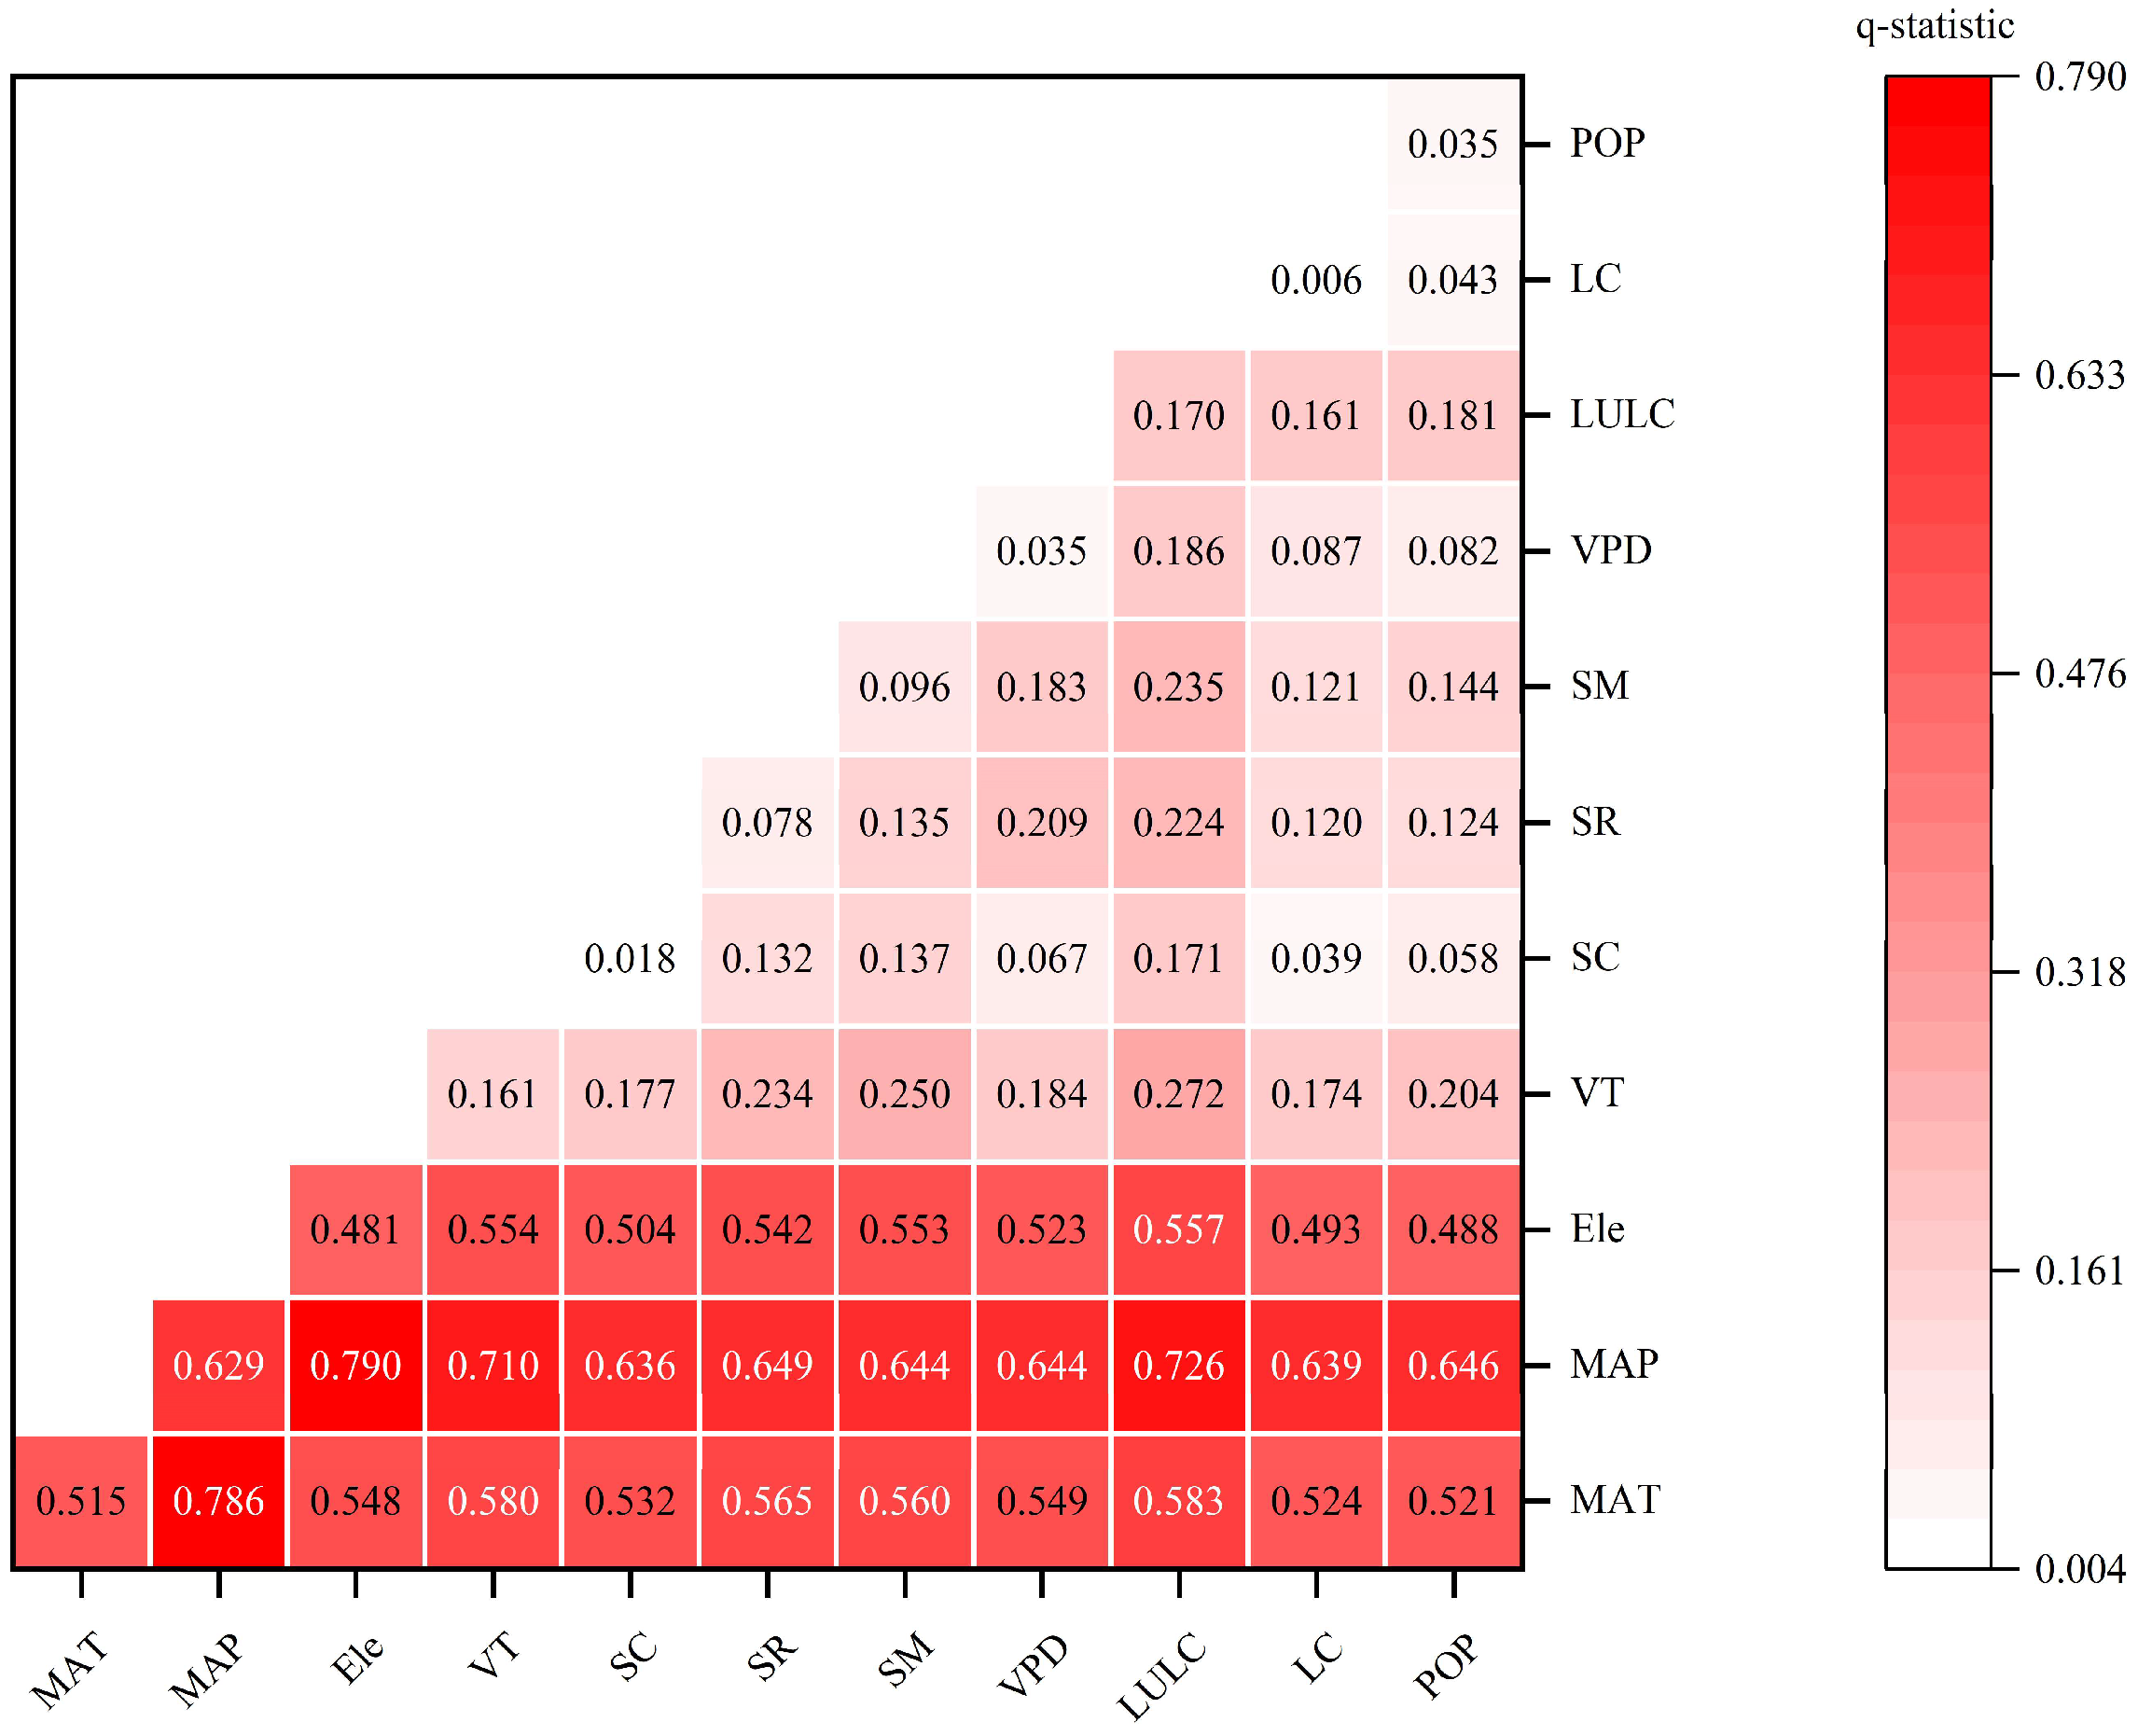
3.2.1. Influencing Factors Detection Analysis

As indicated in Table 4, the factor detector shows that the eleven factors that affect FVC in 2020 have a higher q-statistic explanatory power for climate factors than for anthropogenic factors. Among these, mean annual precipitation (0.629) and mean annual temperature (0.515) have explanatory powers above 50%, making them the main factors affecting FVC in the YRSR. The primary factor impacting vegetation growth is mean annual precipitation. Elevation also shows a significant influence, with an explanatory power above 45%, which contributes to the spatial differentiation of FVC. Conversely, the q-statistic for land use (0.170) and vegetation type (0.161) indicate medium explanatory power for the spatial distribution of FVC. The q-statistic for soil moisture, solar radiation, vapor pressure deficit, snow cover, livestock capacity, and population density are all less than 0.1.

3.2.2. Factors Interaction Detection Analysis

From Figure 8, the interactions of these two factors explain the spatial distribution of FVC better than the interactions between single factors. The strongest interaction occurs between mean annual precipitation and elevation, achieving an explanatory power of 0.790, which surpasses the explanatory power of mean annual precipitation alone (0.629) and that of elevation alone (0.481). The combination of mean annual precipitation with other factors consistently yields high q-statistics: mean annual precipitation and mean annual temperature (0.786), mean annual precipitation and land use (0.726), mean annual precipitation and vegetation type (0.710), mean annual precipitation and population density (0.646), mean annual precipitation and solar radiation (0.649), mean annual precipitation and vapor pressure deficit (0.644), mean annual precipitation and soil moisture (0.644), and mean annual precipitation and livestock capacity (0.639). The lowest q-statistic is observed for the combination of mean annual precipitation and snow cover, which still achieves a q-statistic of 0.636. This indicates that mean annual precipitation is the dominant factor influencing the spatial distribution of FVC in the YRSR, revealing its significant effect on vegetation cover. Conversely, livestock capacity and snow cover exhibit the weakest interaction, with a q-statistic of 0.039. This is primarily attributed to the low explanatory power of livestock capacity (0.006) and snow cover (0.018) when considered individually, resulting in their insufficient combined explanatory power.
According to Table 5, the interaction relationships among the influencing factors demonstrate both bivariate enhancement and nonlinear enhancement. All interaction factors significantly enhance their influence on the spatial heterogeneity of FVC compared to individual factors, indicating that none operate independently. The interaction between mean annual precipitation and other influencing factors is mostly characterized by bivariate enhancement. Snow cover, soil moisture, and vapor pressure deficit exhibit a nonlinear enhancement relationship with other influencing factors. Therefore, the spatial distribution of FVC in the YRSR is not the simple superposition among the eleven influencing factors but rather the outcome of bivariate enhancement and nonlinear enhancement.

3.2.3. Suitable Types or Ranges of Climate Factors for Vegetation Growth

This study applied the geographic detector to analyze the optimal range of climate factors favorable for vegetation growth (Table 6) and conducted statistical significance testing at a 95% confidence level. The higher the FVC value, the more favorable the climatic factors are for vegetation growth. As the annual average temperature increases, FVC gradually rises. When the annual average temperature ranges from 2.21 to 3.91 °C, FVC reaches its maximum value of 0.94. FVC increases with the mean annual precipitation, reaching its maximum value of 0.95 when the precipitation ranges between 836 and 964 mm. FVC reaches its maximum value of 0.8 when snow cover ranges between 25.42% and 32%. Soil moisture varies fluctuatingly, and FVC reaches its maximum value of 0.90 when soil moisture is between 0.25 and 0.30 cm·cm−3. FVC reaches its maximum value of 0.90 when solar radiation ranges from 227 to 243 MJ/m2. Similarly, FVC reaches its maximum value of 0.81 when the saturation vapor pressure deficit is between 0.12 and 0.15 kPa.

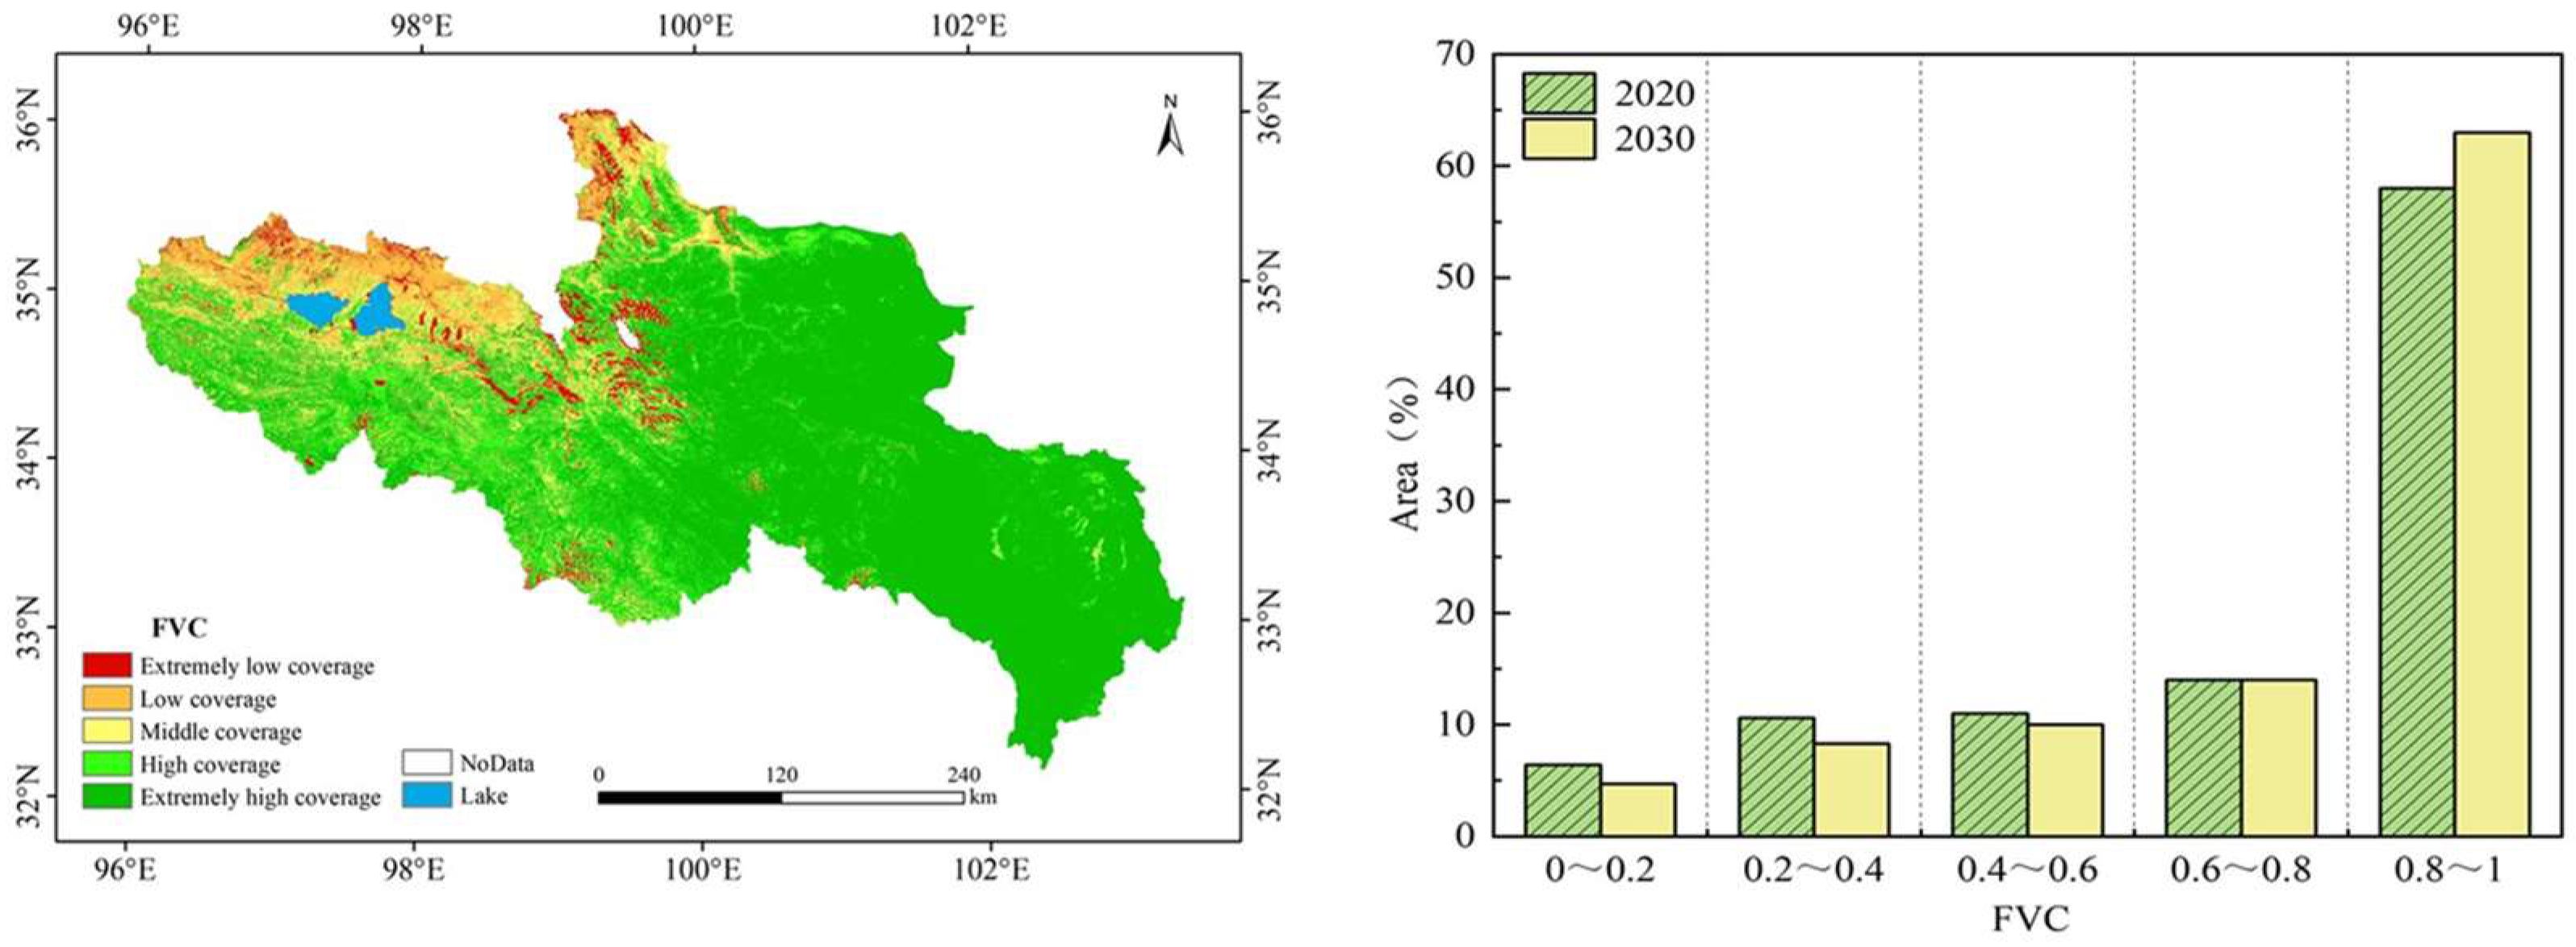
3.3. Future Trends Analysis in the YRSR

This study predicts the spatial-temporal patterns of vegetation coverage in the YRSR for the year 2030 based on the FLUS model. The Kappa coefficient was utilized to compare the simulation results of vegetation coverage in 2020 with the actual observed conditions. The vegetation coverage data for the YRSR in 2015, along with the relevant influencing factor data, were input into the FLUS model to simulate the vegetation coverage for 2020. A Kappa test was performed by comparing the simulated 2020 vegetation coverage with the actual 2020 data, yielding a Kappa coefficient of 0.889 and an overall accuracy of 0.921. These results indicate that the predictive model has a good simulation performance and high accuracy. Consequently, it can be employed to forecast future spatial change trends in vegetation coverage in the YRSR. According to the prediction results in Figure 9, the areas classified as extremely low and low coverage are projected to decrease by 1.7% and 2.3%, respectively, by 2030 compared to 2020. This suggests that the area of low coverage in the region is expected to decrease in the future, which may be attributed to factors such as climate change or land use changes. In 2030, middle and high coverage are expected to account for 11% and 14% of the total area of the YRSR, respectively. This suggests that the vegetation coverage in the region will remain stable in the future, and the overall ecological environment may experience a certain degree of recovery. Conversely, the area of extremely high coverage is expected to increase by 5% in the same moment, indicating a trend of greening in the YRSR in the future. Overall, the vegetation coverage in the YRSR is anticipated to exhibit an increasing trend over the next decade, particularly highlighting a notable recovery trend in the northern and northwestern areas.

4. Discussion

4.1. Temporal and Spatial Changes in Vegetation Coverage

The research findings indicate that the vegetation coverage in the YRSR is generally dominated by high coverage and extremely high coverage. From 2000 to 2020, the FVC in the YRSR exhibited an increasing trend, with an annual growth rate of 0.23%. The results of this study are consistent with the conclusions of Lu et al. [65] and Ren et al. [66]. The vegetation coverage in the YRSR has been effectively restored, largely benefiting from the implementation of the “Grain-for-Green Program” [67] in 1999, the “Sanjiangyuan Ecological Protection and Construction Phase I Project” in 2005, and the “Phase II Project” initiated in 2013 [37]. Among these, returning the grazing land to grasslands involves the construction of enclosures, livestock sheds, and artificial fodder bases, effectively reducing grazing pressure and alleviating the conflict between grassland and livestock. For instance, since the implementation of the ecological projects, the livestock population in Qinghai Province has decreased by 15.34% [68]. The ecological migration policy, combined with the specific conditions of the YRSR, involves both “permanent migration” and “ten-year grazing ban migration” [69]. Herders have transitioned to processing meat and wool products to relieve pressure on the pastoral industry, thereby promoting vegetation recovery and improving the ecological environment. In addition, soil and water conservation measures, including soil erosion control and the conversion of sloped land into terraced fields, have enhanced soil retention capacity and improved soil moisture conditions, thereby providing a more favorable environment for vegetation growth [70]. Additionally, the adoption of artificial precipitation measures has effectively increased local rainfall, enhancing vegetation growth rates and biomass [71]. Therefore, with continuous ecological management, vegetation coverage in the YRSR has generally shown an improving trend. Due to the influence of ENSO (El Niño-Southern Oscillation), FVC exhibited a declining trend after 2006 and 2010, respectively [72].
On a spatial scale, higher figures in the southeast region and lower figures in the northwestern region define vegetation coverage, which is impacted by both anthropogenic and natural influences [73]. The poor vegetation coverage in the northwestern part is primarily due to low precipitation, leading to unfavorable water and thermal conditions for plant growth. In western Maqin and southern Dari counties, low coverage is mainly caused by the presence of the Animaqing Glacier and the predominance of bare land, which limits conditions for vegetation growth. Conversely, the highest vegetation coverage is found in the southeastern part, particularly in Maqu, Ruoergai, Aba, and Hongyuan counties. This is attributed to the abundance of swamps and wetlands, providing low elevation and abundant precipitation, which supports vigorous vegetation growth and contributes to the region’s overall high coverage. Theil–Sen median slope and Mann–Kendall test were used to analyze the vegetation change trend in the YRSR over the past 21 years (Figure 6). The majority of areas showed an improvement in vegetation conditions (75.5%), which further demonstrates the positive effects of the national ecological projects. Combined with measures such as adjustments in the pastoral industry structure, the implementation of grazing bans, and subsidy policies for local herders, these efforts have effectively promoted the improvement of the ecological environment in the YRSR. As a result, there has been an increasing trend in FVC. The area with a degrading trend in FVC accounts for 11.8%, primarily distributed in the lagoonal shoals of Zhaling Lake and Eling Lake, the valley of the Kariqu River, and the valley zone of the Requ River, along with scattered areas in the southeastern part of the YRSR. These findings align with the results of Wang et al. [74]. This is primarily due to the impact of overgrazing, with the maximum grazing pressure index reaching as high as 0.996 in Maduo County [75]. Additionally, the erosion of wetlands, tundra, and lagoonal flats has contributed to the reduction in vegetation coverage. There is also a degradation trend in Gande County and Maqin County, primarily attributed to grassland degradation resulting from unreasonable human activities such as urbanization and over-cultivation of arable land [76].

4.2. Impact of Influencing Factors on Vegetation Change

This study quantified and analyzed the driving mechanisms of natural and anthropogenic factors in the spatial differentiation of FVC in the YRSR using geographic detectors. The results indicate that the mean annual precipitation has an explanatory power of 63% for vegetation coverage (q-statistic > 0.1, Table 5), making it the primary driving factor affecting vegetation coverage. In this study, vegetation coverage gradually increased with the rise in annual precipitation. When the annual average precipitation reached 836–964 mm, vegetation coverage in the YRSR reached its maximum value (Table 6), which is consistent with the study by Zhang et al. [77].
The mean annual temperature is the second key factor influencing vegetation changes, with an explanatory power of 51% for vegetation coverage. This is primarily because the warming and moistening of the climate accelerate the decomposition of soil organic matter, extending the phenological cycle of vegetation and promoting its growth [78]. Although temperature is crucial for vegetation growth, excessively high temperatures and insufficient water can cause plants to reduce stomatal aperture, thereby inhibiting growth [79]. In this study, vegetation coverage was highest when the mean annual temperature ranged from 2.21 to 3.91 °C, while a decreasing trend in vegetation coverage was observed when the temperature ranged from 3.91 to 6.06 °C.
Elevation is also a major driving factor influencing vegetation distribution, with an explanatory power of 48% for vegetation coverage. Elevation indirectly affects vegetation by altering factors such as temperature, precipitation, and soil nutrients [80]. The main reason for the low vegetation coverage in the northwest of the YRSR is the topography, which is higher in the northwest and lower in the southeast. The region is dominated by the Yahela Daheze Mountain in the west and the Burkhan Buda Mountain in the north. Vegetation is unable to acquire the necessary heat, leading to a drop in temperature and rapid evapotranspiration, thereby limiting the growth conditions for vegetation. In previous studies, annual average precipitation, mean annual temperature, and elevation have also been considered important driving factors affecting vegetation growth in arid and semi-arid regions [81].
In our study, 16% of the variation in vegetation coverage is explained by vegetation type. Different vegetation types respond to water and thermal conditions in significantly different ways [82]. For example, the alpine swamp in the eastern part of the YRSR plays an important role in regulating precipitation and maintaining ecological balance, which significantly influences vegetation growth in the region.
Soil moisture (9.6%) and solar radiation (7.8%) also influence vegetation coverage (p < 0.05, Table 5). Vegetation coverage gradually increases with the increase in soil moisture. When soil moisture is high, vegetation can maintain normal transpiration, which facilitates water and nutrient absorption by the roots, promoting healthy growth [83]. Solar radiation is primarily negatively correlated with vegetation coverage [55]. Low solar radiation is usually associated with reduced evaporation and better moisture conditions, which are favorable for vegetation growth. Therefore, vegetation coverage reaches its highest level when solar radiation is between 227 and 243 MJ/m2 [84,85].
The effects of vapor pressure deficit and snow cover on vegetation coverage are 3.5% and 1.8%, respectively. Gao et al. [86] and Zhong et al. [87] found a negative response between vapor pressure deficit and vegetation coverage in arid and semi-arid regions. Global warming leads to an increase in vapor pressure deficit, which prompts vegetation to close its stomata to prevent excessive water loss, thereby reducing photosynthesis and carbon uptake. This is consistent with the findings of this study, where vegetation coverage reaches its maximum value of 0.81 when the vapor pressure deficit is between 0.12 and 0.15 kPa. Additionally, temperature fluctuations and changes in precipitation patterns may lead to variations in snow cover extent and snow duration, subsequently affecting FVC [88]. Although their individual effects are relatively weak, the q-statistic reflects only the isolated impact of each factor on FVC. When interacting with other factors, these effects may become significant, for example, in the interactions of vapor pressure deficit and mean annual precipitation (q (VPD ∩ MAP) = 0.644), snow cover and elevation (q (SC ∩ Ele) = 0.504), etc. This indirectly suggests that vegetation dynamics are driven by the combined influence of multiple factors and triggered by complex mechanisms [89].
Among the anthropogenic factors, population density also influenced vegetation change with an explanatory power of 3.5%. As urbanization progresses, higher population density leads to the degradation of alpine grassland and a reduction in vegetation coverage [90]. The explanatory power of livestock capacity on vegetation change in the YRSR is 0.6%. This is mainly due to the implementation of grazing bans, which have led to a comprehensive ecological protection strategy in the study area, including grazing bans, rest periods, and rotational grazing [91]. Land use significantly influences the spatial distribution of vegetation coverage in the YRSR, with an explanatory power of 17%. Changes in land use reflect human activities impacting the natural environment [92]. In the context of ecological restoration projects, areas previously classified as sandy land have been transformed into grassland, contributing to the overall increasing trend of vegetation coverage in the region [93].

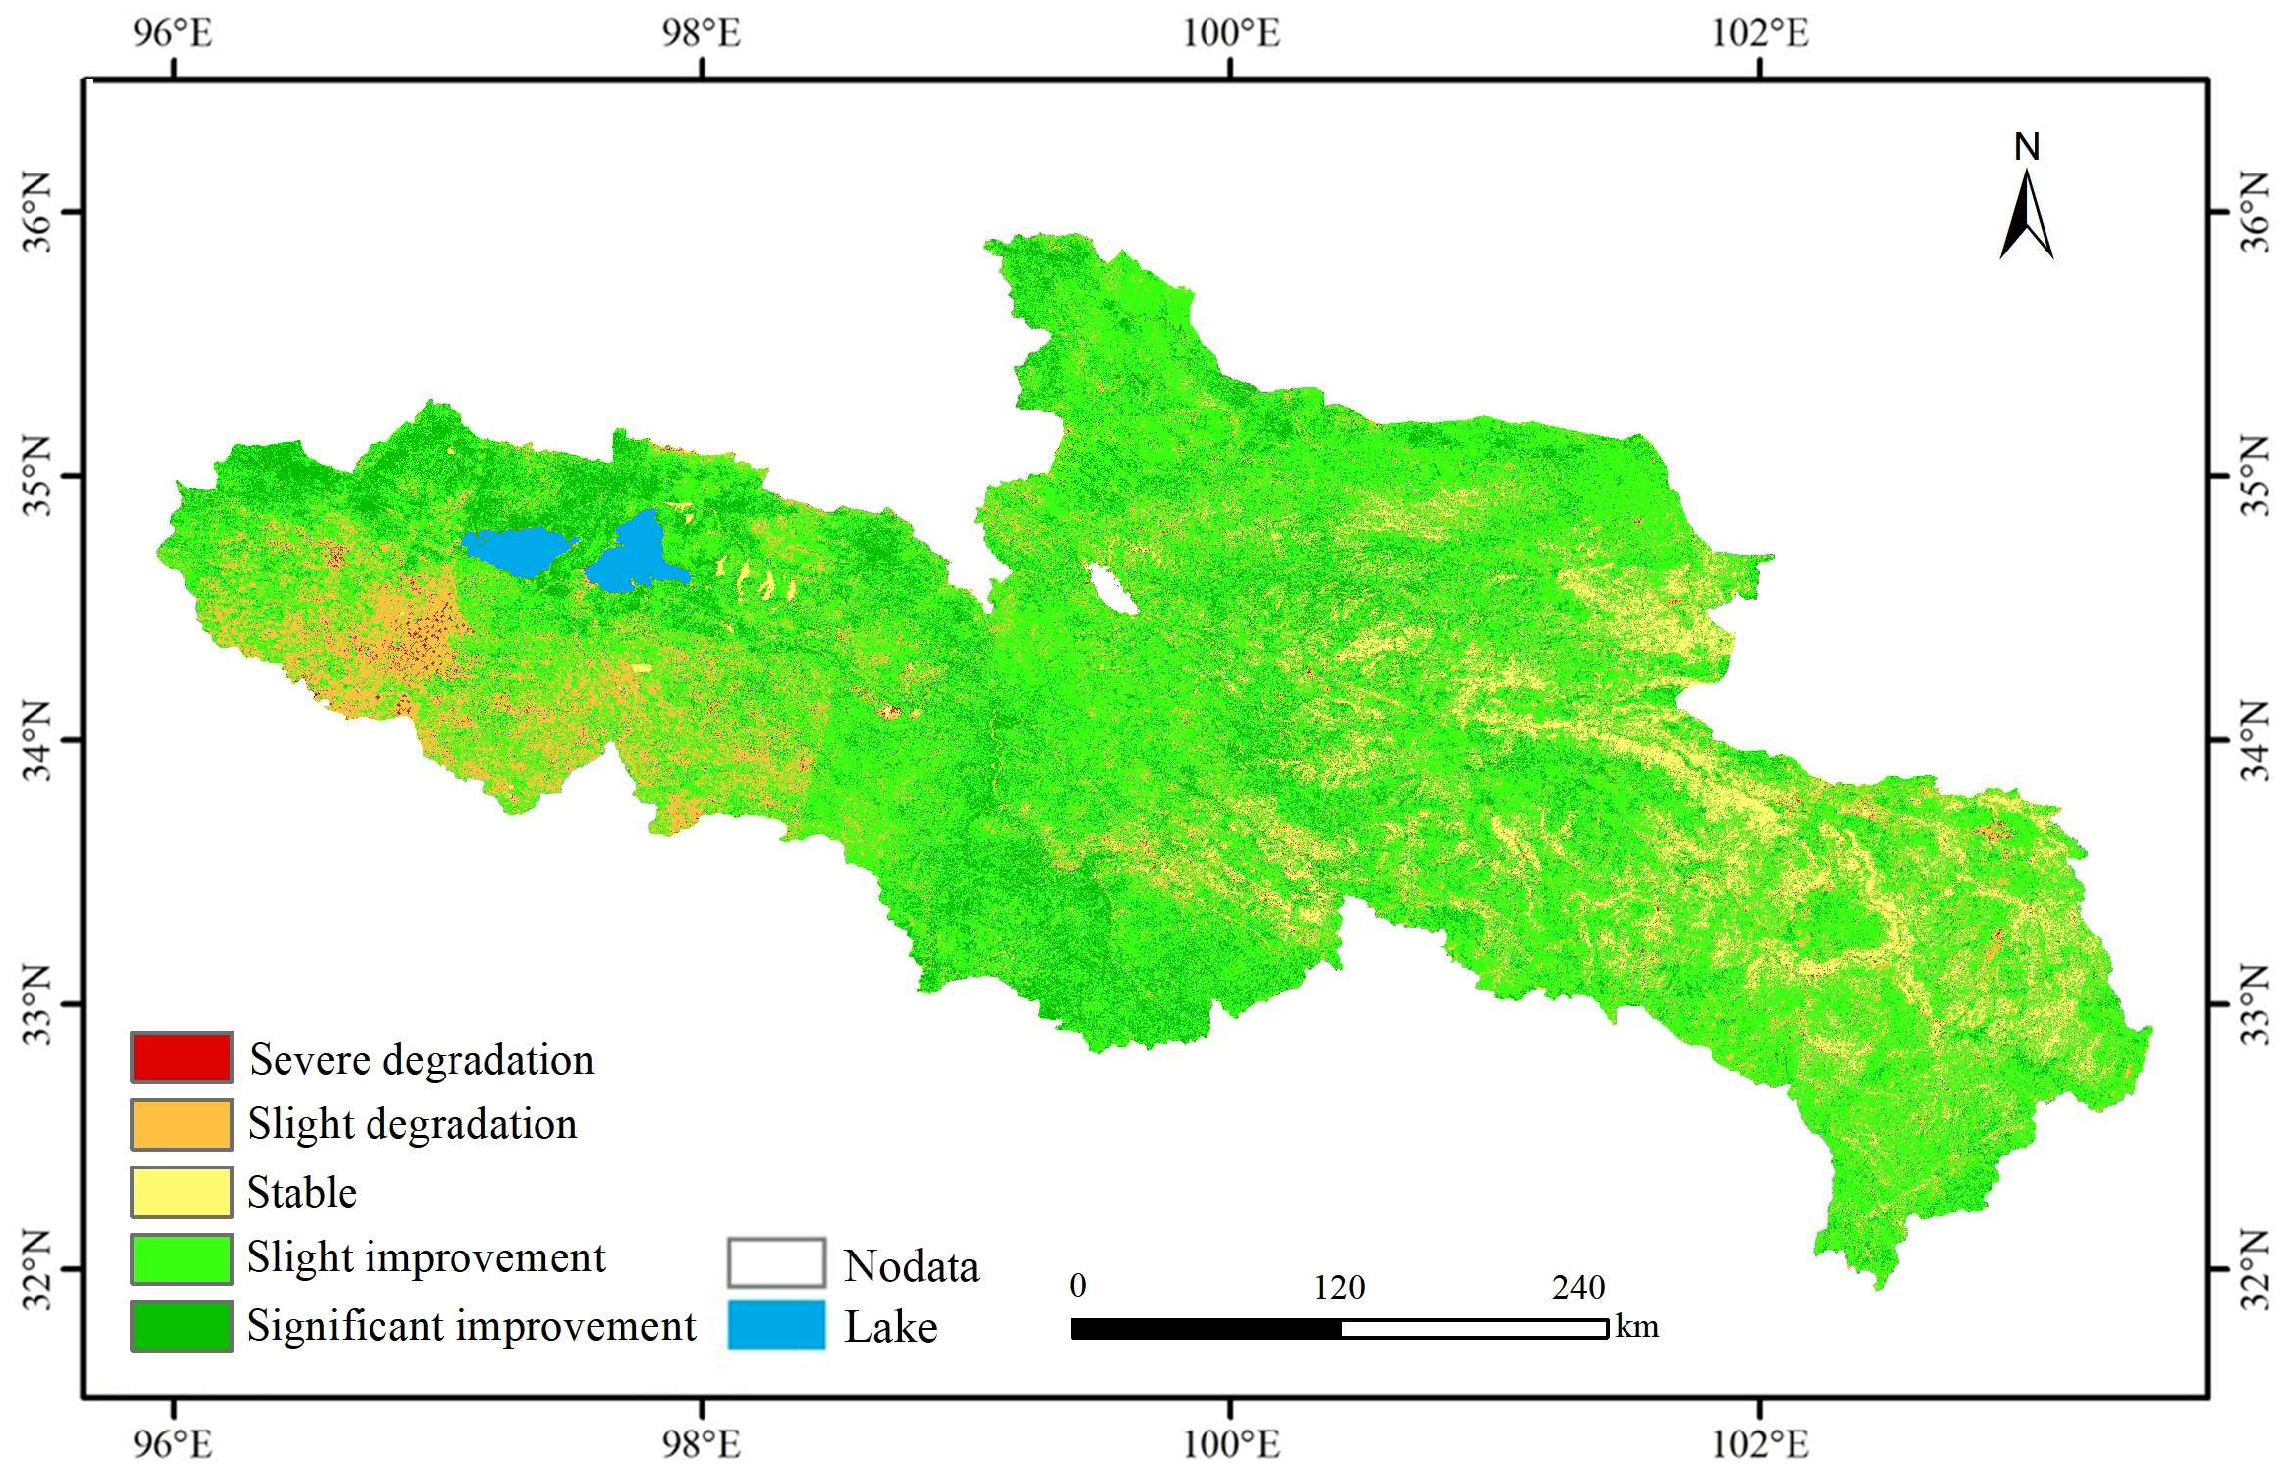
4.3. Future Trends of Vegetation Coverage Changes

This study used the FLUS model to predict the dynamic changes in vegetation coverage in the YRSR by 2030 (Figure 9), which is generally consistent with the findings of Liu et al. [72] in the Yellow River Basin. The Kappa coefficient of the simulation results is 0.889, with an overall accuracy of 92%, indicating a high level of reliability. The results provide a theoretical basis for future vegetation protection in the YRSR. The trend of vegetation recovery in the northern and northwestern parts of the YRSR by 2030 is particularly evident. This finding is closely linked to ecological engineering, including the “afforestation program” and wetland protection initiatives implemented in recent years. It further verifies the positive impacts of these projects in promoting vegetation recovery and enhancing the ecological environment [37,38]. In the future, ecological protection efforts in the northern and northwestern parts of the YRSR should be intensified to consolidate and expand the achievements in vegetation restoration. While the overall vegetation coverage shows an increasing trend, degradation persists in the northern part of Xinghai County, the southeastern part of Maduo County, and around the Animaqing Glacier. This degradation is primarily influenced by topography, climatic conditions, the low carrying capacity of the environment, and the fragile ecological landscape [72]. Therefore, in formulating strategies for ecological protection and restoration, management should fully consider the differences and complexities of these factors and implement targeted measures. This approach aims to achieve comprehensive restoration of vegetation coverage and ensure sustained betterment of the natural setting.

5. Conclusions

We put together and studied the spatial-temporal characteristics of vegetation coverage and its mechanisms in the YRSR between 2000 and 2020. For the purpose of forecasting regional FVC changes in 2030, we also made use of the FLUS model. The findings suggest the following:
(1)
In the last two decades, the average FVC in the YRSR has shown a fluctuating incline, with an annual growth rate of 0.23%. It is primarily dominated by high and extremely high vegetation coverage classes. Spatially, FVC exhibits characteristics of increased numbers in the southeast and decreased numbers in the northwest, with an overall improving trend from 2000 to 2020, particularly in the northern part of the YRSR, including Xinghai County and the southern part of Dari County.
(2)
This study, using the factor detector analysis, reveals that mean annual precipitation, mean annual temperature, and elevation are the key factors influencing FVC in the YRSR, with mean annual precipitation being the dominant factor. At the same time, the two-factor interactions were better at explaining the spatial distribution of FVC than the individual factors. This shows that annual rainfall plays a crucial role in changes in vegetation coverage.
(3)
The prediction results based on the FLUS model indicate that vegetation coverage in the YRSR will continue to increase by 2030, with the area of extremely high coverage rising by 5% compared to 2020. In contrast, the areas of extremely low, low, and medium coverage are expected to decrease. This trend suggests that the vegetation conditions in the YRSR will further improve over the next decade, particularly in the northern and northwestern areas, where the trend of vegetation recovery is notably pronounced.
This study identifies the principal forces of vegetation coverage change in the YRSR as well as its spatial-temporal change characteristics, predicting the change trend for the next decade. These results provide a scientific base for ecological protection and long-term development in the YRSR, as well as a valuable reference for vegetation change studies and ecological management in similar areas.

Author Contributions

Conceptualization, B.W. and B.J.; methodology, B.W., X.H., D.Z. and B.J.; software, B.W., X.Z., D.Z., Z.L., B.N. and X.B.; validation, J.S., X.Z., D.Z. and Z.L.; formal analysis, B.W.; investigation, J.S., B.J., D.Z., X.Z. and Z.L.; resources, B.J.; data curation, B.N. and X.B.; writing—original draft preparation, B.W.; writing—review and editing, B.W. and B.N.; visualization, B.W., X.Z., Z.L., B.N. and X.B.; supervision, J.S.; project administration, J.S.; funding acquisition, J.S. All authors have read and agreed to the published version of the manuscript.

Funding

This research was funded by the Science and Technology Department Project of Inner Mongolia Autonomous Region (No.2024JBGS0003-2); The Youth Science and Technology Foundation of Gansu Province (No.24JRRA105); The National Natural Science Foundation of China (No.52379029); The Natural Science Foundation of Gansu Province (No.23JRRA611); The Science and Technology Major Project of Inner Mongolia Autonomous Region (No.2024JBGS0009); Alxa League Forestry and Grassland Bureau Project (No.AMZCS-G-F-240019); The Taolai River Basin Water Resource Utilization Center Project of Gansu Provincial Department of Water Resources, (No.24GSLK063); The Gansu Institute of Water Resources Science Project: Evaluation of total water use and water use efficiency of water resources in Shule River Basin.

Data Availability Statement

The source of relevant data acquisition has been described in the text.

Conflicts of Interest

The authors declare no conflicts of interest.

References

  1. Li, W.T.; Duveiller, G.; Wieneke, S.; Forkel, M.; Gentine, P.; Reichstein, M.; Niu, S.L.; Migliavacca, M.; Orth, R. Regulation of the global carbon and water cycles through vegetation structural and physiological dynamics. Environ. Res. Lett. 2024, 19, 073008. [Google Scholar] [CrossRef]
  2. Reynolds, J.F.; Stafford Smith, D.M.; Lambin, E.F.; Turner, B.L.; Mortimore, M.; Batterbury, S.P.J.; Downing, T.E.; Dowlatabadi, H.; Fernández, R.J.; Herrick, J.E.; et al. Global desertification: Building a science for dryland development. Science 2007, 316, 847–851. [Google Scholar] [CrossRef] [PubMed]
  3. Wang, X.; Bai, J.; Feng, X.; Zhou, J.; Wang, X.; Yao, W.; Tu, Y.; Sun, Z.; Ma, J. Thresholds for ecosystem service response to changes of vegetation cover in the Qinba Mountain region. Acta Ecol. Sin. 2024, 44, 6811–6827. [Google Scholar]
  4. Wang, Y.; Hao, L.; Xu, Q.; Li, J.; Chang, H. Spatio-temporal variations of vegetation coverage and its geographical factors analysis on the Loess Plateau from 2001 to 2019. Acta Ecol. Sin. 2023, 43, 2397–2407. [Google Scholar]
  5. Yin, Z.; Feng, Q.; Wang, L.; Chen, Z.; Chang, Y.; Zhu, R. Vegetation coverage change and its influencing factors across the northwest region of China during 2000–2019. J. Desert Res. 2022, 42, 11–21. [Google Scholar]
  6. Yue, Y.; Chen, G.; Wang, L.; Li, X.; Li, T. Analysis of vegetation coverage changes in Zhouqu County from 1998 to 2019 based on GEE platform. Acta Agrestia Sin. 2022, 30, 1534–1542. [Google Scholar]
  7. Song, M.; Chen, H.; Ding, H.; Cui, N.; Kang, G.; Wang, Y. Temporal and spatial variation characteristic and influencing factors of vegetation coverage in Tianjin during 1990–2020. Res. Soil Water Conserv. 2023, 30, 154–163. [Google Scholar]
  8. De Keersmaecker, W.; Lhermitte, S.; Tits, L.; Honnay, O.; Somers, B.; Coppin, P. A model quantifying global vegetation resistance and resilience to short-term climate anomalies and their relationship with vegetation cover. Global Ecol. Biogeogr. 2015, 24, 539–548. [Google Scholar] [CrossRef]
  9. Moulton, M.A.B.; Hesp, P.A.; da Silva, G.M.; Bouchez, C.; Lavy, M.; Fernandez, G.B. Changes in vegetation cover on the Younghusband Peninsula transgressive dunefields (Australia) 1949–2017. Earth Surf. Process. Landf. 2019, 44, 459–470. [Google Scholar] [CrossRef]
  10. de Jong, R.; de Bruin, S.; de Wit, A.; Schaepman, M.E.; Dent, D.L. Analysis of monotonic greening and browning trends from global NDVI time-series. Remote Sens. Environ. 2011, 115, 692–702. [Google Scholar] [CrossRef]
  11. Kalisa, W.; Igbawua, T.; Henchiri, M.; Ali, S.; Zhang, S.; Bai, Y.; Zhang, J.H. Assessment of climate impact on vegetation dynamics over East Africa from 1982 to 2015. Sci. Rep. 2019, 9, 16865. [Google Scholar] [CrossRef] [PubMed]
  12. Bai, Y. Analysis of vegetation dynamics in the Qinling-Daba Mountains region from MODIS time series data. Ecol. Indic. 2021, 129, 108029. [Google Scholar] [CrossRef]
  13. Tang, Z.; Ma, J.; Li, C.; Peng, H.; Liang, J. Spatiotemporal changes of vegetation and their responses to temperature and precipitation in upper Shiyang river basin. Geogr. Geo-Inf. Sci. 2017, 60, 969–979. [Google Scholar] [CrossRef]
  14. Zhu, L.; Meng, J.; Zhu, L. Applying Geodetector to disentangle the contributions of natural and anthropogenic factors to NDVI variations in the middle reaches of the Heihe River Basin. Ecol. Indic. 2020, 117, 106545. [Google Scholar] [CrossRef]
  15. Geng, X.; Wang, X.M.; Fang, H.L.; Ye, J.S.; Han, L.K.; Gong, Y.; Cai, D.W. Vegetation coverage of desert ecosystems in the Qinghai-Tibet Plateau is underestimated. Ecol. Indic. 2022, 137, 108780. [Google Scholar] [CrossRef]
  16. Cai, Y.; Chen, L.; Lyu, S.; Zhang, Y.; Wu, Q.; Wang, F.; Song, J.; Cheng, L.; Liu, Q.; Zhang, J. Impact of vegetation change on evapotranspiration components in the Loess Plateau based on Google Earth Engine. Sci. Geogr. Sinica. 2023, 43, 1649–1658. [Google Scholar]
  17. Liu, C.X.; Zhang, X.D.; Wang, T.; Chen, G.Z.; Zhu, K.; Wang, Q.; Wang, J. Detection of vegetation coverage changes in the Yellow River Basin from 2003 to 2020. Ecol. Indic. 2022, 138, 108818. [Google Scholar] [CrossRef]
  18. Ma, Z.H.; Guo, J.H.; Li, W.M.; Cai, Z.Y.; Cao, S.X. Regional differences in the factors that affect vegetation cover in China. Land Degrad. Dev. 2021, 32, 1961–1969. [Google Scholar] [CrossRef]
  19. Gao, W.D.; Zheng, C.; Liu, X.H.; Lu, Y.D.; Chen, Y.F.; Wei, Y.; Ma, Y.D. NDVI-based vegetation dynamics and their responses to climate change and human activities from 1982 to 2020: A case study in the Mu Us Sandy Land, China. Ecol. Indic. 2022, 137, 108745. [Google Scholar] [CrossRef]
  20. Liu, C.L.; Li, W.L.; Wang, W.Y.; Zhou, H.K.; Liang, T.G.; Hou, F.J.; Xu, J.; Xue, P.F. Quantitative spatial analysis of vegetation dynamics and potential driving factors in a typical alpine region on the north-eastern Tibetan Plateau using the Google Earth Engine. Catena 2021, 206, 105500. [Google Scholar] [CrossRef]
  21. Liu, H.; Chen, H.; Dong, T.; Ma, L.; Zhu, X.; Huang, T. Variation characteristic of NDVI and its response to climate change in the Sichuan-Chongqing region. Acta Ecol. Sin. 2023, 43, 6743–6757. [Google Scholar]
  22. Wang, S.; Liu, Q.; Huang, C. Vegetation change and its response to climate extremes in the arid region of Northwest China. Remote Sens. 2021, 13, 1230. [Google Scholar] [CrossRef]
  23. Fu, F.; Zhao, D.X.; Zhang, B.E.; Zhu, Z.M.; Lu, H.Y.; Yang, C.C.; Zhao, M.W. Characteristics of spatial and temporal variations of multi-year vegetation cover in different climatic zones of China and their topographic effects. Environ. Sci. 2024, 1–20. [Google Scholar] [CrossRef]
  24. Feng, D.; Duan, Y.; Li, T.; Ting, T. The vegetation spatio-temporal evolution and their response to geographical environment of Qian-Gui region in 20 years. Res. Soil Water Conserv. 2025, 32, 255–262. [Google Scholar]
  25. Wang, J.; Xie, Y.W.; Wang, X.Y.; Guo, K.M. Driving factors of recent vegetation changes in Hexi Region, Northwest China based on a new classification framework. Remote Sens. 2020, 12, 1758. [Google Scholar] [CrossRef]
  26. Xu, Y.; Dai, Q.Y.; Huang, W.T.; Pan, Y.C.; Zheng, Z.W.; Guo, Z.D. Spatio-temporal variation in vegetation cover and its driving mechanism exploration in Southwest China from 2000 to 2020. Environ. Sci. 2023, 44, 323–335. [Google Scholar]
  27. Piao, S.L.; Wang, X.H.; Park, T.; Chen, C.; Lian, X.; He, Y.; Bjerke, J.W.; Chen, A.P.; Ciais, P.; Tommervik, H.; et al. Characteristics, drivers and feedbacks of global greening. Nat. Rev. Earth Environ. 2020, 1, 14–27. [Google Scholar] [CrossRef]
  28. Yang, X.Y.; Yang, Q.K.; Yang, M.M. Spatio-temporal patterns and driving factors of vegetation change in the Pan-Third Pole region. Remote Sens. 2022, 14, 4402. [Google Scholar] [CrossRef]
  29. Yan, X.X.; Li, J.; Shao, Y.; Hu, Z.Q.; Yang, Z.; Yin, S.Q.; Cui, I. Driving forces of grassland vegetation changes in Chen Barag Banner, Inner Mongolia. GIScience Remote Sens. 2020, 57, 753–769. [Google Scholar] [CrossRef]
  30. Wang, J.F.; Xu, C.D. Geodetector: Principle and prospective. Acta Geogr. Sin. 2017, 72, 116–134. [Google Scholar] [CrossRef]
  31. Wang, S.N.; Wu, Y.J.; Wang, H.Z.; Li, M.Y.; Wang, F.; Zhang, W.Y.; Ma, X.M.; Yu, X.Q. Spatial and temporal drivers of drought analysis using the geodetector in Ordos. Arid Land Res. Manag. 2024, 1–12. Available online: https://link.cnki.net/urlid/65.1095.X.20241115.1751.004 (accessed on 15 December 2024).
  32. Wang, D.; Tian, Y.; Zhang, Y.; Huang, L.; Zhang, Q.; Tao, J.; Yang, Y.; Lin, J. Spatiotemporal evolution and attribution of vegetation coverage in the peak-cluster depression basins. China Environ. Sci. 2022, 42, 4274–4284. [Google Scholar]
  33. Yang, P.H.; Tian, J.; Zhang, N.; Gao, Y.S.; Feng, X.J.; Yang, C.C.; Peng, D.L. Characteristics of Spatial-Temporal Changes and Future Trends Forecast of Vegetation Cover in the Yellow River Basin from 1990 to 2022. Acta Agrestia Sin. 2024, 44, 8542–8553. [Google Scholar]
  34. Li, B.; Li, C.Y.; Liu, J.Y.; Zhang, Q.; Duan, L.M. Decreased Streamflow in the Yellow River Basin, China: Climate Change or Human-Induced? Water 2017, 9, 116. [Google Scholar] [CrossRef]
  35. Hu, G.; Dong, Z.; Lu, J.; Yan, C. Spatial and Temporal Changes of Desertification Land and Its Influence Factors in the Source Region of the Yellow River from 1975 to 2005. J. Desert Res. 2011, 31, 1079–1086. [Google Scholar]
  36. Ma, S.; Sheng, Y.; Cao, W.; Wu, J.; Hu, X.; Wang, S. Numerical Simulation of Spatial Distribution and Change of Permafrost in the Source Area of the Yellow River. Acta Geogr. Sin. 2017, 72, 1621–1633. [Google Scholar]
  37. Shao, Q.; Fan, J.; Liu, J.; Huang, L.; Cao, W.; Liu, L. Target-Based Assessment on Effects of First-Stage Ecological Conservation and Restoration Project in Three-River Source Region, China and Policy Recommendations. Bull. Chinese Acad. Sci. 2017, 32, 35–44. [Google Scholar]
  38. Shao, Q.; Zhao, Z.; Liu, J.; Fan, J. The Characteristics of Land Cover and Macroscopical Ecology Changes in the Source Region of Three Rivers on Qinghai-Tibet Plateau during the Last 30 Years. Geogr. Res. 2010, 29, 1439–1451. [Google Scholar]
  39. Zhang, L.; Li, X.; Feng, J.H.; Rao, R.; He, T.; Chen, Y. Spatial-temporal changes of NDVI in Yellow River Basin and its dual response to climate change and human activities during 2000–2018. Bull. Soil Water Conserv. 2021, 41, 276–286. [Google Scholar]
  40. Qin, Q.T.; Chen, J.J.; Yang, Y.P.; Zhao, X.Y.; Zhou, G.Q.; You, H.T.; Han, X.W. Spatiotemporal variations of vegetation and its response to topography and climate in the source region of the Yellow River. J. Soil Water Conserv. 2021, 41, 3832–3841. [Google Scholar] [CrossRef]
  41. Guo, W.Q.; Yang, T.B.; Dai, J.G.; Shi, L.; Lu, Z.Y. Vegetation cover changes and their relationship to climate variation in the source region of the Yellow River, China, 1990–2000. Int. J. Remote Sens. 2008, 29, 2085–2103. [Google Scholar] [CrossRef]
  42. Yang, Z.P.; Gao, J.X.; Zhou, C.P.; Shi, P.L.; Zhao, L.; Shen, W.S.; Ouyang, H. Spatio-temporal changes of NDVI and its relation with climatic variables in the source regions of the Yangtze and Yellow rivers. J. Geogr. Sci. 2011, 21, 979–993. [Google Scholar] [CrossRef]
  43. Jiang, W.; Yuan, L.; Wang, W.; Cao, R.; Zhang, Y.; Shen, W. Spatio-temporal analysis of vegetation variation in the Yellow River Basin. Ecol. Indic. 2015, 51, 117–126. [Google Scholar] [CrossRef]
  44. Du, J.; Ahati, J.; Zhao, C.; Fang, S.; Liu, W.; Yin, J.; Yuan, X.; Xu, Y.; Shu, J.; He, P. Analysis of Vegetation Dynamics Using GIMMS NDVI3g in the Three-Rivers Headwater Region from 1982 to 2012. Acta Pratacult. Sin. 2016, 25, 1–12. [Google Scholar]
  45. Wu, X.; Li, G.; Pan, X.; Wang, Y.; Zhang, S.; Liu, F.; Shen, Y. Response of Vegetation Cover to Temperature and Precipitation in the Source Region of the Yellow River. Resour. Sci. 2015, 12, 512–521. [Google Scholar]
  46. Zhang, Y.; Liu, L.; Bai, W.; Shen, Z.; Yan, J.; Ding, M.; Li, S.; Zheng, D. Grassland Degradation in the Source Region of the Yellow River. Acta Geogr. Sin. 2006, 61, 3–14. [Google Scholar]
  47. Liang, S.H.; Wan, L.; Li, Z.M.; Cao, W.B. Effects of Frozen Soil on Vegetation in the Source Region of the Yellow River. J. Glaciol. Geocryol. 2007, 29, 45–52. [Google Scholar]
  48. Si, J.H.; Li, J.M.; Yang, Y.; Qi, X.J.; Li, J.J.; Liu, Z.H.; Li, M.Y.; Lu, S.J.; Qi, Y.; Jin, C.; et al. Evaluation and Prediction of Groundwater Quality in the Source Region of the Yellow River. Water 2022, 14, 3946. [Google Scholar] [CrossRef]
  49. Lu, Z.; Song, Q.; Zhao, J.; Ding, Y. Changes in Ecological Land Patterns and Divergence Trends in the Yellow River Source Area from 2005 to 2020. Bull. Soil Water Conserv. 2022, 42, 277–284. [Google Scholar]
  50. Chen, Y.; Zhang, T.B.; Zhu, X.; Yi, G.H.; Li, J.J.; Bie, X.J.; Hu, J.; Liu, X. Quantitatively analyzing the driving factors of vegetation change in China: Climate change and human activities. Ecol. Inform. 2024, 82, 102667. [Google Scholar] [CrossRef]
  51. Zhao, X.; Tan, S.; Li, Y.; Wu, H.; Wu, R. Quantitative analysis of fractional vegetation cover in southern Sichuan urban agglomeration using optimal parameter geographic detector model, China. Ecol. Indic. 2024, 158, 111529. [Google Scholar] [CrossRef]
  52. Holben, B.N. Characteristics of Maximum-Value Composite Images from Temporal AVHRR Data. Int. J. Remote Sens. 1986, 7, 1417–1434. [Google Scholar] [CrossRef]
  53. Ma, R.; Zhang, J.; Shen, X.; Liu, B.; Lu, X.; Jiang, M. Impacts of climate change on fractional vegetation coverage of temperate grasslands in China from 1982 to 2015. J. Environ. Manag. 2024, 350, 119694. [Google Scholar] [CrossRef] [PubMed]
  54. Wang, D.; Li, T.; Wang, K.; Sun, M.; Yu, C.; Yang, F.; Yang, L.; Zhang, W.; Liu, Y.; Zeng, K. Analysis of the Influence Mechanism of Spatial and Temporal Differences in Fraction Vegetation Coverage in the Guanyinyan Reservoir Area of the Jinsha River. Ecol. Environ. Sci. 2024, 33, 997–1007. [Google Scholar]
  55. Qi, R.F.; Li, Q.B.; Ren, J. Study on the Characteristics of Changes in Vegetation Cover and Its Driving Forces in Typical Provinces in the Three-North Shelterbelt Program Regions: Taking Ningxia as Example. Arid Zone Res. 2024, 1–14. [Google Scholar] [CrossRef]
  56. Dai, X.; Ma, J.; Tang, Y.; Li, W. Spatio-temporal dynamics and attribution analysis of vegetation in Gansu Province. Ecol. Environ. Sci. 2024, 33, 1163–1173. [Google Scholar] [CrossRef]
  57. Ma, Y.R.; Guan, Q.Y.; Sun, Y.F.; Zhang, J.; Yang, L.Q.; Yang, E.Q.; Li, H.C.; Du, Q.Q. Three-dimensional dynamic characteristics of vegetation and its response to climatic factors in the Qilian Mountains. Catena 2022, 208, 105694. [Google Scholar] [CrossRef]
  58. Wang, X.; Liu, P.; Geng, M.; Wang, M.; Lu, J. The Key Driving Factors of Land Use Spatio-Temporal Change and Its Influence Trend—A Case Study of Wuwei. China Environ. Sci. 2023, 43, 6583–6591. [Google Scholar]
  59. Dong, D.; Abdirahman, H.; Wang, D.; Tian, S. Spatio-Temporal Variations in Vegetation Cover in Hotan Oasis from 1994 to 2016. Acta Ecologica Sin. 2019, 39, 3710–3719. [Google Scholar]
  60. Wang, W.; Samat, A.; Abuduwaili, J. Geo-Detector Based Spatio-Temporal Variation Characteristics and Driving Factors Analysis of NDVI in Central Asia. Remote Sens. Land Res. 2019, 31, 32–40. [Google Scholar]
  61. Wang, J.F.; Haining, R.; Liu, T.J.; Li, L.F.; Jiang, C.S. Sandwich Estimation for Multi-Unit Reporting on a Stratified Heterogeneous Surface. Environ. Plan. A 2013, 45, 2515–2534. [Google Scholar] [CrossRef]
  62. Qiao, X.; Li, Z.; Lin, J.; Wang, H.; Zheng, S.; Yang, S. Assessing current and future soil erosion under changing land use based on InVEST and FLUS models in the Yihe River Basin, North China. Int. Soil Water Conserv. Res. 2024, 12, 298–312. [Google Scholar] [CrossRef]
  63. Congalton, R.G. A review of assessing the accuracy of classifications of remotely sensed data. Remote Sens. Environ. 1991, 37, 35–46. [Google Scholar] [CrossRef]
  64. Wang, X.; Ma, B.; Li, D.; Chen, K.; Yao, H. Multi-Scenario Simulation and Prediction of Ecological Space in Hubei Province Based on FLUS Model. J. Nat. Resour. 2019, 35, 230–242. [Google Scholar]
  65. Lu, J.; Qin, T.L.; Yan, D.H.; Lv, X.Z.; Yuan, Z.; Wen, J.; Xu, S.; Yang, Y.H.; Feng, J.M.; Li, W. Response of Vegetation to Drought in the Source Region of the Yangtze and Yellow Rivers Based on Causal Analysis. Remote Sens. 2024, 16, 630. [Google Scholar] [CrossRef]
  66. Ren, Z.G.; Tian, Z.H.; Wei, H.T.; Liu, Y.; Yu, Y.P. Spatiotemporal Evolution and Driving Mechanisms of Vegetation in the Yellow River Basin, China during 2000–2020. Ecol. Indic. 2022, 138, 108832. [Google Scholar] [CrossRef]
  67. Ma, L.J.; Liu, Z.; Zhao, B.F.; Lyu, J.W.; Zheng, F.M.; Xu, W.; Gan, X.B. Variations of runoff and sediment and their response to human activities in the source region of the Yellow River, China. Environ. Earth Sci. 2021, 80, 552. [Google Scholar] [CrossRef]
  68. Zhang, X.; Jin, X. Vegetation dynamics and responses to climate change and anthropogenic activities in the Three-River Headwaters Region, China. Ecol. Indic. 2021, 131, 108223. [Google Scholar] [CrossRef]
  69. Wang, Z.; Song, K.; Hu, L. China’s largest scale ecological migration in the three-river headwater region. Ambio 2010, 39, 443–446. [Google Scholar] [CrossRef]
  70. Yang, Y.; Wang, G.; Li, Y.; Wang, Z. Analysis of the spatiotemporal variation of critical vegetation coverage for soil and water conservation and windproof sand fixation functions in the Sanjiangyuan region. J. Mtn. Sci. 2024, 42, 143–153. [Google Scholar] [CrossRef]
  71. Zhai, X.; Liang, X.; Yan, C.; Xing, X.; Jia, H.; Wei, X.; Feng, K. Vegetation dynamic changes and their response to ecological engineering in the Sanjiangyuan Region of China. Remote Sens. 2020, 12, 4035. [Google Scholar] [CrossRef]
  72. Liu, Y.; Song, H.M.; An, Z.S.; Sun, C.F.; Trouet, V.; Cai, Q.F.; Liu, R.S.; Leavitt, S.W.; Song, Y.; Li, Q.; et al. Recent anthropogenic curtailing of Yellow River runoff and sediment load is unprecedented over the past 500 y. Proc. Natl. Acad. Sci. USA 2020, 117, 18251–18257. [Google Scholar] [CrossRef] [PubMed]
  73. Ma, Y.; Ren, X.; Hu, H.; Liu, M.; Meng, Q. Vegetation Dynamics and Its Driving Force in Otindag Sandy Land Based on Geodetector. J. Desert Res. 2019, 41, 195–204. [Google Scholar]
  74. Wang, J.Q.; Wang, G.J.; Liang, S.H.; Du, H.; Peng, H.M. Extraction and Spatio-Temporal Analysis of Vegetation Coverage from 1996 to 2015 in the Source Region of the Yellow River. J. Glaciol. Geocryol. 2021, 43, 662–674. [Google Scholar]
  75. Lv, Y.H.; Hu, J.; Sun, F.X.; Zhang, L.W. Water Retention and Hydrological Regulation: Harmony but Not the Same in Terrestrial Hydrological Ecosystem Services. Acta Ecol. Sin. 2015, 35, 5191–5196. [Google Scholar]
  76. Yang, W.; Su, X.Q.; Li, L.; Yu, B.; Chen, X.; Luo, Z.B.; Chu, W.Y.; Zhang, W.T. Forecasting Future Vegetation Dynamics under SSP/RCP Pathways under Spatially Changing Climate and Human Activities Conditions. Sustainability 2024, 16, 6188. [Google Scholar] [CrossRef]
  77. Zhang, Z.X.; Chang, J.; Xu, C.Y.; Zhou, Y.; Wu, Y.H.; Chen, X.; Jiang, S.S.; Duan, Z. The Response of Lake Area and Vegetation Cover Variations to Climate Change over the Qinghai-Tibetan Plateau during the Past 30 Years. Sci. Total Environ. 2018, 635, 443–451. [Google Scholar] [CrossRef]
  78. Liu, L.B.; Wang, Y.; Wang, Z.; Li, D.L.; Zhang, Y.T.; Qin, D.H.; Li, S.C. Elevation-Dependent Decline in Vegetation Greening Rate Driven by Increasing Dryness Based on Three Satellite NDVI Datasets on the Tibetan Plateau. Ecol. Indic. 2019, 107, 105569. [Google Scholar] [CrossRef]
  79. Guo, Y.J.; Cheng, L.R.; Ding, A.Z.; Yuan, Y.M.; Li, Z.Y.; Hou, Y.Z.; Ren, L.S.; Zhang, S.R. Geodetector model-based quantitative analysis of vegetation change characteristics and driving forces: A case study in the Yongding River basin in China. Int. J. Appl. Earth Obs. Geoinf. 2024, 132, 104027. [Google Scholar] [CrossRef]
  80. Liu, C.; Ren, X.; Zhang, L.; Wang, J.; Zhao, L.; He, H.; Xu, Q.; Zhang, M.; Zeng, N.; Gao, C. Spatio-Temporal Variation of Net Primary Productivity in Three-River-Source National Park Using a Multi-Model Integration Method. Acta Ecol. Sin. 2017, 37, 3084–3095. [Google Scholar] [CrossRef]
  81. Jiao, K.; Gao, J.; Liu, Z. Precipitation drives the NDVI distribution on the Tibetan Plateau while high warming rates may intensify its ecological droughts. Remote Sens. 2021, 13, 1305. [Google Scholar] [CrossRef]
  82. Geng, Q.L.; Chen, X.Q.; He, X.H.; Tian, Z.H. Vegetation Dynamics and Its Response to Climate Change and Human Activities Based on Different Vegetation Types in China. Acta Ecol. Sin. 2022, 42, 3557–3568. [Google Scholar] [CrossRef]
  83. Dai, L.C.; Fu, R.Y.; Guo, X.W.; Du, Y.G.; Zhang, F.W.; Cao, G.M. Soil moisture variations in response to precipitation across different vegetation types on the Northeastern Qinghai-Tibet Plateau. Front. Plant Sci. 2022, 13, 854152. [Google Scholar] [CrossRef] [PubMed]
  84. Qian, H.R.; Zhai, J.Q.; Ma, M.Y.; Zhao, Y.; Ling, M.H.; Wang, Q.M. Temporal and Spatial Variation of Vegetation Coverage and Its Driving Forces During the Growing Season in Haihe River Basin. Res. Soil Water Conserv. 2023, 30, 309–317. [Google Scholar]
  85. Meng, X.Y.; Gao, X.; Li, S.Y.; Lei, J.Q. Spatial and Temporal Characteristics of Vegetation NDVI Changes and the Driving Forces in Mongolia During 1982–2015. Remote Sens. 2020, 12, 603. [Google Scholar] [CrossRef]
  86. Gao, C.; Ren, X.; Fan, L.; He, H.; Zhang, L.; Zhang, X.; Li, Y.; Zeng, N.; Chen, X. Assessing the vegetation dynamics and its influencing factors in Central Asia from 2001 to 2020. Remote Sens. 2023, 15, 4670. [Google Scholar] [CrossRef]
  87. Zhong, Z.; He, B.; Wang, Y.-P.; Chen, H.W.; Chen, D.; Fu, Y.H.; Chen, Y.N.; Guo, L.; Deng, Y.; Huang, L.; et al. Disentangling the effects of vapor pressure deficit on northern terrestrial vegetation productivity. Sci. Adv. 2023, 9, eadf3166. [Google Scholar] [CrossRef]
  88. Qi, Q.; Yang, K.; Li, H.H.; Ai, L.Y.; Wang, C.H.; Wu, T.H. Negative impacts of the withered grass stems on winter snow cover over the Tibetan Plateau. Agric. For. Meteorol. 2024, 352, 110053. [Google Scholar] [CrossRef]
  89. Zuo, Y.F.; Li, Y.H.; He, K.N.; Wen, Y.S. Temporal and Spatial Variation Characteristics of Vegetation Coverage and Quantitative Analysis of Its Potential Driving Forces in the Qilian Mountains, China, 2000–2020. Ecol. Indic. 2022, 143, 109429. [Google Scholar] [CrossRef]
  90. Zhu, M.; Zhou, Z.F.; Wu, X.P.; Liu, R.P.; Zheng, J.J.; Wang, J.L.; Wan, J.X. Response of Vegetation Carbon Sequestration Potential to the Effectiveness of Vegetation Restoration in Karst Ecologically Fragile Areas in Guizhou, Southwest China. Ecol. Indic. 2024, 158, 111495. [Google Scholar] [CrossRef]
  91. Zeng, Y.-N.; Feng, Z.-D. Analysis of cause mechanism of desertification in headwater area of Yellow River. J. Nat. Disasters 2009, 18, 45–52. [Google Scholar] [CrossRef]
  92. Jiang, P.H.; Cheng, L.; Li, M.C.; Zhao, R.F.; Duan, Y.W. Impacts of LUCC on soil properties in the riparian zones of desert oasis with remote sensing data: A case study of the middle Heihe River basin, China. Sci. Total Environ. 2015, 506, 259–271. [Google Scholar] [CrossRef]
  93. Zhu, G.; Gao, H.J.; Zeng, G. Landscape Pattern Change of Sandy Desertification Land in the Source Region of the Yellow River During the Past 45 Years. J. Arid Land Resour. Environ. 2021, 35, 79–85. [Google Scholar]
Figure 1. Location of the study area.
Remotesensing 16 04772 g001
Figure 2. Influencing factors of vegetation coverage. Note: (a) Mean annual temperature, (b) Mean annual precipitation, (c) Elevation, (d) Vegetation type, (e) Snow cover, (f) Solar radiation, (g) Soil moisture, (h) Vapor pressure deficit, (i) Land use and land cover, (j) Livestock capacity, (k) Density of population.
Remotesensing 16 04772 g002
Figure 3. Trend of mean FVC in the Yellow River Source Region (YRSR) from 2000 to 2020.
Remotesensing 16 04772 g003
Figure 4. Proportions of different levels of vegetation coverage in the YRSR.
Remotesensing 16 04772 g004
Figure 5. Spatial distribution characteristics of FVC in the YRSR.
Remotesensing 16 04772 g005
Figure 6. Spatial distribution of FVC trends, 2000–2020.
Remotesensing 16 04772 g006
Figure 7. Changes in the center of gravity migration of vegetation coverage grades, 2000–2020.
Remotesensing 16 04772 g007
Figure 8. Factors interaction detection.
Remotesensing 16 04772 g008
Figure 9. Future trends in FVC in the YRSR.
Remotesensing 16 04772 g009
Table 1. Comparison of influencing factors.
Influencing FactorsAbridge Units
Mean annual temperatureMAT°C
Mean annual precipitationMAPmm
ElevationElem
Vegetation typeVT/
Snow coverSC%
Solar radiationSRMJ/m2
Soil moistureSMcm·cm−3
Vapor pressure deficitVPDkPa
Land use and land coverLULC/
Livestock capacityLCMU/km2
Density of populationPOPperson/km2
Table 2. Types of interaction effects among influencing factors on vegetation coverage.
DescriptionInteraction
q(X1∩X2) < Min(q(X1), q(X2))Weaken, nonlinear
Min(q(X1), q(X2)) < q(X1∩X2) < Max(q(X1), q(X2))Weaken, univariate
q(X1∩X2) > Max(q(X1), q(X2))Enhance, bivariate
q(X1∩X2) = q(X1) + q(X2)Independent
q(X1∩X2) > q(X1) + q(X2)Enhance, nonlinear
Table 3. Domain weights.
LevelExtremely Low CoverageLow CoverageMiddle CoverageHigh CoverageExtremely High Coverage
Domain Weight0.30.010.250.221
Table 4. q-statistic of influencing factors.
Influencing FactorsMATMAPEleVTSCSRSMVPDLULCLCPOP
q-statistic0.5150.6290.4810.1610.0180.0780.0960.0350.1700.0060.035
significance0.0000.0000.0000.0000.0000.0000.0000.0000.0000.0000.000
Table 5. Interaction between influencing factors.
Two-Factor InteractionsInteraction RelationshipsTwo-Factor InteractionsInteraction Relationships
MAT ∩ MAPBVT ∩ SCB
MAT ∩ EleBVT ∩ SRB
MAT ∩ VTBVT ∩ SMB
MAT ∩ SCBVT ∩ VPDB
MAT ∩ SRBVT ∩ LULCB
MAT ∩ SMBVT ∩ LCB
MAT ∩ VPDBVT ∩ POPN
MAT ∩ LULCBSC ∩ SRN
MAT ∩ LCNSC ∩ SMN
MAT ∩ POPBSC ∩ VPDN
MAP ∩ EleBSC ∩ LULCN
MAP ∩ VTBSC ∩ LCN
MAP ∩ SCBSC ∩ POPN
MAP ∩ SRBSR ∩ SMB
MAP ∩ SMBSR ∩ VPDN
MAP ∩ VPDBSR ∩ LULCB
MAP ∩ LULCBSR ∩ LCN
MAP ∩ LCNSR ∩ POPN
MAP ∩ POPBSM ∩ VPDN
Ele ∩ VTBSM ∩ LULCN
Ele ∩ SCNSM ∩ LCN
Ele ∩ SRBSM ∩ POPN
Ele ∩ SMBVPD ∩ LULCN
Ele ∩ VPDNVPD ∩ LCN
Ele ∩ LULCBVPD ∩ POPN
Ele ∩ LCNLULC ∩ LCB
Ele ∩ POPBLULC ∩ POP N
LC ∩ POPN
Note: B represents bivariate enhancement; N represents nonlinear enhancement.
Table 6. The optimal range of climate factors for vegetation.
Climate IndicatorsOptimal RangesFVCUnits
Mean annual temperature2.21–3.910.94°C
Mean annual precipitation836–9640.95Mm
Snow cover25.42–320.80%
Solar radiation227–2430.89MJ/m2
Soil moisture0.25–0.300.90cm·cm−3
Vapor pressure deficit0.12–0.150.81kPa
Disclaimer/Publisher’s Note: The statements, opinions and data contained in all publications are solely those of the individual author(s) and contributor(s) and not of MDPI and/or the editor(s). MDPI and/or the editor(s) disclaim responsibility for any injury to people or property resulting from any ideas, methods, instructions or products referred to in the content.

