


Research on Key Influencing Factors of Ecological Environment Quality in Barcelona Metropolitan Region Based on Remote Sensing


Abstract
1. Introduction
2. Materials and Methods
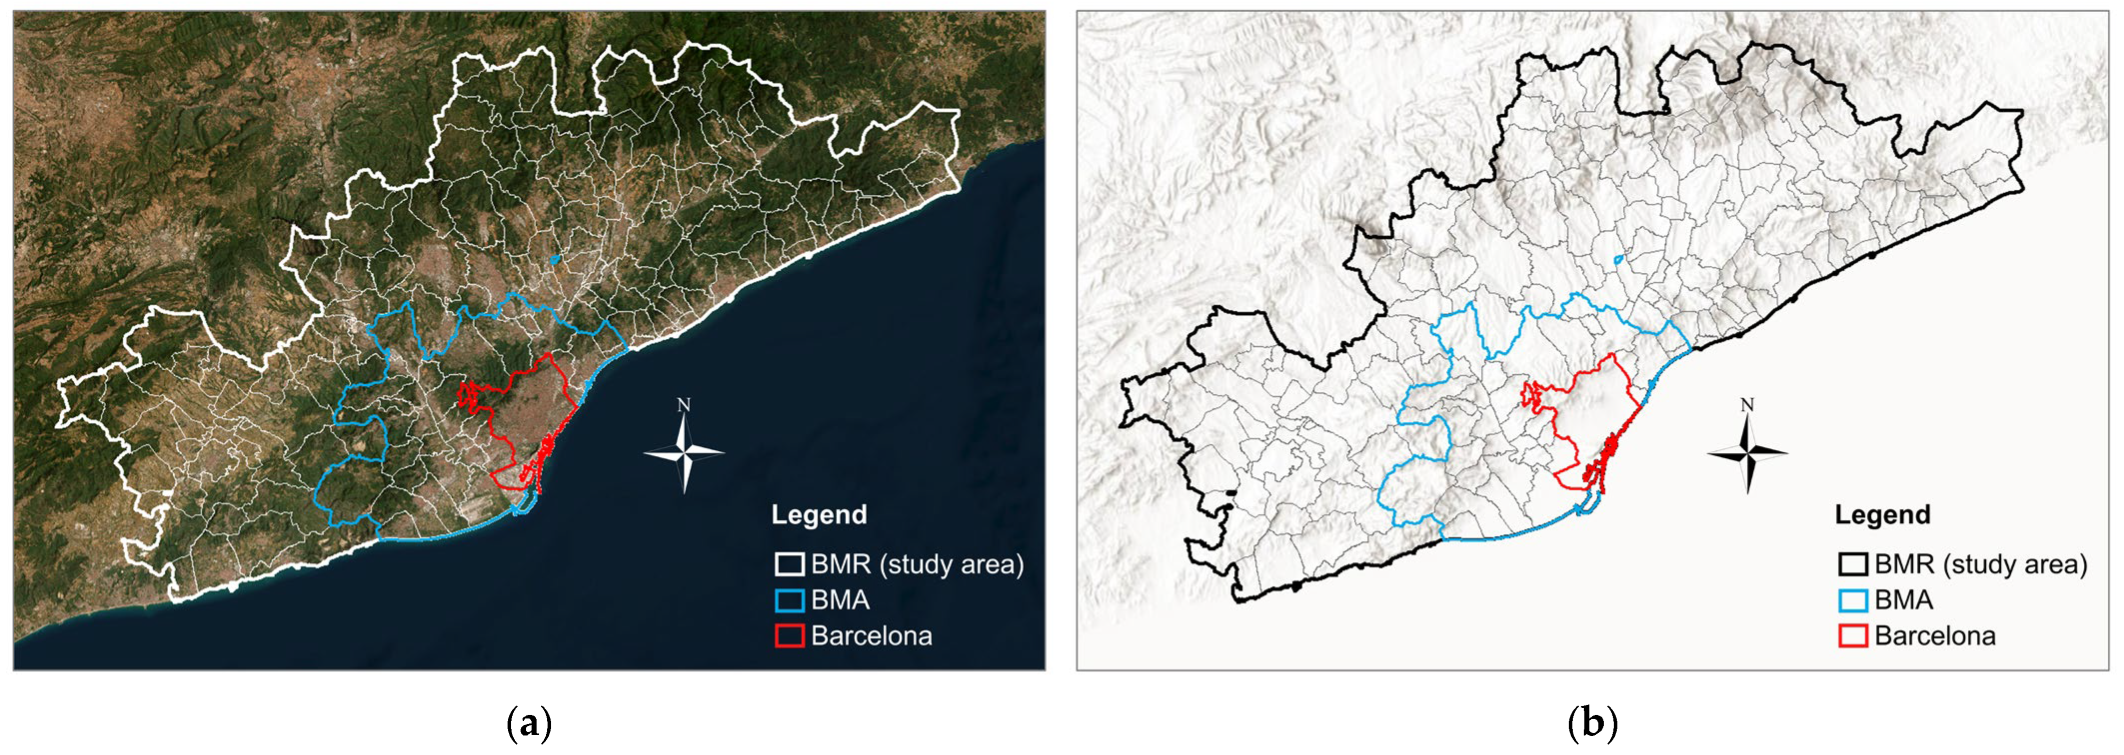
2.1. The Field of Study
2.2. Materials
- Corine Land Cover (CLC) provides us with relatively accurate European land cover data [39] with a resolution of 100 m in 2006, 2012, and 2018 (https://land.copernicus.eu/en/products/corine-land-cover, accessed on 18 June 2024), which records 22 types of green space systems in detail.
- The MODIS_MOD13Q1 (https://lpdaac.usgs.gov/products/mod13q1v006/, accessed on 20 June 2024) dataset provides relevant remote sensing image data with a resolution of 250 m.
- The daytime and nighttime land surface temperature (LST) can be obtained from MODIS_MOD11A1 (https://lpdaac.usgs.gov/products/mod11a1v006/, accessed on 20 June 2024) with a resolution of 1 km.
- The urban heat island effect (UHI) will be expressed as the difference between urban and rural LST, that is, the difference in the average surface temperature between the urban built-up area and the rural area based on land cover data [40]. By subtracting the average surface temperature during the day and night in urban areas from that in rural areas each year, we can get the approximate intensity distribution of the urban heat island effect during the day and the night. The larger the value, the greater the intensity of the urban heat island effect.
- DEM terrain data come from SRTM (https://www.earthdata.nasa.gov/sensors/srtm, accessed on 11 June 2024), with a resolution of 30 m.
- Impervious ground data come from GlobeLand 30 (https://www.webmap.cn/commres.do?method=globeIndex, accessed on 15 June 2024), with a resolution of 30 m.
- E-obs can provide annual European precipitation grid data, as well as daily maximum temperature (T_max) and minimum temperature (T_min), but the resolution is 1°, which is very large (https://surfobs.climate.copernicus.eu/dataaccess/access_eobs.php, accessed on 19 June 2024). Therefore, we used the kriging interpolation method based on the E-obs data to reconstruct the relevant climate map of the BMR with a resolution of 1 km [41].
- The night light data are divided into two parts. The data from 1992 to 2013 come from DMSP data with a resolution of 30 arc seconds and a numerical range of 0–63. The night light data after 2013 are provided by VIIRS with a resolution of 15 arc seconds, which is more accurate and very different from DMSP. In the previous work of the authors, the two datasets were calibrated and unified using the stepwise calibration method, which will not be repeated here [42].
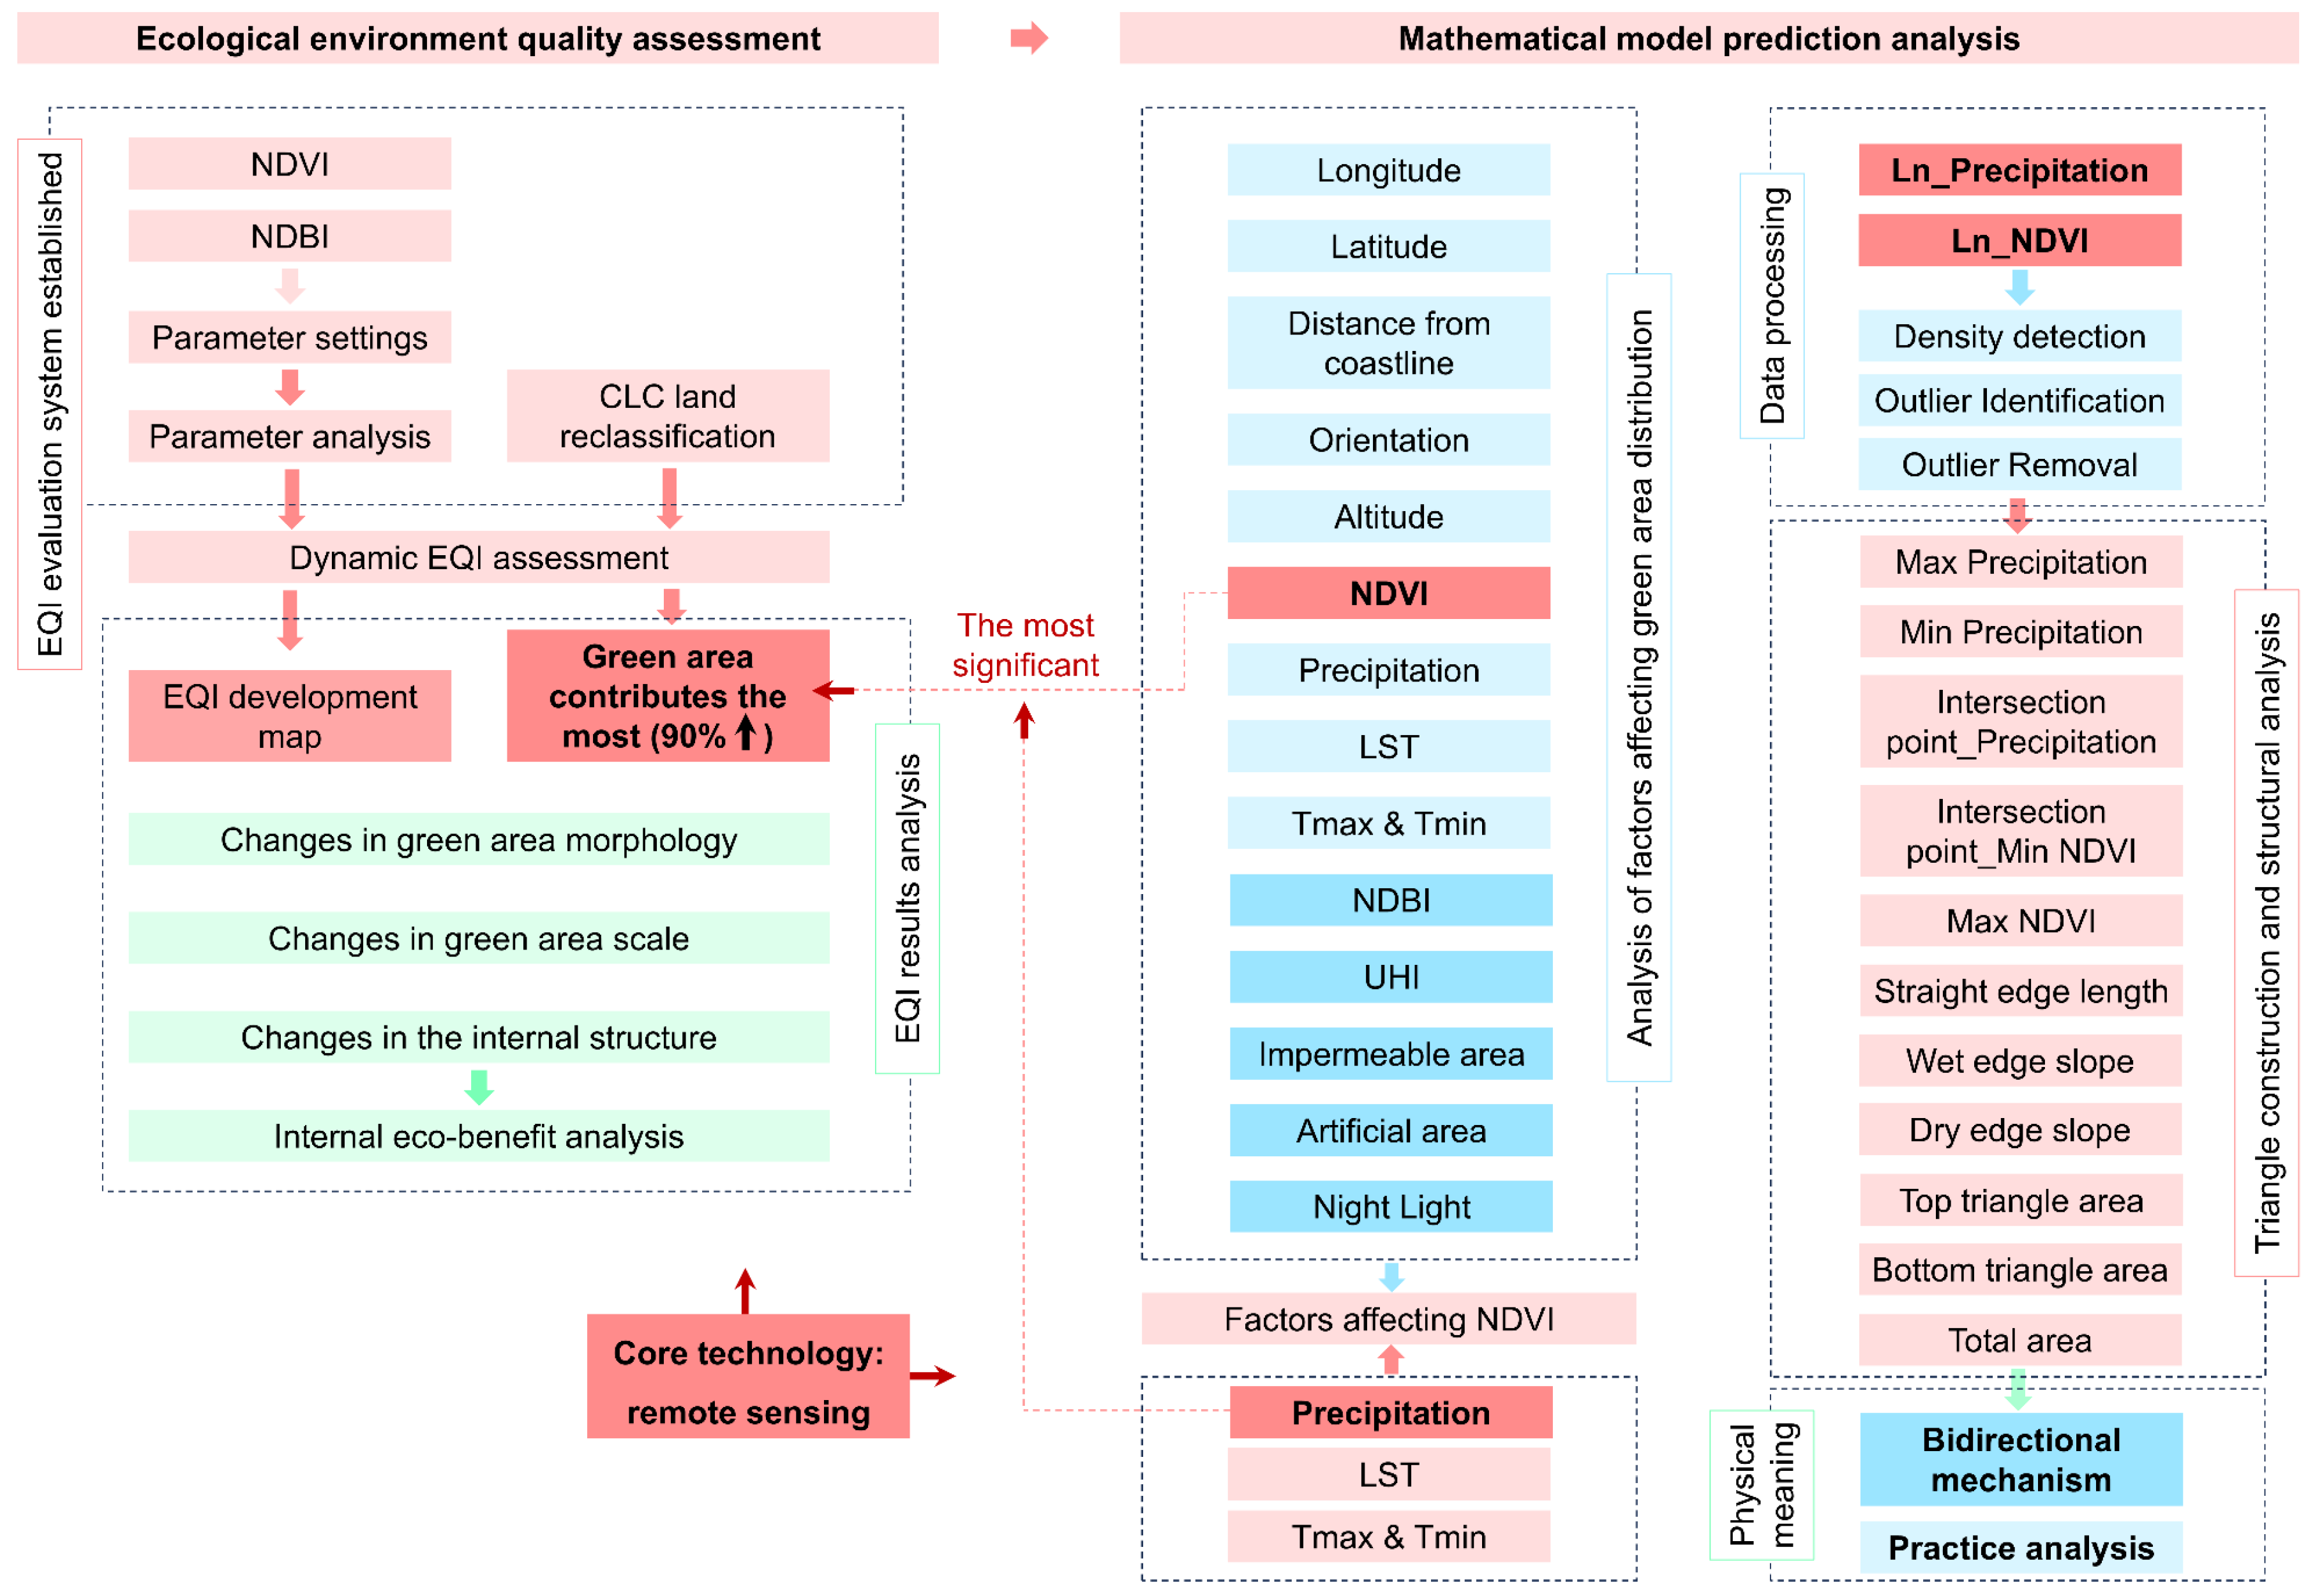
2.3. Methodology
- 1
- First of all, to evaluate the Ecological Environment Quality Index (EQI) of the BMR, we needed to achieve the following aspects.
- For the convenience of analysis, we classified the land-use coverage of the BMR according to the land type classification of CLC [16].
- Then, we extracted the difference (NDVIaverage-NDBIaverage) of the annual average values of NDVI and NDBI for each type of land in 2006, 2012, and 2018 after reclassification.
- Secondly, set the EQI evaluation parameters. For each year, we homogenized the difference results obtained in the previous step using Formula (1), setting the minimum value of each year to 0 and the maximum value to 1 as the evaluation parameter (Ei) of ecological environmental quality.
- Finally, I evaluated the BMR’s annual EQI index based on Formula (2).
- It is important to pay attention to the land-use types that have a greater impact on or contribution to the evaluation results when evaluating the ecological environment quality of urban areas. Land use is the key to controlling the ecological quality of the BMR.
- In addition, we also needed to draw the distribution map of the annual evaluation results of the ecological environment quality index of the BMR and the change map of the results from 2006 to 2018 to analyze the distribution and evolution direction of the ecological quality of the BMR from a spatial perspective.
- 2
- Then, we needed to study the relationship between the key land-use distribution and various possible influencing factors that affect the assessment results. We have reviewed numerous relevant studies and compiled various data on green space distribution, which are presented in Table 1 [5,43,44]. After obtaining the above data, we established a 1km grid within the BMR range, extracted the proportion of key land-use area in the grid each year as the dependent variable, and established an OLS model to analyze their importance.
- 3
- Having established a clear interaction between NDVI and the distribution of key land uses that influence EQI assessment results, it is necessary to analyze the climatic factors affecting NDVI to uncover the indirect impacts of climate change on ecological quality. For this purpose, a climate database spanning 2000 to 2023 was developed, with the annual average NDVI as the dependent variable and multiple climate data as explanatory variables. The strength of the correlations between these variables was then analyzed.
- 4
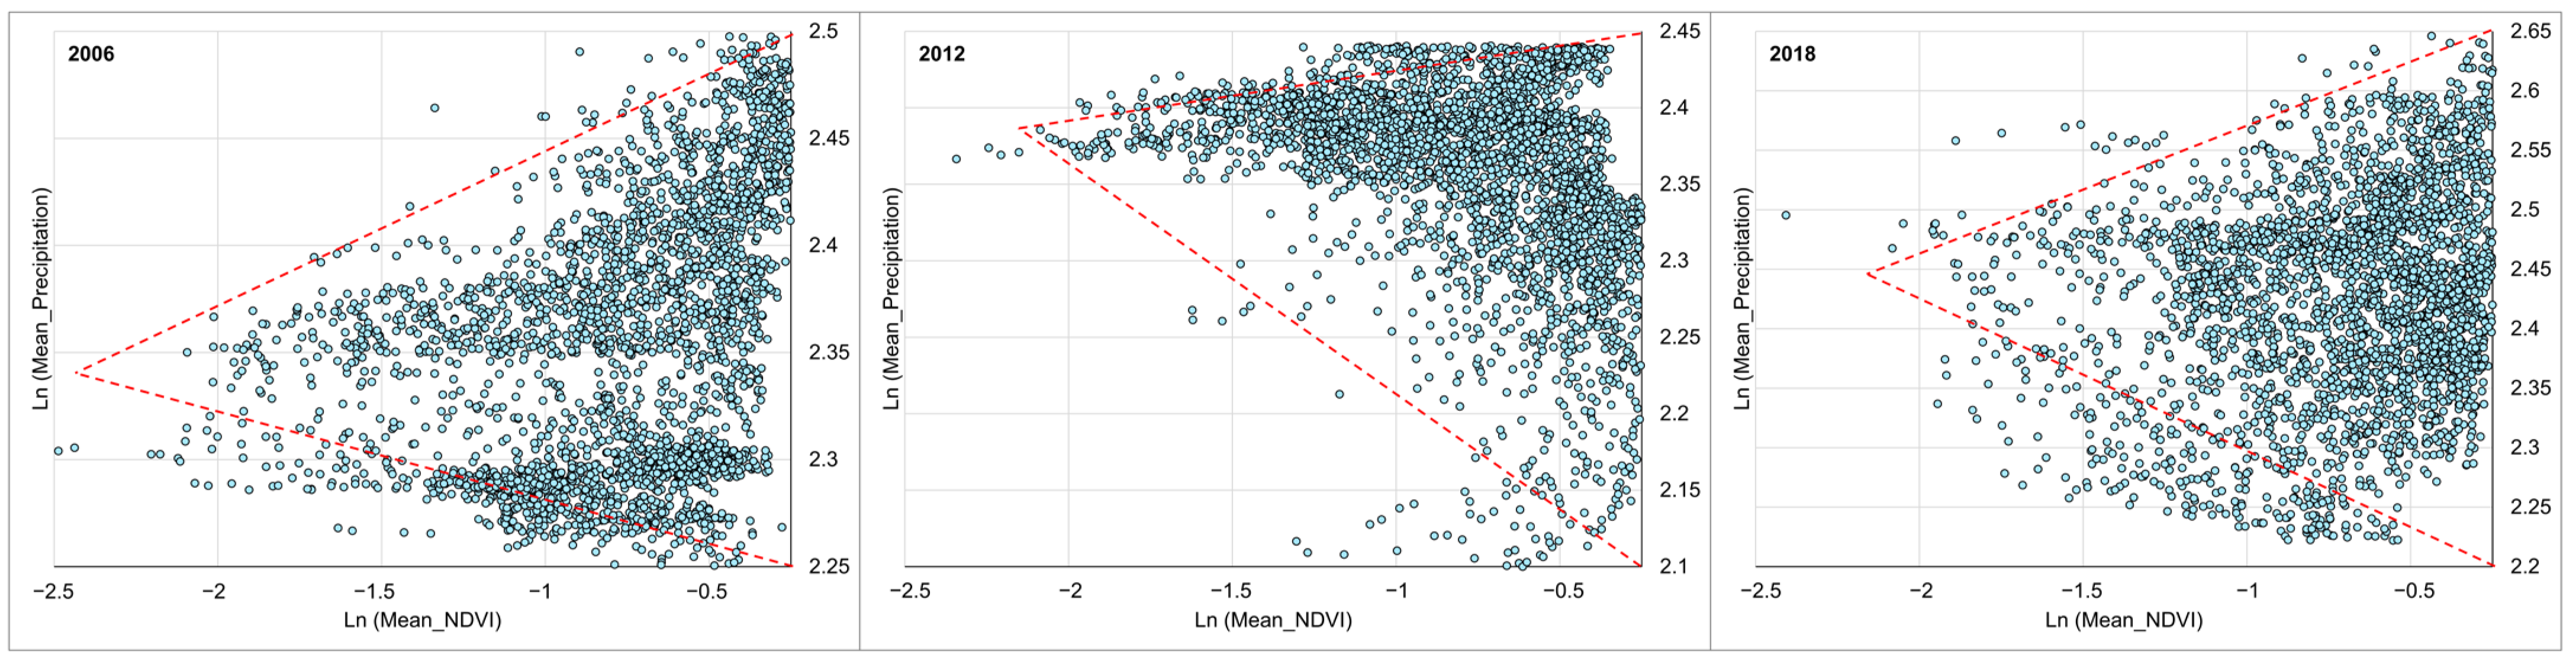
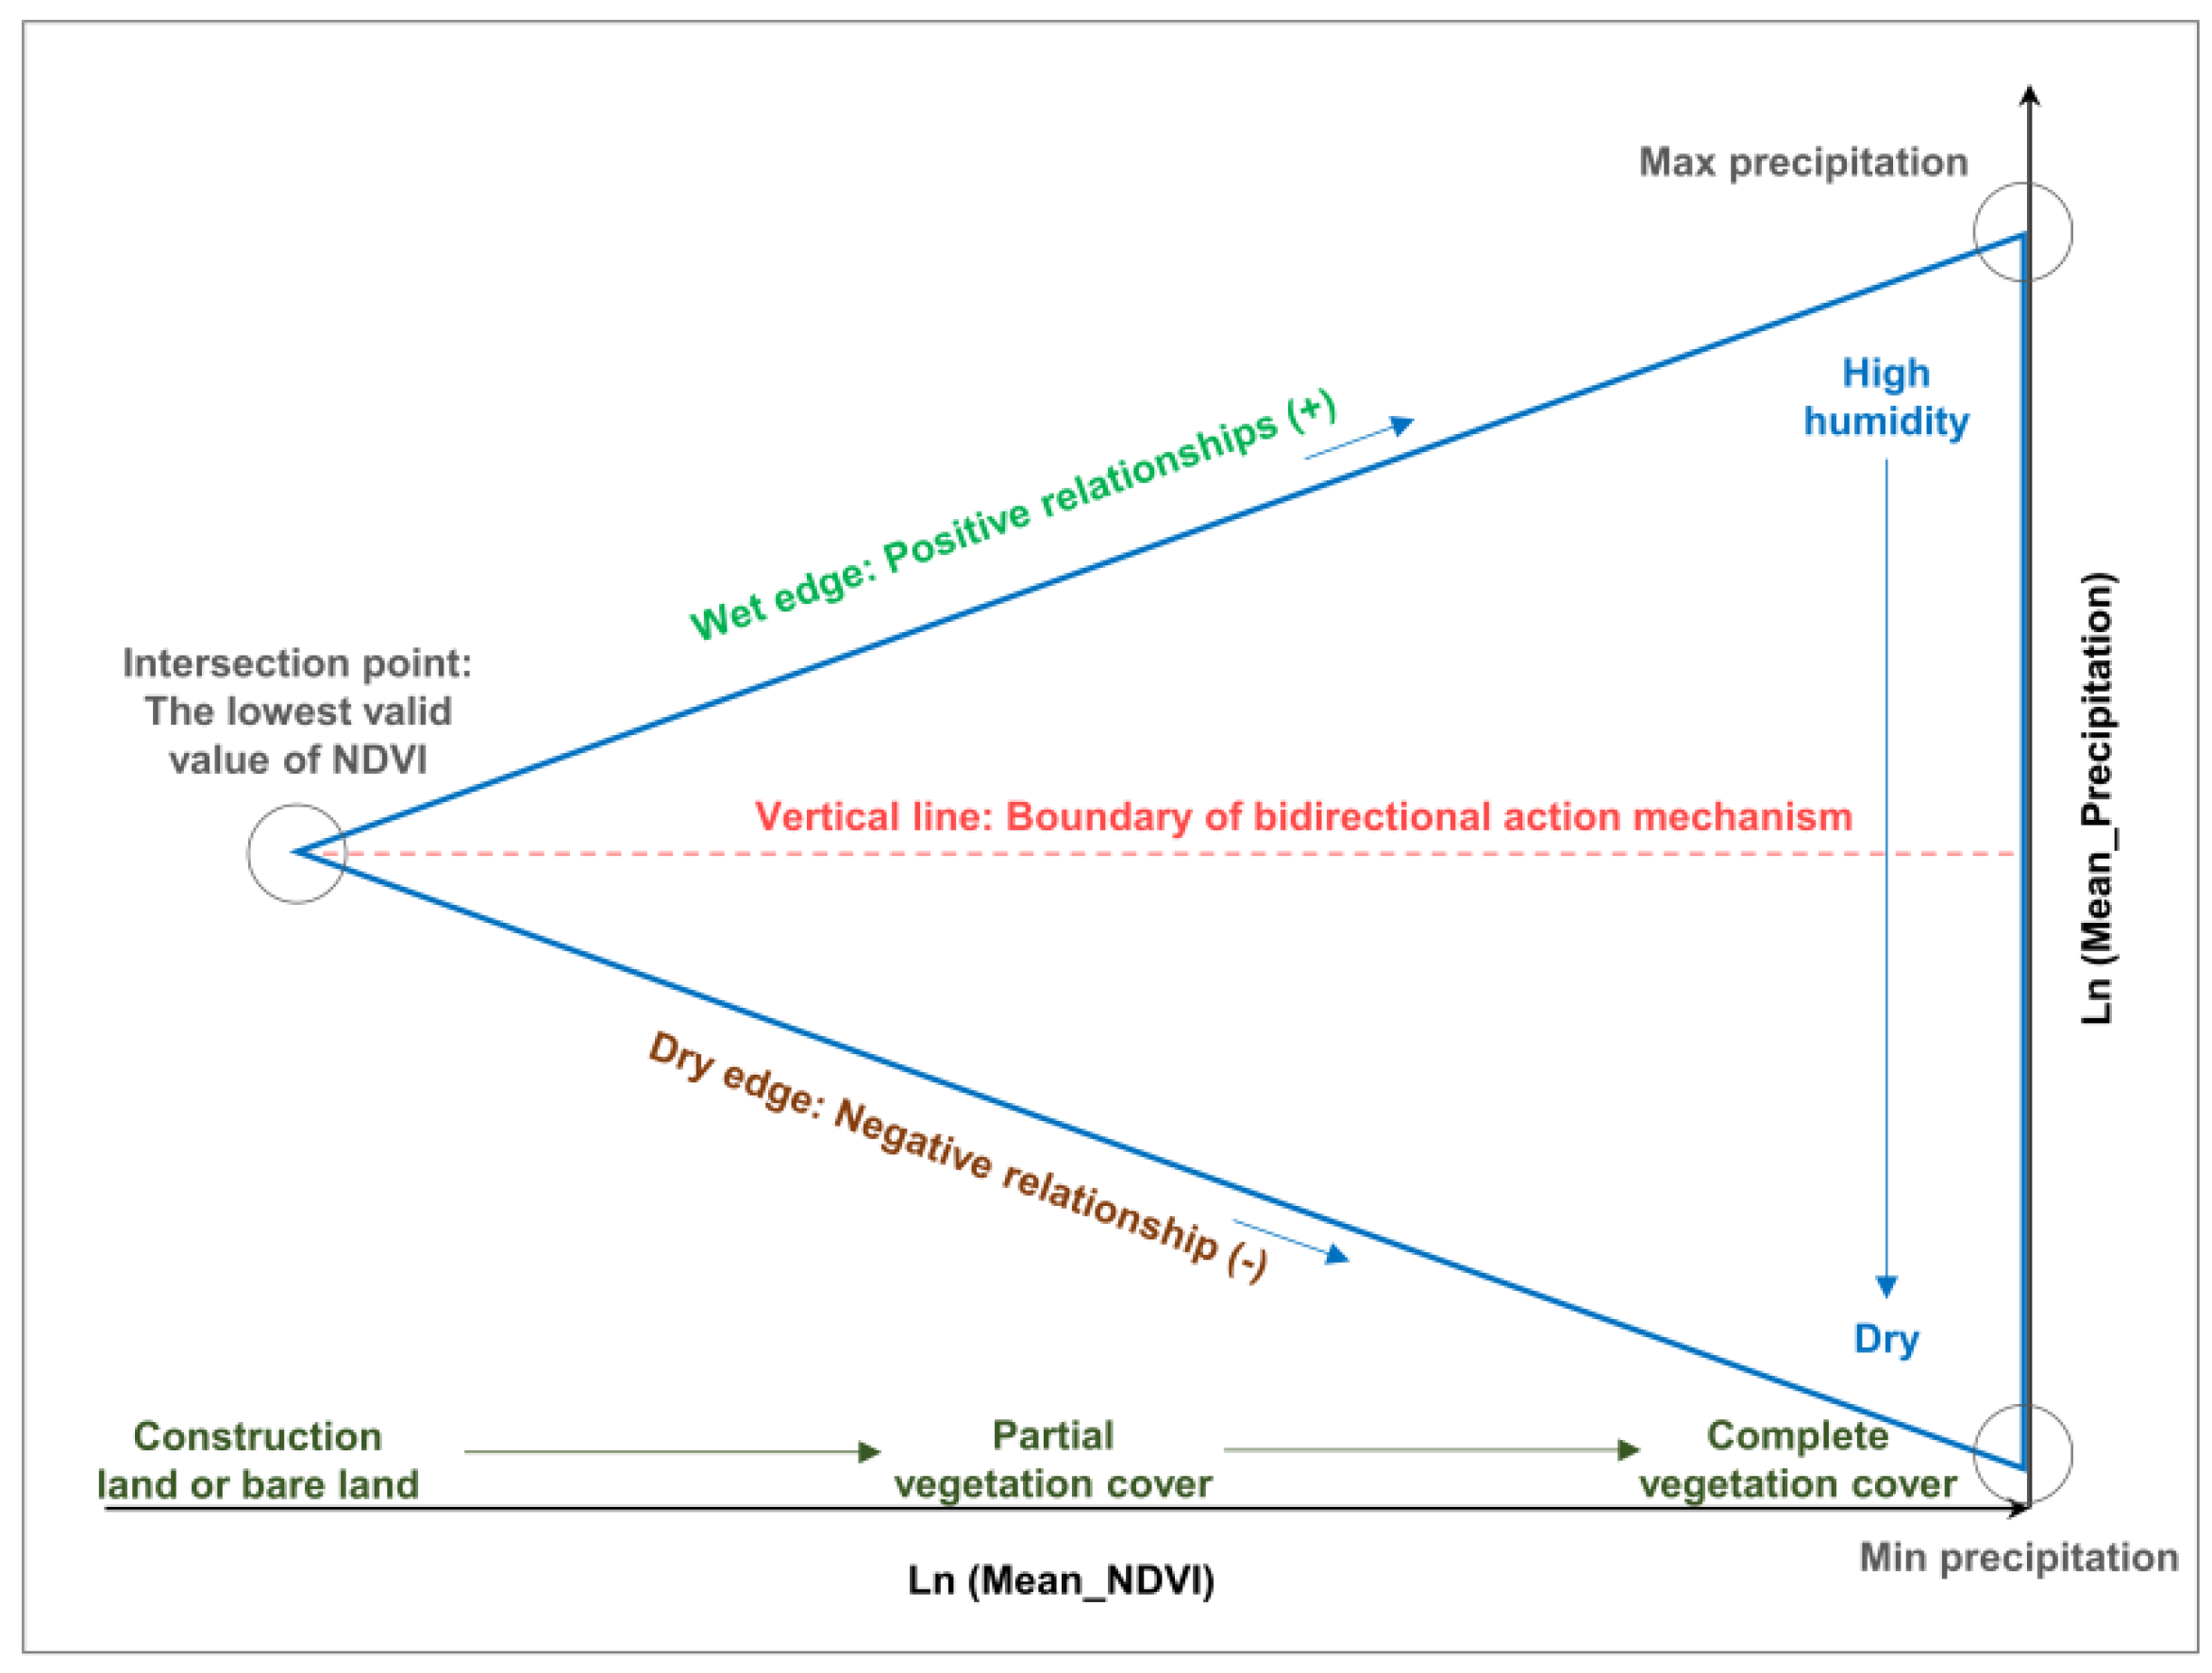
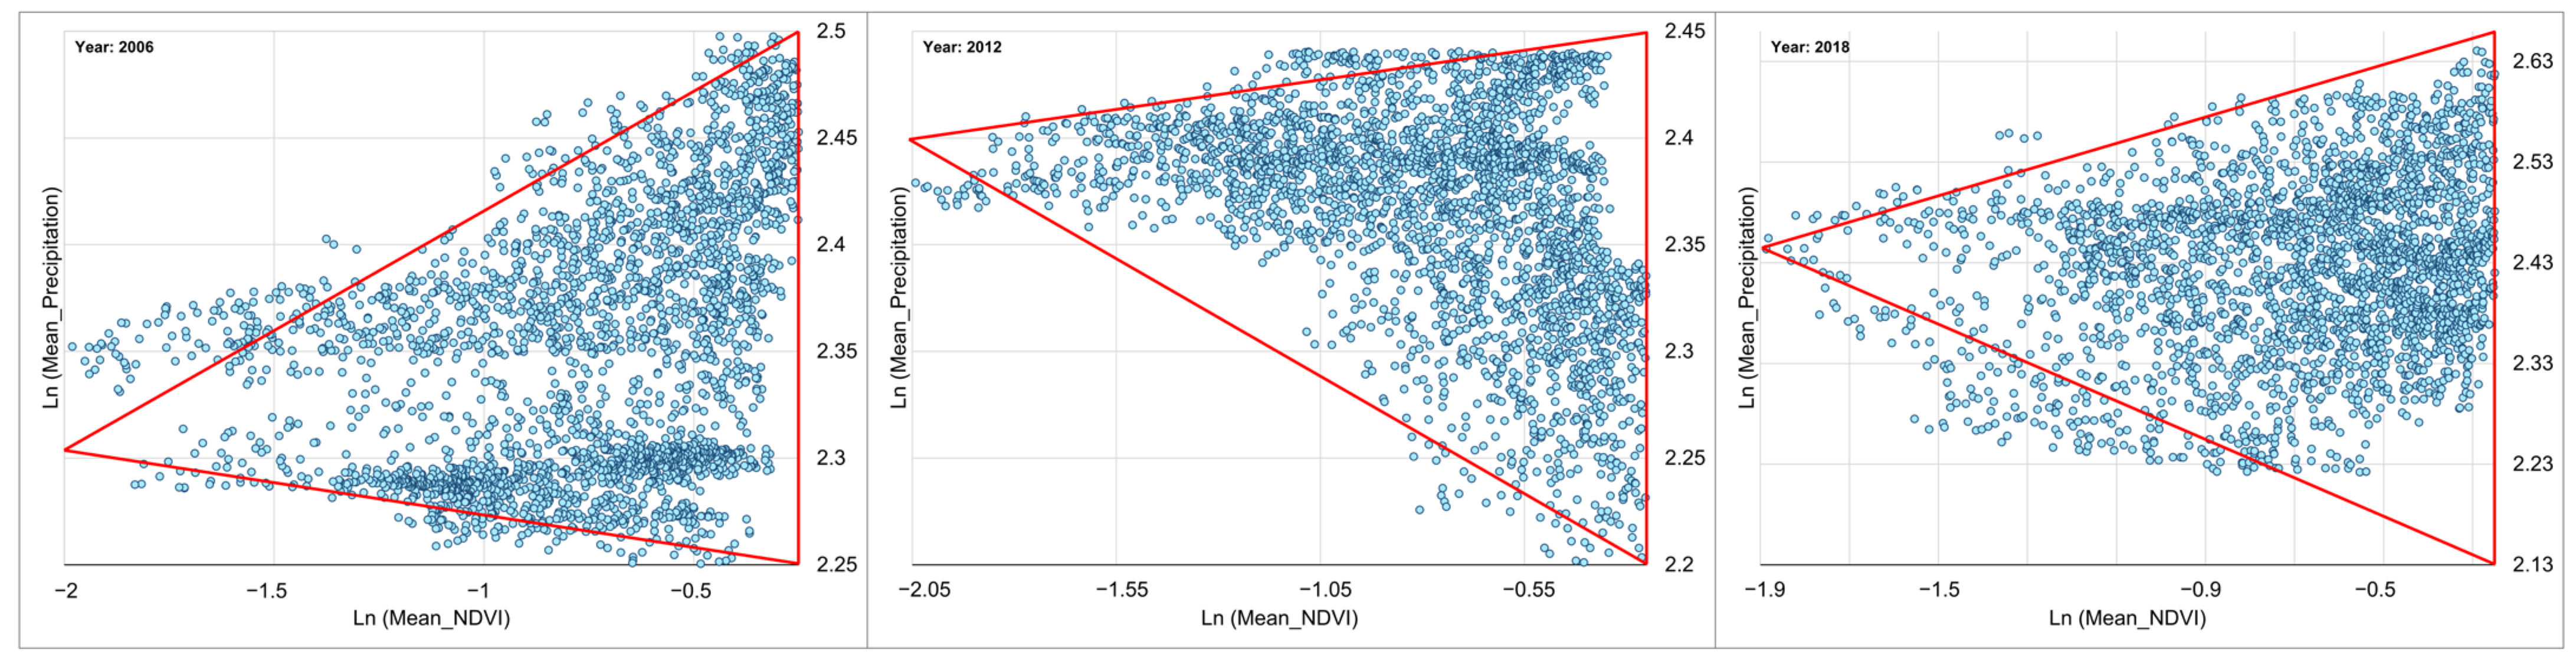
- In a previous study, the authors identified precipitation as a highly complex controlling factor [25], with a strong, yet unresolved, interaction with NDVI. However, this intricate relationship proves challenging to elucidate using conventional regression models [45]. To address this, we employed the precipitation/NDVI characteristic triangle space as an analytical framework to explore the underlying mechanism [46,47,48].
- Firstly, for each year, a precipitation/NDVI scatter plot was established. In order to facilitate the analysis of the physical meaning of each side of the triangle, we used NDVI as the X-axis and precipitation as the Y-axis. Since the numerical ranges of the two values are quite different, the spatial characteristics of the established scatter plot are not obvious, so we calculated the Ln log function for both NDVI and precipitation [49].
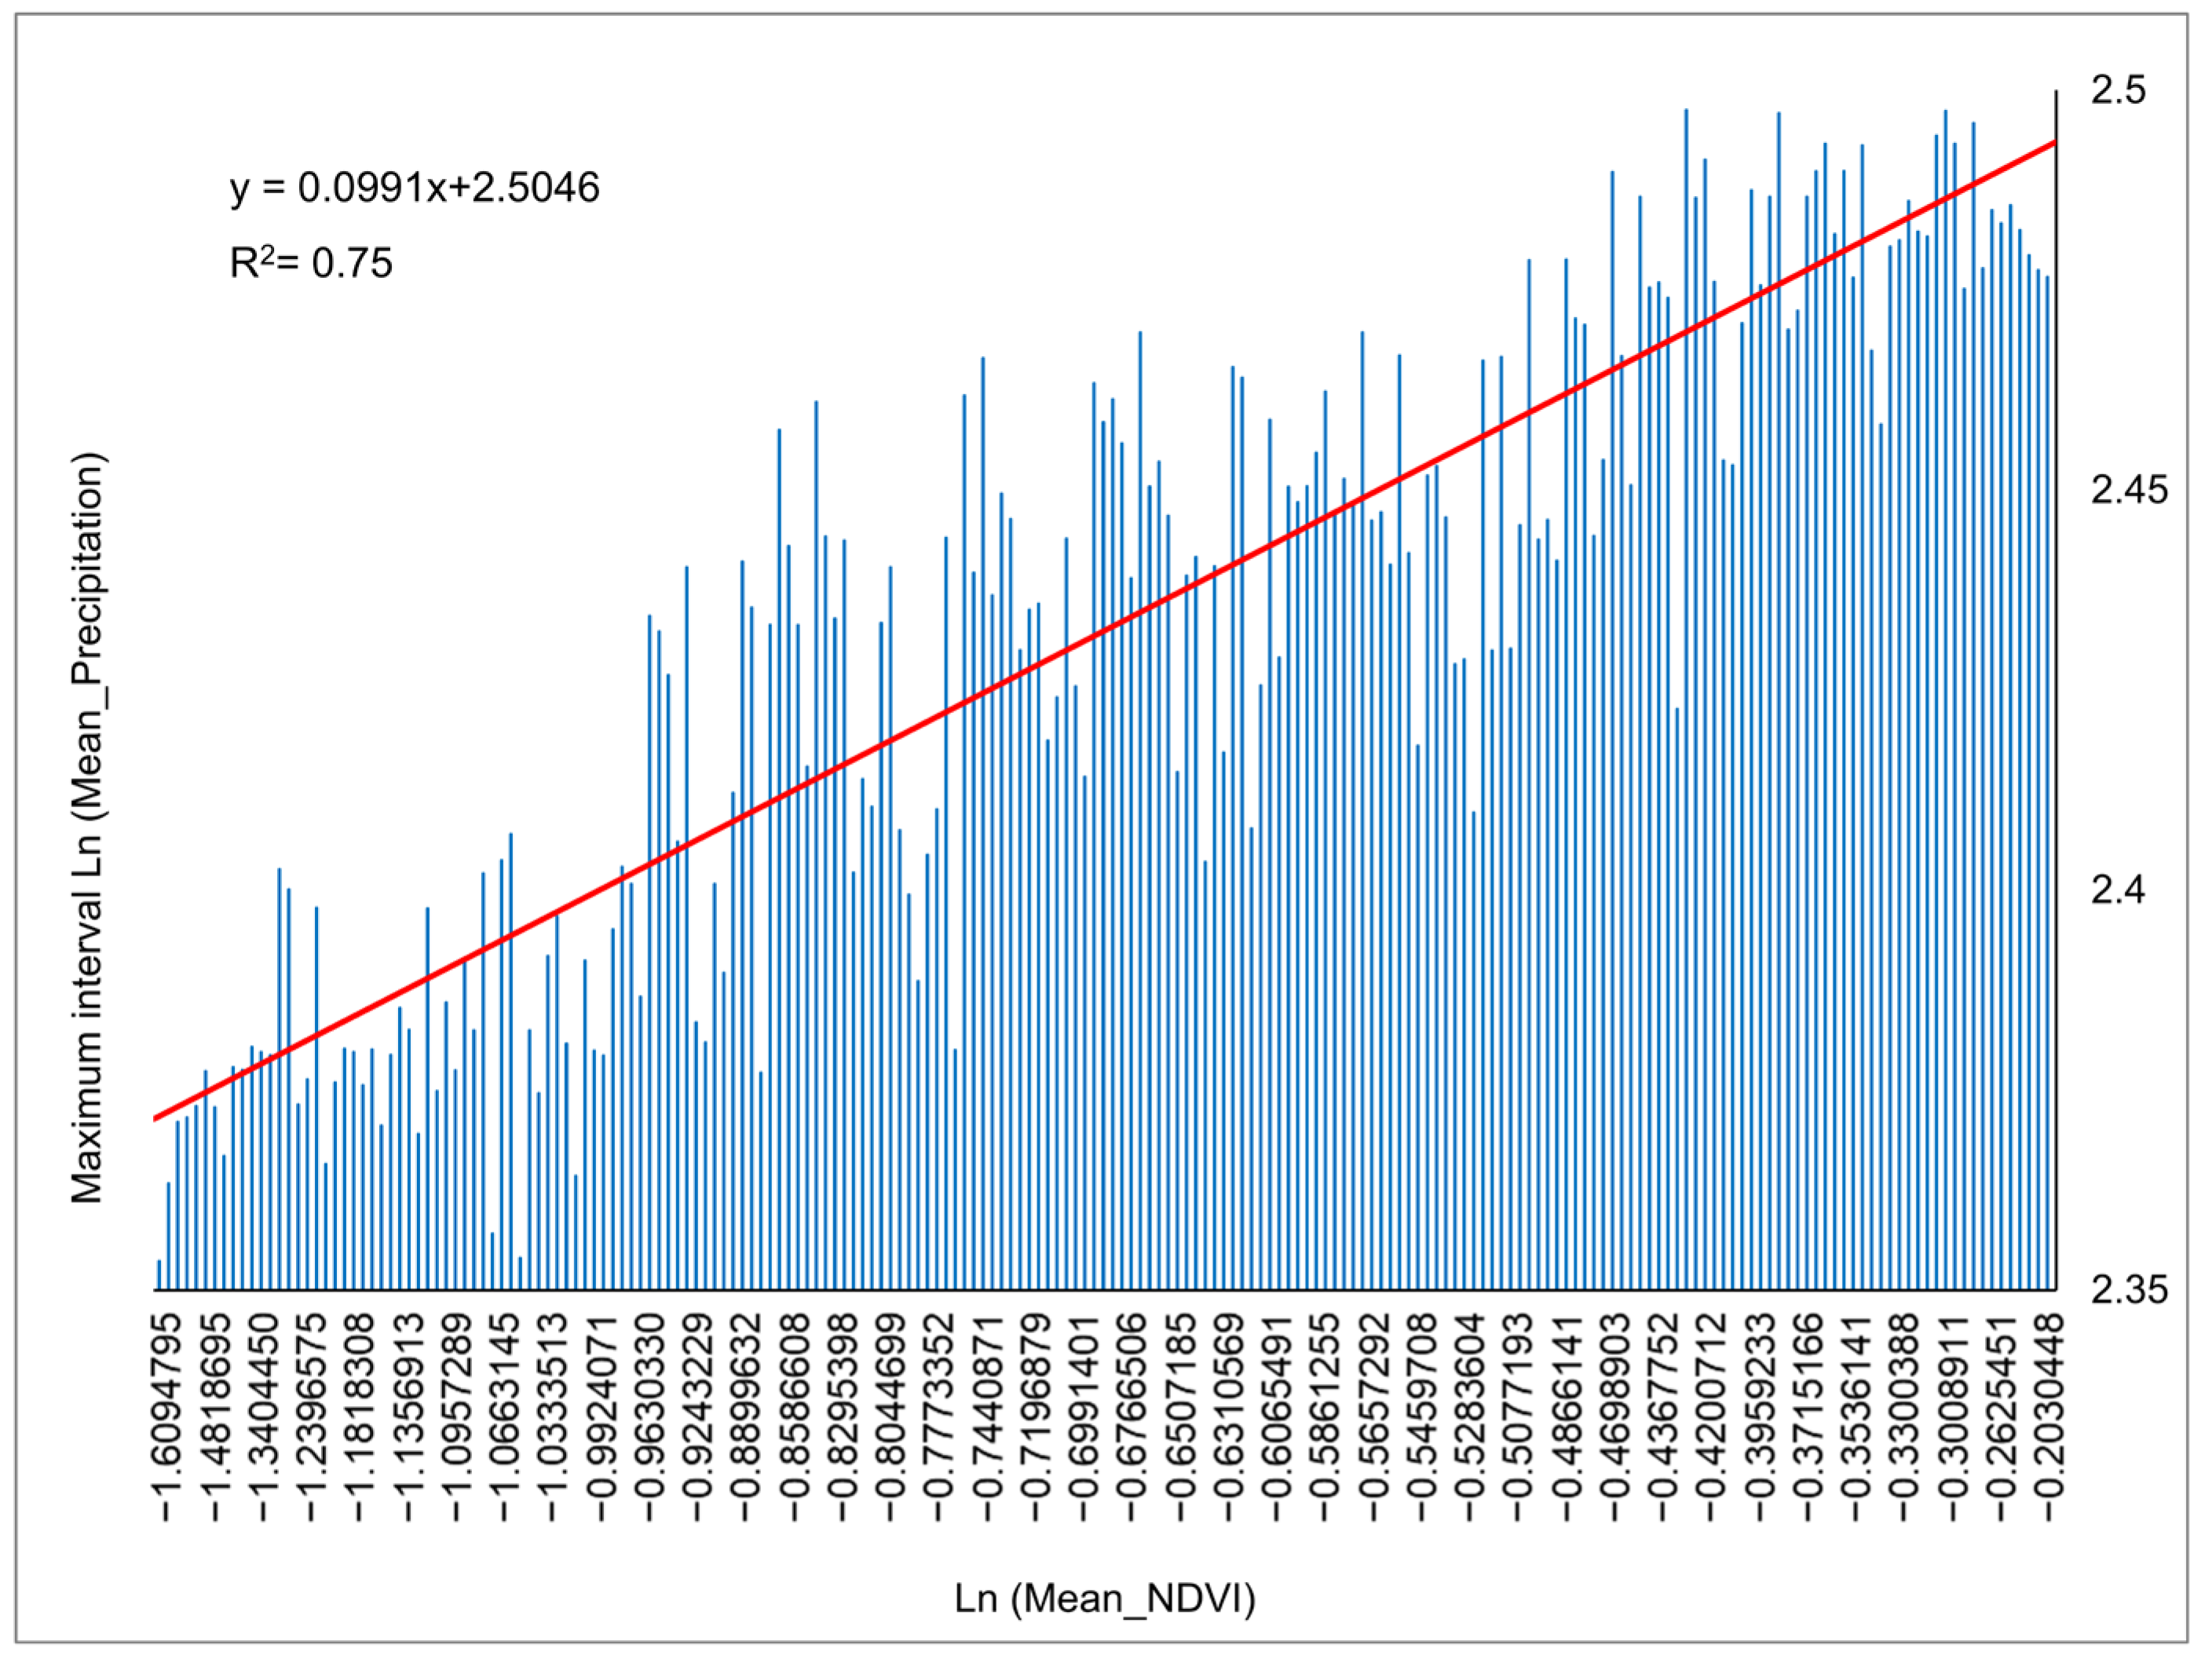
- After removing the abnormal outliers, we can determine the sides of the characteristic triangle. The maximum NDVI value among the retained scattered points will be used as the straight edge. For the hypotenuse, we use 0.01 as a minimum interval and find the maximum and minimum precipitation values in each interval. Then, use the least squares method to perform a linear fit with Equation (3) to obtain the hypotenuse of the triangle [46].
- Finally, after completing the most critical triangle fitting, we can use remote sensing technology to analyze the physical meaning of each side of the precipitation/NDVI characteristic triangle and the space and further analyze the relationship between NDVI and precipitation. This allows us to indirectly understand the impact of precipitation on the green space system.
3. Results
3.1. BMR Ecological Environment Quality Assessment
3.1.1. Green Area Is the Key Land Use That Provides Ecological Benefits
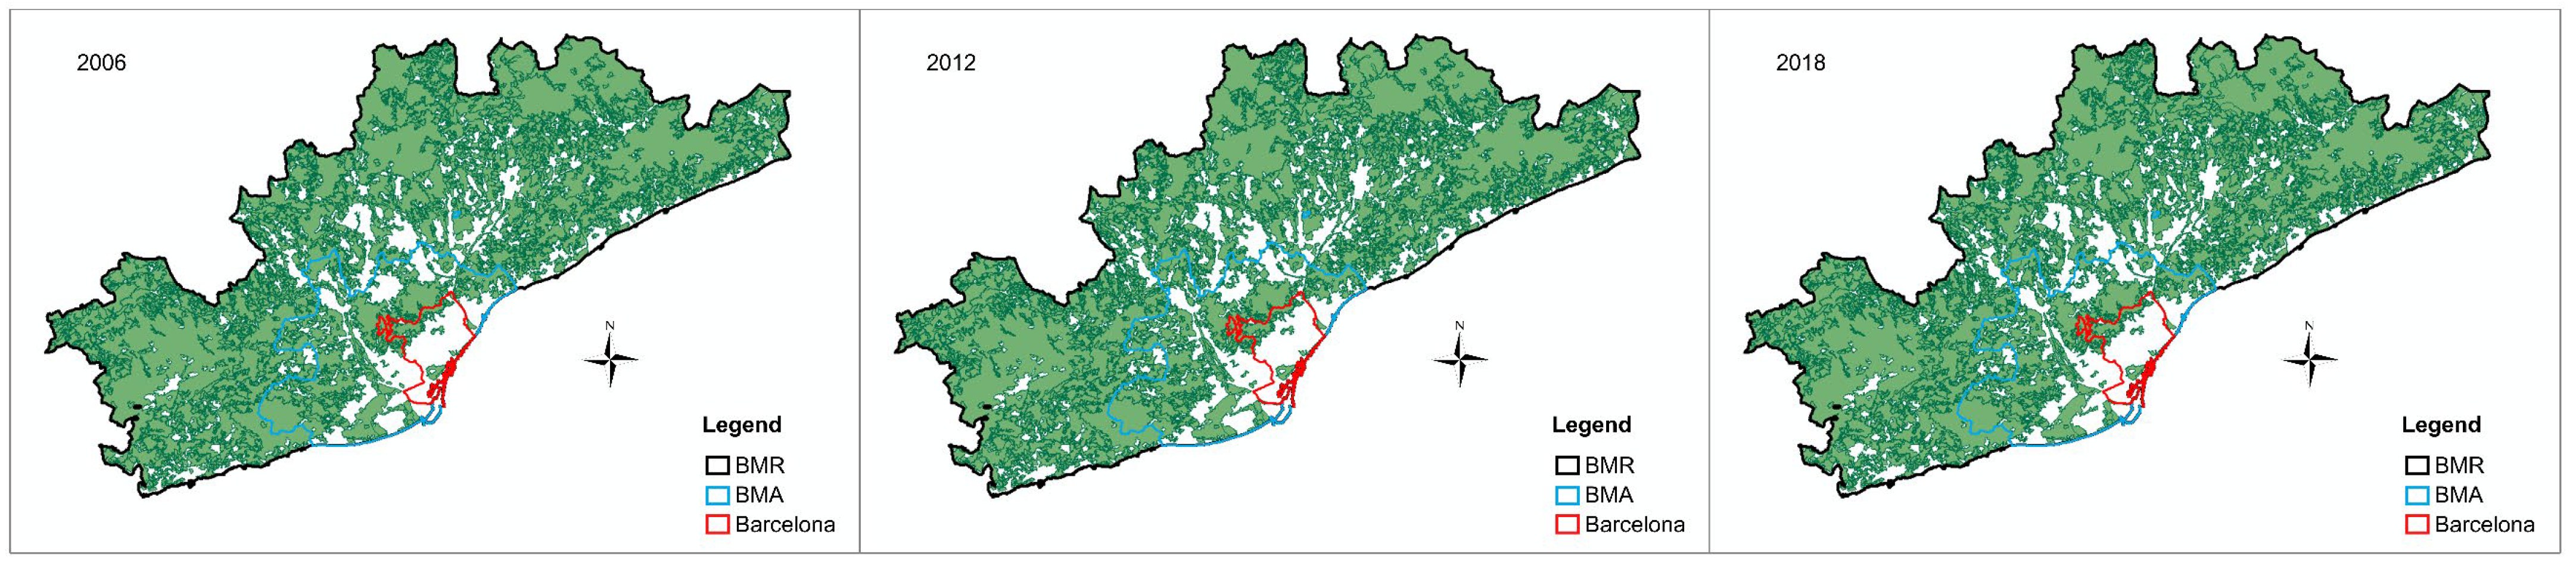
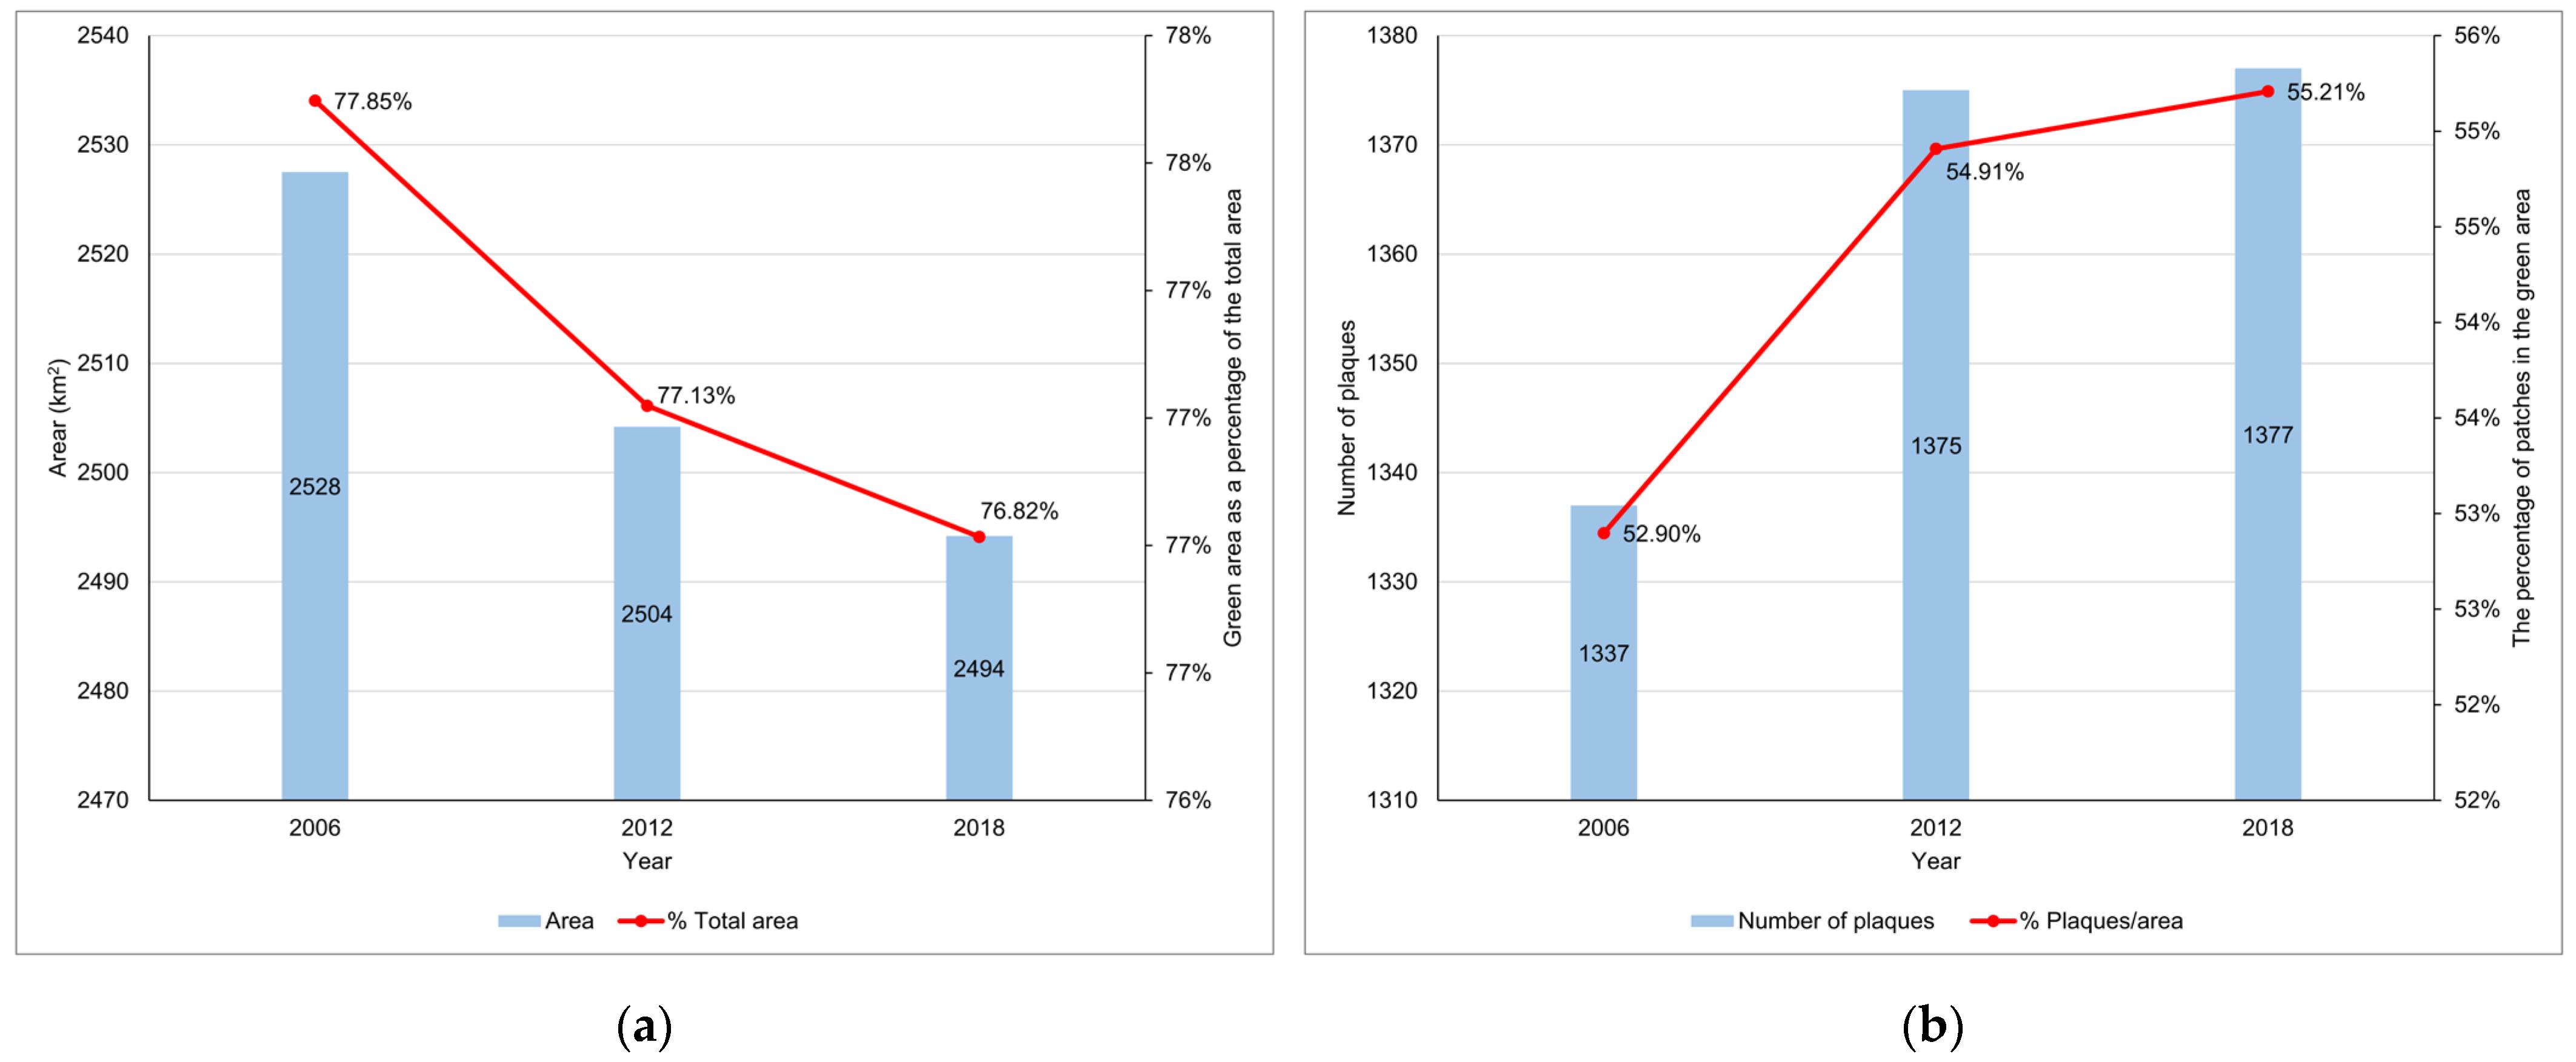
3.1.2. The Green Area Is Shrinking but Becoming More Fragmented
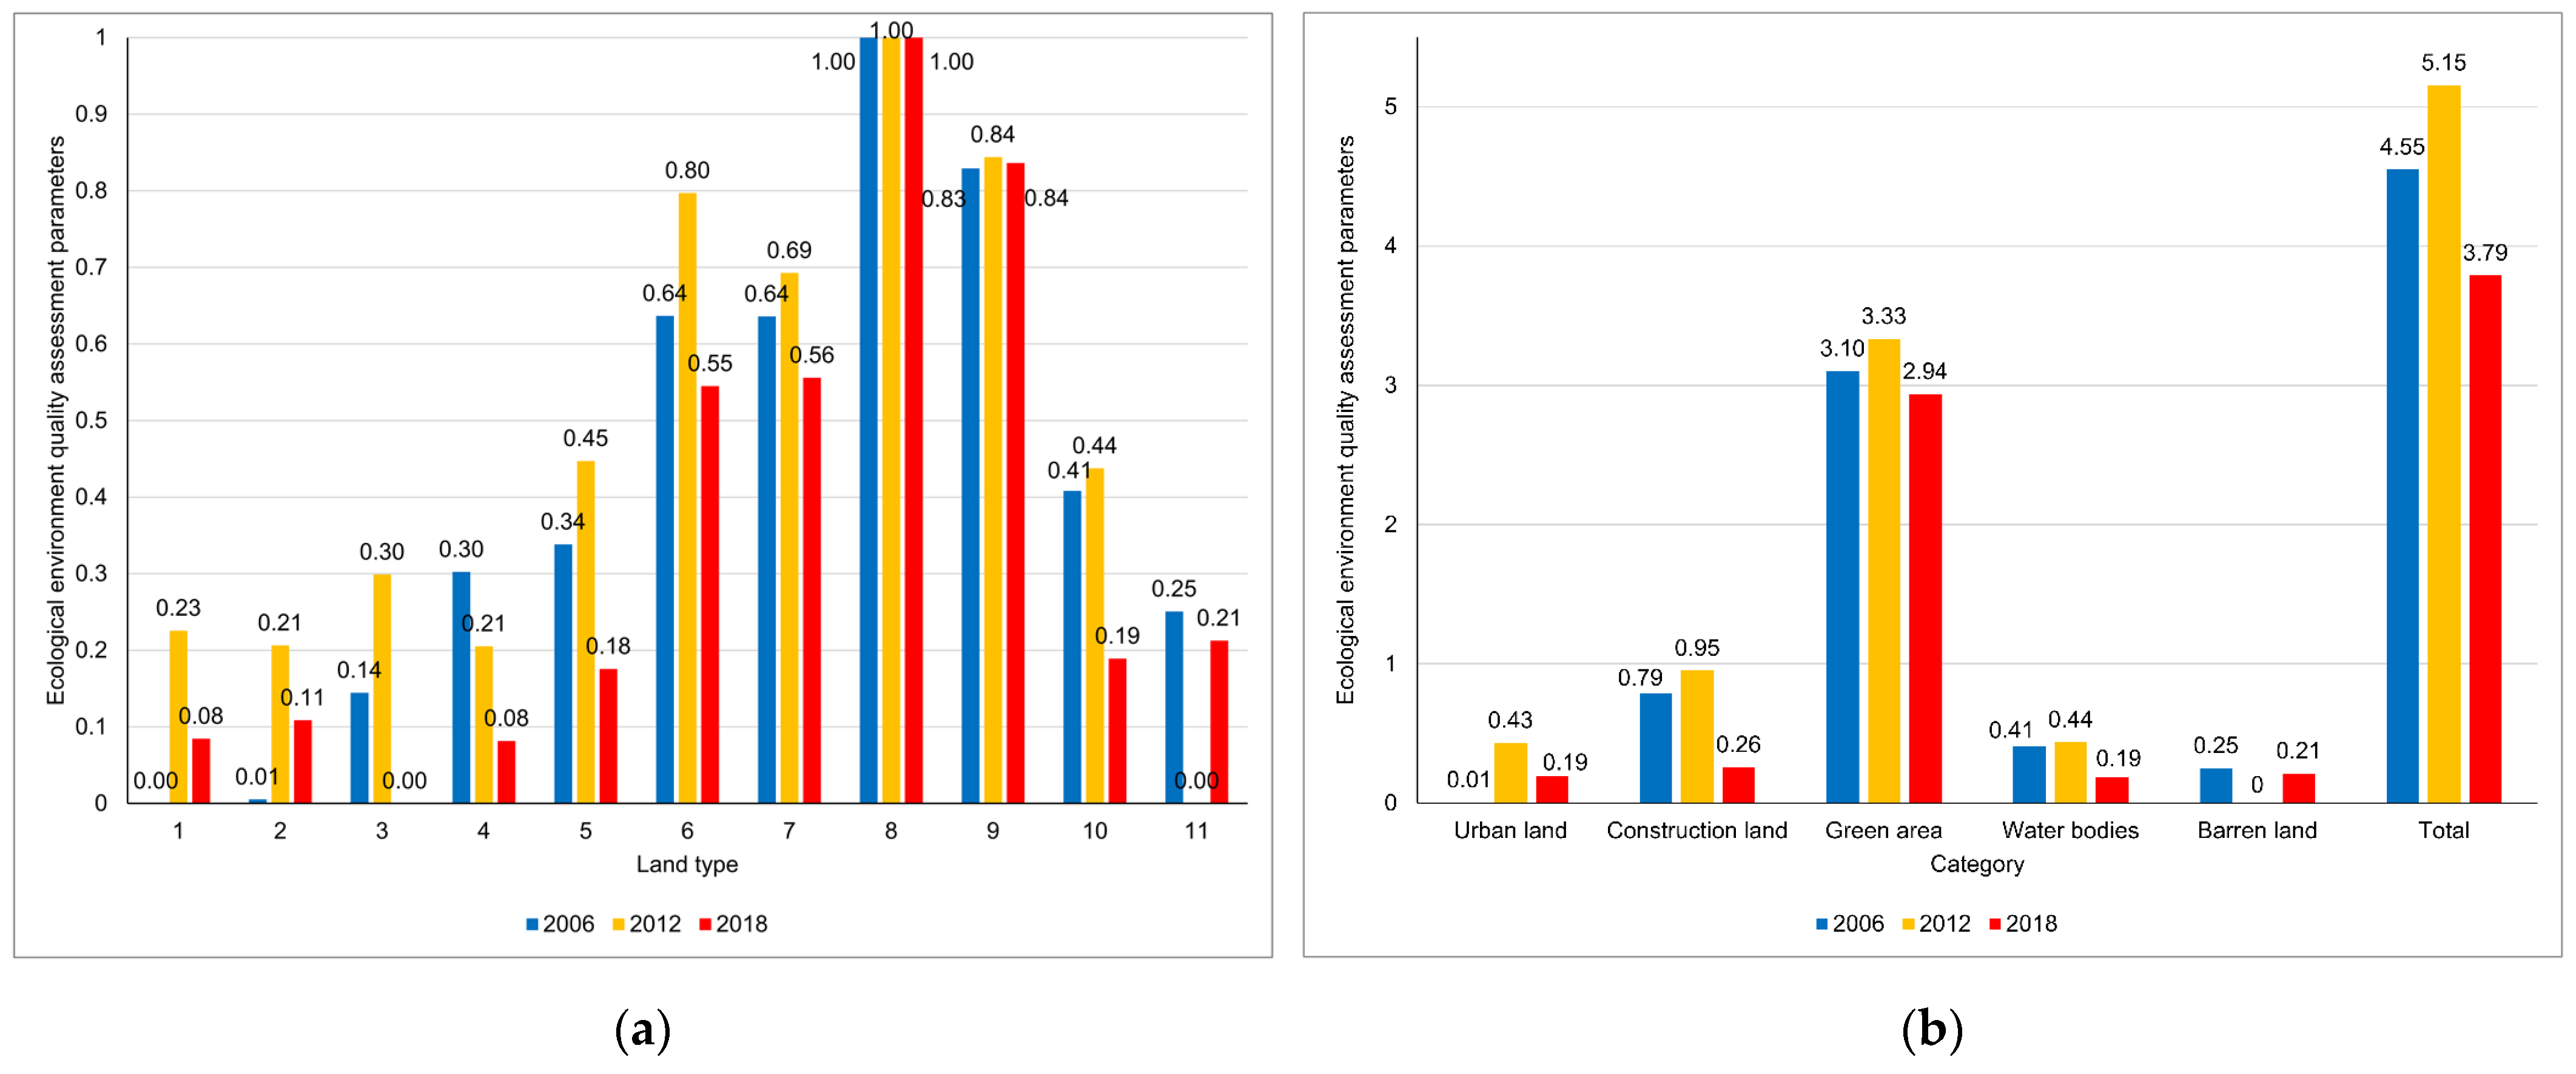
3.1.3. The Ecological Quality Results of the BMR Are Generally Appreciable, with Green Area Making the Largest Contribution
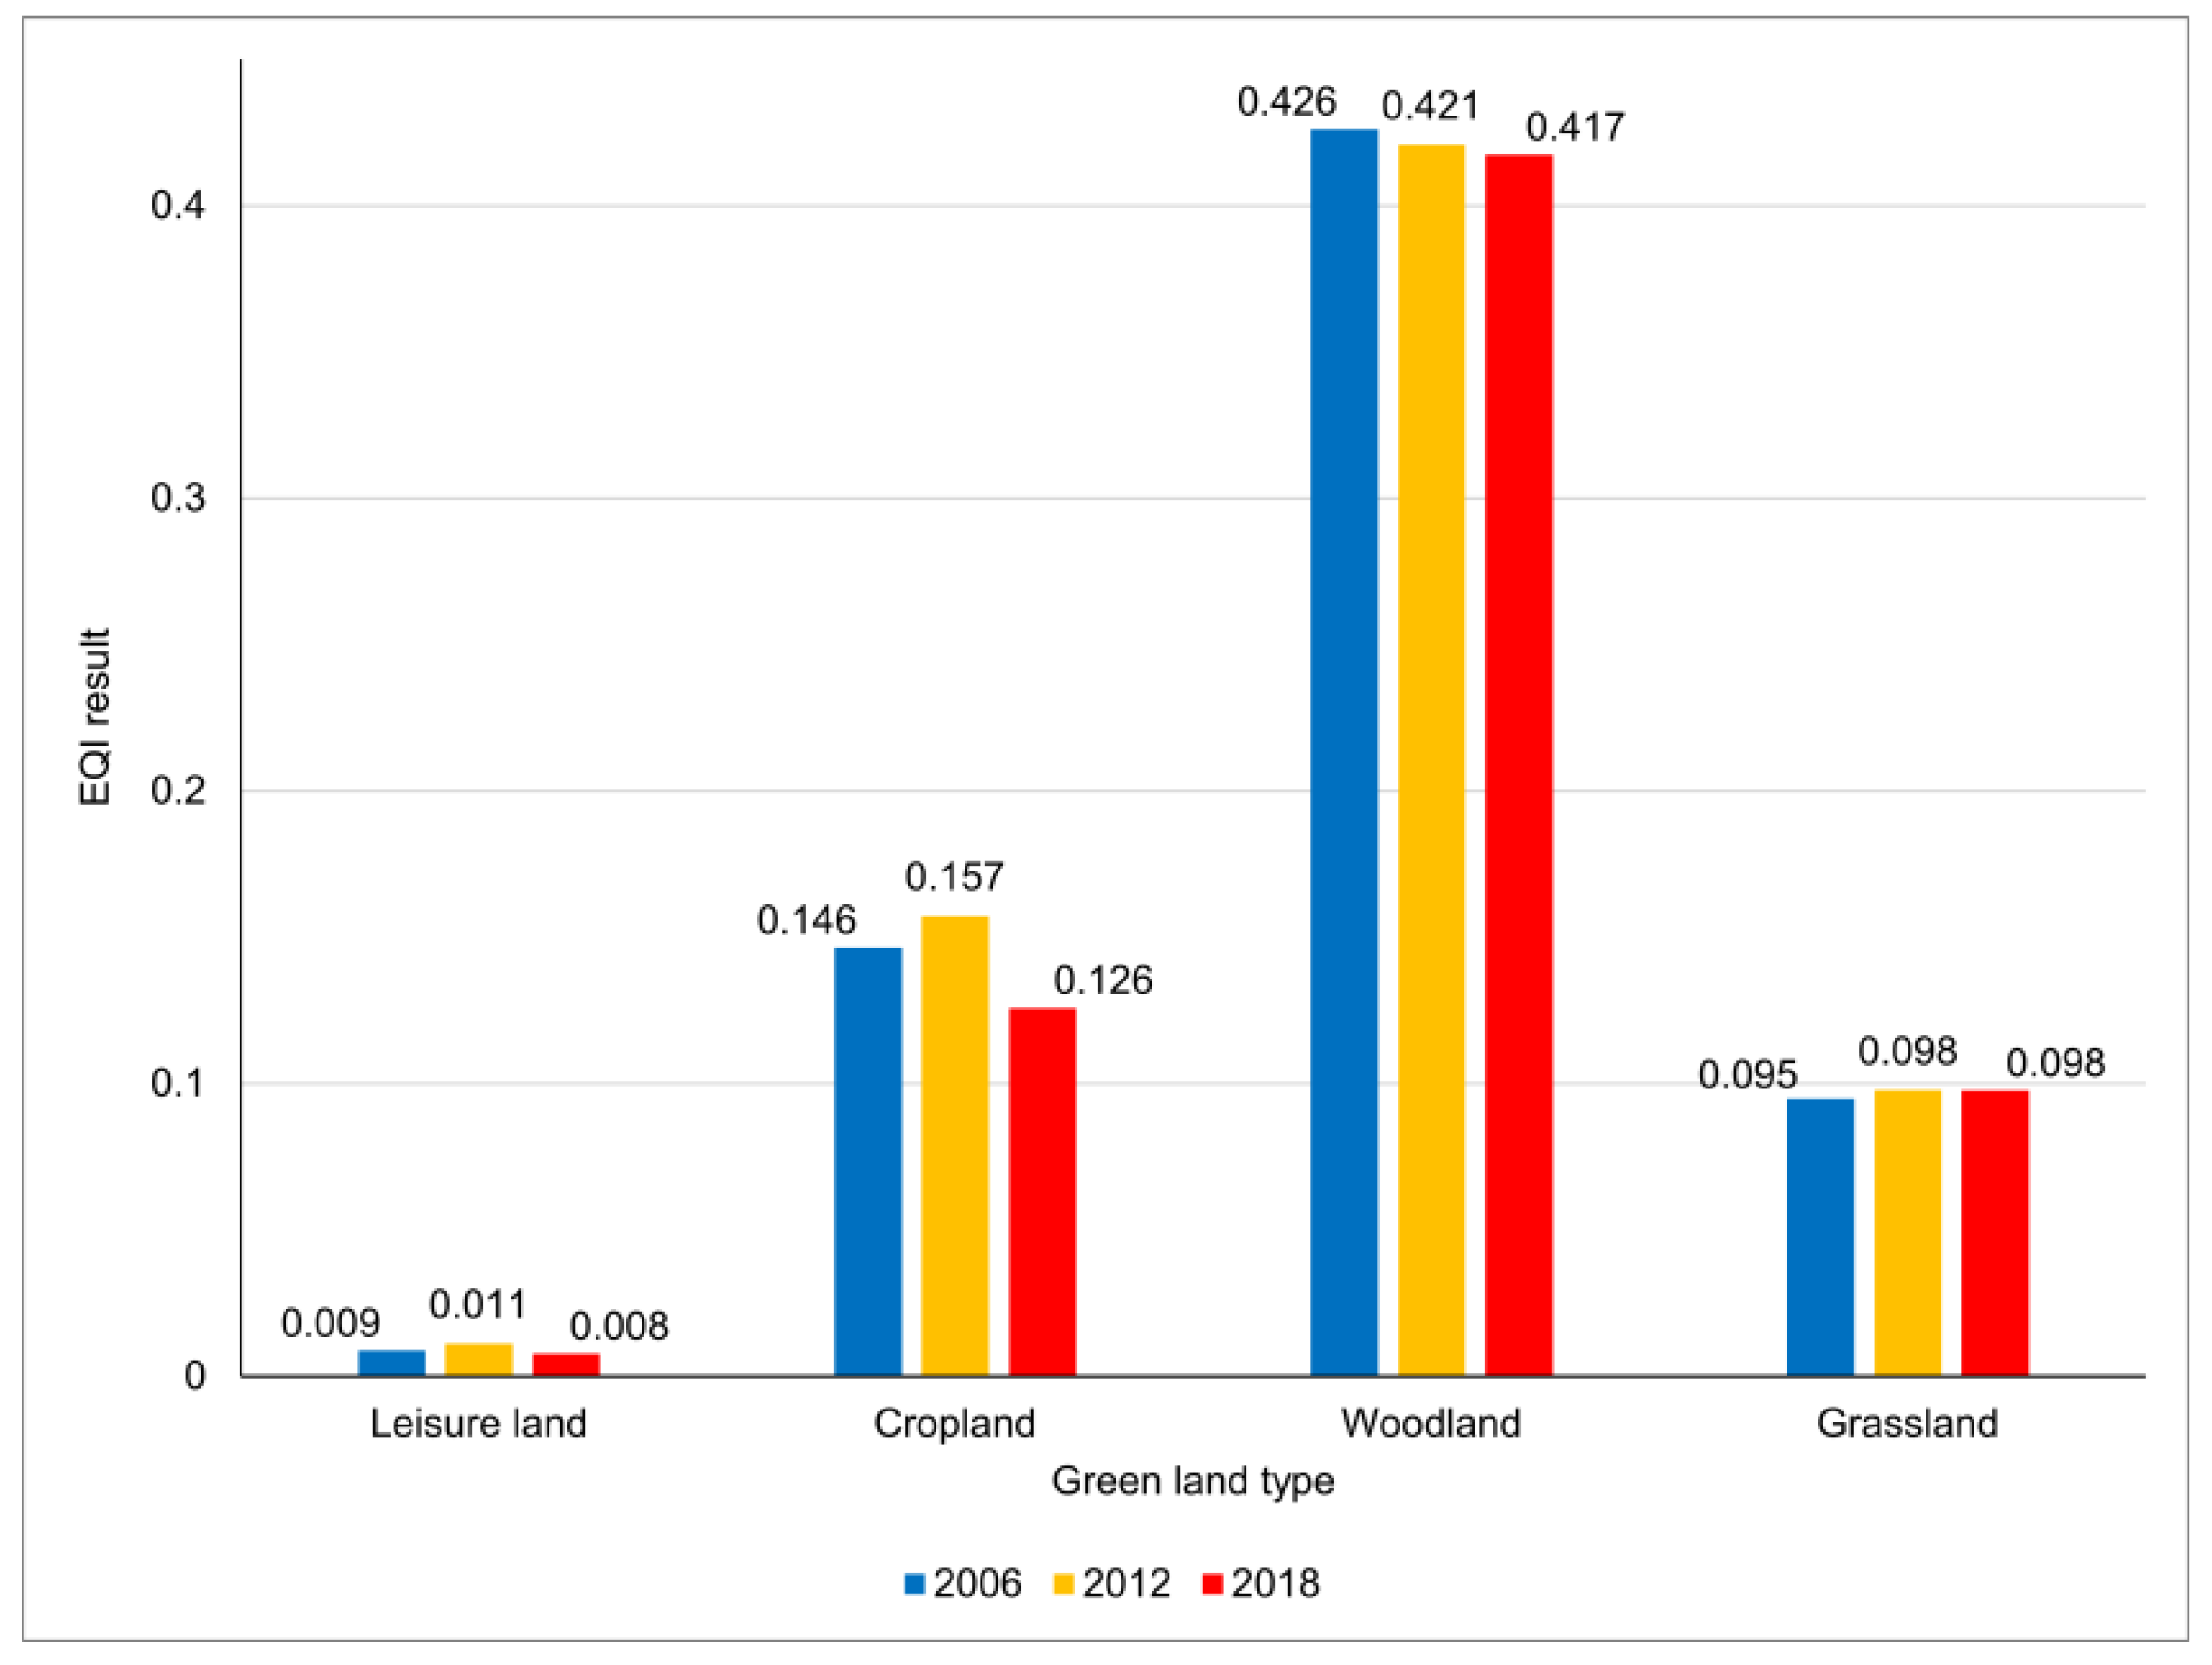
3.1.4. The EQI of Forests Cannot Be Ignored
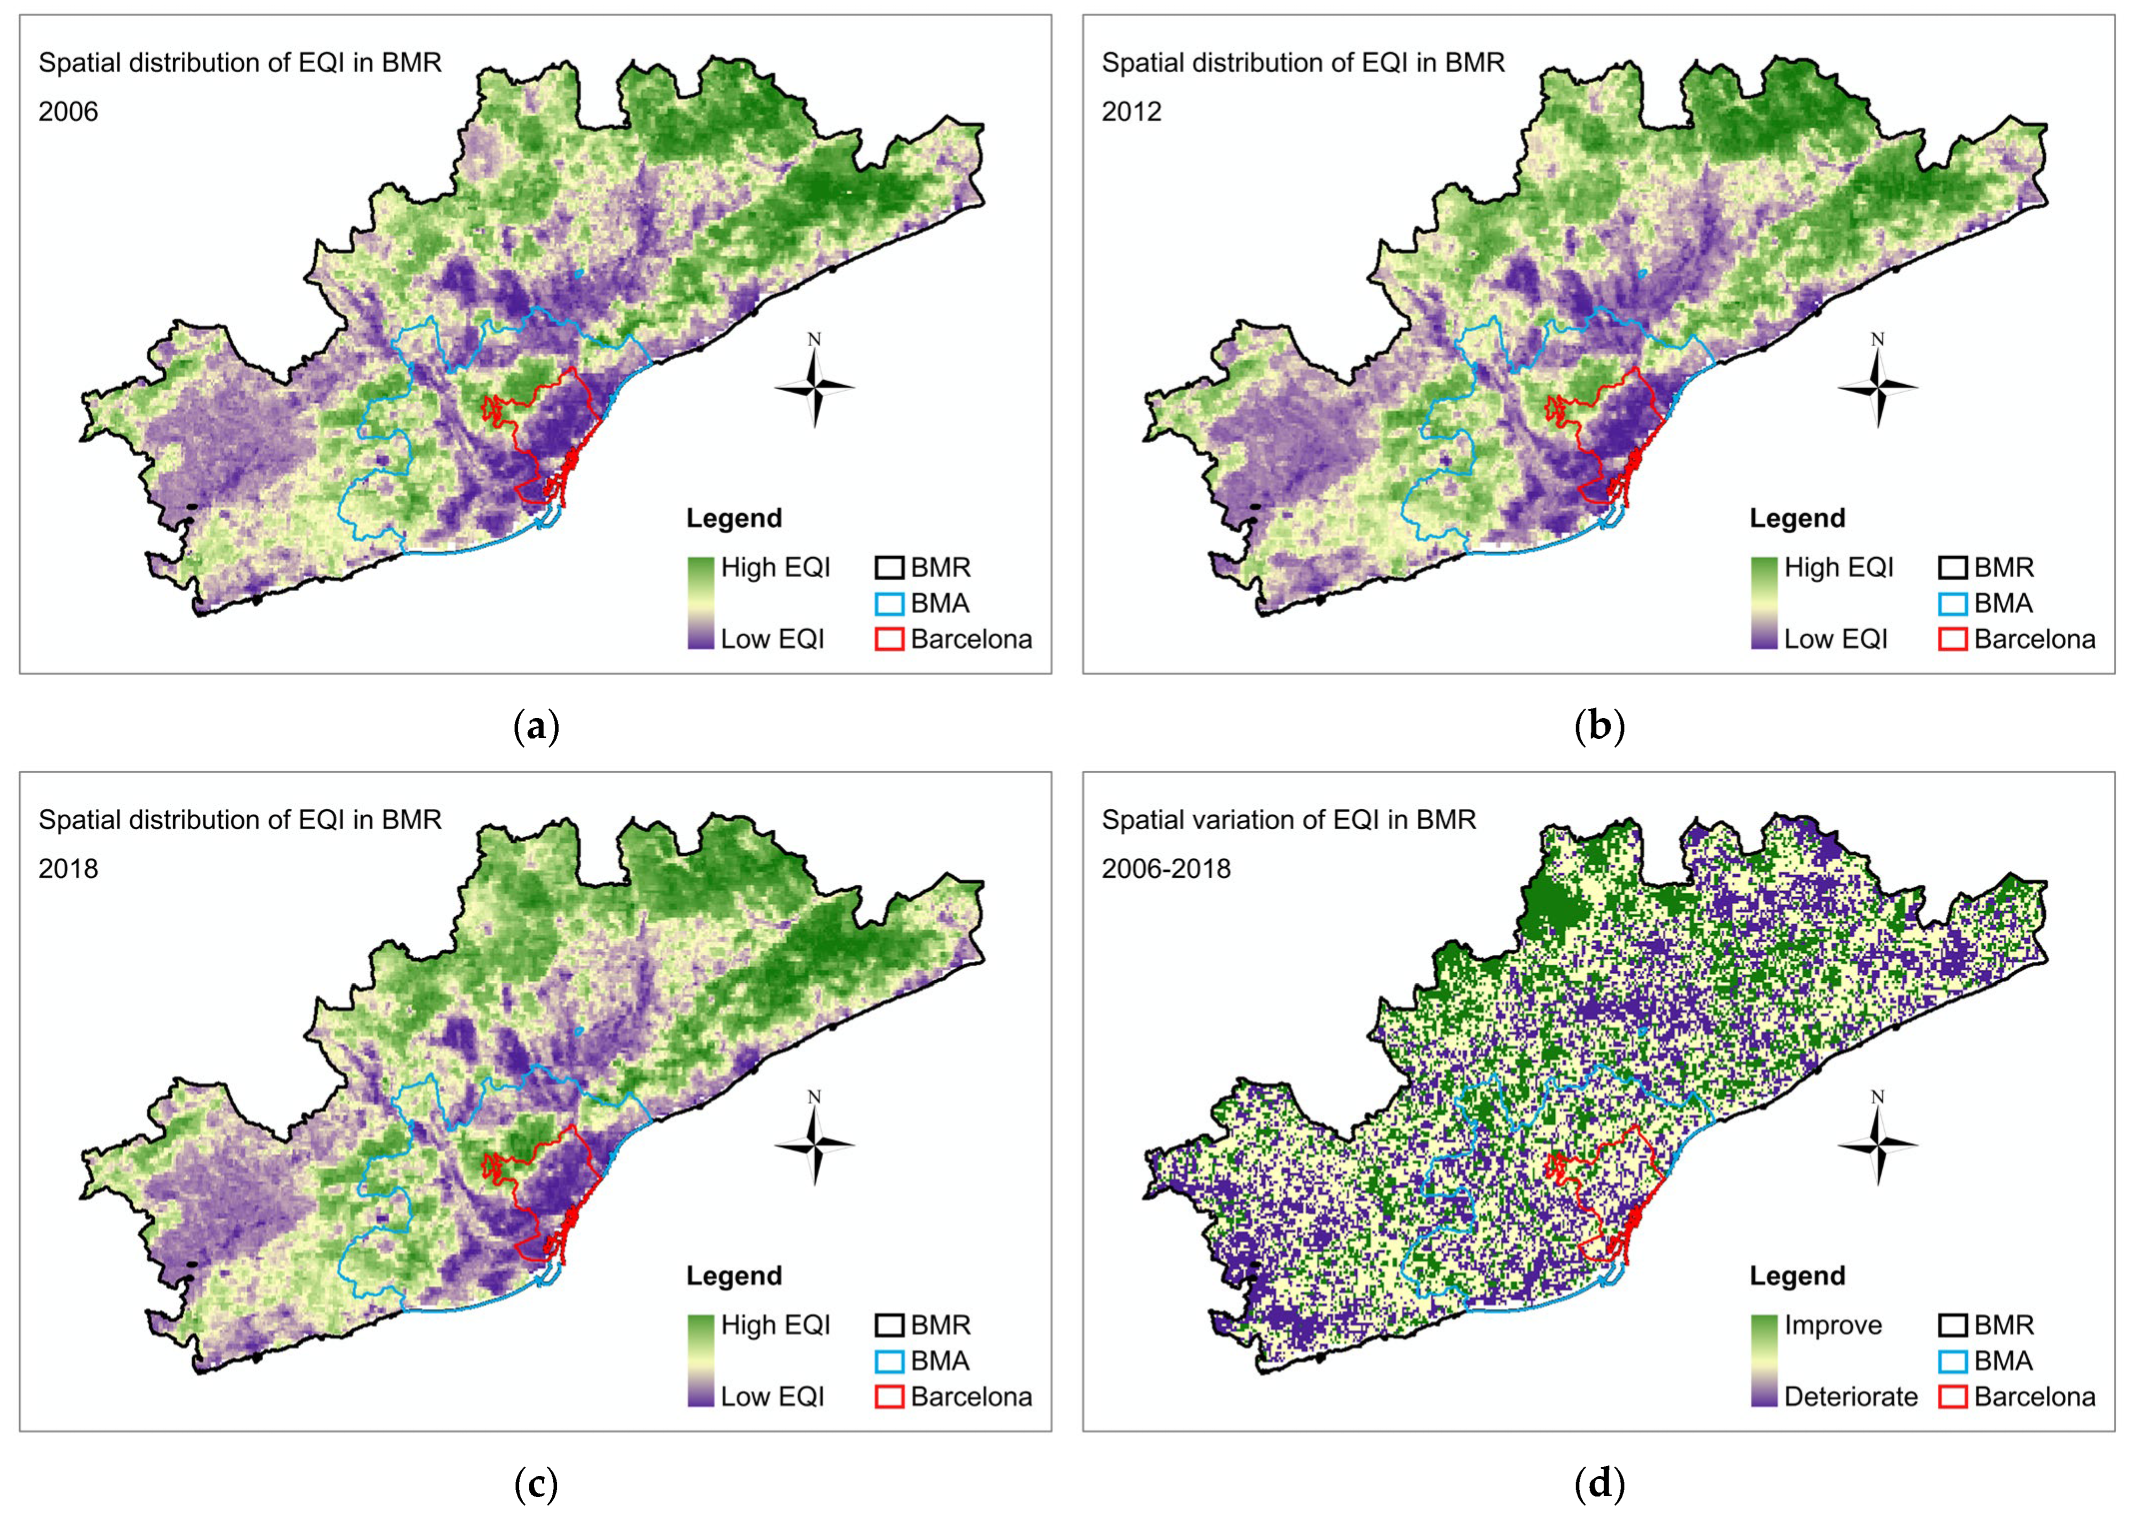
3.1.5. BMR Ecological Environment Quality Distribution Needs to Be Improved
3.2. Analysis of Factors Affecting Green Area Distribution
3.3. Analysis of Climate Factors Affecting NDVI Evolution
3.4. Spatial Analysis of Precipitation/NDVI Characteristic Triangle
3.4.1. Spatial Definition of Precipitation/NDVI Characteristic Triangle
3.4.2. Construction of the Triangular Spatial Structure of the Precipitation/NDVI Scatter Plot
3.4.3. Analysis of the Physical Meaning of the Triangular Space of the Precipitation/NDVI Scatter Plot
- Analysis of parameters of spatial structure of precipitation/NDVI characteristic triangle
- Practical analysis of spatial structure of precipitation/NDVI characteristic triangle
4. Conclusions
- The low-quality areas are larger than the high-quality areas, particularly in the core city of Barcelona. Most of the territory remained unchanged or deteriorated during the study period, with only a few areas showing improvement.
- Fortunately, green areas, which provide the highest ecological benefits, remain the dominant land use in the BMR, although they have slightly decreased in area and have become more fragmented and complex in structure over the past 12 years.
- When combined with the EQI results for green areas, it appears that fragmentation negatively affects the protection of the ecological environment.
- Within the green areas, forests are the dominant land type, and they also have the highest EQI of all green areas, three times greater than that of agricultural land or grassland.
- Urban green areas, likely due to their scattered distribution within the urban layout, exhibit the lowest ecological quality.
- In addition to artificially built surfaces, which are undoubtedly the most fundamental human-induced factors affecting the distribution of green spaces, NDVI, an uncontrollable natural factor, is the most significant positive explanatory variable associated with green space distribution.
- At the same time, climate change will significantly influence NDVI values, thereby impacting ecological quality.
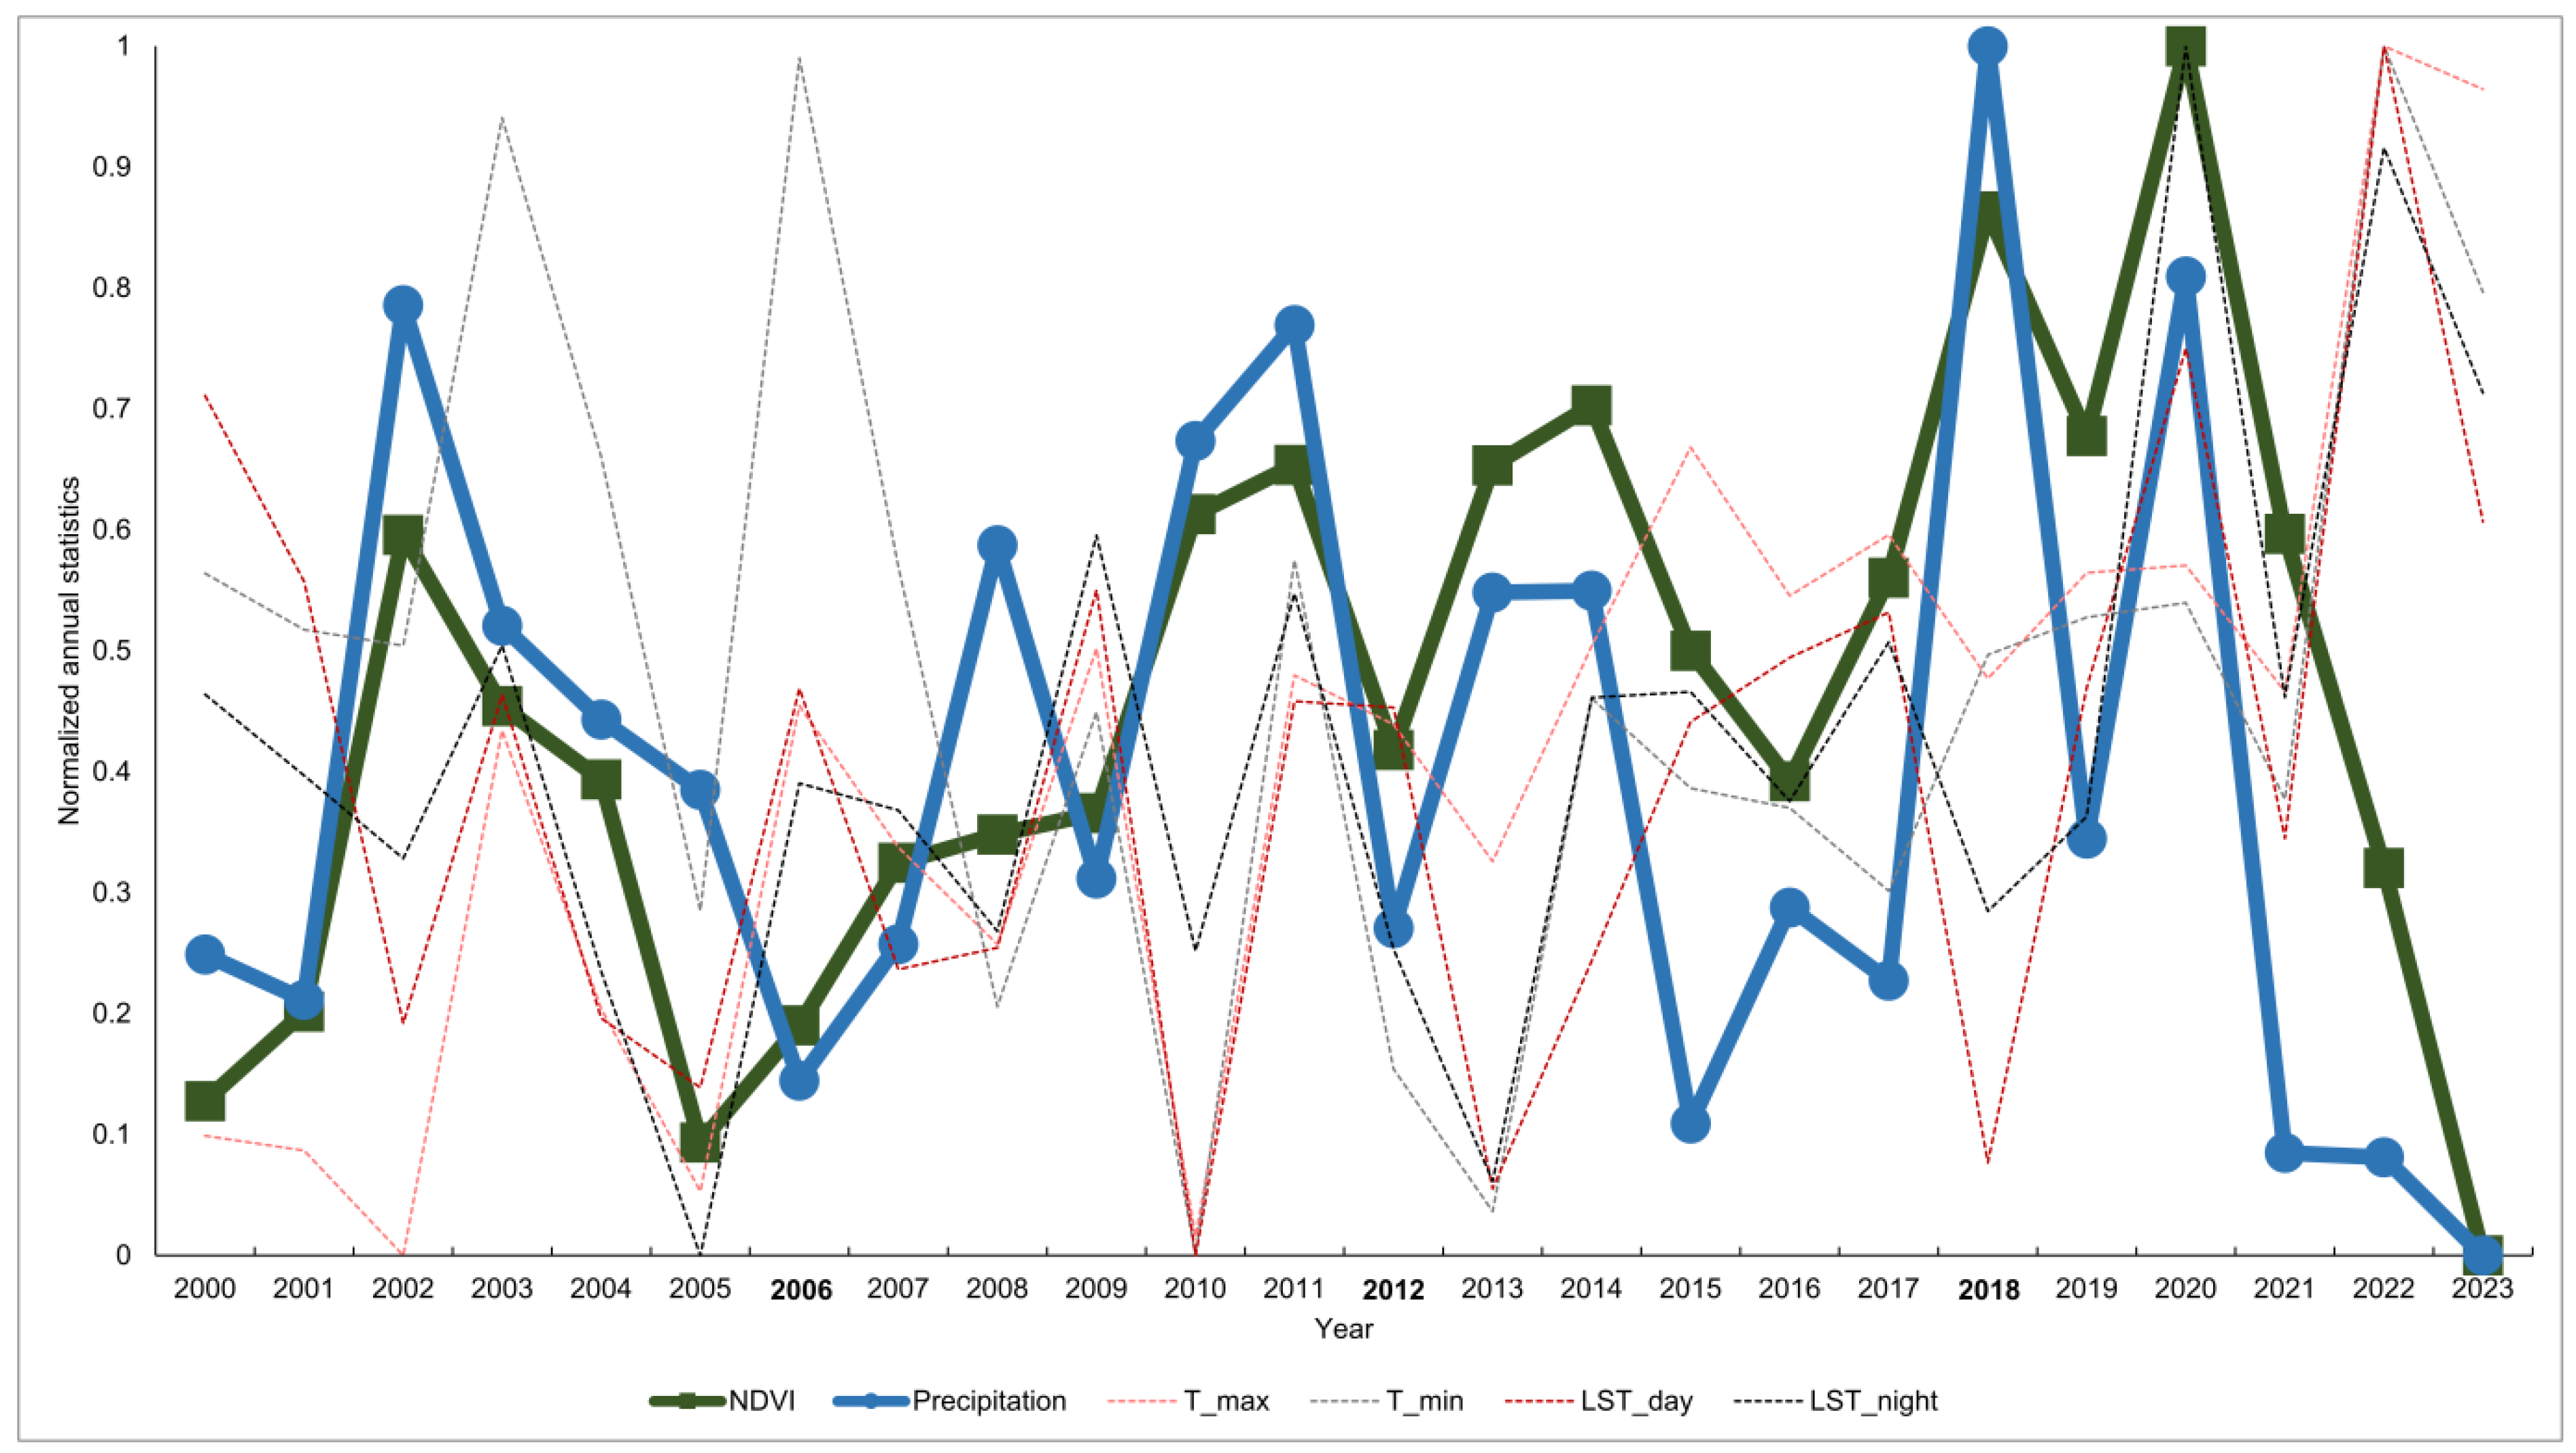
- The climate factor that most strongly affects NDVI is precipitation. Figure 8 illustrates that the trends of annual NDVI and precipitation over the past 23 years are broadly similar, with both increasing and decreasing almost simultaneously, compared to the other four climate variables.
- In fact, we believe that the relationship between changes in precipitation and NDVI is not as simple as the one-sided positive correlation suggested by the model. This aligns with the findings of most scholars, indicating a highly complex and strong relationship between the two, which cannot be easily explained by conventional models [25,31,32,33,34,35].
- The precipitation at the intersection of the two hypotenuses of the characteristic triangle represents a critical value that governs two interactions with NDVI. Above this precipitation, the two variables cooperate and mutually promote each other, while below it, they exhibit a counteractive relationship. This critical value has been increasing each year.
- The slopes of the two hypotenuses and the area sizes of the two triangles divided by the vertical line both indicate the strength of these interactions. The steeper the slope and the larger the area, the greater the intensity of the interaction, and the more significant its impact on NDVI for that year.
- As predicted in this study, the dominant relationship in 2012 was the inverse interaction. NDVI was suppressed by precipitation, and the related EQI decreased accordingly. When cross-referencing this with Table 3, we find that the EQI ratio of green land in this year was the lowest among the three years.
- Additionally, the threshold and total area of the straight side of the characteristic triangle show that the interaction between BMR precipitation and NDVI is becoming increasingly complex.
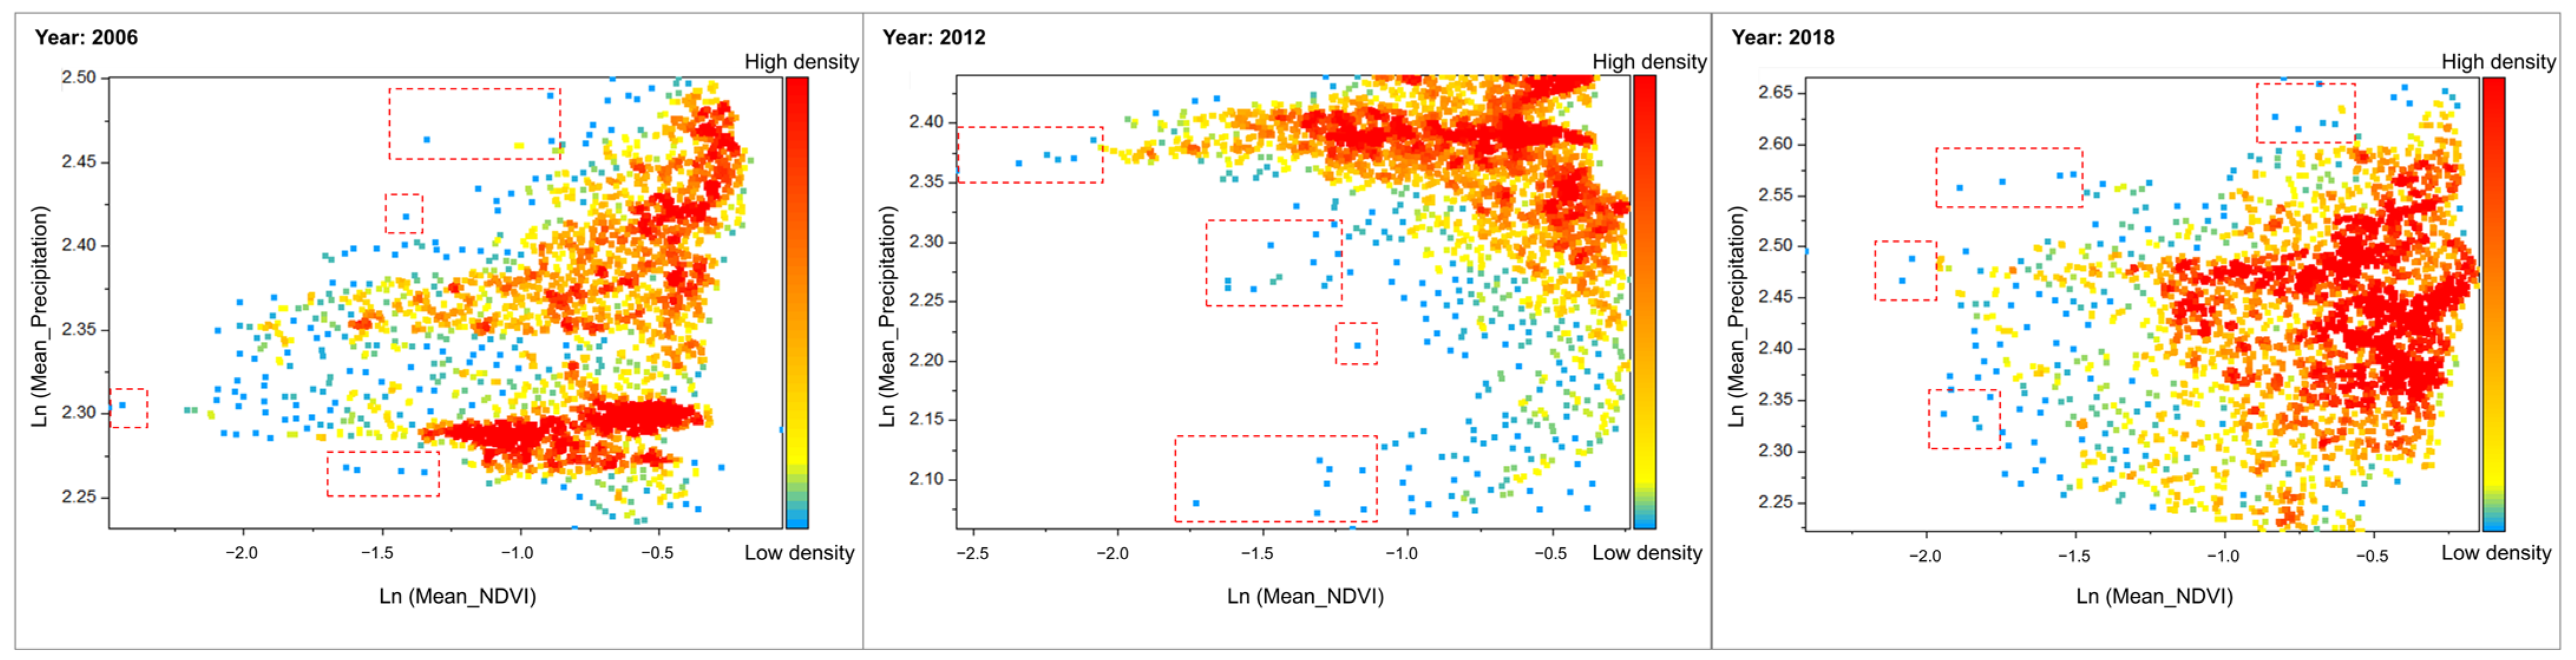
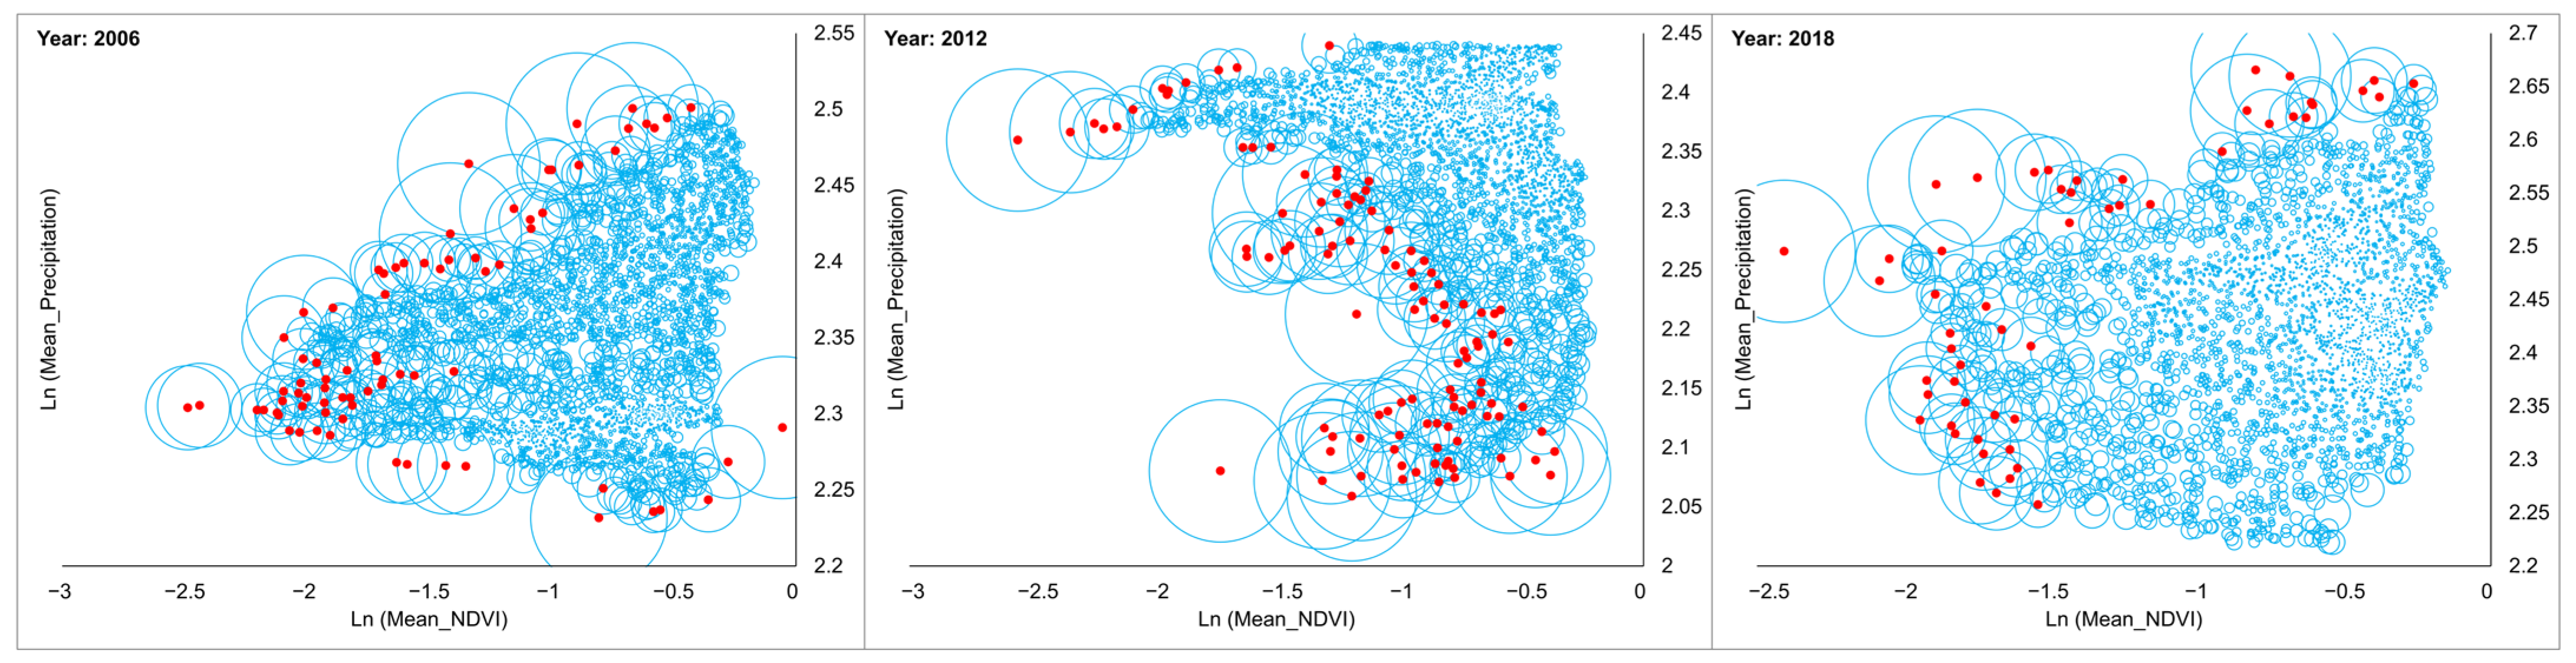
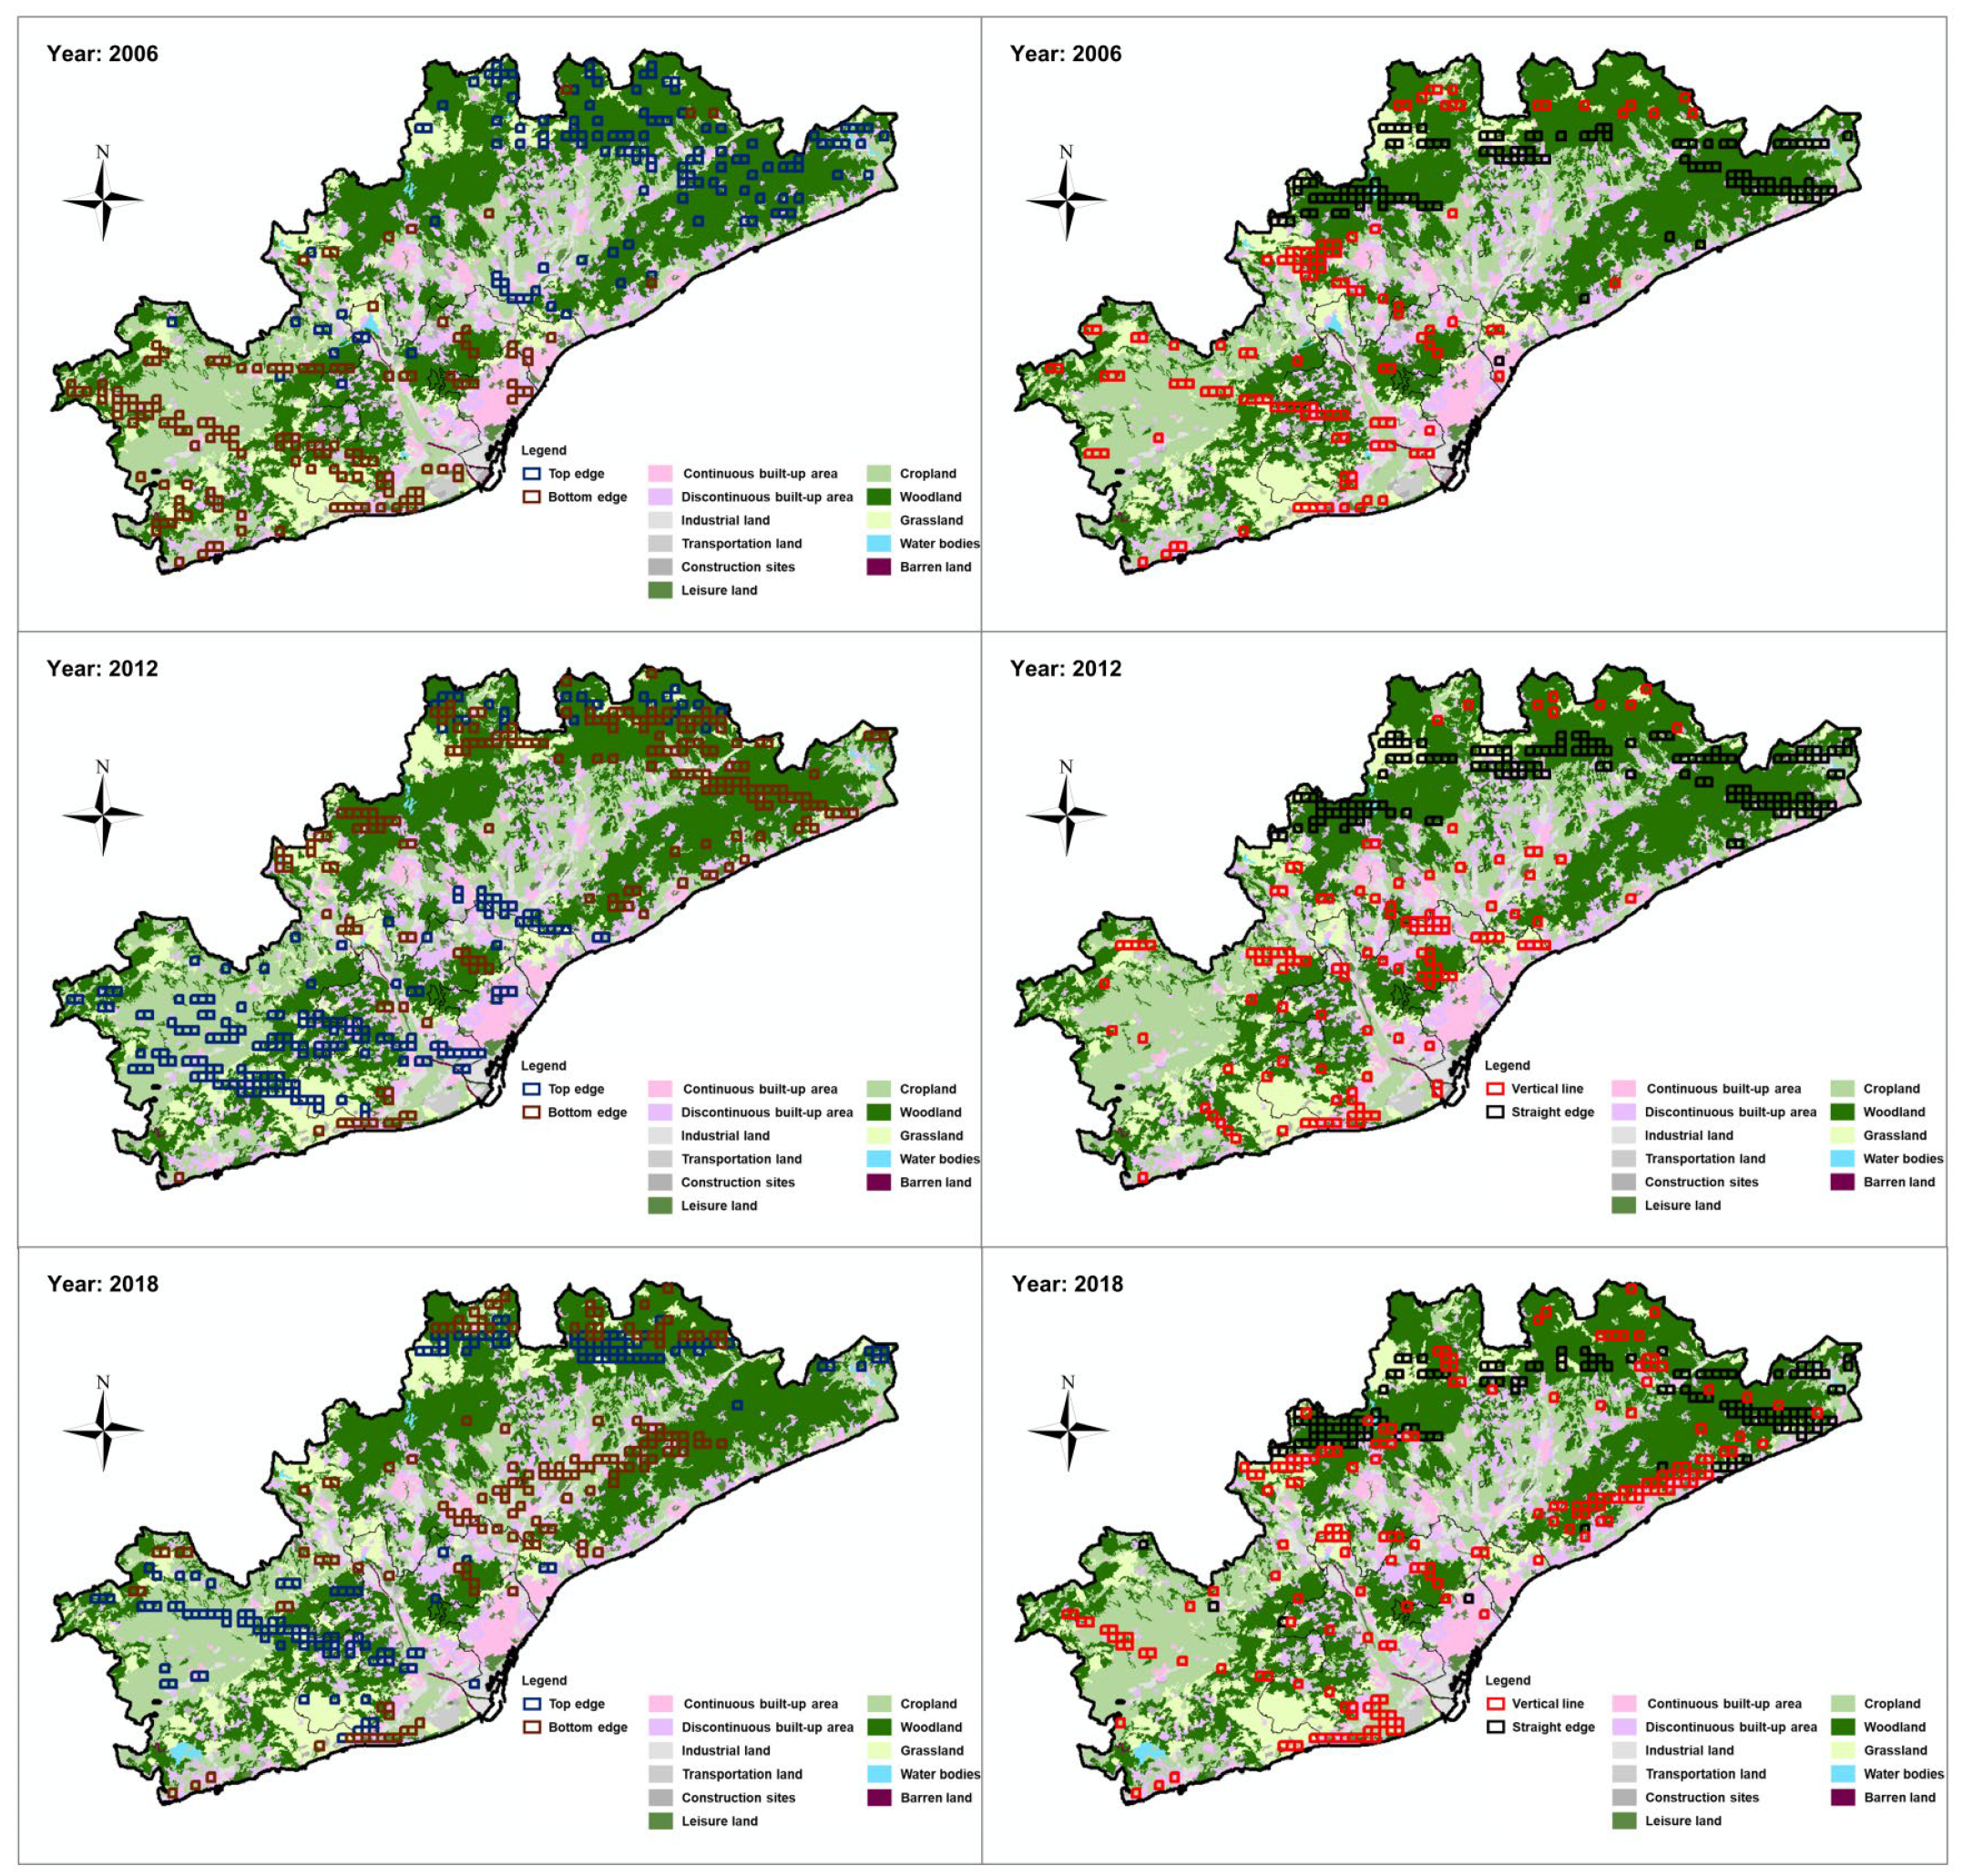
- Finally, we analyzed the geographical distribution of pixels corresponding to scatter points near the three sides and vertical lines of each characteristic triangle, summarizing their typical land covers and associated EQIs.
5. Discussion
Author Contributions
Funding
Institutional Review Board Statement
Informed Consent Statement
Data Availability Statement
Acknowledgments
Conflicts of Interest
Appendix A

| Code | Classification Results | CLC Land-Use Description | Categories |
|---|---|---|---|
| 1 | Continuous built-up area | Continuous urban fabric | Urban land |
| 2 | Discontinuous built-up area | Discontinuous urban fabric | |
| 3 | Industrial land | Industrial or commercial units | Construction land |
| 4 | Transportation land | Road and rail networks and associated land | |
| Port areas | |||
| Airports | |||
| 5 | Mine, dump, and construction sites | Mineral extraction sites | |
| Dump sites | |||
| Construction sites | |||
| 6 | Leisure land | Green urban areas | Green area |
| Sport and leisure facilities | |||
| 7 | Cropland | Non-irrigated arable land | |
| Permanently irrigated land | |||
| Rice fields | |||
| Vineyards | |||
| Fruit trees and berry plantations | |||
| Olive groves | |||
| Pastures | |||
| Annual crops associated with permanent crops | |||
| Complex cultivation patterns | |||
| Land principally occupied by agriculture, with significant areas of natural vegetation | |||
| Agro-forestry areas | |||
| 8 | Woodland | Broad-leaved forest | |
| Coniferous forest | |||
| Mixed forest | |||
| 9 | Grassland | Natural grasslands | |
| Moors and heathland | |||
| Sclerophyllous vegetation | |||
| Transitional woodland-shrub | |||
| Inland marshes | |||
| Peat bogs | |||
| Salt marshes | |||
| 10 | Barren land | Beaches, dunes, sands | Barren land |
| Bare rocks | |||
| Sparsely vegetated areas | |||
| Burnt areas | |||
| Glaciers and perpetual snow | |||
| Salines | |||
| Intertidal flats | |||
| 11 | Water bodies | Water courses | Water bodies |
| Water bodies | |||
| Coastal lagoons | |||
| Estuaries | |||
| Sea and ocean | |||
| NODATA |
Appendix B
| Code | EQI_2006 | EQI_2012 | EQI_2018 |
|---|---|---|---|
| 1 | 0 | 0.009219 | 0.003457 |
| 2 | 0.000535 | 0.021722 | 0.011454 |
| 3 | 0.007083 | 0.015654 | 0 |
| 4 | 0.003032 | 0.002596 | 0.001035 |
| 5 | 0.002876 | 0.003089 | 0.001127 |
| 6 | 0.008674 | 0.011114 | 0.0076 |
| 7 | 0.146374 | 0.157215 | 0.125857 |
| 8 | 0.426103 | 0.42076 | 0.417397 |
| 9 | 0.094843 | 0.097719 | 0.097545 |
| 10 | 0.00164 | 0.001237 | 0.000914 |
| 11 | 0.000504 | 0 | 0.000353 |
| Total | 0.691664 | 0.740324 | 0.666741 |
Appendix C
| Var | 1 | 2 | 3 | 4 | 5 | 6 | 7 | 8 | 9 | 10 | 11 | 12 | 13 | 14 | 15 | 16 | 17 | 18 | 19 | 20 | 21 |
|---|---|---|---|---|---|---|---|---|---|---|---|---|---|---|---|---|---|---|---|---|---|
| 1 | 1 | −0.058 ** | 0.176 ** | 0.268 ** | 0.090 ** | 0.448 ** | 0.212 ** | 0.679 ** | 0.114 ** | −0.463 ** | −0.549 ** | −0.124 ** | −0.300 ** | −0.421 ** | 0.307 ** | −0.536 ** | −0.463 ** | −0.549 ** | −0.947 ** | −0.982 ** | −0.514 ** |
| 2 | −0.058 ** | 1 | 0.705 ** | −0.283 ** | 0.049 ** | 0.003 | 0.036 * | 0.312 ** | 0.884 ** | −0.261 ** | .331 ** | −0.501 ** | 0.212 ** | −0.379 ** | 0.693 ** | −0.384 ** | −0.261 ** | 0.331 ** | 0.067 ** | 0.063 ** | 0.068 ** |
| 3 | 0.176 ** | 0.705 ** | 1 | 0.459 ** | 0.053 ** | 0.480 ** | 0.136 ** | 0.405 ** | 0.863 ** | −0.428 ** | −0.245 ** | −0.291 ** | −0.379 ** | −0.788 ** | 0.733 ** | −0.427 ** | −0.428 ** | −0.245 ** | −0.142 ** | −0.179 ** | −0.279 ** |
| 4 | 0.268 ** | −0.283 ** | 0.459 ** | 1 | 0.012 | 0.609 ** | 0.129 ** | 0.144 ** | 0.033 | −0.267 ** | −0.692 ** | 0.181 ** | −0.775 ** | −0.531 ** | 0.046 * | −0.103 ** | −0.267 ** | −0.692 ** | −0.246 ** | −0.281 ** | −0.412 ** |
| 5 | 0.090 ** | 0.049 ** | 0.053 ** | 0.012 | 1 | 0.124 ** | 0.068 ** | 0.140 ** | 0.085 ** | −0.098 ** | −0.089 ** | −0.045 * | −0.111 ** | −0.086 ** | 0.021 | −0.124 ** | −0.098 ** | −0.089 ** | −0.084 ** | −0.087 ** | −0.122 ** |
| 6 | 0.448 ** | 0.003 | 0.480 ** | 0.609 ** | 0.124 ** | 1 | 0.206 ** | 0.554 ** | 0.355 ** | −0.659 ** | −0.722 ** | −0.217 ** | −0.755 ** | −0.712 ** | 0.307 ** | −0.523 ** | −0.659 ** | −0.722 ** | −0.420 ** | −0.452 ** | −0.734 ** |
| 7 | 0.212 ** | 0.036 * | 0.136 ** | 0.129 ** | 0.068 ** | 0.206 ** | 1 | 0.409 ** | 0.102 ** | −0.229 ** | −0.113 ** | −0.168 ** | −0.100 ** | −0.131 ** | 0.091 ** | −0.187 ** | −0.229 ** | −0.113 ** | −0.141 ** | −0.192 ** | −0.141 ** |
| 8 | 0.679 ** | 0.312 ** | 0.405 ** | 0.144 ** | 0.140 ** | 0.554 ** | 0.409 ** | 1 | 0.447 ** | −0.804 ** | −0.328 ** | −0.638 ** | −0.263 ** | −0.513 ** | 0.467 ** | −0.930 ** | −0.804 ** | −0.328 ** | −0.644 ** | −0.683 ** | −0.526 ** |
| 9 | 0.114 ** | 0.884 ** | 0.863 ** | 0.033 | 0.085 ** | 0.355 ** | 0.102 ** | 0.447 ** | 1 | −0.422 ** | −0.022 | −0.435 ** | −0.178 ** | −0.686 ** | 0.770 ** | −0.496 ** | −0.422 ** | −0.022 | −0.087 ** | −0.108 ** | −0.238 ** |
| 10 | −0.463 ** | −0.261 ** | −0.428 ** | −0.267 ** | −0.098 ** | −0.659 ** | −0.229 ** | −0.804 ** | −0.422 ** | 1 | 0.409 ** | 0.790 ** | 0.364 ** | 0.524 ** | −0.389 ** | 0.807 ** | 1.000 ** | 0.409 ** | 0.434 ** | 0.471 ** | 0.565 ** |
| 11 | −0.549 ** | 0.331 ** | −0.245 ** | −0.692 ** | −0.089 ** | −0.722 ** | −0.113 ** | −0.328 ** | −0.022 | 0.409 ** | 1 | −0.235 ** | 0.689 ** | 0.580 ** | −0.183 ** | 0.243 ** | 0.409 ** | 1.000 ** | 0.511 ** | 0.558 ** | 0.673 ** |
| 12 | −0.124 ** | −0.501 ** | −0.291 ** | 0.181 ** | −0.045 * | −0.217 ** | −0.168 ** | −0.638 ** | −0.435 ** | 0.790 ** | −0.235 ** | 1 | −0.075 ** | 0.168 ** | −0.291 ** | 0.696 ** | 0.790 ** | −0.235 ** | 0.119 ** | 0.126 ** | 0.150 ** |
| 13 | −0.300 ** | 0.212 ** | −0.379 ** | −0.775 ** | −0.111 ** | −0.755 ** | −0.100 ** | −0.263 ** | −0.178 ** | 0.364 ** | 0.689 ** | −0.075 ** | 1 | 0.670 ** | −0.038 * | 0.218 ** | 0.364 ** | 0.689 ** | 0.289 ** | 0.307 ** | 0.576 ** |
| 14 | −0.421 ** | −0.379 ** | −0.788 ** | −0.531 ** | −0.086 ** | −0.712 ** | −0.131 ** | −0.513 ** | −0.686 ** | 0.524 ** | 0.580 ** | 0.168 ** | 0.670 ** | 1 | −0.767 ** | 0.475 ** | 0.524 ** | 0.580 ** | 0.382 ** | 0.427 ** | 0.666 ** |
| 15 | 0.307 ** | 0.693 ** | .733 ** | 0.046 * | 0.021 | .307 ** | 0.091 ** | 0.467 ** | 0.770 ** | −0.389 ** | −0.183 ** | −0.291 ** | −0.038 * | −0.767 ** | 1 | −0.453 ** | −0.389 ** | −0.183 ** | −0.265 ** | −0.310 ** | −0.401 ** |
| 16 | −0.536 ** | −0.384 ** | −0.427 ** | −0.103 ** | −0.124 ** | −0.523 ** | −0.187 ** | −0.930 ** | −0.496 ** | 0.807 ** | 0.243 ** | 0.696 ** | 0.218 ** | 0.475 ** | −0.453 ** | 1 | 0.807 ** | 0.243 ** | 0.508 ** | 0.539 ** | 0.468 ** |
| 17 | −0.463 ** | −0.261 ** | −0.428 ** | −0.267 ** | −0.098 ** | −0.659 ** | −0.229 ** | −0.804 ** | −0.422 ** | 1.000 ** | 0.409 ** | 0.790 ** | 0.364 ** | 0.524 ** | −0.389 ** | 0.807 ** | 1 | 0.409 ** | 0.434 ** | 0.471 ** | 0.565 ** |
| 18 | −0.549 ** | 0.331 ** | −0.245 ** | −0.692 ** | −0.089 ** | −0.722 ** | −0.113 ** | −0.328 ** | −0.022 | 0.409 ** | 1.000 ** | −0.235 ** | 0.689 ** | 0.580 ** | −0.183 ** | 0.243 ** | 0.409 ** | 1 | 0.511 ** | 0.558 ** | 0.673 ** |
| 19 | −0.947 ** | 0.067 ** | −0.142 ** | −0.246 ** | −0.084 ** | −0.420 ** | −0.141 ** | −0.644 ** | −0.087 ** | 0.434 ** | 0.511 ** | 0.119 ** | 0.289 ** | 0.382 ** | −0.265 ** | 0.508 ** | 0.434 ** | 0.511 ** | 1 | 0.945 ** | 0.492 ** |
| 20 | −0.982 ** | 0.063 ** | −0.179 ** | −0.281 ** | −0.087 ** | −0.452 ** | −0.192 ** | −0.683 ** | −0.108 ** | 0.471 ** | 0.558 ** | 0.126 ** | 0.307 ** | 0.427 ** | −0.310 ** | 0.539 ** | 0.471 ** | 0.558 ** | 0.945 ** | 1 | 0.515 ** |
| 21 | −0.514 ** | 0.068 ** | −0.279 ** | −0.412 ** | −0.122 ** | −0.734 ** | −0.141 ** | −0.526 ** | −0.238 ** | 0.565 ** | 0.673 ** | 0.150 ** | 0.576 ** | 0.666 ** | −0.401 ** | 0.468 ** | 0.565 ** | 0.673 ** | 0.492 ** | 0.515 ** | 1 |
| Var | 1 | 2 | 3 | 4 | 5 | 6 | 7 | 8 | 9 | 10 | 11 | 12 | 13 | 14 | 15 | 16 | 17 | 18 | 19 | 20 | 21 |
|---|---|---|---|---|---|---|---|---|---|---|---|---|---|---|---|---|---|---|---|---|---|
| 1 | 1 | −0.060 ** | 0.178 ** | 0.272 ** | 0.090 ** | 0.456 ** | 0.214 ** | 0.677 ** | −0.184 ** | −0.454 ** | −0.529 ** | −0.176 ** | −0.316 ** | −0.335 ** | 0.197 ** | −0.553 ** | −0.454 ** | −0.529 ** | −0.953 ** | −0.981 ** | −0.510 ** |
| 2 | −0.060 ** | 1 | 0.705 ** | −0.283 ** | 0.049 ** | 0.003 | 0.036 * | 0.284 ** | −0.681 ** | −0.223 ** | 0.047 * | −0.303 ** | −0.430 ** | −0.353 ** | 0.112 ** | −0.366 ** | −0.223 ** | 0.047 * | 0.02 | 0.032 | 0.049 ** |
| 3 | 0.178 ** | 0.705 ** | 1 | 0.459 ** | 0.053 ** | 0.480 ** | 0.136 ** | 0.405 ** | −0.596 ** | −0.439 ** | −0.527 ** | −0.160 ** | −0.745 ** | −0.873 ** | 0.588 ** | −0.485 ** | −0.439 ** | −0.527 ** | −0.149 ** | −0.163 ** | −0.282 ** |
| 4 | 0.272 ** | −0.283 ** | 0.459 ** | 1 | 0.012 | 0.609 ** | 0.129 ** | 0.185 ** | 0.096 ** | −0.323 ** | −0.741 ** | 0.132 ** | −0.413 ** | −0.706 ** | 0.660 ** | −0.211 ** | −0.323 ** | −0.741 ** | −0.194 ** | −0.218 ** | −0.393 ** |
| 5 | 0.090 ** | 0.049 ** | 0.053 ** | 0.012 | 1 | 0.124 ** | 0.068 ** | 0.142 ** | −0.015 | −0.097 ** | −0.132 ** | −0.025 | −0.112 ** | −0.051 ** | −0.033 | −0.135 ** | −0.097 ** | −0.132 ** | −0.058 * | −0.072 ** | −0.128 ** |
| 6 | 0.456 ** | 0.003 | 0.480 ** | 0.609 ** | 0.124 ** | 1 | 0.206 ** | 0.593 ** | −0.186 ** | −0.745 ** | −0.815 ** | −0.327 ** | −0.672 ** | −0.632 ** | 0.296 ** | −0.613 ** | −0.745 ** | −0.815 ** | −0.364 ** | −0.418 ** | −0.735 ** |
| 7 | 0.214 ** | 0.036 * | 0.136 ** | 0.129 ** | 0.068 ** | 0.206 ** | 1 | 0.433 ** | −0.036 * | −0.228 ** | −0.125 ** | −0.188 ** | −0.084 ** | −0.157 ** | 0.154 ** | −0.249 ** | −0.228 ** | −0.125 ** | −0.142 ** | −0.181 ** | −0.146 ** |
| 8 | 0.677 ** | 0.284 ** | 0.405 ** | 0.185 ** | 0.142 ** | 0.593 ** | 0.433 ** | 1 | −0.360 ** | −0.802 ** | −0.441 ** | −0.662 ** | −0.467 ** | −0.441 ** | 0.207 ** | −0.922 ** | −0.802 ** | −0.441 ** | −0.665 ** | −0.709 ** | −0.566 ** |
| 9 | −0.184 ** | −0.681 ** | −0.596 ** | 0.096 ** | −0.015 | −0.186 ** | −0.036 * | −0.360 ** | 1 | 0.360 ** | 0.181 ** | 0.308 ** | 0.647 ** | 0.443 ** | −0.035 | 0.368 ** | 0.360 ** | 0.181 ** | 0.156 ** | 0.165 ** | 0.318 ** |
| 10 | −0.454 ** | −0.223 ** | −0.439 ** | −0.323 ** | −0.097 ** | −0.745 ** | −0.228 ** | −0.802 ** | 0.360 ** | 1 | 0.565 ** | 0.812 ** | 0.560 ** | 0.460 ** | −0.146 ** | 0.811 ** | 10.000 ** | 0.565 ** | 0.364 ** | 0.406 ** | 0.635 ** |
| 11 | −0.529 ** | 0.047 * | −0.527 ** | −0.741 ** | −0.132 ** | −0.815 ** | −0.125 ** | −0.441 ** | 0.181 ** | 0.565 ** | 1 | −0.022 | 0.629 ** | 0.729 ** | −0.484 ** | 0.448 ** | 0.565 ** | 10.000 ** | 0.475 ** | 0.518 ** | 0.664 ** |
| 12 | −0.176 ** | −0.303 ** | −0.160 ** | 0.132 ** | −0.025 | −0.327 ** | −0.188 ** | −0.662 ** | 0.308 ** | 0.812 ** | −0.022 | 1 | 0.234 ** | 0.042 * | 0.165 ** | 0.668 ** | 0.812 ** | −0.022 | 0.087 ** | 0.108 ** | 0.301 ** |
| 13 | −0.316 ** | −0.430 ** | −0.745 ** | −0.413 ** | −0.112 ** | −0.672 ** | −0.084 ** | −0.467 ** | 0.647 ** | 0.560 ** | 0.629 ** | 0.234 ** | 1 | 0.756 ** | −0.163 ** | 0.503 ** | 0.560 ** | 0.629 ** | 0.232 ** | 0.261 ** | 0.592 ** |
| 14 | −0.335 ** | −0.353 ** | −0.873 ** | −0.706 ** | −0.051 ** | −0.632 ** | −0.157 ** | −0.441 ** | 0.443 ** | 0.460 ** | 0.729 ** | 0.042 * | 0.756 ** | 1 | −0.769 ** | 0.475 ** | 0.460 ** | 0.729 ** | 0.285 ** | 0.321 ** | 0.432 ** |
| 15 | 0.197 ** | 0.112 ** | 0.588 ** | 0.660 ** | −0.033 | 0.296 ** | 0.154 ** | 0.207 ** | −0.035 | −0.146 ** | −0.484 ** | 0.165 ** | −0.163 ** | −0.769 ** | 1 | −0.223 ** | −0.146 ** | −0.484 ** | −0.199 ** | −0.226 ** | −0.075 ** |
| 16 | −0.553 ** | −0.366 ** | −0.485 ** | −0.211 ** | −0.135 ** | −0.613 ** | −0.249 ** | −0.922 ** | 0.368 ** | 0.811 ** | 0.448 ** | 0.668 ** | 0.503 ** | 0.475 ** | −0.223 ** | 1 | 0.811 ** | 0.448 ** | 0.532 ** | 0.565 ** | 0.540 ** |
| 17 | −0.454 ** | −0.223 ** | −0.439 ** | −0.323 ** | −0.097 ** | −0.745 ** | −0.228 ** | −0.802 ** | 0.360 ** | 10.000 ** | 0.565 ** | 0.812 ** | 0.560 ** | 0.460 ** | −0.146 ** | 0.811 ** | 1 | 0.565 ** | 0.364 ** | 0.406 ** | 0.635 ** |
| 18 | −0.529 ** | 0.047 * | −0.527 ** | −0.741 ** | −0.132 ** | −0.815 ** | −0.125 ** | −0.441 ** | 0.181 ** | 0.565 ** | 10.000 ** | −0.022 | 0.629 ** | 0.729 ** | −0.484 ** | 0.448 ** | 0.565 ** | 1 | 0.475 ** | 0.518 ** | 0.664 ** |
| 19 | −0.953 ** | 0.02 | −0.149 ** | −0.194 ** | −0.058 * | −0.364 ** | −0.142 ** | −0.665 ** | 0.156 ** | 0.364 ** | 0.475 ** | 0.087 ** | 0.232 ** | 0.285 ** | −0.199 ** | 0.532 ** | 0.364 ** | 0.475 ** | 1 | 0.942 ** | 0.355 ** |
| 20 | −0.981 ** | 0.032 | −0.163 ** | −0.218 ** | −0.072 ** | −0.418 ** | −0.181 ** | −0.709 ** | 0.165 ** | 0.406 ** | 0.518 ** | 0.108 ** | 0.261 ** | 0.321 ** | −0.226 ** | 0.565 ** | 0.406 ** | 0.518 ** | 0.942 ** | 1 | 0.389 ** |
| 21 | −0.510 ** | 0.049 ** | −0.282 ** | −0.393 ** | −0.128 ** | −0.735 ** | −0.146 ** | −0.566 ** | 0.318 ** | 0.635 ** | 0.664 ** | 0.301 ** | 0.592 ** | 0.432 ** | −0.075 ** | 0.540 ** | 0.635 ** | 0.664 ** | 0.355 ** | 0.389 ** | 1 |
| Var | 1 | 2 | 3 | 4 | 5 | 6 | 7 | 8 | 9 | 10 | 11 | 12 | 13 | 14 | 15 | 16 | 17 | 18 | 19 | 20 | 21 |
|---|---|---|---|---|---|---|---|---|---|---|---|---|---|---|---|---|---|---|---|---|---|
| 1 | 1 | −0.049 ** | 0.192 ** | 0.280 ** | 0.088 ** | 0.461 ** | 0.213 ** | 0.688 ** | 0.125 ** | −0.547 ** | −0.576 ** | −0.303 ** | −0.305 ** | −0.376 ** | 0.242 ** | −0.589 ** | −0.547 ** | −0.576 ** | −0.944 ** | −0.978 ** | −0.560 ** |
| 2 | −0.049 ** | 1 | 0.705 ** | −0.283 ** | 0.049 ** | 0.003 | 0.036 * | 0.334 ** | −0.039 * | −0.136 ** | −0.008 | −0.172 ** | −0.409 ** | −0.312 ** | −0.018 | −0.370 ** | −0.136 ** | −0.008 | 0.070 ** | 0.060 ** | 0.002 |
| 3 | 0.192 ** | 0.705 ** | 1 | 0.459 ** | 0.053 ** | 0.480 ** | 0.136 ** | 0.442 ** | −0.207 ** | −0.464 ** | −0.509 ** | −0.241 ** | −0.784 ** | −0.858 ** | 0.431 ** | −0.473 ** | −0.464 ** | −0.509 ** | −0.145 ** | −0.186 ** | −0.349 ** |
| 4 | 0.280 ** | −0.283 ** | 0.459 ** | 1 | 0.012 | 0.609 ** | 0.129 ** | 0.174 ** | −0.127 ** | −0.449 ** | −0.616 ** | −0.146 ** | −0.515 ** | −0.732 ** | 0.585 ** | −0.184 ** | −0.449 ** | −0.616 ** | −0.251 ** | −0.283 ** | −0.420 ** |
| 5 | 0.088 ** | 0.049 ** | 0.053 ** | 0.012 | 1 | 0.124 ** | 0.068 ** | 0.145 ** | 0.074 ** | −0.065 ** | −0.138 ** | 0.014 | −0.123 ** | −0.060 ** | −0.065 ** | −0.145 ** | −0.065 ** | −0.138 ** | −0.088 ** | −0.088 ** | −0.081 ** |
| 6 | 0.461 ** | 0.003 | 0.480 ** | 0.609 ** | 0.124 ** | 1 | 0.206 ** | 0.554 ** | 0.152 ** | −0.806 ** | −0.741 ** | −0.522 ** | −0.715 ** | −0.670 ** | 0.193 ** | −0.587 ** | −0.806 ** | −0.741 ** | −0.430 ** | −0.465 ** | −0.759 ** |
| 7 | 0.213 ** | 0.036 * | 0.136 ** | 0.129 ** | 0.068 ** | 0.206 ** | 1 | 0.425 ** | 0.042 * | −0.226 ** | −0.112 ** | −0.215 ** | −0.104 ** | −0.165 ** | 0.150 ** | −0.391 ** | −0.226 ** | −0.112 ** | −0.194 ** | −0.202 ** | −0.179 ** |
| 8 | 0.688 ** | 0.334 ** | 0.442 ** | 0.174 ** | 0.145 ** | 0.554 ** | 0.425 ** | 1 | 0.229 ** | −0.768 ** | −0.456 ** | −0.675 ** | −0.479 ** | −0.466 ** | 0.155 ** | −0.948 ** | −0.768 ** | −0.456 ** | −0.659 ** | −0.692 ** | −0.595 ** |
| 9 | 0.125 ** | −0.039 * | −0.207 ** | −0.127 ** | 0.074 ** | 0.152 ** | 0.042 * | 0.229 ** | 1 | −0.264 ** | −0.062 ** | −0.300 ** | −0.054 ** | 0.111 ** | −0.273 ** | −0.275 ** | −0.264 ** | −0.062 ** | −0.145 ** | −0.125 ** | −0.204 ** |
| 10 | −0.547 ** | −0.136 ** | −0.464 ** | −0.449 ** | −0.065 ** | −0.806 ** | −0.226 ** | −0.768 ** | −0.264 ** | 1 | 0.649 ** | 0.840 ** | 0.631 ** | 0.590 ** | −0.168 ** | 0.776 ** | 10.000 ** | 0.649 ** | 0.509 ** | 0.553 ** | 0.770 ** |
| 11 | −0.576 ** | −0.008 | −0.509 ** | −0.616 ** | −0.138 ** | −0.741 ** | −0.112 ** | −0.456 ** | −0.062 ** | 0.649 ** | 1 | 0.132 ** | 0.650 ** | 0.750 ** | −0.427 ** | 0.427 ** | 0.649 ** | 10.000 ** | 0.536 ** | 0.585 ** | 0.722 ** |
| 12 | −0.303 ** | −0.172 ** | −0.241 ** | −0.146 ** | 0.014 | −0.522 ** | −0.215 ** | −0.675 ** | −0.300 ** | 0.840 ** | 0.132 ** | 1 | 0.359 ** | 0.234 ** | 0.086 ** | 0.705 ** | 0.840 ** | 0.132 ** | 0.281 ** | 0.304 ** | 0.488 ** |
| 13 | −0.305 ** | −0.409 ** | −0.784 ** | −0.515 ** | −0.123 ** | −0.715 ** | −0.104 ** | −0.479 ** | −0.054 ** | 0.631 ** | 0.650 ** | 0.359 ** | 1 | 0.829 ** | −0.077 ** | 0.504 ** | 0.631 ** | 0.650 ** | 0.279 ** | 0.308 ** | 0.609 ** |
| 14 | −0.376 ** | −0.312 ** | −0.858 ** | −0.732 ** | −0.060 ** | −0.670 ** | −0.165 ** | −0.466 ** | 0.111 ** | 0.590 ** | 0.750 ** | 0.234 ** | 0.829 ** | 1 | −0.621 ** | 0.464 ** | 0.590 ** | 0.750 ** | 0.330 ** | 0.385 ** | 0.556 ** |
| 15 | 0.242 ** | −0.018 | 0.431 ** | 0.585 ** | −0.065 ** | 0.193 ** | 0.150 ** | 0.155 ** | −0.273 ** | −0.168 ** | −0.427 ** | 0.086 ** | −0.077 ** | −0.621 ** | 1 | −0.118 ** | −0.168 ** | −0.427 ** | −0.197 ** | −0.255 ** | −0.138 ** |
| 16 | −0.589 ** | −0.370 ** | −0.473 ** | −0.184 ** | −0.145 ** | −0.587 ** | −0.391 ** | −0.948 ** | −0.275 ** | 0.776 ** | 0.427 ** | 0.705 ** | 0.504 ** | 0.464 ** | −0.118 ** | 1 | 0.776 ** | 0.427 ** | 0.564 ** | 0.592 ** | 0.575 ** |
| 17 | −0.547 ** | −0.136 ** | −0.464 ** | −0.449 ** | −0.065 ** | −0.806 ** | −0.226 ** | −0.768 ** | −0.264 ** | 10.000 ** | 0.649 ** | 0.840 ** | 0.631 ** | 0.590 ** | −0.168 ** | 0.776 ** | 1 | 0.649 ** | 0.509 ** | 0.553 ** | 0.770 ** |
| 18 | −0.576 ** | −0.008 | −0.509 ** | −0.616 ** | −0.138 ** | −0.741 ** | −0.112 ** | −0.456 ** | −0.062 ** | 0.649 ** | 10.000 ** | 0.132 ** | 0.650 ** | 0.750 ** | −0.427 ** | 0.427 ** | 0.649 ** | 1 | 0.536 ** | 0.585 ** | 0.722 ** |
| 19 | −0.944 ** | 0.070 ** | −0.145 ** | −0.251 ** | −0.088 ** | −0.430 ** | −0.194 ** | −0.659 ** | −0.145 ** | 0.509 ** | 0.536 ** | 0.281 ** | 0.279 ** | 0.330 ** | −0.197 ** | 0.564 ** | 0.509 ** | 0.536 ** | 1 | 0.946 ** | 0.536 ** |
| 20 | −0.978 ** | 0.060 ** | −0.186 ** | −0.283 ** | −0.088 ** | −0.465 ** | −0.202 ** | −0.692 ** | −0.125 ** | 0.553 ** | 0.585 ** | 0.304 ** | 0.308 ** | 0.385 ** | −0.255 ** | 0.592 ** | 0.553 ** | 0.585 ** | 0.946 ** | 1 | 0.571 ** |
| 21 | −0.560 ** | 0.002 | −0.349 ** | −0.420 ** | −0.081 ** | −0.759 ** | −0.179 ** | −0.595 ** | −0.204 ** | 0.770 ** | 0.722 ** | 0.488 ** | 0.609 ** | 0.556 ** | −0.138 ** | 0.575 ** | 0.770 ** | 0.722 ** | 0.536 ** | 0.571 ** | 1 |
Appendix D
| NDVI | Precipitation | T_max | T_min | LST_day | LST_night | |
|---|---|---|---|---|---|---|
| NDVI | 1 | 0.684 ** | 0.053 | −0.283 | −0.236 | 0.131 |
| Precipitation | 0.684 ** | 1 | −0.388 | −0.256 | −0.484 * | −0.168 |
| T_max | 0.053 | −0.388 | 1 | 0.433 * | 0.593 ** | 0.670 ** |
| T_min | −0.283 | −0.256 | 0.433 * | 1 | 0.563 ** | 0.555 ** |
| LST_day | −0.236 | −0.484 * | 0.593 ** | 0.563 ** | 1 | 0.817 ** |
| LST_night | 0.131 | −0.168 | 0.670 ** | 0.555 ** | 0.817 ** | 1 |
References
- Liu, T. Evaluation of Guilin’s urban ecological environment based on remote sensing data. Master’s Thesis, Guilin University of Technology, Guilin, China, 2023. [Google Scholar]
- Ramez, A.B.; Hooi, H.L.; Jeremy, C. The evolution of the natural resource curse thesis: A critical literature survey. Resour. Policy 2017, 51, 123–134. [Google Scholar]
- Qian, L.; Wu, Z.; Guo, G. Research on the relationship between built environment and urban biodiversity in high-density urban areas: Taking Century Avenue in Pudong New Area, Shanghai as an example. Urban Dev. Res. Res. 2018, 25, 97–106. [Google Scholar]
- Xiong, K.; Li, J.; Long, M. Characteristics and key issues of soil and water loss in typical karst rocky desertification control areas. Chin. J. Geogr. 2012, 67, 878–888. [Google Scholar]
- Roca, J.; Arellano, B. Effects of urban greenery on health. A study from remote sensing. Int. Arch.Photogramm. Remote Sens. Spat. Inf. Sci. 2022, XLIII-B3-2022, 17–24. [Google Scholar]
- Xu, Z.; Blanca, A. Urban sprawl and warming—Research on the evolution of the urban sprawl of chinese municipalities and its relationship with climate warming in the past three decades. Int. Arch.Photogramm. Remote Sens. Spat. Inf. Sci. 2022, XLIII-B4-2022, 209–215. [Google Scholar]
- Wang, F.; Liang, R.; Yang, X.; Chen, M. Research on ecological water demand in northwest China—Theoretical analysis of ecological water demand in Arid and Semi-arid Regions. J. Nat. Resour. 2002, 2010, 1–8. [Google Scholar]
- Wang, Z. Chahannaoer basin based on improved remote sensing ecological index. Master’s Thesis, Anhui University of Science and Technology, Huainan, China, 2021. [Google Scholar]
- Lavorel, S.; Flannigan, M.D.; Lambin, E.F. Vulnerability of land systems to fire: Interactions among humans, climate, the atmosphere, and ecosystems. Mitig. Adapt. Strateg. Glob. Change 2007, 12, 33–53. [Google Scholar] [CrossRef]
- Moran, M.S.; Peters, C.D.; Watts, J.M. Estimating soil moisture at the watershed scale with satellite-based radar and land surface models. Can. J. Remote Sens. 2004, 30, 805–826. [Google Scholar] [CrossRef]
- Gupta, K.; Kumar, P.; Pathan, S.K. Urban Neighborhood Green Index—A measures of green spaces inutban areas. Landsc. Urban Plan. 2012, 105, 325–335. [Google Scholar] [CrossRef]
- Wickham, J.D.; Jones, K.B. Environmental auditing, An Integrated Environmental Assessment of the US Mid-Atlantic Region. Environ. Manag. 1999, 24, 553–560. [Google Scholar] [CrossRef]
- Ivits, E.; Cherlet, M.; Mehl, W.; Sommer, S. Estimating the ecologic status and change of riparian zones in Andalusia assessed by multi-temporal AVHHR data. Ecol Indie 2009, 9, 422–431. [Google Scholar] [CrossRef]
- Manill, J.; Pino, J.; Mallarach, J.M. A land suitability index for strategic environmental assessment in metropolitan areas. Landsc. Urban Plan. 2017, 201, 200. [Google Scholar]
- Xu, H. Remote sensing evaluation index of regional ecological environment change. China Environ. Sci. 2013, 33, 889–897. [Google Scholar]
- Hou, Y.; Chen, Y.; Ding, J.; Li, Z.; Li, Y.; Sun, F. Ecological Impacts of Land Use Change in the Arid Tarim River Basin of China. Remote Sens. 2022, 14, 1894. [Google Scholar] [CrossRef]
- Wessels, K.; Prince, S.; Frost, P. Assessing the effects of human-induced land degradation in the former homelands of northern south africa with a 1 km AVHRR NDVI time-series. Remote Sens. Environ. 2004, 91, 47–67. [Google Scholar] [CrossRef]
- Pettorelli, N.; Laurance, W.; O’Brien, T. Satellite remote sensing for applied ecologists: Opportunities and challenges. J. Appl. Ecol. 2014, 51, 839–848. [Google Scholar] [CrossRef]
- Goward, S.; Prince, S. Transient effects of climate on vegetation dynamics: Satellite observations. J. Biogeogr. 1995, 22, 549–563. [Google Scholar] [CrossRef]
- De Jong, S.; Brouwer, L.; Riezebos, H. Effects of grazing on vegetation and erosion in the chaco boreal, paraguay. Geoderma 1999, 88, 65–79. [Google Scholar]
- Jie, R. Study on the evolution and driving force of surface ecological environment in western lli basin based on NDVI. Master’s Thesis, College of Disaster Prevention Technology, Langfang, China, 2020. [Google Scholar]
- Zhang, Y.; She, J.; Long, X.; Zhang, M. Spatial-temporal evolution and driving factors of eco-environmental quality based on RSEI in Chang-Zhu-Tan metropolitan circle, central China. Ecol. Indic. 2022, 144, 109436. [Google Scholar] [CrossRef]
- Zhang, L.; Fang, C.; Zhao, R.; Zhu, C.; Guan, J. Spatial-temporal evolution and driving force analysis of eco-quality in urban agglomerations in China. Sci. Total Environ. 2023, 866, 161465. [Google Scholar] [CrossRef]
- Huang, M.; Gong, D.; Zhang, L.; Lin, H.; Chen, Y.; Zhu, D.; Xiao, C.; Altan, O. Spatial-temporal dynamics and forecasting of ecological security pattern under the consideration of protecting habitat: A case study of the Poyang Lake ecoregion. Int. J. Digit. Earth 2024, 17, 2376277. [Google Scholar] [CrossRef]
- Xu, Z.; Arellano, B.; Roca, J. Study on factors influencing forest distribution in Barcelona metropolitan region. Sustainability 2024, 16, 5449. [Google Scholar] [CrossRef]
- Zhou, L.; Tucker, C.; Kaufmann, R.K. Variations in northern vegetation activity inferred from satellite data of vegetation index during 1981 to 1999. J. Geophys. Res. 2001, 106, 20069–20083. [Google Scholar] [CrossRef]
- Yang, Y.; Shang, S.; Mao, Q. Impact of soil moisture on vegetation growing condition and climate change over the Tibetan plateau. J. Geophys. Res. Atmos. 2012, 117, 15205–15215. [Google Scholar]
- Wu, C.; Niu, Z.; Tang, Q. Impact of topography on vegetation dynamics in a mountain-oasis-desert system in Xinjiang, China. Remote Sens. 2018, 10, 946. [Google Scholar]
- Xu, C.; Liu, M.; Zhang, Z. Responses of vegetation activity to multi-factor influences in different sub-regions of northeast China. Remote Sens. 2014, 6, 5866–5887. [Google Scholar]
- Ji, L.; Peters, A. Assessing vegetation response to drought in the northern great plains using vegetation and drought indices. Remote Sens. Environ. 2003, 87, 85–98. [Google Scholar] [CrossRef]
- Pettorelli, N.; Vik, J.; Mysterud, A. Using the satellite-derived NDVI to assess ecological responses to environmental change. Trends Ecol. Evol. 2005, 20, 503–510. [Google Scholar] [CrossRef]
- Liu, Z.; Li, J. Response of temporal and spatial changes of vegetation in Heilongjiang Province to climate factors from 2000 to 2020. For. Eng. 2024, 40, 85–97. [Google Scholar]
- Mu, S.; Li, J.; Chen, Y. Spatial and temporal variation characteristics of vegetation coverage in Inner Mongolia from 2001 to 2010. Acta Geogr. Sin. 2012, 67, 1255–1268. [Google Scholar]
- Liu, Y.; Van Dijk, A.; De Jeu, R. Recent reversal in loss of global terrestrial biomass. Nat. Clim. Change 2015, 5, 470–474. [Google Scholar] [CrossRef]
- Xu, Y.; Li, J.; Guo, Q.; Li, H.; Wu, H. Spatial-temporal evolution characteristics of NDVI and analysis of its climate driving factors in Nanchang. For. Eng. 2024, 40, 8023. [Google Scholar]
- Cebollada, A.; Carme, M. La movilidad en la Región Metropolitana de Barcelona: Entre los nuevos retos y las viejas prácticas. Finisterra 2010, 45, 90. [Google Scholar] [CrossRef]
- Available online: https://landscan.ornl.gov/ (accessed on 10 July 2024).
- Available online: https://territori.gencat.cat/ca/01_departament/05_plans/01_planificacio_territorial/plans_territorials_nou/territorials_parcials/ptp_metropolita_de_barcelona/ (accessed on 20 September 2024).
- Zhang, X.; Roca, J.; Arellano, B. Evolution of ecological patterns of land use changes in European metropolitan areas. In Proceedings of the SPIE, Berlin, Germany, 26 October 2022. [Google Scholar]
- Haobo, Y.; Xinyi, Z. Urban heat island analysis based on high resolution measurement data: A case study in Beijing. Sustainable Cities Soc. 2024, 106, 105389. [Google Scholar]
- Boer, E.P.; Kirsten, M.; Dewi, H. Kriging and thin plate splines for mapping climate variables. Int. J. Appl. Earth Obs. Geoinf. 2001, 3, 146–154. [Google Scholar] [CrossRef]
- Xu, Z.; Roca, J.; Arellano, B. Research on the expansion of Beijing-Tianjin-Hebei China’s Capital metropolitan agglomeration based on night lighting technology. In Proceedings of the SPIE, Amsterdam, The Netherlands, 19 October 2023. [Google Scholar]
- Chris, B.; Aysin, D.; Jason, B. Factors shaping urban green space provision: A systematic review of the literature. Landsc. Urban Plan. 2018, 178, 82–101. [Google Scholar]
- Rahmati, L.; Hanaei, T. Comparative analysis of key factors influencing urban green space in Mashhad, Iran (1988–2018). Environ. Syst. Res. 2024, 13, 13. [Google Scholar] [CrossRef]
- Ghebrezgabher, M.G.; Yang, T.; Yang, X.; Sereke, T.E. Assessment of NDVI variations in responses to climate change in the Horn of Africa. Egypt. J. Remote Sens. Space Sci. 2020, 23, 249–261. [Google Scholar] [CrossRef]
- Song, Z. The triangular feature space between nighttime light intensity and vegetation index and its applications. Master’s Thesis, East China Normal University, Shanghai, China, 2023. [Google Scholar]
- Sandholt, I.; Rasmussen, K.; Andersen, J. A simple interpretation of the surface temperature/vegetation index space for assessment of surface moisture status. Remote Sens. Environ. 2002, 79, 213–224. [Google Scholar] [CrossRef]
- Pengxin, W.; Jianya, G.; Xiaowen, L. Conditional vegetation temperature index and its application in drought monitoring. J. Wuhan Univ. 2001, 26, 412–418. [Google Scholar]
- Hasan, M.M.; Croke, B.F.W.; Liu, S.; Shimizu, K.; Karim, F. Using mixed probability distribution functions for modelling non-zero sub-daily rainfall in Australia. Geosciences 2020, 10, 43. [Google Scholar] [CrossRef]
- Rosenblatt, M. Remarks on some nonparametric estimates of a density function. Ann. Math. Stat. 1956, 27, 832–837. [Google Scholar] [CrossRef]
- Emanuel, P. On estimation of a probability density function and mode. Ann. Math. Stat. 1962, 33, 1065–1076. [Google Scholar]
- Epanechnikov, A. Non-Parametric Estimation of a multivariate probability density. Theory Probab. Its Appl. 1969, 14, 153–158. [Google Scholar] [CrossRef]
- Xiong, K.; Ding, Q.; Zhu, Z. Chiller fault detection based on isolation forest and KDE-LOF. Comput. Appl. Softw. 2023, 40, 84–89. [Google Scholar]
- Breunig, M.; Kriegel, H. LOF: Identifying density-based local outliers. ACM Sigmod Rec. 2000, 29, 93–104. [Google Scholar] [CrossRef]
- Wu, Z. Study on Vegetation Cover Change and Its Response to Climate in Qilian Mountains from 2000 to 2012. Master’s Thesis, Northwest Normal University, Lanzhou, China, 2014. [Google Scholar]
- Yao, X.; Yu, K.; Liu, J. Spatial and temporal evolution of ecological vulnerability in areas with severe soil erosion in southern China. Chin. J. Appl. Ecol. 2016, 27, 735–745. [Google Scholar]
- Zhang, H.; Wang, X.; Peng, D. Evaluation of Urban Vegetation Phenology Using 250 m MODIS Vegetation Indices. Photogramm. Eng. Remote Sens. 2022, 88, 461–467. [Google Scholar] [CrossRef]
- Huang, J. Research on forest aboveground biomass regeneration method based on BEPS model and remote sensing. Master’s Thesis, Nanjing University, Nanjing, China, 2014. [Google Scholar]
- Cheng, M.; Jiang, H.; Chen, J.; Guo, Z.; Jiang, Z. Study on vegetation cover change in Hotan area of Xinjiang based on Landsat data. J. Anhui Agric. Sci. 2009, 37, 1239–1244. [Google Scholar]
- Arellano, B.; Roca, J. Modelling nighttime air temperature from remote sensing imagery and GIS data. In Proceedings of the SPIE, Space, Satellites, and Sustainability II, Glasgow, UK, 28 September–1 October 2021. [Google Scholar]
- Zhang, S.; Yang, P.; Xia, J.; Qi, K.; Wang, W.; Cai, W.; Chen, N. Research and Analysis of Ecological Environment Quality in the Middle Reaches of the Yangtze River Basin between 2000 and 2019. Remote Sens. 2021, 13, 4475. [Google Scholar] [CrossRef]
- Shi, M.; Lin, F.; Jing, X.; Li, B.; Shi, Y.; Hu, Y. Ecological Environment Quality Assessment of Arid Areas Based on Improved Remote Sensing Ecological Index—A Case Study of the Loess Plateau. Sustainability 2023, 15, 13881. [Google Scholar] [CrossRef]
- Zaitunah, A.; Samsuri; Silitonga, A.; Syaufina, L. Urban Greening Effect on Land Surface Temperature. Sensors 2022, 22, 4168. [Google Scholar] [CrossRef] [PubMed]
- Peng, L.; Wu, H.; Li, Z. Spatial–Temporal Evolutions of Ecological Environment Quality and Ecological Resilience Pattern in the Middle and Lower Reaches of the Yangtze River Economic Belt. Remote Sens. 2023, 15, 430. [Google Scholar] [CrossRef]
- Guha, S.; Govil, H.; Dey, A.; Gill, N. Analytical study of land surface temperature with NDVI and NDBI using Landsat 8 OLI and TIRS data in Florence and Naples city, Italy. Eur. J. Remote Sens. 2018, 51, 667–678. [Google Scholar] [CrossRef]
- Xia, W.; Xiaojie, Y.; Changzheng, J.; Wei, D. Dynamic monitoring and analysis of factors influencing ecological environment quality in northern Anhui, China, based on the Google Earth Engine. Sci. Rep. 2022, 12, 20307. [Google Scholar]
- Available online: https://land.copernicus.eu/en/products/corine-land-cover/clc2018 (accessed on 16 July 2024).
- Arellano, B.; Roca, J.; Qianhui, Z. Spain: Towards a drier and warmer climate? Analysis of climate change effects on precipitation and temperature trends in Spain. In Proceedings of the European Meteorological Society Annual Meeting, Barcelona, Spain, 2 September 2024. [Google Scholar]
- Haisheng, H.; Hewitt, R.J. Future climate risks to world cultural heritage sites in Spain: A systematic analysis based on shared socioeconomic pathways. Int. J. Disaster Risk Reduct. 2024, 113, 2212–4209. [Google Scholar]
- Lorenzo, M.; Alvarez, I. Future changes of hot extremes in Spain: Towards warmer conditions. Nat Hazards 2022, 113, 383–402. [Google Scholar] [CrossRef]
- David, C.; Susana, C.; Rocha, A. Future surface temperature changes for the Iberian Peninsula according to EURO-CORDEX climate projections. Clim. Dyn. 2021, 56, 1–16. [Google Scholar]
- Henson, S.; Beaulieu, C.; Lampitt, R. Observing climate change trends in ocean biogeochemistry: When and where. Glob. Change Biol. 2016, 22, 1561–1571. [Google Scholar] [CrossRef]
- Chander, G.; Hewison, T.; Fox, N.; Wu, X.; Xiong, X.; Blackwell, W. Overview of intercalibration of satellite instruments. IEEE Trans. Geosci. Remote Sens. 2013, 51, 1056–1080. [Google Scholar] [CrossRef]
| Type | Factors |
|---|---|
| Natural factors | Longitude |
| Latitude | |
| Distance from coastline | |
| Orientation | |
| Altitude | |
| NDVI | |
| Precipitation | |
| LST | |
| LST_day- LST_night | |
| T_max | |
| T_min | |
| T_max-T_min | |
| Human activity | NDBI |
| Urban heat island effect | |
| Impermeable area | |
| Artificial area | |
| Nighttime light data |
| Code | Reclassification | Categories |
|---|---|---|
| 1 | Continuous built-up area | Urban land |
| 2 | Discontinuous built-up area | |
| 3 | Industrial land | Construction land |
| 4 | Transportation land | |
| 5 | Construction sites | |
| 6 | Leisure land | Green area |
| 7 | Cropland | |
| 8 | Woodland | |
| 9 | Grassland | |
| 10 | Water bodies | Water bodies |
| 11 | Barren land | Barren land |
| Categories | 2006 | 2012 | 2018 | |||
|---|---|---|---|---|---|---|
| EQI | % of Total | EQI | % of Total | EQI | % of Total | |
| Urban land | 0.001 | 0.08% | 0.031 | 4.18% | 0.015 | 2.24% |
| Construction land | 0.013 | 1.88% | 0.021 | 2.88% | 0.002 | 0.32% |
| Green area | 0.676 | 97.73% | 0.687 | 92.77% | 0.648 | 97.25% |
| Water bodies | 0.002 | 0.24% | 0.001 | 0.17% | 0.001 | 0.14% |
| Barren land | 0.001 | 0.07% | 0.000 | 0 | 0.0003 | 0.05% |
| Overall | 0.692 | 100.00% | 0.740 | 100.00% | 0.667 | 100.00% |
| Independent Variable b | Model_2006 a | Model_2012 a | Model_2018 a | |||||||||
|---|---|---|---|---|---|---|---|---|---|---|---|---|
| B | Beta | t | Sig. | B | Beta | t | Sig. | B | Beta | t | Sig. | |
| Constant | −1719.33 | −6.00 | 0.00 | −1534.85 | −4.79 | 0.00 | −2681.47 | −5.75 | 0.00 | |||
| Longitude | 0.00 | −0.17 | −7.02 | 0.00 | 0.00 | −0.12 | −4.26 | 0.00 | 0.00 | −0.16 | −3.86 | 0.00 |
| Latitude | 0.00 | 0.19 | 5.41 | 0.00 | 0.00 | 0.17 | 4.92 | 0.00 | 0.00 | 0.31 | 5.49 | 0.00 |
| Distance from coastline | 0.00 | −0.13 | −5.65 | 0.00 | 0.00 | −0.08 | −4.31 | 0.00 | 0.00 | −0.06 | −2.13 | 0.03 |
| Orientation | 0.00 | 0.00 | −0.13 | 0.89 | 0.00 | 0.00 | −0.76 | 0.45 | 0.00 | 0.00 | −0.74 | 0.46 |
| Altitude | 0.00 | −0.02 | −2.13 | 0.03 | 0.00 | 0.00 | 0.33 | 0.74 | 0.00 | 0.00 | 0.18 | 0.86 |
| Slope | 2.78 | 0.04 | 8.59 | 0.00 | 0.29 | 0.00 | 0.54 | 0.59 | 1.61 | 0.02 | 4.22 | 0.00 |
| NDVI_ MEAN | 6.77 | 0.00 | 0.25 | 0.80 | 5.98 | 0.03 | 1.89 | 0.06 | 5.45 | 0.03 | 1.73 | 0.08 |
| Precipitation | 1.21 | 0.03 | 1.42 | 0.16 | 0.97 | 0.02 | 2.13 | 0.03 | 0.93 | 0.03 | 3.89 | 0.00 |
| LST_DAY- LST_NIGHT | 0.22 | 0.02 | 2.01 | 0.04 | −0.12 | −0.01 | −0.82 | 0.41 | 0.18 | 0.01 | 1.30 | 0.20 |
| T_max | 0.50 | 0.01 | 1.38 | 0.17 | 0.83 | 0.02 | 1.53 | 0.13 | 4.03 | 0.14 | 8.05 | 0.00 |
| T_max-T_min | −1.03 | −0.03 | −3.18 | 0.00 | −0.76 | −0.03 | −1.95 | 0.05 | −3.55 | −0.09 | −7.83 | 0.00 |
| NDBI | −1.90 | −0.01 | −0.87 | 0.38 | −1.92 | 0.02 | 1.61 | 0.11 | −1.00 | 0.02 | 1.16 | 0.25 |
| UHIE_ NIGHT | −0.02 | 0.00 | −0.13 | 0.90 | 0.65 | 0.03 | 2.28 | 0.02 | −0.27 | −0.01 | −1.08 | 0.28 |
| Impermeable area | −15.53 | −0.15 | −12.84 | 0.00 | −25.96 | −0.25 | −17.79 | 0.00 | −15.74 | −0.15 | −10.93 | 0.00 |
| Artificial area | −80.61 | −0.83 | −64.97 | 0.00 | −72.64 | −0.75 | −49.37 | 0.00 | −81.32 | −0.83 | −56.55 | 0.00 |
| Night Light | −0.03 | −0.02 | −2.55 | 0.01 | −0.02 | −0.01 | −1.33 | 0.19 | 0.01 | 0.00 | 0.50 | 0.62 |
| Independent Variable | R2 | B | Beta | t | Sig. |
|---|---|---|---|---|---|
| Precipitation | 0.47 | 0.00 | 0.68 | 4.40 | 0.00 |
| T_max | 0.00 | 0.00 | 0.05 | 0.25 | 0.81 |
| T_min | 0.08 | −0.01 | −0.28 | −1.39 | 0.18 |
| LST_day | 0.06 | 0.00 | −0.24 | −1.14 | 0.27 |
| LST_night | 0.02 | 0.00 | 0.13 | 0.62 | 0.54 |
| Year | Top Edge | R2 | Bottom Edge | R2 | Straight Edge |
|---|---|---|---|---|---|
| 2006 | y = 0.0991x + 2.5046 | 0.7510288 | y = −0.0258x + 2.2563 | 0.1790952 | x = −0.1705 |
| 2012 | y = 0.0261x + 2.4428 | 0.2359837 | y = −0.0841x + 2.2153 | 0.5709729 | x = −0.2341 |
| 2018 | y = 0.113x + 2.6567 | 0.375945 | y = −0.1641x + 2.1339 | 0.6198449 | x = −0.3823 |
| Year | 2006 | 2012 | 2018 | |||
|---|---|---|---|---|---|---|
| Max Precipitation | 2.49 | (12.01) | 2.44 | (11.43) | 2.64 | (14.00) |
| Min Precipitation | 2.26 | (9.59) | 2.24 | (9.35) | 2.16 | (8.67) |
| Intersection point_Precipitation | 2.31 | (10.05) | 2.39 | (10.90) | 2.44 | (11.51) |
| Intersection point_Min NDVI | −1.99 | (0.14) | −2.06 | (0.13) | −1.89 | (0.15) |
| Max NDVI | −0.19 | (0.83) | −0.24 | (0.79) | −0.16 | (0.85) |
| Straight edge length | 0.22 | 0.20 | 0.48 | |||
| Wet edge slope | 0.10 | 0.03 | 0.11 | |||
| Dry edge slope | −0.03 | −0.08 | −0.16 | |||
| Top triangle area | 0.16 | 0.04 | 0.17 | |||
| Bottom triangle area | 0.04 | 0.14 | 0.24 | |||
| Total area | 0.20 | 0.18 | 0.41 | |||
Disclaimer/Publisher’s Note: The statements, opinions and data contained in all publications are solely those of the individual author(s) and contributor(s) and not of MDPI and/or the editor(s). MDPI and/or the editor(s) disclaim responsibility for any injury to people or property resulting from any ideas, methods, instructions or products referred to in the content. |
© 2024 by the authors. Licensee MDPI, Basel, Switzerland. This article is an open access article distributed under the terms and conditions of the Creative Commons Attribution (CC BY) license (https://creativecommons.org/licenses/by/4.0/).
Share and Cite
Zhang, X.; Ramos, B.A.; Cladera, J.R. Research on Key Influencing Factors of Ecological Environment Quality in Barcelona Metropolitan Region Based on Remote Sensing. Remote Sens. 2024, 16, 4735. https://doi.org/10.3390/rs16244735
Zhang X, Ramos BA, Cladera JR. Research on Key Influencing Factors of Ecological Environment Quality in Barcelona Metropolitan Region Based on Remote Sensing. Remote Sensing. 2024; 16(24):4735. https://doi.org/10.3390/rs16244735
Chicago/Turabian StyleZhang, Xu, Blanca Arellano Ramos, and Josep Roca Cladera. 2024. "Research on Key Influencing Factors of Ecological Environment Quality in Barcelona Metropolitan Region Based on Remote Sensing" Remote Sensing 16, no. 24: 4735. https://doi.org/10.3390/rs16244735
APA StyleZhang, X., Ramos, B. A., & Cladera, J. R. (2024). Research on Key Influencing Factors of Ecological Environment Quality in Barcelona Metropolitan Region Based on Remote Sensing. Remote Sensing, 16(24), 4735. https://doi.org/10.3390/rs16244735