Technical Note

A Method for Developing a Digital Terrain Model of the Coastal Zone Based on Topobathymetric Data from Remote Sensors

by
Mariusz Specht
1,* and
Marta Wiśniewska
2
1
Department of Transport and Logistics, Gdynia Maritime University, Morska 81-87, 81-225 Gdynia, Poland
2
Marine Technology Ltd., Wiktora Roszczynialskiego 4-6, 81-521 Gdynia, Poland
*
Author to whom correspondence should be addressed.
Remote Sens. 2024, 16(24), 4626; https://doi.org/10.3390/rs16244626
Submission received: 8 September 2024 / Revised: 3 December 2024 / Accepted: 5 December 2024 / Published: 10 December 2024
(This article belongs to the Special Issue Remote Sensing: 15th Anniversary)

Abstract

:
This technical note aims to present a method for developing a Digital Terrain Model (DTM) of the coastal zone based on topobathymetric data from remote sensors. This research was conducted in the waterbody adjacent to the Vistula Śmiała River mouth in Gdańsk, which is characterised by dynamic changes in its seabed topography. Bathymetric and topographic measurements were conducted using an Unmanned Aerial Vehicle (UAV) and two hydrographic methods (a Single-Beam Echo Sounder (SBES) and a manual survey using a Global Navigation Satellite System (GNSS) Real-Time Kinematic (RTK) receiver). The result of this research was the development of a topobathymetric chart based on data recorded by the above-mentioned sensors. It should be emphasised that bathymetric data for the shallow waterbody (less than 1 m deep) were obtained based on high-resolution photos taken by a UAV. They were processed using the “Depth Prediction” plug-in based on the Support Vector Regression (SVR) algorithm, which was implemented in the QGIS software as part of the INNOBAT project. This plug-in allowed us to generate a dense cloud of depth points for a shallow waterbody. Research has shown that the developed DTM of the coastal zone based on topobathymetric data from remote sensors is characterised by high accuracy of 0.248 m (p = 0.95) and high coverage of the seabed with measurements. Based on the research conducted, it should be concluded that the proposed method for developing a DTM of the coastal zone based on topobathymetric data from remote sensors allows the accuracy requirements provided in the International Hydrographic Organization (IHO) Special Order (depth error ≤ 0.25 m (p = 0.95)) to be met in shallow waterbodies.

1. Introduction

Bathymetric work carried out in shallow waters (less than 1 m deep) is a commonly performed measurement, as knowledge on the course of seabed topography has a direct impact on coastal zone management, the design and monitoring of hydrotechnical structures and the safety of navigation [1,2,3,4,5].
The most popular instruments for depth measurement include Multi-Beam Echo Sounders (MBESs) and Single-Beam Echo Sounders (SBESs) [6,7]. Even though SBESs continue to be the most commonly used bathymetric systems worldwide, it is MBESs that, thanks to their large swath width, are capable of ensuring complete coverage of the seabed with depth data and enable the performance of such work in a relatively shorter time [8,9]. Although the aforementioned methods for depth measurement are known for their high accuracy, they are not optimum solutions in shallow waters. They are costly and time-consuming and often have a limited operating range due to the impossibility of measuring the entire shallow waterbody.
Bathymetric measurements using Unmanned Aerial Vehicles (UAVs) are a modern method of collecting data on the depth and sea bottom of waterbodies [10,11,12,13,14]. It is an alternative or complement to traditional measurement methods, such as sonars, which are mounted on vessels. This method allows for quick and precise mapping of waterbodies, especially shallow waters and areas that are difficult to access, thanks to high-resolution cameras or Light Detection and Ranging (LiDAR) systems. Undoubtedly, the advantages of carrying out bathymetric measurements with the use of drones include, among others, high resolution of bathymetric data; accessibility to hard-to-reach places, e.g., shallow or overgrown waters; speed of implementation, as UAVs can quickly move and record data from large areas; and the cost of research, because they are cheaper than traditional methods using aircraft or vessels. However, the limitations of the use of drones in bathymetric measurements include depth, because LiDAR and photogrammetric measurements are effective up to a depth of about a dozen or so metres from the shore; water transparency, which is decisively influenced by the depth accuracy; weather conditions, such as wind and waves, and lack of light, which may affect the quality of the data collected; and legal regulations, since UAV flights are subject to airspace regulations.
The application of UAVs in hydrography enables the acquisition of high-resolution geospatial data and ensures precision in determining their location. Drones are commonly used when creating geospatial models of land areas. Different types of sensors are used in this field, including digital cameras and lightweight multispectral cameras [15,16]. The data being acquired can include observations of changes in pixel intensity and digital images used to generate a point cloud by Structure-from-Motion (SfM) photogrammetry [17,18,19]. A study by Specht et al. [20] analysed methods that enable the acquisition of depth data through the use of a photogrammetric camera. It was finally decided that the method for determining shallow waterbody depths should be based on SfM photogrammetry and work with the SVR algorithm. This was due to the highest depth accuracy among the analysed methods for determining shallow waterbody depths being based on the images taken by a UAV. This method was created and implemented in the form of the “Depth Prediction” plug-in in the QGIS software [21] as part of the INNOBAT project, whose aim was to develop an integrated system using autonomous unmanned aerial and surface vehicles intended for bathymetric monitoring in the coastal zone. The INNOBAT system allows the seabed topography to be surveyed in accordance with the requirements set out for the second most stringent order of hydrographic surveys, namely the International Hydrographic Organization (IHO) Special Order (horizontal position error ≤ 2 m (p = 0.95), vertical position error ≤ 0.25 m (p = 0.95)) [22]. The conducted research showed high-accuracy depth measurements in shallow waters (less than 1 m deep) [23]. The resulting bathymetric and topographic model allows the accuracy requirements for determining depth provided by the IHO Special Order [24] to be met.
The integration of bathymetric and topographic data is an innovative solution allowing the coastal situation to be recognised [25,26,27,28]. Topobathymetric charts are often used in coastline monitoring to, among other things, detect unsafe levels of rising water. Bathymetric and topographic measurements are essential for generating datasets needed for terrain modelling, in particular in the coastal zone [29,30]. Such data are important for the planning, design and construction of engineering structures.
Topobathymetric charts are becoming increasingly popular, but acquiring the data for compiling them involves the use of a number of sensors. A study by Oladosu et al. [31] presents a Digital Terrain Model (DTM) resulting from bathymetric and topographic data integration. The study area was the Maiyegun Estate Waterfront in Nigeria. Topographic points on the beach were determined using the Global Navigation Satellite System (GNSS) Real-Time Kinematic (RTK) method and a rover. Bathymetric points were acquired using an echo sounder installed on a classic hydrographic vessel, and the echo sounder itself was integrated with an RTK receiver. Both the Triangulated Irregular Network (TIN) model and the DTM were developed in the ArcMap software. The processed data and their effect demonstrated the effectiveness of the integration of bathymetric and topographic data.
Another example of a successful bathymetric and topographic data integration is described in a study by Gesch and Wilson [32]. The study area was Tampa Bay in Florida, USA. The authors acquired the topographic data from the United States Geological Survey (USGS) National Elevation Dataset (NED) and the bathymetric data from the National Oceanic and Atmospheric Administration’s (NOAA) National Geophysical Data Center (NGDC) database. In addition, the topographic data recorded by the LiDAR system were used to demonstrate the usefulness of integrating these data with the existing ones. Detailed information on the sensors with which the data were collected is not known. The ArcInfo software was used to develop the topobathymetric chart. It was demonstrated that the most important elements for integrating data of different sources include the common horizontal and vertical reference system, mosaicking and surface interpolation.
Topobathymetric DTMs are most commonly developed based on the TIN model [33], so that details from measurements of high density are retained while minimising the risk of artefact emergence on the surface under study. This conclusion is described in a study by Yoon and Kim [34], demonstrated based on a measurement session on the Bogue Inlet coast in North Carolina, USA. The Kongsberg EM3002D MBES collected bathymetric data in the deeper part of the waterbody, while in the shallow water, a very shallow draft vessel with the Teledyne Odom Echotrac CV100 SBES installed was used. Topographic data were acquired based on photos and using the GNSS (mounted on an off-road vehicle).
The first chapter of this paper, Section 1 “Introduction”, presents the current state of knowledge regarding the performance of hydrographic surveys in shallow waters based on the data acquired from working with photos taken by a photogrammetric camera, an echo sounder, a GNSS RTK receiver, and a LiDAR system. Other topobathymetric studies and methods of data acquisition and integration are also reviewed.
This technical note aims to present a method for developing a DTM of the coastal zone based on topobathymetric data registered using remote sensors, such as a photogrammetric camera mounted on a UAV, as well as an SBES integrated with a GNSS RTK receiver placed on a hydrographic survey vessel. Moreover, the “Depth Prediction” plug-in was tested for determining shallow waterbody depths based on images taken by a drone. This plug-in was created in the QGIS software as part of the INNOBAT project.
The remainder of this technical note is organised as follows: Section 2 “Materials and Methods” chapter describes the area in which the measurement sessions were carried out and the equipment used along with its characteristics, as well as includes the methodology used to acquire bathymetric and topographic data. The same section also includes a description of data processing and integration, as well as the development of the DTM of the coastal zone. Section 3 “Results” presents the developed topobathymetric model and the workflow with the registered topobathymetric data, which describes the stages in developing this model. In addition, the accuracy of the generated DTM of the coastal zone is assessed. Section 4 “Discussion” compares this publication with the most similar publications regarding the development of the topobathymetric model. This technical note ends with general conclusions.

2. Materials and Methods

This chapter provides information on the area under study, the equipment used during the measurement missions, as well as the methods for processing bathymetric and topographic data.

2.1. Measurement Location

The waterbody in which the measurements were carried out was the Vistula River mouth in Gdańsk (Pomorskie Voivodeship, Poland), and more precisely, one of the estuary arms of the Vistula River, commonly referred to as the Vistula Śmiała [35]. The Vistula Śmiała River, with a total length of 2.5 km [36], which flows into Gdańsk Bay, separates Port Island (in the west) from Sobieszewska Island (in the east). The characteristic features of the west bank include the structures of the Wisła Shipyard and the National Sailing Centre (NSC) of the Gdańsk University of Physical Education and Sport (GUPES). The site also includes the Green Islands, which are an ecological site [37]. The beach surface, along which the surveys were conducted, is sandy. The Vistula Śmiała River mouth in Gdańsk is located in Universal Transverse Mercator zone 34 North (UTM 34 N) (Figure 1) [38].

2.2. Measurement Equipment

Deep-water bathymetric measurements at depths greater than 1 m were carried out using the Echologger EU400 SBES [39] integrated with the Trimble R10 GNSS RTK receiver [40]. Raw depth data were recorded in the HYPACK 2023 software. The instruments were installed on a hydrographic vessel, and the passes over the sounding profiles were conducted by the vessel’s helmsman. Technical data of the Echologger EU400 SBES (Eofe Ultrasonics Co. Ltd., Goyang-Si, Republic of Korea) and the Trimble R10 GNSS RTK receiver (Trimble, Tokyo, Japan) are shown in Table 1.
The Trimble R10 GNSS RTK receiver was also used for shallow water bathymetric measurements at depths less than 1 m, carried out by a traditional geodetic (staking) method characterised by high accuracy [41], especially under non-forested and undeveloped conditions [42].
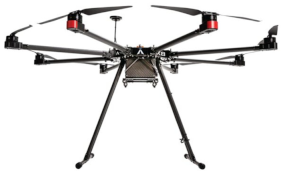
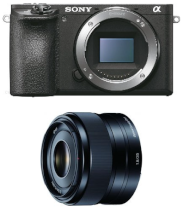
To densify bathymetric data and determine the coastline as accurately as possible, the Aurelia X8 Standard LE UAV (Aurelia Aerospace, Shizuoka, Japan) was used. It is an octocopter that enables efficient flight in case of failure of one of the eight rotors [43]. The camera installed on the UAV was the Sony A6500 camera with the Sony E 35 mm f/1.8 OSS lens (Sony, Tokyo, Japan) [44,45]. Technical data of the Aurelia X8 Standard LE drone and the Sony A6500 with the Sony E 35 mm f/1.8 OSS lens are shown in Table 2.
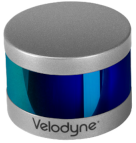
The aerial system also included the Velodyne VLP-16 Lite LiDAR system [46], integrated with the SBG Ellipse-D Inertial Navigation System (INS) [47]. The integration of this particular LiDAR system, which is one of the most popular solutions on the market [48], with a positioning system, was possible through data recording in the HYPACK 2023 software. Technical data of the Velodyne VLP-16 Lite LiDAR system and the SBG Ellipse-D INS are presented in Table 3.

2.3. Realisation of Bathymetric and Topographic Measurements

To develop a chart containing both bathymetric and topographic data, a number of measurements were carried out using the equipment described in Section 2.2. A total of two survey missions were completed on 26 September 2023 and 7 November 2023.

2.3.1. Measurement Campaign Conducted on 29 September 2023

The measurements of 29 September 2023 had to be started with the design of sounding profile plans for the shallow-water bathymetry, carried out with the use of a GNSS RTK receiver and for the deep-water bathymetry, which was conducted using an SBES integrated with a GNSS RTK receiver. In addition, a UAV flight was performed to record LiDAR points. Hydrographic surveys were conducted in appropriate hydrometeorological conditions, i.e., with no wind and small waves. Water levels from specific hours were taken into account in the development of the topobathymetric chart. Three-dimensional (3D) position coordinates were recorded in the PL-UTM system (zone 34 N; deep-water bathymetry, shallow-water bathymetry, LiDAR points) and the heights were provided in the PL-EVRF2007-NH system.
Bathymetric measurement near the shore using an SBES is impossible to carry out. Instead, these sites were surveyed using the traditional method and the “Depth Prediction” method proposed by Szostak et al. [21]. The hydrographic survey carried out by the traditional geodetic method and using an SBES provided a total of 1124 depth points (including the positive ones, representing the beach along the coastline, as shown in Figure 2).
As for the measurement conducted by the traditional geodetic method, very accurate precision, both horizontal and vertical, was achieved, which is the effect of the application of the RTK method with an appropriate number of satellites seen, the accuracy of the Trimble R10 GNSS RTK receiver and the precision of survey performance by the operator. The horizontal precision ranged from 0.02 m to 0.039 m; however, the vertical precision ranged from 0.023 m to 0.046 m. However, the use of the Trimble R10 GNSS RTK receiver, which was automatically synchronised with the Echologger EU400 SBES in the HYPACK 2023 software, allowed for depth measurement with an accuracy of approx. 5 cm Root Mean Square (RMS).
The second stage of the first measurement campaign involved the recording of a point cloud using a LiDAR system and a UAV. The recording, as in the case of the SBES, was carried out in the HYPACK 2023 software. Due to the relatively small area, a flight was performed along three measurement lines at a height of 69.9 m (Figure 3).
The designed survey mission was carried out by the UAV in autonomous mode. During the photogrammetric flight, LiDAR data were recorded with a positioning accuracy of 3 cm RMS. The LiDAR data were consistent with bathymetric data and covered the area along the coastline, reflecting both the sandy beach surface and further features of the area, such as vegetation.

2.3.2. Measurement Campaign Conducted on 7 November 2023

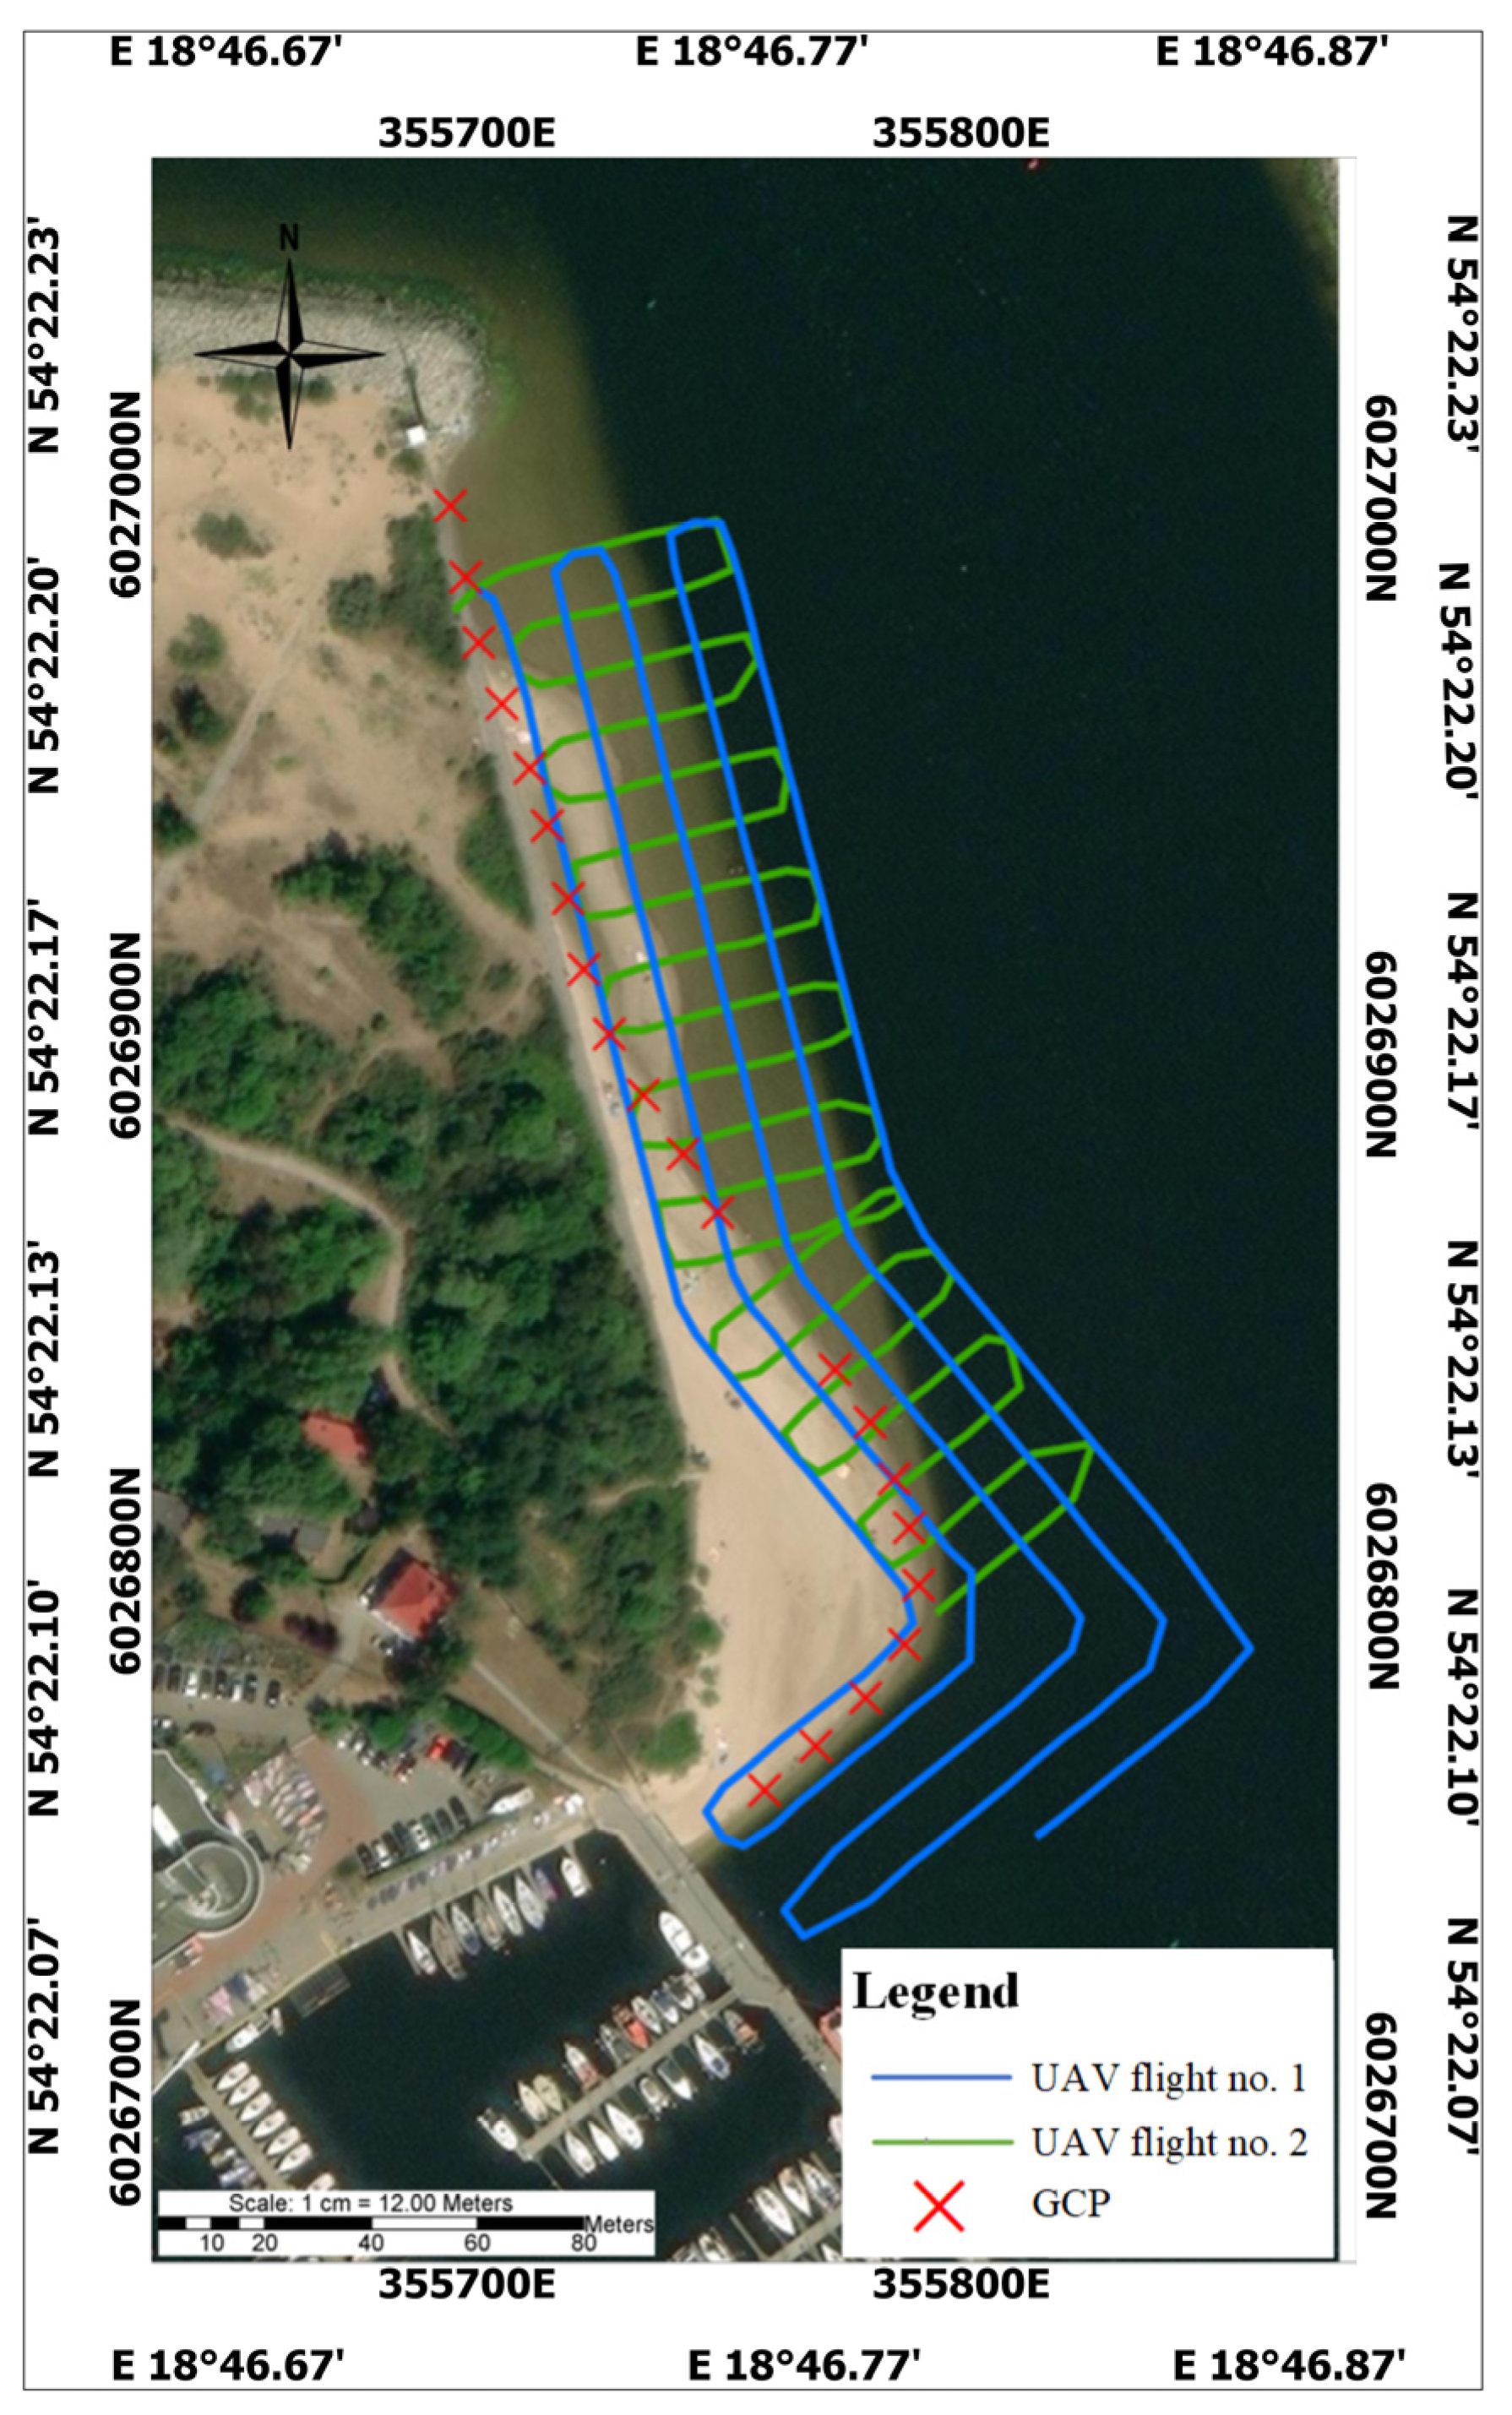
The measurements conducted on 7 November 2023 were aimed at acquiring photos through the use of the Aurelia X8 Standard LE UAV and the Sony A6500 camera with the Sony E 35 mm f/1.8 OSS lens. The aerial images and the products obtained from them, e.g., files in the LAS format, allowed the shallow-water bathymetry to be densified at further stages, thereby increasing the measurement precision. The mission was completed in windless weather. The water level from a specific hour of the flight pass performance was taken into account in the further development of the bathymetry. The flight pass was performed autonomously by a drone at a height of 120 m. In addition, a polarising filter was installed on the camera, which enabled a reduction in undesirable reflections on the image [49]. Moreover, the area was covered with 21 Ground Control Points (GCPs), which were determined with high accuracy by the GNSS RTK method in the PL-UTM (zone 34 N) and the PL-EVRF2007-NH height system. GCPs were designed along the coastline as close as possible to the shore at equal distances in accordance with the methodology developed in the publication [50]. The distribution of GCPs and UAV flights in the study area is presented in Figure 4. Both the mean horizontal precision and the mean vertical precision of GCPs amounted to approx. 0.03 m.
During the measurement campaign, 804 high-quality photos were obtained, in which control points could be identified without problems for further georeferencing. The images enabled the coverage of the coastal zone of the beach under study, which was assessed as a satisfactory result meeting the aim of the survey mission.

2.4. Data Processing

The points obtained by the traditional geodetic method had to be read in the XLSX format, and for the height (depth) values, the water level from the particular hours on the day of the first measurement campaign had to be taken into account. Since further work was carried out in the ArcMap 10.8.2 software, it was necessary to record the point coordinates in the PL-UTM/PL-EVRF2007-NH systems in the TXT format. A total of 248 depth points were determined using the geodetic method. The highest recorded height was 0.09 m and the lowest height value amounted to −0.76 m.
The bathymetry performed through the use of an SBES required the cleaning of the so-called spikes, i.e., points being artefacts [51] that are not part of the seabed. To this end, the HYPACK 2023 software and the Single Beam Editor (64-bit) tool, which enables manual cleaning of the data derived from the echo sounder, were applied, although automatic filters can also be used. The cleaned data in the PL-UTM/PL-EVRF2007-NH systems were recorded in the TXT format, while maintaining the same column layout as that for the bathymetric data measured by the GNSS RTK receiver. A total of 876 depth points were determined using an SBES. The lowest recorded depth was 0.5 m and the highest depth value amounted to 7.71 m.
The LiDAR data were also processed in the HYPACK 2023 software but used the 64-bit HYSWEEP EDITOR tool instead. As the system was mounted on a UAV, it was necessary to take into account both the flight altitude and the geometric relationships between the INS and the LiDAR system. Based on the Global Positioning System (GPS) log files derived from the camera installed on the drone, it was possible to acquire information on the UAV’s flight altitude during the survey, which was 69.9 m. The LiDAR system was calibrated before the first measurement campaign, and the Roll, Pitch, and Yaw (RPY angles) values resulting from the calibration were included. The cleaned data in the PL-UTM/PL-EVRF2007-NH systems were recorded in the TXT format while maintaining the same column layout as that for bathymetric data measured by the Trimble R10 GNSS RTK receiver and the SBES. After filtering and data reduction, 3,379,884 LiDAR points remained. The highest recorded height was 0.29 m and the lowest height value amounted to 4.99 m.
All of the three files in the TXT format described above were merged together into a single TXT file, and a point object characteristic of the ArcMap, i.e., the shapefile, was created. A visualisation of the integrated data derived from a total of three mutually independent instruments (GNSS RTK receiver, LiDAR system, SBES) is presented in Figure 5.
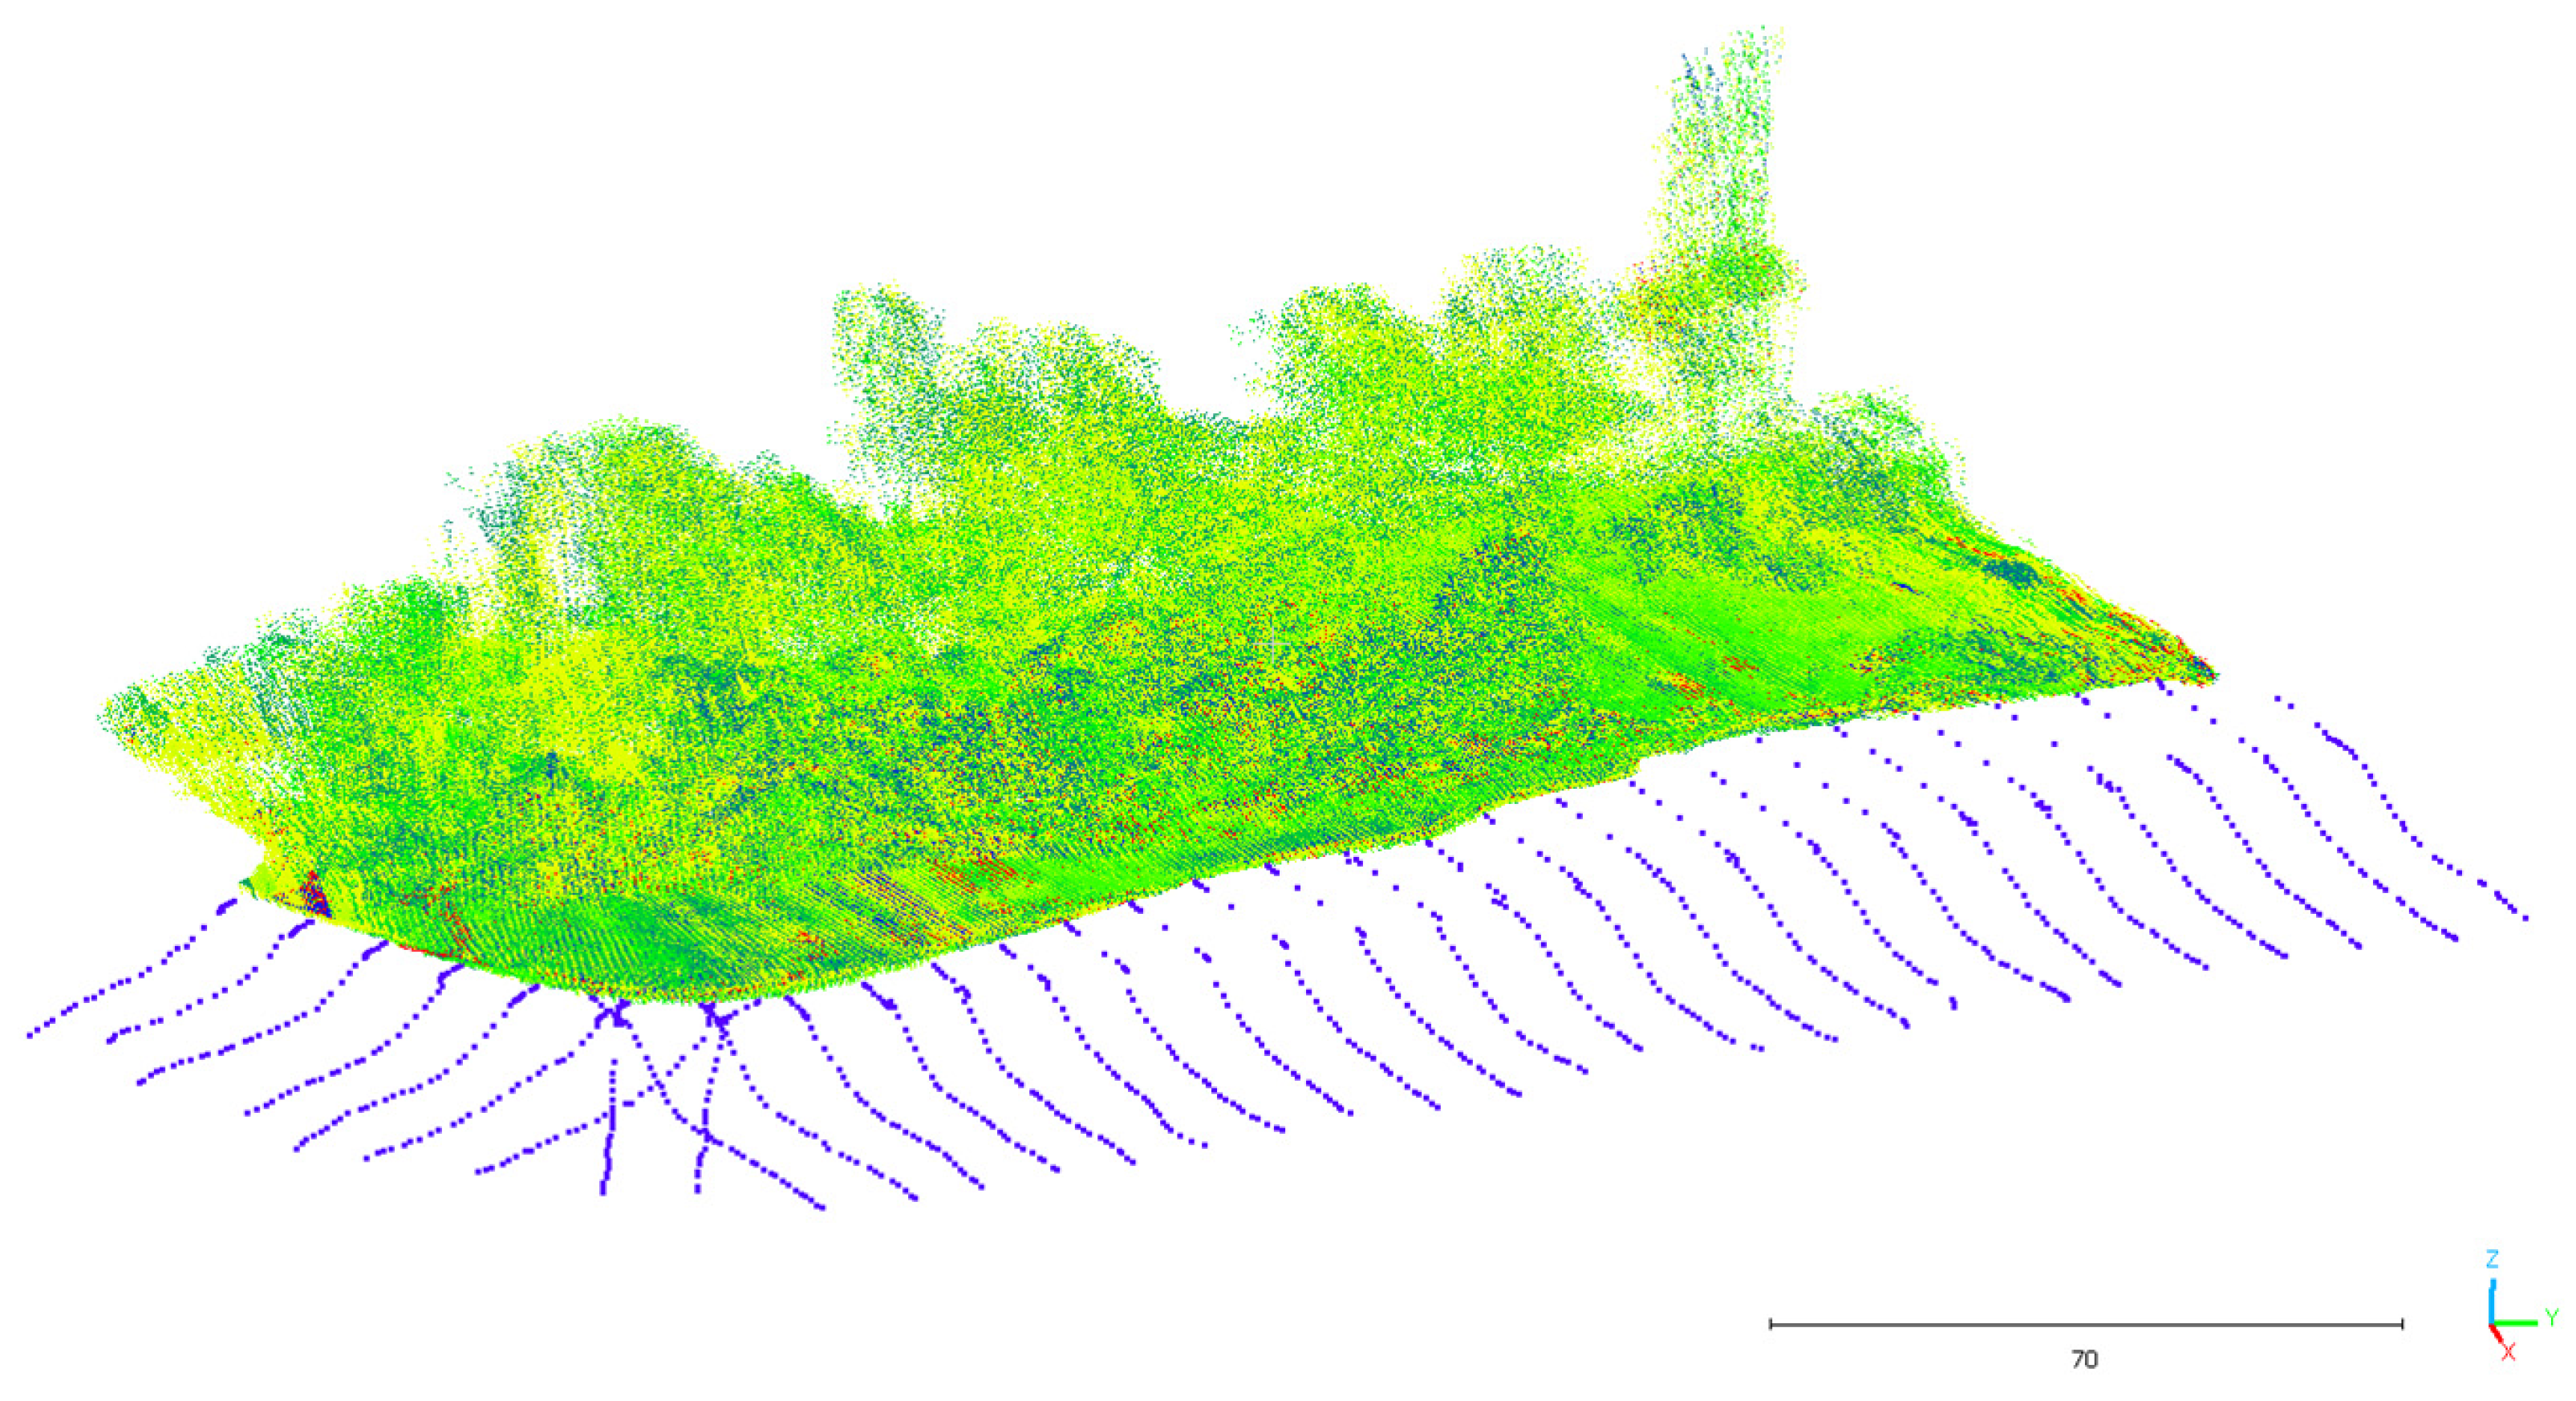
The photos derived from the Sony camera installed on the Aurelia X8 Standard LE UAV and GCPs recorded during the second measurement campaign had to be entered into the Pix4Dmapper 4.7.5 software. This program allows a point cloud to be obtained based on the above input data, as it operates based on the SfM algorithm [52,53], distinguished by its provision of three-dimensional scenes. To this end, a series of temporal RGB images (photos) and georeferencing information (control points) were used. Thanks to using automatic algorithms for estimating the camera’s position, it also provides information on the internal and external camera’s orientation at the time of acquiring each image, which enables the determination of how individual three-dimensional coordinates are projected onto the resulting photos [18,54]. In the Pix4Dmapper 4.7.5 software, it was also necessary to define the output coordinate system, which in this case was the PL-UTM system (zone 34 N), i.e., the same as that in each previously described independent survey. Figure 6 shows the georeferenced images and a point cloud in the LAS format obtained based on the SfM algorithm. The generated point cloud consisted of 16,361,541 points and covered an area of 0.020 km2. A total of 86% of images (343 out of 398) were calibrated. The mean georeference error was 0.115 m and the mean vertical error was 0.104 m.
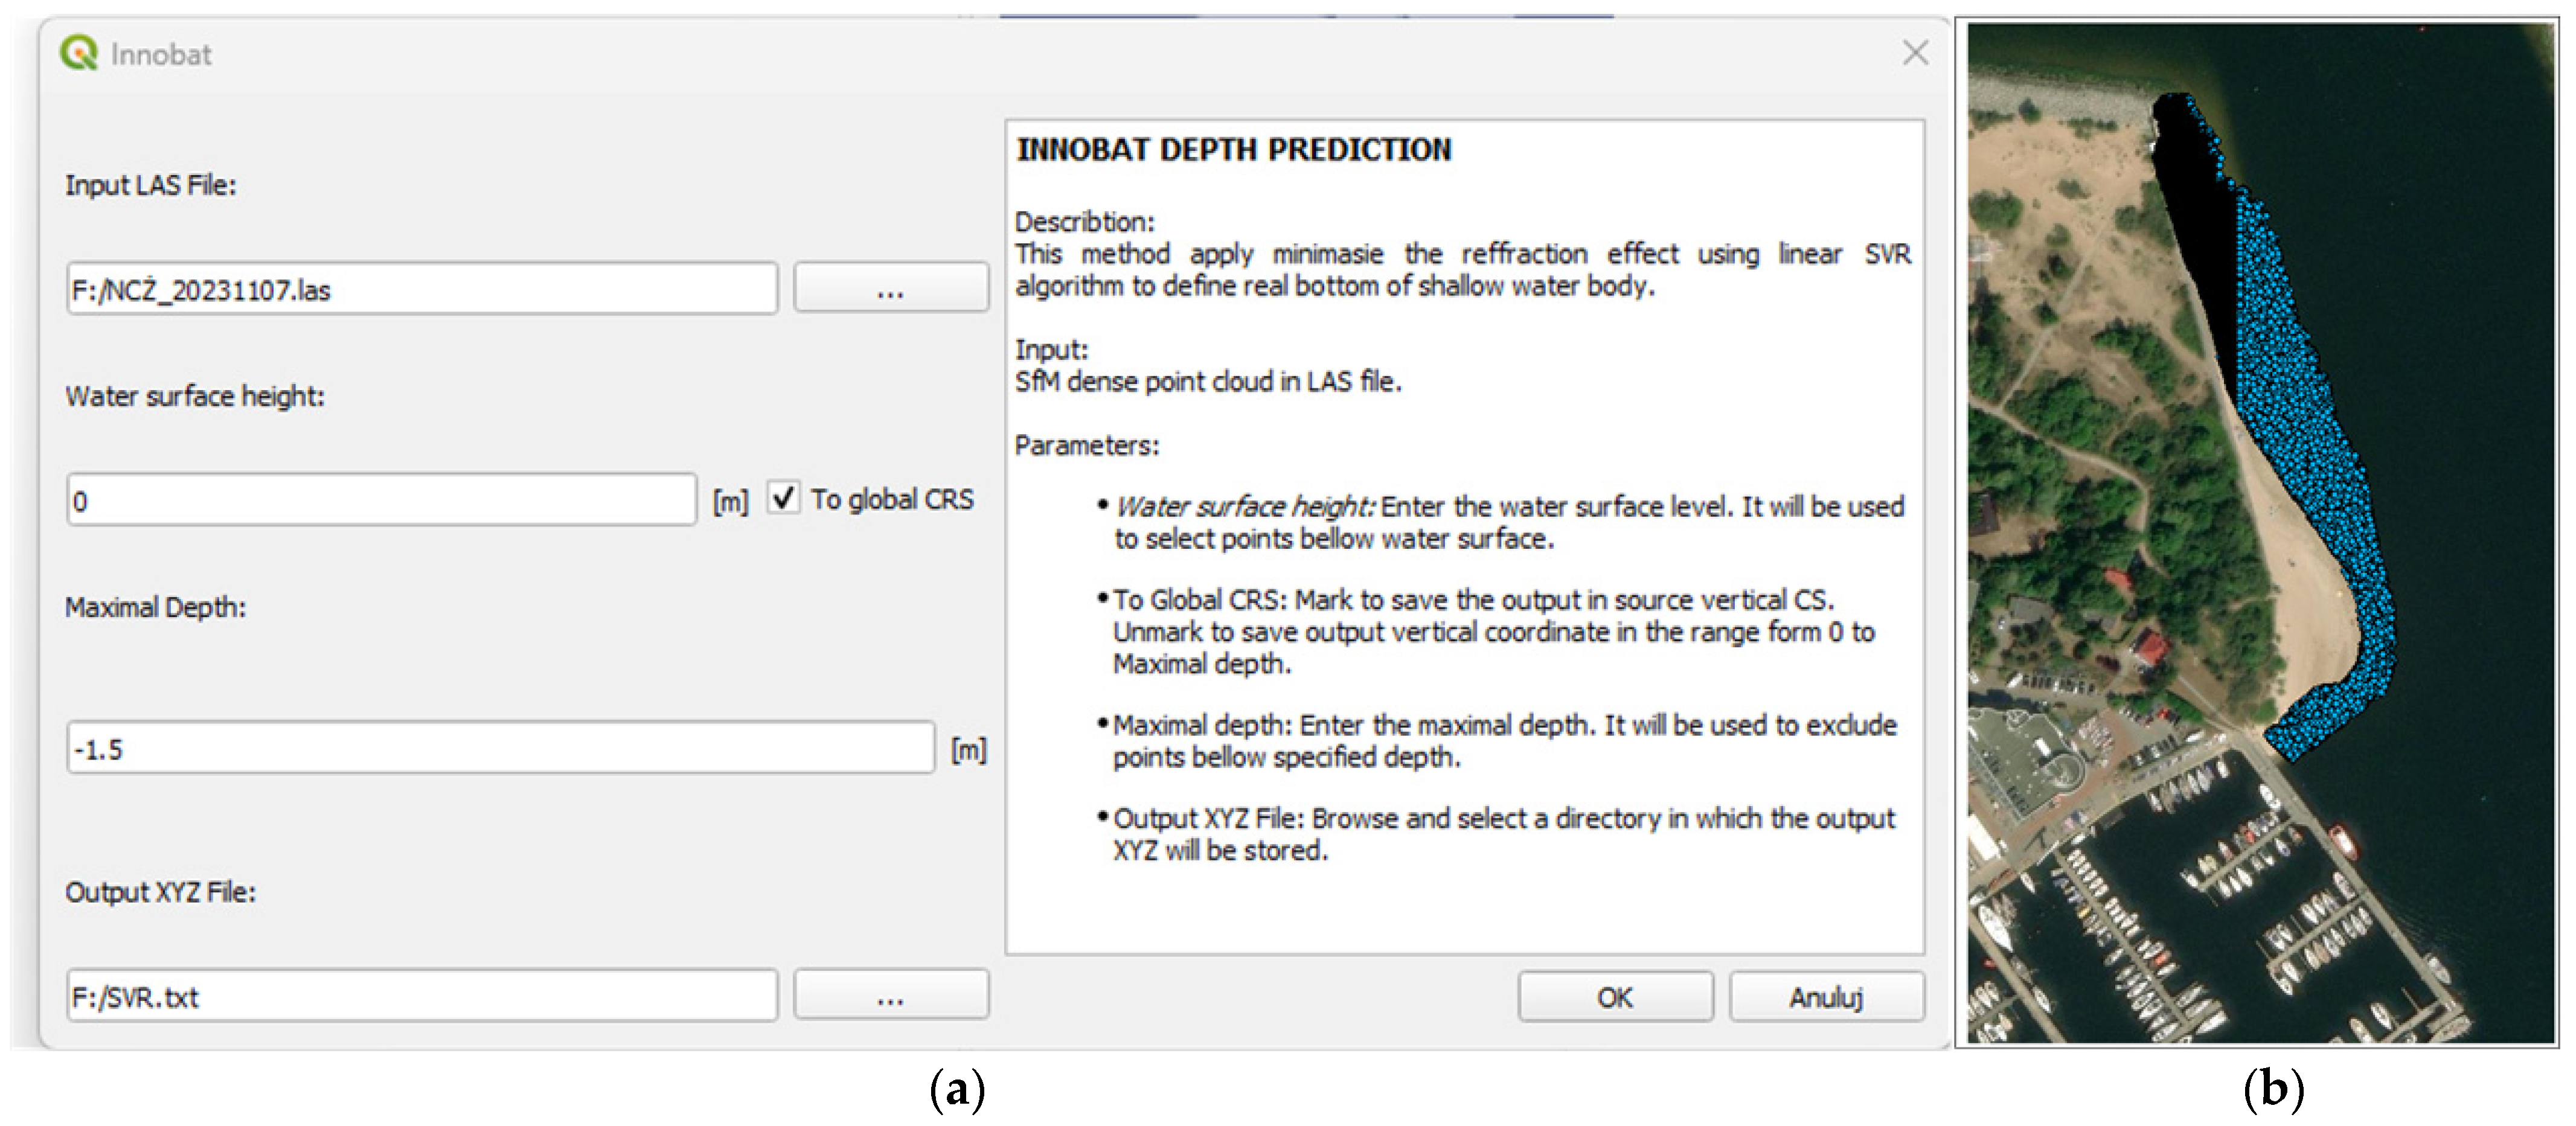
The file in the LAS format was essential for determining the depth points using the “Depth Prediction” plug-in installed in the QGIS 3.40 software. This plug-in allows depths to be predicted and recorded in the XYZ and TXT formats. Based on research conducted as part of the INNOBAT project, a value of 1.5 m was selected as the maximum depth [23]. Figure 7 shows the plug-in window and settings for the area discussed in this study, as well as the final result as a shapefile created in the ArcMap 10.8.2 program, following a reduction in the number of points in the CloudCompare 2.13.2 software.
In the ArcMap 10.8.2 software, it was possible to integrate files in the SHP format into a single file. Then, we created a TIN model, and on its basis, isobaths with an interval of 1 m were generated. The raster image files and the resulting isobaths were clipped to the individually defined area. An appropriate colour scheme was also set. The base map was downloaded from the ArcGIS library.
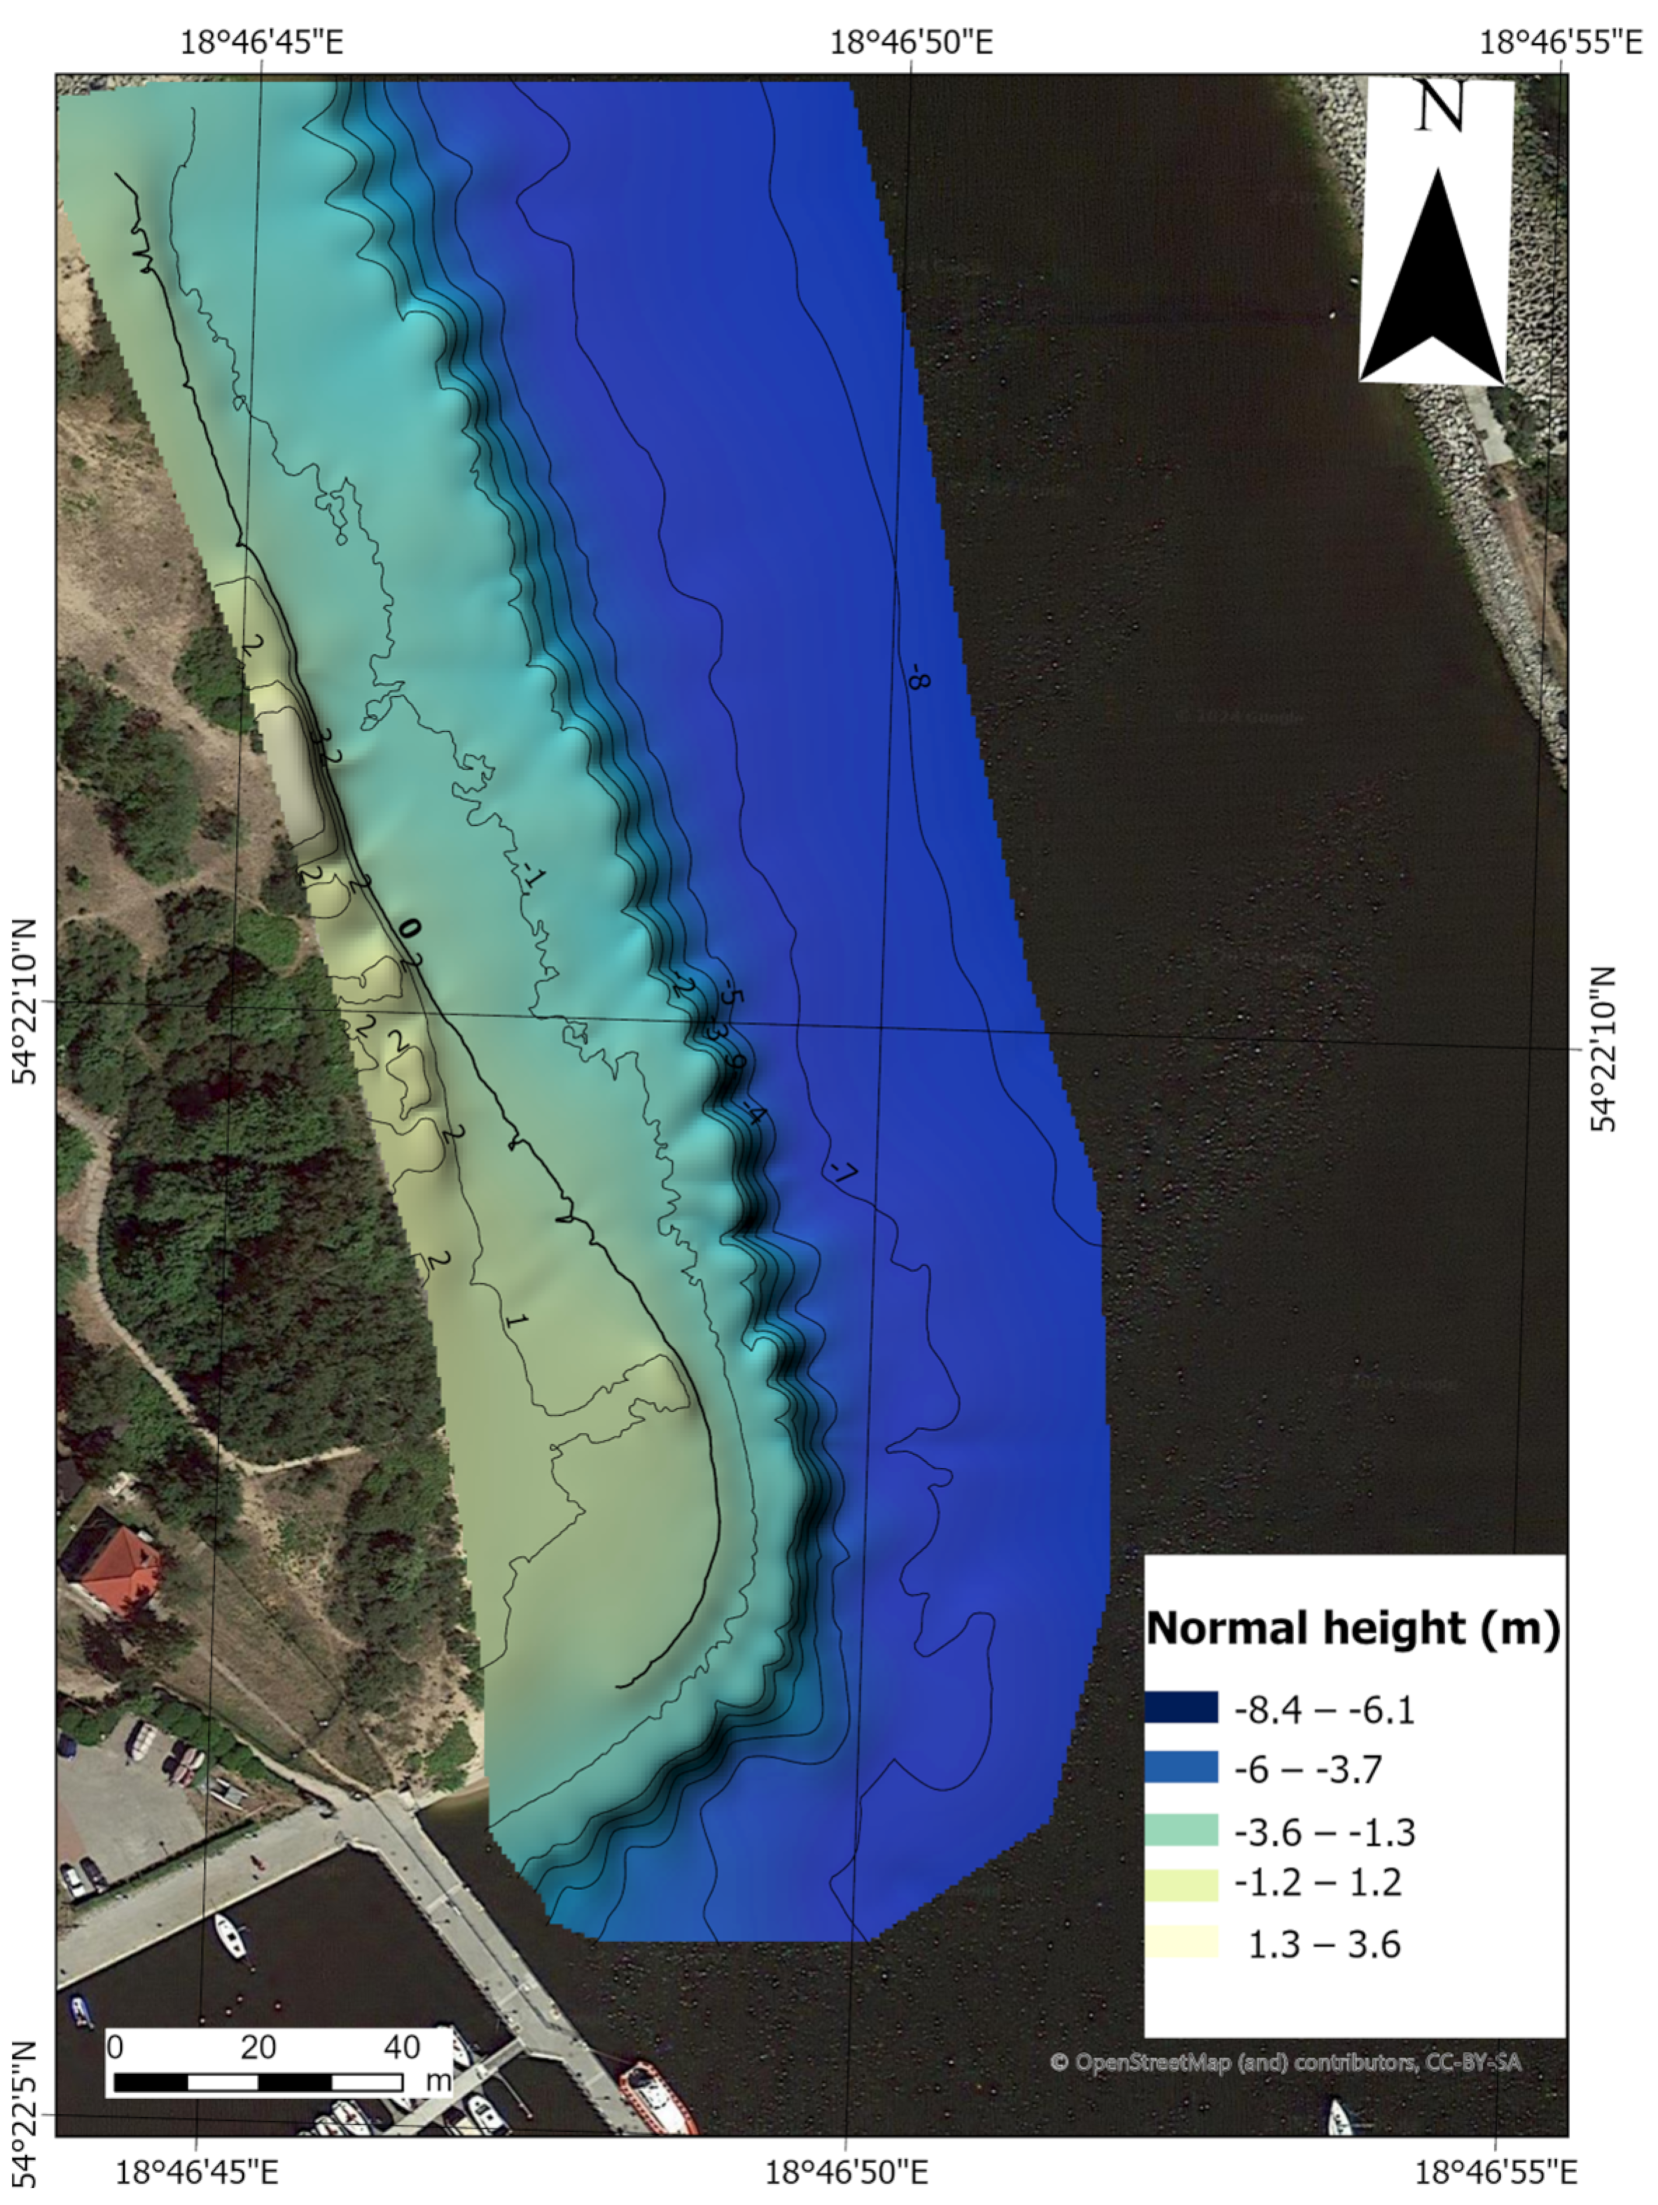
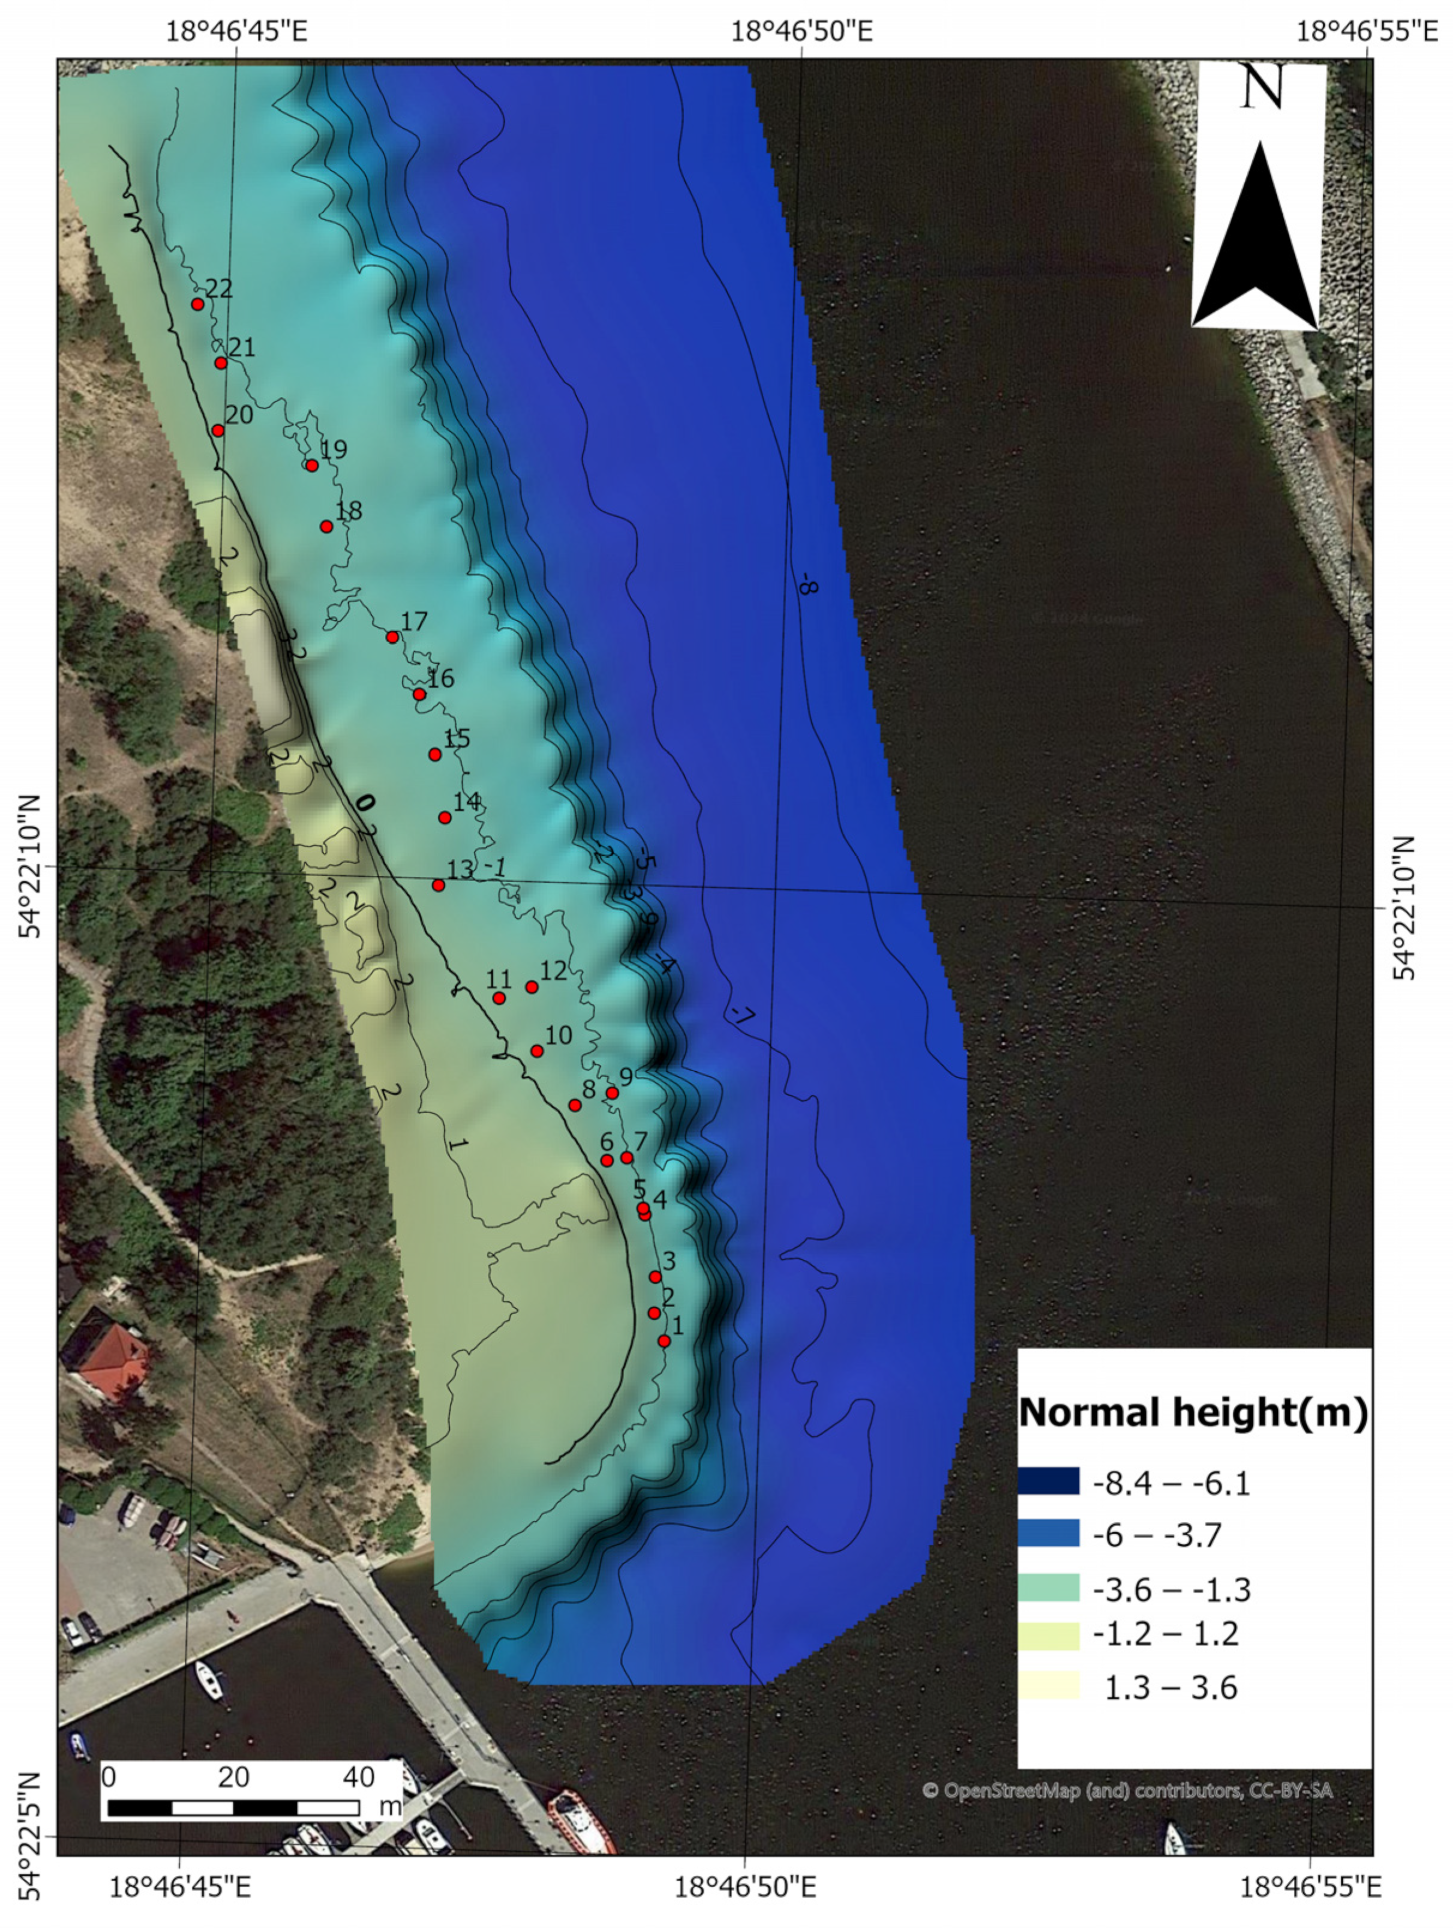
The completed measurement missions and the processing of data along with their integration resulted in a TIN model along with isobaths, based on which a bathymetric and topographic DTM, showing the coastal zone and the seabed topography of the Vistula Śmiała River mouth in Gdańsk, was created (Figure 8). A total of 443,190 points were used to develop the digital terrain model of the coastal zone, including the following:
  • A total of 280 bathymetric points measured with the use of a GNSS RTK receiver;
  • A total of 844 bathymetric points recorded using an SBES;
  • A total of 119,462 bathymetric points generated with the use of the “Depth Prediction” method;
  • A total of 322,604 topographic points generated using the SfM method.
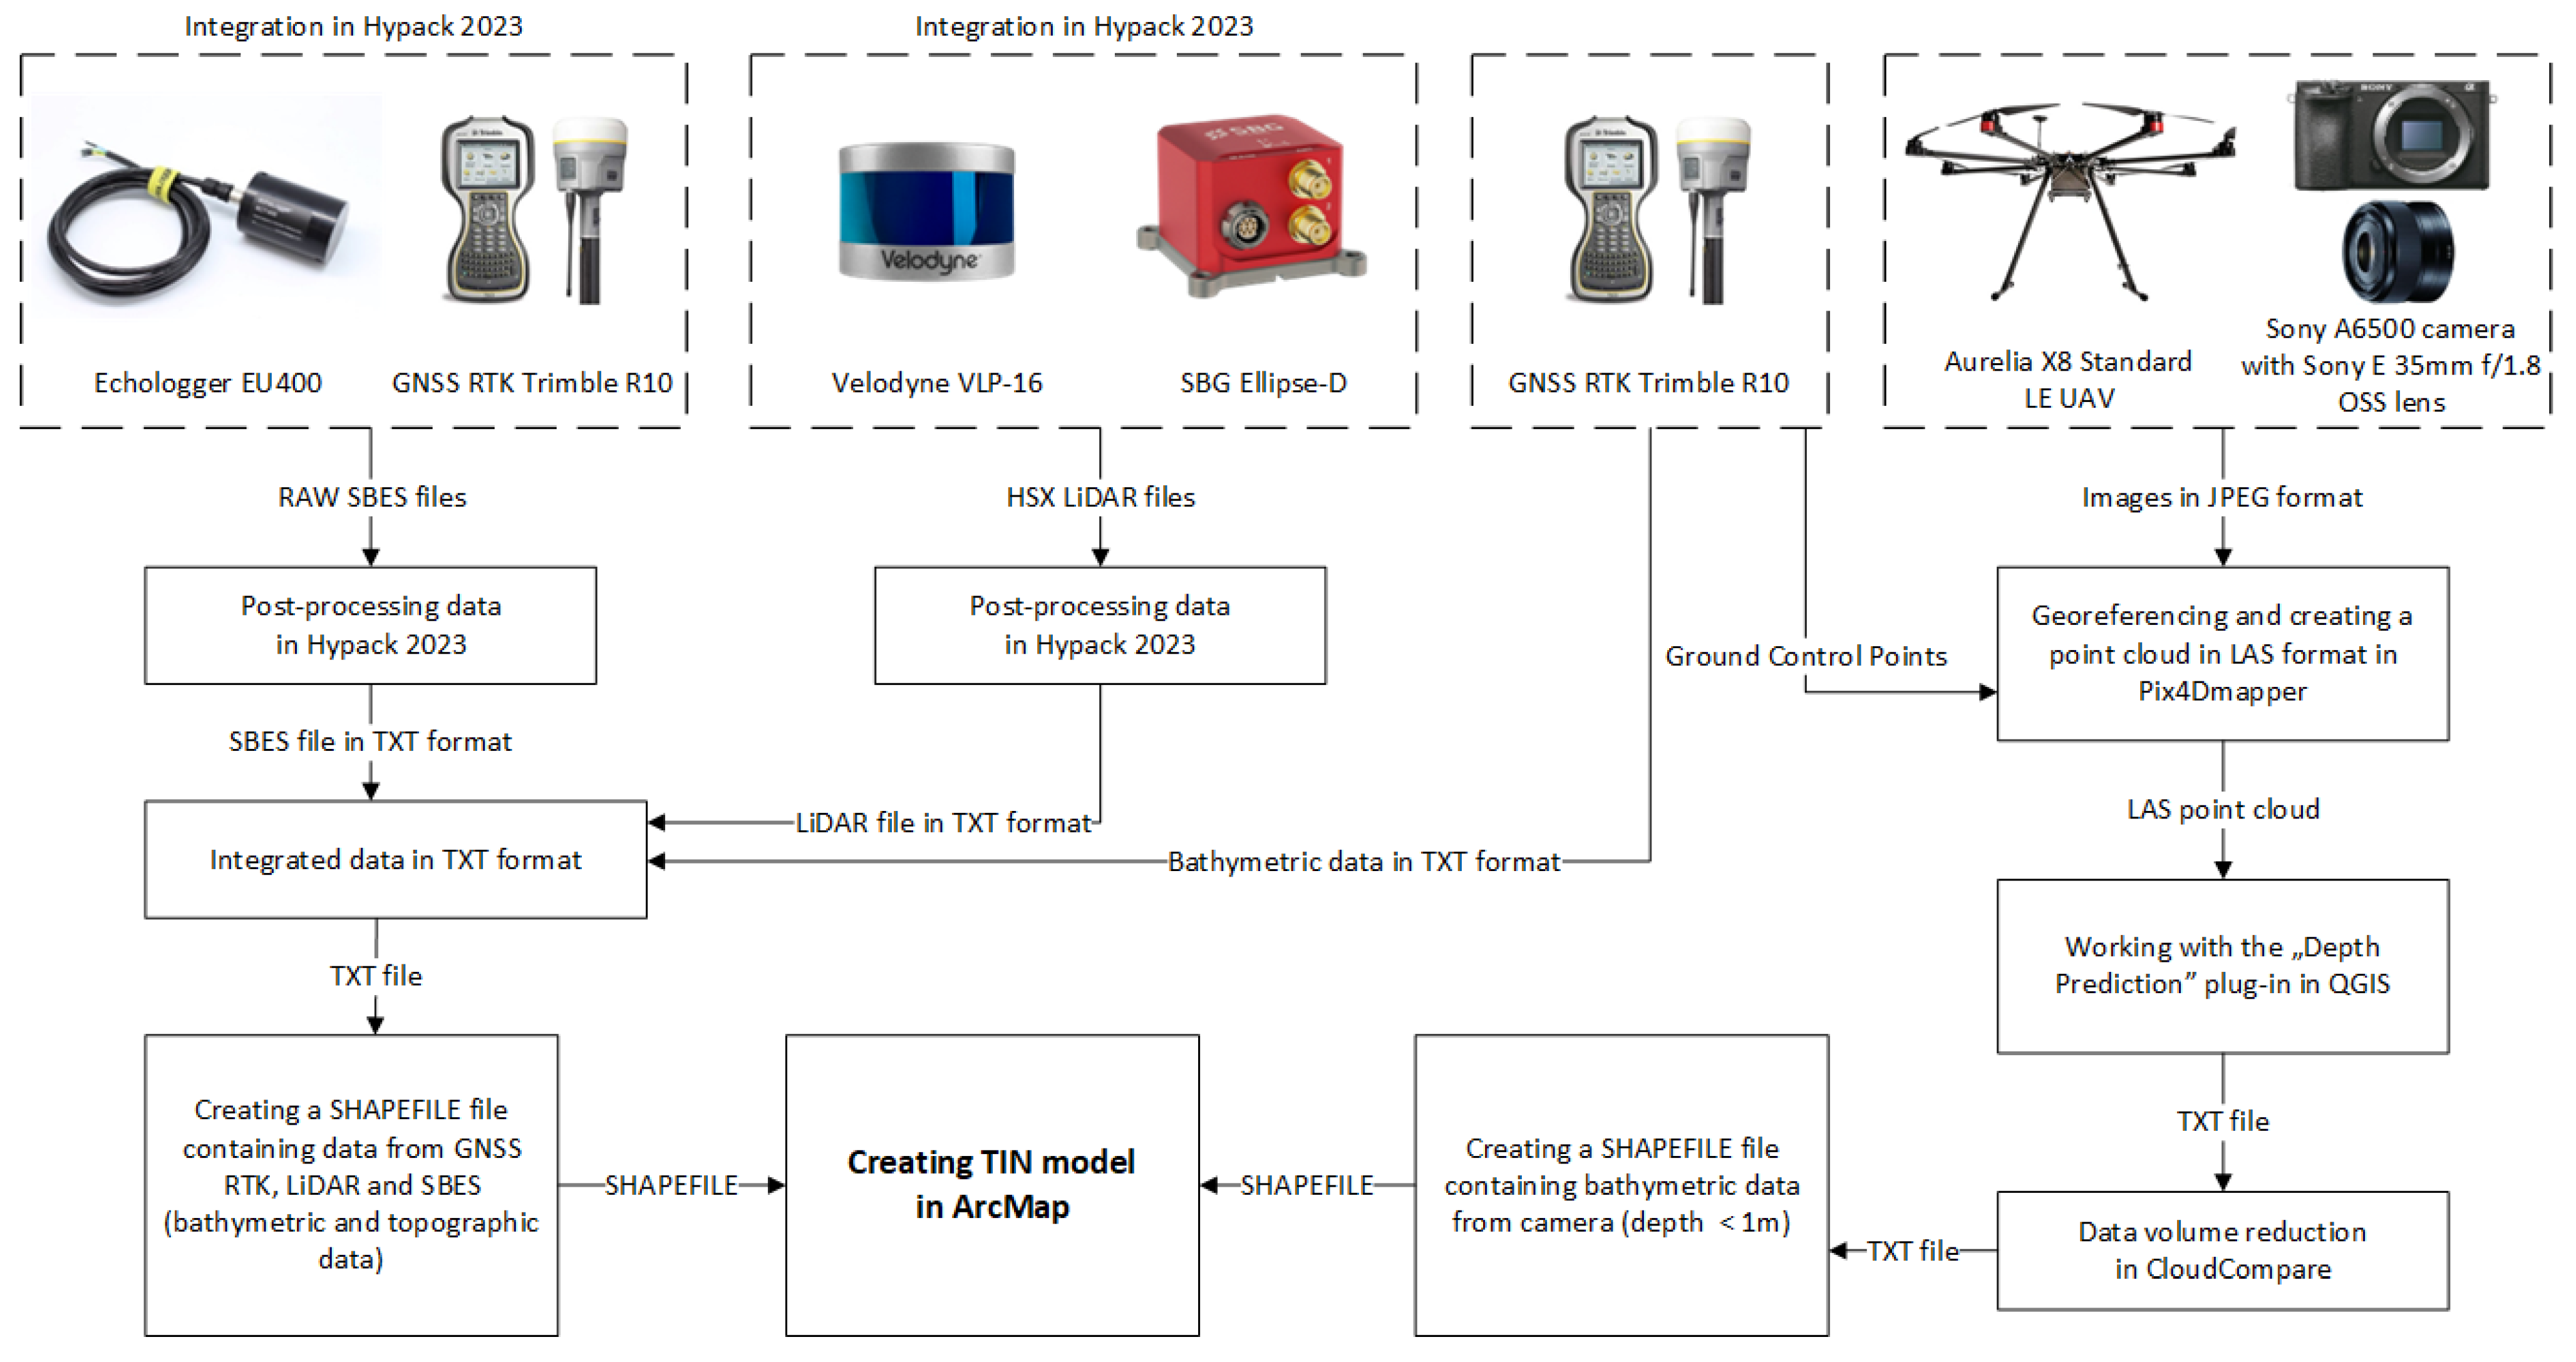
Data processing was based on the need to work using several programs (ArcMap, HYPACK, Pix4Dmapper, QINSY). The shallow-water bathymetry points covered the entire zone in detail, and the application of the same horizontal (PL-UTM) and vertical (PL-ETRF2007-NH) systems enabled an integration of all the data, even though their recordings were independent of each other. A diagram was developed to describe the work with bathymetric and topographic data to create a model covering both the land and water parts (Figure 9).

3. Results

The coastal zone of the Vistula Śmiała River mouth in Gdańsk is a recreational place due to the sandy beach located in this area. The seabed topography is characterised by a quite gentle descent into the water, because the 1 m isobath is located at a distance of no less than 10 m from the shore, while the 2 m isobath is within 15 m of the coast. A sudden drop in the waterbody depth can be observed from the 2 m isobath to the 6 m isobath, because the distance between them is approx. 10 m. At a distance of 50 m from the shore, the waterbody depth amounts to approx. 7 m, while at a distance of 80 m from the coast, the waterbody depth is about 8 m. In this part of the waterbody, there is a water route connecting the Vistula Śmiała River mouth with Gdańsk Bay. The greatest slope of the terrain can be observed in the southern part of the beach. This is most likely due to the proximity of the NSC-GUPES. To generate the contours and calculate the distances between them, we used the Contour tool in the ArcMap software, which creates a class of contour features from a raster surface. The input file was a file generated using the Topo to Raster tool. In ArcMap’s Contour tool, an interval of 1 m was selected, and the program generated contours and calculated the distances between them automatically. The distance ranges from the shoreline to each isobath are presented in Table 4.
The validation of a DTM consists of determining whether it meets user requirements based on adopted quality criteria. For each criterion, a quality assessment procedure can be used to decide whether a digital terrain model is acceptable for a given use [55]. In the first approach, the DTM is compared with a reference dataset (external validation), whereas in the second case, the quality of the digital terrain model is determined without any reference data (internal validation) [56]. The main external assessment approach is to assess the accuracy of a DTM using ground control data [57]. The second external approach consists of processing simulated images to derive a DTM and to compare the output digital terrain model with the input DTM used to simulate the synthetic image dataset [58]. However, the main internal assessment approaches include visual control [59] and internal quality assessment, which are based on the hypothesis that all topographic surfaces are supposed to fulfil some universal rules [60]. For the purposes of this technical note, it was decided to assess the quality (accuracy) of the developed DTM using underwater GCPs, whose coordinates were treated as reference.
Next, it was decided to assess the accuracy of the generated DTM of the coastal zone based on bathymetric and topographic data integration. For this purpose, depths obtained from the topobathymetric model were compared with the depths of underwater GCPs, which were determined using a GNSS RTK receiver and were considered as reference values. Underwater GCPs were evenly distributed throughout the waterbody to a depth of 1 m so that the position coordinates could be measured by the operator. The location of underwater GCPs used to validate the created DTM is shown in Figure 10.
To assess the accuracy of the generated DTM of the coastal zone, it was decided to calculate the population standard deviation (σ) for 22 underwater GCPs:
σ = i = 1 N x i μ 2 N ,
where
  • σ—population standard deviation;
  • N—number of depths in the population;
  • xi—each depth error value from the population;
  • μ—population mean.
Then, it was decided to convert depth errors from a confidence level of 68% to 95% using the following relationship [24]:
T V U = 1.96 σ ,
where
  • TVU—total vertical uncertainty at a confidence level of 95%.
Table 5 presents the accuracy statistics of the generated DTM of the coastal zone based on bathymetric and topographic data integration.
To assess whether the generated DTM of the coastal zone meets the requirements for determining the depth, which are provided by the IHO Special Order (depth error ≤ 0.25 m (p = 0.95)), it was decided to calculate the maximum allowable TVU [24]:
T V U max d = a 2 + b d 2 ,
where
  • TVUmax(d)—maximum depth error at a confidence level of 95%;
  • a—depth-independent component of measurement error;
  • b—coefficient representing the depth-dependent component of measurement error;
  • d—waterbody depth.
Since the underwater GCPs were located at depths less than 1 m, the maximum allowable TVU should not exceed 0.25 m for the IHO Special Order. To meet these accuracy requirements, the total depth error at a confidence level of 95% (TVU) cannot be greater than the maximum depth error at a confidence level of 95% (TVUmax(d)):
T V U T V U max d
It is reasonable to conclude that the accuracy of the generated DTM of the coastal zone was 0.248 (p = 0.95). This means that the proposed method for developing a terrain model based on bathymetric and topographic data integration meets the accuracy requirements for determining the depth, which are provided by the IHO Special Order.

4. Discussion

The most closely related publication authored by Lubczonek et al. [61] presents a method for combining data collected from UAV and Unmanned Surface Vehicle (USV) to form a digital representation of the shallow waterbody bottom, covering both the land and water parts. Key components of the suggested approach include using underwater GCPs to collect UAV data, analysing a ground class point cloud, generating a mask according to the bathymetric reference surface, and removing points located above the water surface. In the methodology described, the authors suggest using the HL mask as a more versatile option. The experiments took place on Lake Dąbie in Poland, a waterbody with an average depth of 2.61 m. The UAV and USV datasets were combined to create surface models using various interpolation techniques. Studies have demonstrated that combining data from both UAV and USV vehicles allows for the creation of a bathymetric model for the shallow waterbody with an accuracy of 3 cm RMS. In contrast to the method suggested in this technical note, bathymetric information in shallow waters was acquired with an echo sounder on a USV, instead of using the SfM technique.
Genchi et al. [62] present a method for developing a topobathymetric model using low-cost UAV and USV vehicles in a shallow tidal environment. In addition, a cross-analysis of the topobathymetric model and tidal data was performed to provide a classification of hydrogeomorphic zones. The tests were conducted in the Bahía Blanca estuary in Argentina. As a result of the study, a DTM was developed with a spatial resolution of approx. 0.08 m (land part) and 0.50 m (water part). The accuracy of the created topobathymetric model was 0.09 m (land part) and 0.18 m (water part). Moreover, the accuracy of the SfM model was assessed. It was 0.09 m RMS for the vertical plane. Based on the obtained research results, it can be concluded that the created topobathymetric model precisely reproduces landforms.
Mazza et al. [63] carried out research to estimate bathymetric accuracies in shallow waters and examine the adaptability of drone-based surveys, even with a targetless approach. The Roman fish tank of “Punta della Vipera” served as the study object. It is situated near the Italian village of Santa Marinella at a depth of up to 1.6 m. Two UAVs were applied in the study to develop a topobathymetric model using the SfM method. Validation studies were conducted to evaluate the correctness of the resulting 3D model. GCPs were calculated using an underwater camera (snorkeler-based) and a GNSS RTK receiver. Submerged topography can potentially be defined by combining SfM photogrammetry with UAS-based surveys. A topobathymetric model with a high resolution of 0.02 m and a vertical accuracy ranging from 0.06 m to 0.29 m was obtained because of the SfM photogrammetry.
The papers by Lubczonek et al. and Genchi et al., similarly to this technical note, concern methods for developing a DTM of the coastal zone based on bathymetric and topographic data integration. However, neither of these two publications assessed the accuracy of the generated SfM model for the water part. Another paper by Mazza et al. concerned, among others, assessment of the accuracy of the Digital Bathymetric Model (DBM) generated using the SfM technique. The obtained accuracy of the SfM model is similar to that obtained in this publication. Thanks to this, it can meet the accuracy requirements for determining depth, which are provided by the IHO Special Order.

5. Conclusions

This study has shown that data integration is an effective method. Creating bathymetric and topographic charts requires expensive equipment and accurate planning of the survey missions, which is time-consuming. However, the DTM can combine the land and water parts of the coastal zone, providing real observations of situations, such as coastline shifts and topography changes, especially in areas with a sandy surface. To ensure high accuracy, it is important to conduct measurements and process data in the same vertical and horizontal systems. In addition, when the measurement campaigns are carried out on other days, the water levels need to be taken into account. In this case, the information made available by the IMGW-PIB was used [64]. This National Research Institute provides a hydrological and meteorological service [65]. Another important factor that enables a reduction in the number of artefacts is the work based on the TIN model, which is characterised by, e.g., the accuracy of vector data, which does not change when creating the model [66], and the high accuracy of surface modelling [67].
The presented methodology for performing bathymetric and topographic measurements and the development of the DTM based on multi-sensor data integration exhibit the expected performance. As part of this study, several flights were performed along the planned route using a UAV, with the aim of determining the optimum flight altitude. The optimum flight altitude is understood as such a distance that allows the photos to cover the largest possible area while enabling the precise determination of the position coordinates of GCPs, whose number also provides high-quality image georeferencing. The right weather conditions and the application of a polarising filter allowed a flight altitude of 120 m to be achieved. Observations should be carried out on days when the wave action is relatively calm to minimise depth prediction errors. Due to the technique’s advantage over conventional digital photogrammetric methods, research into determining the shallow water depth based on aerial photos frequently involves processing using the SfM algorithm. The “Depth Prediction” plug-in for predicting depths in shallow waters uses the SVR method, and the undisputed advantage of this solution is the application of the model in waterbodies other than those in which the training was carried out. The effectiveness of this method, which was tested as part of the INNOBAT project, can be described as high-quality when applied to a depth of 1 m.
Topobathymetric charts developed using the method proposed in this technical note show the depth and seabed shape of waterbodies, which can be widely used in many areas of life, such as navigation and shipping, planning and construction of water infrastructure, geological and geophysical research, environmental protection and natural resource management, rescue and underwater exploration, water resource management and flood protection, oceanographic research, as well as tourism and recreation. The accuracy and detail of these maps depend directly on the quality, quantity and distribution of depth/height data that can be obtained using various remote sensors. The quality of the developed topobathymetric charts should be high, because otherwise it may lead to incorrect determination of the navigability conditions of waterways, anchorages and other water areas, as well as incorrect determination of the safe depth of waterbodies in port areas.

Author Contributions

Conceptualization, M.S.; methodology, M.S.; validation, M.W.; formal analysis, M.S. and M.W.; investigation, M.S. and M.W.; data curation, M.W.; writing—original draft preparation, M.S. and M.W.; writing—review and editing, M.S. and M.W.; visualization, M.W.; supervision, M.S. All authors have read and agreed to the published version of the manuscript.

Funding

This research was funded by the statutory activities of Gdynia Maritime University, grant number WN/2024/PZ/05.

Data Availability Statement

The original contributions presented in the study are included in the article, further inquiries can be directed to the corresponding author.

Conflicts of Interest

Author Marta Wiśniewska was employed by the company Marine Technology Ltd. The remaining authors declare that the research was conducted in the absence of any commercial or financial relationships that could be construed as a potential conflict of interest.

References

  1. Herbert, T.; Ogochukwu, N.I.; John, F.A. Bathymetric Mapping for Safe Navigation: A Case Study of Part of Lagos Lagoon. Afr. Sch. J. Environ. Des. Constr. Mgt. (AJECM) 2019, 14, 1–13. [Google Scholar]
  2. Jaud, M.; Delsol, S.; Urbina-Barreto, I.; Augereau, E.; Cordier, E.; Guilhaumon, F.; Le Dantec, N.; Floc’h, F.; Delacourt, C. Low-tech and Low-cost System for High-resolution Underwater RTK Photogrammetry in Coastal Shallow Waters. Remote Sens. 2023, 16, 20. [Google Scholar] [CrossRef]
  3. Specht, C.; Lewicka, O.; Specht, M.; Zblewski, S. Impact of Hydrotechnical Structures on Forming the Tombolo Oceanographic Phenomenon in Kołobrzeg and Sopot. TransNav Int. J. Mar. Navig. Saf. Sea Transp. 2021, 15, 687–694. [Google Scholar] [CrossRef]
  4. Specht, M.; Specht, C.; Szafran, M.; Makar, A.; Dąbrowski, P.; Lasota, H.; Cywiński, P. The Use of USV to Develop Navigational and Bathymetric Charts of Yacht Ports on the Example of National Sailing Centre in Gdańsk. Remote Sens. 2020, 12, 2585. [Google Scholar] [CrossRef]
  5. Wlodarczyk-Sielicka, M.; Stateczny, A. Clustering Bathymetric Data for Electronic Navigational Charts. J. Navig. 2016, 69, 1143–1153. [Google Scholar] [CrossRef]
  6. Arseni, M.; Voiculescu, M.; Georgescu, L.P.; Iticescu, C.; Rosu, A. Testing Different Interpolation Methods Based on Single Beam Echosounder River Surveying. Case Study: Siret River. ISPRS Int. J. Geo-Inf. 2019, 8, 507. [Google Scholar] [CrossRef]
  7. Wlodarczyk-Sielicka, M.; Stateczny, A. Comparison of Selected Reduction Methods of Bathymetric Data Obtained by Multibeam Echosounder. In Proceedings of the 2016 Baltic Geodetic Congress (BGC 2016), Gdańsk, Poland, 2–4 June 2016. [Google Scholar]
  8. Gao, J. Bathymetric Mapping by Means of Remote Sensing: Methods, Accuracy and Limitations. Prog. Phys. Geogr. 2009, 33, 103–116. [Google Scholar] [CrossRef]
  9. Grządziel, A. Method of Time Estimation for the Bathymetric Surveys Conducted with a Multi-Beam Echosounder System. Appl. Sci. 2023, 13, 10139. [Google Scholar] [CrossRef]
  10. Agrafiotis, P.; Skarlatos, D.; Georgopoulos, A.; Karantzalos, K. Shallow Water Bathymetry Mapping from UAV Imagery Based on Machine Learning. Int. Arch. Photogramm. Remote Sens. Spat. Inf. Sci. 2019, 42, 9–16. [Google Scholar] [CrossRef]
  11. Brodie, K.L.; Bruder, B.L.; Slocum, R.K.; Spore, N.J. Simultaneous Mapping of Coastal Topography and Bathymetry from a Lightweight Multicamera UAS. IEEE Trans. Geosci. Remote Sens. 2019, 57, 6844–6864. [Google Scholar] [CrossRef]
  12. Del Savio, A.A.; Luna Torres, A.; Vergara Olivera, M.A.; Llimpe Rojas, S.R.; Urday Ibarra, G.T.; Neckel, A. Using UAVs and Photogrammetry in Bathymetric Surveys in Shallow Waters. Appl. Sci. 2023, 13, 3420. [Google Scholar] [CrossRef]
  13. He, J.; Lin, J.; Ma, M.; Liao, X. Mapping Topo-bathymetry of Transparent Tufa Lakes Using UAV-based Photogrammetry and RGB Imagery. Geomorphology 2021, 389, 107832. [Google Scholar] [CrossRef]
  14. Thomasberger, A.; Nielsen, M.M. UAV-based Subsurface Data Collection Using a Low-tech Ground-truthing Payload System Enhances Shallow-water Monitoring. Drones 2023, 7, 647. [Google Scholar] [CrossRef]
  15. Rossi, L.; Mammi, I.; Pelliccia, F. UAV-derived Multispectral Bathymetry. Remote Sens. 2020, 12, 3897. [Google Scholar] [CrossRef]
  16. Taddia, Y.; Russo, P.; Lovo, S.; Pellegrinelli, A. Multispectral UAV Monitoring of Submerged Seaweed in Shallow Water. Appl. Geomat. 2020, 12, 19–34. [Google Scholar] [CrossRef]
  17. Bagheri, O.; Ghodsian, M.; Saadatseresht, M. Reach Scale Application of UAV + SfM Method in Shallow Rivers Hyperspatial Bathymetry. Int. Arch. Photogramm. Remote Sens. Spat. Inf. Sci. 2015, 40, 77–81. [Google Scholar] [CrossRef]
  18. Eltner, A.; Sofia, G. Structure from Motion Photogrammetric Technique. In Developments in Earth Surface Processes; Tarolli, P., Mudd, S.M., Eds.; Elsevier: Amsterdam, The Netherlands, 2020; Chapter 1; Volume 23, pp. 1–24. [Google Scholar]
  19. Hänsel, P.; Schindewolf, M.; Eltner, A.; Kaiser, A.; Schmidt, J. Feasibility of High-resolution Soil Erosion Measurements by Means of Rainfall Simulations and SfM Photogrammetry. Hydrology 2016, 3, 38. [Google Scholar] [CrossRef]
  20. Specht, M.; Wiśniewska, M.; Stateczny, A.; Specht, C.; Szostak, B.; Lewicka, O.; Stateczny, M.; Widźgowski, S.; Halicki, A. Analysis of Methods for Determining Shallow Waterbody Depths Based on Images Taken by Unmanned Aerial Vehicles. Sensors 2022, 22, 1844. [Google Scholar] [CrossRef]
  21. Szostak, B.; Specht, M.; Burdziakowski, P.; Stateczny, A.; Specht, C.; Lewicka, O. Methodology for Performing Bathymetric Measurements of Shallow Waterbodies Using an UAV, and their Processing Based on the SVR Algorithm. Measurement 2023, 223, 113720. [Google Scholar] [CrossRef]
  22. Specht, M.; Stateczny, A.; Specht, C.; Widźgowski, S.; Lewicka, O.; Wiśniewska, M. Concept of an Innovative Autonomous Unmanned System for Bathymetric Monitoring of Shallow Waterbodies (INNOBAT System). Energies 2021, 14, 5370. [Google Scholar] [CrossRef]
  23. Specht, M.; Szostak, B.; Lewicka, O.; Stateczny, A.; Specht, C. Method for Determining of Shallow Water Depths Based on Data Recorded by UAV/USV Vehicles and Processed Using the SVR Algorithm. Measurement 2023, 221, 113437. [Google Scholar] [CrossRef]
  24. IHO. IHO Standards for Hydrographic Surveys, 6.1.0 ed.; Special Publication No. 44; IHO: Monaco, Monaco, 2022. [Google Scholar]
  25. Lewicka, O. Method for Accuracy Assessment of Topo-bathymetric Surface Models Based on Geospatial Data Recorded by UAV and USV Vehicles. Metrol. Meas. Syst. 2023, 30, 461–480. [Google Scholar] [CrossRef]
  26. Ruan, X.; Guo, M.; Zhan, Z. A Regional Digital Bathymetric Model Fusion Method Based on Topographic Slope: A Case Study of the South China Sea and Surrounding Waters. Heliyon 2024, 10, e26644. [Google Scholar] [CrossRef]
  27. Specht, O. Multi-sensor Integration of Hydroacoustic and Optoelectronic Data Acquired from UAV and USV Vehicles on the Inland Waterbody. TransNav Int. J. Mar. Navig. Saf. Sea Transp. 2023, 17, 791–798. [Google Scholar] [CrossRef]
  28. Włodarczyk-Sielicka, M.; Bodus-Olkowska, I.; Łącka, M. The Process of Modelling the Elevation Surface of a Coastal Area Using the Fusion of Spatial Data from Different Sensors. Oceanologia 2022, 64, 22–34. [Google Scholar] [CrossRef]
  29. Specht, O. Land and Seabed Surface Modelling in the Coastal Zone Using UAV/USV-based Data Integration. Sensors 2023, 23, 8020. [Google Scholar] [CrossRef] [PubMed]
  30. Stateczny, A. The Neural Method of Sea Bottom Shape Modelling for the Spatial Maritime Information System. In Maritime Engineering and Ports II; Brebbia, C.A., Olivella, J., Eds.; WIT Press: Southampton, UK, 2000; Volume 51, pp. 251–259. [Google Scholar]
  31. Oladosu, S.O.; Ehigiator-Irughe, R.; Aigbe, J.E. Seamless Topo-bathymetric Surveys of Maiyegun Estate Waterfront Lagos State, Nigeria. Niger. J. Technol. 2022, 41, 377–384. [Google Scholar] [CrossRef]
  32. Gesch, D.; Wilson, R. Development of a Seamless Multisource Topographic/Bathymetric Elevation Model of Tampa Bay. Mar. Technol. Soc. J. 2001, 35, 58–64. [Google Scholar] [CrossRef]
  33. Bernstein, D.J.; Freeman, C.W.; Sumners, B.W.; Mitasova, H. Modern Techniques for Improved Topo/Bathy Elevation Modeling of Tidal Inlets. In Proceedings of the U.S. Hydro 2011 Conference, Tampa, FL, USA, 25–28 April 2011. [Google Scholar]
  34. Yoon, S.-J.; Kim, T. Fast UAV Image Mosaicking by a Triangulated Irregular Network of Bucketed Tiepoints. Remote Sens. 2023, 15, 5782. [Google Scholar] [CrossRef]
  35. Janas, U.; Kendzierska, H.; Dąbrowska, A.H.; Dziubińska, A. Non-indigenous Bivalve—The Atlantic Rangia Rangia Cuneata—In the Wisła Śmiała River (Coastal Waters of the Gulf of Gdańsk, the Southern Baltic Sea). Oceanol. Hydrobiol. Stud. 2014, 43, 427–430. [Google Scholar] [CrossRef]
  36. Discovery Tourism. Gdańsk Beach “Ujście Wisły”. Available online: https://odtur.pl/atrakcje/gdansk-plaza-gdansk-ujscie-wisly-53694.html (accessed on 3 December 2024). (In Polish).
  37. Gdańsk City Council. Resolution No. VII/65/11 of the Gdańsk City Council of 17 February 2011 on the Establishment of the “Zielone Wyspy” Ecological Site; Gdańsk City Council: Gdańsk, Poland, 2011. (In Polish) [Google Scholar]
  38. Soto-Marquez, E.; Caverlotti-Silva, M. Reduced Equations for K UTM Scale Factor and GNSS Usage in Chilean Cadastral Environments. J. Geospat. Surv. 2024, 4, 1–11. [Google Scholar] [CrossRef]
  39. EchoLogger. Single Frequency Echosounder (Shallow). Available online: https://www.echologger.com/products/single-frequency-echosounder-shallow (accessed on 3 December 2024).
  40. Trimble. Trimble R10 GNSS Receiver User Guide. Available online: https://receiverhelp.trimble.com/r10-gnss/R10%20UserGuide.pdf (accessed on 3 December 2024).
  41. Harley, M.D.; Turner, I.L.; Short, A.D.; Ranasinghe, R. Assessment and Integration of Conventional, RTK-GPS and Image-derived Beach Survey Methods for Daily to Decadal Coastal Monitoring. Coast. Eng. 2011, 58, 194–205. [Google Scholar] [CrossRef]
  42. Nayak, B.S.; Naik, K.; Ojjela, O.; Pal, S. GPS Receiver Simplification for Low cost Applications and Multipath Mitigation Analysis on SDR based Re Configurable Software Receiver. Def. Sci. J. 2023, 73, 699–711. [Google Scholar] [CrossRef]
  43. Aurelia Aerospace. Aurelia X8 Standard. Available online: https://aurelia-aerospace.com/product/aurelia-x8-standard/ (accessed on 3 December 2024).
  44. Sony. ILCE-6500. Available online: https://www.sony.com/electronics/support/e-mount-body-ilce-6000-series/ilce-6500/specifications (accessed on 3 December 2024).
  45. Sony Asia Pacific. E 35mm F1.8 OSS. Available online: https://www.sony-asia.com/electronics/camera-lenses/sel35f18#product_details_default (accessed on 3 December 2024).
  46. Bula, J.; Derron, M.-H.; Mariethoz, G. Dense Point Cloud Acquisition with a Low-cost Velodyne VLP-16. Geosci. Instrum. Methods Data Syst. 2020, 9, 385–396. [Google Scholar] [CrossRef]
  47. SBG Systems. Ellipse-D. Available online: https://www.sbg-systems.com/products/ellipse-series/#ellipse-d_rtk_gnss_ins (accessed on 3 December 2024).
  48. Chan, T.O.; Lichti, D.D.; Roesler, G.; Cosandier, D.; Al-Durgham, K. Range Scale-factor Calibration of the Velodyne VLP-16 Lidar System for Position Tracking Applications. In Proceedings of the 11th International Conference on Mobile Mapping Technology (MMT 2019), Shenzhen, China, 6–8 May 2019. [Google Scholar]
  49. Hong, N.; Hilfiker, J.N. Mueller Matrix Ellipsometry Study of a Circular Polarizing Filter. J. Vac. Sci. Technol. B 2020, 38, 014012. [Google Scholar] [CrossRef]
  50. Specht, M. Methodology for Performing Bathymetric and Photogrammetric Measurements Using UAV and USV Vehicles in the Coastal Zone. Remote Sens. 2024, 16, 3328. [Google Scholar] [CrossRef]
  51. Ferreira, I.O.; Santos, A.d.P.d.; Oliveira, J.C.d.; Medeiros, N.d.G.; Emiliano, P.C. Robust Methodology for Detection of Spikes in Multibeam Echo Sounder Data. Bol. Ciênc. Geod. 2019, 25, e2019014. [Google Scholar] [CrossRef]
  52. Condorelli, F.; Rinaudo, F.; Salvadore, F.; Tagliaventi, S. A Match-moving Method Combining AI and SFM Algorithms in Historical Film Footage. Int. Arch. Photogramm. Remote Sens. Spat. Inf. Sci. 2020, 43, 813–820. [Google Scholar] [CrossRef]
  53. Zhen, W.; Hu, Y.; Yu, H.; Scherer, S. LiDAR-enhanced Structure-from-Motion. In Proceedings of the 2020 IEEE International Conference on Robotics and Automation (ICRA 2020), Paris, France, 31 May–31 August 2020. [Google Scholar]
  54. Chandrashekar, A.; Papadakis, J.; Willis, A.; Gantert, J. Structure-from-Motion and RGBD Depth Fusion. In Proceedings of the IEEE SoutheastCon 2018, St. Petersburg, FL, USA, 19–22 April 2018. [Google Scholar]
  55. Reuter, H.I.; Hengl, T.; Gessler, P.; Soille, P. Preparation of DEMs for Geomorphometric Analysis. In Developments in Soil Organic Matter; Elsevier: Amsterdam, The Netherlands, 2009; Volume 33, pp. 87–120. [Google Scholar]
  56. Polidori, L.; El Hage, M. Digital Elevation Model Quality Assessment Methods: A Critical Review. Remote Sens. 2020, 12, 3522. [Google Scholar] [CrossRef]
  57. Graf, L.; Moreno-de-las-Heras, M.; Ruiz, M.; Calsamiglia, A.; García-Comendador, J.; Fortesa, J.; López-Tarazón, J.A.; Estrany, J. Accuracy Assessment of Digital Terrain Model Dataset Sources for Hydrogeomorphological Modelling in Small Mediterranean Catchments. Remote Sens. 2018, 10, 2014. [Google Scholar] [CrossRef]
  58. Chu, H.-J.; Chen, R.-A.; Tseng, V.S.; Wang, C.-K. Identifying LiDAR Sample Uncertainty on Terrain Features from DEM Simulation. Geomorphology 2014, 204, 325–333. [Google Scholar] [CrossRef]
  59. Podobnikar, T. Methods for Visual Quality Assessment of a Digital Terrain Model. SAPIENS 2009, 2, 1–10. [Google Scholar]
  60. Polidori, L.; El Hage, M.; Valeriano, M.D.M. Digital Elevation Model Validation with No Ground Control: Application to the Topodata DEM in Brazil. Bol. Ciências Geodésicas 2014, 20, 467–479. [Google Scholar] [CrossRef]
  61. Lubczonek, J.; Wlodarczyk-Sielicka, M.; Lacka, M.; Zaniewicz, G. Methodology for Developing a Combined Bathymetric and Topographic Surface Model Using Interpolation and Geodata Reduction Techniques. Remote Sens. 2021, 13, 4427. [Google Scholar] [CrossRef]
  62. Genchi, S.A.; Vitale, A.J.; Perillo, G.M.E.; Seitz, C.; Delrieux, C.A. Mapping Topobathymetry in a Shallow Tidal Environment Using Low-Cost Technology. Remote Sens. 2020, 12, 1394. [Google Scholar] [CrossRef]
  63. Mazza, D.; Parente, L.; Cifaldi, D.; Meo, A.; Senatore, M.R.; Guadagno, F.M.; Revellino, P. Quick Bathymetry Mapping of a Roman Archaeological Site Using RTK UAS-based Photogrammetry. Front. Earth Sci. 2023, 11, 1183982. [Google Scholar] [CrossRef]
  64. Barańczuk, J. The Statistical Relation/Coherence between Ice-Regimes of Lake Raduńskie Górne and Lake Ostrzyckie. Limnol. Rev. 2018, 18, 103–108. [Google Scholar] [CrossRef]
  65. Szumiejko, F.; Wdowikowski, M. IMGW-PIB Monitor as a Source of Information on Dangerous Meteorological and Hydrological Phenomena for Crisis Management Needs. Def. Sci. Q. Manag. Command. Fac. Natl. Def. Univ. Wars. 2016, 2, 209–226. (In Polish) [Google Scholar]
  66. Susetyo, D.B.; Syafiudin, M.F.; Prasetyo, Y. DTM Generation from TerraSAR-X Using TIN Algorithm in Papua Island, Indonesia. Int. Arch. Photogramm. Remote Sens. Spat. Inf. Sci. 2017, 42, 101–106. [Google Scholar] [CrossRef]
  67. Matori, A.N.; Hidzir, H. Low Cost DTM for Certain Engineering Purposes. In Proceedings of the Map Asia 2010 & ISG 2010 Conference, Kuala Lumpur, Malaysia, 26–28 July 2010. [Google Scholar]
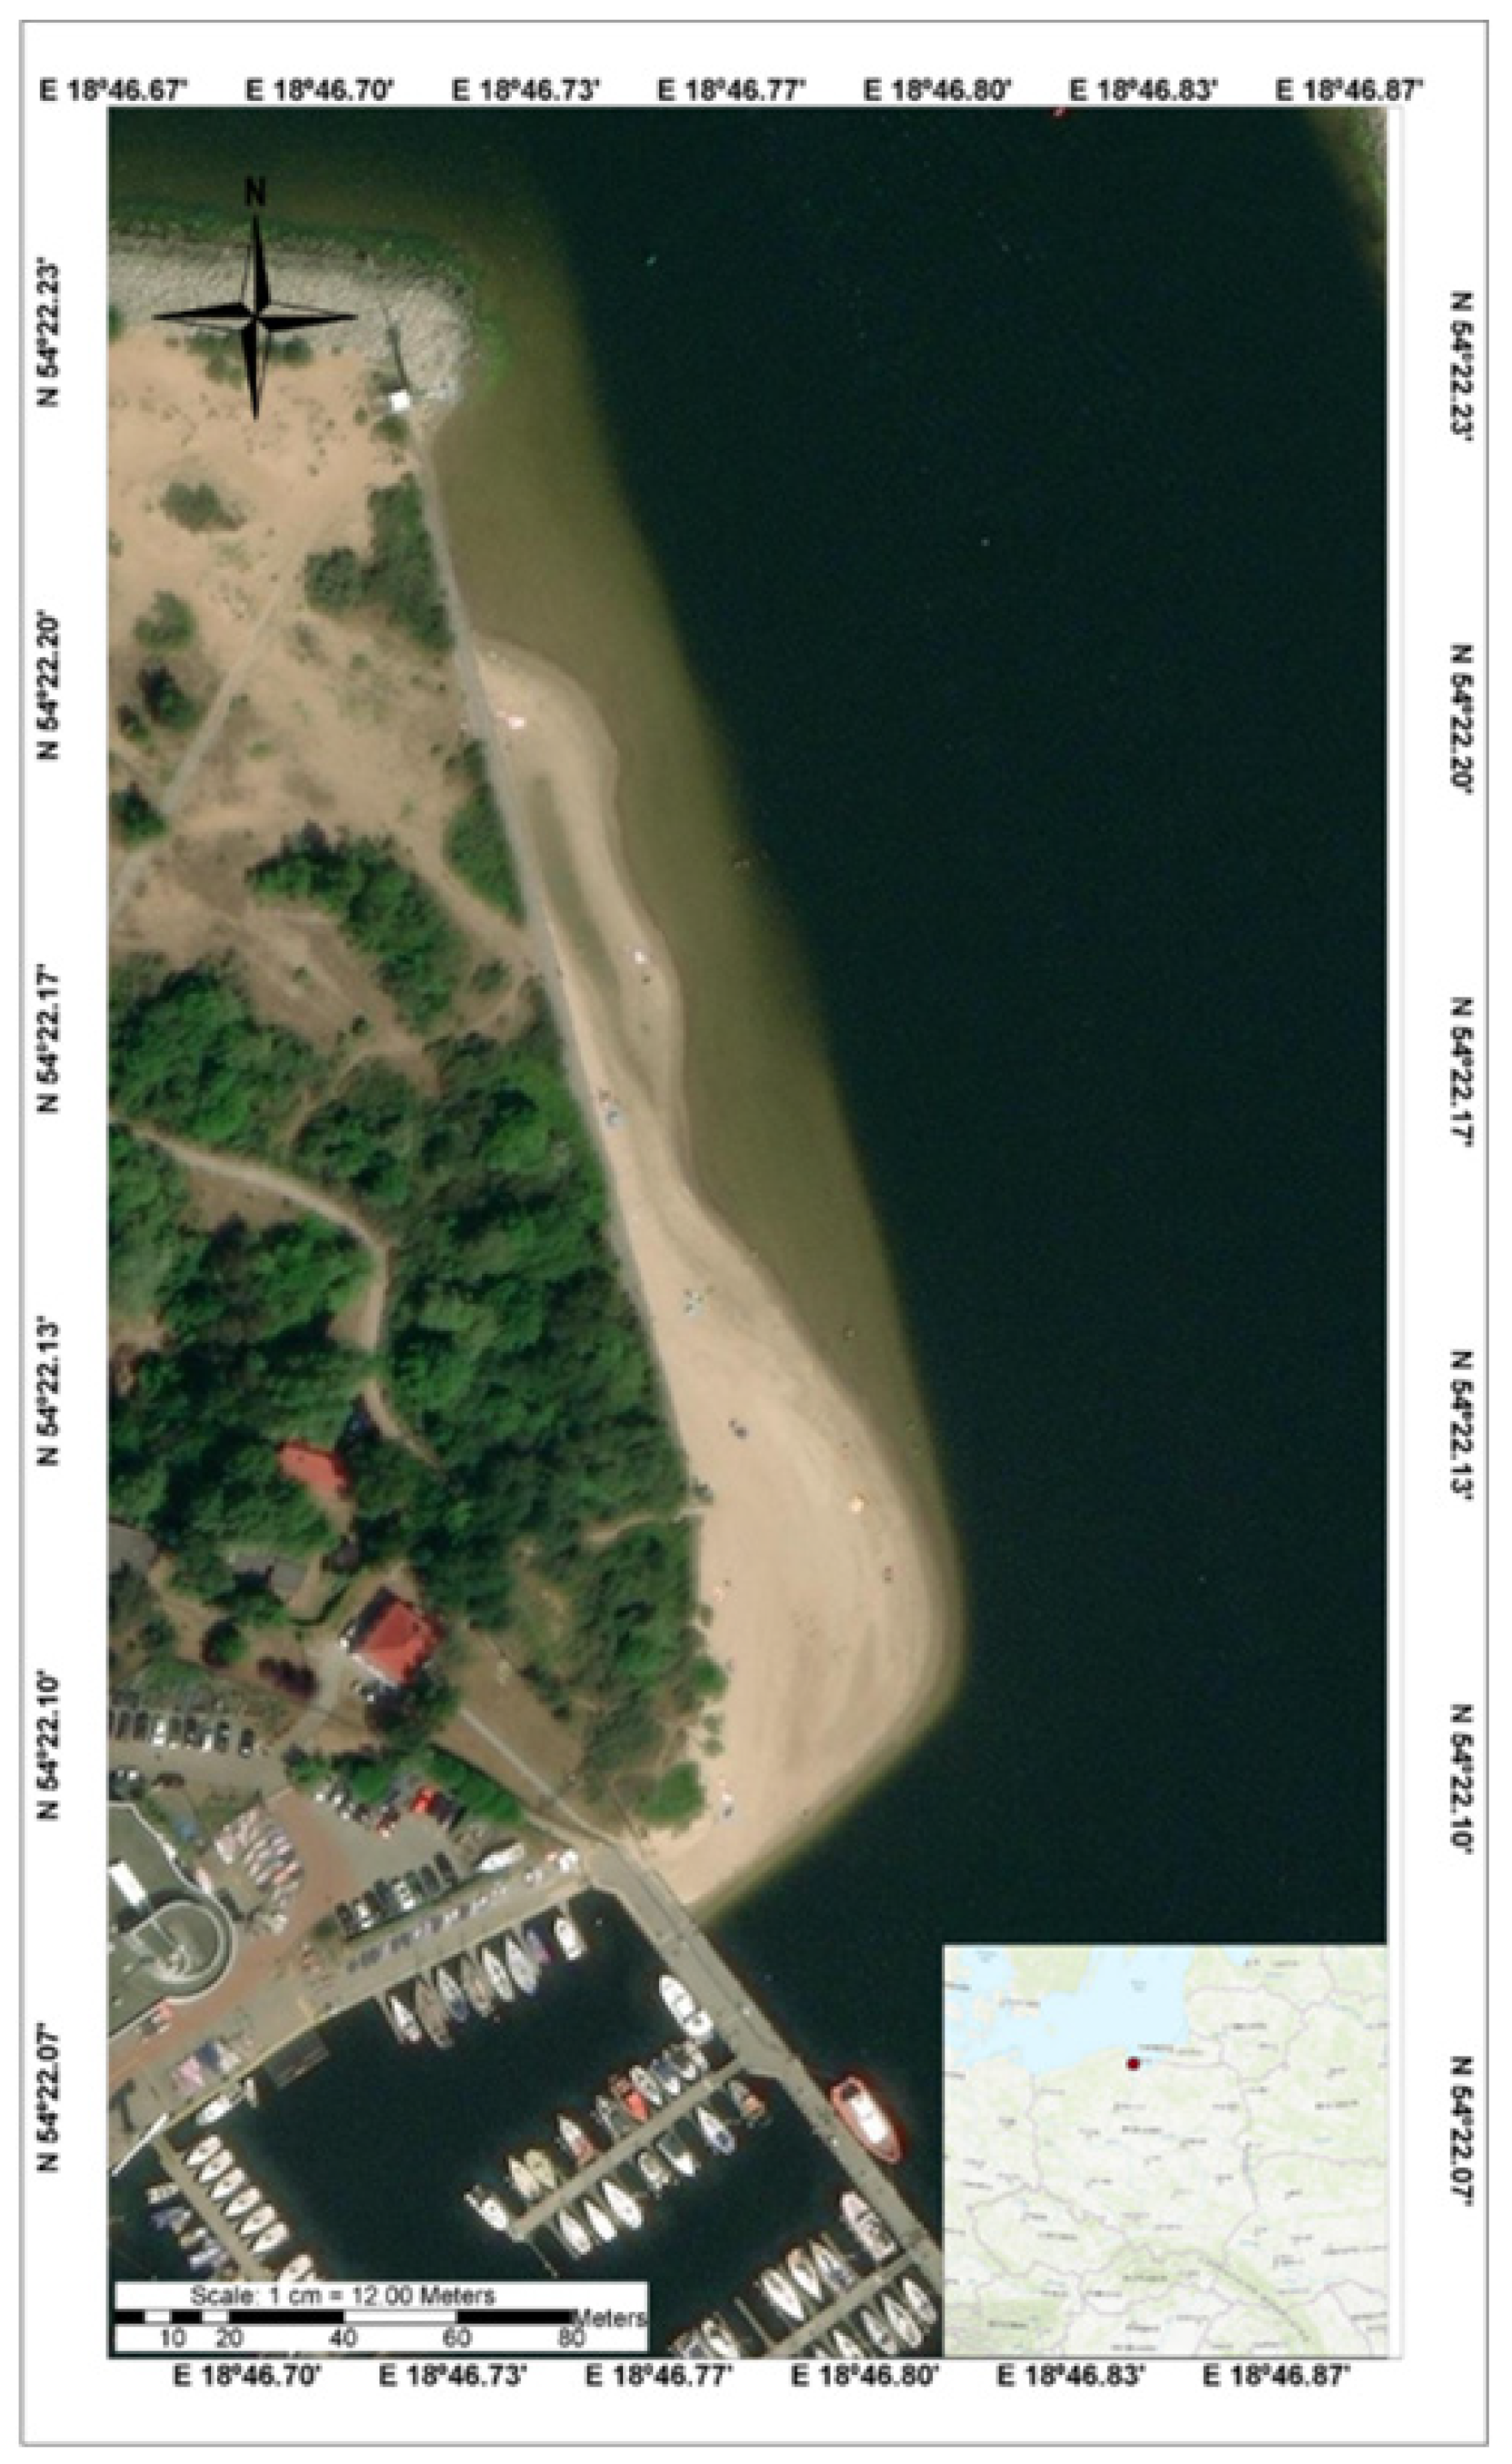
Figure 1. The location of bathymetric and topographic measurements carried out at the Vistula Śmiała River mouth in Gdańsk.
Remotesensing 16 04626 g001
Figure 2. The location of depth points recorded by an SBES integrated with a GNSS RTK receiver and designed sounding profiles in the study area.
Remotesensing 16 04626 g002
Figure 3. Flight trajectory of the UAV using the LiDAR system in the study area.
Remotesensing 16 04626 g003
Figure 4. The distribution of GCPs and UAV flights in the study area.
Remotesensing 16 04626 g004
Figure 5. A visualisation of the integrated data derived from a total of three mutually independent instruments (GNSS RTK receiver, LiDAR system, SBES).
Remotesensing 16 04626 g005
Figure 6. A view of georeferenced photos based on the entered GCPs (a) and a point cloud (b).
Remotesensing 16 04626 g006
Figure 7. The “Depth Prediction” plug-in window (a) and the depth points obtained based on photos (b).
Remotesensing 16 04626 g007
Figure 8. A bathymetric and topographic DTM of the Vistula Śmiała River mouth in Gdańsk.
Remotesensing 16 04626 g008
Figure 9. A diagram showing the development of the DTM of the coastal zone based on bathymetric and topographic data integration.
Remotesensing 16 04626 g009
Figure 10. The location of underwater GCPs that were used to assess the accuracy of the generated DTM of the coastal zone based on bathymetric and topographic data integration.
Remotesensing 16 04626 g010
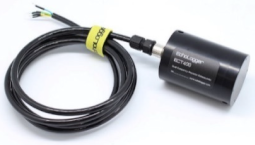
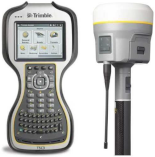
Table 1. Technical data of the Echologger EU400 SBES and the Trimble R10 GNSS RTK receiver.
Echologger EU400 SBESGNSS RTK Trimble R10
Remotesensing 16 04626 i001Remotesensing 16 04626 i002
Frequency450/200 kHzChannels440
Beamwidth5/10°Satellite signals tracked simultaneouslyGPS, GLONASS, BDS, Galileo and SBAS
Transmit pulse width10–200 μs (10 μs step)Positioning rate1, 2, 5, 10 and 20 Hz
Range0.15–100 mHorizontal positioning accuracyRTK: ±8 mm + 1 ppm RMS
Repetition ratemax 10 HzDGPS: ±0.25 m + 1 ppm RMS
Sampling rate100 kHzStatic mode: ±3 mm + 0.1 ppm RMS
Water column resolution±7.5 mmVertical positioning accuracyRTK: ±15 mm + 1 ppm RMS
Altimeter range resolution1 mmDGPS: ±0.25 m + 1 ppm RMS
Temperature resolution0.1 °CStatic mode: ±3.5 mm + 0.4 ppm RMS
Table 2. Technical data of the Aurelia X8 Standard LE UAV and the Sony A6500 camera with the Sony E 35 mm f/1.8 OSS lens.
Aurelia X8 Standard LE UAVSony A6500 Camera with Sony E 35 mm f/1.8 OSS Lens
Remotesensing 16 04626 i003Remotesensing 16 04626 i004
Max flight time45 min.Image sensorSensor type: APS-C type (23.5 × 15.6 mm), CMOS
Aspect Ratio: 3:2
Number of pixels: 25 Mpx
UAV empty weight5.95 kg
UAV weight incl. batteries9.79 kg
UAV MTOW17.79 kgLensAngle of view: 44°
Focal length: 35 mm
Aperture width: f/1.8–f/22
Sharpness: 0.3 m-∞
Max flight speed56 km/h
Max wind resistance32 km/h
Operating temperature–15 °C to 50 °C
Max service ceiling3000 m ASLISO range100–51,200
Operating range2.4–5 kmElectronic shutter speed1/4000–30 s
Operating frequencies433 MHz, 915 MHz or 2.4 GhzMax image size6000 × 3376 (16:9) or 6000 × 4000 (3:2)
GPS receiveru-blox NEO-M9NPhoto file formatJPEG, RAW
CompassRM3100Data recordingMemory Stick Duo or SD memory card
Table 3. Technical data of the Velodyne VLP-16 Lite LiDAR system and the SBG Ellipse-D INS.
Velodyne VLP-16 Lite LiDAR SystemSBG Ellipse-D INS
Remotesensing 16 04626 i005Remotesensing 16 04626 i006
Channels16Pitch/Roll accuracySP: 0.1° RMS
RTK: 0.05° RMS
PPK: 0.03° RMS
Measurement range100 m
Field of view (vertical)–15° to 15°Heading accuracyDual antenna 2 m: 0.2° RMS
Single antenna: 0.2° RMS
PPK: 0.1° RMS
Angular resolution (vertical)
Field of view (horizontal)360°Velocity accuracy0.03 m/s RMS
Navigation accuracySP: 1.2 m RMS
SBAS: 1 m RMS
RTK/PPK: 1 cm + 1 ppm RMS
Angular resolution (horizontal)0.1–0.4°
Rotation rate5–20 HzAvailable dataCalibrated sensor data, delta angles and velocity, Euler angles, GNSS raw data, GPS data, heave, position, status, UTC time, velocity, etc.
Wavelength903 nm
LiDAR points generated per second300,000–600,000Aiding sensorsGNSS, odometer, RTCM
Output rate200/1000 Hz
Dimensions103 × 72 mm
diameter × height
Dimensions46 × 45 × 32 mm
Weight590 gWeight65 g
Table 4. Distance ranges from the shoreline to each isobath.
Isobath (m)Distance Ranges from the Shoreline to Each Isobath (m)
14–22
29–38
311–39
412–41
513–42
616–46
726–57
857–84
Table 5. Accuracy statistics of the generated DTM of the coastal zone based on bathymetric and topographic data integration.
Point NumberObserved Depth (m)Predicted Depth (m)xi (m)μ (m)(xi–μ)2 (m2)σ (m)TVU (m)
1–0.202–0.3900.1880.0780.0120.1270.248
2–0.100–0.3200.220 0.020
3–0.229–0.3500.121 0.002
4–0.413–0.4200.007 0.005
5–0.650–0.460–0.190 0.072
6–0.213–0.170–0.043 0.015
7–0.680–0.7000.020 0.003
8–0.217–0.180–0.037 0.013
9–0.710–0.8000.090 0.000
10–0.205–0.160–0.045 0.015
11–0.180–0.3100.130 0.003
12–0.271–0.3900.119 0.002
13–0.205–0.2700.065 0.000
14–0.232–0.4500.218 0.020
15–0.714–0.500–0.214 0.085
16–0.225–0.4100.185 0.012
17–0.229–0.3700.141 0.004
18–0.158–0.3600.202 0.015
19–0.129–0.3400.211 0.018
20–0.139–0.100–0.039 0.014
21–0.231–0.3700.139 0.004
22–0.329–0.5500.221 0.021
Disclaimer/Publisher’s Note: The statements, opinions and data contained in all publications are solely those of the individual author(s) and contributor(s) and not of MDPI and/or the editor(s). MDPI and/or the editor(s) disclaim responsibility for any injury to people or property resulting from any ideas, methods, instructions or products referred to in the content.