Article

Ensemble Learning for Oat Yield Prediction Using Multi-Growth Stage UAV Images

1
State Key Laboratory of Maize Bio-Breeding, College of Agronomy and Biotechnology, China Agricultural University, Beijing 100193, China
2
Key Laboratory of Farming System, Ministry of Agriculture and Rural Affairs of China, China Agricultural University, Beijing 100193, China
3
Department of Geography, Simon Fraser University, Burnaby, BC V5A 1S6, Canada
4
Agriculture and Agri-Food Canada, Ottawa, ON K1A 0C6, Canada
5
Zhangjiakou Academy of Agricultural Sciences, Zhangjiakou 075000, China
6
Department of Geographical Sciences, University of Maryland, College Park, MD 20742, USA
7
Department of Plant, Food and Environmental Sciences, Agricultural Campus, Dalhousie University, P.O. Box 550, Truro, NS B2N 5E3, Canada
*
Author to whom correspondence should be addressed.
Remote Sens. 2024, 16(23), 4575; https://doi.org/10.3390/rs16234575
Submission received: 12 October 2024 / Revised: 27 November 2024 / Accepted: 4 December 2024 / Published: 6 December 2024
(This article belongs to the Section Remote Sensing in Agriculture and Vegetation)

Abstract

:
Accurate crop yield prediction is crucial for optimizing cultivation practices and informing breeding decisions. Integrating UAV-acquired multispectral datasets with advanced machine learning methodologies has markedly refined the accuracy of crop yield forecasting. This study aimed to construct a robust and versatile yield prediction model for multi-genotyped oat varieties by investigating 14 modeling scenarios that combine multispectral data from four key growth stages. An ensemble learning framework, StackReg, was constructed by stacking four base algorithms—ridge regression (RR), support vector machines (SVM), Cubist, and extreme gradient boosting (XGBoost)—to predict oat yield. The results show that, for single growth stages, base models achieved R2 values within the interval of 0.02 to 0.60 and RMSEs ranging from 391.50 to 620.49 kg/ha. By comparison, the StackReg improved performance, with R2 values extending from 0.25 to 0.61 and RMSEs narrowing to 385.33 and 542.02 kg/ha. In dual-stage and multi-stage settings, the StackReg consistently surpassed the base models, reaching R2 values of up to 0.65 and RMSE values as low as 371.77 kg/ha. These findings underscored the potential of combining UAV-derived multispectral imagery with ensemble learning for high-throughput phenotyping and yield forecasting, advancing precision agriculture in oat cultivation.

Graphical Abstract

1. Introduction

Meeting the growing global demand for food amidst a rising population and improving living standards constitute a critical challenge of our time. Oats are a globally cultivated cereal crop, widely grown across North America, Europe, and parts of Asia, and valued for their high nutritional content and health benefits [1]. However, oat production is profoundly influenced by a complex interplay of environmental conditions, agronomic practices, and the specific genotypes selected, collectively contributing to substantial variability in yield levels [2].
Accurately and timely monitoring oats’ dynamic growth and grain yield is critical for agronomists to identify high-yielding genotypes and optimize field management practices. Oat yield estimation is currently primarily based on field measurements and scouting, which are time-consuming, labor-intensive, and prone to subjective bias, potentially leading to inaccurate yield estimates [3,4]. Furthermore, field scouting is limited in its ability to deliver real-time information. When problems are detected and acted upon, crops may have already suffered irreversible damage and thus reduce yield potential. Therefore, developing an efficient, objective, and accurate assessment tool is imperative for the oat industry to enable real-time decision-making, enhance growth monitoring, and optimize field management, maximizing yield potential.
Remote sensing technology has become an integral tool in agriculture, offering detailed canopy images and valuable spectral data through various platforms (e.g., satellites and unmanned aerial vehicles (UAVs)) [5,6]. It has become a standard tool in plant breeding programs and agricultural assessments to monitor plants over large areas repeatedly [7,8]. High-resolution remote sensing, mainly using UAVs equipped with multispectral sensors, has gained significant attention for its effectiveness in monitoring detailed crop features and estimating yield-related traits [9]. UAVs, a powerful platform for high-throughput phenotyping, provide a rapid, non-destructive method for collecting time series environmental data, thus improving the efficiency of agricultural research and management.
In crop yield prediction with remote sensing data, conventional regression methods frequently depend on deriving vegetation indices (VIs) sensitive to critical traits, such as biomass and leaf area index, to establish direct or indirect linear relationships [10]. However, these models often suffer from index saturation, data noise sensitivity, and difficulty capturing complex phenological patterns. Although newly introduced vegetation indices, like kernel Normalized Difference Vegetation Index (kNDVI), have shown improved performance by reducing saturation and bias, particularly under high biomass conditions, their utility remaining limited when working with high-dimensional UAV-based data [11,12]. Data complexity and sheer volume from UAV platforms have underscored the inherent limitations of traditional linear models in predicting crop yields from multiple vegetation indices.
Advances in computer science have driven significant innovation in precision agriculture, with machine learning (ML) algorithms for remote sensing modeling becoming a central focus of research in recent years [13]. ML techniques, including ridge regression (RR), support vector machines (SVM), Gaussian processes (GP), random forests (RF), and deep neural networks (DNN), are being increasingly applied to construct predictive models for crops derived from diverse remote sensing datasets [14,15,16]. These methods can address different issues of linear regression models (e.g., index saturation and sensitivity to data noise) and notably improve the accuracy and robustness of predictions of plant traits [17]. However, the performance of these models can vary considerably across different crops and environments [18]. For instance, in studies that combine UAV-based multispectral data with various ML algorithms for yield forecasting, RF has been identified as the optimal model for predicting maize yields [19], while GP regression has excelled in predicting wheat and soybean yields [20,21]. SVM has proven most effective in estimating broad bean yields [22], and convolutional neural networks (CNN) have shown exceptional precision in rice yield prediction [23]. These variations underscore the potential of adopting more generalized framework approaches to address the challenges of yield prediction across diverse crops and environmental conditions.
Ensemble learning (EL) enhances the predictive accuracy by combining multiple base models, utilizing techniques like bagging, boosting, and stacking to harness their complementary advantages. These methods have generally achieved superior generalization performance compared to individual models across various applications [24]. This has been demonstrated in yield estimation studies for crops like wheat [25], rice [26], peas [27], and alfalfa [28]. Despite advancements in yield prediction, no studies have yet addressed integrating multispectral data with stacked ensemble learning methods for oat yield prediction, particularly across multiple oat varieties, where genetic diversity introduces additional challenges in accurately capturing yield variability.
Previous research on crop yield prediction has predominantly focused on data from single growth stages, particularly during the later phases of crop development [29]. While late-stage data provide valuable insights into final yield estimates, they may fail to capture early physiological shifts that are critical to the crop’s overall growth trajectory [30]. Focusing solely on monitoring a single growth stage may fail to capture the dynamic changes throughout the entire crop development cycle or overlook critical shifts during key growth periods, thus missing early physiological changes and environmental factors that significantly influence yield potential [31]. Therefore, incorporating data from multiple growth stages provides a more comprehensive understanding of crop development, improving the accuracy and resilience of yield predictions.
This study aims to develop a more generalizable oat yield model by applying ML techniques and VIs derived from multispectral UAV data collected during the 2022 and 2023 growing seasons. The key objectives are (1) to explore the utility of UAV multispectral data for predicting oat yields across various genotypes; (2) to assess the performance of base and ensemble learning methods in enhancing prediction accuracy; and (3) to evaluate the effectiveness of an optimal multi-growth stage model for oat yield prediction.

2. Materials and Methods

2.1. Field Trial Design

This two-year study (2022 and 2023) was conducted at the National Oat and Buckwheat Industry System Oat Breeding Demonstration Base (41°8′54.21″N, 114°44′51.09″E) in Zhangbei County, Hebei Province, China (Figure 1). The region experiences a temperate continental climate, receiving an average of 475.72 mm of annual precipitation and maintaining a mean temperature of 4.04 °C over the past five years (data from https://www.meteoblue.com/, accessed on 1 September 2024). During the oat growing seasons, the average daily temperature in 2022 was 17.77 °C, with a maximum of 24.35 °C and a minimum of 10.86 °C, accompanied by a total rainfall of 179.7 mm. In 2023, the average daily temperature was 18.32 °C, with a maximum of 24.26 °C and a minimum of 11.92 °C and total rainfall of 191.6 mm.
A total of 338 oat cultivars, developed by the oat breeding industry over the past few decades, were used in this study and were sown in late May each year. The experimental field rotated with potatoes in the previous season. Each plot was planted with two cultivars, measuring 7.2 m by 2.1 m with a row spacing of 0.27 m. Irrigation was carried out using a movable sprinkler system, with water applied only to ensure seedling emergence, while subsequent water needs were met exclusively through natural rainfall. No fertilizers or pesticides were applied, and manual weeding was conducted. Farmland management adhered to optimal local agricultural practices. At maturity, each cultivar was manually harvested, with oat grains collected in plastic mesh bags, dried, and weighed at approximately 13% moisture. In total, 141 samples were collected in 2022 and 197 in 2023.

2.2. UAV Image Processing

UAV imagery was captured at key growth stages of oats (jointing, heading, early-grain filling, and mid-grain filling). The data were collected using a DJI Phantom 4 Multispectral fitted with five sensors (Table 1), with UAV flights conducted between 11:00 a.m. and 2:00 p.m. under clear skies. Autonomous flights were performed at an altitude of 50 m using DJI Go Pro software v2.0, ensuring 80% forward and 80% side overlap. The UAV acquired three diffuse standards (25%, 50%, and 75%) for radiometric calibration and ground control points for geometric corrections for each flight.
After each flight, the images were processed using Terra v3.9.4 software for stitching, radiometric calibration, and generating orthorectified reflectance data. Each cultivar’s planting area was divided into regular polygons using the QGIS v3.16.2 (Quantum Geographic Information System) software for this study. The boundaries of each cultivar were manually delineated from the orthomosaic map, and the ‘Copy and Move Features’ tool in QGIS was used to ensure uniform plot sizes. The average reflectance of each cultivar was extracted from imagery using Python v3.10.13 libraries (pandas, numpy, geopandas, rasterio, etc.), and the selected VIs, chosen for their proven performance in previous yield prediction studies [21,32], were computed as described in Table 2. Pearson’s correlation coefficient (r) was tested between VIs and oat grain yield to identify those with stronger correlations.

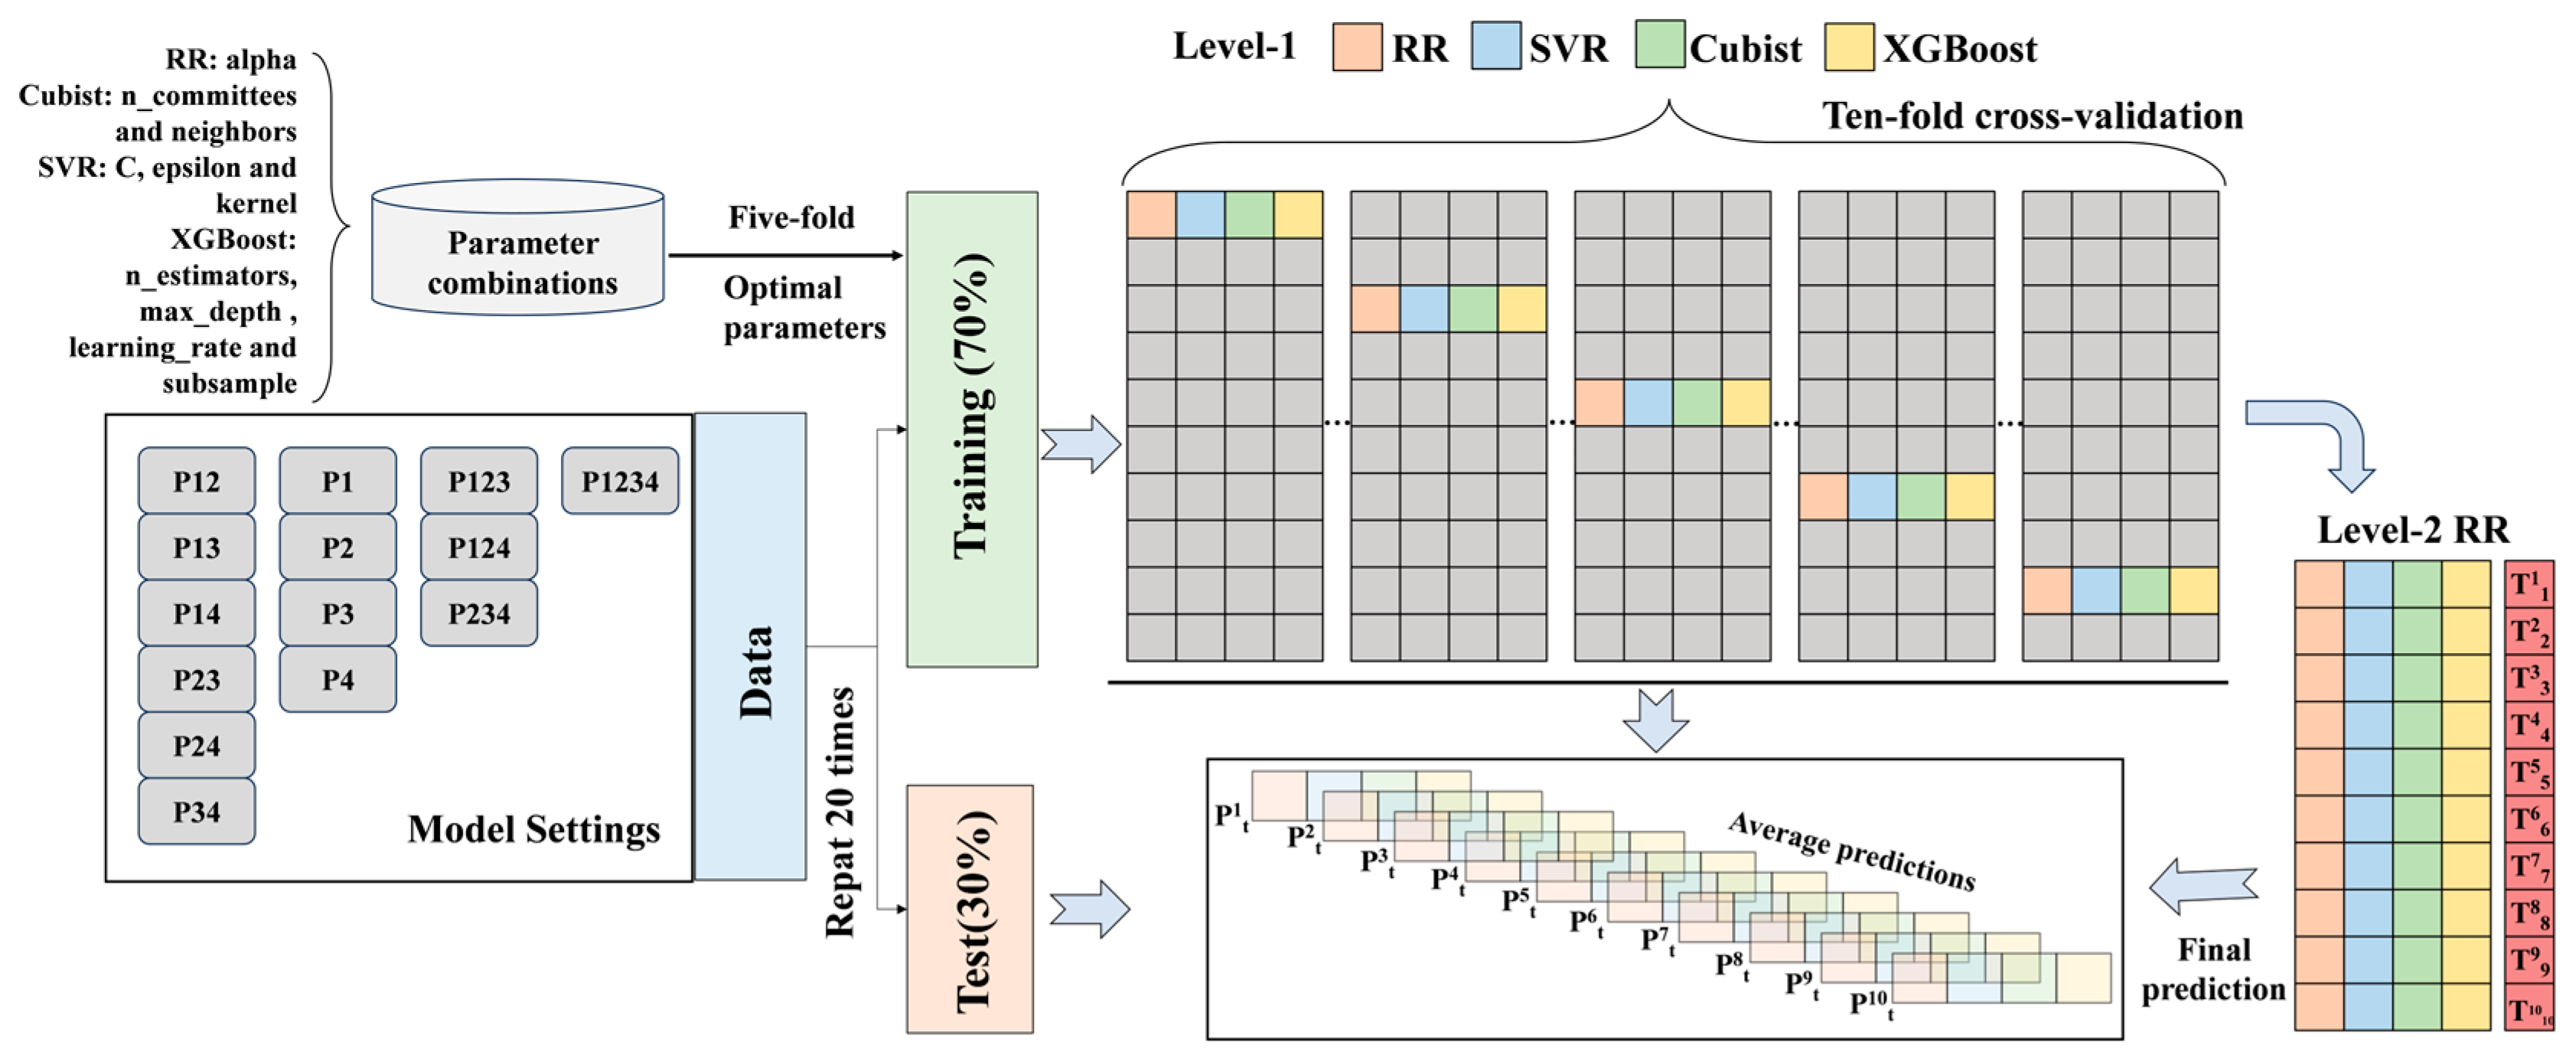
2.3. Ensemble Learning Framework for Oat Yield Prediction

We developed 14 modeling scenarios by combining key growth periods that have a significant influence on yield formation (P1: jointing stage, P2: heading stage, P3: early-grain filling stage, and P4: mid-grain filling stage), including single-growth period modeling scenarios; dual-growth period modeling scenarios (P12, P13, P14, P23, P24, and P34); and multi-growth period models (P123, P124, P234, and P1234).
In this study, we developed a stacked ensemble learning (EL) framework to enhance oat yield prediction accuracy by integrating four machine learning algorithms: RR, SVR, Cubist, and XGBoost (Figure 2). This ensemble leverages RR’s ability to address multicollinearity through regularization [46], SVR’s capacity to model non-linear relationships with kernel functions [47], Cubist’s use of regression trees combined with rule-based models for interpretability [9], and XGBoost’s efficiency in handling large-scale, high-dimensional data through advanced gradient boosting [48]. Stacking regression (StackReg) is an advanced ensemble method that integrates multiple base models to boost predictive accuracy [49]. The process is divided into two levels. First, the datasets were randomly divided into training (70%) and testing (30%) sets. The optimal parameters for each base algorithm were determined using five-fold cross-validation (CV) applied to the training data. The detailed parameter combinations are provided in Table 3. Subsequently, a ten-fold CV was conducted using the four base algorithms with their respective optimal parameters. The four trained base models generated ten predictions, each on the test set, which were then averaged.
At the second level, the prediction matrix from the training data served as input for a meta-model. RR was the secondary learner, integrating the base model predictions to produce the final ensemble output. The dataset was partitioned into training and testing sets 20 times to ensure robustness, maintaining the same partitioning across different modeling scenarios. Additionally, within each identical split, the same CV partitioning was applied across different ML models, ensuring fair comparisons of predictive accuracy.

2.4. Model Evaluation

In this study, the yield samples from 2022 and 2023 were randomly divided into training and test sets, and this process was repeated 20 times across 14 modeling scenarios. The accuracy of each base model and StackReg model was calculated using Equations (1) and (2). To assess the statistical significance of differences in performance between StackReg and four base models, paired t-tests were conducted on the R2 values of the test set predictions using Python’s scipy v1.10.1 stats library.
R 2 = 1 i = 1 n   y i y ^ i 2 i = 1 n   y i y ¯ i 2
RMSE   = i = 1 n   y i y ^ i 2 n
where n is the number of samples, y i is the observed value, y ¯ i is the mean of the observed value, and y ^ i is the predicted value.

3. Results

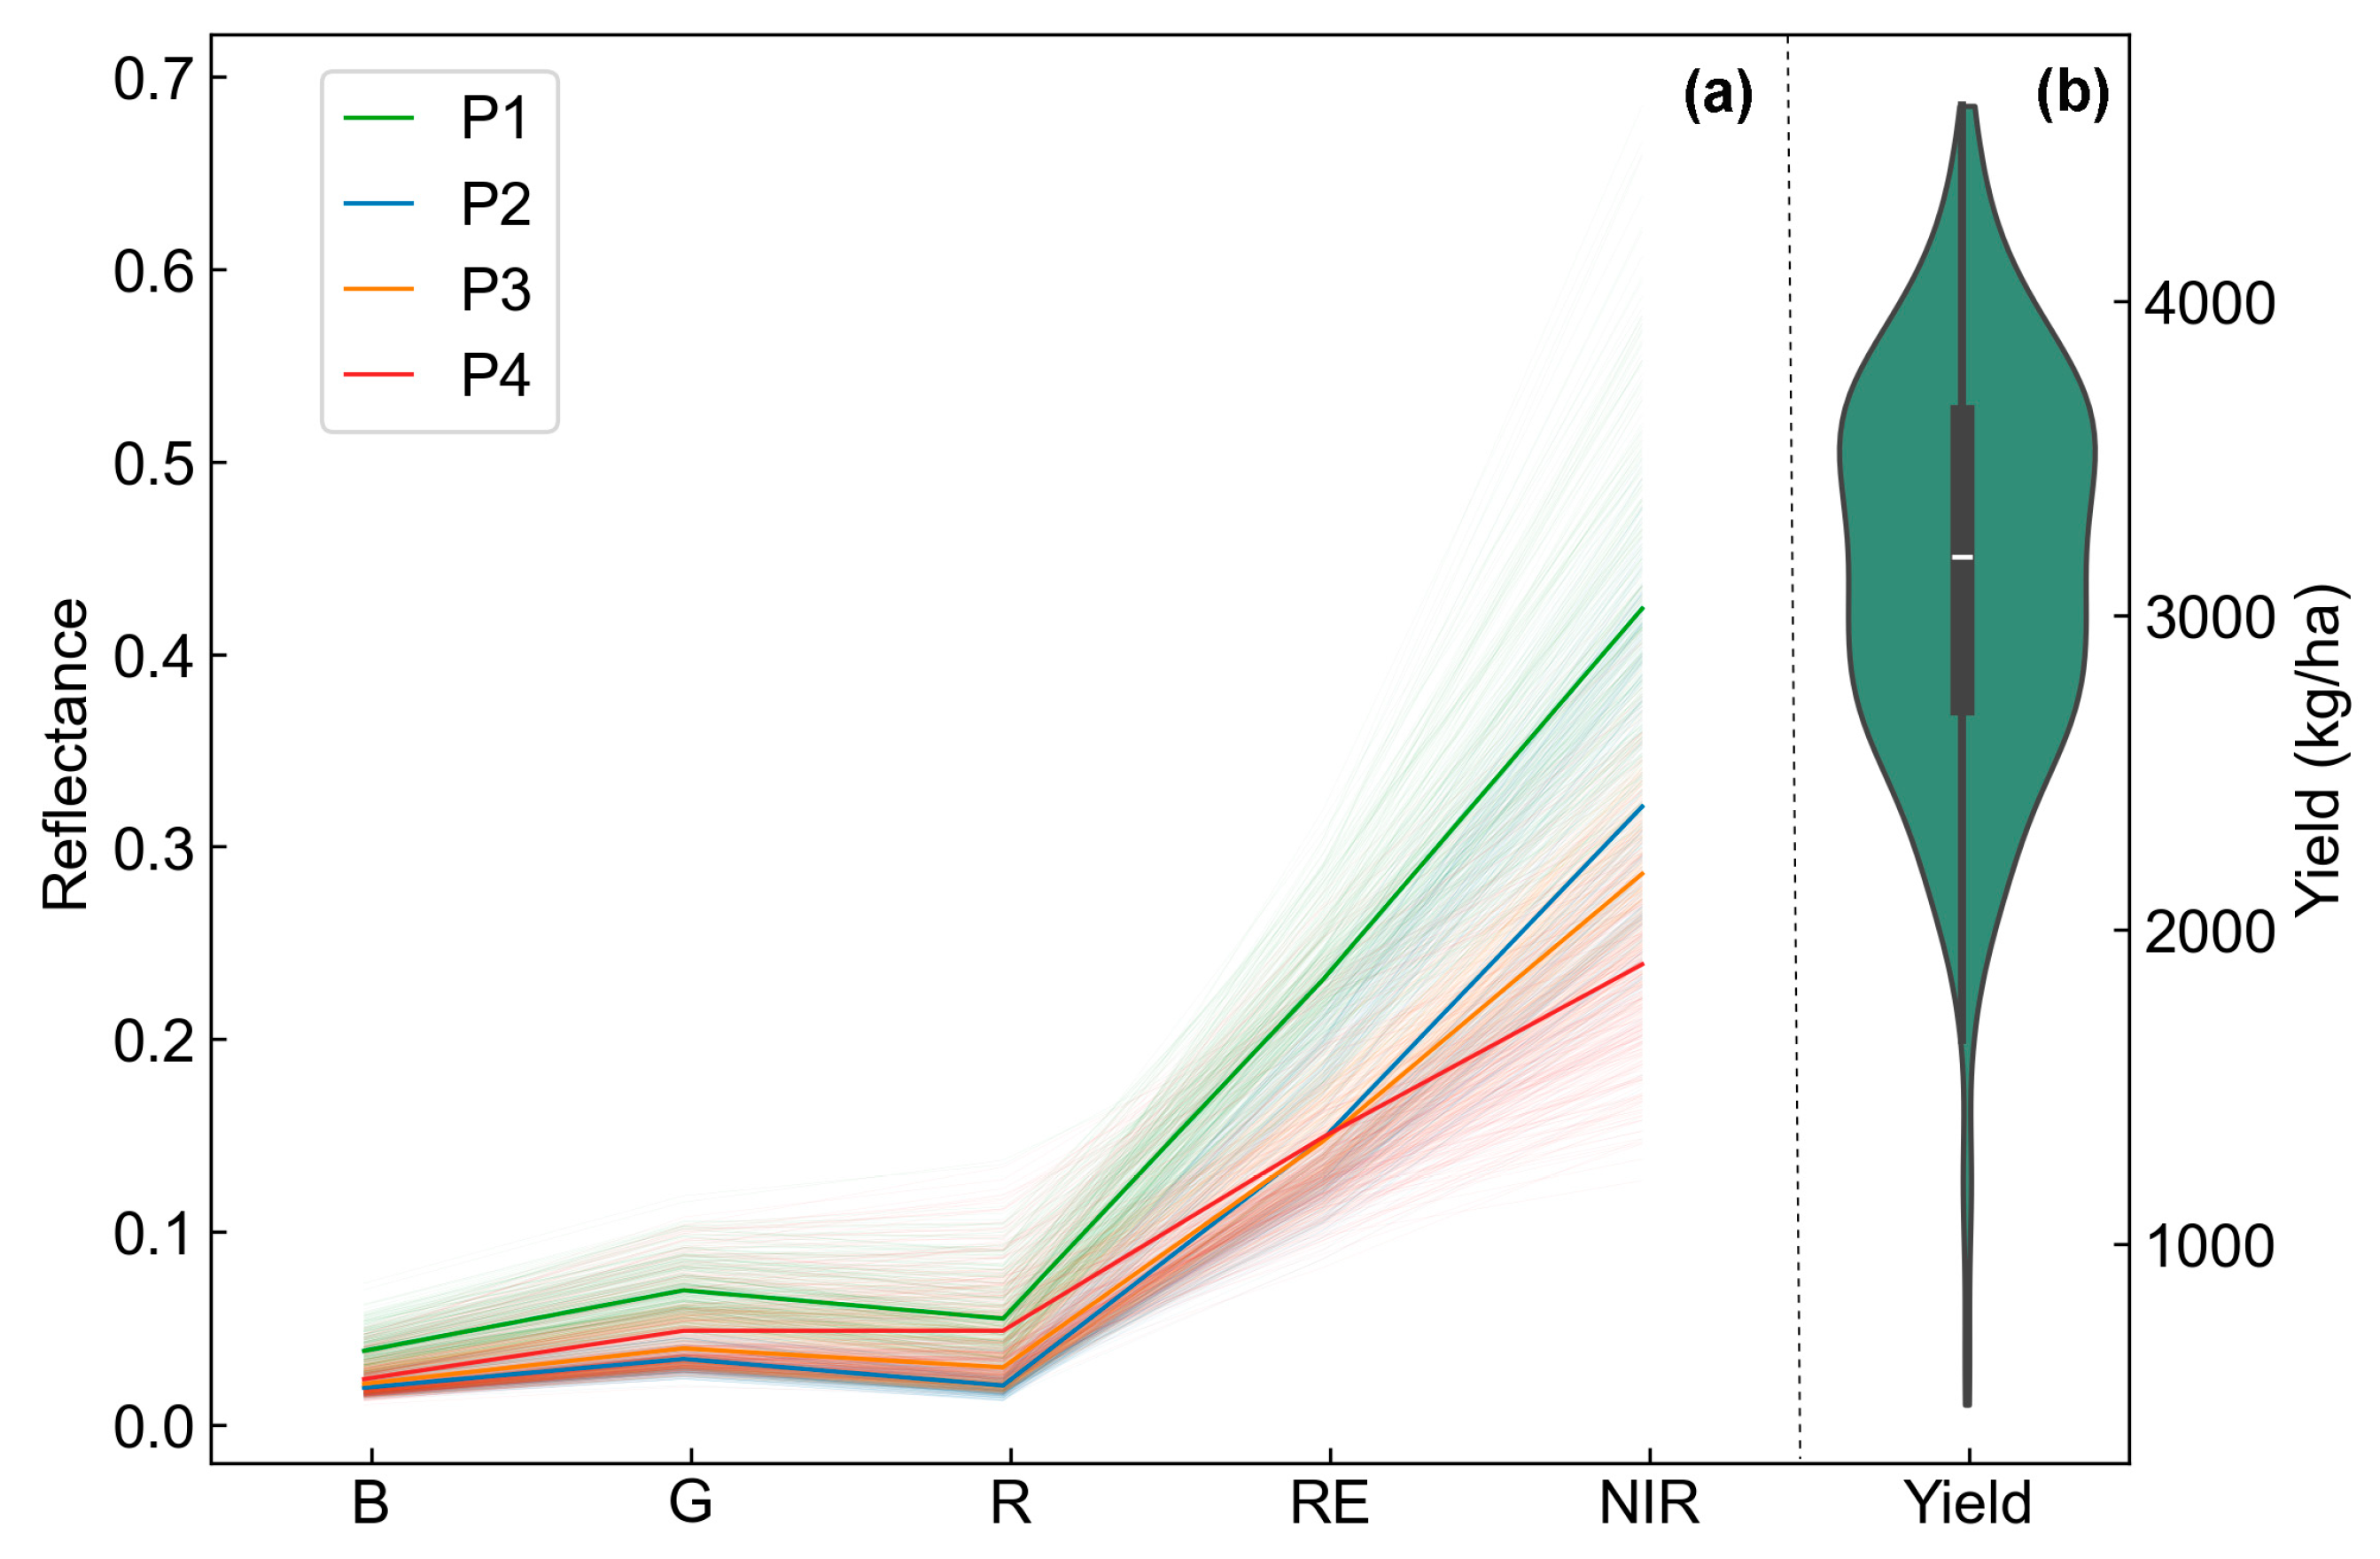
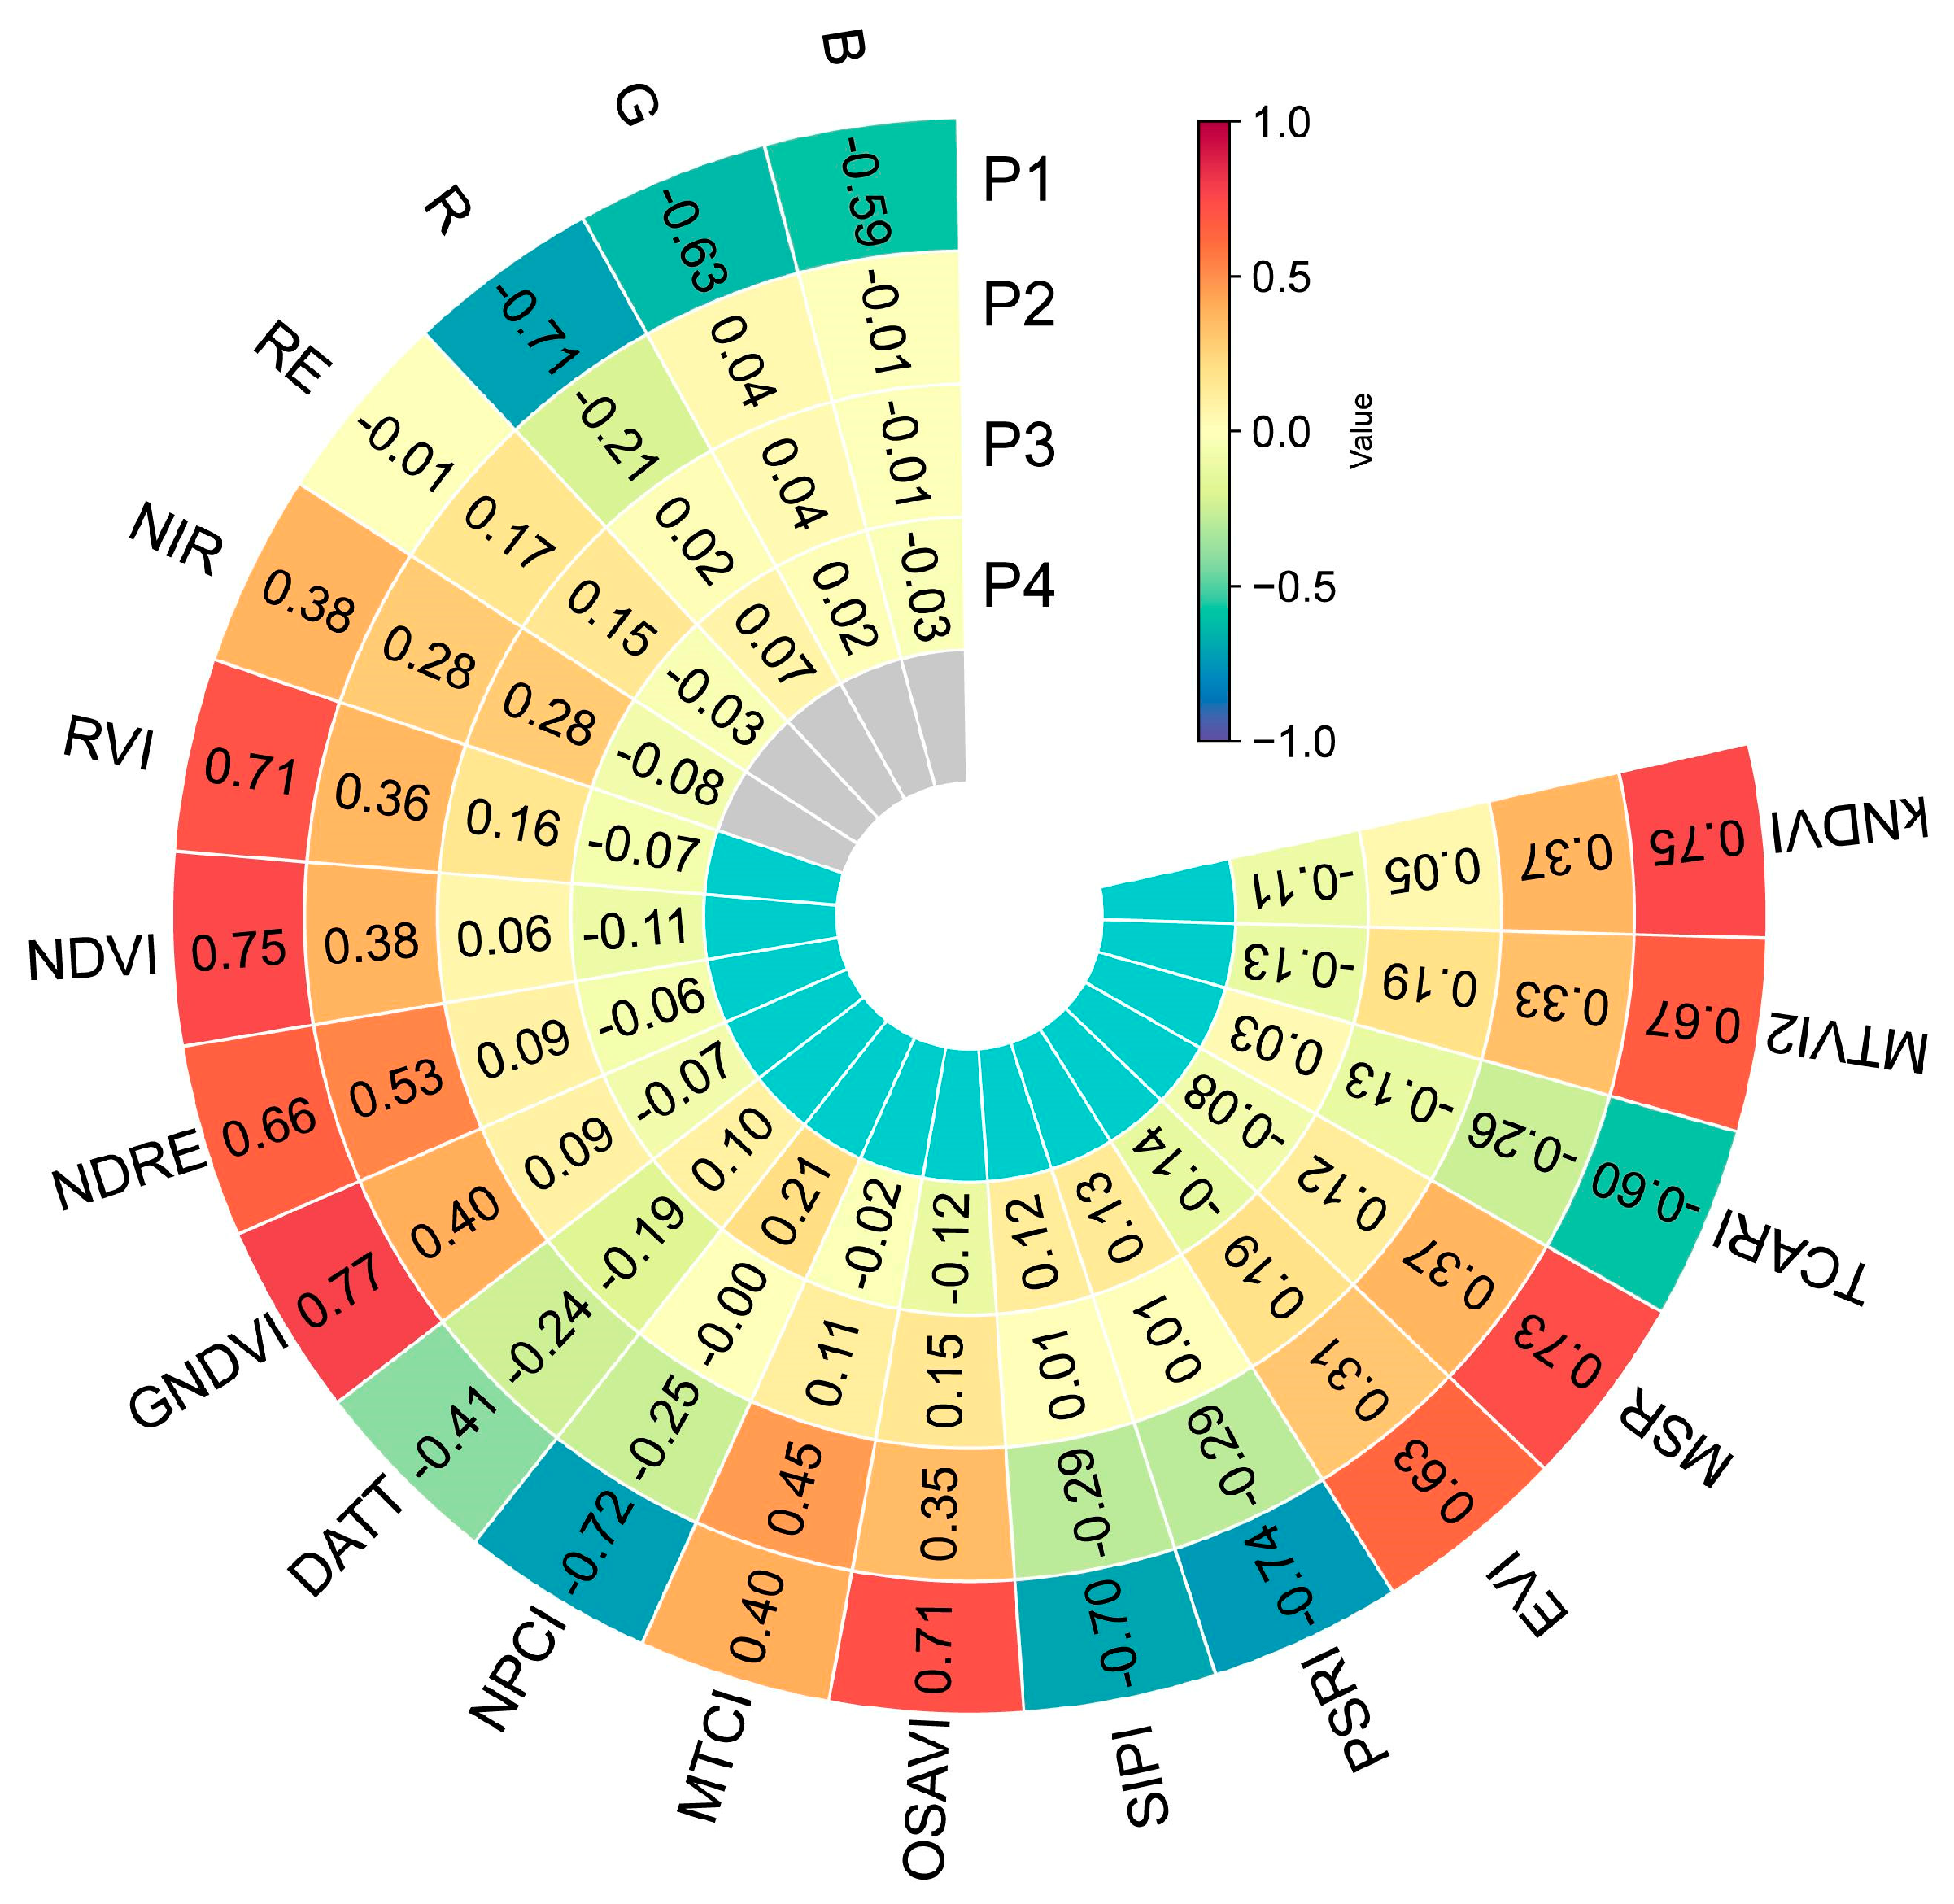
3.1. Statistical Analysis of Yield and UAV Spectral Data

The combined oat yield data from both growing seasons followed a normal distribution (Figure 3b). Yield values ranged from 510.58 to 4639.92 kg/ha, with a mean of 3162.69 kg/ha. The dataset exhibited a coefficient of variation of 20.33% (Table 4). The UAV-captured spectral reflectance curves of oat canopies across four growth stages showed typical crop patterns, with low reflectance in the blue and red bands and a peak in the green (Figure 3a). A marked increase in reflectance was observed in the red edge and near-infrared (NIR) regions, particularly during the jointing phase (P1). As the oats matured and spikes appeared after the heading phase (P2), the canopy structure changed with a reduction in leaf area and an increase in spikes, resulting in decreased NIR reflectance.
Vegetation indices were calculated using UAV images acquired at different growth stages, and their correlation with the oat grain yield was determined. As the growth stages advanced, the correlation gradually decreased (Figure 4). In the P1 stage, most VIs exhibited significant correlations with oat yield, with absolute r values spanning from 0.40 (MTCI) to 0.77 (GNDVI). In the P2 stage, the correlations weaken, with absolute values ranging from 0.24 (DATT) to 0.53 (NDRE). By the P3 stage, NIR band reflectance exhibited the strongest correlation with yield (r = 0.28). In the final stage, P4, NPCI exhibited the highest correlation (r = 0.21).

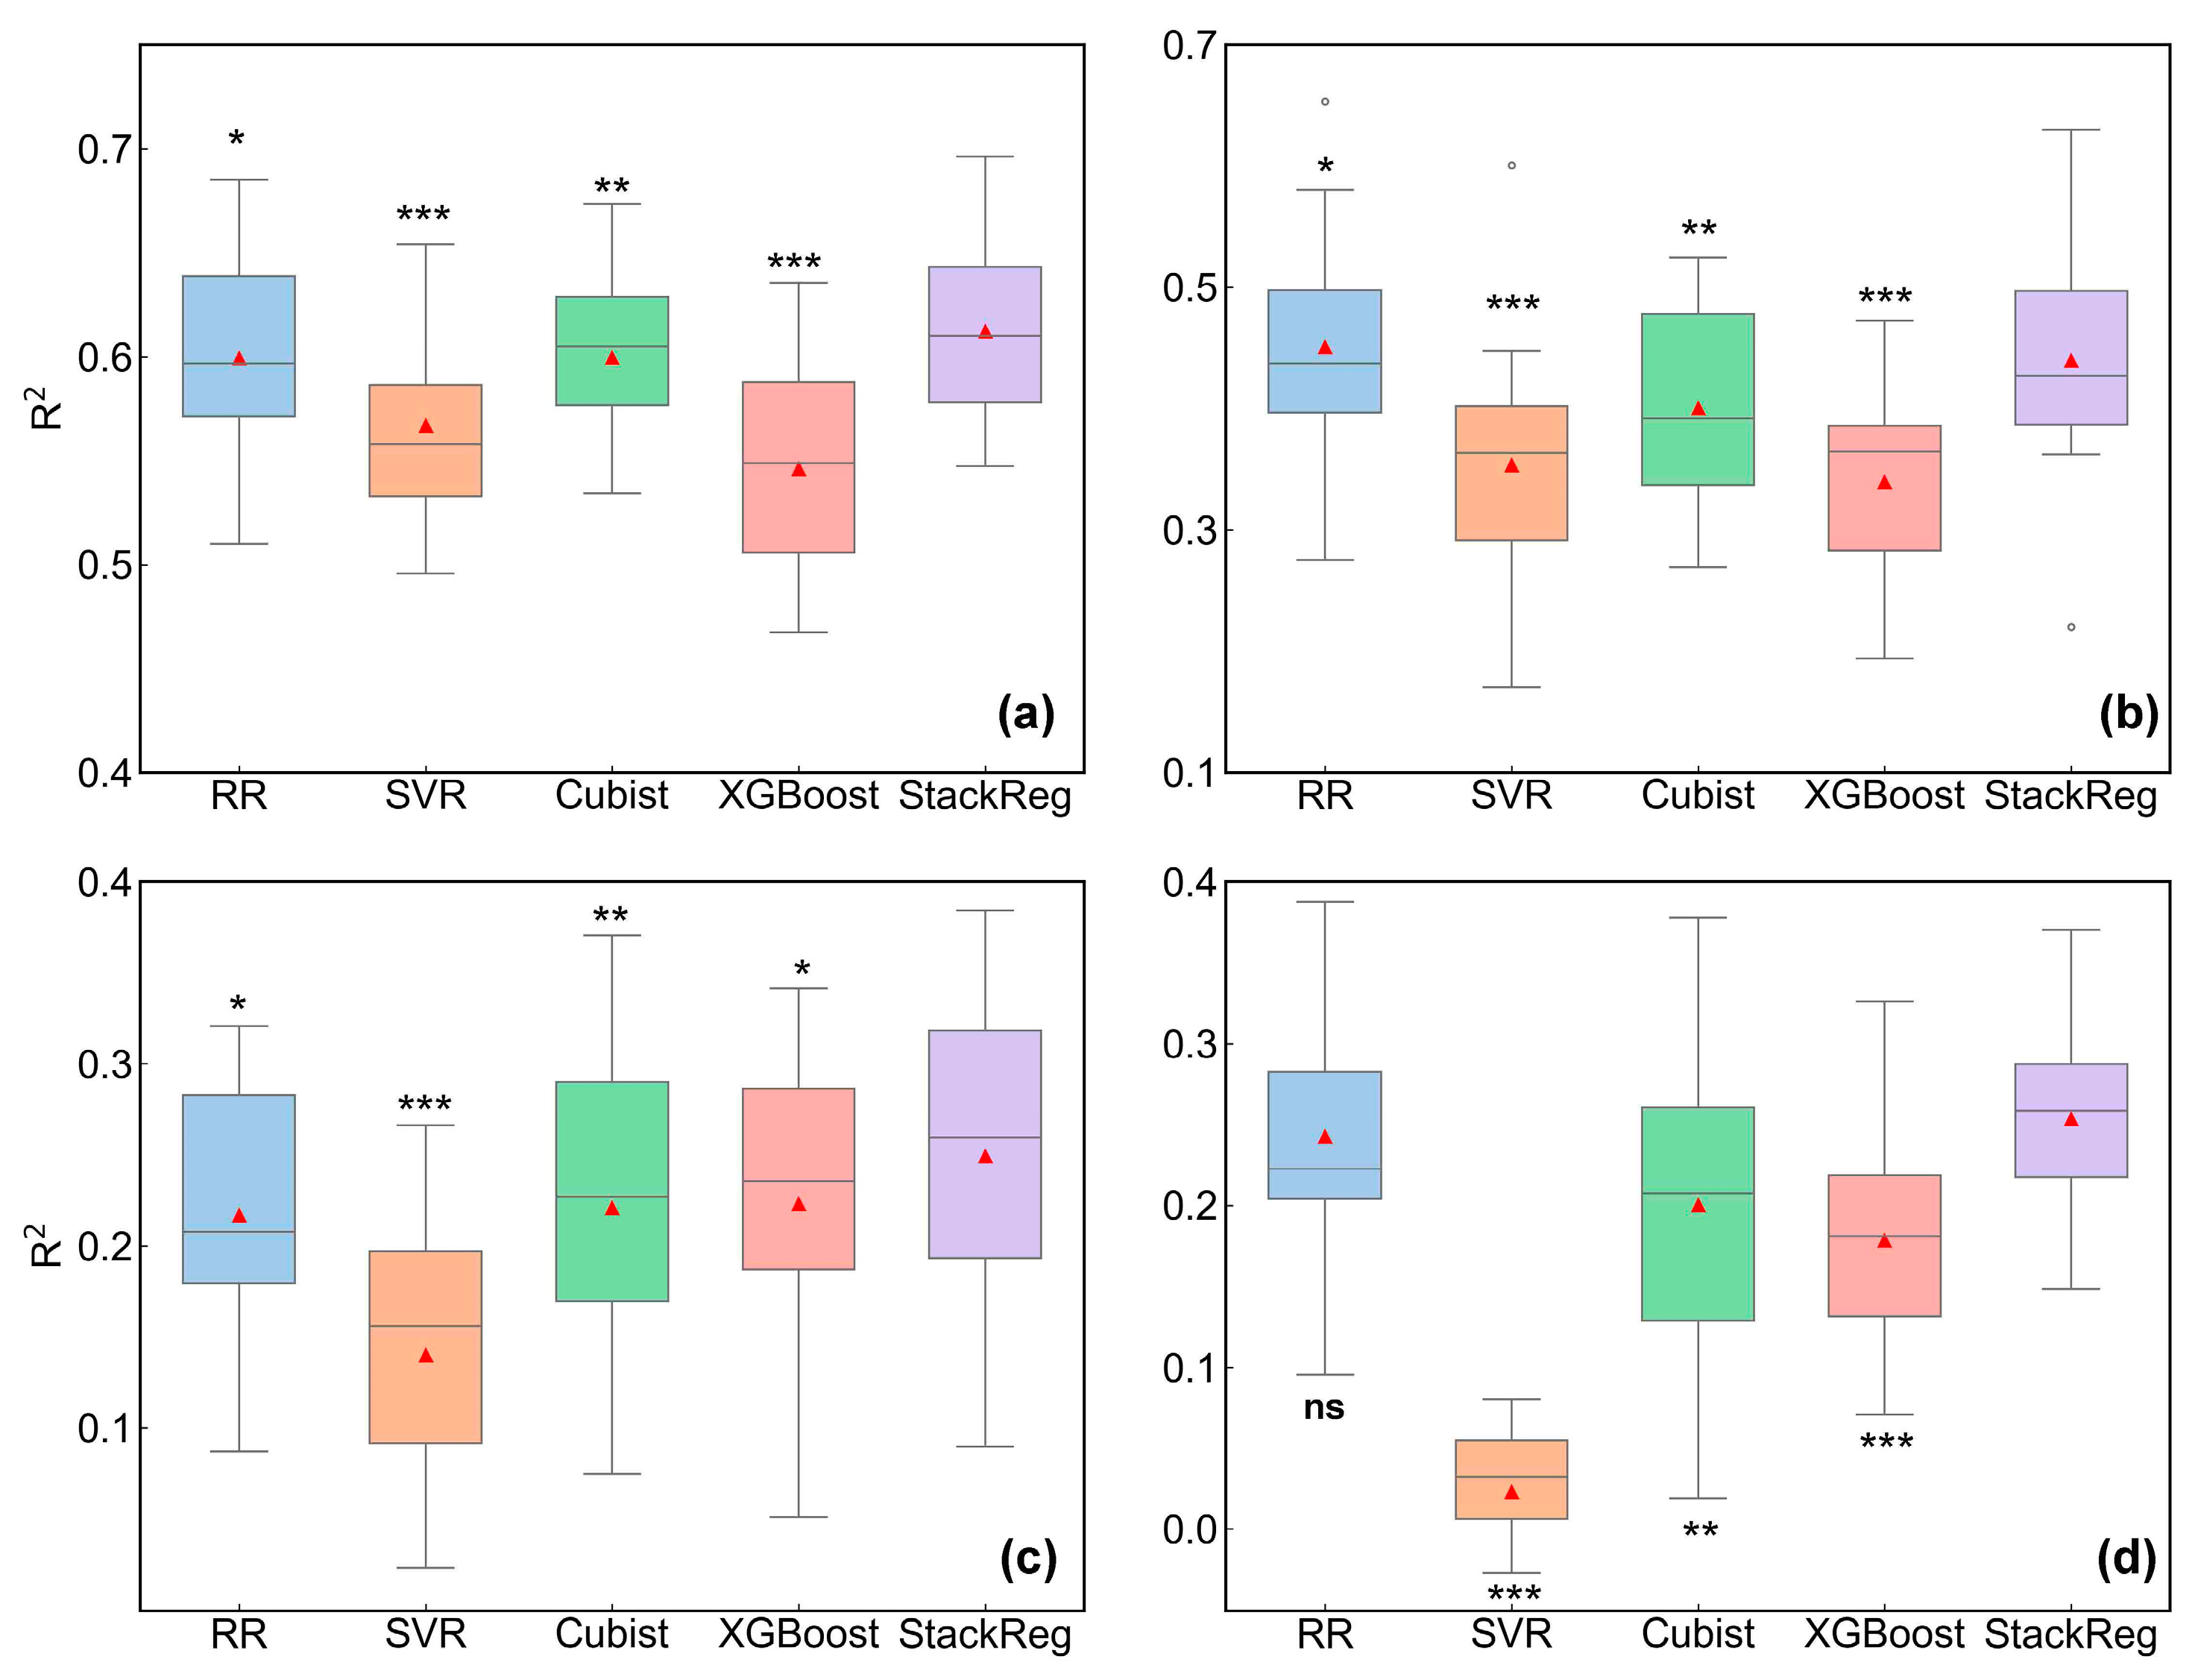
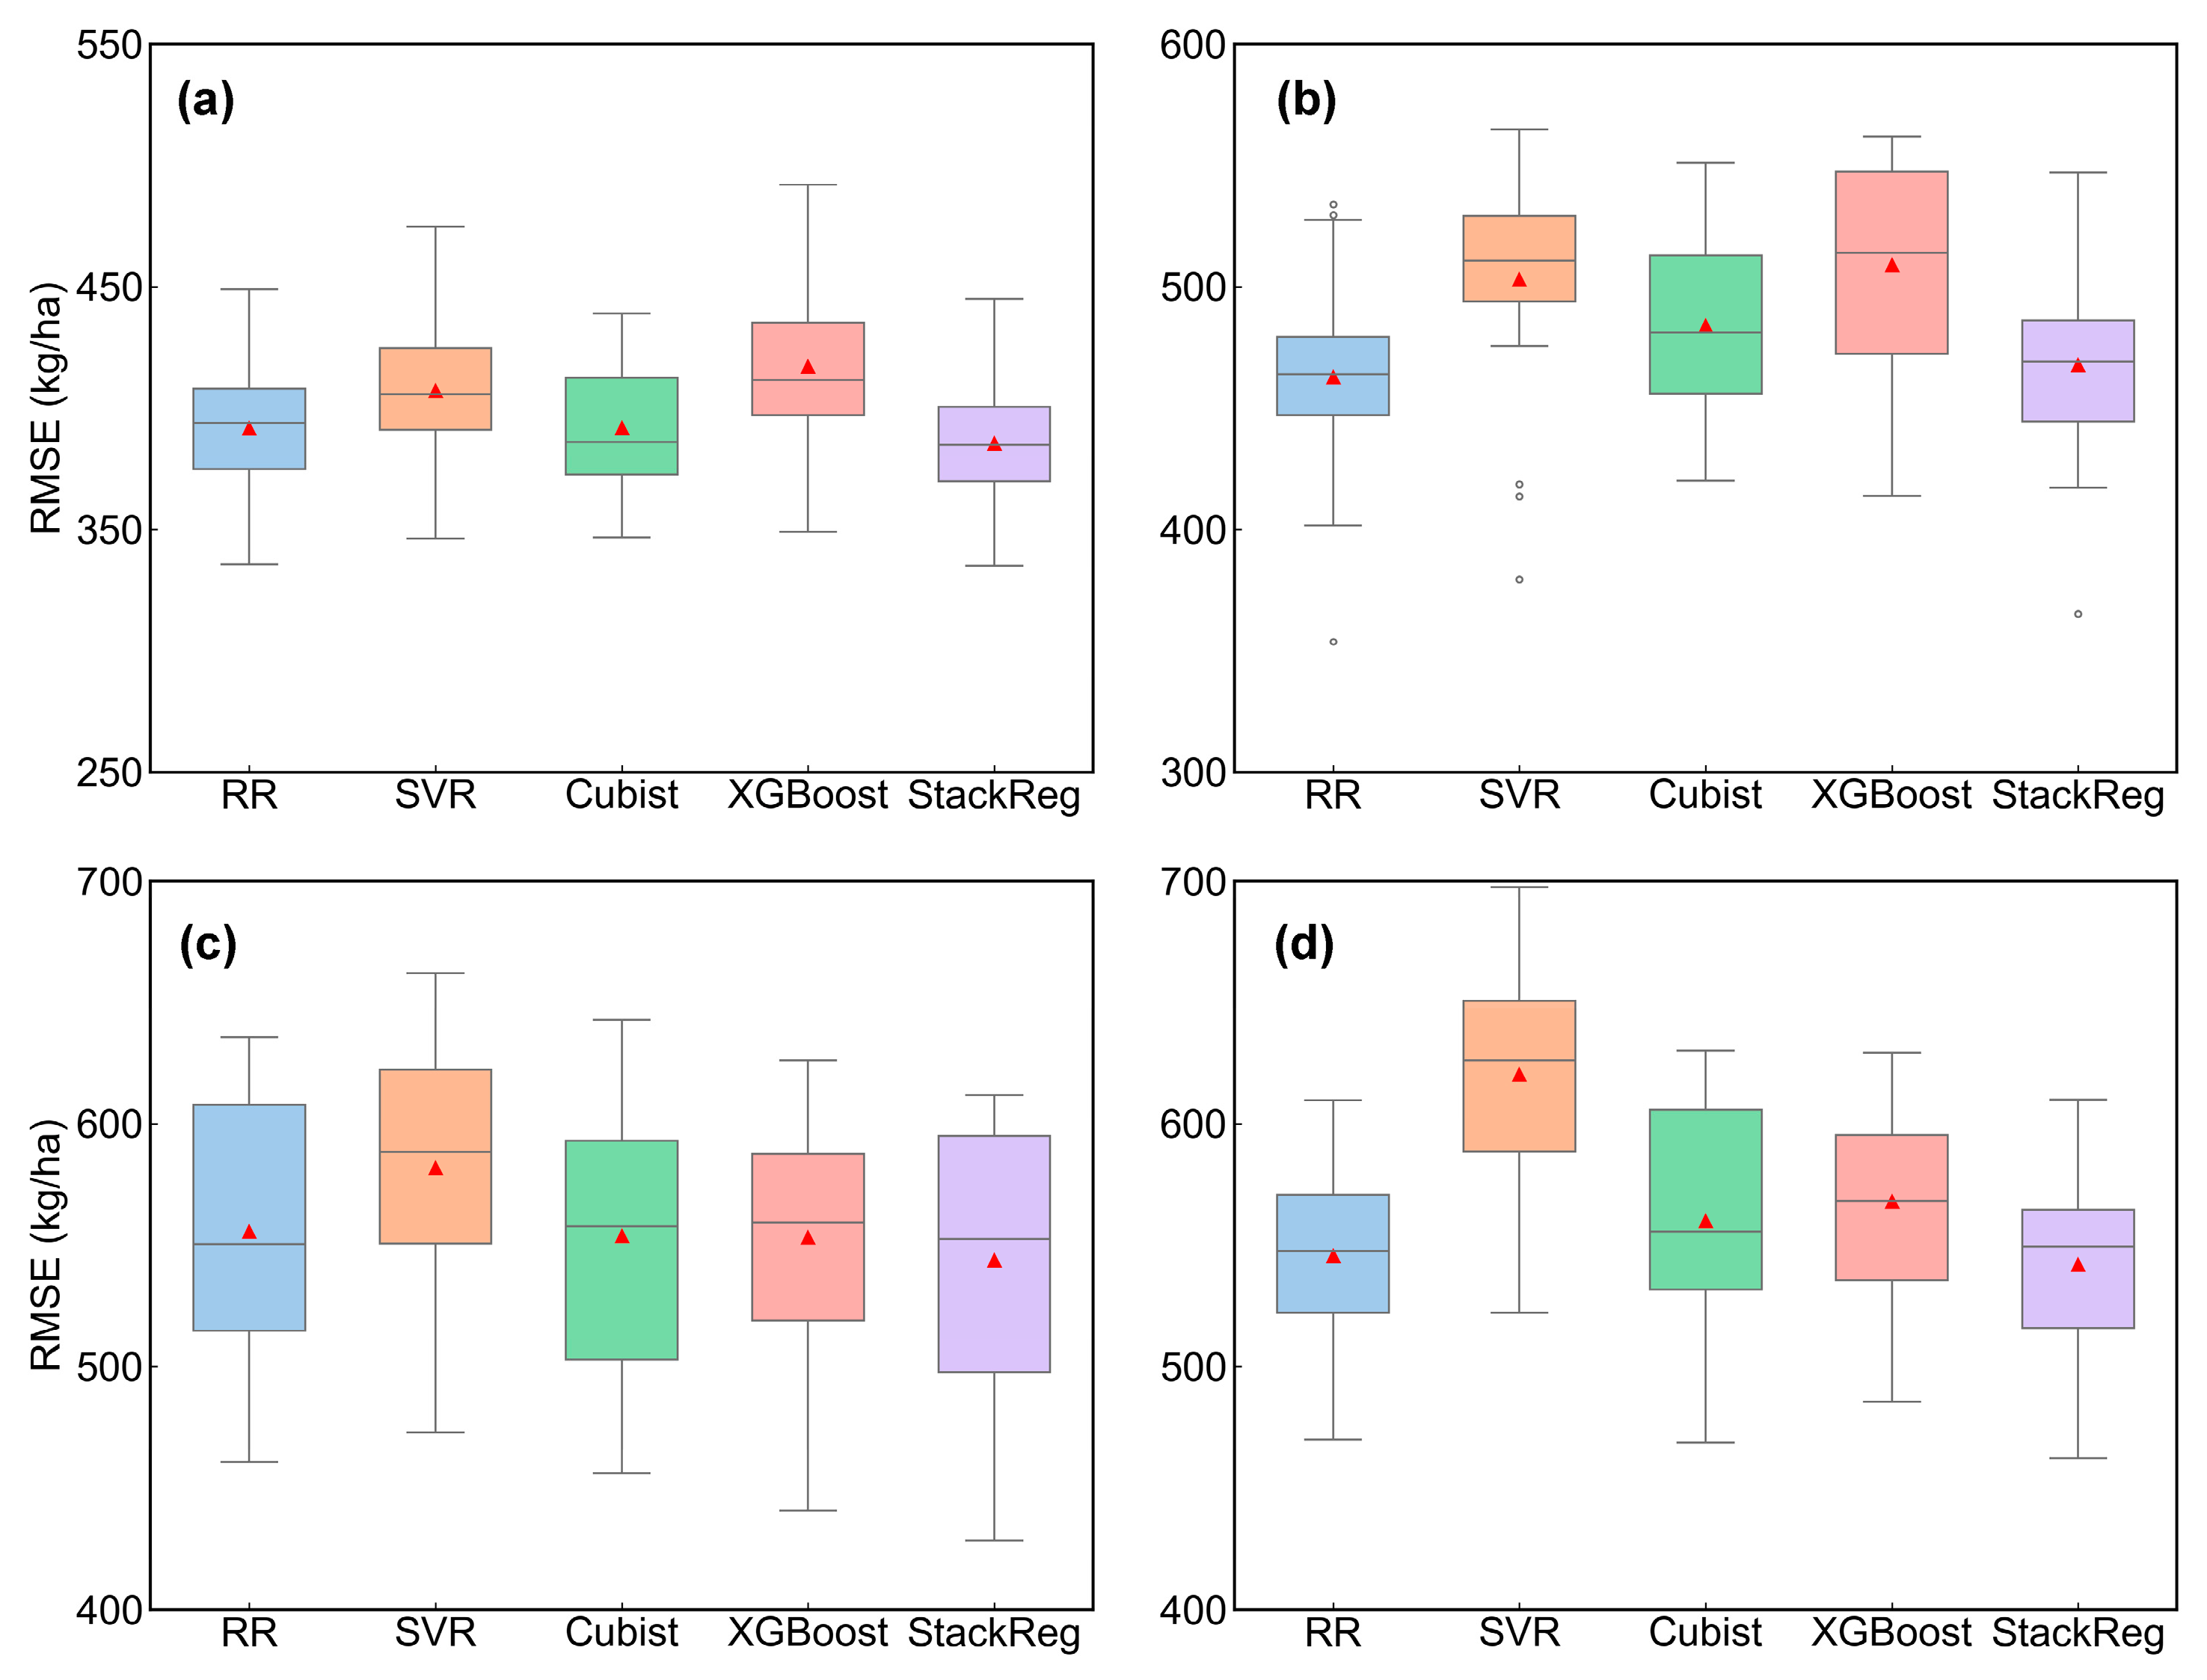
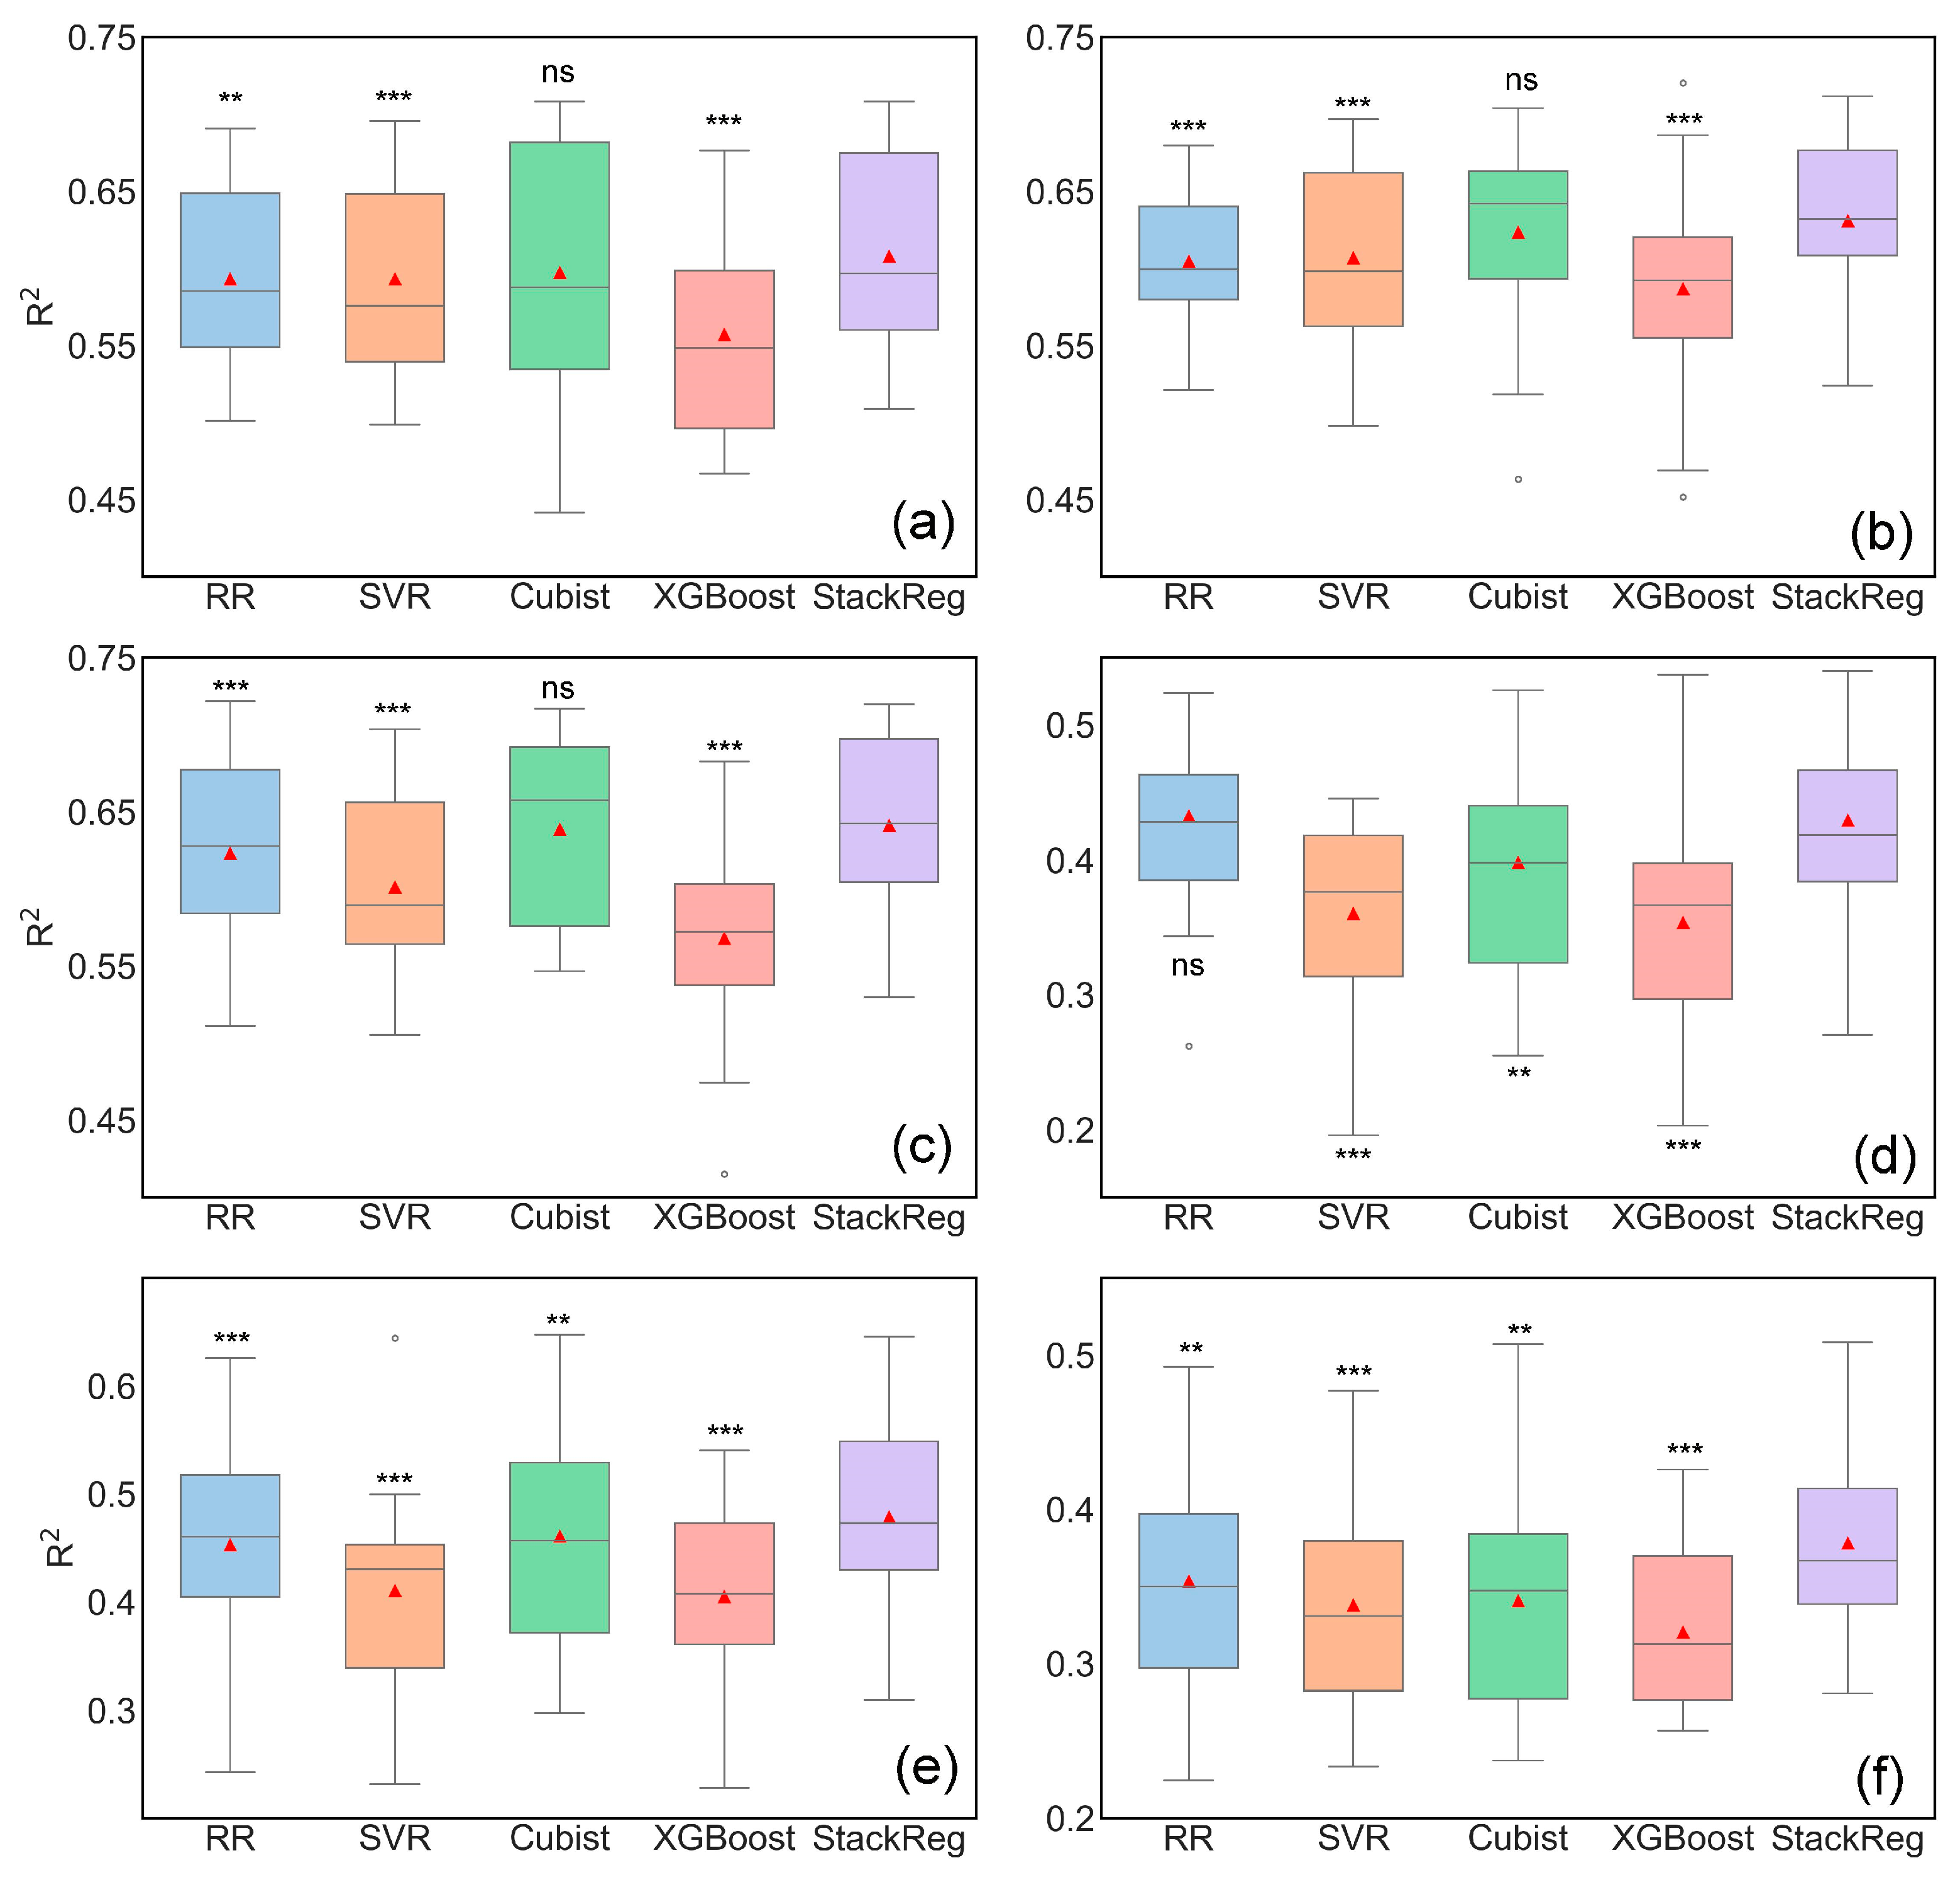
3.2. Evaluation of Oat Yield Prediction Models Based on Single-Stage UAV Imagery

The StackReg model consistently exhibited superior predictive accuracy compared to the base models in most growth stages (Figure 5 and Figure 6). During the jointing stage (P1), the four base models exhibited average R2 values spanning 0.55 to 0.60, with RMSE values between 391.50 and 417.25 kg/ha. The StackReg achieved a higher R2 of 0.61 and a lower RMSE of 385.33 kg/ha. At the heading stage (P2), base models had average R2 values between 0.34 and 0.45, with RMSE values from 462.91 to 509.04 kg/ha. The accuracy of the StackReg (R2 = 0.44, RMSE = 467.90 kg/ha) was slightly lower than that of the RR base model, possibly due to a lower outlier in the StackReg results and a higher effect observed in the RR results. However, the statistical analysis revealed significant differences (p < 0.05) between the StackReg and RR models. During the early-grain filling stage (P3), base models produced R2 values between 0.14 and 0.22, with RMSEs ranging from 553.18 to 581.87 kg/ha. The StackReg improved upon these results, delivering an R2 of 0.25 and a RMSE of 543.79 kg/ha. In the mid-grain filling stage (P4), the base models showed R2 values varying from 0.02 to 0.24, with RMSEs from 545.62 to 620.49 kg/ha, whereas the StackReg further enhanced the performance (R2 = 0.25 and RMSE = 542.02 kg/ha).

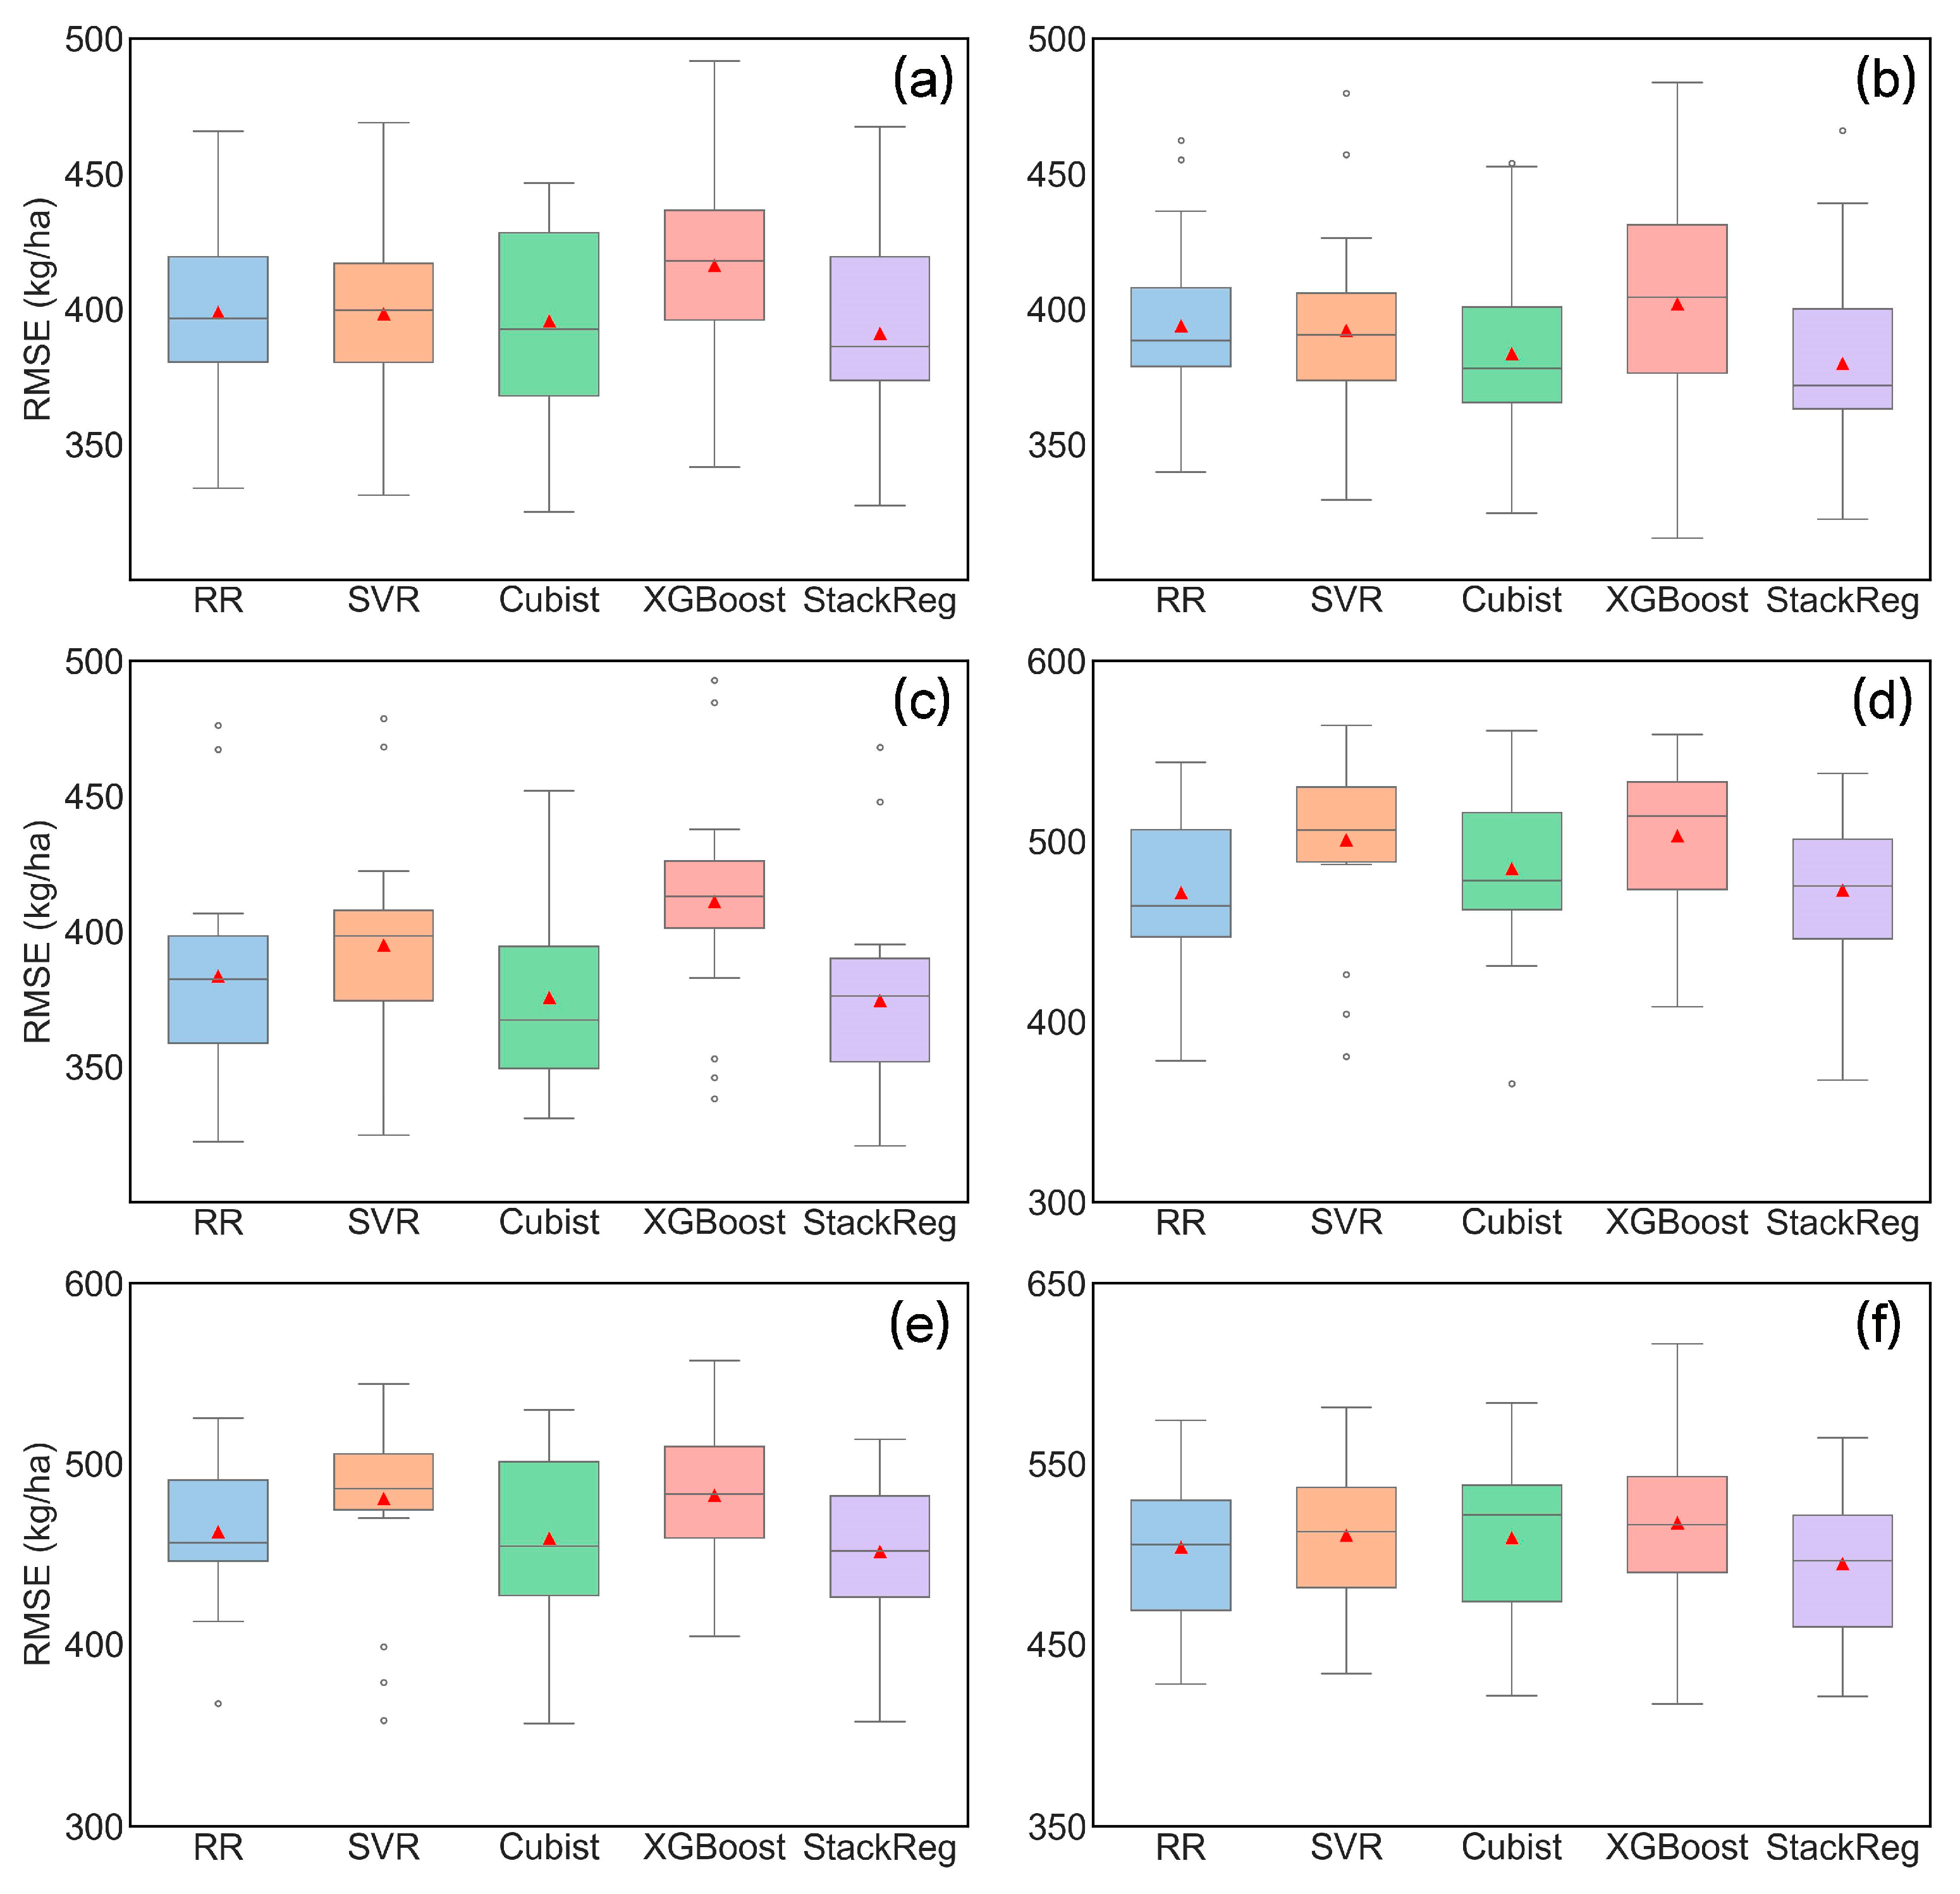
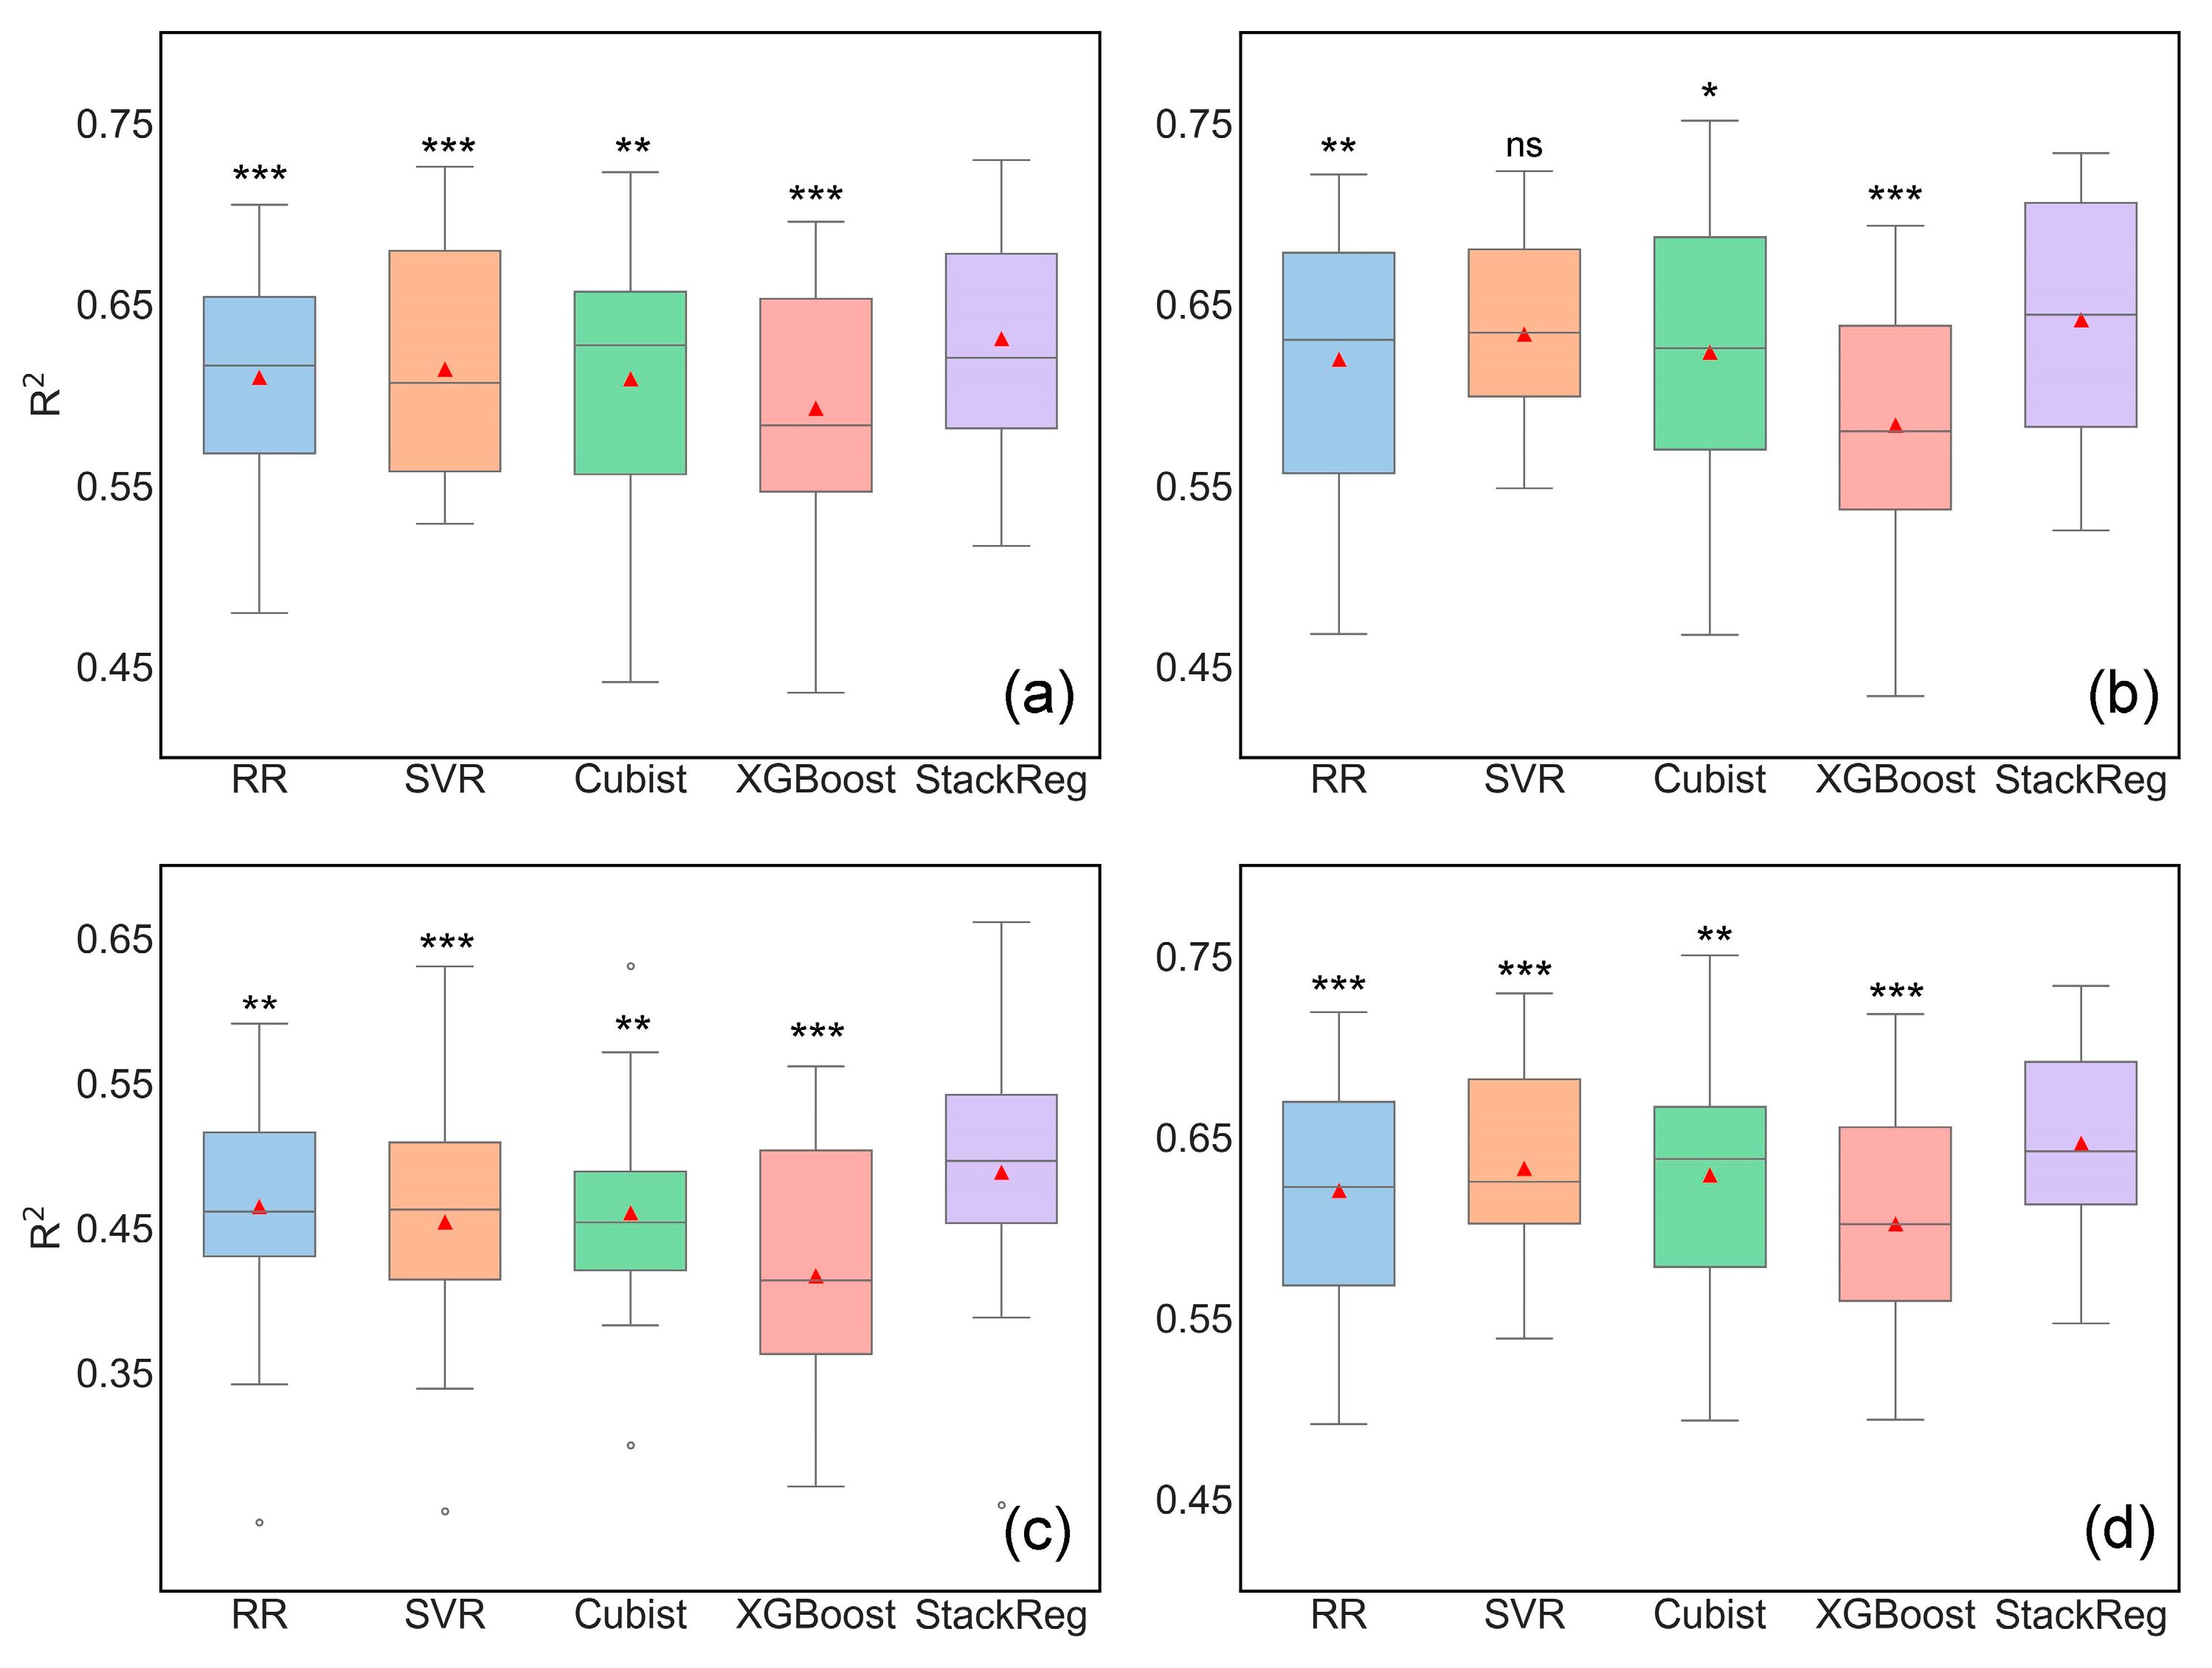
3.3. Evaluation of Oat Yield Prediction Models Based on Dual-Stage UAV Imagery

Across all six dual-stage combinations, the StackReg model generally outperformed the individual base models, with statistically significant differences from the base models in most cases (Figure 7 and Figure 8). For combinations involving the earlier growth stages (P12, P13, and P14), the StackReg model showed significant improvements (R2 = 0.61~0.64, RMSE = 374~391 kg/ha). The base model R2 values varied between 0.56 and 0.64, and the RMSEs ranged between 375 and 416 kg/ha. For combinations involving later growth stages (P23, P24, and P34), although the overall predictive accuracy decreased, the StackReg model still surpassed the base models, with R2 values spanning 0.38 to 0.48 and RMSEs falling within the range of 451 to 495 kg/ha. In contrast, the base models showed R2 values ranging from 0.32 to 0.46, with RMSEs varying between 458 and 517 kg/ha.

3.4. Evaluation of Oat Yield Prediction Models Based on Multi-Stage UAV Imagery

Across all four multi-stage combinations, the StackReg model consistently outperformed the individual base models with statistically significant differences (Figure 9 and Figure 10). For the P123 combination, the StackReg (R2 = 0.63, RMSE = 379.60 kg/ha) outperformed the base models, which had R2 values ranging from 0.59 to 0.61 and RMSEs between 388.19 and 398.89 kg/ha. In the P124 combination, the base models exhibited average R2 values between 0.58 and 0.63, with RMSEs ranging from 378.79 to 403.15 kg/ha. The StackReg improved performance (R2 = 0.64 and RMSE =374.08 kg/ha). For the P234 combination, the base models demonstrated average R2 values between 0.42 and 0.46, with RMSEs ranging from 457.78 to 477.84 kg/ha. The StackReg enhanced these results (R2 = 0.49 and RMSE = 447.19 kg/ha). Finally, for the P1234 combination, the base models produced average R2 values from 0.60 to 0.63, with RMSEs between 384.78 and 394.20 kg/ha. The StackReg delivered the highest accuracy, recording an R2 of 0.65 and a RMSE of 371.77 kg/ha.

4. Discussion

4.1. Integrating Multiple Growth Stages for Oat Yield Prediction

Numerous studies have demonstrated that physiological shifts across different growth stages lead to significant spectral variations in crop canopy, captured in VIs used for predicting yields. Our study found that the relationship between VIs and oat yield varied across different growth stages, aligning with previous research [3]. Grain yield is primarily determined by thousand grain weight (TGW), spike number (SN), and grain number per spike (GN), all of which are influenced by various factors, particularly during key growth stages [32,50]. The jointing stage is crucial for determining SN and GN, while the heading stage is pivotal for TGW. During the grain-filling stage, photosynthetically produced compounds are translocated from vegetative organs to grains, making this phase essential for the final yield formation [51,52]. Therefore, we thoroughly investigated these key growth stages and their combinations and found that yield prediction was most accurate during the jointing stage, followed by the heading and grain-filling stages. Similar trends have been reported in winter wheat and rice yield prediction studies [53,54]. The decline in model accuracy during the later stages is attributed to nutrient translocation from the canopy to the grains, natural leaf senescence, and reductions in chlorophyll content and photosynthetic activity. These factors weaken the association between red and near-infrared VIs and the accumulation of grain dry matter [21,55]. This phenomenon is reflected in the relationship between VIs and yield across different growth stages. Commonly used VIs, such as NDVI, GNDVI, OSAVI, EVI, SIPI and PSRI, are widely employed to quantify essential crop parameters, including biomass, chlorophyll content, and nitrogen levels, all of which are closely linked to yield potential [9,49,56,57]. Among these, the NDVI stands out as the most extensively utilized and effective VI for estimating crop yield [58].
Our findings are consistent with multiple studies that have demonstrated the effectiveness of multispectral data in predicting crop yields across various species [19,49,54]. However, a considerable number of studies rely on spectral data from a single growth stage, particularly late stages of development. This approach may overlook temporal variations in vegetation characteristics that influence yield potential [59]. Previous research has suggested that using multiple stages of crop canopy spectral data can potentially improve the accuracy of yield prediction [32,60]. For oats, there has been limited investigation into the use of multi-stage spectral data for yield prediction. In our research, combining spectral data from multiple growth stages enhanced the precision of predicting oat yields, particularly when the jointing stage was included in the model. Notably, our results showed that the predictive accuracy of the full multi-stage combination (P1234; R2 = 0.65) was only marginally higher than that of a two-stage combination (P14; R2 = 0.64). This suggests that monitoring early and late growth stages in tandem could provide an efficient approach for oat yield prediction in future studies.
However, incorporating spectral data from multiple growth stages as input features increases the number of variables in machine learning models, potentially leading to data redundancy and greater model complexity [61]. Additionally, the large number of input features can raise the risk of overfitting [32]. The limited improvement observed in our study from multi-stage combinations may be due to the lack of variable selection, which could result in redundant features being included in the model. Future research could explore feature selection methods to identify the most relevant VIs for each growth stage, thereby optimizing yield prediction models.

4.2. Potential of Ensemble Learning in Oat Yield Prediction

While remarkable achievements of ML across various domains, purely data-driven approaches still face inherent limitations. The reliability of machine learning outcomes is strongly influenced by the quality of the training data, the appropriateness of the chosen model, and the understanding of input–target relationships [49]. Using individual machine learning algorithms for estimating diverse crop parameters (e.g., yield) often encounters these limitations [57,62]. Minor variations in estimation accuracy can significantly impact decision-making in precision agriculture, emphasizing the need to explore approaches that can achieve higher predictive accuracy. This study investigated the effectiveness of the ensemble learning approach across multiple growth stage scenarios. Consistent with previous research, the ensemble models demonstrated higher predictive accuracy under various modeling conditions (e.g., single growth period, dual growth periods, and multiple growth periods), affirming the reliability of this method [25]. Our results revealed variability in the optimal base model (RR, SVR, Cubist, and XGBoost) across different modeling scenarios (e.g., data combinations from various growth stages). Specifically, the Cubist model achieved the highest predictive accuracy for oat yield in the P1, P12, P13, P14, and P24 scenarios. The RR model performed best in the P2, P4, P23, P34, and P234 scenarios. The SVR model excelled in the P123, P124, and P1234 scenarios, while XGBoost demonstrated the highest accuracy in the P3 scenario. This variability limits the applicability of any single base model across all scenarios. Consequently, it highlights the advantage of the stacked ensemble learning approach, which combines the strengths of different base models to achieve more consistent and robust predictive accuracy. For instance, multispectral studies on wheat have demonstrated the effectiveness of ensemble learning methods in yield prediction. A stacking algorithm integrating models such as RF, PLS, XGBoost, and Extreme Learning Machine achieved a yield prediction accuracy, with an R2 ranging from 0.52 to 0.63 [59], while another ensemble approach combining RF, SVR, RR, and GP reported a yield prediction accuracy within the range of R2 = 0.625–0.628 [25]. These findings align with our results, as they underscore the versatility and effectiveness of ensemble learning methods in addressing the limitations of individual machine learning models and achieving higher accuracy in yield prediction across different crops and growth stage scenarios.
Substantial errors in certain base learners may introduce significant biases during the training of the meta-learner, ultimately affecting the overall predictive accuracy [49]. In studies employing stacked regression to estimate plant traits, linear models are frequently utilized as meta-models to mitigate overfitting and address multicollinearity within the data [25]. Similar to previous research, this study adopts RR as the secondary learner, demonstrating improved oat yield model accuracy [9,49]. Future research could explore a variety of secondary learners to enhance prediction accuracy further. Potential methods include weighted averaging [63], Bayesian averaging [64], and decision-level fusion [65], each offering distinct advantages in integrating multiple predictive models. However, EL demands comprehensive training for each base model to reach the optimal performance, which inevitably increases the training time compared to the most influential single model. Future research should investigate strategies to harmonize model complexity with predictive precision, optimizing performance and efficiency.

4.3. Implications for Future Research

Commonly used multispectral VIs do not always exhibit high sensitivity to the physiological traits of crops. Combining data from other types of sensors (e.g., LiDAR, SAR, and hyperspectral imaging) or simulated datasets (e.g., PROSAIL and crop growth models) could enhance crop yield prediction accuracy and model stability [66,67,68]. Hyperspectral remote sensing, in particular, offers promising solutions for more precise crop monitoring [69]. For example, sun-induced chlorophyll fluorescence, derived from narrow hyperspectral bands, can be utilized to monitor physiological growth and predict agricultural yields by reflecting the leaf photosynthetic capacity [70]. While spectral data alone offer valuable insights for yield prediction, its predictive power remains limited. Integrating additional data, such as meteorological (e.g., temperature) and phenological variables (e.g., growth stage timing), could potentially improve predictive accuracy [71].
Additionally, UAV remote sensing, known for its acceptable spatial and temporal resolution and operational flexibility, provides notable advantages in precision agriculture [72], especially for studies involving multiple crop varieties. Nevertheless, further research is needed to effectively scale UAV findings to satellite-based observations to meet the needs of large-scale agricultural monitoring.
The rise of deep learning technologies, particularly the use of Transformer architectures [73] and emerging methods like Graph Neural Networks (GNNs) [74], has dramatically advanced the ability to manage large-scale, high-dimensional datasets for regression or classification modeling purposes. These methods extract features from images and leverage the raw data as input for sophisticated deep learning algorithms, potentially uncovering additional latent information embedded within the images [16]. The application of deep learning models in agricultural yield prediction offers significant potential to address the limitations of traditional approaches by incorporating various data sources (e.g., satellite imagery, climate, and soil conditions), enabling a more holistic analysis and improving prediction accuracy [13].

5. Conclusions

In this study, we employed stacking ensemble learning methods to enhance the accuracy of oat yield predictions using UAV multispectral images captured at various growth stages. The results demonstrated that, compared to single models, multi-model stacking significantly improves the accuracy of oat yield estimation. Moreover, combining data from multiple growth stages achieved more stable and accurate prediction accuracy than individual stages alone. This methodology held great promise as a valuable tool for assessing oat yield potential, offering critical scientific insights and decision support that can accelerate the development of high-yield and quality oat varieties.

Author Contributions

P.Z.: Methodology, Formal analysis, Writing—Original Draft, and Writing—Reviewing and Editing; B.L.: Supervision, Methodology, Conceptualization, and Writing—Reviewing and Editing; Z.H. and X.W.: Data Collection; S.J.: Data curation and Formal analysis; J.G., J.S., H.Z., and Y.Y.: Writing—Reviewing and Editing; Z.Z.: Supervision, Conceptualization, and Writing—Reviewing and Editing. All authors have read and agreed to the published version of the manuscript.

Funding

This study was financially supported by the Science and Technology Key Program of Inner Mongolia (2021ZD0002) and the earmarked fund for the China Agriculture Research System (CARS-07-B-5 and CARS-07-A-6).

Data Availability Statement

The raw data supporting the conclusions of this article will be made available by the authors on request.

Conflicts of Interest

The authors declare no conflicts of interest.

References

  1. Butt, M.S.; Tahir-Nadeem, M.; Khan, M.K.I.; Shabir, R.; Butt, M.S. Oat: Unique among the cereals. Eur. J. Nutr. 2008, 47, 68–79. [Google Scholar] [CrossRef] [PubMed]
  2. Rispail, N.; Montilla-Bascón, G.; Sánchez-Martín, J.; Flores, F.; Howarth, C.; Langdon, T.; Rubiales, D.; Prats, E. Multi-Environmental Trials Reveal Genetic Plasticity of Oat Agronomic Traits Associated With Climate Variable Changes. Front. Plant Sci. 2018, 9, 1358. [Google Scholar] [CrossRef]
  3. Wang, Z.; Zhang, C.; Gao, L.; Fan, C.; Xu, X.; Zhang, F.; Zhou, Y.; Niu, F.; Li, Z. Time Phase Selection and Accuracy Analysis for Predicting Winter Wheat Yield Based on Time Series Vegetation Index. Remote Sens. 2024, 16, 1995. [Google Scholar] [CrossRef]
  4. Chen, P.; Li, Y.; Liu, X.; Tian, Y.; Zhu, Y.; Cao, W.; Cao, Q. Improving yield prediction based on spatio-temporal deep learning approaches for winter wheat: A case study in Jiangsu Province, China. Comput. Electron. Agric. 2023, 213, 108201. [Google Scholar] [CrossRef]
  5. Laurila, H.; Karjalainen, M.; Kleemola, J.; Hyyppä, J. Cereal Yield Modeling in Finland Using Optical and Radar Remote Sensing. Remote Sens. 2010, 2, 2185–2239. [Google Scholar] [CrossRef]
  6. Sharma, P.; Leigh, L.; Chang, J.; Maimaitijiang, M.; Caffé, M. Above-Ground Biomass Estimation in Oats Using UAV Remote Sensing and Machine Learning. Sensors 2022, 22, 601. [Google Scholar] [CrossRef]
  7. Xie, C.; Yang, C. A review on plant high-throughput phenotyping traits using UAV-based sensors. Comput. Electron. Agric. 2020, 178, 105731. [Google Scholar] [CrossRef]
  8. Zhang, C.; Marzougui, A.; Sankaran, S. High-resolution satellite imagery applications in crop phenotyping: An overview. Comput. Electron. Agric. 2020, 175, 105584. [Google Scholar] [CrossRef]
  9. Fei, S.; Hassan, M.A.; Xiao, Y.; Su, X.; Chen, Z.; Cheng, Q.; Duan, F.; Chen, R.; Ma, Y. UAV-based multi-sensor data fusion and machine learning algorithm for yield prediction in wheat. Precis. Agric. 2023, 24, 187–212. [Google Scholar] [CrossRef]
  10. Yang, G.; Liu, J.; Zhao, C.; Li, Z.; Huang, Y.; Yu, H.; Xu, B.; Yang, X.; Zhu, D.; Zhang, X. Unmanned aerial vehicle remote sensing for field-based crop phenotyping: Current status and perspectives. Front. Plant Sci. 2017, 8, 1111. [Google Scholar] [CrossRef]
  11. Camps-Valls, G.; Campos-Taberner, M.; Moreno-Martínez, Á.; Walther, S.; Duveiller, G.; Cescatti, A.; Mahecha, M.D.; Muñoz-Marí, J.; García-Haro, F.J.; Guanter, L.; et al. A unified vegetation index for quantifying the terrestrial biosphere. Sci. Adv. 2021, 7, eabc7447. [Google Scholar] [CrossRef] [PubMed]
  12. Wang, Q.; Moreno-Martínez, Á.; Muñoz-Marí, J.; Campos-Taberner, M.; Camps-Valls, G. Estimation of vegetation traits with kernel NDVI. ISPRS J. Photogramm. Remote Sens. 2023, 195, 408–417. [Google Scholar] [CrossRef]
  13. van Klompenburg, T.; Kassahun, A.; Catal, C. Crop yield prediction using machine learning: A systematic literature review. Comput. Electron. Agric. 2020, 177, 105709. [Google Scholar] [CrossRef]
  14. Li, Z.; Zhou, X.; Cheng, Q.; Fei, S.; Chen, Z. A Machine-Learning Model Based on the Fusion of Spectral and Textural Features from UAV Multi-Sensors to Analyse the Total Nitrogen Content in Winter Wheat. Remote Sens. 2023, 15, 2152. [Google Scholar] [CrossRef]
  15. Maimaitijiang, M.; Sagan, V.; Sidike, P.; Daloye, A.M.; Erkbol, H.; Fritschi, F.B. Crop Monitoring Using Satellite/UAV Data Fusion and Machine Learning. Remote Sens. 2020, 12, 1357. [Google Scholar] [CrossRef]
  16. Nevavuori, P.; Narra, N.; Lipping, T. Crop yield prediction with deep convolutional neural networks. Comput. Electron. Agric. 2019, 163, 104859. [Google Scholar] [CrossRef]
  17. Canicattì, M.; Vallone, M. Drones in vegetable crops: A systematic literature review. Smart Agric. Technol. 2024, 7, 100396. [Google Scholar] [CrossRef]
  18. Chlingaryan, A.; Sukkarieh, S.; Whelan, B. Machine learning approaches for crop yield prediction and nitrogen status estimation in precision agriculture: A review. Comput. Electron. Agric. 2018, 151, 61–69. [Google Scholar] [CrossRef]
  19. Marques Ramos, A.P.; Prado Osco, L.; Elis Garcia Furuya, D.; Nunes Gonçalves, W.; Cordeiro Santana, D.; Pereira Ribeiro Teodoro, L.; Antonio da Silva Junior, C.; Fernando Capristo-Silva, G.; Li, J.; Henrique Rojo Baio, F.; et al. A random forest ranking approach to predict yield in maize with uav-based vegetation spectral indices. Comput. Electron. Agric. 2020, 178, 105791. [Google Scholar] [CrossRef]
  20. Ren, P.; Li, H.; Han, S.; Chen, R.; Yang, G.; Yang, H.; Feng, H.; Zhao, C. Estimation of Soybean Yield by Combining Maturity Group Information and Unmanned Aerial Vehicle Multi-Sensor Data Using Machine Learning. Remote Sens. 2023, 15, 4286. [Google Scholar] [CrossRef]
  21. Bian, C.; Shi, H.; Wu, S.; Zhang, K.; Wei, M.; Zhao, Y.; Sun, Y.; Zhuang, H.; Zhang, X.; Chen, S. Prediction of Field-Scale Wheat Yield Using Machine Learning Method and Multi-Spectral UAV Data. Remote Sens. 2022, 14, 1474. [Google Scholar] [CrossRef]
  22. Ji, Y.; Chen, Z.; Cheng, Q.; Liu, R.; Li, M.; Yan, X.; Li, G.; Wang, D.; Fu, L.; Ma, Y.; et al. Estimation of plant height and yield based on UAV imagery in faba bean (Vicia faba L.). Plant Methods 2022, 18, 26. [Google Scholar] [CrossRef] [PubMed]
  23. Yang, Q.; Shi, L.; Han, J.; Zha, Y.; Zhu, P. Deep convolutional neural networks for rice grain yield estimation at the ripening stage using UAV-based remotely sensed images. Field Crops Res. 2019, 235, 142–153. [Google Scholar] [CrossRef]
  24. Zhang, Y.; Liu, J.; Shen, W. A Review of Ensemble Learning Algorithms Used in Remote Sensing Applications. Appl. Sci. 2022, 12, 8654. [Google Scholar] [CrossRef]
  25. Fei, S.; Hassan, M.A.; He, Z.; Chen, Z.; Shu, M.; Wang, J.; Li, C.; Xiao, Y. Assessment of Ensemble Learning to Predict Wheat Grain Yield Based on UAV-Multispectral Reflectance. Remote Sens. 2021, 13, 2338. [Google Scholar] [CrossRef]
  26. Sarkar, T.K.; Roy, D.K.; Kang, Y.S.; Jun, S.R.; Park, J.W.; Ryu, C.S. Ensemble of Machine Learning Algorithms for Rice Grain Yield Prediction Using UAV-Based Remote Sensing. J. Biosyst. Eng. 2024, 49, 1–19. [Google Scholar] [CrossRef]
  27. Liu, Z.; Ji, Y.; Ya, X.; Liu, R.; Liu, Z.; Zong, X.; Yang, T. Ensemble Learning for Pea Yield Estimation Using Unmanned Aerial Vehicles, Red Green Blue, and Multispectral Imagery. Drones 2024, 8, 227. [Google Scholar] [CrossRef]
  28. Feng, L.; Zhang, Z.; Ma, Y.; Du, Q.; Williams, P.; Drewry, J.; Luck, B. Alfalfa Yield Prediction Using UAV-Based Hyperspectral Imagery and Ensemble Learning. Remote Sens. 2020, 12, 2028. [Google Scholar] [CrossRef]
  29. Peng, J.; Wang, D.; Zhu, W.; Yang, T.; Liu, Z.; Eyshi Rezaei, E.; Li, J.; Sun, Z.; Xin, X. Combination of UAV and deep learning to estimate wheat yield at ripening stage: The potential of phenotypic features. Int. J. Appl. Earth Obs. Geoinf. 2023, 124, 103494. [Google Scholar] [CrossRef]
  30. Nevavuori, P.; Narra, N.; Linna, P.; Lipping, T. Crop Yield Prediction Using Multitemporal UAV Data and Spatio-Temporal Deep Learning Models. Remote Sens. 2020, 12, 4000. [Google Scholar] [CrossRef]
  31. El-Hendawy, S.; Mohammed, N.; Al-Suhaibani, N. Enhancing Wheat Growth, Physiology, Yield, and Water Use Efficiency under Deficit Irrigation by Integrating Foliar Application of Salicylic Acid and Nutrients at Critical Growth Stages. Plants 2024, 13, 1490. [Google Scholar] [CrossRef] [PubMed]
  32. Hassan, M.A.; Fei, S.; Li, L.; Jin, Y.; Liu, P.; Rasheed, A.; Shawai, R.S.; Zhang, L.; Ma, A.; Xiao, Y.; et al. Stacking of Canopy Spectral Reflectance from Multiple Growth Stages Improves Grain Yield Prediction under Full and Limited Irrigation in Wheat. Remote Sens. 2022, 14, 4318. [Google Scholar] [CrossRef]
  33. Pearson, R.L.; Miller, L.D. Remote mapping of standing crop biomass for estimation of the productivity of the shortgrass prairie. In Proceedings of the Eighth International Symposium on Remote Sensing of Environment, Ann Arbor, MI, USA, 2–6 October 1972; p. 1355. [Google Scholar]
  34. Rouse, J.W.; Haas, R.H.; Schell, J.A.; Deering, D.W. Monitoring Vegetation Systems in the Great Plains with ERTS. NASA Spec. Publ. 1974, 351, 309. [Google Scholar]
  35. Li, F.; Miao, Y.; Feng, G.; Yuan, F.; Yue, S.; Gao, X.; Liu, Y.; Liu, B.; Ustin, S.L.; Chen, X. Improving estimation of summer maize nitrogen status with red edge-based spectral vegetation indices. Field Crops Res. 2014, 157, 111–123. [Google Scholar] [CrossRef]
  36. Gitelson, A.A.; Merzlyak, M.N. Remote sensing of chlorophyll concentration in higher plant leaves. Adv. Space Res. 1998, 22, 689–692. [Google Scholar] [CrossRef]
  37. Datt, B. Remote sensing of chlorophyll a, chlorophyll b, chlorophyll a+ b, and total carotenoid content in eucalyptus leaves. Remote Sens. Environ. 1998, 66, 111–121. [Google Scholar] [CrossRef]
  38. Peñuelas, J.; Gamon, J.; Fredeen, A.; Merino, J.; Field, C. Reflectance indices associated with physiological changes in nitrogen-and water-limited sunflower leaves. Remote Sens. Environ. 1994, 48, 135–146. [Google Scholar] [CrossRef]
  39. Wu, C.; Niu, Z.; Tang, Q.; Huang, W.; Rivard, B.; Feng, J. Remote estimation of gross primary production in wheat using chlorophyll-related vegetation indices. Agric. For. Meteorol. 2009, 149, 1015–1021. [Google Scholar] [CrossRef]
  40. Rondeaux, G.; Steven, M.; Baret, F. Optimization of soil-adjusted vegetation indices. Remote Sens. Environ. 1996, 55, 95–107. [Google Scholar] [CrossRef]
  41. Penuelas, J.; Baret, F.; Filella, I. Semi-empirical indices to assess carotenoids/chlorophyll a ratio from leaf spectral reflectance. Photosynthetica 1995, 31, 221–230. [Google Scholar] [CrossRef]
  42. Merzlyak, M.N.; Gitelson, A.A.; Chivkunova, O.B.; Rakitin, V.Y. Non-destructive optical detection of pigment changes during leaf senescence and fruit ripening. Physiol. Plant. 1999, 106, 135–141. [Google Scholar] [CrossRef]
  43. Huete, A.; Didan, K.; Miura, T.; Rodriguez, E.P.; Gao, X.; Ferreira, L.G. Overview of the radiometric and biophysical performance of the MODIS vegetation indices. Remote Sens. Environ. 2002, 83, 195–213. [Google Scholar] [CrossRef]
  44. Haboudane, D.; Miller, J.R.; Pattey, E.; Zarco-Tejada, P.J.; Strachan, I.B. Hyperspectral vegetation indices and novel algorithms for predicting green LAI of crop canopies: Modeling and validation in the context of precision agriculture. Remote Sens. Environ. 2004, 90, 337–352. [Google Scholar] [CrossRef]
  45. Devadas, R.; Lamb, D.; Simpfendorfer, S.; Backhouse, D. Evaluating ten spectral vegetation indices for identifying rust infection in individual wheat leaves. Precis. Agric. 2009, 10, 459–470. [Google Scholar] [CrossRef]
  46. Wang, T.; Gao, M.; Cao, C.; You, J.; Zhang, X.; Shen, L. Winter wheat chlorophyll content retrieval based on machine learning using in situ hyperspectral data. Comput. Electron. Agric. 2022, 193, 106728. [Google Scholar] [CrossRef]
  47. Li, D.; Miao, Y.; Gupta, S.K.; Rosen, C.J.; Yuan, F.; Wang, C.; Wang, L.; Huang, Y. Improving Potato Yield Prediction by Combining Cultivar Information and UAV Remote Sensing Data Using Machine Learning. Remote Sens. 2021, 13, 3322. [Google Scholar] [CrossRef]
  48. Zhao, D.; Zhen, J.; Zhang, Y.; Miao, J.; Shen, Z.; Jiang, X.; Wang, J.; Jiang, J.; Tang, Y.; Wu, G. Mapping mangrove leaf area index (LAI) by combining remote sensing images with PROSAIL-D and XGBoost methods. Remote Sens. Ecol. Conserv. 2023, 9, 370–389. [Google Scholar] [CrossRef]
  49. Yang, S.; Li, L.; Fei, S.; Yang, M.; Tao, Z.; Meng, Y.; Xiao, Y. Wheat Yield Prediction Using Machine Learning Method Based on UAV Remote Sensing Data. Drones 2024, 8, 284. [Google Scholar] [CrossRef]
  50. Sadeghi-Tehran, P.; Virlet, N.; Ampe, E.M.; Reyns, P.; Hawkesford, M.J. DeepCount: In-Field Automatic Quantification of Wheat Spikes Using Simple Linear Iterative Clustering and Deep Convolutional Neural Networks. Front. Plant Sci. 2019, 10, 1176. [Google Scholar] [CrossRef]
  51. Peltonen-Sainio, P.; Rajala, A. Duration of vegetative and generative development phases in oat cultivars released since 1921. Field Crops Res. 2007, 101, 72–79. [Google Scholar] [CrossRef]
  52. Guan, K.; Wu, J.; Kimball, J.S.; Anderson, M.C.; Frolking, S.; Li, B.; Hain, C.R.; Lobell, D.B. The shared and unique values of optical, fluorescence, thermal and microwave satellite data for estimating large-scale crop yields. Remote Sens. Environ. 2017, 199, 333–349. [Google Scholar] [CrossRef]
  53. Deng, Q.; Wu, M.; Zhang, H.; Cui, Y.; Li, M.; Zhang, Y. Winter Wheat Yield Estimation Based on Optimal Weighted Vegetation Index and BHT-ARIMA Model. Remote Sens. 2022, 14, 1994. [Google Scholar] [CrossRef]
  54. Zhou, X.; Zheng, H.B.; Xu, X.Q.; He, J.Y.; Ge, X.K.; Yao, X.; Cheng, T.; Zhu, Y.; Cao, W.X.; Tian, Y.C. Predicting grain yield in rice using multi-temporal vegetation indices from UAV-based multispectral and digital imagery. ISPRS J. Photogramm. Remote Sens. 2017, 130, 246–255. [Google Scholar] [CrossRef]
  55. Yue, J.; Yang, G.; Li, C.; Li, Z.; Wang, Y.; Feng, H.; Xu, B. Estimation of winter wheat above-ground biomass using unmanned aerial vehicle-based snapshot hyperspectral sensor and crop height improved models. Remote Sens. 2017, 9, 708. [Google Scholar] [CrossRef]
  56. Wang, F.; Yi, Q.; Hu, J.; Xie, L.; Yao, X.; Xu, T.; Zheng, J. Combining spectral and textural information in UAV hyperspectral images to estimate rice grain yield. Int. J. Appl. Earth Obs. Geoinf. 2021, 102, 102397. [Google Scholar] [CrossRef]
  57. Zhang, P.-P.; Zhou, X.-X.; Wang, Z.-X.; Mao, W.; Li, W.-X.; Yun, F.; Guo, W.-S.; Tan, C.-W. Using HJ-CCD image and PLS algorithm to estimate the yield of field-grown winter wheat. Sci. Rep. 2020, 10, 5173. [Google Scholar] [CrossRef]
  58. Hassan, M.A.; Yang, M.; Rasheed, A.; Yang, G.; Reynolds, M.; Xia, X.; Xiao, Y.; He, Z. A rapid monitoring of NDVI across the wheat growth cycle for grain yield prediction using a multi-spectral UAV platform. Plant Sci. 2019, 282, 95–103. [Google Scholar] [CrossRef]
  59. Zhang, S.; Qi, X.; Duan, J.; Yuan, X.; Zhang, H.; Feng, W.; Guo, T.; He, L. Comparison of Attention Mechanism-Based Deep Learning and Transfer Strategies for Wheat Yield Estimation Using Multisource Temporal Drone Imagery. IEEE Trans. Geosci. Remote Sens. 2024, 62, 4407723. [Google Scholar] [CrossRef]
  60. Wang, L.; Tian, Y.; Yao, X.; Zhu, Y.; Cao, W. Predicting grain yield and protein content in wheat by fusing multi-sensor and multi-temporal remote-sensing images. Field Crops Res. 2014, 164, 178–188. [Google Scholar] [CrossRef]
  61. Holloway, J.; Mengersen, K. Statistical Machine Learning Methods and Remote Sensing for Sustainable Development Goals: A Review. Remote Sens. 2018, 10, 1365. [Google Scholar] [CrossRef]
  62. Shafiee, S.; Lied, L.M.; Burud, I.; Dieseth, J.A.; Alsheikh, M.; Lillemo, M. Sequential forward selection and support vector regression in comparison to LASSO regression for spring wheat yield prediction based on UAV imagery. Comput. Electron. Agric. 2021, 183, 106036. [Google Scholar] [CrossRef]
  63. Shahhosseini, M.; Hu, G.; Archontoulis, S.V. Forecasting corn yield with machine learning ensembles. Front. Plant Sci. 2020, 11, 1120. [Google Scholar] [CrossRef] [PubMed]
  64. Yin, J.; Medellín-Azuara, J.; Escriva-Bou, A.; Liu, Z. Bayesian machine learning ensemble approach to quantify model uncertainty in predicting groundwater storage change. Sci. Total Environ. 2021, 769, 144715. [Google Scholar] [CrossRef] [PubMed]
  65. Useya, J.; Chen, S. Comparative Performance Evaluation of Pixel-Level and Decision-Level Data Fusion of Landsat 8 OLI, Landsat 7 ETM+ and Sentinel-2 MSI for Crop Ensemble Classification. IEEE J. Sel. Top. Appl. Earth Obs. Remote Sens. 2018, 11, 4441–4451. [Google Scholar] [CrossRef]
  66. Liu, Z.; Jin, S.; Liu, X.; Yang, Q.; Li, Q.; Zang, J.; Li, Z.; Hu, T.; Guo, Z.; Wu, J.; et al. Extraction of Wheat Spike Phenotypes From Field-Collected Lidar Data and Exploration of Their Relationships With Wheat Yield. IEEE Trans. Geosci. Remote Sens. 2023, 61, 1–13. [Google Scholar] [CrossRef]
  67. Jin, N.; Tao, B.; Ren, W.; He, L.; Zhang, D.; Wang, D.; Yu, Q. Assimilating remote sensing data into a crop model improves winter wheat yield estimation based on regional irrigation data. Agric. Water Manag. 2022, 266, 107583. [Google Scholar] [CrossRef]
  68. Ishaq, R.A.F.; Zhou, G.; Tian, C.; Tan, Y.; Jing, G.; Jiang, H.; Obaid-ur-Rehman. A Systematic Review of Radiative Transfer Models for Crop Yield Prediction and Crop Traits Retrieval. Remote Sens. 2024, 16, 121. [Google Scholar] [CrossRef]
  69. Sun, G.; Jiao, Z.; Zhang, A.; Li, F.; Fu, H.; Li, Z. Hyperspectral image-based vegetation index (HSVI): A new vegetation index for urban ecological research. Int. J. Appl. Earth Obs. Geoinf. 2021, 103, 102529. [Google Scholar] [CrossRef]
  70. Wang, N.; Suomalainen, J.; Bartholomeus, H.; Kooistra, L.; Masiliūnas, D.; Clevers, J.G.P.W. Diurnal variation of sun-induced chlorophyll fluorescence of agricultural crops observed from a point-based spectrometer on a UAV. Int. J. Appl. Earth Obs. Geoinf. 2021, 96, 102276. [Google Scholar] [CrossRef]
  71. Feng, Z.; Cheng, Z.; Ren, L.; Liu, B.; Zhang, C.; Zhao, D.; Sun, H.; Feng, H.; Long, H.; Xu, B.; et al. Real-time monitoring of maize phenology with the VI-RGS composite index using time-series UAV remote sensing images and meteorological data. Comput. Electron. Agric. 2024, 224, 109212. [Google Scholar] [CrossRef]
  72. Sishodia, R.P.; Ray, R.L.; Singh, S.K. Applications of Remote Sensing in Precision Agriculture: A Review. Remote Sens. 2020, 12, 3136. [Google Scholar] [CrossRef]
  73. Liu, Y.; Wang, S.; Chen, J.; Chen, B.; Wang, X.; Hao, D.; Sun, L. Rice Yield Prediction and Model Interpretation Based on Satellite and Climatic Indicators Using a Transformer Method. Remote Sens. 2022, 14, 5045. [Google Scholar] [CrossRef]
  74. Yang, F.; Zhang, D.; Zhang, Y.; Zhang, Y.; Han, Y.; Zhang, Q.; Zhang, Q.; Zhang, C.; Liu, Z.; Wang, K. Prediction of corn variety yield with attribute-missing data via graph neural network. Comput. Electron. Agric. 2023, 211, 108046. [Google Scholar] [CrossRef]
Figure 1. Study area and experimental layout with P4M UAV images taken on 25 July 2022 and 25 July 2023.
Remotesensing 16 04575 g001
Figure 2. Model setup and stacked regression framework for oat yield prediction.
Remotesensing 16 04575 g002
Figure 3. Distribution of UAV-captured spectral reflectance at different growth stages (a), and total oat yield distribution (b). Jointing (P1), heading (P2), early-grain filling (P3), and mid-grain filling (P4).
Remotesensing 16 04575 g003
Figure 4. Correlation between spectral variables and oat yield across different growth stages: jointing (P1), heading (P2), early-grain filling (P3), and mid-grain filling (P4).
Remotesensing 16 04575 g004
Figure 5. The statistical distribution of base and ensemble learning models’ prediction accuracy (R2) for oat yield prediction using UAV imagery from individual growth stages. (a) P1, jointing; (b) P2, heading; (c) P3, early-grain filling; and (d) P4, mid-grain filling. Statistical significance markers (* p < 0.05, ** p < 0.01, *** p < 0.001, and ns p ≥ 0.05) represent differences in prediction performance between the StackReg model and the base models.
Remotesensing 16 04575 g005
Figure 6. The statistical distribution of base and ensemble learning models’ prediction accuracy (RMSE) for oat yield prediction using UAV imagery from individual growth stages. (a) P1, jointing; (b) P2, heading; (c) P3, early-grain filling; and (d) P4, mid-grain filling.
Remotesensing 16 04575 g006
Figure 7. The statistical distribution of base and ensemble learning models’ prediction accuracy (R2) for oat yield prediction using dual-stage UAV imagery. Growth stages include jointing (P1), heading (P2), early-grain filling (P3), and mid-grain filling (P4). (ac) P1 paired with P2, P3, and P4; (df) P2 paired with P3 and P4 and P3 paired with P4. Statistical significance markers (** p < 0.01, *** p < 0.001, and ns p ≥ 0.05) represent differences in prediction performance between the StackReg model and the base models.
Remotesensing 16 04575 g007
Figure 8. The statistical distribution of base and ensemble learning models’ prediction accuracy (RMSE) for oat yield prediction using dual-stage UAV imagery. Growth stages include jointing (P1), heading (P2), early-grain filling (P3), and mid-grain filling (P4). (ac) P1 paired with P2, P3, and P4; (df) P2 paired with P3 and P4, and P3 paired with P4.
Remotesensing 16 04575 g008
Figure 9. The statistical distribution of base and ensemble learning models’ prediction accuracy (R2) for oat yield prediction using multi-stage UAV imagery. Growth stages include jointing (P1), heading (P2), early-grain filling (P3), and mid-grain filling (P4). (ac) Three-stage combinations (P123, P124, and P234); (d) four-stage combination (P1234). Statistical significance markers (* p < 0.05, ** p < 0.01, *** p < 0.001, and ns p ≥ 0.05) represent differences in prediction performance between the StackReg model and the base models.
Remotesensing 16 04575 g009
Figure 10. The statistical distribution of base and ensemble learning models’ prediction accuracy (RMSE) for oat yield prediction using multi-stages UAV imagery. Growth stages include jointing (P1), heading (P2), early-grain filling (P3), and mid-grain filling (P4). (ac) Three-stage combinations (P123, P124, P234); (d) Four-stage combination (P1234).
Remotesensing 16 04575 g010
Table 1. Main parameters of the multispectral sensor.
Spectral BandsCentral Wavelength (nm)
Blue450 ± 16
Green560 ± 16
Red650 ± 16
Red edge730 ± 16
Near-infrared840 ± 26
Table 2. Main parameters of the multispectral sensor.
FeatureFormulationReferences
Ratio Vegetation Index (RVI)NIR/R[33]
Normalized Difference Vegetation Index (NDVI)(NIR − R)/(NIR + R)[34]
Normalized difference red edge (NDRE)(NIR − RE)/(NIR − RE)[35]
Green Normalized Difference Vegetation (GNDVI)(NIR − G)/(NIR + G)[36]
Datt’s chlorophyll content (DATT)R/(G × RE)[37]
Normalized pigment chlorophyll ratio index (NPCI)(R − B)/(R + B)[38]
MERIS Terrestrial Chlorophyll Index (MTCI)(NIR − RE)/(NIR − R)[39]
Optimized Soil-Adjusted Vegetation Index (OSAVI) 1.16 ( N I R R ) N I R + R + 0.16 [40]
Structure Insensitive Pigment Index (SIPI)(NIR − B)/(NIR − R)[41]
Plant Senescence Reflectance Index (PSRI)(R − B)/NIR[42]
Enhanced Vegetation Index (EVI) 2.5 ( N I R R ) N I R + 6 R 7.5 B + 1 [43]
Modified Simple Ratio (MSR) N I R / R 1 N I R / R + 1 [44]
Transformed Chlorophyll Absorption Reflectance Index (TCARI)3 × ((RE − R) − 0.2 × (RE − G) × (RE/R))[45]
Modified Transformed Vegetation Index (MTVI2) 1.5 1.2 N I R G 2.5 R G 2 N I R + 1 2 6 N I R 5 R 0.5 [44]
Kernel Normalized Difference Vegetation Index (kNDVI) t a n h [ ( N I R R ) / 2 × σ ] 2 [12]
Table 3. Hyperparameters of four base models.
ModelsHyperparameters
RRAlpha: Regularization strength was logarithmically spaced across ten values between 0.01 and 100, allowing for fine-tuning of the model’s regularization effect.
SVRC: The regularization parameter was explored across five logarithmic steps between 0.1 and 10 (i.e., 0.1, 0.32, 1, 3.16, and 10), balancing margin flexibility and generalization. Epsilon: The epsilon parameter, determining the margin of tolerance, was tested with values 0.01, 0.1, and 0.2. Kernel: Both the linear and radial basis function (RBF) kernels were tested to model different relationships between input features and yield.
CubistCommittees: The number of committees was varied from 5 to 30, in increments of 5, to control the ensemble size and complexity. Neighbors: The number of neighbors used for local adjustments was tested from 1 to 9, in unit increments, to balance local and global predictions.
XGBoostNumber of Estimators: The number of boosting rounds was varied from 100 to 600, in steps of 100, to balance the model complexity and overfitting risk. Max Depth: The maximum tree depth was evaluated at three levels—1, 3, and 5—affecting the model’s complexity. Learning Rate: The learning rate was tested with values 0.01, 0.1, and 0.2, controlling the contribution of each tree. Subsample: The subsample ratio was varied from 0.7 to 0.9, in increments of 0.1, to introduce randomness and reduce overfitting risk.
Table 4. Descriptive statistics of oat yield.
Sampling Year20222023Total
Measured number141197338
Mean (kg/ha)3154.303168.693162.69
Maximum (kg/ha)4517.204639.924639.92
Minimum (kg/ha)510.581804.53510.58
Standard deviation (kg/ha)719.82583.78643.05
Coefficient of variation (%)22.8218.4220.33
Disclaimer/Publisher’s Note: The statements, opinions and data contained in all publications are solely those of the individual author(s) and contributor(s) and not of MDPI and/or the editor(s). MDPI and/or the editor(s) disclaim responsibility for any injury to people or property resulting from any ideas, methods, instructions or products referred to in the content.

