Article

Vegetation Trends Due to Land Cover Changes on the Tibetan Plateau for 2015–2100 Largely Explained by Forest

1
Land-Atmosphere Interaction and Its Climatic Effects Group, State Key Laboratory of Tibetan Plateau Earth System, Environment and Resources (TPESER), Institute of Tibetan Plateau Research, Chinese Academy of Sciences, Beijing 100101, China
2
College of Hydraulic & Environmental Engineering, China Three Gorges University, Yichang 443002, China
3
College of Earth and Planetary Sciences, University of Chinese Academy of Sciences, Beijing 100049, China
4
College of Atmospheric Science, Lanzhou University, Lanzhou 730000, China
5
National Observation and Research Station for Qomolongma Special Atmospheric Processes and Environmental Changes, Shigatse 858200, China
6
Kathmandu Center of Research and Education, Chinese Academy of Sciences, Beijing 100101, China
7
China-Pakistan Joint Research Center on Earth Sciences, Chinese Academy of Sciences, Islamabad 45320, Pakistan
*
Author to whom correspondence should be addressed.
Remote Sens. 2024, 16(23), 4558; https://doi.org/10.3390/rs16234558
Submission received: 16 October 2024 / Revised: 22 November 2024 / Accepted: 2 December 2024 / Published: 5 December 2024

Abstract

:
Vegetation changes on the Tibetan Plateau are indicative of the dual impacts of climate change and human activities, with satellite data offering a potent tool for monitoring these alterations. However, the impacts of future land cover change on vegetation changes on the Tibetan Plateau under different climate scenarios remain unclear. This study systematically investigates vegetation trends and their contributions driven by land cover changes under eight future climate scenarios from 2015 to 2100 using remotely sensed land cover and NDVI data. We estimated consistent NDVI data for land cover changes under the climate scenarios and quantified the vegetation trends and the relative contributions of each land cover type using a relative importance matrix. The study found that (1) Grasslands will remain the dominant land cover, increasing by 4.13% from 2015 to 2100, while Forests, particularly Woody Savannas and Mixed Forests, will significantly influence vegetation trends, with maximum contributions of 48–55% across seasons. (2) Vegetation trends under climate scenarios exhibit greening, browning followed by greening, fluctuation, and browning patterns, with greening being predominant. (3) Forests dominate vegetation trends in most scenarios, especially under pathways of sustainability (SSP1) and fossil-fueled development (SSP5). (4) The seasonal patterns of vegetation changes due to land cover changes are generally similar to the annual one; variations in land cover changes under different scenarios lead to differences in vegetation seasonal patterns. Our research promotes the understanding of the interaction between future land cover changes and vegetation changes on the Tibetan Plateau.

Graphical Abstract

1. Introduction

The Tibetan Plateau occupies an important position in the global terrestrial ecosystem, which is quite fragile and significantly affected by climate change and human activities [1,2]. Vegetation is an important part of the terrestrial ecosystem of the Tibetan Plateau and exerts a significant influence on the regional surface energy cycle, carbon emissions, and near-surface climate [3,4,5,6]. Therefore, the vegetation dynamics serve as a key indicator for ecosystem changes and climate change on the Tibetan Plateau. The monitoring of the changes takes on great significance in understanding the evolution of vegetation system at high altitudes. With the continuous advancement of satellite observation technology, large-scale and high-frequency monitoring of vegetation dynamics on the Tibetan Plateau has been widely used [1]. Satellite data suggest that the vegetation change appears as an overall greening in the Tibetan Plateau, although these trends vary in diverse regions [1]. The vegetation on Tibetan Plateau shows a fluctuating growth trend before 2000 [7], whereas this trend is remarkably enhanced after 2000, with about 70% of the regions experiencing a pronounced greening [8,9].
Vegetation changes on the Tibetan Plateau are driven by both climate change and non-climatic factors. The primary climatic factors influencing vegetation include temperature and precipitation [10,11]. Temperature is considered a pivotal climatic variable associated with vegetation growth compared to precipitation. Rising temperatures have promoted greening in the central and southeastern regions of the Tibetan Plateau, while inhibiting greening in the southwestern and northeastern areas [12]. The rates of temperature increase also affect vegetation growth differently across latitudes. Specifically, the rate of temperature rise in the high-latitude regions of the Tibetan Plateau exceeds that in low-latitude areas, resulting in a stronger greening trend in the former [13]. Enhanced spatial variability in precipitation may lead to spatiotemporal discrepancy in vegetation responses [11]. Moreover, decreased precipitation could hinder the positive effects of rising temperatures on vegetation greening [13]. For alpine meadows, however, precipitation had a larger impact on vegetation than temperature [14].
Nevertheless, recent studies increasingly reveal a stronger link between vegetation changes and non-climatic factors on the Tibetan Plateau. These non-climatic factors primarily include land cover change, urbanization, and grazing [9,15,16]. Research has shown that human activities, such as urbanization, grazing, and environmental protection projects, contribute to approximately 66% of the vegetation changes on the Tibetan Plateau, which is about twice that of climatic factors [9]. Similar studies support this finding. Grasslands, the largest type of vegetation on the Tibetan Plateau, are similarly influenced by non-climatic factors, primarily land cover changes, which contribute to about 66% of the changes to Grassland dynamics [10]. For the Grasslands without land cover change, climatic factors made up about 77% of the contribution, indicating that land cover change plays a substantial role in vegetation dynamics on the Tibetan Plateau. According to the assessments of land cover change, the Tibetan Plateau experienced significant transformations between 1950 and 2000, including permafrost and Grassland degradation, urban expansion, deforestation, and desertification [17]. Since 2000, protected areas on the Tibetan Plateau have converted a considerable amount of farmland into Forest or Grassland, while urban expansion has encroached on a great deal of nearby cropland. In the southeastern Tibetan Plateau, 72% of alpine meadows have been converted into Shrubland and Forest [18]. Future land cover change predictions indicate that subalpine Moist Forests will see the greatest area increase under low-, medium-, and high-emission scenarios [19]. Grassland, Shrubland, and Needleleaf Forest areas are also expected to expand and shift toward higher elevations [20]. By the mid-to-late 2050s, the growing season for vegetation is projected to expand, and Evergreen Forests in the southern and eastern Tibetan Plateau are expected to replace alpine tundra [21]. Additionally, predictions from the CMIP5 and CMIP6 models suggest that the vegetation greening will continue on the Tibetan Plateau [22]. These studies underscore the profound impact that land cover change is expected to have on future vegetation dynamics on the Tibetan Plateau.
Numerous studies have identified land cover change as a key driver of vegetation change on the Tibetan Plateau. Yet, the specific effects of future land cover change on vegetation dynamics remain unclear. Future land cover changes may be controlled by various coupled scenarios of shared socioeconomic pathways (SSPs) and representative concentration pathways (RCPs). Therefore, a systematic investigation of the vegetation changes and its contribution due to land cover change under different climate scenarios is necessary, especially for understanding the future evolution of the vegetation ecosystem on the Tibetan Plateau. Facing this challenge, this study employed a linear model-based relative importance matrix analysis method to systematically evaluate land cover change-driven vegetation trends and their contributions under eight climate scenarios from 2015 to 2100. We analyzed MODIS land cover data, NDVI data, and future land cover products for each scenario. This study aims to answer the following two key scientific questions: (1) What are the vegetation trends due to land cover changes in the Tibetan Plateau under future scenarios? (2) Which type of land cover dominates the impact of future land cover changes on vegetation trends under future scenarios? This research deepens the understanding of how land cover change will affect the future vegetation ecosystem on the Tibetan Plateau.

2. Materials and Methods
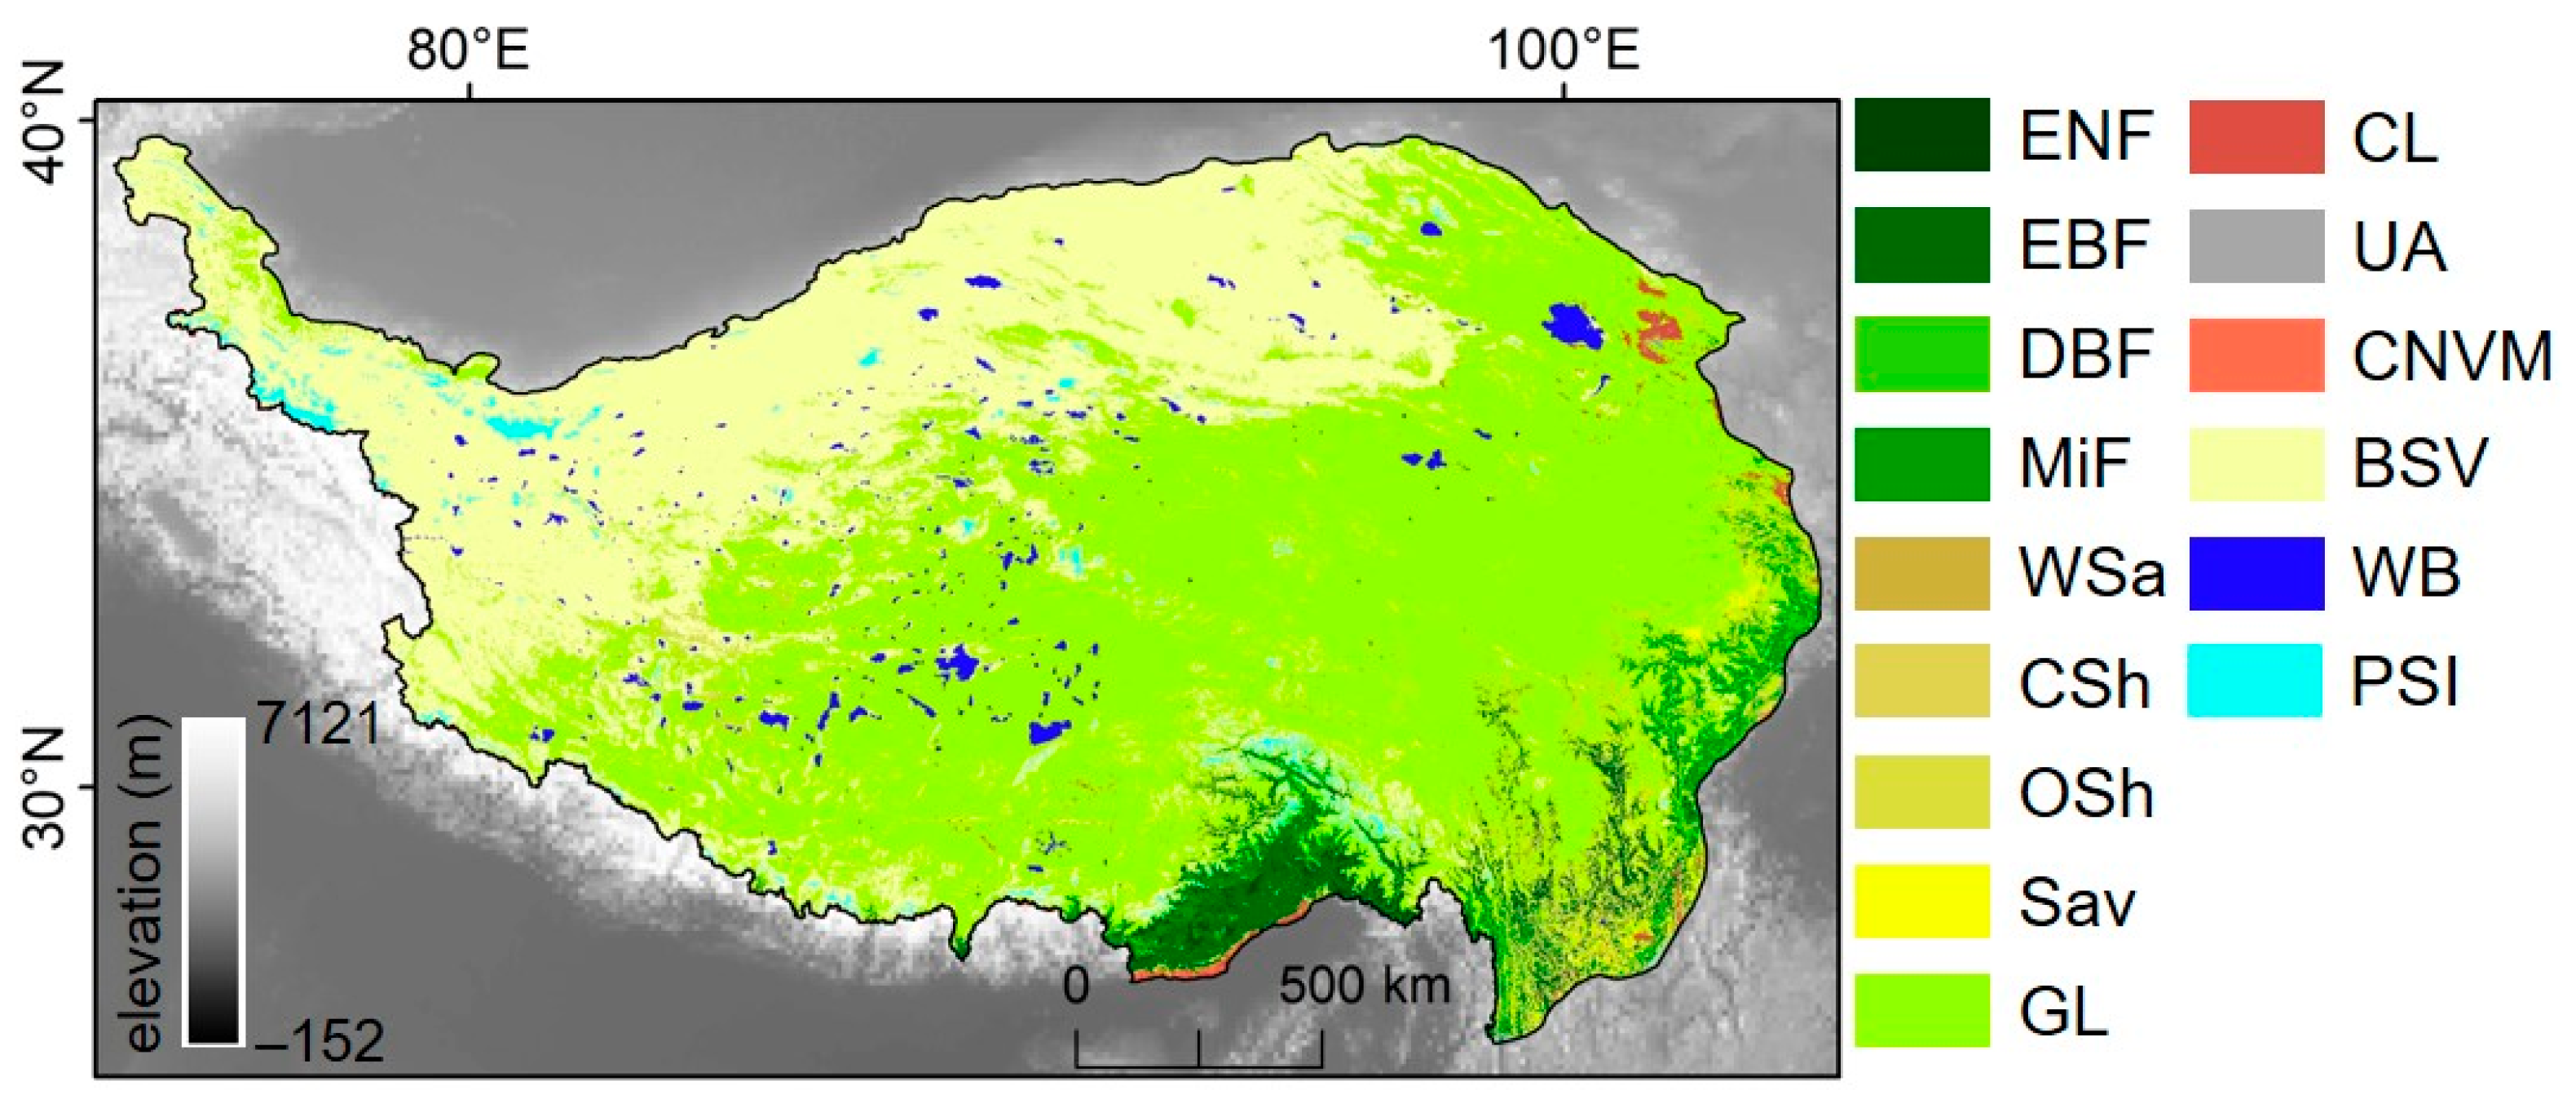
2.1. Study Area

The Tibetan Plateau has an average elevation exceeding 4000 m and exhibits a cold and arid climate in the northwest, gradually transitioning to a warm and humid climate in the southeast (Figure 1). Over the past five decades, temperatures have risen significantly at a rate of approximately 0.2 °C per decade [23]. Precipitation shows substantial spatial variation, ranging from up to 2000 mm annually in the southeast to less than 100 mm in the northwest [24]. It is a prime area for examining land cover–vegetation dynamics at high altitudes. Dominated by Grasslands (51.95%) and Barren Land (33.92%), with Forests, Glaciers, Water Bodies, and Shrublands covering smaller areas [25], the Tibetan Plateau has seen rapid land cover changes due to climate and human activities [17,24]. Vegetation greening (40.29%) exceeded browning (3.57%) between 2000 and 2021 [26]. As climate change and human impacts intensify, the study of land cover’s effects on Tibetan Plateau vegetation is crucial for assessing regional climate impacts.

2.2. Data Sources and Processing

This study employed MODIS land cover products, land cover data under eight future climate scenarios, and MODIS vegetation index products to investigate the vegetation dynamics due to land cover changes on the Tibetan Plateau from 2015 to 2100 and their contributions. To ensure the consistency of data analysis scales, the spatial resolution of all datasets was aggregated to 1 km, and detailed information is provided in Table 1.
The MODIS land cover product in 2015 was used to extract the vegetation indices under different land cover types across the Tibetan Plateau, sourced from MCD12Q1 Version 6.1 data, with a spatial resolution of 500 m. This product classifies the global land cover into 17 types according to the International Geosphere-Biosphere Programme (IGBP), namely, Evergreen Needleleaf Forest, Evergreen Broadleaf Forest, Deciduous Needleleaf Forest, Deciduous Broadleaf Forest, Mixed Forest, Closed Shrubland, Open Shrubland, Woody Savanna, Savanna, Grassland, Permanent Wetland, Cropland, Urban and Built-up Land, Cropland/Natural Vegetation Mosaic, Permanent Snow and Ice, Barren, and Water Bodies. These land cover types can be grouped into broad categories, as detailed in Table 2. In this study, the majority rule was applied to aggregate the land cover product to a 1 km resolution, and Permanent Snow and Ice, as well as Water Bodies, which contain no terrestrial vegetation, were excluded.
The land cover products under eight future climate scenarios were employed to calculate the future NDVI and analyze their contributions in relation to diverse types of land cover changes, sourced from the global future land use/land cover dataset [27]. The eight SSP-RCP scenarios take into account a range of future radiative forcing levels and socioeconomic conditions [28,29,30]. These scenarios have been endorsed by the Coupled Model Intercomparison Project Phase 6 (CMIP6) and are highly suitable for researchers across diverse scientific disciplines to conduct climate change-related studies [31]. This land cover product is based on MODIS land cover products and the Land Use Harmonization (LUH2) dataset, and it employs the Future Land Use Simulation (FLUS) model to generate land cover data for eight SSP-RCP scenarios (see Table 3). This product covers the period of 2015~2100, with a 5-year interval and a spatial resolution of approximately 1 km, and the same IGBP-based land cover classification scheme was adopted [27].
MODIS vegetation index products were used to characterize the vegetation status of the Tibetan Plateau in the past and to simulate the vegetation status under various land cover types in future scenarios. These data come from the MOD13A2 Version 6.1, covering the period from 2003 to 2015, with a temporal resolution of 16 days and a spatial resolution of 1 km. This study employed the classic NDVI to represent the vegetation status of the Tibetan Plateau.

2.3. Methods

This study adopted a three-step approach to investigate the vegetation trends and their contributions driven by future land cover change on the Tibetan Plateau. First, we synthesized the annual and seasonal average NDVI from 2003 to 2015 based on the MODIS vegetation data to represent the historical average vegetation conditions of the region. Second, using 2015 MODIS land cover data and future land cover projections, we estimated the spatiotemporal dynamics of the NDVI under different future climate scenarios, applying the assumption that vegetation states are similar for the same land cover type. Finally, we constructed a multivariate linear model between future land cover types and the NDVI, and used the relative importance matrix method to quantify the contribution of each land cover type to the future NDVI of the Tibetan Plateau under various future climate scenarios. The overall technical workflow is illustrated in Figure 2.

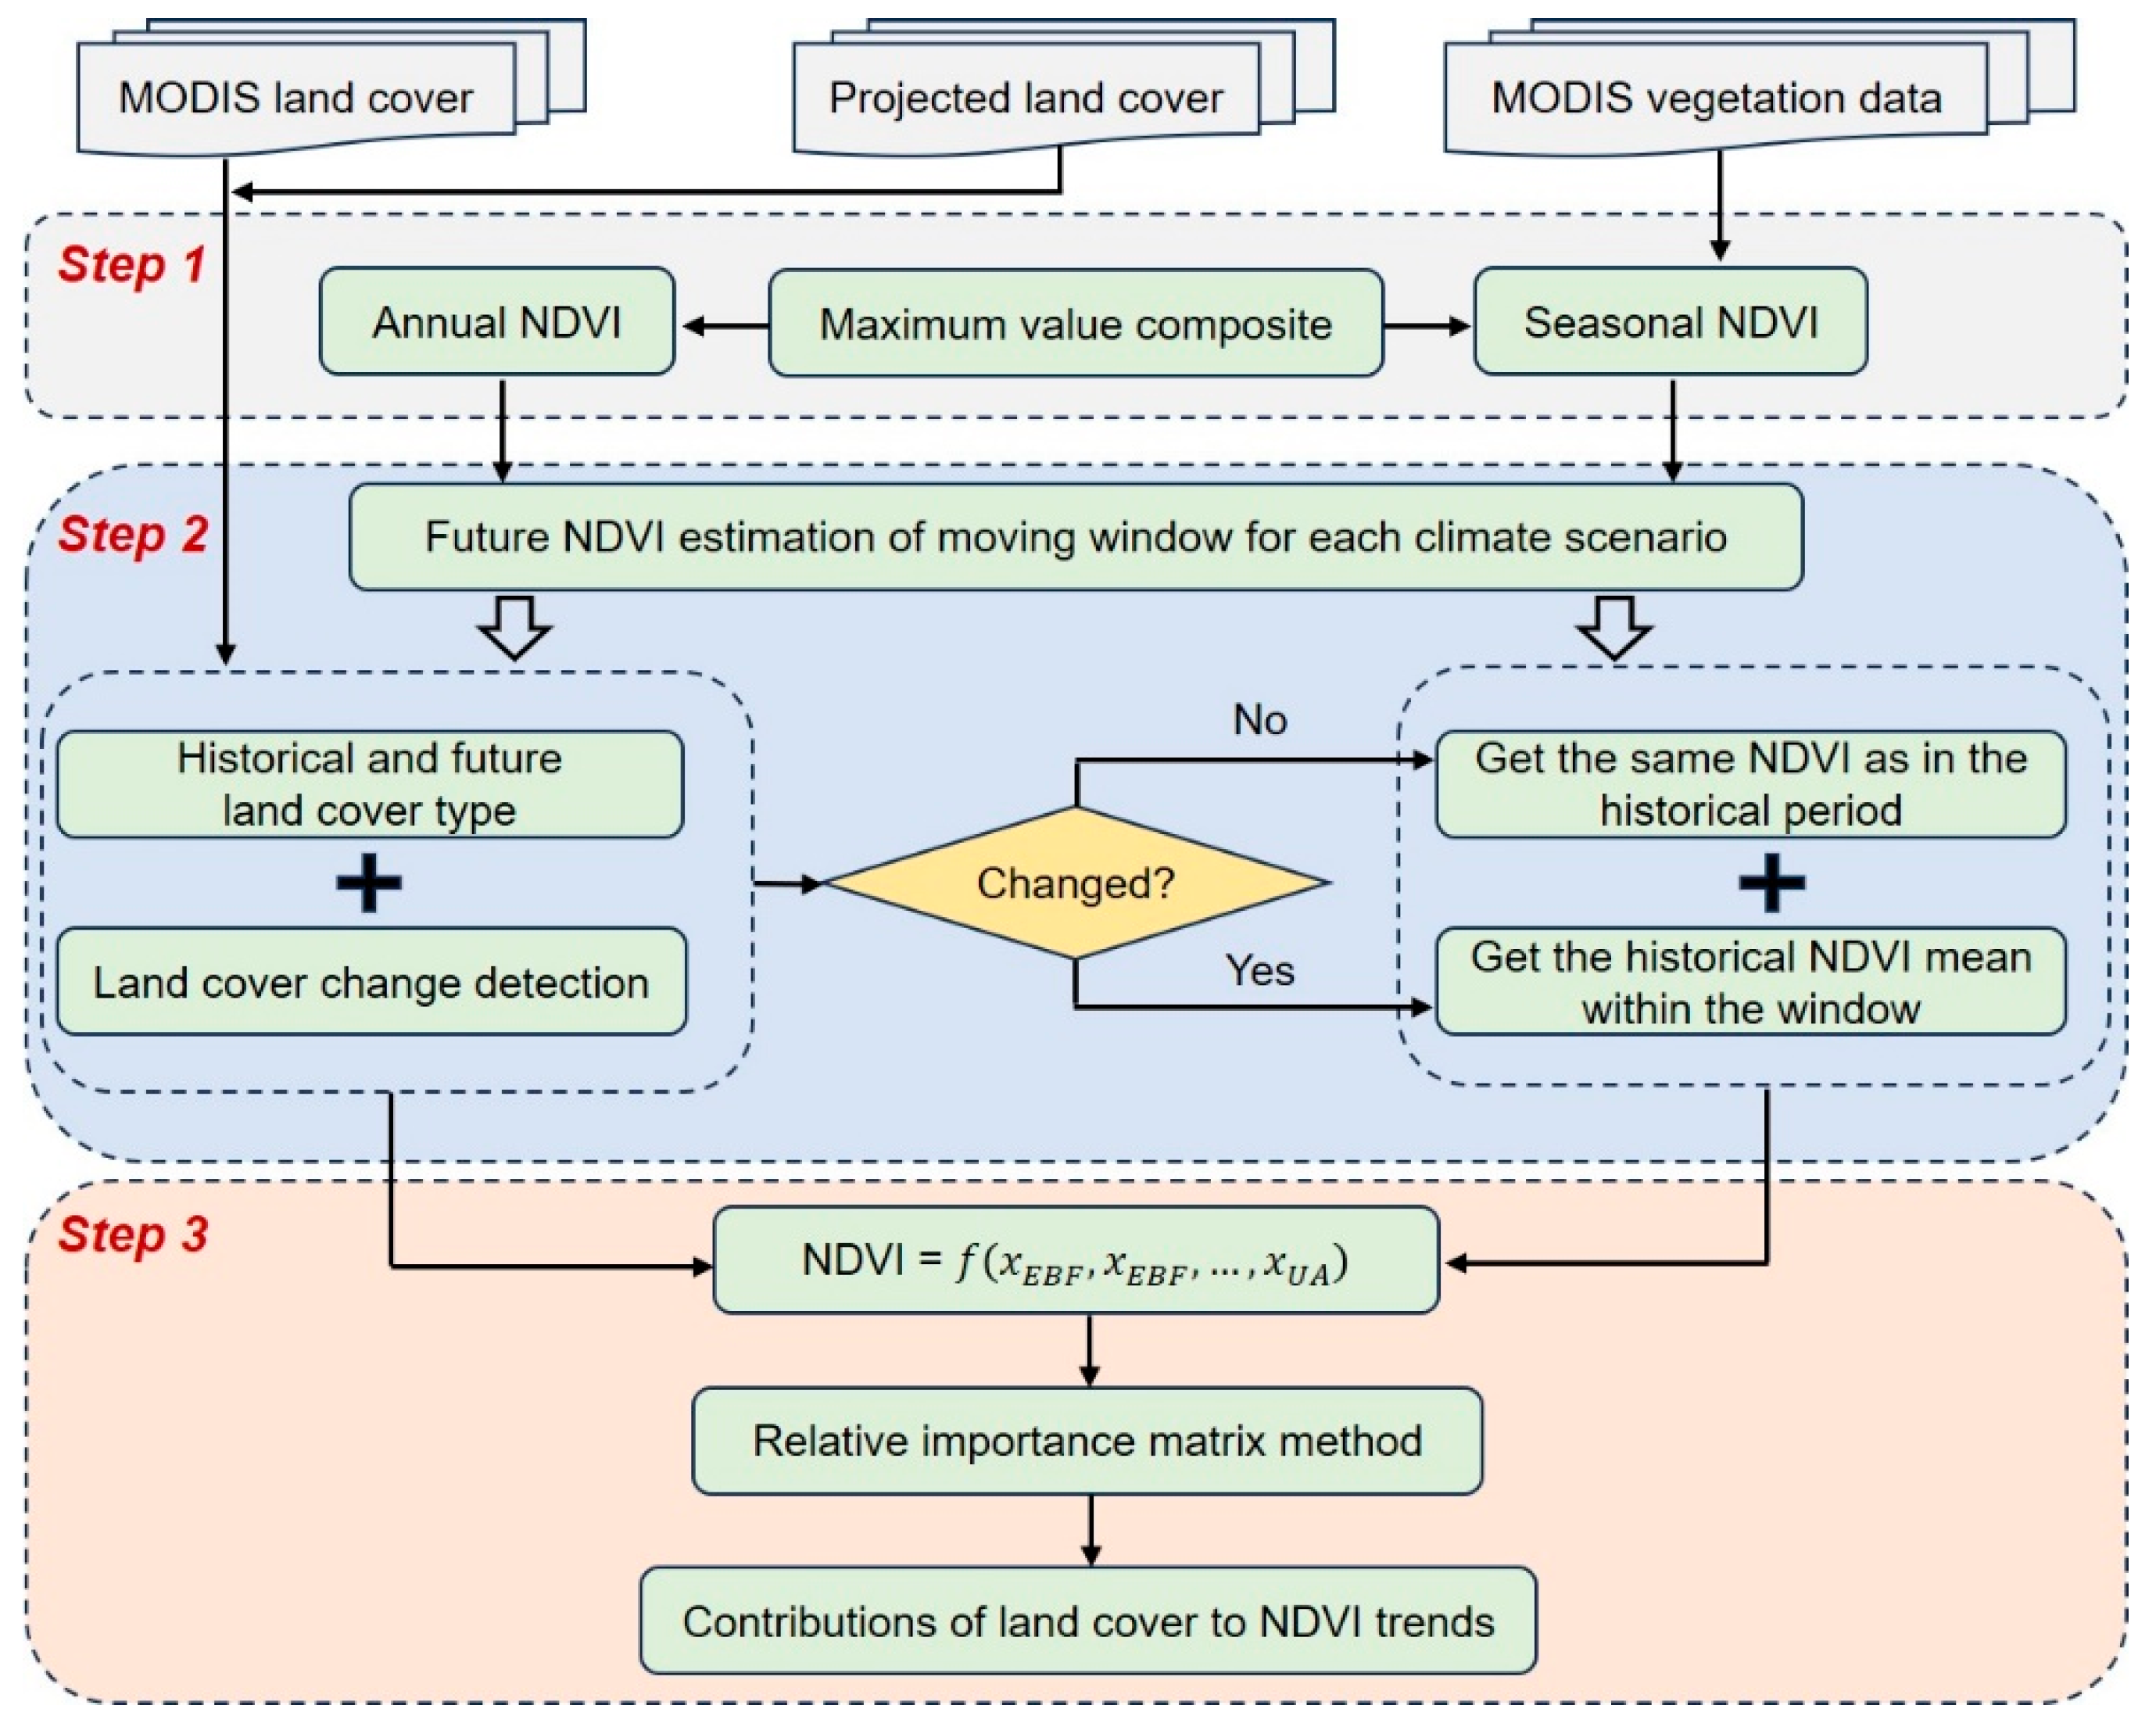
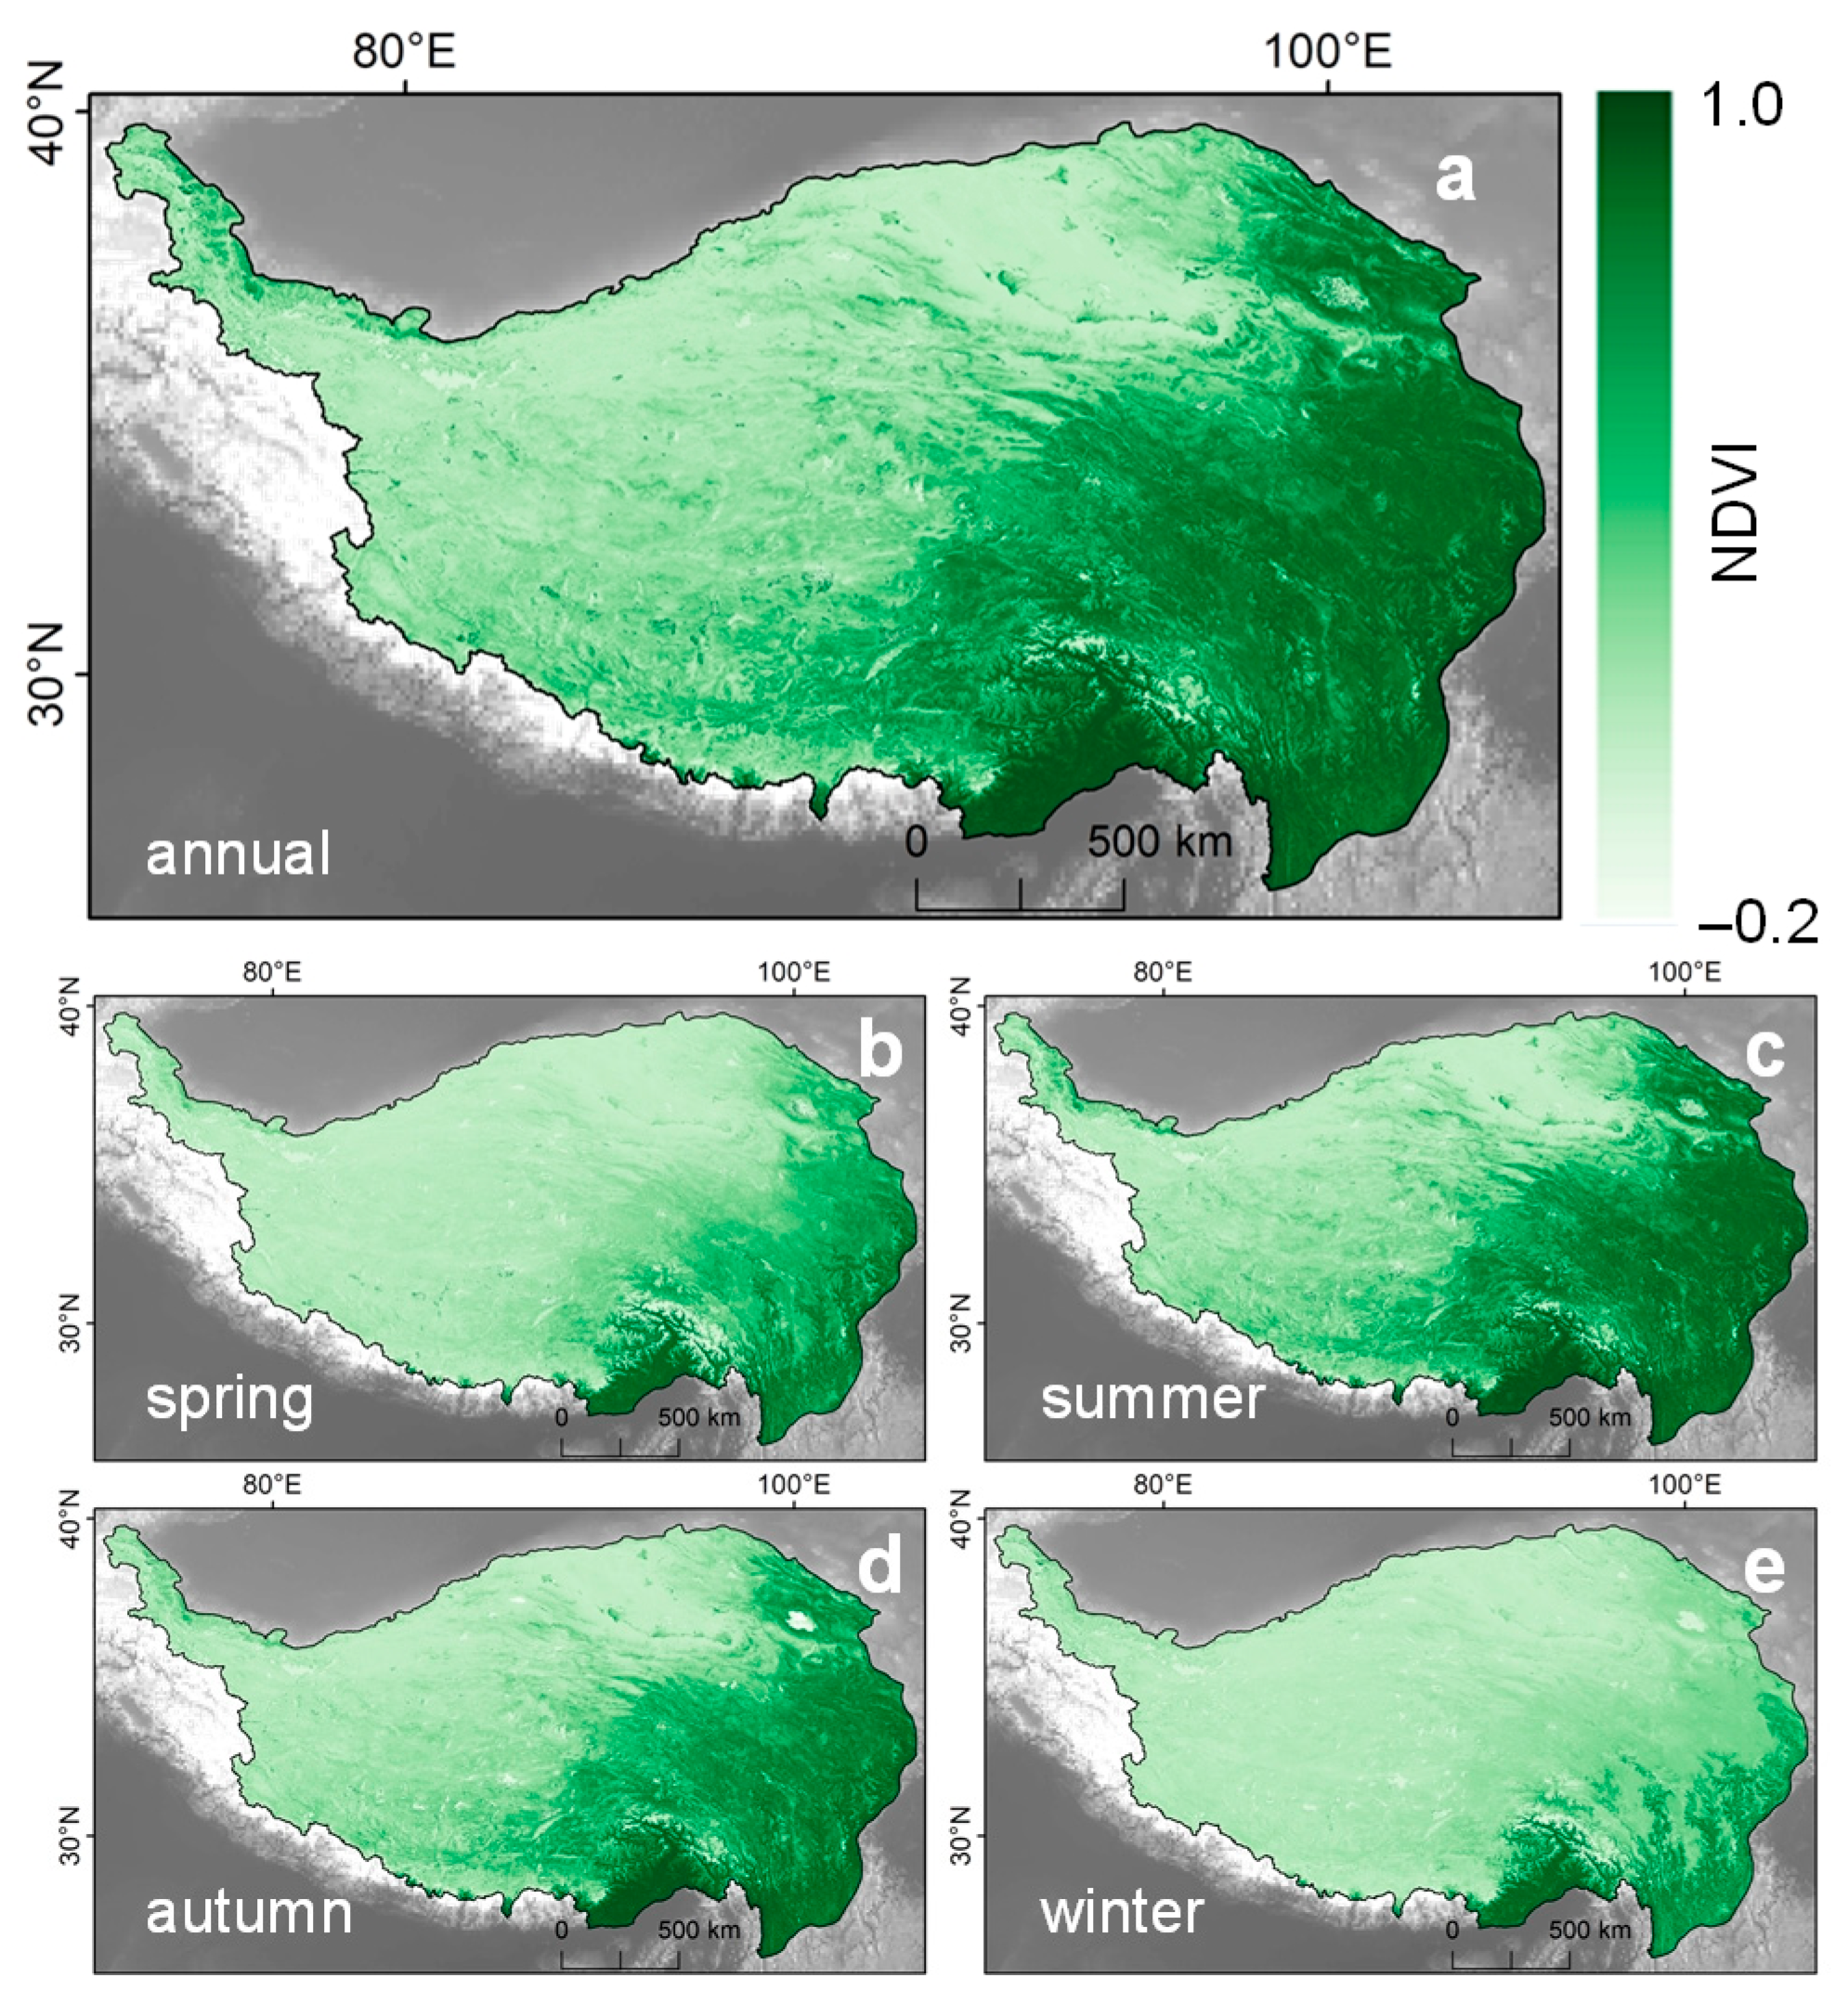
2.3.1. Calculation of Annual and Seasonal NDVI for the Tibetan Plateau During Past Period

We aggregated the annual and seasonal average NDVI of the Tibetan Plateau from 2003 to 2015 using the maximum value synthesis method (Figure 3), aiming to minimize the interference caused by cloud cover, atmospheric aerosols, and variations in the solar angle [32]. In this study, spring, summer, autumn, and winter are defined as March to May, June to August, September to November, and December to February, respectively. These annual and seasonal NDVIs can be used to approximate the vegetation mean of the Tibetan Plateau under historical climate conditions, and will be applied in estimating the spatiotemporal dynamics of the NDVI under various future scenarios.

2.3.2. Estimation of the Spatiotemporal NDVI Dynamics on the Tibetan Plateau from 2015 to 2100

Given the lack of consistent vegetation data with future land cover change data on the Tibetan Plateau in the current study, we adapted methods from previous studies [27] to estimate the spatiotemporal dynamics of vegetation driven by land cover changes under various climate scenarios. Specifically, we assumed that the NDVI values for the same land cover type in historical and future contexts were similar so to represent the NDVI differences driven by different land cover types [27]. We compared annual land cover types under eight future climate scenarios with those from 2015, detecting both unchanged and changed land cover types. For the unchanged land cover pixels, NDVI values were directly obtained from the historical data, while, for the changed pixels, the NDVI values were derived from the mean NDVI of similar land cover types within an 11 km window. The 11 km window is deemed the minimum threshold to adequately reflect the spatial heterogeneity of vegetation and reduce redundant computation, which is critical for the precision of our land cover change impact assessments. If no matches were found, the window was automatically expanded until a valid NDVI value was obtained [27]. Using this method, we successfully estimated the spatial distribution of the NDVI on the Tibetan Plateau every five years from 2015 to 2100 across eight scenarios. While we acknowledge that this approach may not accurately quantify future NDVI dynamics, it provides an approximate estimate that aligns spatially and temporally with land cover types under different future climate scenarios. Our estimated NDVI data strictly adhere to the eight scenarios recommended by the Coupled Model Intercomparison Project Phase 6 (CMIP6, [31]), as the future land cover products used in this study and the scenario settings of LUH2 (v2f version) both originate from CMIP6. This significant advantage offers a consistent perspective for assessing trends in vegetation changes driven by future land cover changes and quantifying their contributions.

2.3.3. Quantification of the Contributions of Different Future Land Cover Types on Vegetation Trends in the Tibetan Plateau

We developed a multiple linear regression model to examine the relationship between various land cover types and the NDVI, employing the relative importance matrix method to quantify their contributions. Model testing indicated that future changes in Barren or Sparsely Vegetated Land (BSV) on the Tibetan Plateau did not meet the variable confidence conditions, and both Permanent Snow and Ice and Water Bodies were excluded as non-vegetation types. Finally, we constructed a multiple linear model with 12 land cover types related to the NDVI on the Tibetan Plateau, namely, Evergreen Needleleaf Forests, Evergreen Broadleaf Forests, Deciduous Needleleaf Forests, Deciduous Broadleaf Forests, Mixed Forests, Woody Savannas, Closed Shrublands, Open Shrub-lands, Savannas, Grasslands, Croplands, Urban and Built-up Lands, and Cropland/Natural Vegetation Mosaics. Using the constructed model, we employed the R relaimpo package (https://www.rdocumentation.org/packages/relaimpo/versions/2.2-6/topics/calc.relimp, accessed on 1 December 2024) to assess the relative importance of each land cover type and quantify their percentage contributions. The R relaimpo package has been widely used in studies quantifying the contributions of land cover changes [33,34,35].

3. Results

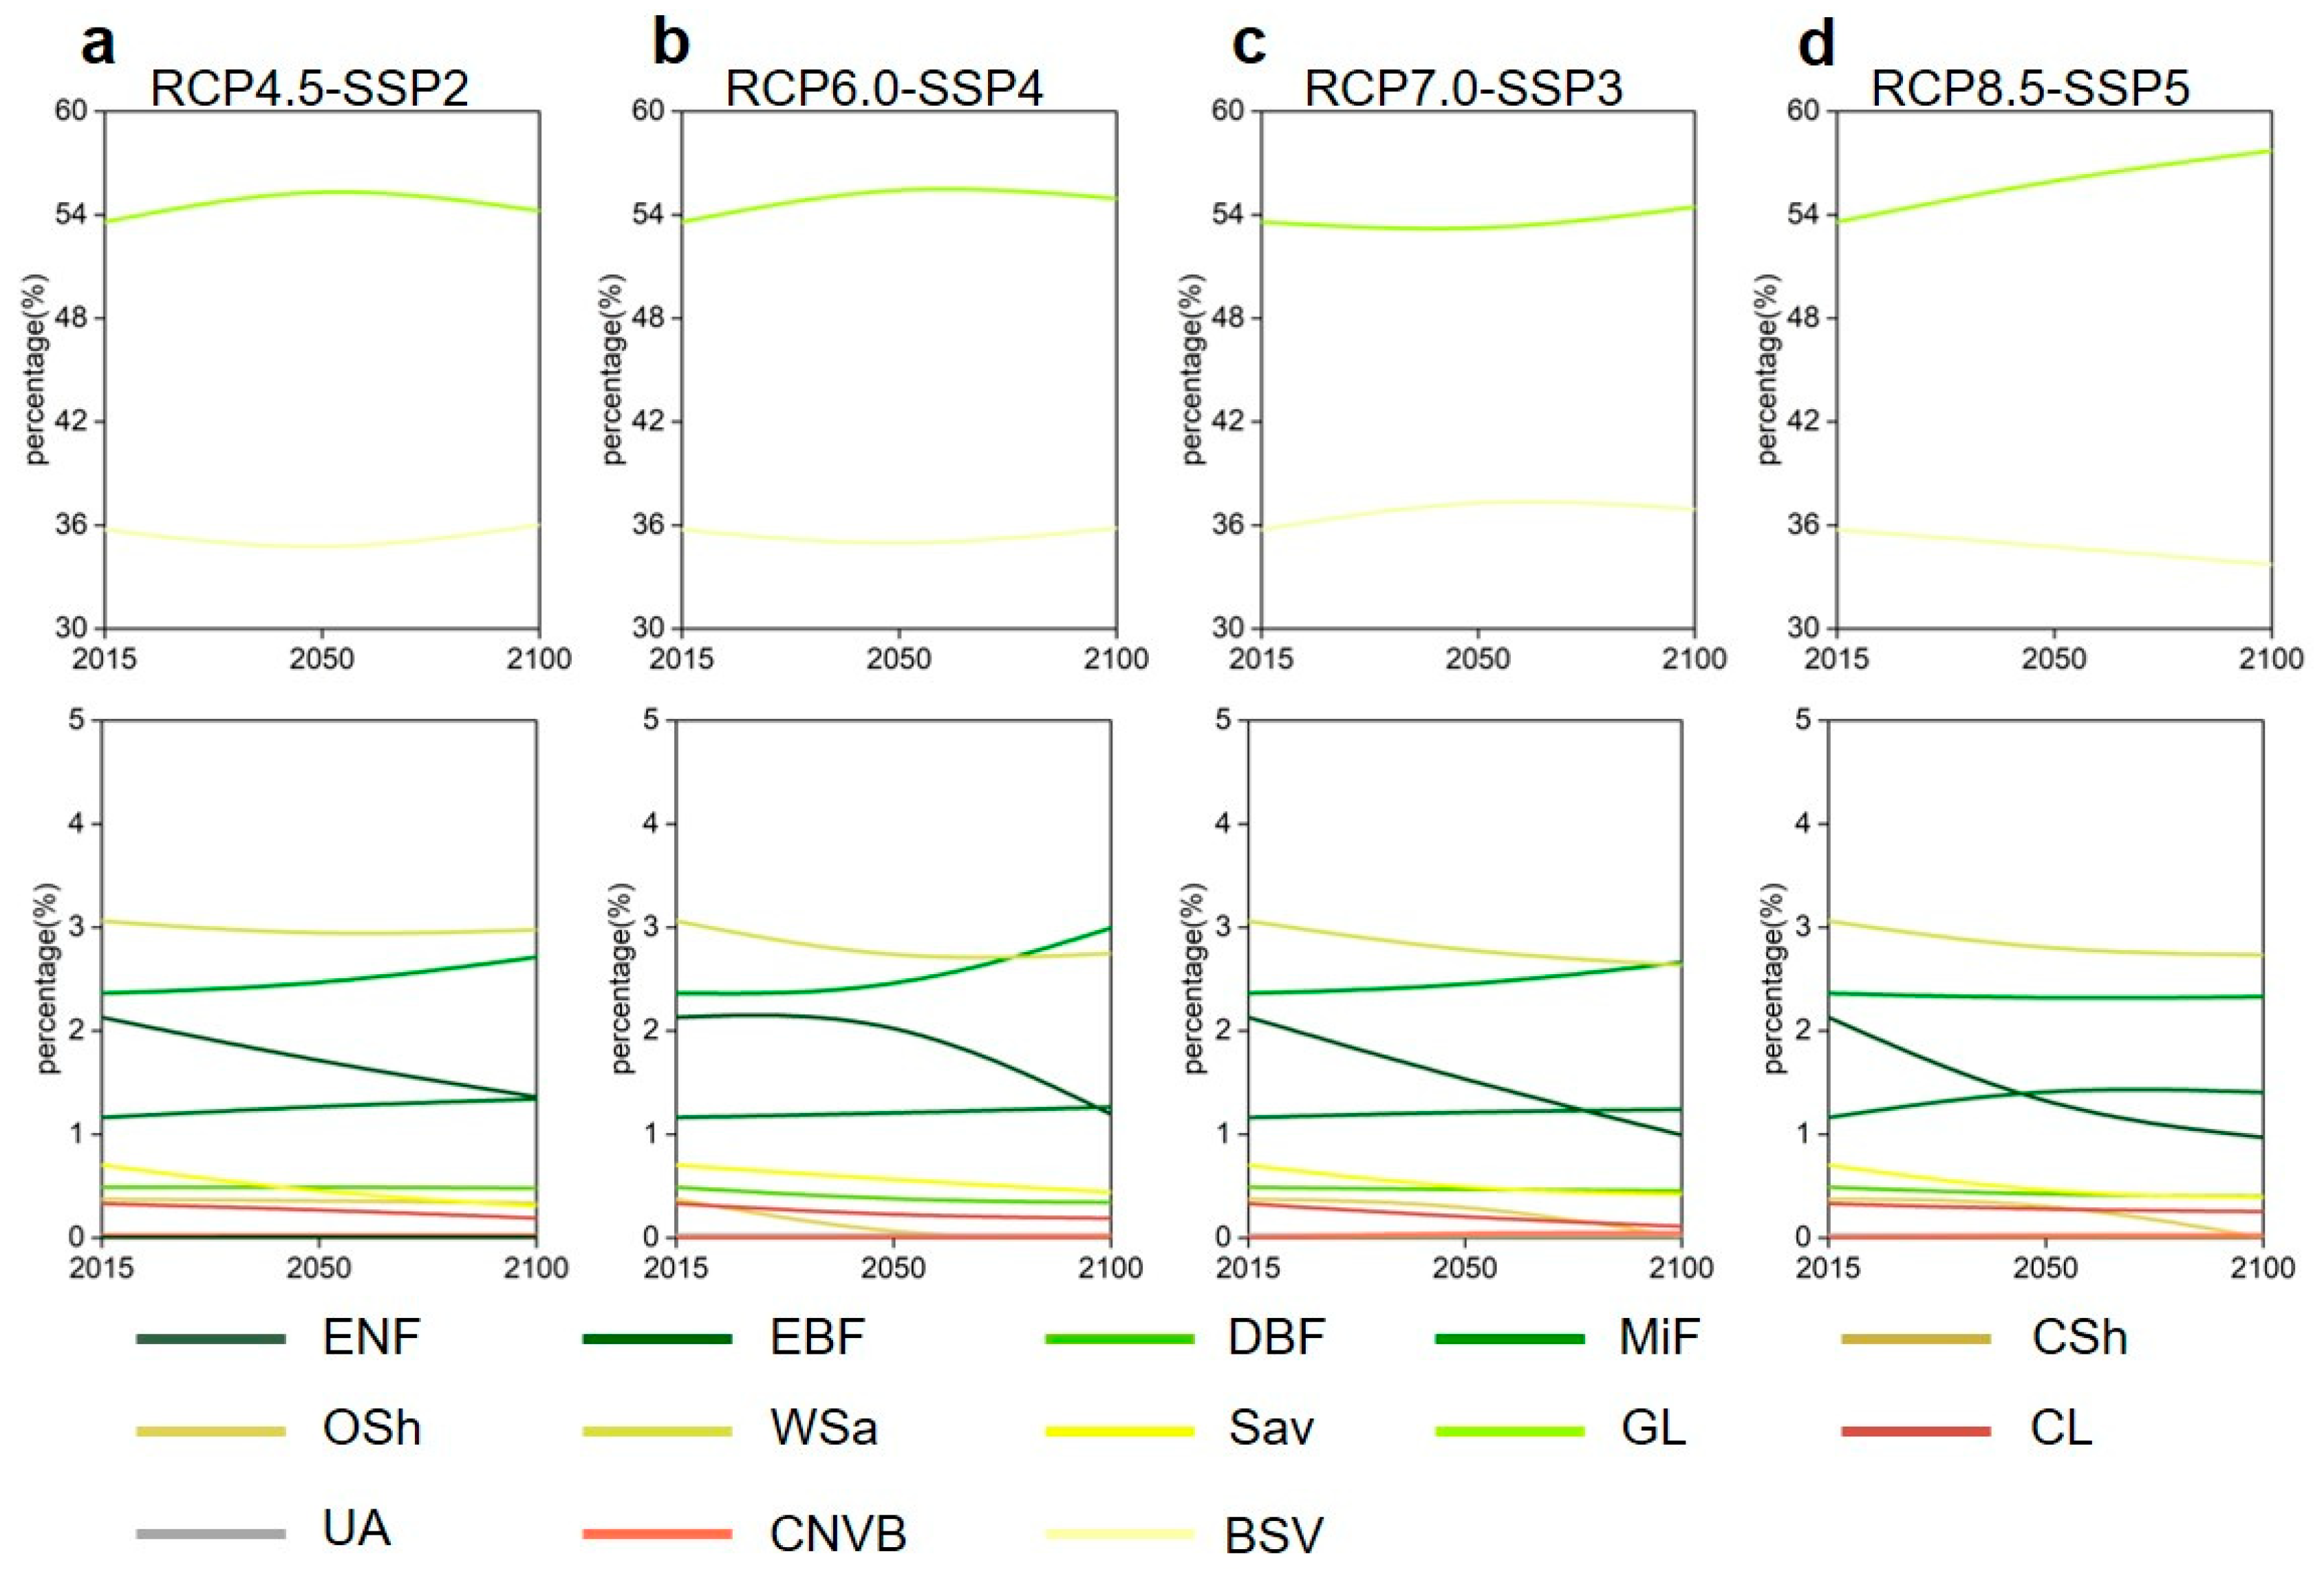
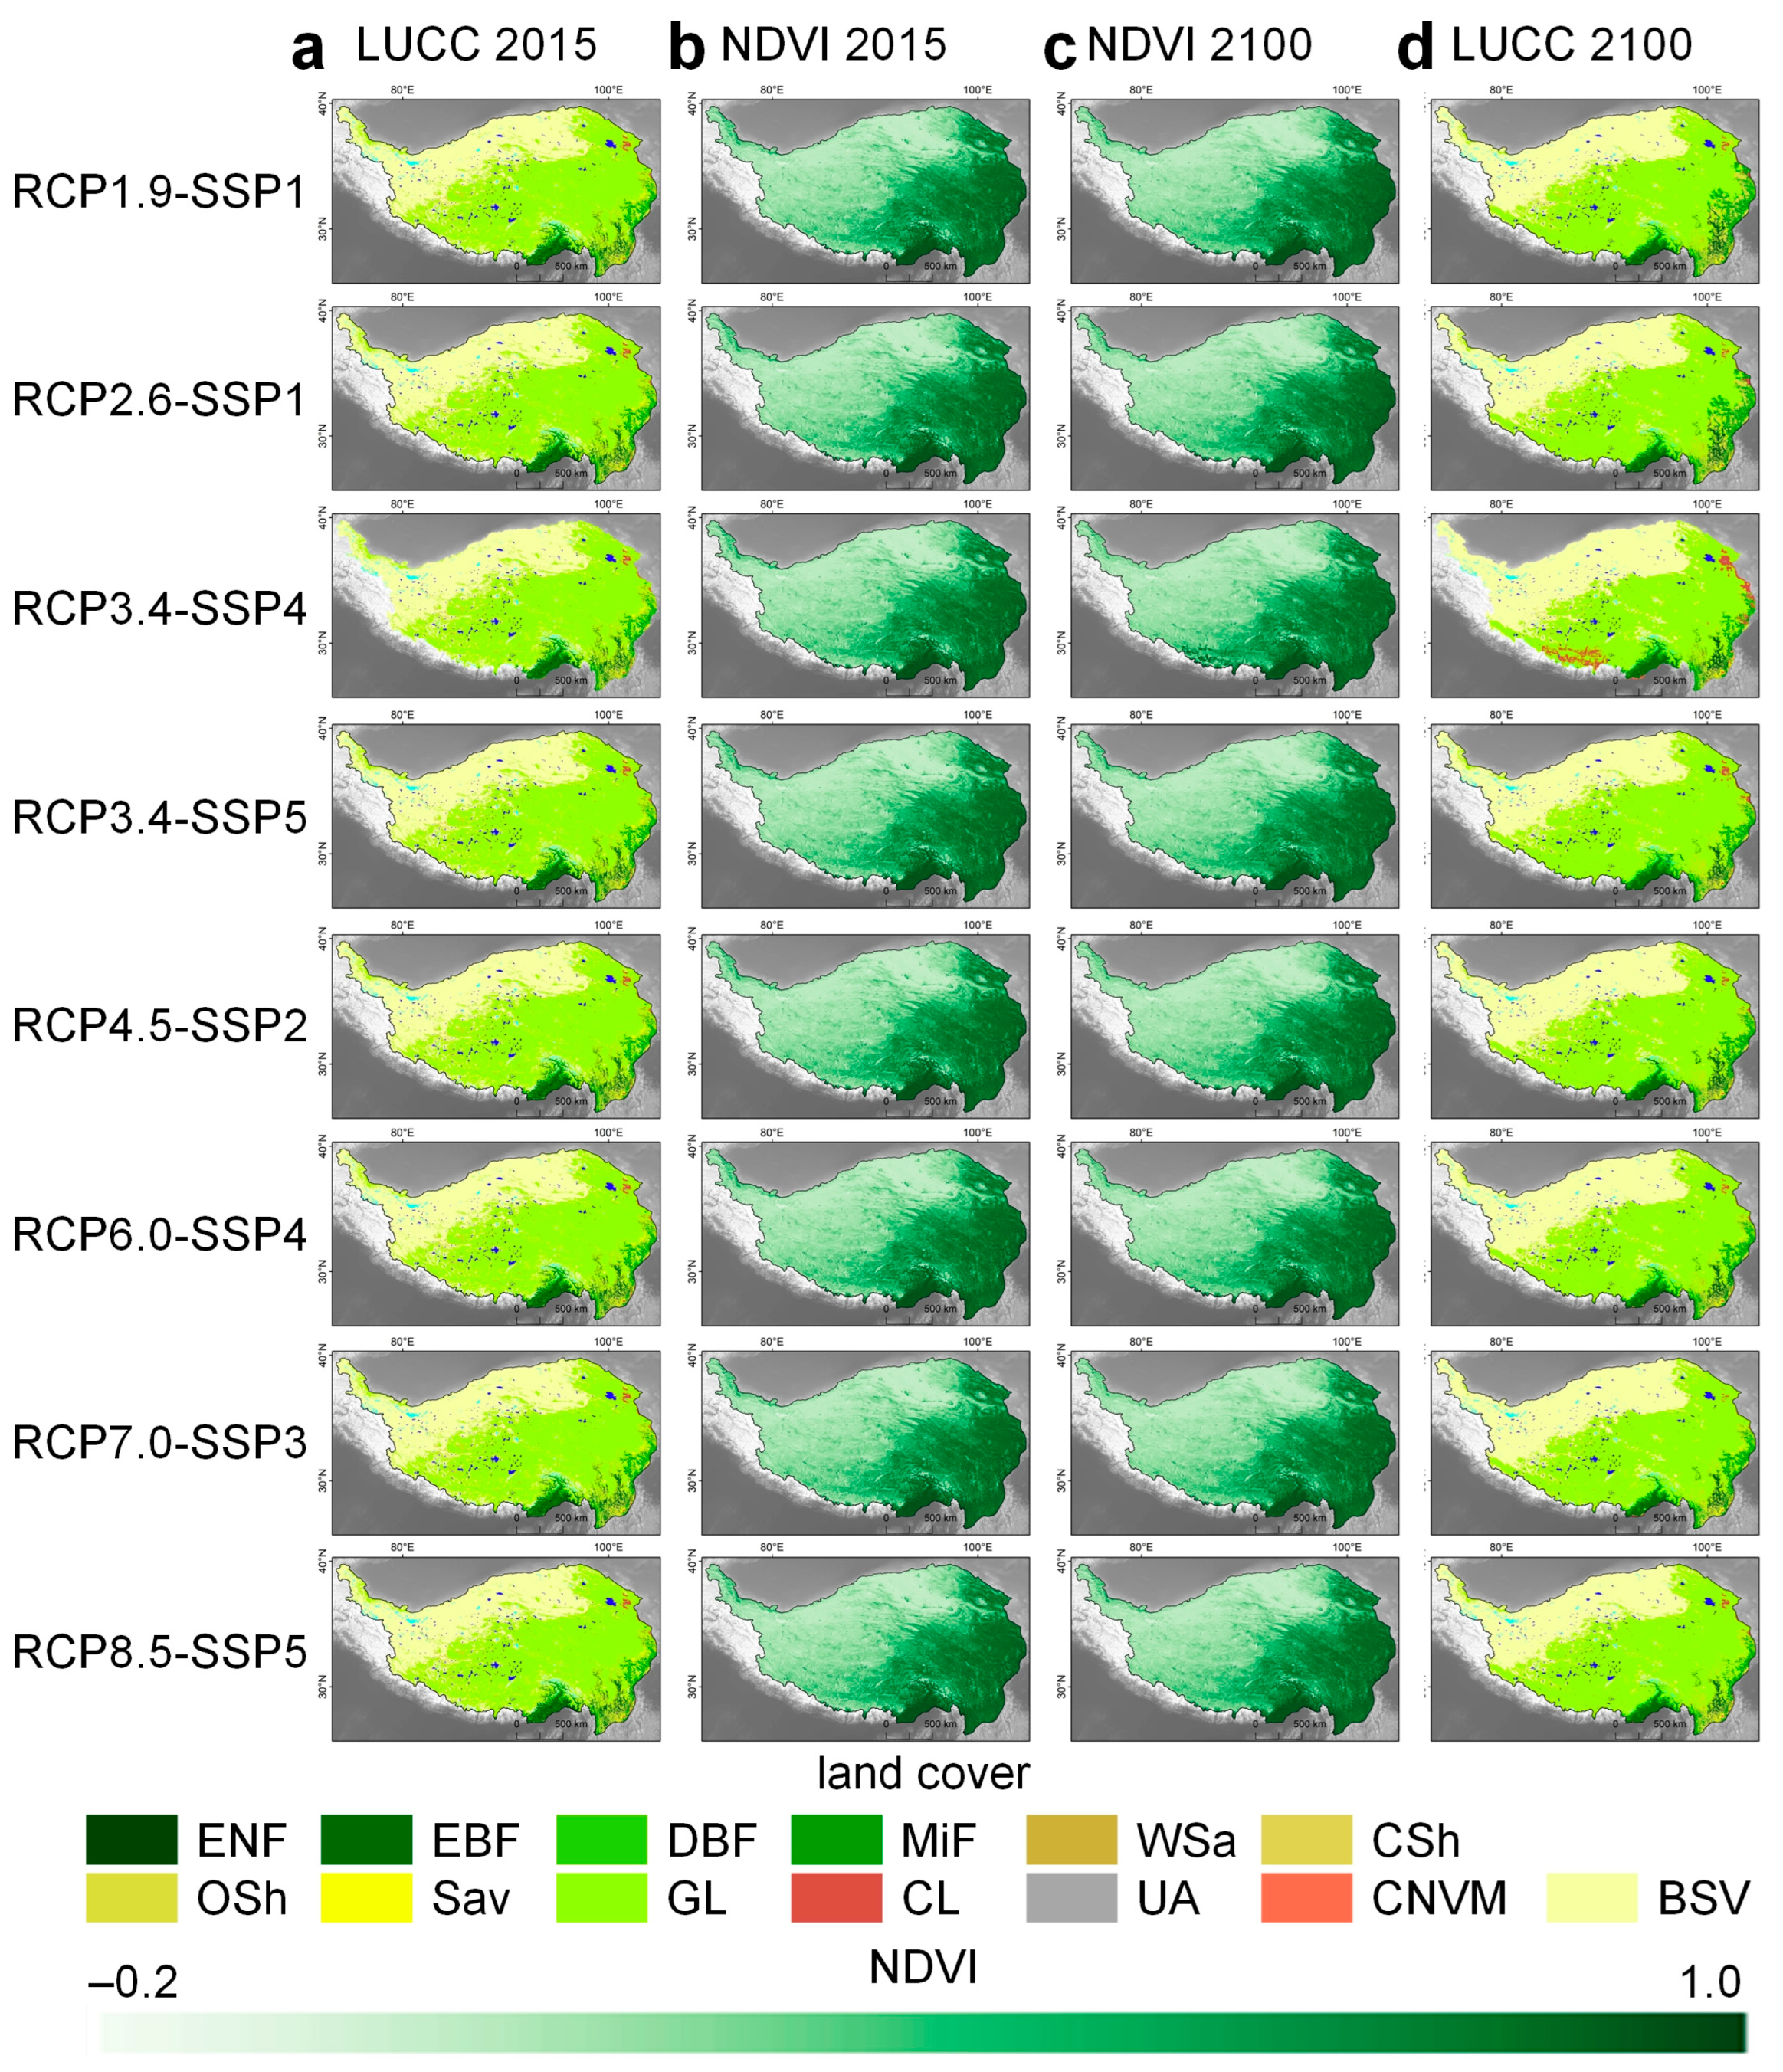
3.1. Land Cover Dynamics on the Tibetan Plateau from 2015 to 2100 Under Eight Climate Scenarios

We carefully evaluated the temporal changes in land cover proportions under different RCP-SSP scenarios, revealing significant variations in land cover dynamics on the Tibetan Plateau across various scenarios. GL and BSV are projected to be the dominant land cover types on the Tibetan Plateau in the future, followed by diverse Forest types, then other Grassland types, Cropland (CL), and Cropland/Natural Vegetation Mosaic (CNVM). On average, across the eight climate scenarios (Figure 4 and Figure 5), GLs have the largest proportion of area, covering 54.49%. Among them, the highest average proportion is under the RCP8.5-SSP5 scenario (56.17%, Figure 5d), and the lowest is under the RCP3.4-SSP4 scenario (52.73%, Figure 4c). The second largest land cover type is BSV, accounting for 35.23%, with the highest proportion under the RCP3.4-SSP4 scenario (37.15%) and the lowest under the RCP3.4-SSP5 scenario (34.01%). The remaining land cover types, on average, account for less than 4% of the total area. Specifically, Wsa, MiF, ENF, EBF, DBF, Sav, CL, Osh, UA, and CNVM cover proportions reach 3.07%, 2.71%, 1.64%, 1.30%, 0.44%, 0.44%, 0.31%, 0.27%, 0.03%, 0.02%, and 0.004%, respectively. Among these, WSa, MiF, and CL are the most prevalent under the extremely low forcing scenario (RCP1.9-SSP1, Figure 4a); ENF, Sav, and UA show their largest proportions under the low forcing scenarios (RCP3.4-SSP5 and RCP3.4-SSP4, Figure 4c,d). EBF, DBF, and CNVM are the most significant under the medium forcing scenarios (RCP4.5-SSP2 and RCP6.0-SSP4, Figure 5a,b). OSh has the highest proportion under the high forcing scenario (RCP8.5-SSP5, Figure 5d).
For the land cover dynamics of 2015~2100, the GL proportion under the RCP8.5-SSP5 scenario, where it has the largest area proportion, increased by 4.13% (Figure 5d). BSV under the RCP3.4-SSP4 scenario, where it has the highest area proportion, increased by 2.58% (Figure 4c). WSa, MiF, and CL, under the RCP1.9-SSP1 scenario with the greatest area proportions, increased by 1.42%, 1.25%, and 0.12%, respectively (Figure 4a). Under the low forcing scenarios (RCP3.4-SSP5 and RCP3.4-SSP4), where WSa, MiF, and CL have the largest area proportions, their changes were –0.27%, –0.36%, and 0.00%, respectively (Figure 4c,d). EBF, DBF, and CNVM, under the medium forcing scenarios (RCP4.5-SSP2 and RCP6.0-SSP4) with the largest area proportions, increased by 0.18%, 0.01%, and 0.01%, respectively (Figure 4c,d). Lastly, Osh under the high forcing scenario (RCP8.5-SSP5) had a decrease of 0.37%, which has the highest area proportion (Figure 5d).
The results reveal significant variations in future land cover dynamics on the Tibetan Plateau under different climate scenarios, with Grasslands (GLs) and Barren or Sparsely Vegetated Land (BSV) projected to be the dominant types, and notable changes in Forest types and other Grassland subtypes.

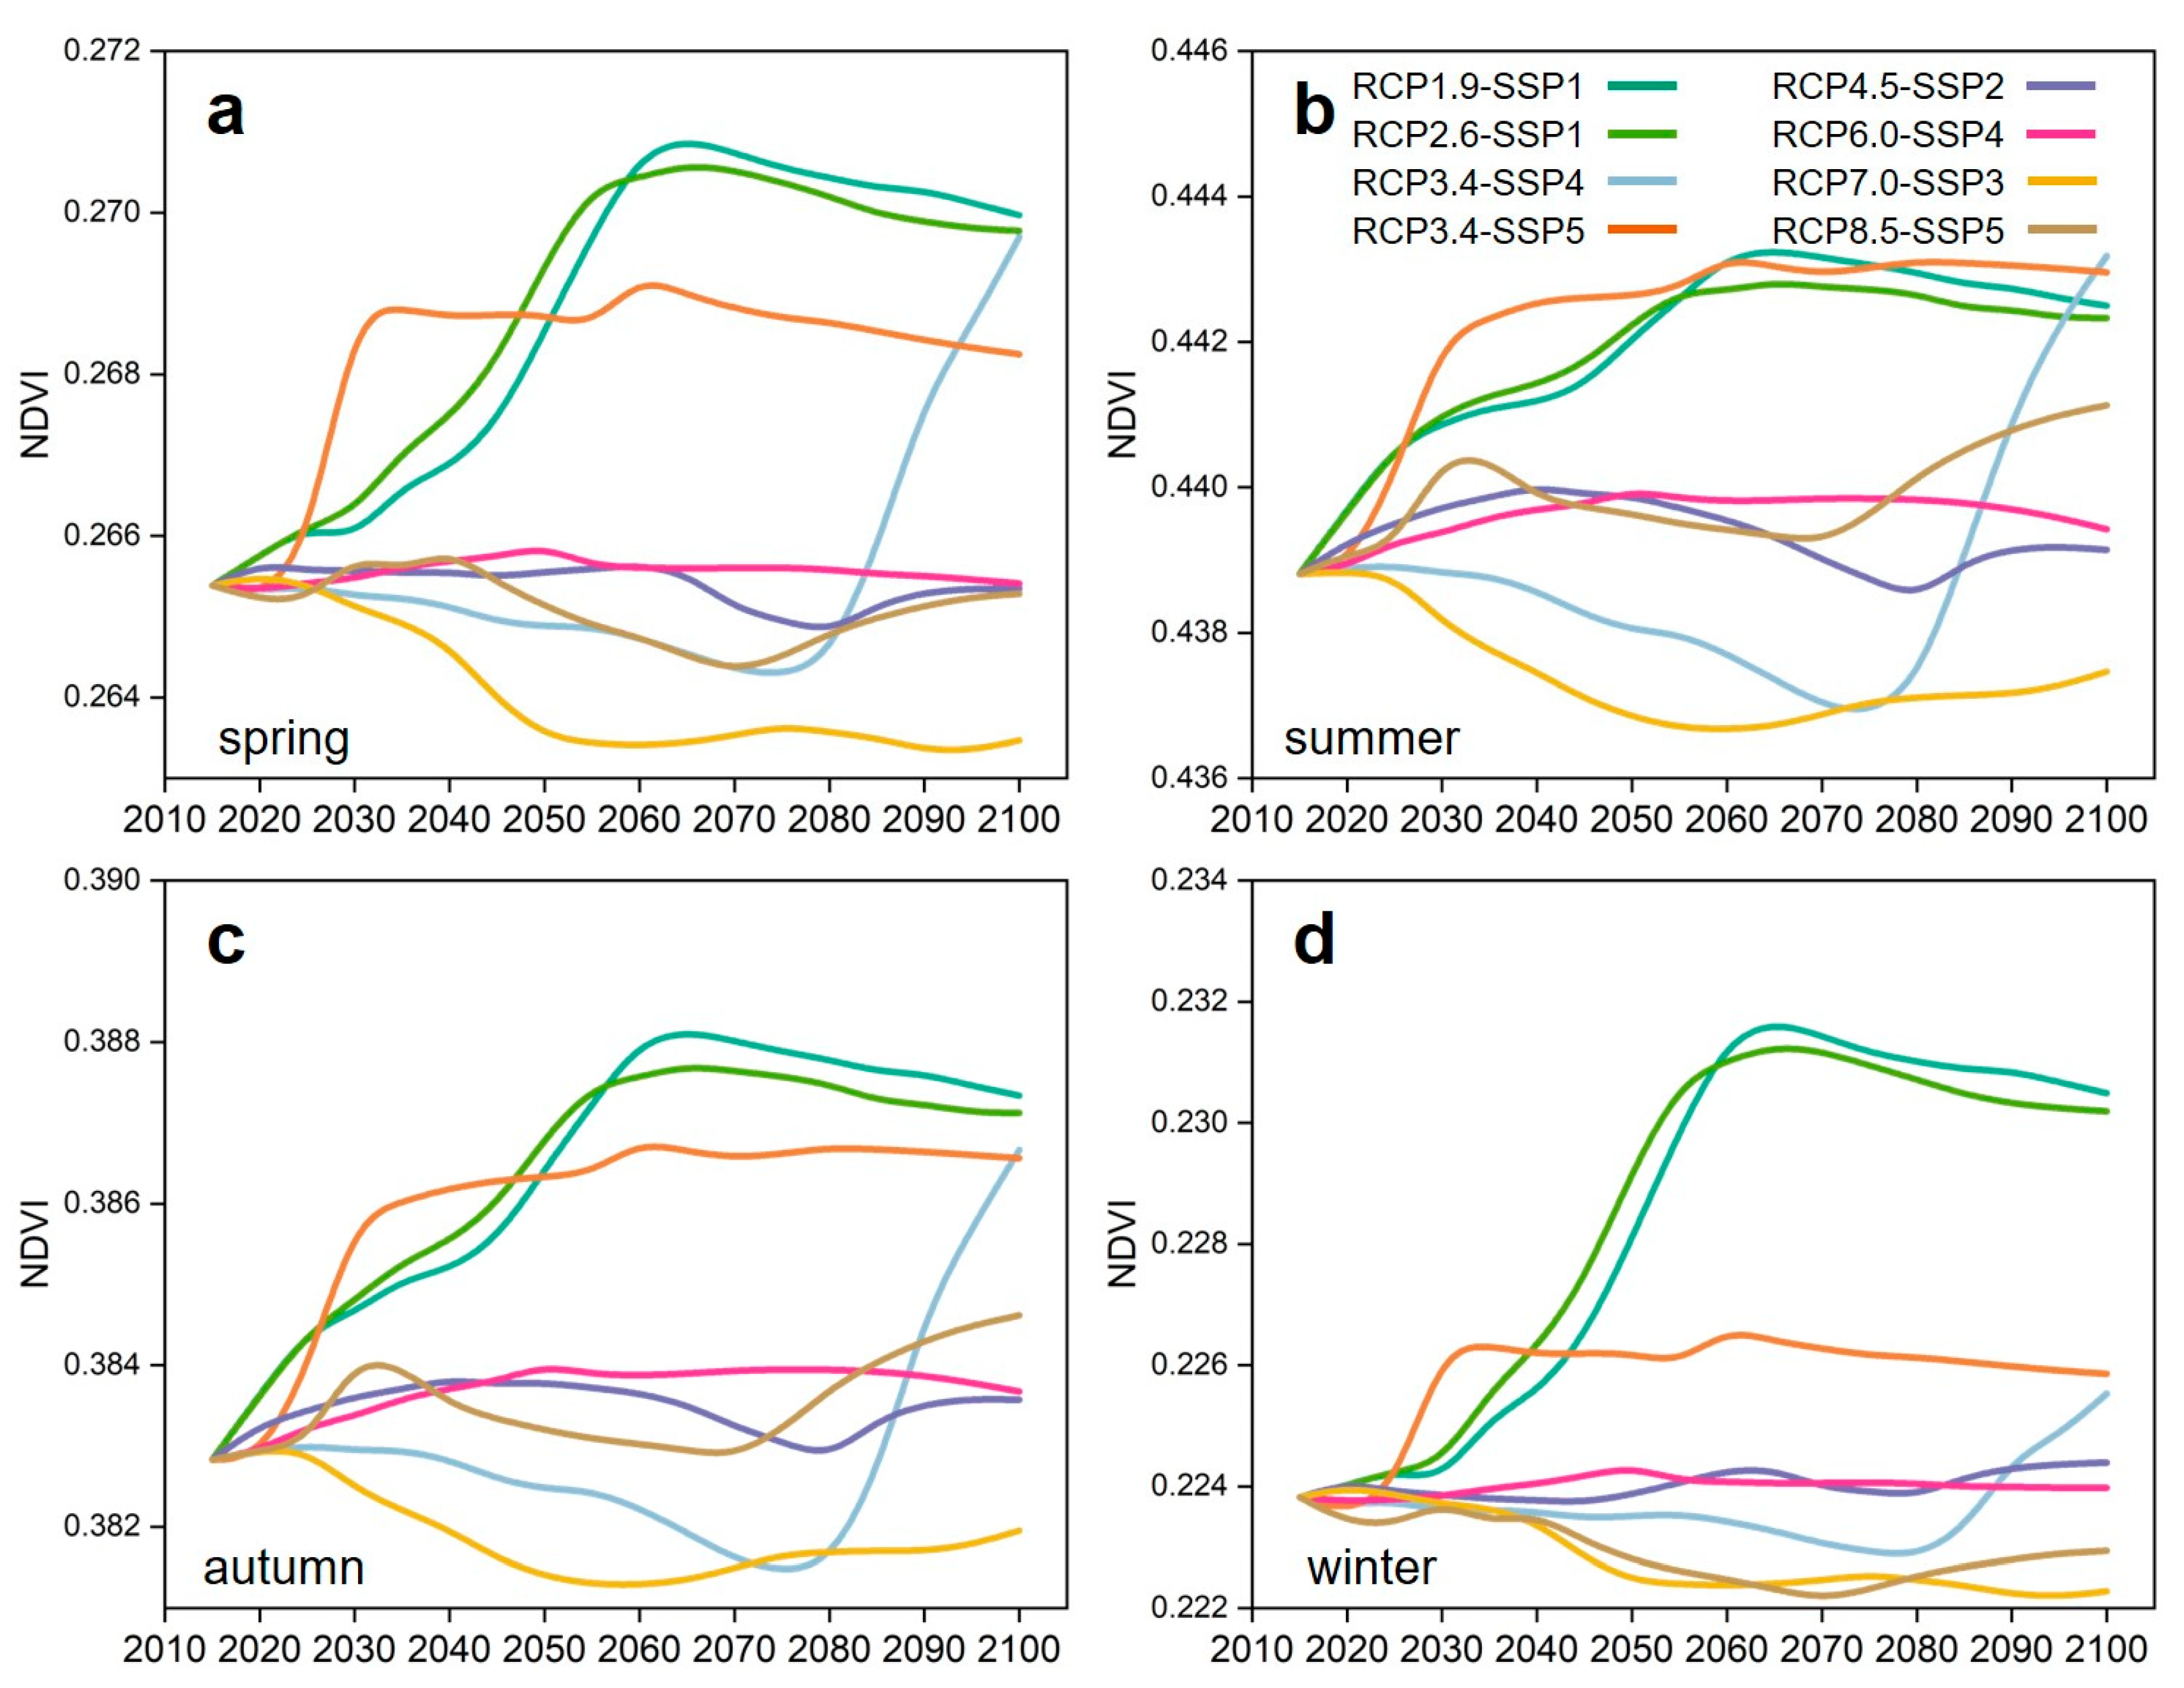
3.2. Vegetation Trends Due to Land Cover Changes on the Tibetan Plateau Under Different Climate Scenarios

We derived the annual NDVI for the Tibetan Plateau from 2015 to 2100 across eight climate–socioeconomic scenarios based on the assumption that the vegetation NDVI remains unchanged under the same land cover type grids during both past and future periods. Due to paper space limitations, only the annual NDVI for 2015 and 2100 is presented here (Figure 6). In terms of the spatial distribution patterns, the annual NDVI in 2100 is characterized by high southeast and low northwest for either climate scenario.
We presented the trends of the annual NDVI on the Tibetan Plateau due to land cover changes under different climate scenarios and identified the following four main patterns: greening, browning followed by greening, fluctuation, and browning of vegetation (Figure 7). The scenarios RCP1.9-SSP1, RCP2.6-SSP1, RCP3.4-SSP5, and RCP8.5-SSP5 show a greening trend, which may be attributed to the remarkable increases in Forest and Grassland areas. The proportions of WSa and MiF enlarged notably under the RCP1.9-SSP1 and RCP2.6-SSP1 scenarios (Figure 4a,b). Besides the growth of WSa and MiF in the RCP3.4-SSP5 scenario, GL and EBF also exhibited notable increases (Figure 4d). Under the RCP8.5-SSP5 scenario, although there was no substantial increase in the Forest category, GL still maintained notable growth (Figure 5d). The RCP3.4-SSP4 scenario displayed a browning followed by a greening trend (Figure 7). In this scenario, a large portion of the Forest showed a declining trend, as did GL, but a rapid increase in CL in the later period (Figure 4c); this may be the main reason for the remarkable greening in the later stages of this climate scenario. Both RCP4.5-SSP2 and RCP6.0-SSP4 scenarios showed a fluctuation trend, generally showing an initial increase followed by a decrease (Figure 7). In terms of forest cover, only MiF showed a growth trend, while ENF declined rapidly, and GL exhibited an initial rise followed by a decline (Figure 5a,b). These interactive changes in land cover types may have contributed to the fluctuating vegetation trends in these two scenarios. The RCP7.0-SSP3 scenario demonstrated a browning trend (Figure 7), with the vast majority of Forest showing a decreasing trend and GL showing a fluctuating trend (Figure 5c), which had a substantial impact on the annual NDVI trend.
In summary, annual and seasonal vegetation trends on the Tibetan Plateau due to land cover changes under various climate scenarios exhibit patterns of greening, browning followed by greening, fluctuation, and browning, with greening being the predominant trend across the scenarios.

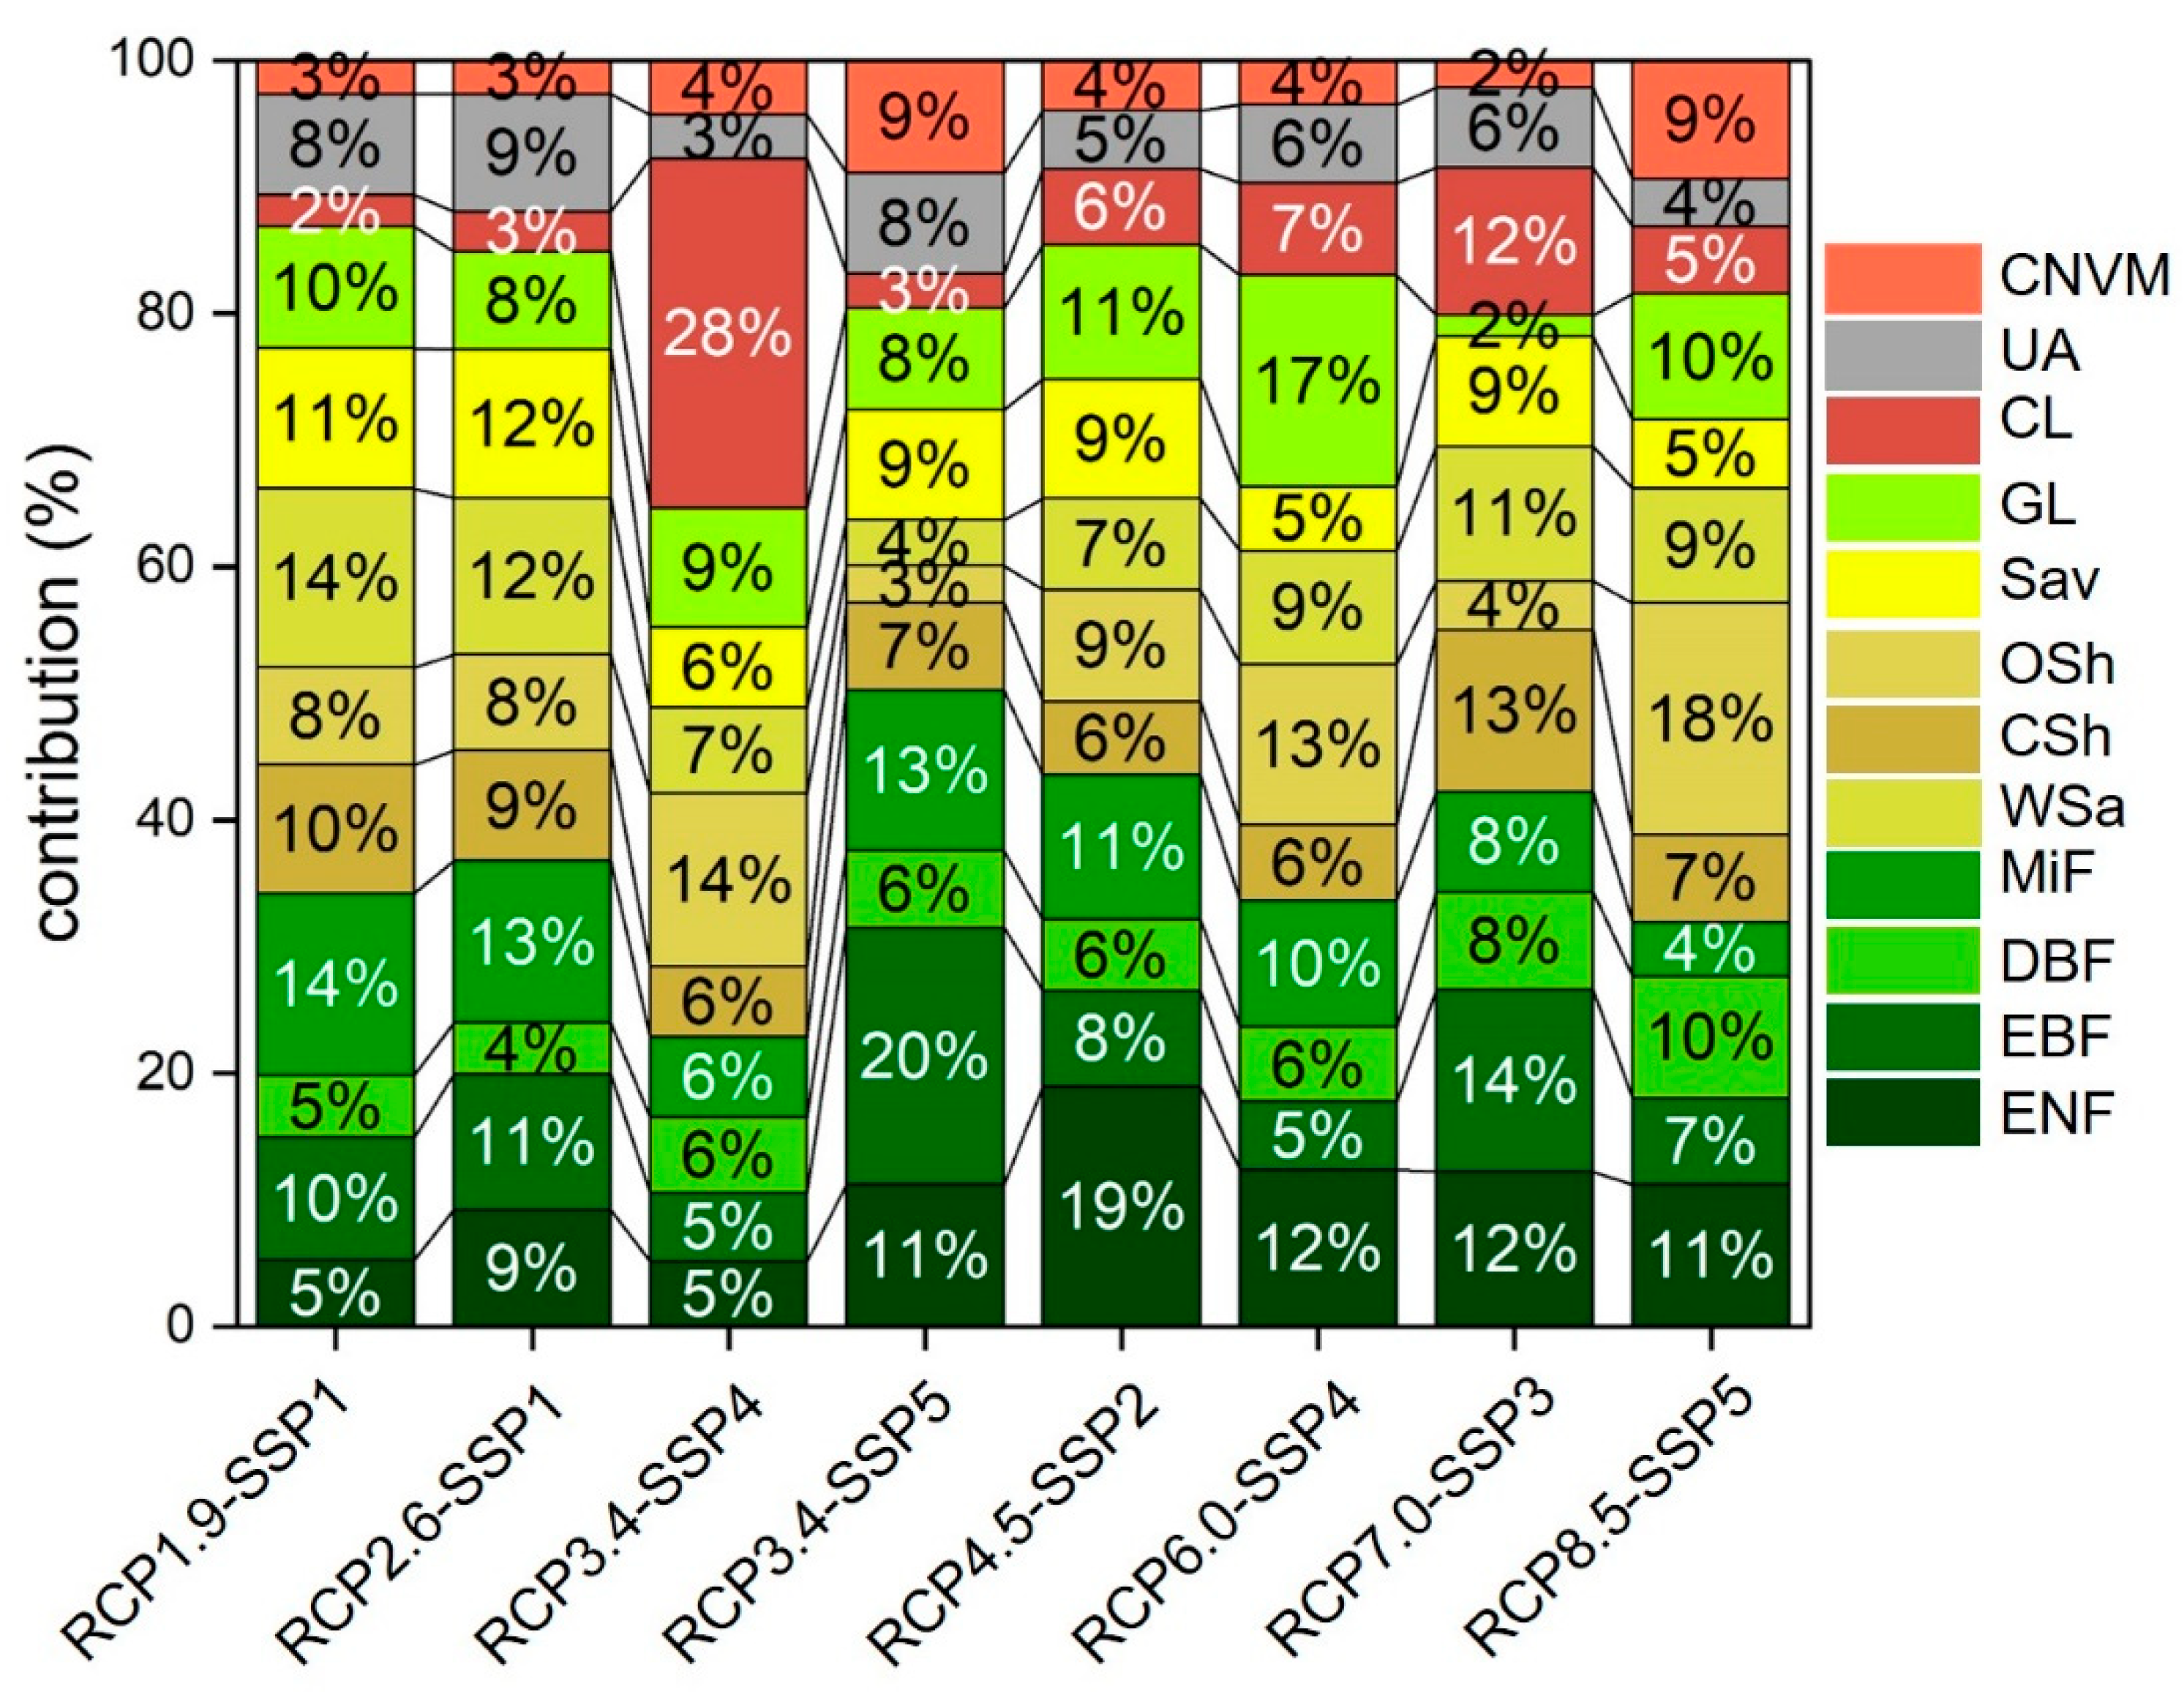
3.3. Contributions of Land Cover Changes to Annual Vegetation Changess on the Tibetan Plateau Under Different Climate Scenarios

Generally, Forest dominates the vegetation trends due to land cover changes under future climate scenarios, with Grassland ranking second. Forest leads in far more of the climate scenarios than Grassland. The following six climate scenarios are dominated by Forest contributions: RCP1.9-SSP1, RCP2.6-SSP1, RCP3.4-SSP5, RCP4.5-SSP2, RCP6.0-SSP4, and RCP7.0-SSP3 (Figure 8). The scenario with the greatest Forest contribution is RCP3.4-SSP5, with a contribution of 48%, where the Forest type with the greatest contribution to land cover change is MiF, accounting for 13% (Figure 8). Grasslands are the primary contributors in the following two climate scenarios: RCP3.4-SSP4 and RCP8.5-SSP5 (Figure 8). The RCP8.5-SSP5 scenario has the highest Grassland contribution at 52%, with GL playing the biggest role, account for 24% (Figure 8).
In terms of the specific land cover contributions (Figure 8): (1) For scenarios where the annual vegetation on the Tibetan Plateau exhibits a greening trend, Wsa and MiF make the greatest positive contributions to the extremely low forcing level and sustainability pathway (RCP1.9-SSP1), reaching 13% and 12%, respectively. EBF, Sav, and UA make the greatest contribution to the low forcing level and sustainability pathway (RCP2.6-SSP1), each at 11%. MiF, EBF, and ENF make the largest impact on the low forcing level and fossil-fueled development pathway (RCP3.4-SSP5), at 13%, 12%, and 12%, respectively. GL and CSh make the largest contributions to the high forcing level and fossil-fueled development pathway (RCP8.5-SSP5), reaching 24% and 16%, respectively. (2) For the scenario where annual vegetation on the Tibetan Plateau displays a browning followed by greening trend (RCP3.4-SSP4), CL, OSh, and GL make the largest contributions, at 30%, 14%, and 9%, respectively. (3) For scenarios with fluctuating vegetation trends on the Tibetan Plateau, GL and CL make the largest contributions to the medium forcing level and middle-of-the-road pathway (RCP4.5-SSP2), at 23% and 13%, respectively. GL and CSh contribute the most to the medium forcing level and inequality pathway (RCP6.0-SSP4), at 21% and 13%, respectively. (4) For scenarios exhibiting a browning trend on the Tibetan Plateau, EBF and Sav make the greatest contributions to the medium-to-high forcing level and regional rivalry pathway (RCP7.0-SSP3), at 13% and 12%, respectively.

4. Discussion

4.1. Seasonal Impacts of Land Cover Change-Driven Vegetation Trends Under Climate Scenarios

Seasonal NDVI trends due to land cover changes exhibit both similarities and striking differences across the various climate scenarios. Summarily, seasonal variations have the most substantial impact on vegetation trends due to land cover changes under the RCP8.5-SSP5 scenario, followed by RCP3.4-SSP5, RCP4.5-SSP2, and RCP6.0-SSP4. Minimal effects were shown for the RCP1.9-SSP1, RCP2.6-SSP1, and RCP7.0-SSP3 scenarios. This indicates a strong correlation between climate scenarios primarily based on the fossil-fueled development pathway and seasonal changes in future vegetation trends. Specifically, under the climate scenarios of RCP1.9-SSP1, RCP2.6-SSP1, and RCP3.4-SSP5, vegetation greening due to land cover changes occurs in all seasons (Figure 9), with the rapid growth of Forest or Grassland cover (Figure 5a,b,d). However, the extent of greening under the RCP3.4-SSP5 scenario is relatively weaker in spring and autumn compared to the RCP1.9-SSP1 and RCP2.6-SSP1 scenarios (Figure 9a,c), notably weaker in winter compared to the RCP1.9-SSP1 and RCP2.6-SSP1 scenarios (Figure 9d), and higher than the RCP1.9-SSP1 and RCP2.6-SSP1 scenarios in summer (Figure 9b). This implies the strong seasonal regulation of vegetation trends due to land cover change under the RCP3.4-SSP5 scenario. Under the RCP3.4-SSP4 scenario, the vegetation trend transitions from browning to greening in all seasons (Figure 9), but the magnitude of both browning and greening is minimal in winter (Figure 9d). The fluctuations in vegetation due to land cover changes under the RCP4.5-SSP2 and RCP6.0-SSP4 scenarios occur in all seasons, with greater fluctuations in summer and autumn than in spring and winter (Figure 9). The vegetation browning due to land cover changes under the RCP7.0-SSP3 scenario also occurs in all seasons. Under the RCP8.5-SSP5 scenario, the vegetation greening due to land cover changes occurs in summer and autumn (Figure 9b,c), while vegetation fluctuations occur in spring (Figure 9a), and browning occurs in winter (Figure 9d). This is primarily associated with significant changes in Grassland under the RCP8.5-SSP5 scenario, where growth in spring may not be very pronounced, while substantial vegetation growth occurs in summer and autumn, but the vegetation may wither in winter.

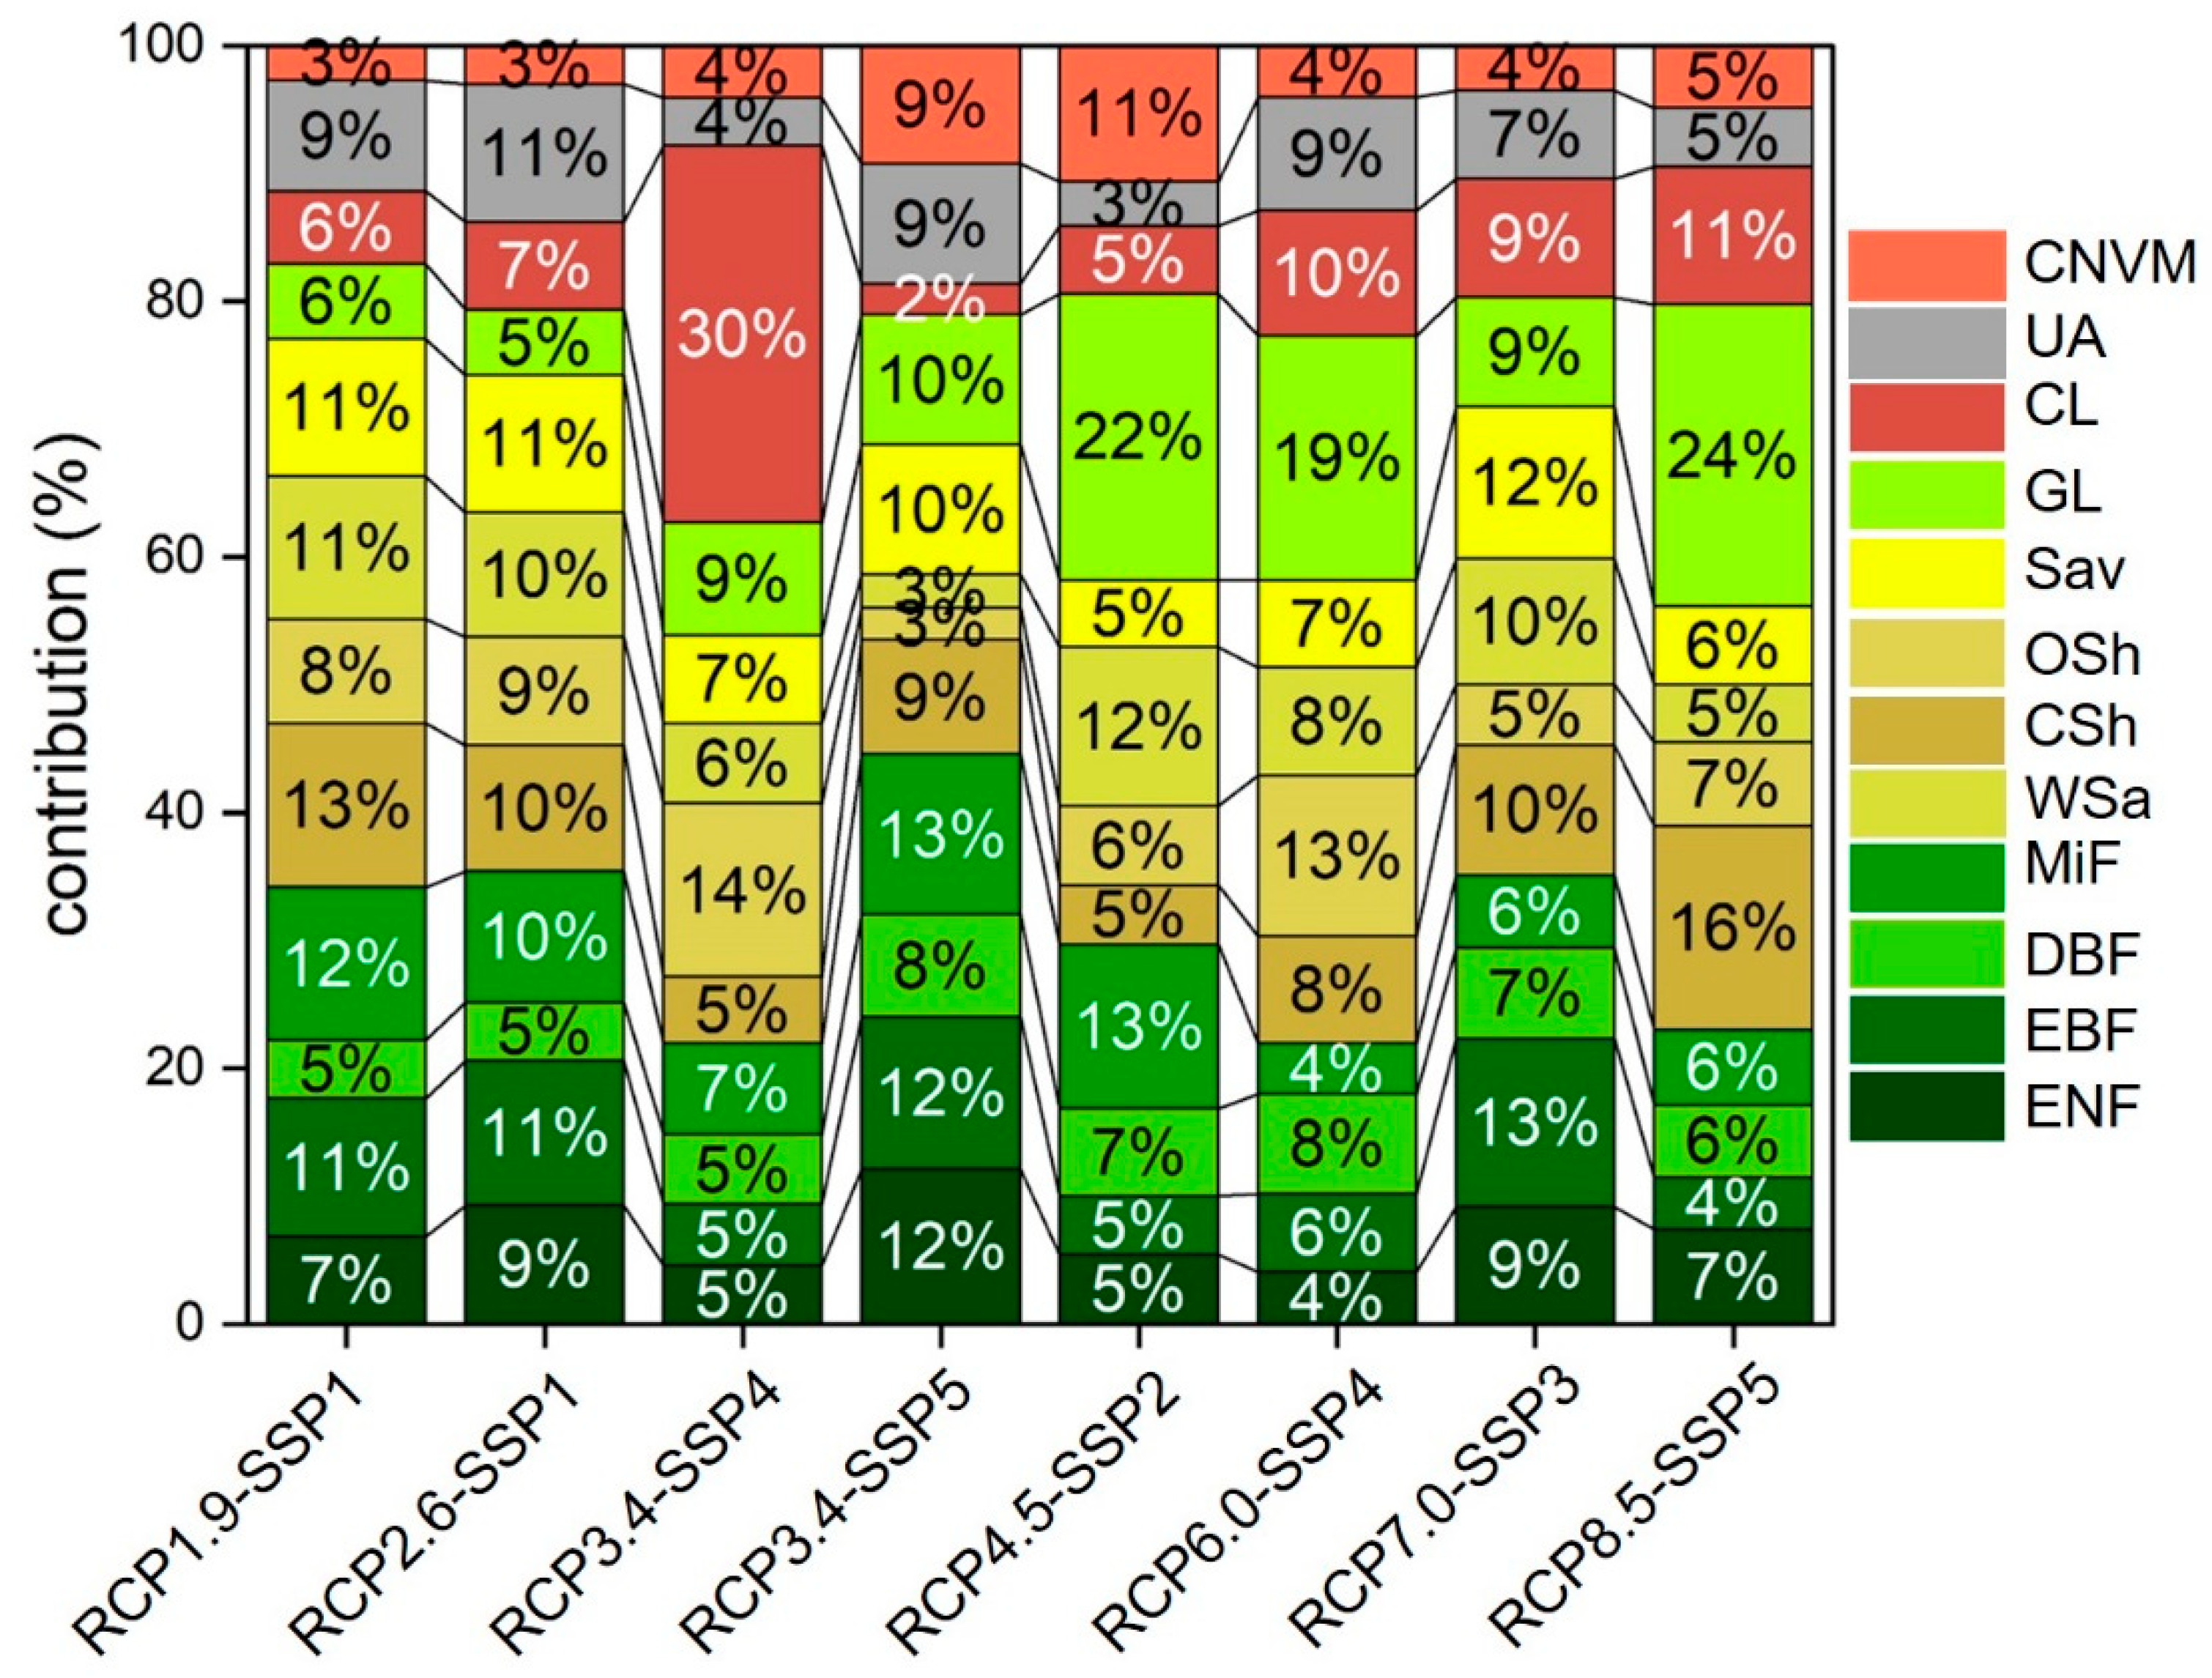
4.2. Seasonal Differences in the Contribution of Land Cover Changes to Vegetation Trends Under Climate Scenarios

We also quantified the contribution of each land cover type to future seasonal NDVI trends (Figure 10, Figure 11, Figure 12 and Figure 13). Forest dominates the vegetation changes for most climate scenarios at the spring, summer, and winter scales, and are equal to Grassland in autumn, which is generally consistent with results obtained at the annual scale. Furthermore, the strongest contribution of Forest to future NDVI trends typically occurs under the RCP3.4-SSP5 and RCP3.4-SSP4 scenarios, while Grasslands make their maximum contribution under the RCP3.4-SSP4 and RCP8.5-SSP5 scenarios. This indicates that the fossil-fueled development pathway (SSP5) and inequality pathway (SSP4) accelerate the dominance of Forest and Grassland over vegetation trends on the Tibetan Plateau. Specifically, in spring, Forest contributions dominated seven scenarios, reaching a maximum of 54% under the low forcing level and fossil-fueled development pathway (RCP3.4-SSP5). Grassland contribution dominates the vegetation trend of one scenario, reaching a maximum of 35% under the low forcing level and inequality pathway (RCP3.4-SSP4) (Figure 10). In summer, six scenarios are dominated by Forest contributions, reaching a maximum of 48% under the low forcing level and inequality pathway (RCP3.4-SSP4). Grassland dominates in three scenarios, accounting for a maximum of 53% under the high forcing level and fossil-fueled development pathway (RCP8.5-SSP5) (Figure 11). During autumn, Forest dominates in four scenarios, with a maximum contribution of 48% under the low forcing level and fossil-fueled development pathway (RCP3.4-SSP5). Grassland also dominates in four scenarios, reaching a maximum of 52% under the high forcing level and fossil-fueled development pathway (RCP8.5-SSP5) (Figure 12). In winter, Forests dominate all scenarios, with a maximum contribution of 55% under the low forcing level and fossil-fueled development pathway (RCP3.4-SSP5) (Figure 13).

4.3. Prospects and Limitations

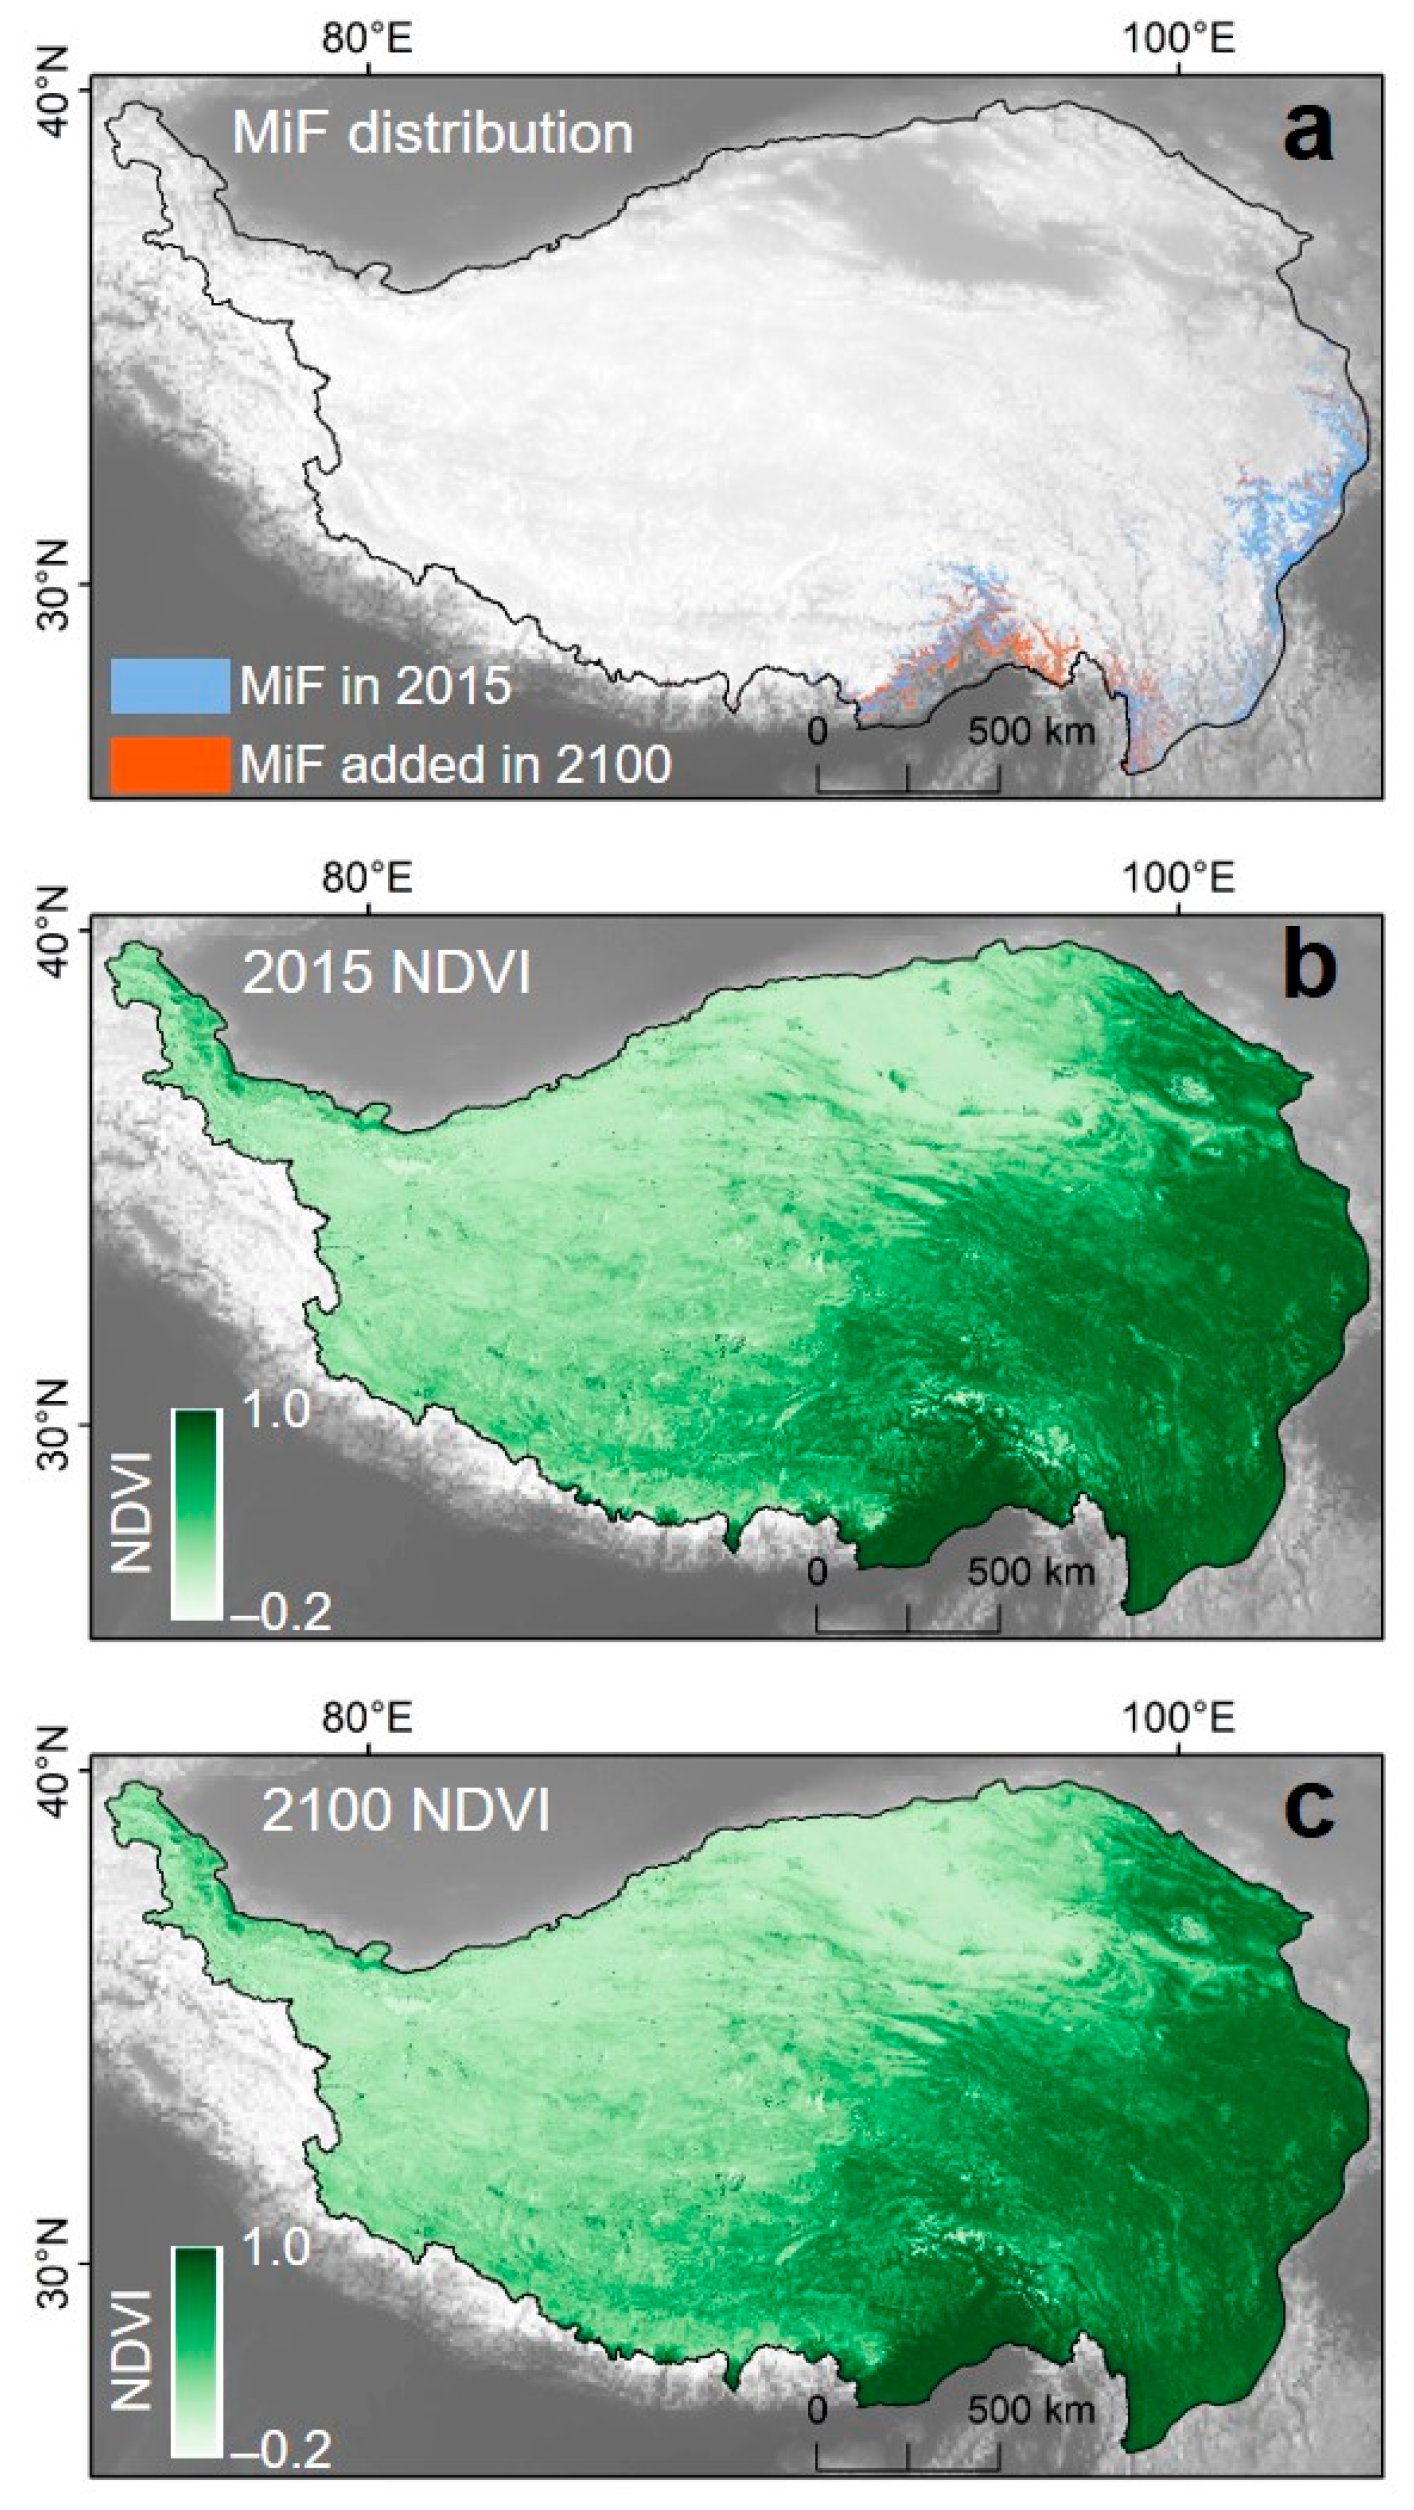
4.3.1. Impact of Mixed Forests on the Vegetation Trends of the Tibetan Plateau

We found that MiF (Mixed Forest) plays a crucial role in predicting annual and seasonal NDVIs, particularly under scenarios such as RCP1.9-SSP1, RCP2.6-SSP1, RCP3.4-SSP5, and RCP4.5-SSP2, where their relative contribution surpasses that of other Forest types (Figure 14). We analyzed the proportional changes in different Forest types from 2015 to 2100. The results revealed that MiF exhibits the most significant growth across all scenarios (Table 4). For instance, under the RCP3.4-SSP5 scenario, where the relative contribution of MiF is most pronounced at 13% (Figure 8), Figure 14a illustrates that the majority of MiF expansion by 2100 (shown in orange areas) occurs predominantly in the southeastern Tibetan Plateau. These regions benefit from abundant water and heat, which promote lush vegetation growth. High NDVI values for both 2015 and the projected 2100 are concentrated in these areas (Figure 14b,c). The substantial expansion of MiF and its consistently high NDVI values together contribute to its dominant role in most scenarios. Additionally, numerous studies suggest that both historical and future climate warming are key factors driving the growth of MiF on the Tibetan Plateau [36,37].

4.3.2. Implications for Ecological Research on the Tibetan Plateau

The major findings of this study underscore the relationship between land cover changes and vegetation dynamics on the Tibetan Plateau. Firstly, the expansion of Grasslands and Mixed Forests suggests potential shifts in ecosystem services such as carbon sequestration and water regulation, as demonstrated by Piao et al. (2015), who showed how vegetation growth can influence the local climate through increased evapotranspiration, affecting water regulation and potentially sequestering carbon [38]. Secondly, the varied vegetation trends under different climate scenarios indicate the sensitivity of the Tibetan Plateau’s ecology to global changes, a point emphasized in [21], which provides an overview of how the Tibetan Plateau’s ecology is sensitive to global changes, with specific implications for vegetation trends under different climate scenarios. Thirdly, the significant control of Forests over vegetation trends highlights the importance of Forest conservation in climate adaptation strategies, a notion supported by [22], who discuss the role of Forests in climate adaptation strategies, emphasizing the need for conservation efforts in the face of changing global conditions. Future research should aim to disentangle the direct and indirect effects of these changes on biodiversity and ecosystem resilience, while also considering the socioeconomic drivers influencing land-use decisions in the region. This will inform more holistic management approaches that address ecological sustainability on the Tibetan Plateau.
The seasonal patterns of vegetation changes on the Tibetan Plateau, as illustrated in Figure 9, reveal significant differences across climate scenarios. These variations indicate that vegetation responses are not uniform throughout the year, with distinct growth trends observed in spring, summer, autumn, and winter. For instance, the greening trend is most pronounced in summer, suggesting that warmer temperatures and increased sunlight during this period enhance the photosynthetic activity. Conversely, winter shows a decline in vegetation, likely due to harsh climatic conditions, which can lead to reduced biomass and biodiversity. These seasonal dynamics have profound ecological implications. Seasonal fluctuations can affect habitat availability for wildlife, alter nutrient cycling, and influence water retention in the soil. For example, the timing and intensity of vegetation growth can impact herbivore populations and their grazing patterns. Additionally, changes in the vegetation phenology can affect carbon storage and release, influencing local and regional climate patterns. Understanding these seasonal variations is crucial for predicting ecosystem responses to climate change and for developing effective conservation strategies.

4.3.3. Limitations of the Used Data and Methods

The study, while comprehensive, has certain limitations. The data relied on MODIS and future land cover products and vegetation products, which, despite their widespread use, may have inherent inaccuracies in representing the complex Tibetan Plateau environment. While the MODIS data significantly mitigate the impact of cloud cover on the Tibetan Plateau due to their high temporal resolution, the spatial resolution is relatively coarse compared to the Landsat data, which makes it less effective in capturing surface vegetation change signals. Therefore, integrating the high spatial resolution of Landsat data with the superior temporal resolution of MODIS data is an important direction for future research [39]. This approach could more accurately assess vegetation dynamics on the Tibetan Plateau. Future land cover products are derived solely from assumptions about climate, economic, and technological developments under future scenarios, which carry inherent uncertainties. The method of estimating future NDVI values based on historical data assumes that vegetation states remain consistent across different land cover types, an assumption that may not be entirely robust given the dynamic nature of ecosystems. Additionally, the use of a multivariate linear model to quantify the contributions of land cover types may oversimplify the complex interactions between vegetation and land cover factors. The study acknowledges that these approaches provide approximate estimates rather than precise quantifications of future vegetation dynamics, suggesting a need for more nuanced models and data sources to better predict the impacts of land cover changes on the Tibetan Plateau vegetation.

5. Conclusions

This study reveals the significant influence of future land cover changes on vegetation trends in the Tibetan Plateau. Our findings highlight the following key points: (1) Grasslands dominate the Tibetan Plateau, and Grasslands are projected to expand by 4.13%, while Mixed Forest is expected to increase by 1.25%. (2) Vegetation trends due to land cover changes from 2015 to 2100 exhibit the following four patterns: greening, browning followed by greening, fluctuation, and browning, with greening being the most widespread. (3) Forests significantly drive the vegetation trends of all scenarios at the annual and season scales, particularly under scenarios of fossil-fueled development (SSP5) and inequality (SSP4), where they and Grasslands exert a more pronounced influence. This research deepens our understanding of the interplay between land cover changes and vegetation dynamics on the Tibetan Plateau, informing regional land management and ecological conservation strategies.

Author Contributions

Conceptualization, F.W. and Y.M.; methodology, F.W.; manuscript, F.W. and Y.M.; funding acquisition, Y.M. Writing—review and editing, F.W. and Y.M. All authors have read and agreed to the published version of the manuscript.

Funding

This research was funded by the National Natural Science Foundation of China (grant numbers 42230610 and U2442213), and the Second Tibetan Plateau Scientific Expedition and Research (STEP) program (grant number 2019QZKK0103).

Data Availability Statement

The original contributions presented in the study are included in the article, further inquiries can be directed to the corresponding author.

Acknowledgments

The authors would like to acknowledge all of the members of the Land–Atmosphere Interaction and its Climatic Effects Group.

Conflicts of Interest

The authors declare no conflicts of interest.

References

  1. Zhong, L.; Ma, Y.; Xue, Y.; Piao, S. Climate Change Trends and Impacts on Vegetation Greening Over the Tibetan Plateau. J. Geophys. Res. Atmos. 2019, 124, 7540–7552. [Google Scholar] [CrossRef]
  2. Shen, M.; Piao, S.; Jeong, S.-J.; Zhou, L.; Zeng, Z.; Ciais, P.; Chen, D.; Huang, M.; Jin, C.-S.; Li, L.Z.X.; et al. Evaporative Cooling over the Tibetan Plateau Induced by Vegetation Growth. Proc. Natl. Acad. Sci. USA 2015, 112, 9299–9304. [Google Scholar] [CrossRef]
  3. Wang, Y.; Xiao, J.; Ma, Y.; Ding, J.; Chen, X.; Ding, Z.; Luo, Y. Persistent and Enhanced Carbon Sequestration Capacity of Alpine Grasslands on Earth’s Third Pole. Sci. Adv. 2023, 9, eade6875. [Google Scholar] [CrossRef] [PubMed]
  4. Wang, Y.; Ma, Y.; Li, H.; Yuan, L. Carbon and Water Fluxes and Their Coupling in an Alpine Meadow Ecosystem on the Northeastern Tibetan Plateau. Theor. Appl. Climatol. 2020, 142, 1–18. [Google Scholar] [CrossRef]
  5. Tian, L.; Zhang, Y.; Zhu, J. Decreased Surface Albedo Driven by Denser Vegetation on the Tibetan Plateau. Environ. Res. Lett. 2014, 9, 104001. [Google Scholar] [CrossRef]
  6. Liu, J.; Lu, Y. How Well Do CMIP6 Models Simulate the Greening of the Tibetan Plateau? Remote Sens. 2022, 14, 4633. [Google Scholar] [CrossRef]
  7. Zhou, D.; Fan, G.; Huang, R.; Fang, Z.; Liu, Y.; Li, H. Interannual Variability of the Normalized Difference Vegetation Index on the Tibetan Plateau and Its Relationship with Climate Change. Adv. Atmos. Sci. 2007, 24, 474–484. [Google Scholar] [CrossRef]
  8. Zou, F.; Li, H.; Hu, Q. Responses of Vegetation Greening and Land Surface Temperature Variations to Global Warming on the Qinghai-Tibetan Plateau, 2001–2016. Ecol. Indic. 2020, 119, 106867. [Google Scholar] [CrossRef]
  9. Huang, Y.; Xin, Z.; Dor-ji, T.; Wang, Y. Tibetan Plateau Greening Driven by Warming-Wetting Climate Change and Ecological Restoration in the 21st Century. Land Degrad. Dev. 2022, 33, 2407–2422. [Google Scholar] [CrossRef]
  10. Pan, T.; Zou, X.; Liu, Y.; Wu, S.; He, G. Contributions of Climatic and Non-Climatic Drivers to Grassland Variations on the Tibetan Plateau. Ecol. Eng. 2017, 108, 307–317. [Google Scholar] [CrossRef]
  11. Huang, X.; Zhang, T.; Yi, G.; He, D.; Zhou, X.; Li, J.; Bie, X.; Miao, J. Dynamic Changes of NDVI in the Growing Season of the Tibetan Plateau During the Past 17 Years and Its Response to Climate Change. Int. J. Environ. Res. Public Health 2019, 16, 3452. [Google Scholar] [CrossRef] [PubMed]
  12. Hua, T.; Wang, X. Temporal and Spatial Variations in the Climate Controls of Vegetation Dynamics on the Tibetan Plateau during 1982–2011. Adv. Atmos. Sci. 2018, 35, 1337–1346. [Google Scholar] [CrossRef]
  13. Liu, L.; Wang, Y.; Wang, Z.; Li, D.; Zhang, Y.; Qin, D.; Li, S. Elevation-Dependent Decline in Vegetation Greening Rate Driven by Increasing Dryness Based on Three Satellite NDVI Datasets on the Tibetan Plateau. Ecol. Indic. 2019, 107, 105569. [Google Scholar] [CrossRef]
  14. Zheng, Z.; Zhu, W.; Zhang, Y. Seasonally and Spatially Varied Controls of Climatic Factors on Net Primary Productivity in Alpine Grasslands on the Tibetan Plateau. Glob. Ecol. Conserv. 2020, 21, e00814. [Google Scholar] [CrossRef]
  15. Dong, Q.-M.; Zhao, X.-Q.; Wu, G.-L.; Shi, J.-J.; Ren, G.-H. A Review of Formation Mechanism and Restoration Measures of “Black-Soil-Type” Degraded Grassland in the Qinghai-Tibetan Plateau. Environ. Earth Sci. 2013, 70, 2359–2370. [Google Scholar] [CrossRef]
  16. Davidson, A.D.; Detling, J.K.; Brown, J.H. Ecological Roles and Conservation Challenges of Social, Burrowing, Herbivorous Mammals in the World’s Grasslands. Front. Ecol. Environ. 2012, 10, 477–486. [Google Scholar] [CrossRef]
  17. Cui, X.; Graf, H.-F. Recent Land Cover Changes on the Tibetan Plateau: A Review. Clim. Change 2009, 94, 47–61. [Google Scholar] [CrossRef]
  18. Wang, C.; Gao, Q.; Yu, M. Quantifying Trends of Land Change in Qinghai-Tibet Plateau during 2001–2015. Remote Sens. 2019, 11, 2435. [Google Scholar] [CrossRef]
  19. Fan, Z.; Bai, X. Scenarios of Potential Vegetation Distribution in the Different Gradient Zones of Qinghai-Tibet Plateau under Future Climate Change. Sci. Total Environ. 2021, 796, 148918. [Google Scholar] [CrossRef]
  20. Meng, N.; Yang, Y.; Zheng, H.; Li, R. Climate Change Indirectly Enhances Sandstorm Prevention Services by Altering Ecosystem Patterns on the Qinghai-Tibet Plateau. J. Mt. Sci. 2021, 18, 1711–1724. [Google Scholar] [CrossRef]
  21. Zhang, R.H.; Su, F.G.; Jiang, Z.H.; Gao, X.J.; Guo, D.L.; Ni, J.; You, Q.L.; Lan, C.; Zhou, B.T. An Overview of Projected Climate and Environmental Changes across the Tibetan Plateau in the 21st Century. Chin. Sci. Bull. 2015, 60, 3036–3047. [Google Scholar]
  22. Zhao, Q.; Zhu, Z.; Zeng, H.; Zhao, W.; Myneni, R.B. Future Greening of the Earth May Not Be as Large as Previously Predicted. Agric. For. Meteorol. 2020, 292–293, 108111. [Google Scholar] [CrossRef]
  23. Latif, A.; Ilyas, S.; Zhang, Y.; Xin, Y.; Zhou, L.; Zhou, Q. Review on Global Change Status and Its Impacts on the Tibetan Plateau Environment. J. Plant Ecol. 2019, 12, 917–930. [Google Scholar] [CrossRef]
  24. Wang, X.; Zheng, D.; Shen, Y. Land Use Change and Its Driving Forces on the Tibetan Plateau during 1990–2000. CATENA 2008, 72, 56–66. [Google Scholar] [CrossRef]
  25. Pan, Y.; Li, X.; Wang, D.; Li, S.; Wen, L. Impacts of Land Use/Land Cover Distributions on Permafrost Simulations on Tibetan Plateau. Remote Sens. 2023, 15, 5586. [Google Scholar] [CrossRef]
  26. Wang, F.; Ma, Y.; Darvishzadeh, R.; Han, C. Annual and Seasonal Trends of Vegetation Responses and Feedback to Temperature on the Tibetan Plateau since the 1980s. Remote Sens. 2023, 15, 2475. [Google Scholar] [CrossRef]
  27. Hou, H.; Zhou, B.-B.; Pei, F.; Hu, G.; Su, Z.; Zeng, Y.; Zhang, H.; Gao, Y.; Luo, M.; Li, X. Future Land Use/Land Cover Change Has Nontrivial and Potentially Dominant Impact on Global Gross Primary Productivity. Earth’s Future 2022, 10, e2021EF002628. [Google Scholar] [CrossRef]
  28. Van Vuuren, D.P.; Edmonds, J.; Kainuma, M.; Riahi, K.; Thomson, A.; Hibbard, K.; Hurtt, G.C.; Kram, T.; Krey, V.; La-marque, J.-F.; et al. The Representative Concentration Pathways: An Overview. Clim. Change 2011, 109, 5–31. [Google Scholar] [CrossRef]
  29. O’Neill, B.C.; Tebaldi, C.; Van Vuuren, D.P.; Eyring, V.; Friedlingstein, P.; Hurtt, G.; Knutti, R.; Kriegler, E.; Lamarque, J.-F.; Lowe, J.; et al. The Scenario Model Intercomparison Project (ScenarioMIP) for CMIP6. Geosci. Model Dev. 2016, 9, 3461–3482. [Google Scholar] [CrossRef]
  30. Riahi, K.; Van Vuuren, D.P.; Kriegler, E.; Edmonds, J.; O’Neill, B.C.; Fujimori, S.; Bauer, N.; Calvin, K.; Dellink, R.; Fricko, O.; et al. The Shared Socioeconomic Pathways and Their Energy, Land Use, and Greenhouse Gas Emissions Implications: An Overview. Glob. Environ. Change 2017, 42, 153–168. [Google Scholar] [CrossRef]
  31. Van Vuuren, D.P.; Kriegler, E.; O’Neill, B.C.; Ebi, K.L.; Riahi, K.; Carter, T.R.; Edmonds, J.; Hallegatte, S.; Kram, T.; Mathur, R.; et al. A New Scenario Framework for Climate Change Research: Scenario Matrix Architecture. Clim. Change 2014, 122, 373–386. [Google Scholar] [CrossRef]
  32. Holben, B.N. Characteristics of Maximum-Value Composite Images from Temporal AVHRR Data. Int. J. Remote Sens. 1986, 7, 1417–1434. [Google Scholar] [CrossRef]
  33. Dang, Y.; He, H.; Zhao, D.; Sunde, M.; Du, H. Quantifying the Relative Importance of Climate Change and Human Activities on Selected Wetland Ecosystems in China. Sustainability 2020, 12, 912. [Google Scholar] [CrossRef]
  34. Rezaei, E.E.; Ghazaryan, G.; Moradi, R.; Dubovyk, O.; Siebert, S. Crop Harvested Area, Not Yield, Drives Variability in Crop Production in Iran. Environ. Res. Lett. 2021, 16, 064058. [Google Scholar] [CrossRef]
  35. Singh, K.K.; Bianchetti, R.A.; Chen, G.; Meentemeyer, R.K. Assessing Effect of Dominant Land-Cover Types and Pattern on Urban Forest Biomass Estimated Using LiDAR Metrics. Urban Ecosyst. 2017, 20, 265–275. [Google Scholar] [CrossRef]
  36. Zhao, D.; Wu, S.; Yin, Y.; Yin, Z.-Y. Vegetation Distribution on Tibetan Plateau under Climate Change Scenario. Reg. Environ. Change 2011, 11, 905–915. [Google Scholar] [CrossRef]
  37. Li, T.; Peng, J.; Au, T.F.; Li, J.; Li, J.; Zhang, Y. Dendroclimatological Study of Sabina Saltuaria and Abies Faxoniana in the Mixed Forests of the Qionglai Mountains, Eastern Tibetan Plateau. J. For. Res. 2024, 35, 20. [Google Scholar] [CrossRef]
  38. Piao, S.; Yin, G.; Tan, J.; Cheng, L.; Huang, M.; Li, Y.; Liu, R.; Mao, J.; Myneni, R.B.; Peng, S.; et al. Detection and Attribution of Vegetation Greening Trend in China over the Last 30 Years. Glob. Change Biol. 2015, 21, 1601–1609. [Google Scholar] [CrossRef]
  39. Liu, Y.; Lu, H.; Tian, P.; Qiu, L. Evaluating the Effects of Dams and Meteorological Variables on Riparian Vegetation NDVI in the Tibetan Plateau. Sci. Total Environ. 2022, 831, 154933. [Google Scholar] [CrossRef]
Figure 1. Land cover on the Tibetan Plateau. ENF, EBF, DBF, MiF, WSa, CSh, OSh, Sav, GL, CL, UA, CNVM, BSV, WB, and PSI refer to Evergreen Needleleaf Forest, Evergreen Broadleaf Forest, Deciduous Needleleaf Forest, Deciduous Broadleaf Forest, Mixed Forest, Woody Savanna, Closed Shrubland, Open Shrubland, Savanna, Grassland, Cropland, Urban and Built-up Land, Cropland/Natural Vegetation Mosaic, Barren or Sparsely Vegetated Land, Water Bodies, Barren, and Permanent Snow and Ice, respectively.
Remotesensing 16 04558 g001
Figure 2. A framework for investigating the impacts of future land cover change on vegetation changes. Step 1 for the past NDVI estimation, Step 2 for the future NDVI estimation, and Step 3 for quantifying the contribution of land cover to future NDVI trends.
Remotesensing 16 04558 g002
Figure 3. Annual and seasonal composite NDVIs for 2003~2015. (ae), which include the composite NDVI for annual, spring, summer, autumn, and winter, respectively.
Remotesensing 16 04558 g003
Figure 4. Trends of 2015–2100 in land cover change on the Tibetan Plateau under different climate scenarios—I. ENF, EBF, DBF, MiF, WSa, CSh, OSh, Sav, GL, CL, UA, CNVM, and BSV refer to Evergreen Needleleaf Forest, Evergreen Broadleaf Forest, Deciduous Needleleaf Forest, Deciduous Broadleaf Forest, Mixed Forest, Woody Savanna, Closed Shrubland, Open Shrubland, Savanna, Grassland, Cropland, Urban and Built-up Land, Cropland/Natural Vegetation Mosaic, and Barren, respectively. (ad) The land cover changes in 2015~2100 for RCP1.9-SSP1 (extremely low forcing scenario and sustainability), RCP2.6-SSP1 (low forcing scenario and sustainability), RCP3.4-SSP4 (low forcing scenario and inequality), and RCP3.4-SSP5 (low forcing scenario and fossil-fueled development), respectively.
Remotesensing 16 04558 g004
Figure 5. Trends of 2015–2100 in land cover change on the Tibetan Plateau under different climate scenarios—II. ENF, EBF, DBF, MiF, WSa, CSh, OSh, Sav, GL, CL, UA, CNVM, and BSV refer to Evergreen Needleleaf Forest, Evergreen Broadleaf Forest, Deciduous Needleleaf Forest, Deciduous Broadleaf Forest, Mixed Forest, Woody Savanna, Closed Shrubland, Open Shrubland, Savanna, Grassland, Cropland, Urban and Built-up Land, Cropland/Natural Vegetation Mosaic, and Barren, respectively. (ad) The land cover changes in 2015~2100 for RCP4.5-SSP2 (medium forcing scenario and middle of the road), RCP6.0-SSP4 (medium forcing scenario and inequality), RCP7.0-SSP3 (medium-to-high forcing scenario and regional rivalry), and RCP8.0-SSP5 (high forcing scenario and fossil-fueled development), respectively.
Remotesensing 16 04558 g005
Figure 6. Changes in 2015–2100 in land cover and its driven annual NDVI on the Tibetan Plateau under different climate scenarios. ENF, EBF, DBF, MiF, WSa, CSh, OSh, Sav, GL, CL, UA, CNVM, and BSV refer to Evergreen Needleleaf Forest, Evergreen Broadleaf Forest, Deciduous Needleleaf Forest, Deciduous Broadleaf Forest, Mixed Forest, Woody Savanna, Closed Shrubland, Open Shrubland, Savanna, Grassland, Cropland, Urban and Built-up Land, Cropland/Natural Vegetation Mosaic, and Barren or Sparsely Vegetated Land, respectively. (a,d) The land cover types under eight climate scenarios for the years 2015 and 2100, respectively. (b,c) The NDVI values under eight climate scenarios for the years 2015 and 2100, respectively.
Remotesensing 16 04558 g006
Figure 7. Vegetation trends due to land cover changes under different climate scenarios.
Remotesensing 16 04558 g007
Figure 8. Contributions of land cover change to annual NDVI values under different climate scenarios. ENF, EBF, DBF, MiF, WSa, CSh, OSh, Sav, GL, CL, UA, and CNVM refer to Evergreen Needleleaf Forest, Evergreen Broadleaf Forest, Deciduous Needleleaf Forest, Deciduous Broadleaf Forest, Mixed Forest, Woody Savanna, Closed Shrubland, Open Shrubland, Savanna, Grassland, Cropland, Urban and Built-up Land, and Cropland/Natural Vegetation Mosaic, respectively.
Remotesensing 16 04558 g008
Figure 9. Land cover-driven seasonal trends of 2015~2100 in NDVI values under different scenarios. (ad) The NDVI trends of 2015~2100 for spring, summer, autumn, and winter, respectively.
Remotesensing 16 04558 g009
Figure 10. Contributions of land cover change to spring NDVI values under different climate scenarios. ENF, EBF, DBF, MiF, WSa, CSh, OSh, Sav, GL, CL, UA, and CNVM refer to Evergreen Needleleaf Forest, Evergreen Broadleaf Forest, Deciduous Needleleaf Forest, Deciduous Broadleaf Forest, Mixed Forest, Woody Savanna, Closed Shrubland, Open Shrubland, Savanna, Grassland, Cropland, Urban and Built-up Land, and Cropland/Natural Vegetation Mosaic, respectively.
Remotesensing 16 04558 g010
Figure 11. Contributions of land cover change to summer NDVI values under different climate scenarios. ENF, EBF, DBF, MiF, WSa, CSh, OSh, Sav, GL, CL, UA, and CNVM refer to Evergreen Needleleaf Forest, Evergreen Broadleaf Forest, Deciduous Needleleaf Forest, Deciduous Broadleaf Forest, Mixed Forest, Woody Savanna, Closed Shrubland, Open Shrubland, Savanna, Grassland, Cropland, Urban and Built-up Land, and Cropland/Natural Vegetation Mosaic, respectively.
Remotesensing 16 04558 g011
Figure 12. Contributions of land cover change to autumn NDVI values under different climate scenarios. ENF, EBF, DBF, MiF, WSa, CSh, OSh, Sav, GL, CL, UA, and CNVM refer to Evergreen Needleleaf Forest, Evergreen Broadleaf Forest, Deciduous Needleleaf Forest, Deciduous Broadleaf Forest, Mixed Forest, Woody Savanna, Closed Shrubland, Open Shrubland, Savanna, Grassland, Cropland, Urban and Built-up Land, and Cropland/Natural Vegetation Mosaic, respectively.
Remotesensing 16 04558 g012
Figure 13. Contributions of land cover change to winter NDVI values under different climate scenarios. ENF, EBF, DBF, MiF, WSa, CSh, OSh, Sav, GL, CL, UA, and CNVM refer to Evergreen Needleleaf Forest, Evergreen Broadleaf Forest, Deciduous Needleleaf Forest, Deciduous Broadleaf Forest, Mixed Forest, Woody Savanna, Closed Shrubland, Open Shrubland, Savanna, Grassland, Cropland, Urban and Built-up Land, and Cropland/Natural Vegetation Mosaic, respectively.
Remotesensing 16 04558 g013
Figure 14. The 2015 and 2100 Mixed Forest and NDVI distribution on the Tibetan Plateau under the RCP3.4-SSP5 scenario. (a) The MiF (Mixed Forest) change from 2015 to 2100. (b,c) The NDVI values for 2015 and 2100, respectively.
Remotesensing 16 04558 g014
Table 1. Land cover and vegetation data used in this study.
ParameterDatasetSpatial
Resolution
Temporal ResolutionDownload Links
Land coverMCD12Q1500 mYearlyhttps://lpdaac.usgs.gov/products/mcd12q1v061, accessed on 1 December 2024
Future land coverGlobal IGBP LULC projection dataset under eight SSPs-RCPs1000 m5-yearhttps://doi.org/10.6084/m9.figshare.20088368.v1, accessed on 1 December 2024
NDVIMOD13A21000 m16 dayshttps://lpdaac.usgs.gov/products/mod13a2v061, accessed on 1 December 2024
Table 2. Land cover types based on the IGBP classification and their broad categories.
IGBP CodeIGBP ClassBroad Category
1Evergreen Needleleaf Forest (ENF)Forest
2Evergreen Broadleaf Forest (EBF)
3Deciduous Needleleaf Forest (DNF)
4Deciduous Broadleaf Forest (DBF)
5Mixed Forest (MiF)
8Woody Savanna (WSa)
6Closed Shrubland (CSh)Grassland
7Open Shrubland (OSh)
9Savanna (Sav)
10Grassland (GL)
12Cropland (CL)Agriculture
14Cropland/Natural Vegetation Mosaic (CNVM)
13Urban and Built-up Land (UA)Urban land
16Barren or Sparsely Vegetated Land (BSV)Barren land
11Permanent WetlandIce and water
15Snow and Ice
17Water Bodies
Table 3. Eight climate scenarios for future land cover data.
Climate ScenariosRepresentative Concentration Pathways (RCPs)Shared Socioeconomic Pathways (SSPs)
RCP1.9-SSP1Extremely low forcing scenario
with radiative forcing stabilized at ~1.9 W/m2 in 2100
Sustainability
RCP2.6-SSP1Low forcing scenario
with radiative forcing stabilized at ~2.6 W/m2 in 2100
Sustainability
RCP3.4-SSP4Low forcing scenario
with radiative forcing stabilized at ~3.4 W/m2 in 2100
Inequality
RCP3.4-SSP5Low forcing scenario
with radiative forcing stabilized at ~3.4 W/m2 in 2100
Fossil-fueled development
RCP4.5-SSP2Medium forcing scenario
with radiative forcing stabilized at ~4.5 W/m2 in 2100
Middle of the road
RCP6.0-SSP4Medium forcing scenario, with radiative forcing stabilized at ~5.4 W/m2 in 2100 and ~6.0 W/m2 after 2100Inequality
RCP7.0-SSP3Medium-to-high forcing scenario
with radiative forcing stabilized at ~7.0 W/m2 in 2100
Regional rivalry
RCP8.5-SSP5High forcing scenario
with radiative forcing stabilized at ~6.0 W/m2 in 2100
Fossil-fueled development
Table 4. Changes in the proportions of different forest types from 2015 to 2100 under eight climate scenarios.
Climate ScenariosENF (%)EBF (%)DBF (%)MiF (%)WSa (%)
RCP8.5-SSP5−1.160.24−0.09−0.04−0.33
RCP7.0-SSP3−1.140.08−0.030.30−0.43
RCP6.0-SSP4−0.940.10−0.150.63−0.31
RCP4.5-SSP2−0.770.18−0.010.35−0.08
RCP3.4-SSP5−1.090.42−0.030.58−0.07
RCP3.4-SSP4−0.270.05−0.220.10−0.90
RCP2.6-SSP1−0.750.16−0.101.511.24
RCP1.9-SSP1−0.530.14−0.061.251.42
Disclaimer/Publisher’s Note: The statements, opinions and data contained in all publications are solely those of the individual author(s) and contributor(s) and not of MDPI and/or the editor(s). MDPI and/or the editor(s) disclaim responsibility for any injury to people or property resulting from any ideas, methods, instructions or products referred to in the content.

