Article

A Planar Feature-Preserving Texture Defragmentation Method for 3D Urban Building Models

1
State Key Laboratory of Information Engineering in Surveying, Mapping and Remote Sensing, Wuhan University, Wuhan 430079, China
2
Wuhan Daspatial Technology Co., Ltd., Wuhan 430223, China
3
Engineering Technology Innovation Center for 3D Real Scene Construction and Urban Refinement Governance of the Ministry of Natural Resources, Wuhan 430223, China
4
Intellectual Computing Laboratory for Cultural Heritage, Wuhan University, Wuhan 430072, China
5
Department of Civil Engineering, Engineering College, Northern Border University, Arar 91431, Saudi Arabia
*
Author to whom correspondence should be addressed.
Remote Sens. 2024, 16(22), 4154; https://doi.org/10.3390/rs16224154
Submission received: 29 September 2024 / Revised: 24 October 2024 / Accepted: 4 November 2024 / Published: 7 November 2024

Abstract

:
Oblique photogrammetry-based 3D modeling is widely used for large-scale urban reconstruction. However, textures generated with photogrammetric techniques often exhibit scattered and irregular characteristics, which lead to significant challenges with texture seams and UV map discontinuities, increasing storage requirements and affecting rendering quality. In this paper, we propose a planar feature-preserving texture defragmentation method designed specifically for urban building models. Our approach leverages the multi-planar topology of buildings to optimize texture merging and reduce fragmentation. The proposed approach is composed of three main stages: the extraction of planar features from texture fragments; the employment of these planar elements as guiding constraints for merging adjacent texture fragments within a two-dimensional texture space; and an enhanced texture-packing algorithm designed for more regular texture charts to systematically generate refined texture atlas. Experiments on various urban building models demonstrate that our method significantly improves texture continuity and storage efficiency compared to traditional approaches, with both quantitative and qualitative validation.

1. Introduction

With the rapid development of Multi-View Stereo (MVS) techniques, the use of oblique photogrammetry in producing real-world 3D models has become increasingly widespread due to its capacity to provide highly automated, realistic, and comprehensive representations of real-world features [1]. Photo-reconstructed meshes are enriched with one or multiple high-resolution textures derived from the same set of photographs used to reconstruct the shape, thereby significantly enhancing the fidelity of the models. This process, known as texture reconstruction, involves the calculation and execution of image-to-geometry registration, assigning an image label for each triangle face. However, it is worth noting that the photogrammetric pipeline often lacks full consideration of the continuity between adjacent triangle faces. As a result, the generated texture charts typically exhibit a scattered and irregular nature, leading to fragmented texture atlases with a great number of texture seams [2]. Although texture seams are unavoidable in any real-world 3D model, they gives rise to several challenges [3]. The first one is the increased memory resource consumption. Texture fragmentation poses challenges for texture packing, potentially leading to the inefficient utilization of texture memory space. And the duplication of vertices and texture pixels at texture seams introduces storage redundancies, implying additional costs both in memory and per-vertex workloads. A second issue is related to diminished rendering quality as MIP-mapping exacerbates texture bleeding at texture seams, adversely affecting the visualization quality of the model.
In the study of computer graphics, the main established method for addressing texture fragmentation is mesh parameterization. Mesh parameterization, a widely used texture reconstruction method, segments the model’s surface according to specified guidelines [4,5] to establish a mapping between the 3D model and 2D texture images. It calculates texture coordinates for each triangular face while balancing cut length against texture information loss. Generalized model parameterization remains a persistent research challenge. Some approaches aim to minimize angular distortions [6,7], while isometric parameterization is often utilized to reduce triangle deformation [8,9], and recent strategies emphasize the achievement of global bijectivity [4,10]. However, frequent inaccuracies in the photogrammetric reconstruction result in geometrical noise and meshing defects [11]. Models generated from the photogrammetry pipeline present issues such as small holes, topological inconsistencies, or a lack of manifold consistency [12]. These flaws are especially prominent when dealing with complex building geometries, as point cloud imperfections can lead to inaccuracies during the 3D reconstruction process, often hindering satisfactory parameterization results [13].
Photogrammetric models typically use projection-based methods [14]. This approach leverages the projection transformations between photogrammetric models and multi-view images for texture mapping. However, as previously mentioned, the projection-based method tends to generate a multitude of texture fragments because the model is reconstructed from many different angles. The selection of projection images for triangle faces is influenced by occlusions and face normals, resulting in the discretization of textures [15]. Some studies have addressed the problem of texture fragmentation by optimizing the texture mapping algorithm during model generation, including the addition of constraints for local surface consistency [16] and enhancements to the MRF energy function [17]. However, these methods are limited to adjacent triangular faces and do not offer global feature control. Moreover, they are only applicable during model generation and cannot address the post-processing optimization needs of existing models.
Focusing on buildings within urban scenes is particularly important because buildings are not only a crucial component of urban landscapes but also a primary concern when editing and optimizing city scene models [17]. Although parameterization approaches may not be applicable to photogrammetric models directly, we can derive inspiration from their mesh surface redistribution methods. The traditional defragmentation method for general models [12] focuses on local merges to reduce seams and control deformation, often resulting in random and disorganized texture atlases. However, the shapes of buildings are strictly constrained [18], and preserving their overall shapes is important for the subsequent texture image editing and processing [19]. Acknowledging this, our paper proposes a novel texture fragmentation optimization method based on planar structure. On one hand, this method uses planarity as a constraint to achieve conflict-free merging; on the other hand, it adopts an improved packing approach that is better suited to regular patterns. Consequently, the resulting texture atlas not only retains the planar structure but also improves rendering quality and storage efficiency, thereby expanding the application scenarios of 3D building models.

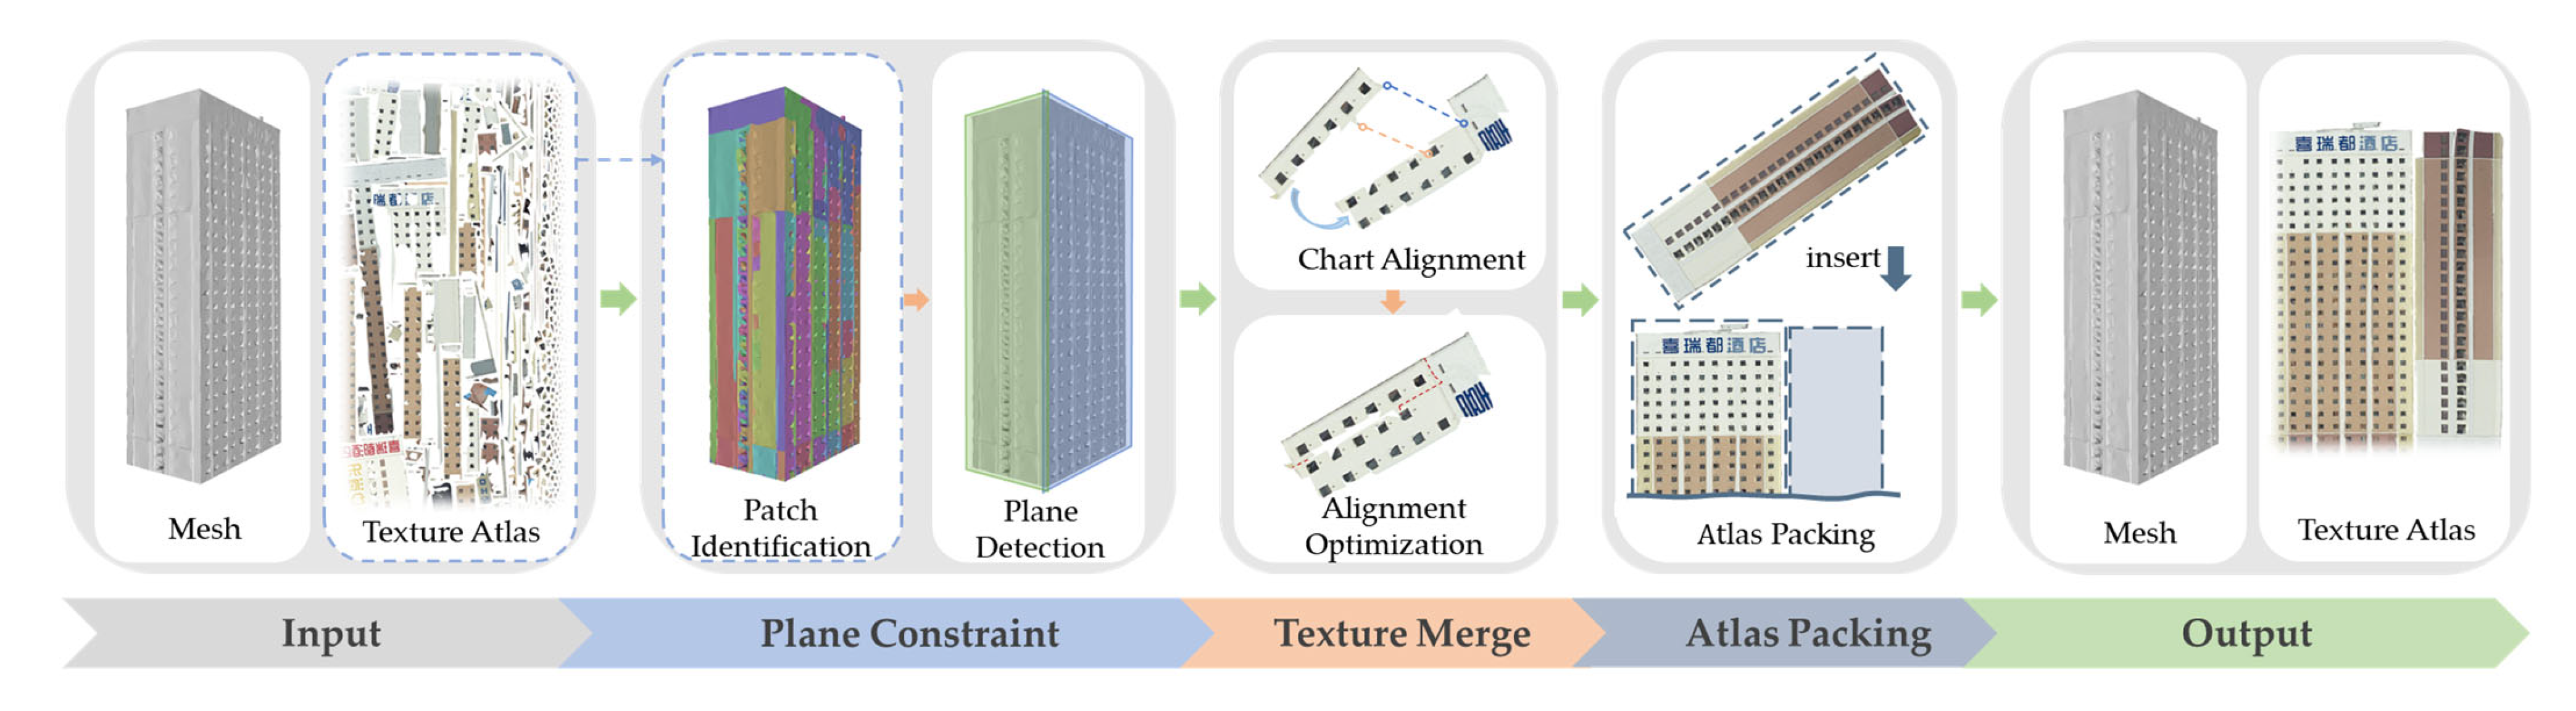
2. Materials and Methods

The texture defragmentation method, taking into account the planar features, is illustrated in Figure 1. The input data were in OBJ format, which is a text-based file format that stores geometric information and texture images separately. This method works in three major steps: (1) Plane Constraint: Based on the composition of texture fragments of the original 3D model consisting of triangular faces, the patch structure is identified and planar features are detected through an enhanced region-growing approach. (2) Texture Merge: Planar features are used as constraints to guide a sequential merge operation. This operation includes the alignment and optimization of chart pairs. The geometric and texture mapping relationships are concurrently updated throughout this process. (3) Atlas Packing: A “Square Tetris-like” layout operation is performed on the merged texture charts in the 2D texture space, enabling the packing of the texture atlas generating the final model.

2.1. Enhanced Planar Feature Detection

2.1.1. Patch Identification

For the texture chart that we are about to handle, the corresponding patches in three-dimensional geometry are identified as more suitable units for planar feature detection than the basic triangular faces of the model. This approach helps maintain the internal coherence of the original texture charts. Moreover, models generated through the photogrammetric pipeline often exhibit patches with more obvious planar attributes [20], which facilitates effective planar detection.
The patches are pinpointed based on the texture coordinate data from the three-dimensional vertices of the model. Intuitively, 3D vertices located at seams are mapped to multiple positions in the 2D image. That is, to avoid discontinuities at seams, the same vertex can be assigned different texture coordinates. A prevalent technique involves using duplicated vertices to store various texture coordinates at the seams [21]. As shown in Figure 2, the vertex V S located at the seam is associated with texture coordinates T S 1 and T S 2 in the 2D texture map, respectively. Therefore, it is feasible to determine whether a triangle vertex is part of a texture seam by checking if it is associated with multiple texture coordinates. Employing this approach allows for the identification of all seams in the model and patches demarcated by these seams.

2.1.2. Patch-Based Region Growing

The region-growing algorithm is employed to discern planar features, iterating over neighboring elements that meet specific growth criteria to form distinct regions [22]. Consequently, this process involves three pivotal issues: which seed point to select, how to define growth conditions, and when to halt growth.
To uphold the integrity of building model textures, detection is conducted at the patch level. The seed for region growing is designated as the patch with the maximum area within the set to be partitioned. The criteria for region growing are typically set based on the angle between the normal vectors of the to-be-partitioned element and the plane formed by the current region growing process, or alternatively, by the maximum distance criteria [23,24]. The specific procedure is outlined as follows:
  • Sort all patches to be partitioned in the global set in descending area order;
  • Choose a patch as the seed, add it to the seed set, remove it from the global set, and simultaneously initialize a new planar region;
  • Expand the region by including adjacent patches that meet angle criteria, simultaneously adding them to the seed set, and removing them from the global set;
  • Select a new seed from the seed set and repeat until no seeds remain;
  • If patches are left unassigned, restart with a new seed.
The inclusion of a patch into a planar region requires evaluating its fitted plane’s properties. Given a three-dimensional point set P = { V 1 , V 2 , , V n } , where V i = { x i , y i , z i } , its covariance matrix C is constructed (see Equation (1)).
C = 1 n 1 i = 1 n x i x ¯ 2 i = 1 n ( x i x ¯ ) ( y i y ¯ ) i = 1 n ( x i x ¯ ) ( z i z ¯ ) i = 1 n ( y i y ¯ ) ( x i x ¯ ) i = 1 n y i y ¯ 2 i = 1 n ( y i y ¯ ) ( z i z ¯ ) i = 1 n ( z i z ¯ ) ( x i x ¯ ) i = 1 n ( z i z ¯ ) ( y i y ¯ ) i = 1 n z i z ¯ 2
Eigenvalue decomposition is performed on the covariance matrix C to obtain eigenvalues σ 1 < σ 2 < σ 3 , and corresponding eigenvectors v 1 , v 2 , v 3 , which reflect the distribution of the point set in three-dimensional space. The direction of eigenvector v 3 represents the direction of maximum variance in the point set distribution. The direction of v 2 is perpendicular to the direction of v 3 and corresponds to the maximum variance direction in the perpendicular direction; its associated eigenvalue to some extent reflects the width of the plane formed by the point set. v 1 , orthogonal to both v 2 and v 3 , serves as the normal vector of the fitted plane. Similarly, the normal vector n of the patch to be partitioned can be obtained, and the angle θ between them can be calculated using Equation (2). The threshold for θ is typically set between 20 and 30 degrees.
θ = a c o s ( v 1 · v 2 / v 1 v 2 )

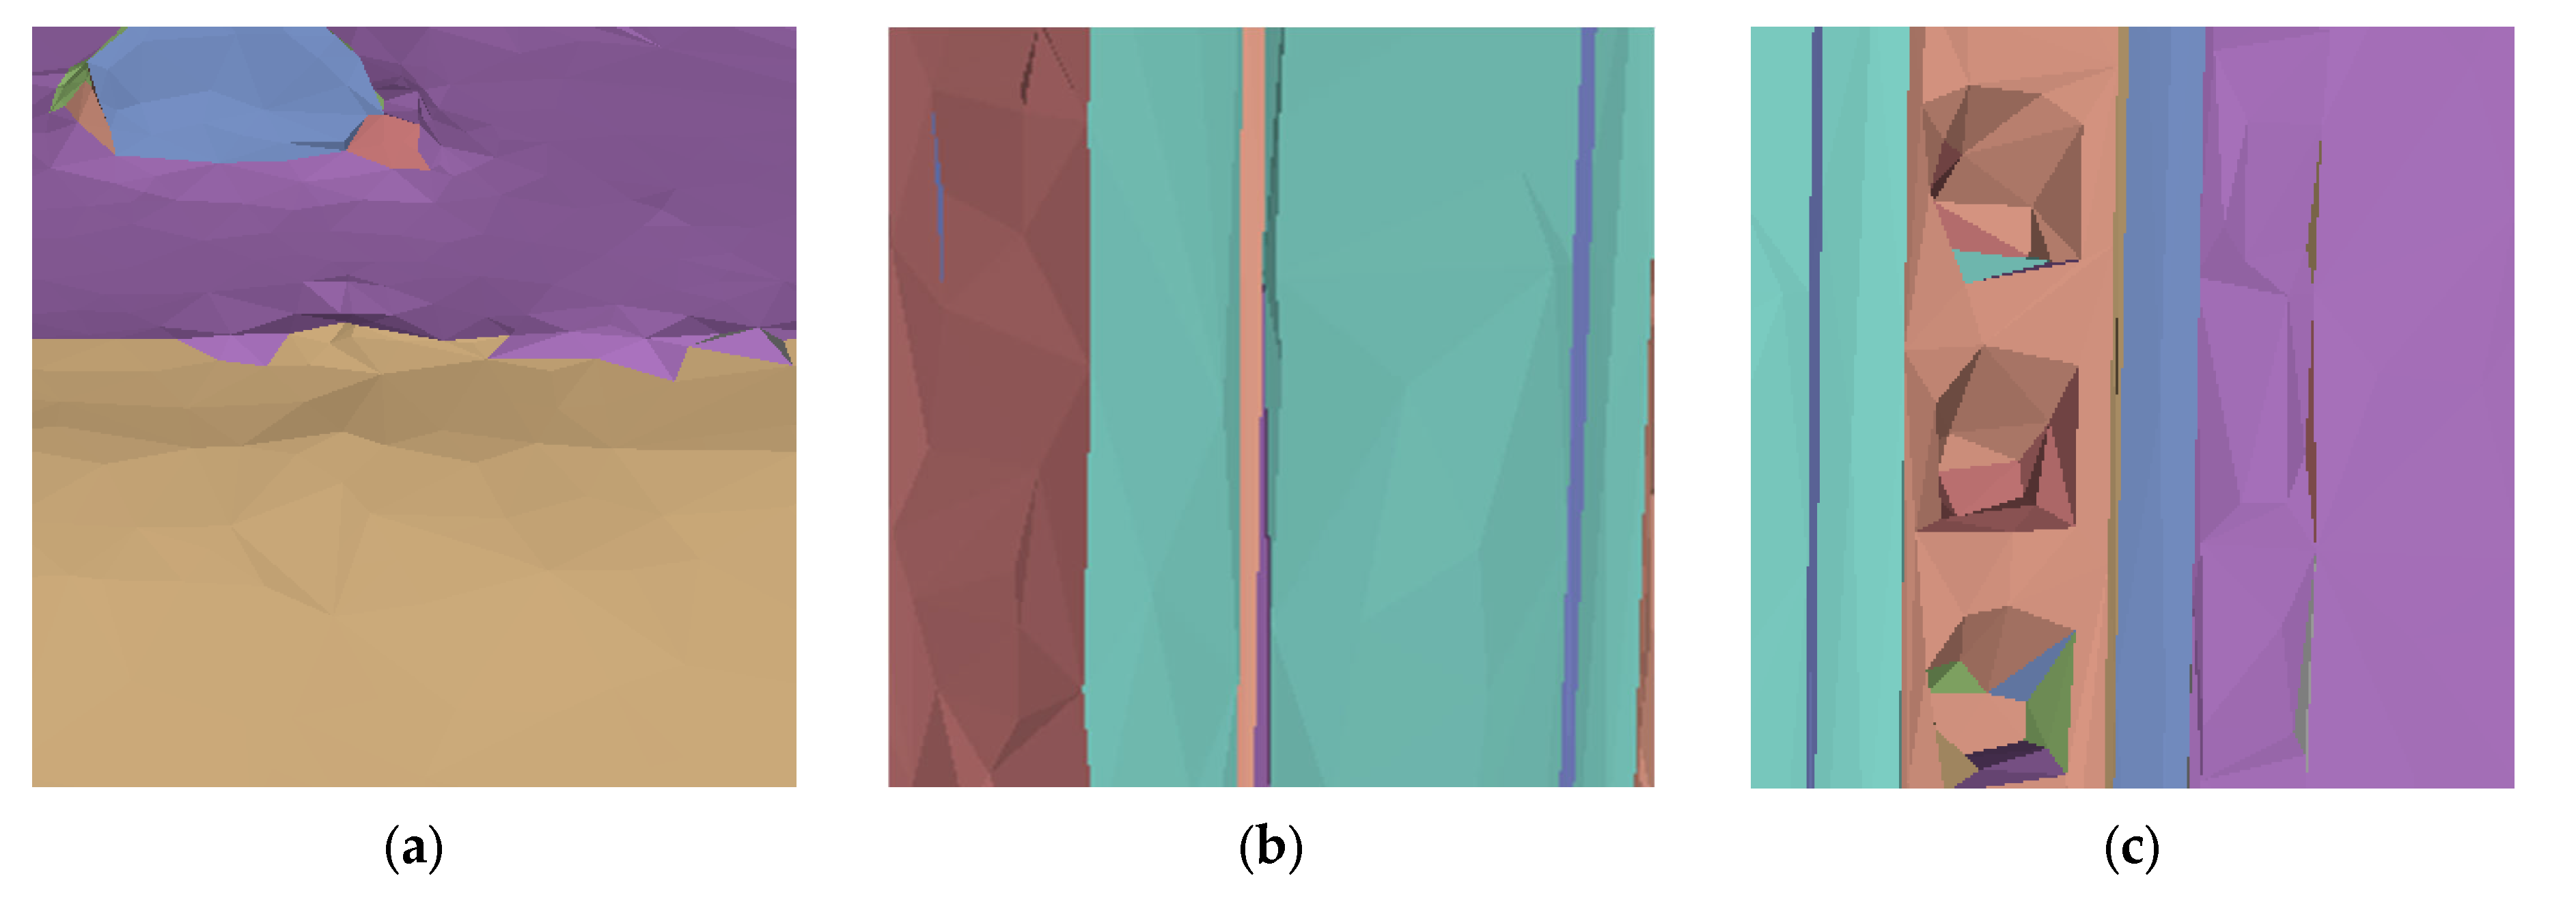
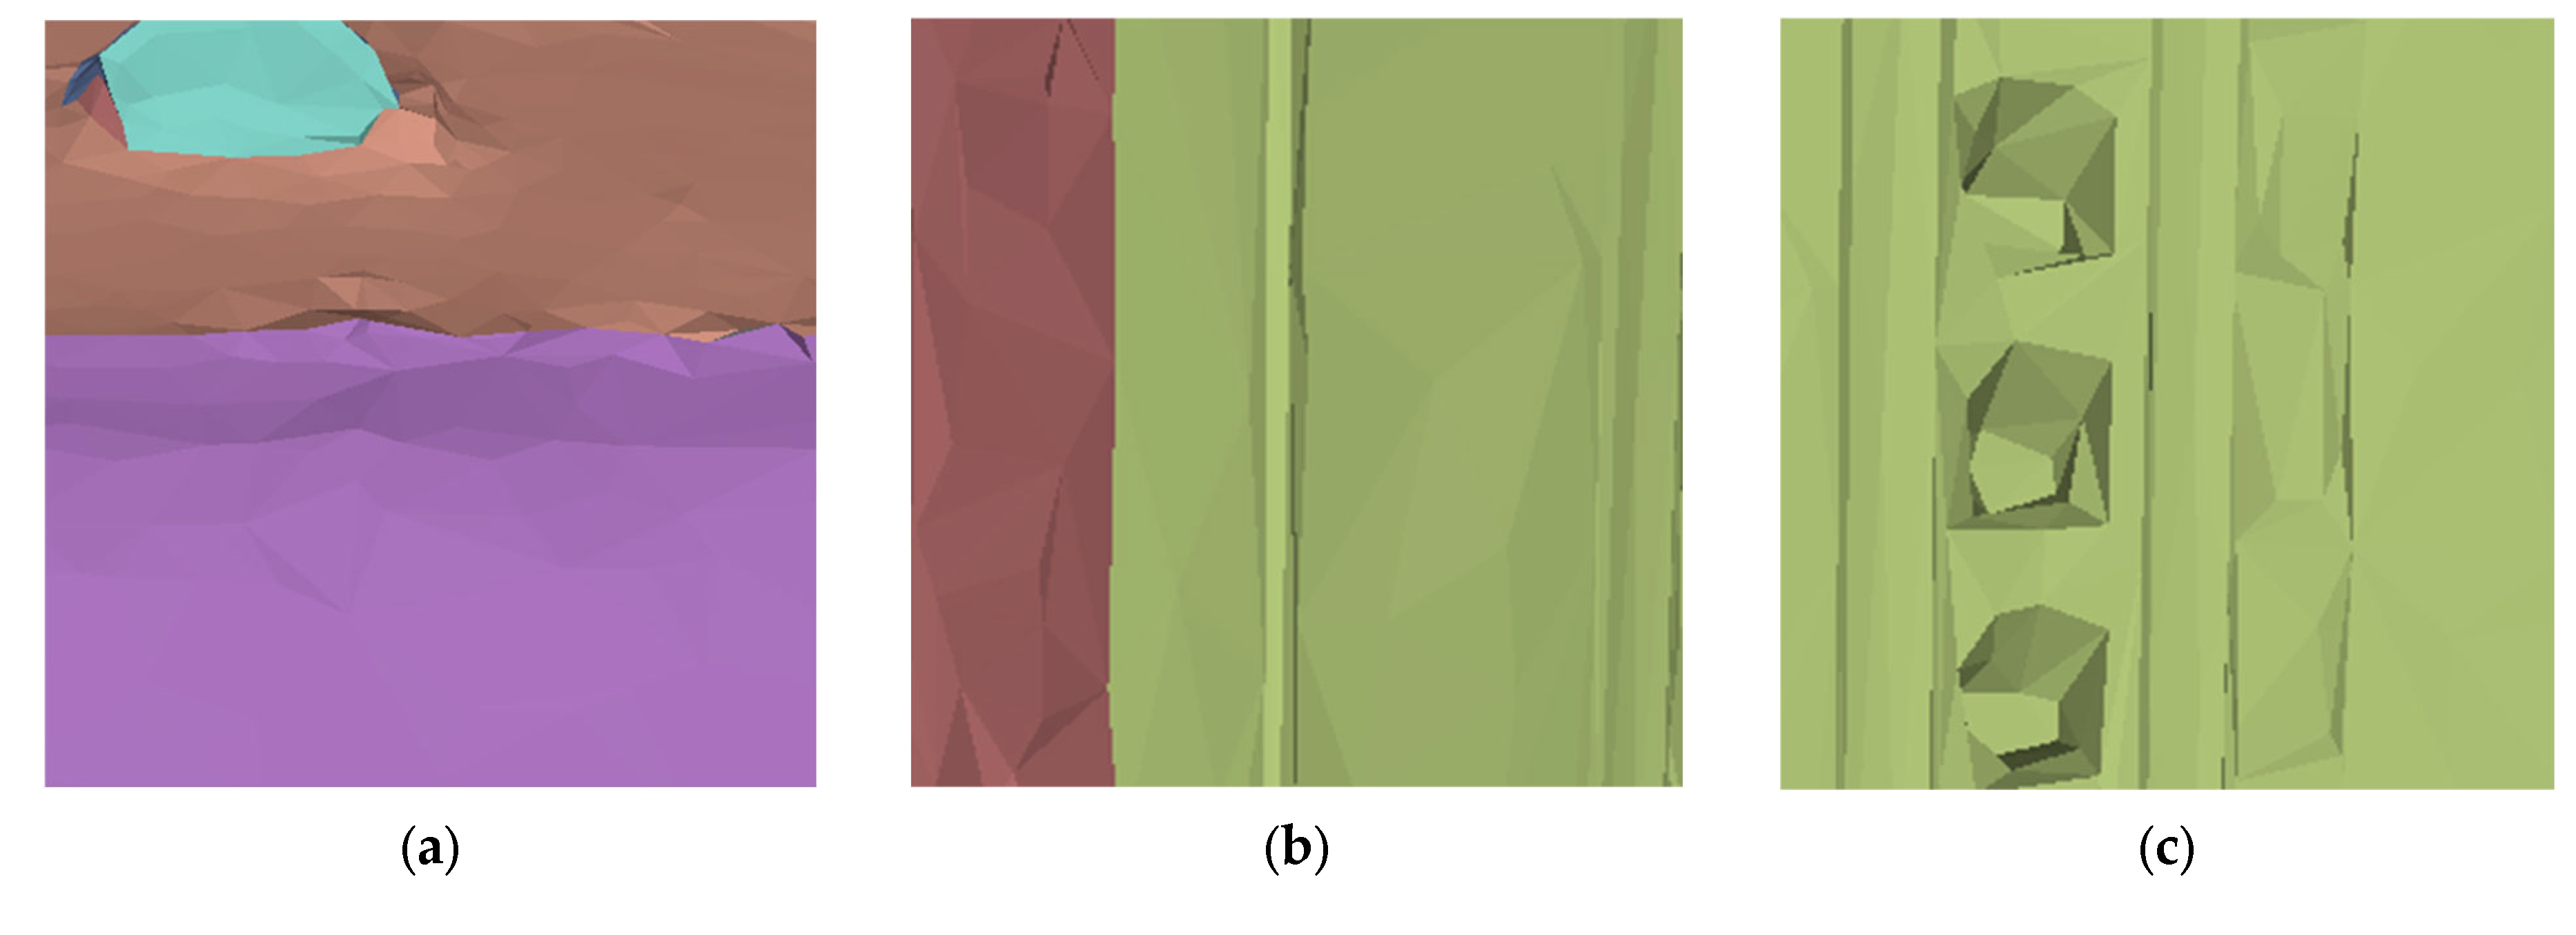
2.1.3. Region Growing Refinements

The regions are aimed at delineating building geometries, including the overall facades and roof with details like windows and chimneys as much as possible. However, due to geometric noise and topological defects, the results of plane detection may not be perfect. The following are instances of suboptimal plane detection illustrated in Figure 3:
  • Jagged borders: These may arise due to irregularities in the original surface geometry, and may contribute to the overall integrity of the plane;
  • Elongated strip-like regions: The presence of elongated strip-like regions may be attributed to elongated features in the building structure, such as beams or columns, which can cause the bending or curvature of the textures;
  • Small components with smooth curvature: The traditional region growing method faces significant challenges when handling models with smooth curvature [17]. Small components with smooth curvature might be caused by architectural details or decorative elements that deviate from the assumed planarity.
Figure 3. Examples of common issues in plane detection using traditional methods. (a) Jagged borders. (b) Elongated strip-like regions. (c) Small components with smooth curvature.
Remotesensing 16 04154 g003
To address jagged borders, we adopted the method proposed by [18] to filter out the boundary patch and grouped it into the region with more faces. In the setting of region growth conditions, we introduced the Comprehensive Planarity Index (referred to as I ) in addition to the restriction on the angle between normal vectors. This index quantifies the quality of the fitted plane by comprehensively considering the flatness, the elongation, and the normal direction’s consistency of the plane. Specifically, the computation of I is revealed in Equation (3), where δ represents the degree of flatness to a plane and ξ reflects the elongation of the point set in three-dimensional space. The weights w 1 , w 2 , and w 3 for the corresponding components are empirically set to 0.4, 0.3, and 0.3, based on the performance across various building models to ensure balanced contributions from flatness, elongation, and normal consistency. Experiments on several typical building models, including structures with complex geometries, have demonstrated that this weighting scheme effectively addresses issues such as jagged borders, elongated regions, and small components with smooth curvature, as shown in Figure 4.
I = ω 1 · δ + ω 2 · ξ + ω 3 · ( 1 sin ( θ ) )   δ = 1 δ ,     δ 0 0 ,     δ = 0     δ = σ / σ ξ = 1 ξ ,     ξ   0 0 ,     δ = 0     ξ = σ / σ  

2.2. Texture Merging Methods

This section presents an advanced methodology for merging texture seams within the planar structure of building models. The UV coordinates of two corresponding texture charts are transformed to align and merge at the seam. This process, which converts three-dimensional mapping to two dimensions, can cause distortion at the texture triangles along the seam. Simultaneously, it has a cascading effect on neighboring triangles, influencing subsequent merges. To mitigate this effect and improve the merging success for planar sections like facades and roofs, we introduce a rule-based texture merging strategy tailored for building models.

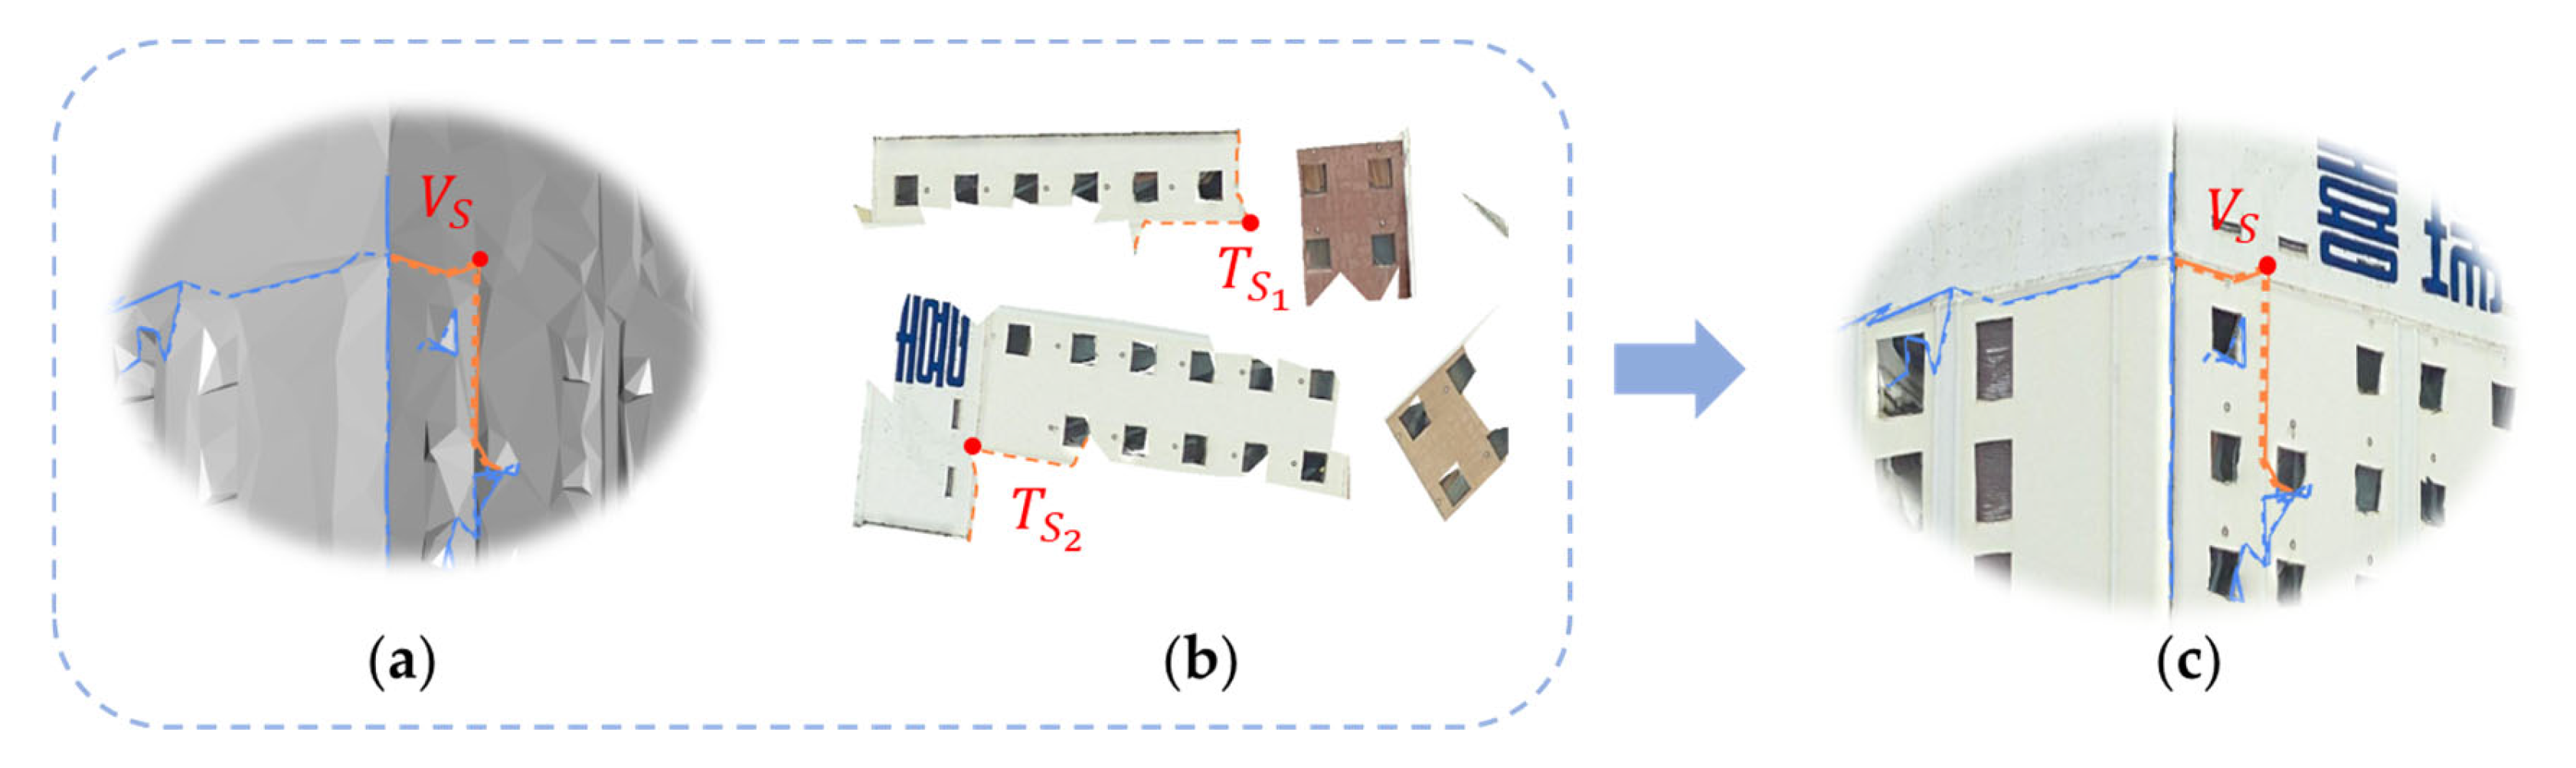
2.2.1. Specifying Sequence for Texture Merging

For a given texture seam, T , which corresponds to a pair of charts in the texture space and geometric patches in the 3D space, we can naturally employ these attributes to prioritize the seam’s merging sequence. This prioritization focuses on preserving the overall facade, placing a greater emphasis on the integrity of the entire structure rather than minor details in the merge results. Within a single planar area, we will merge the corresponding texture charts in the sequence determined by the “merging potential” of each texture seam.
The merging potential of a texture seam T is assessed using a comprehensive planar index I , with I a and I b representing the indices for patches p a t c h a and p a t c h b , respectively. These indices are derived from point sets P tied to each patch. The planar potential is thus defined as:
P l a n a r A p t i t u d e = m a x ( I a , I b )
Recognizing the benefits of merging larger charts for maintaining building facade integrity, we introduce a size-based incentive:
s i z e R e w a r d s = m a x ( A r e a c h a r t a ,   A r e a ( c h a r t b ) )
Consequently, the comprehensive merging potential X is formulated as:
X = p l a n a r A p t i t u d e     s i z e R e w a r d s
Following this, the texture seam T is arranged in the priority queue based on the descending order of merging potential for sequential merging.

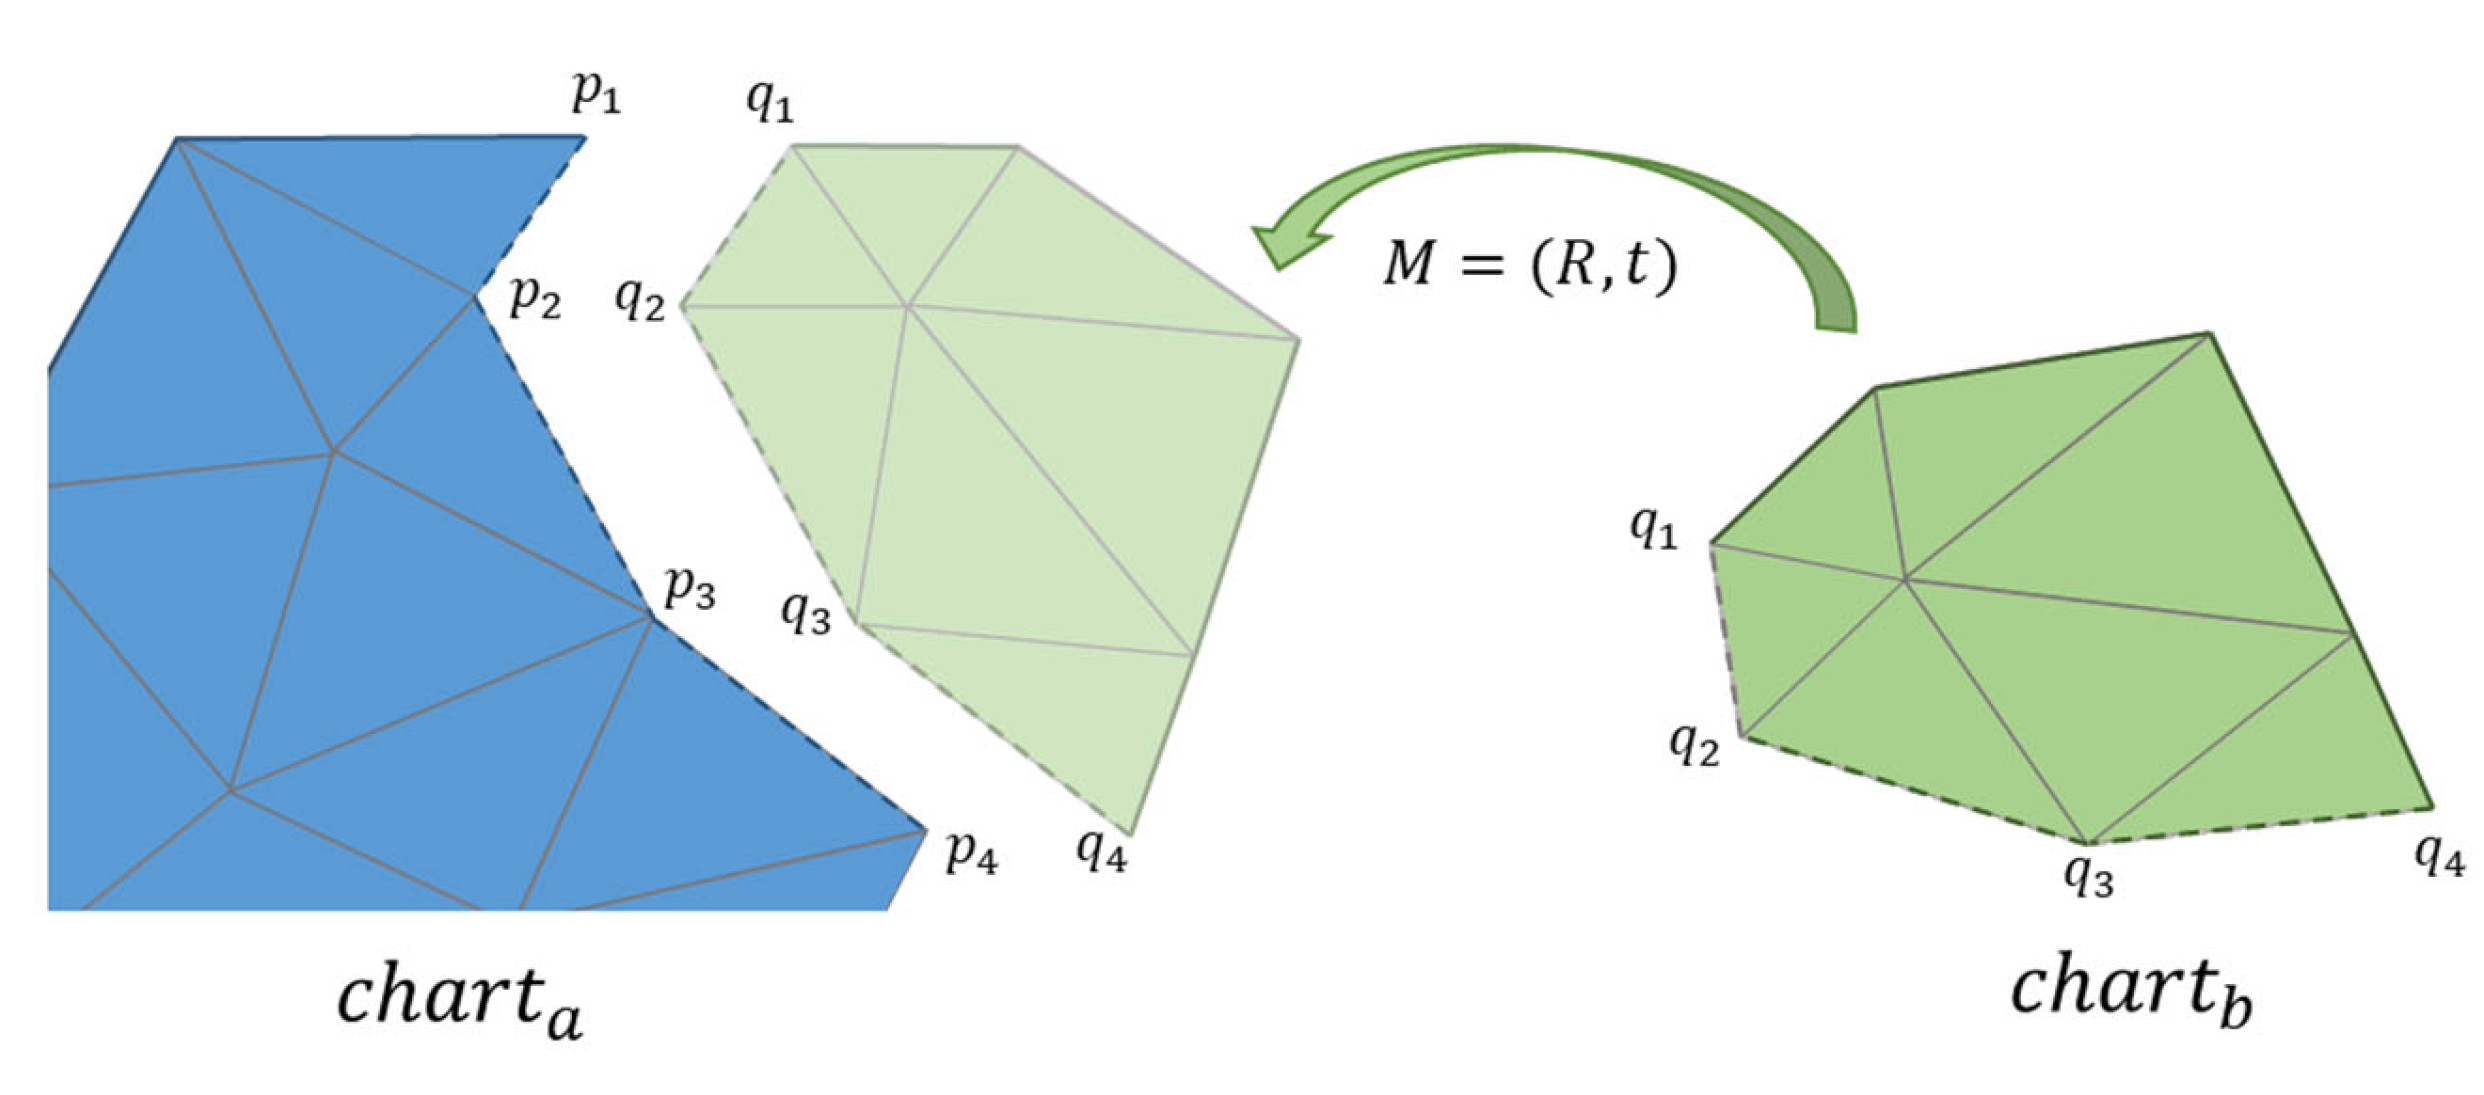
2.2.2. Chart Alignment

To eliminate the texture seams, the respective vertex pairs at the seam must be aligned in texture space. For the texture charts, c h a r t a and c h a r t b , we apply a 2D rigid transformation to the smaller of the two charts. The aim of this transformation is to minimize the distance between each pair of vertices being merged in a least-squares sense. Specifically, for the two sets of vertex points, A = { p 1 , p 2 , , p n } and B = { q 1 , q 2 , , q n } , our objective is to find a rotation matrix (R) and translation vector (t) that satisfy the following equation.
R , t = a r g m i n R S O 3 , t R 3 i = 1 n | | R p i + t q i | | 2
The computed best-fitting rigid transformation, M = ( R , t ) , ensures the alignment of the corresponding points in the texture space, as depicted in Figure 5.
After aligning the texture charts through transformation, each pair of vertices { p n , q n } intended for merging is moved to their average geometric position. This step includes the merging of these vertices in terms of topology, accompanied by updates to the corresponding topological relationships, ensuring the consistency and coherence between the model’s geometric and textured components.

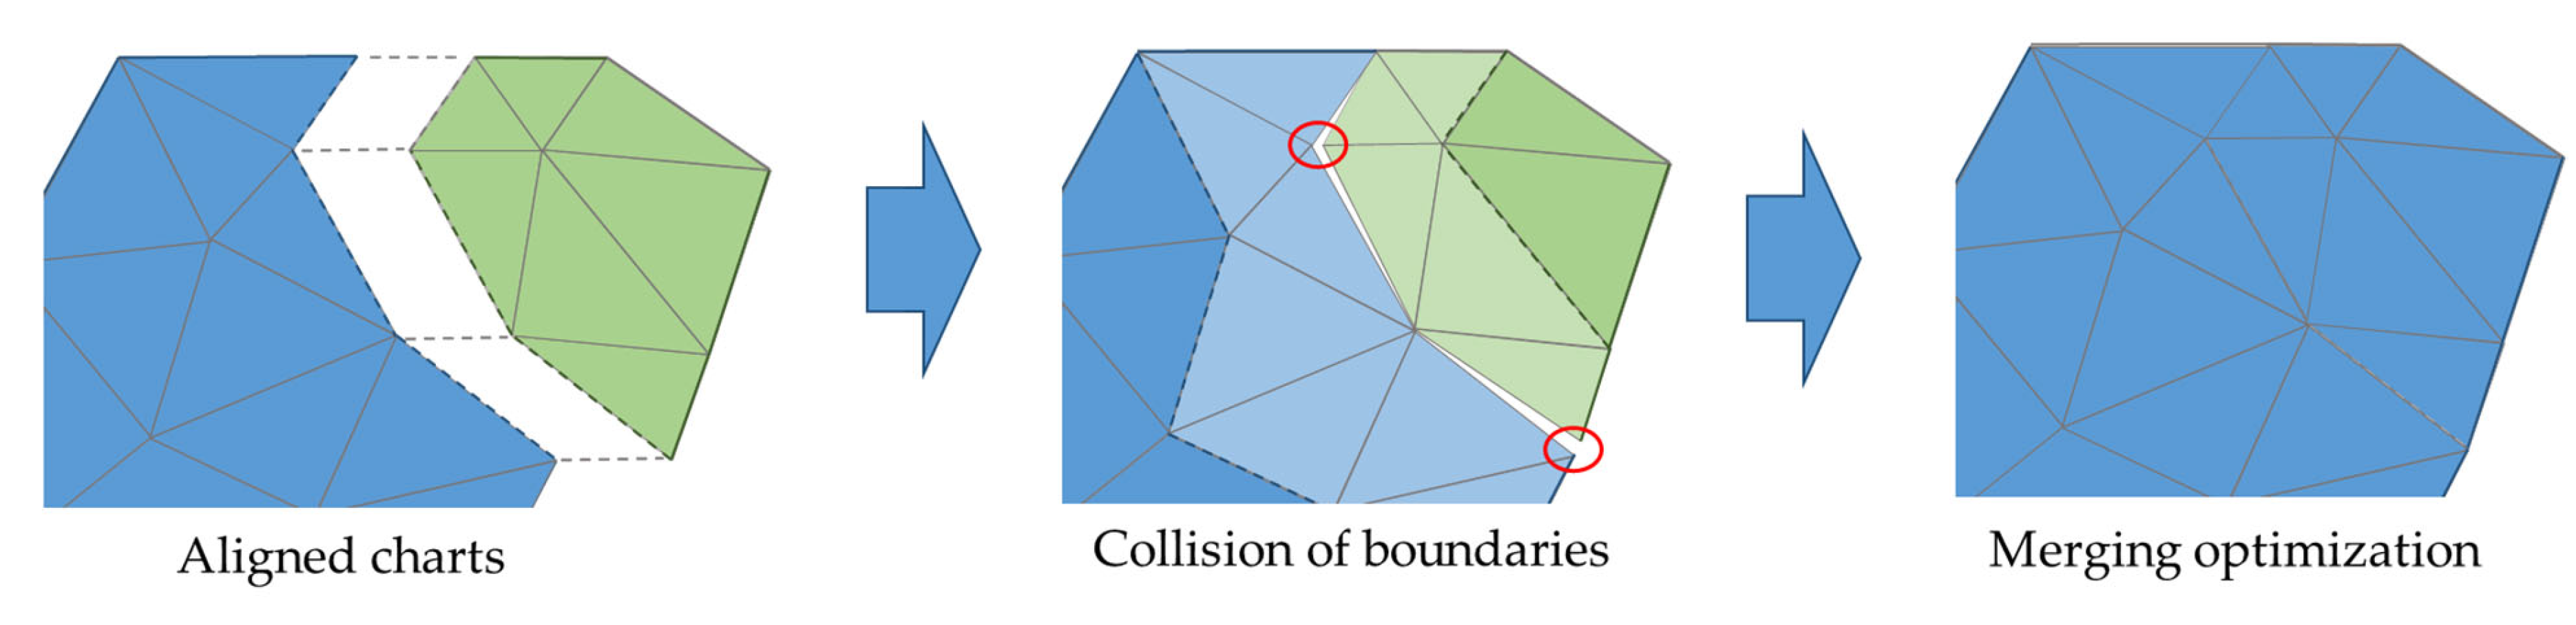
2.2.3. Merging Optimization

Texture chart merging often involves altering the UV positions corresponding to vertices at the seams, resulting in texture distortion. Additionally, the confluence of charts may precipitate the collision of boundaries between two charts, as highlighted by red circles in Figure 6. Post-alignment optimization is crucial to address these issues. The schematic diagram of the optimization process is illustrated in Figure 6.
In this study, we apply OptCuts [4], an algorithm that concurrently optimizes the parameterization and cutting of a three-dimensional mesh. This algorithm adeptly alternates between topology and geometry update steps, consistently decreasing distortion and seam length. Notably, this method can use the aligned state as the initial solution. Diverging from the ARAP method [5] applied by Maggiordomo et al., which may give rise to triangle folding and introduce new local UV overlaps, the OptCuts approach ensures that the resulting texture mapping attains global bijectivity post-optimization. This global bijectivity also effectively mitigates the risk of triangle folding that may be introduced by alignment operations.
In a general sense, the scope of optimization should correlate with the displacement of vertices during merging. Therefore, we define the optimization scope as all triangles within α times the vertex displacement distance. In this paper, we set the value of α to 5 based on empirical testing and balancing the trade-off between optimization effectiveness and computational efficiency. Vertices outside the optimization region are designated as constants. Assuming the triangles slated for optimization are labeled with indices t { 1,2 , , T } , we measure distortion over the domain to be optimized using the symmetric Dirichlet energy [25], normalized by surface area:
E d = 1 t φ A t t φ A t ( σ t , 1 2 + σ t , 2 2 + σ t , 1 2 + σ t , 1 2 )
where φ represents the collection of all triangles participating in the optimization iterations, A t denotes the area of triangle t on the input surface, and σ t , i refers to the i -th singular value of the deformation gradient for triangle t in the affine transformation, which delineates the transformation between the initial texture triangle and the present configuration. The OptCuts method endeavors to minimize the length of texture seams within the distortion bound and further reduce distortion after the completion of texture seam merging.
In order to maintain the regularity of the facade, during each merge operation, we specify that the individual seam must be fully merged. If the distortion after the complete merge exceeds the distortion limit, the current merge is discarded. Otherwise, it is accepted. After completion, the corresponding texture seam T is removed from the queue Q . At the same time, the merging potential associated with texture seams related to c h a r t a and c h a r t b is recalculated, resulting in the subsequent update of the queue Q .

2.3. Texture Atlas Packing Strategy

The process of tightly packing texture charts into a unified texture space, after their merge, is a crucial step in optimizing texture memory usage. The challenge lies in packing these charts to minimize wasted space, considering the NP-complete nature of the packing problem [26]. Heuristic methods are typically adopted to achieve near-optimal solutions, as fully optimal packing is computationally infeasible. Previous strategies, such as those by [27,28], cater to automatic parameterization for simpler convex or concave shapes, but they are less efficient for larger, regular-shaped charts or intricate smaller components post-merging.
In contrast to Lévy et al.’s approach, which places Tetriminos vertically and uses the top and bottom horizons to minimize voids, we often encounter inefficient space utilization due to irregular fragments being placed between regular planar areas. To address this for building models with predominantly rectangular regions, we introduce the “Square Tetris” packing strategy. This novel approach marries the concept of approximate rectangular packing with the strategic filling of fine-grained components to enhance efficiency. An illustrative diagram of this method is provided in Figure 7. The “Square Tetris” strategy unfolds as follows:
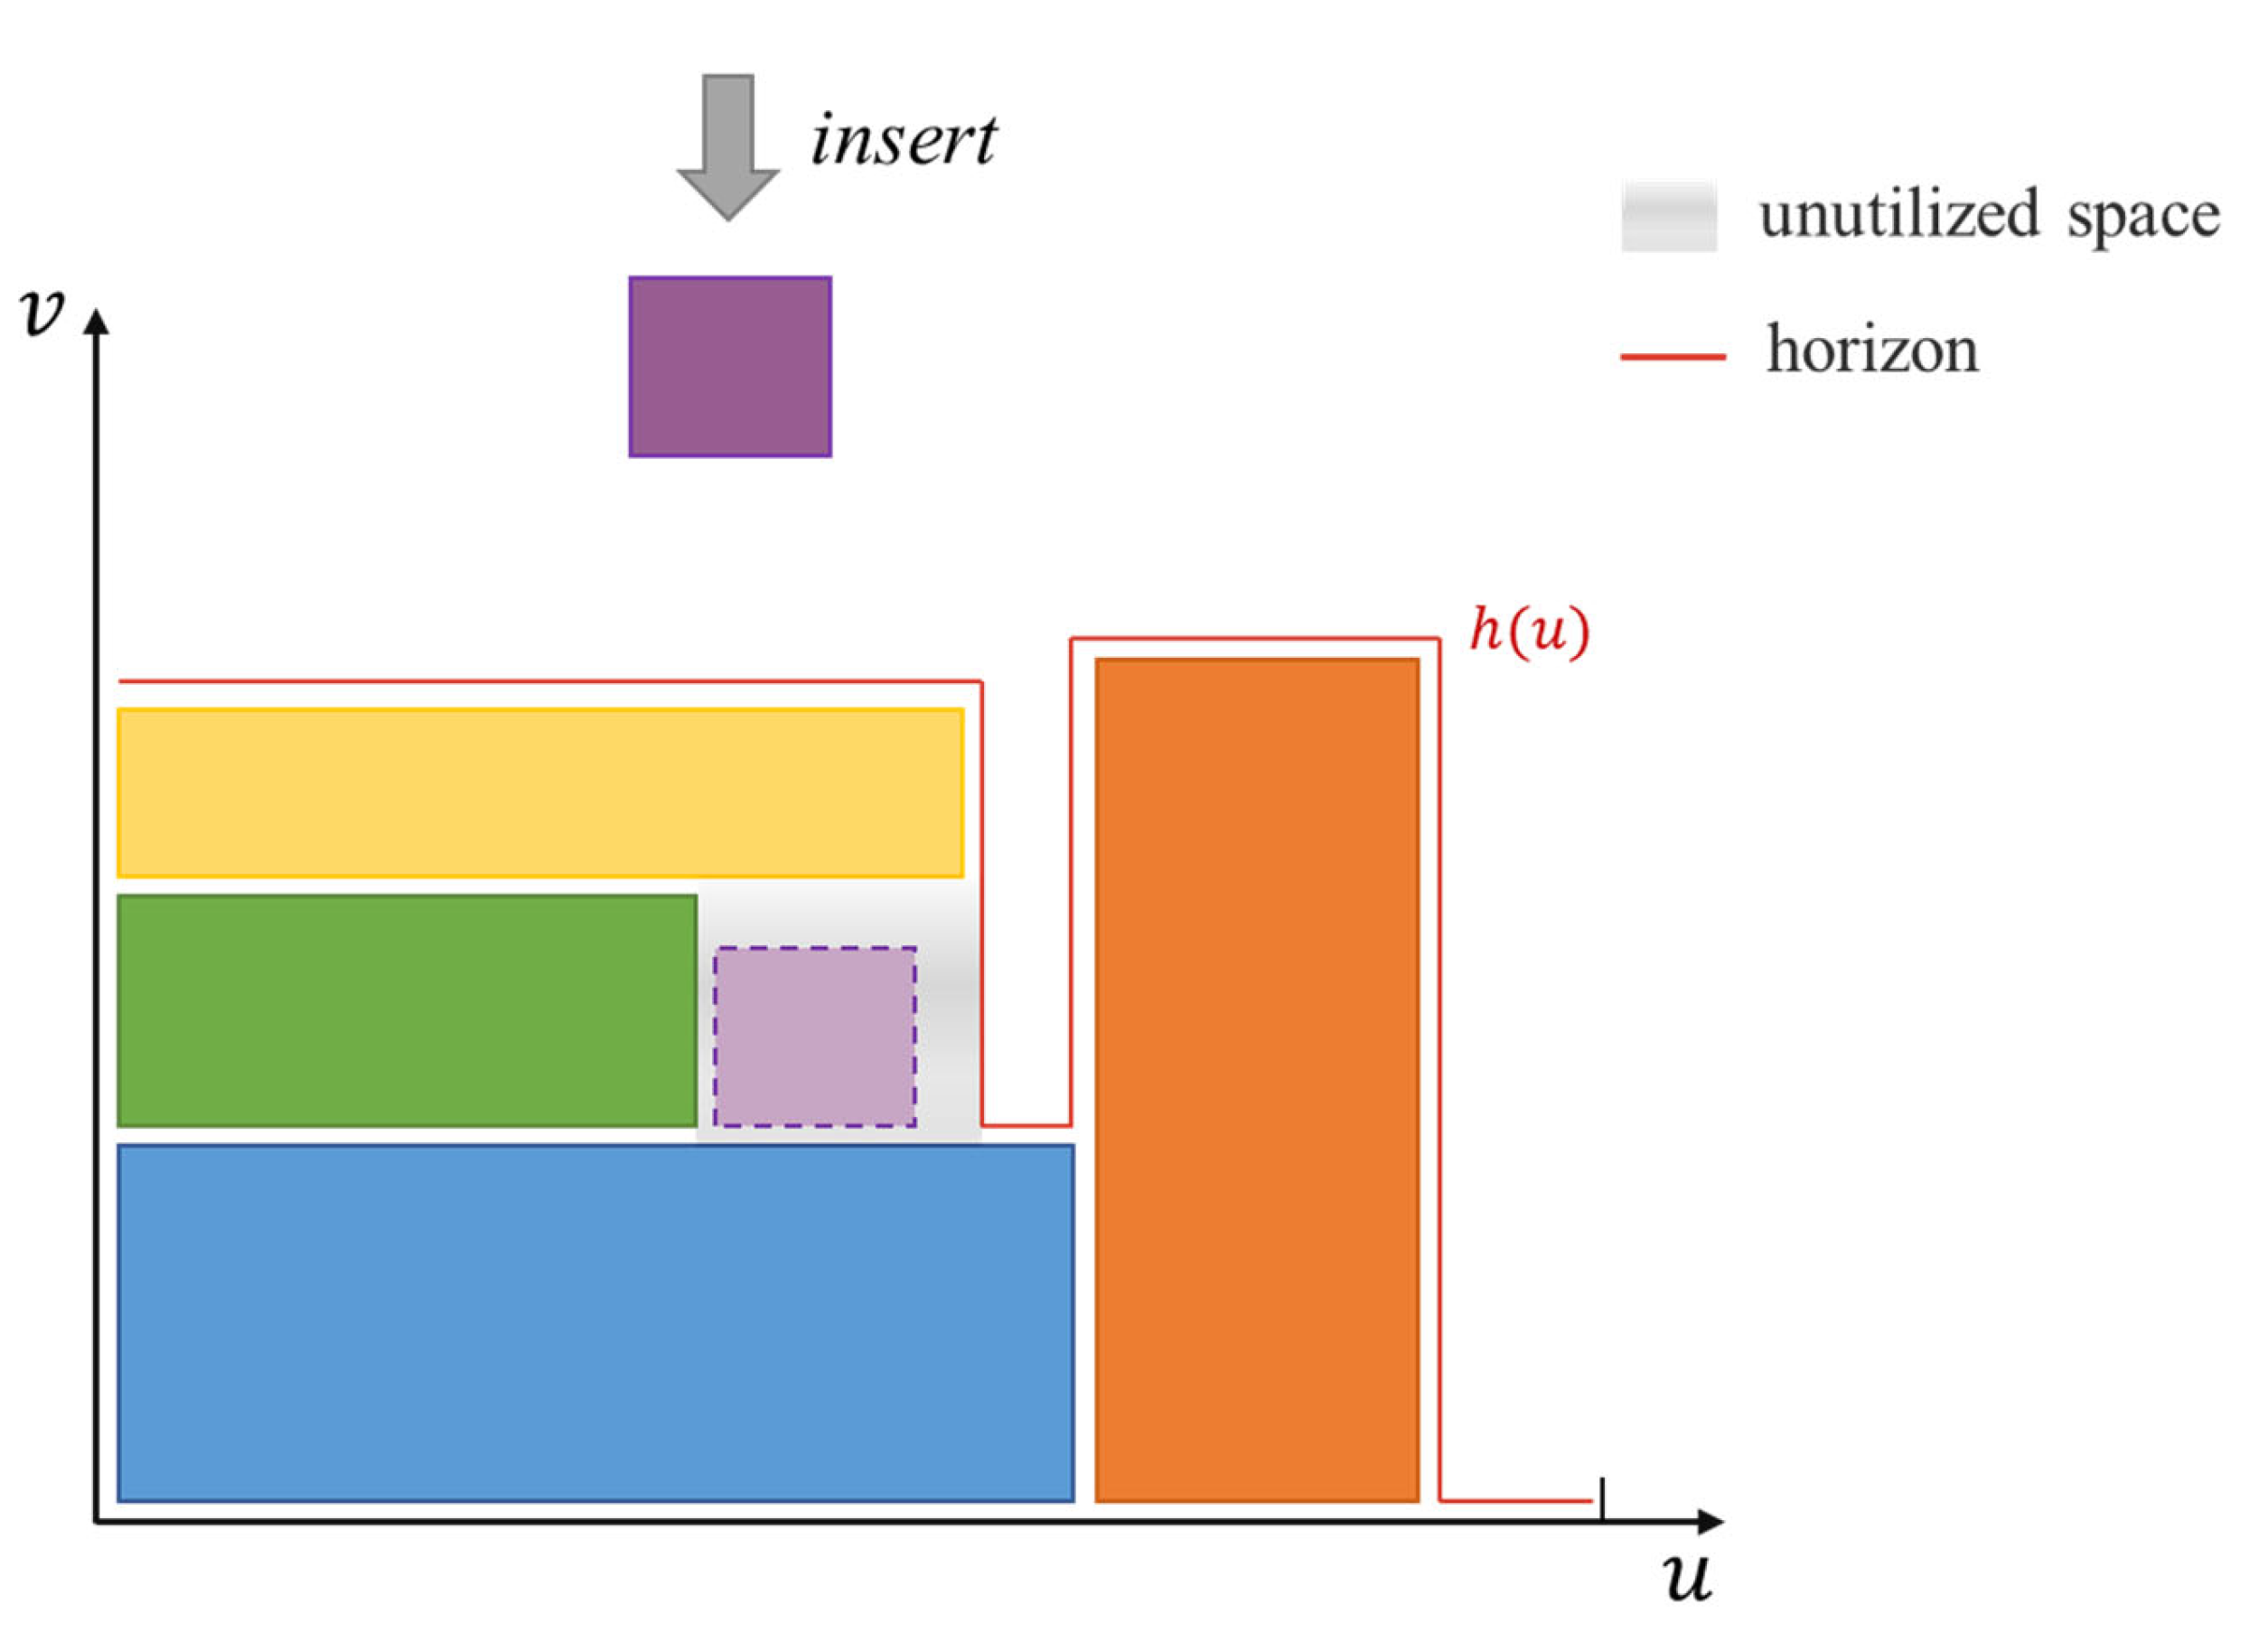
  • Initially, we position all texture atlases within their minimum bounding rectangles (MBRs). These MBRs will replace the actual texture atlases in the calculation of their packing positions in the (u, v) space.
  • The MBRs can be placed horizontally or vertically, and they are sorted in decreasing order of area.
  • As shown in the diagram, we retain the concept of a horizon from traditional Tetris methods and maintain it using a simpler piecewise linear function, h(u). Additionally, for unutilized space, we allow the next inserted rectangle to prioritize detecting and filling that area.
  • The placement of the MBRs will follow the subsequent method. Initially, we sort the enclosed unutilized space in descending order by area to obtain L = { L 0 , L 1 , , L s } . For each chart’s bounding rectangle square, we assess if it can be placed within L . If not, we position the lower-left corner of the square on the horizon from left to right to minimize the peak value of h ( u ) after placement, and update h ( u ) . If placement is feasible, h(u) remains unchanged, and we update Ls. The position where the bounding rectangle is placed represents the final packing position of the corresponding texture atlas.

3. Experiments and Discussion

To validate the effectiveness of the algorithm proposed, we conducted experiments on 187 individual building models from Wuhan city. The experimental data were derived from real-world three-dimensional model data produced by a photogrammetric process applied to unmanned aerial vehicle imagery, as shown in Figure 8. The evaluation of the algorithm includes both qualitative and quantitative analyses. For qualitative assessment, we selected three experimental models representing typical categories of buildings: a residential building, a factory workshop, and a hotel. These models encompass the primary types of structures, lending the texture fragmentation experiments a universal significance. Figure 9 and Figure 10 illustrate the original models with applied texture mapping and their corresponding original texture maps.

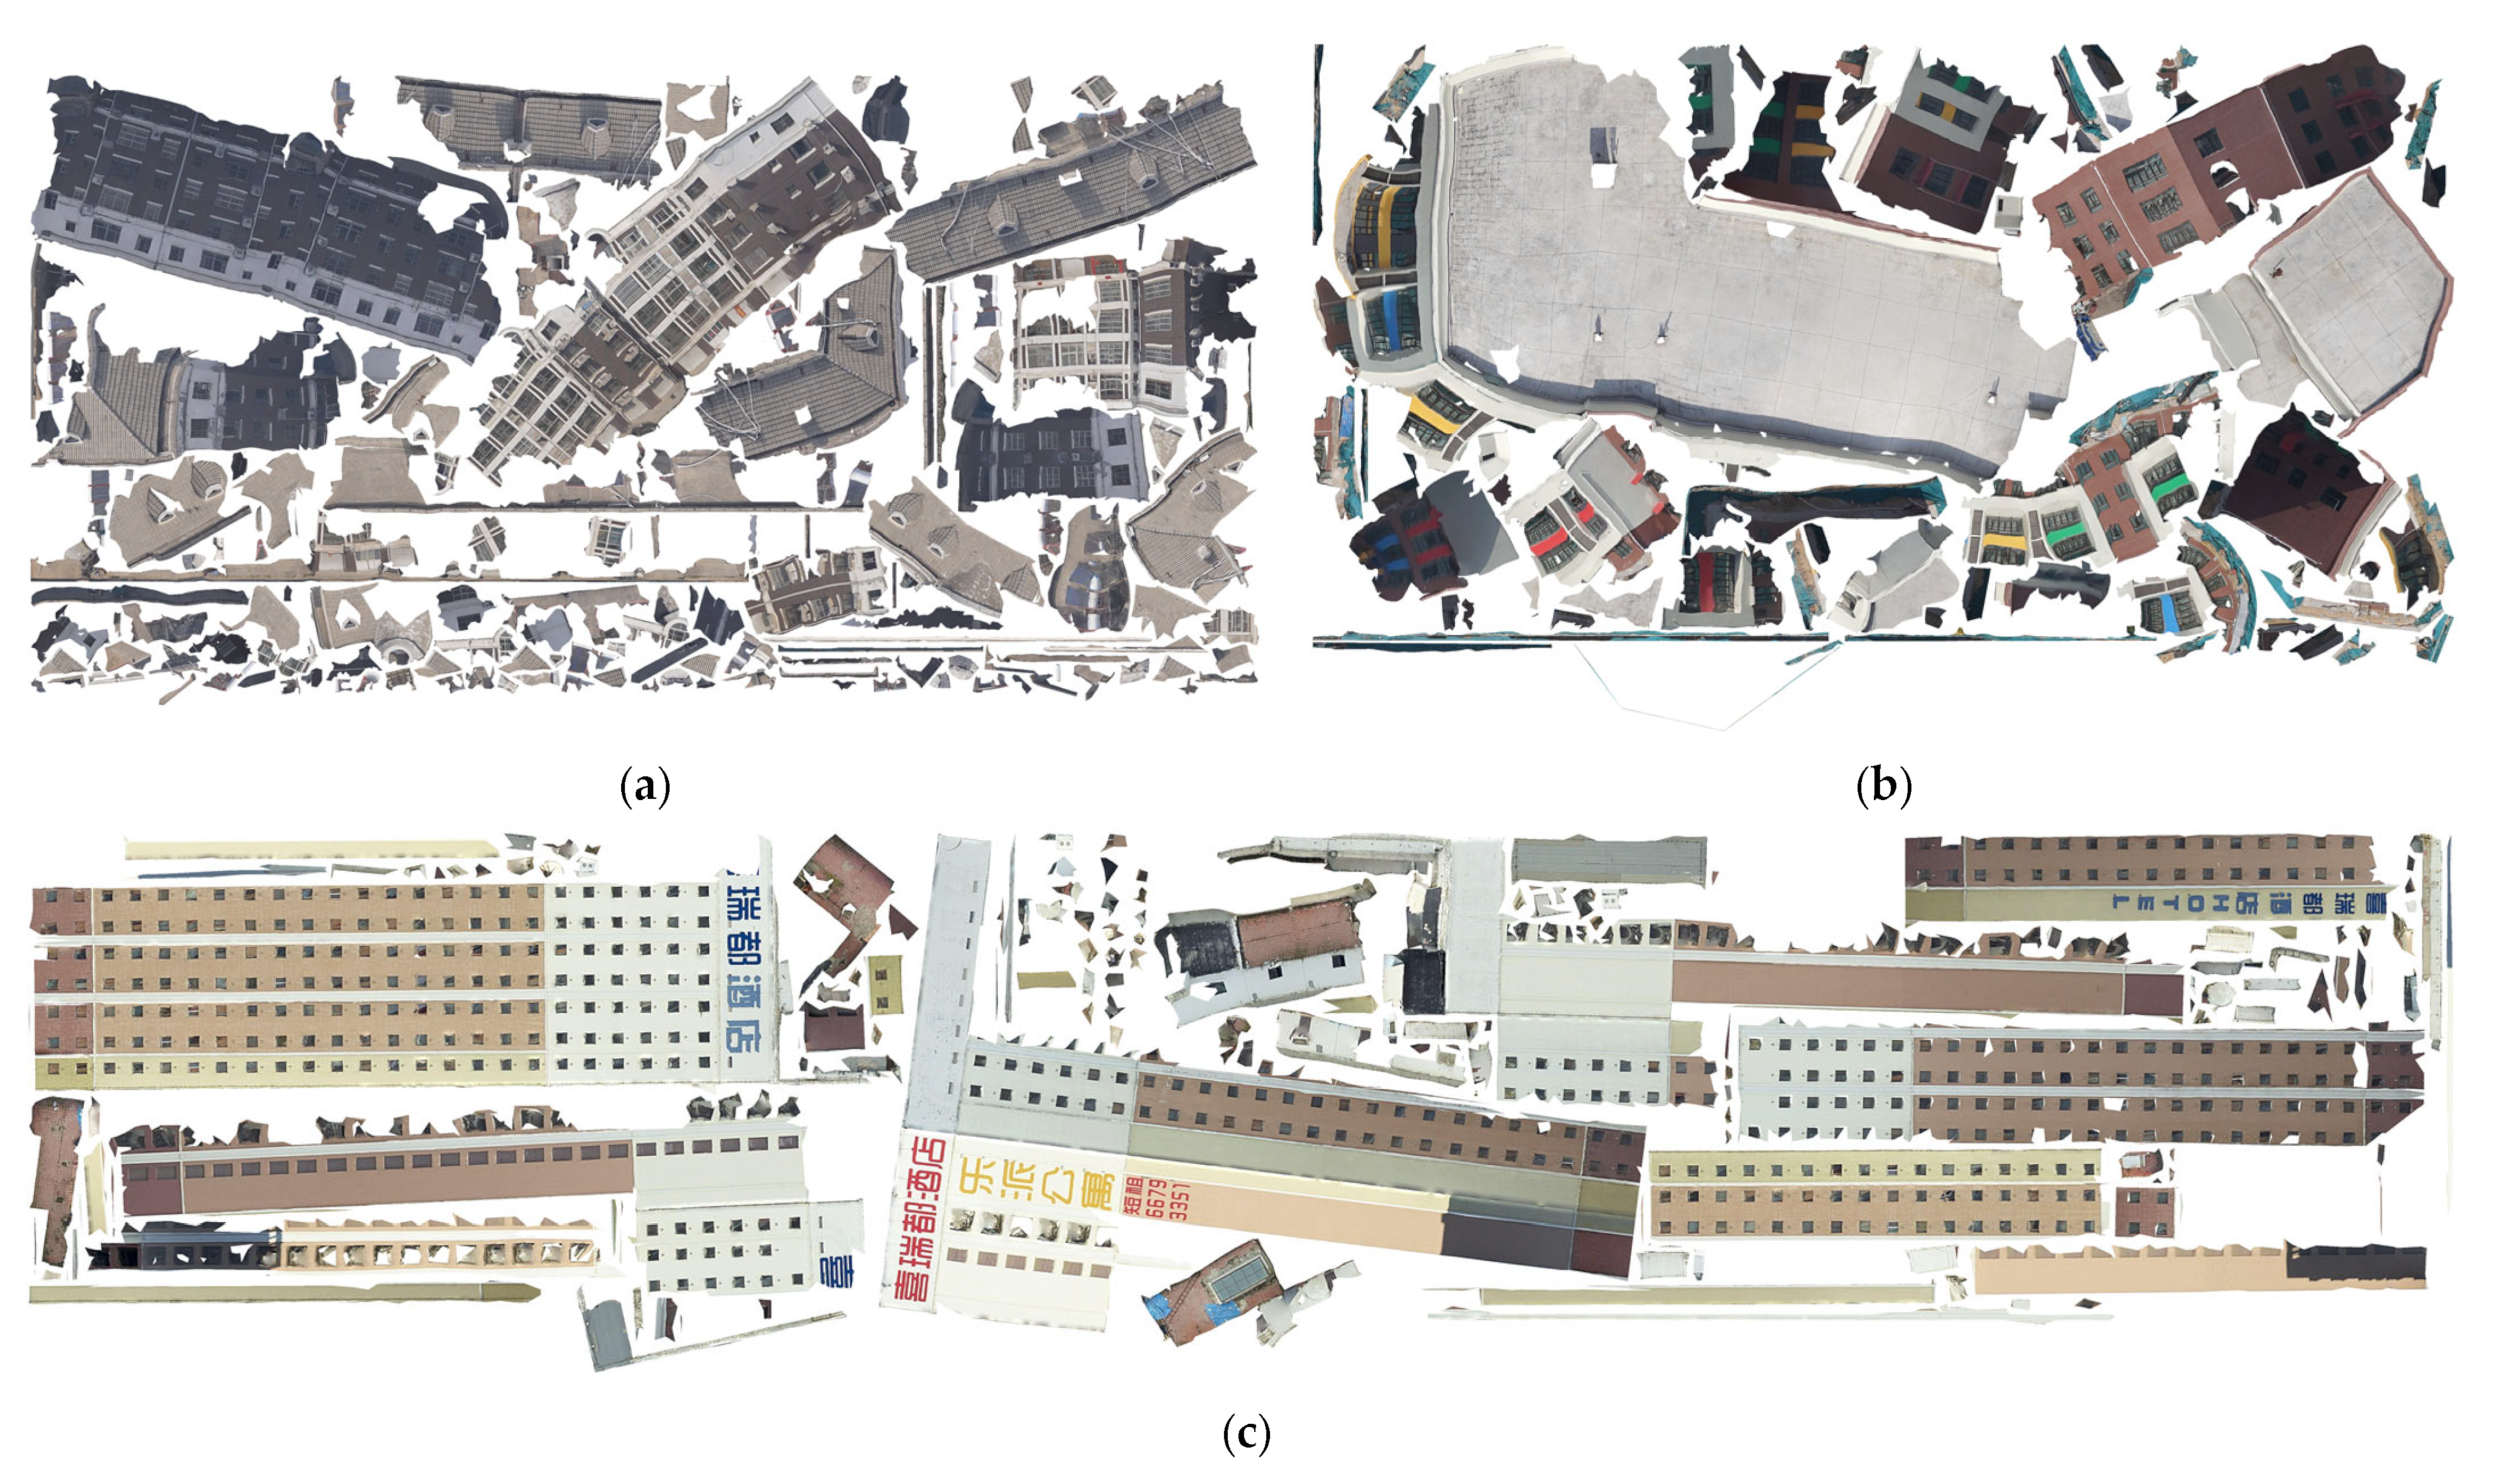
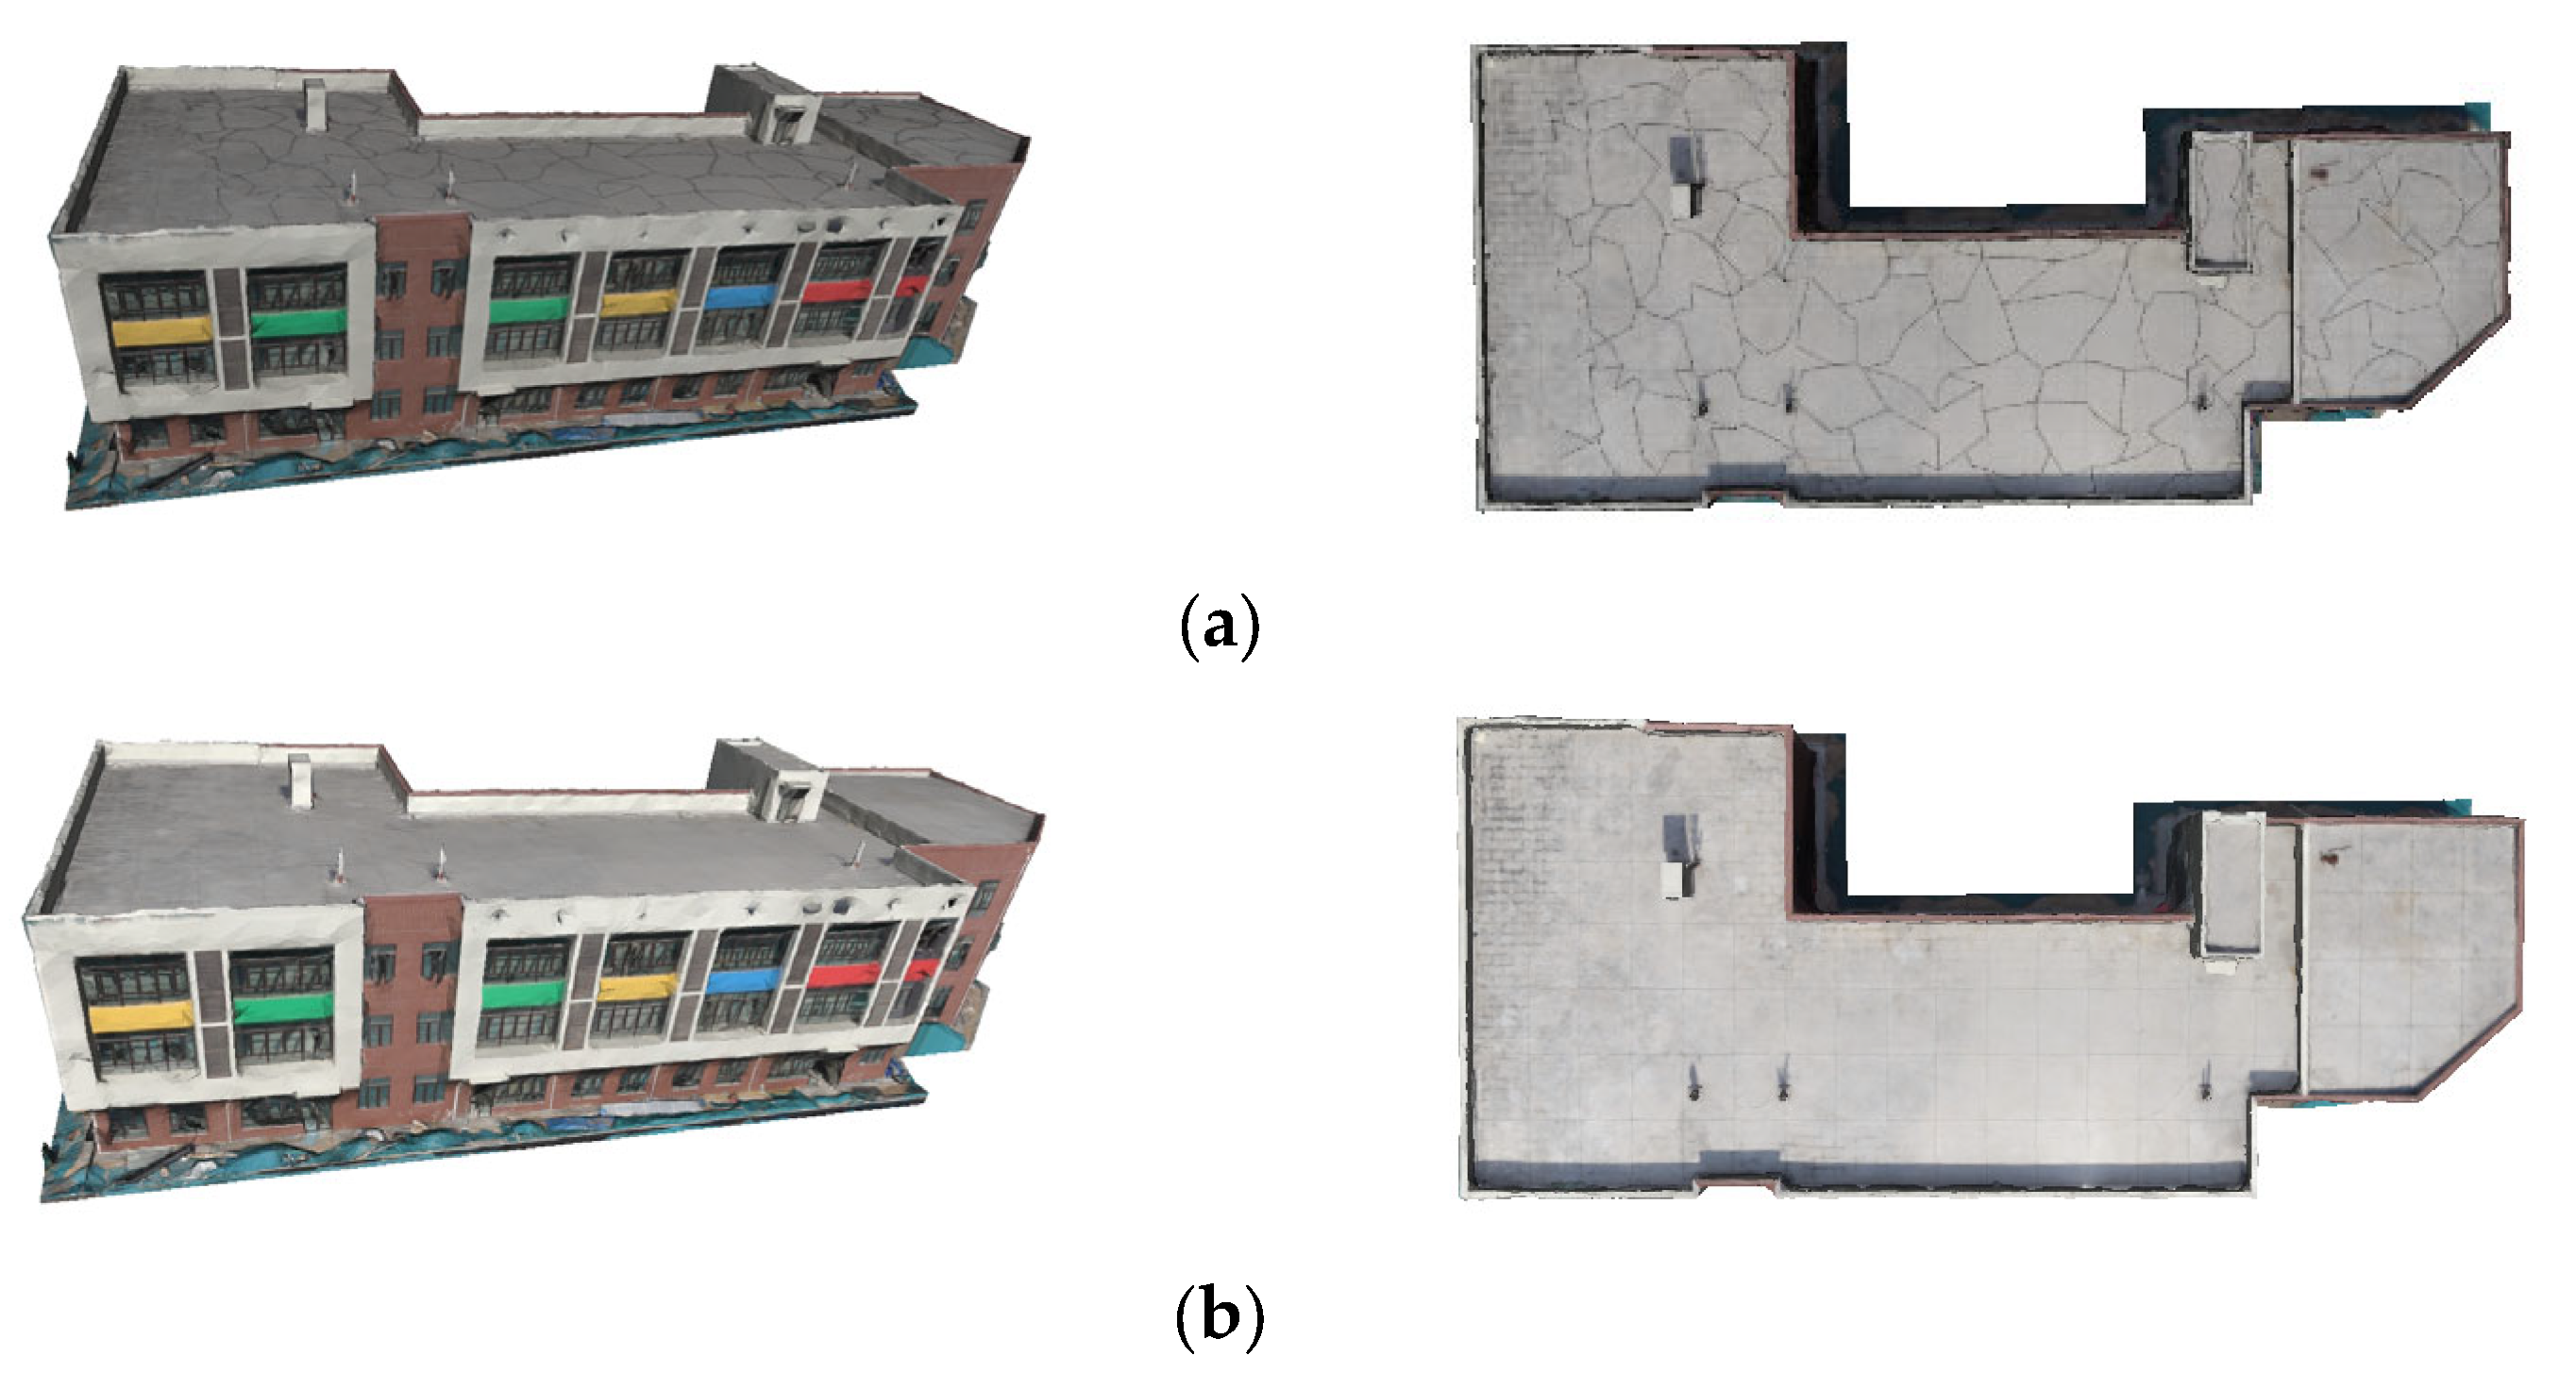
3.1. Qualitative Assessment

The results of the entire workflow are shown in Figure 11 and Figure 12. For a more intuitive presentation, we visualize the patches corresponding to the texture maps in 3D mode with distinct colors.
From an overall perspective, the results of plane structure detection effectively represent the structural information of building models. For instance, large-scale planar structures such as facades in all buildings, roofs of factory buildings, and residential building rooftops are well preserved. Simultaneously, the method achieves a nearly complete merge of all texture charts in a planar region. While there are still some texture fragments that cannot be merged due to the introduction of significant texture deformation, the approach successfully preserves the majority of facade and roof planar structures. In terms of local details, features such as eaves and corners are well delineated, and the windows on the facade, as well as other irregularly shaped components on the roof, do not significantly impact the integrity of the planar structure.
Following the completion of the merging process, the merged textures are packed into a two-dimensional texture space using the “Square Tetris” packing algorithm. The packing results are then exported as a texture image. Through the merging process, a relatively complete facade texture image can be obtained, effectively improving the issue of texture fragmentation, as depicted in Figure 13.
In contrast, the texture image generated by the traditional method [12] (referred to as ‘M-method’ hereafter) is presented in Figure 14, employing a traditional Tetris packing approach. The merging results are more random and chaotic, characterized by many elongated features and incomplete facades. This merging outcome lacks semantic information and poses challenges in utilizing packing space effectively during the packing process.
The models after texture merging are exported and rendered in MeshLab for comparison with the original models, as illustrated in Figure 15. The upper portion displays the original models, which exhibit texture distortion and aliasing at a distance. The lower portion showcases the models after texture merging, revealing a noticeable reduction in texture seams, particularly in planar regions, which becomes more evident from the perspective of the 3D models.

3.2. Quantitative Analysis

3.2.1. Measurements for Defragmented Models

The objective of merging texture fragments is to minimize texture distortion within predefined thresholds while alleviating texture fragmentation. This involves reducing the number of texture seams to mitigate visual artifacts during rendering and decrease the associated storage overhead.
Despite optimizations in traditional texture mapping facilitated by graphics hardware and APIs, minor rendering artifacts resulting from inconsistent bilinear interpolation along seams remain inevitable. Therefore, our method demonstrates its effectiveness in mitigating texture fragmentation to improve potential rendering artifacts by evaluating the reduction in texture seam length and the number of texture charts. Furthermore, we believe that scattered texture charts and winding texture seams affect the efficiency of texture packing, while vertex duplications are necessary for encoding texture seams, both leading to additional storage overhead. Hence, we illustrate the effectiveness of our method in reducing memory usage and per-vertex workloads by assessing changes in texture size and vertex duplications. Additionally, texture merge inevitably leads to distortion on the original texture, which we quantify using the symmetric Dirichlet energy to measure relative distortion compared to the original texture.
Furthermore, we employ the M-method as a benchmark in our comparative experiment to assess the effectiveness of our approach. The M-method offers a comprehensive process for texture defragmentation in general models, serving as a solid reference for evaluation. Expanding upon this groundwork for urban building models, we introduce constraints derived from planar features. Additionally, we enhance the merging strategy, optimization methods, and packing techniques to align with our specific objectives and requirements.

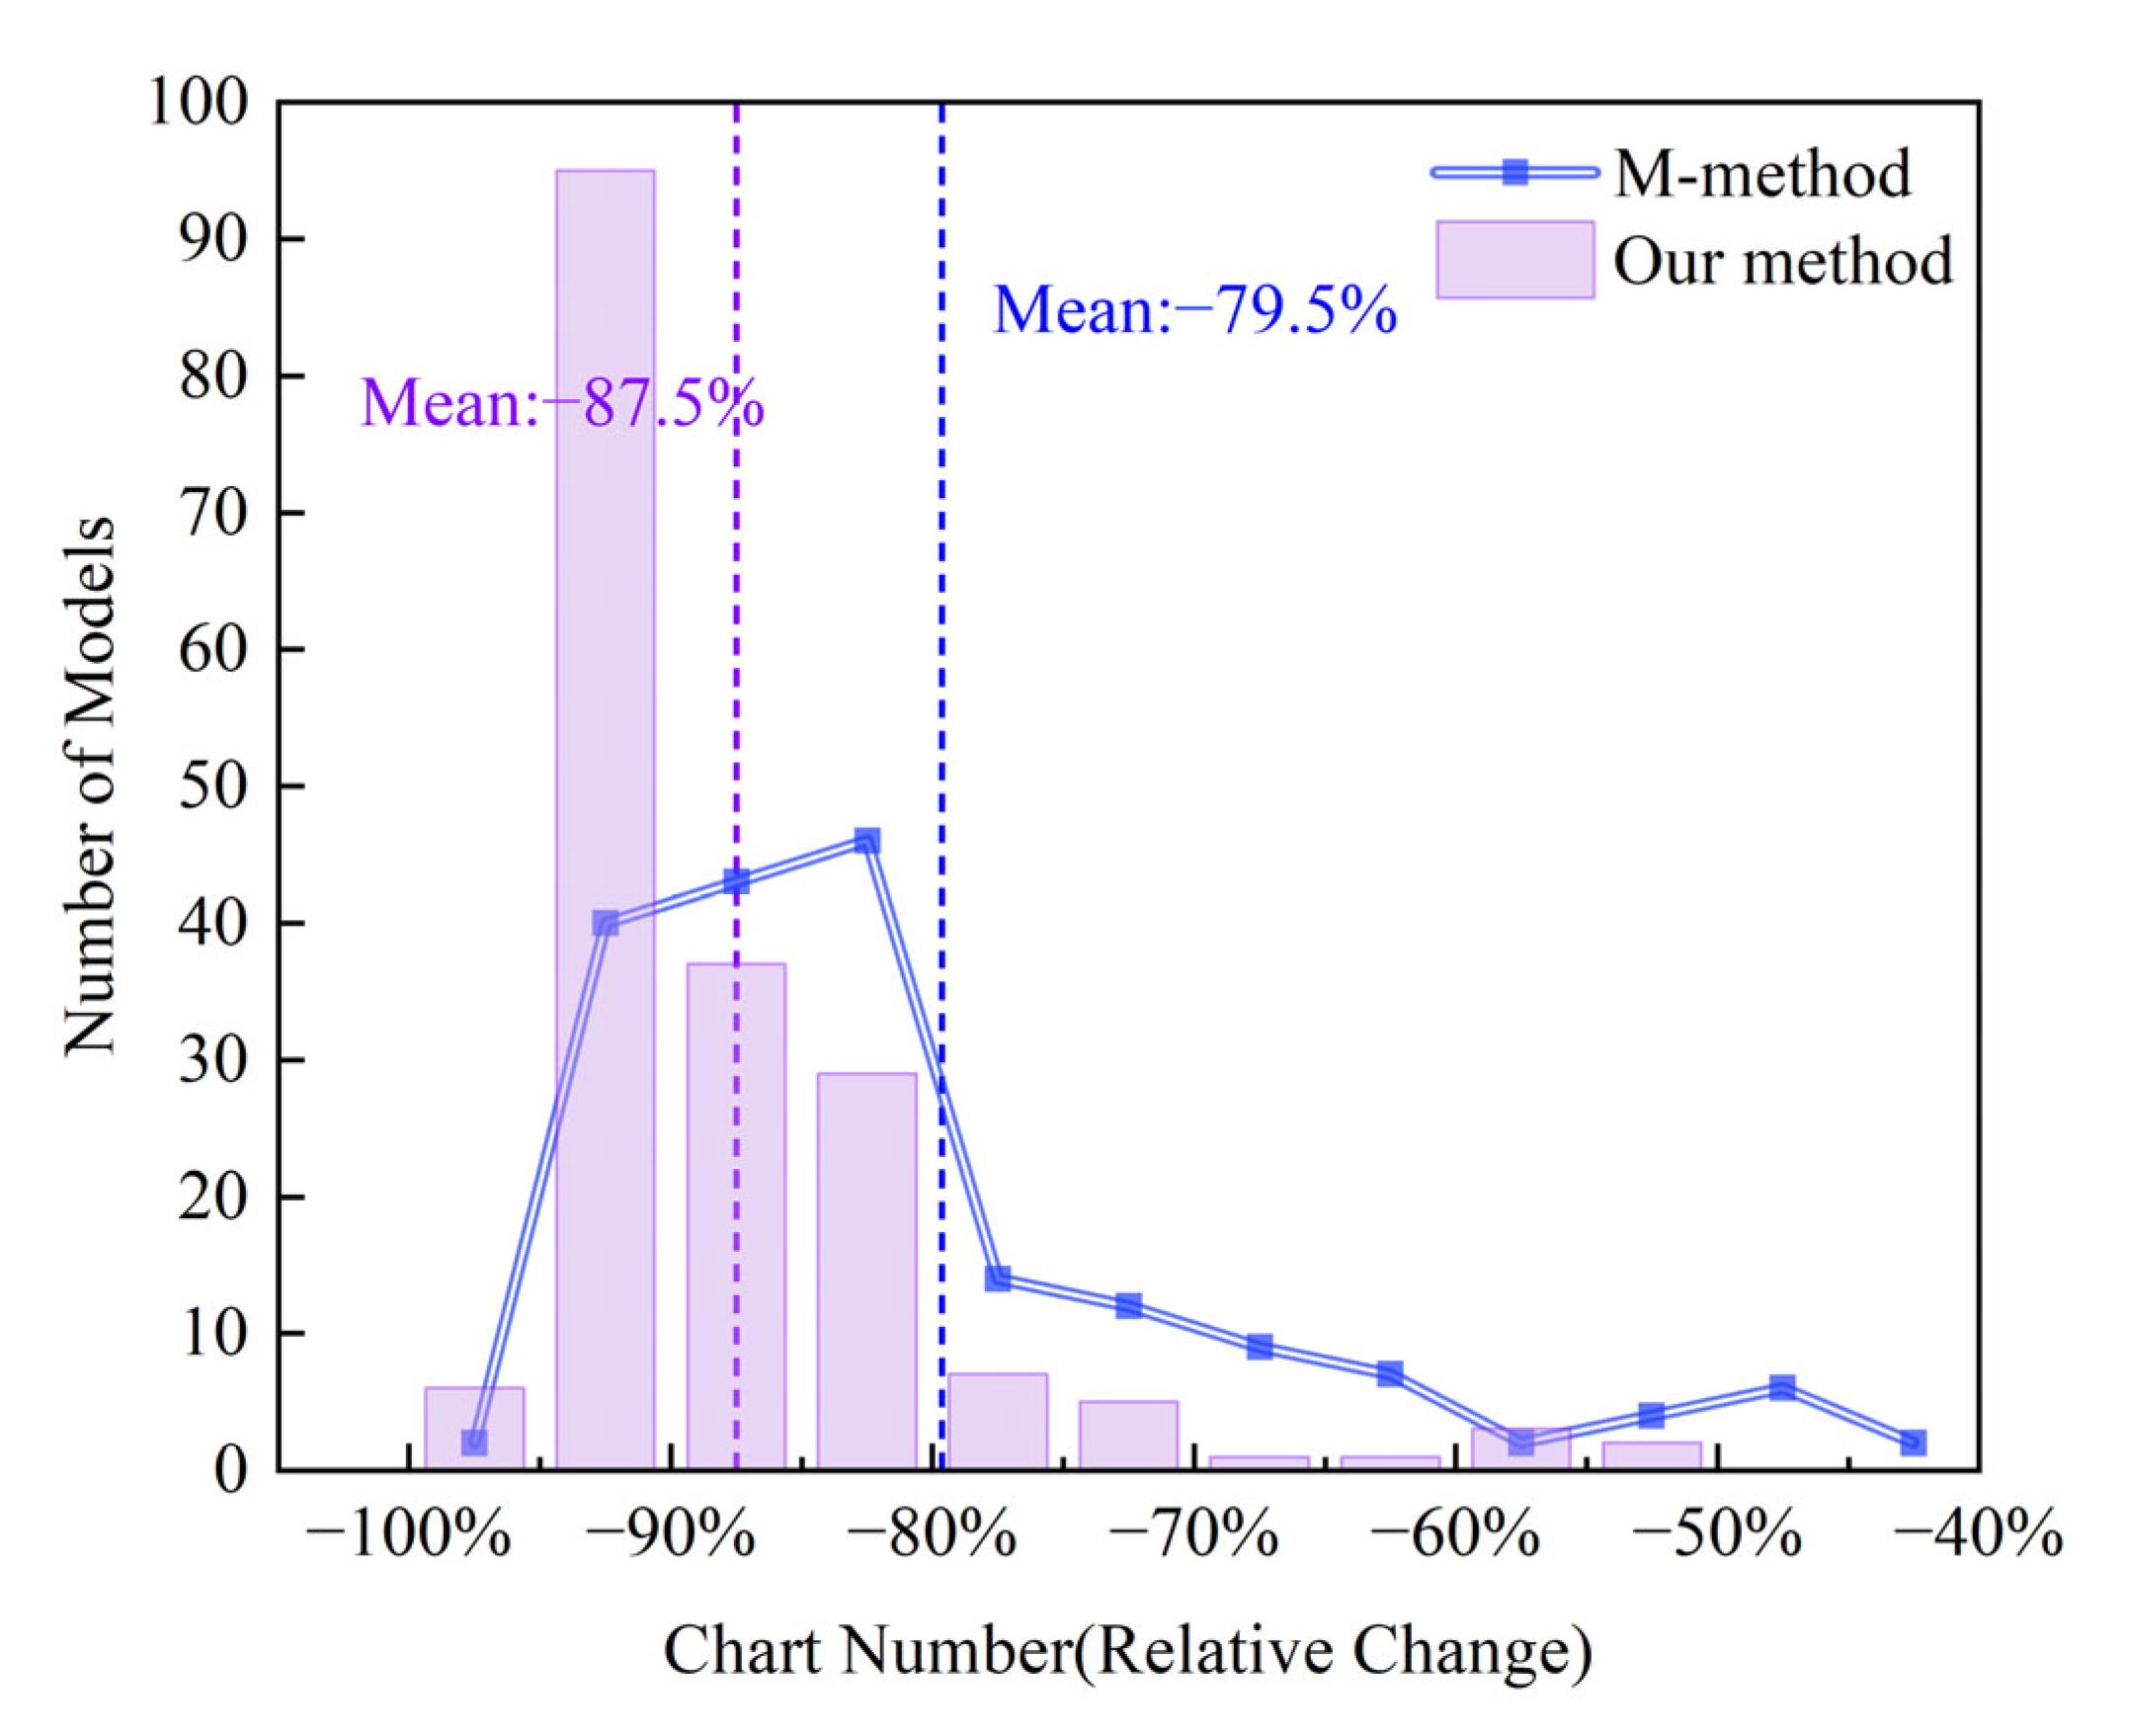
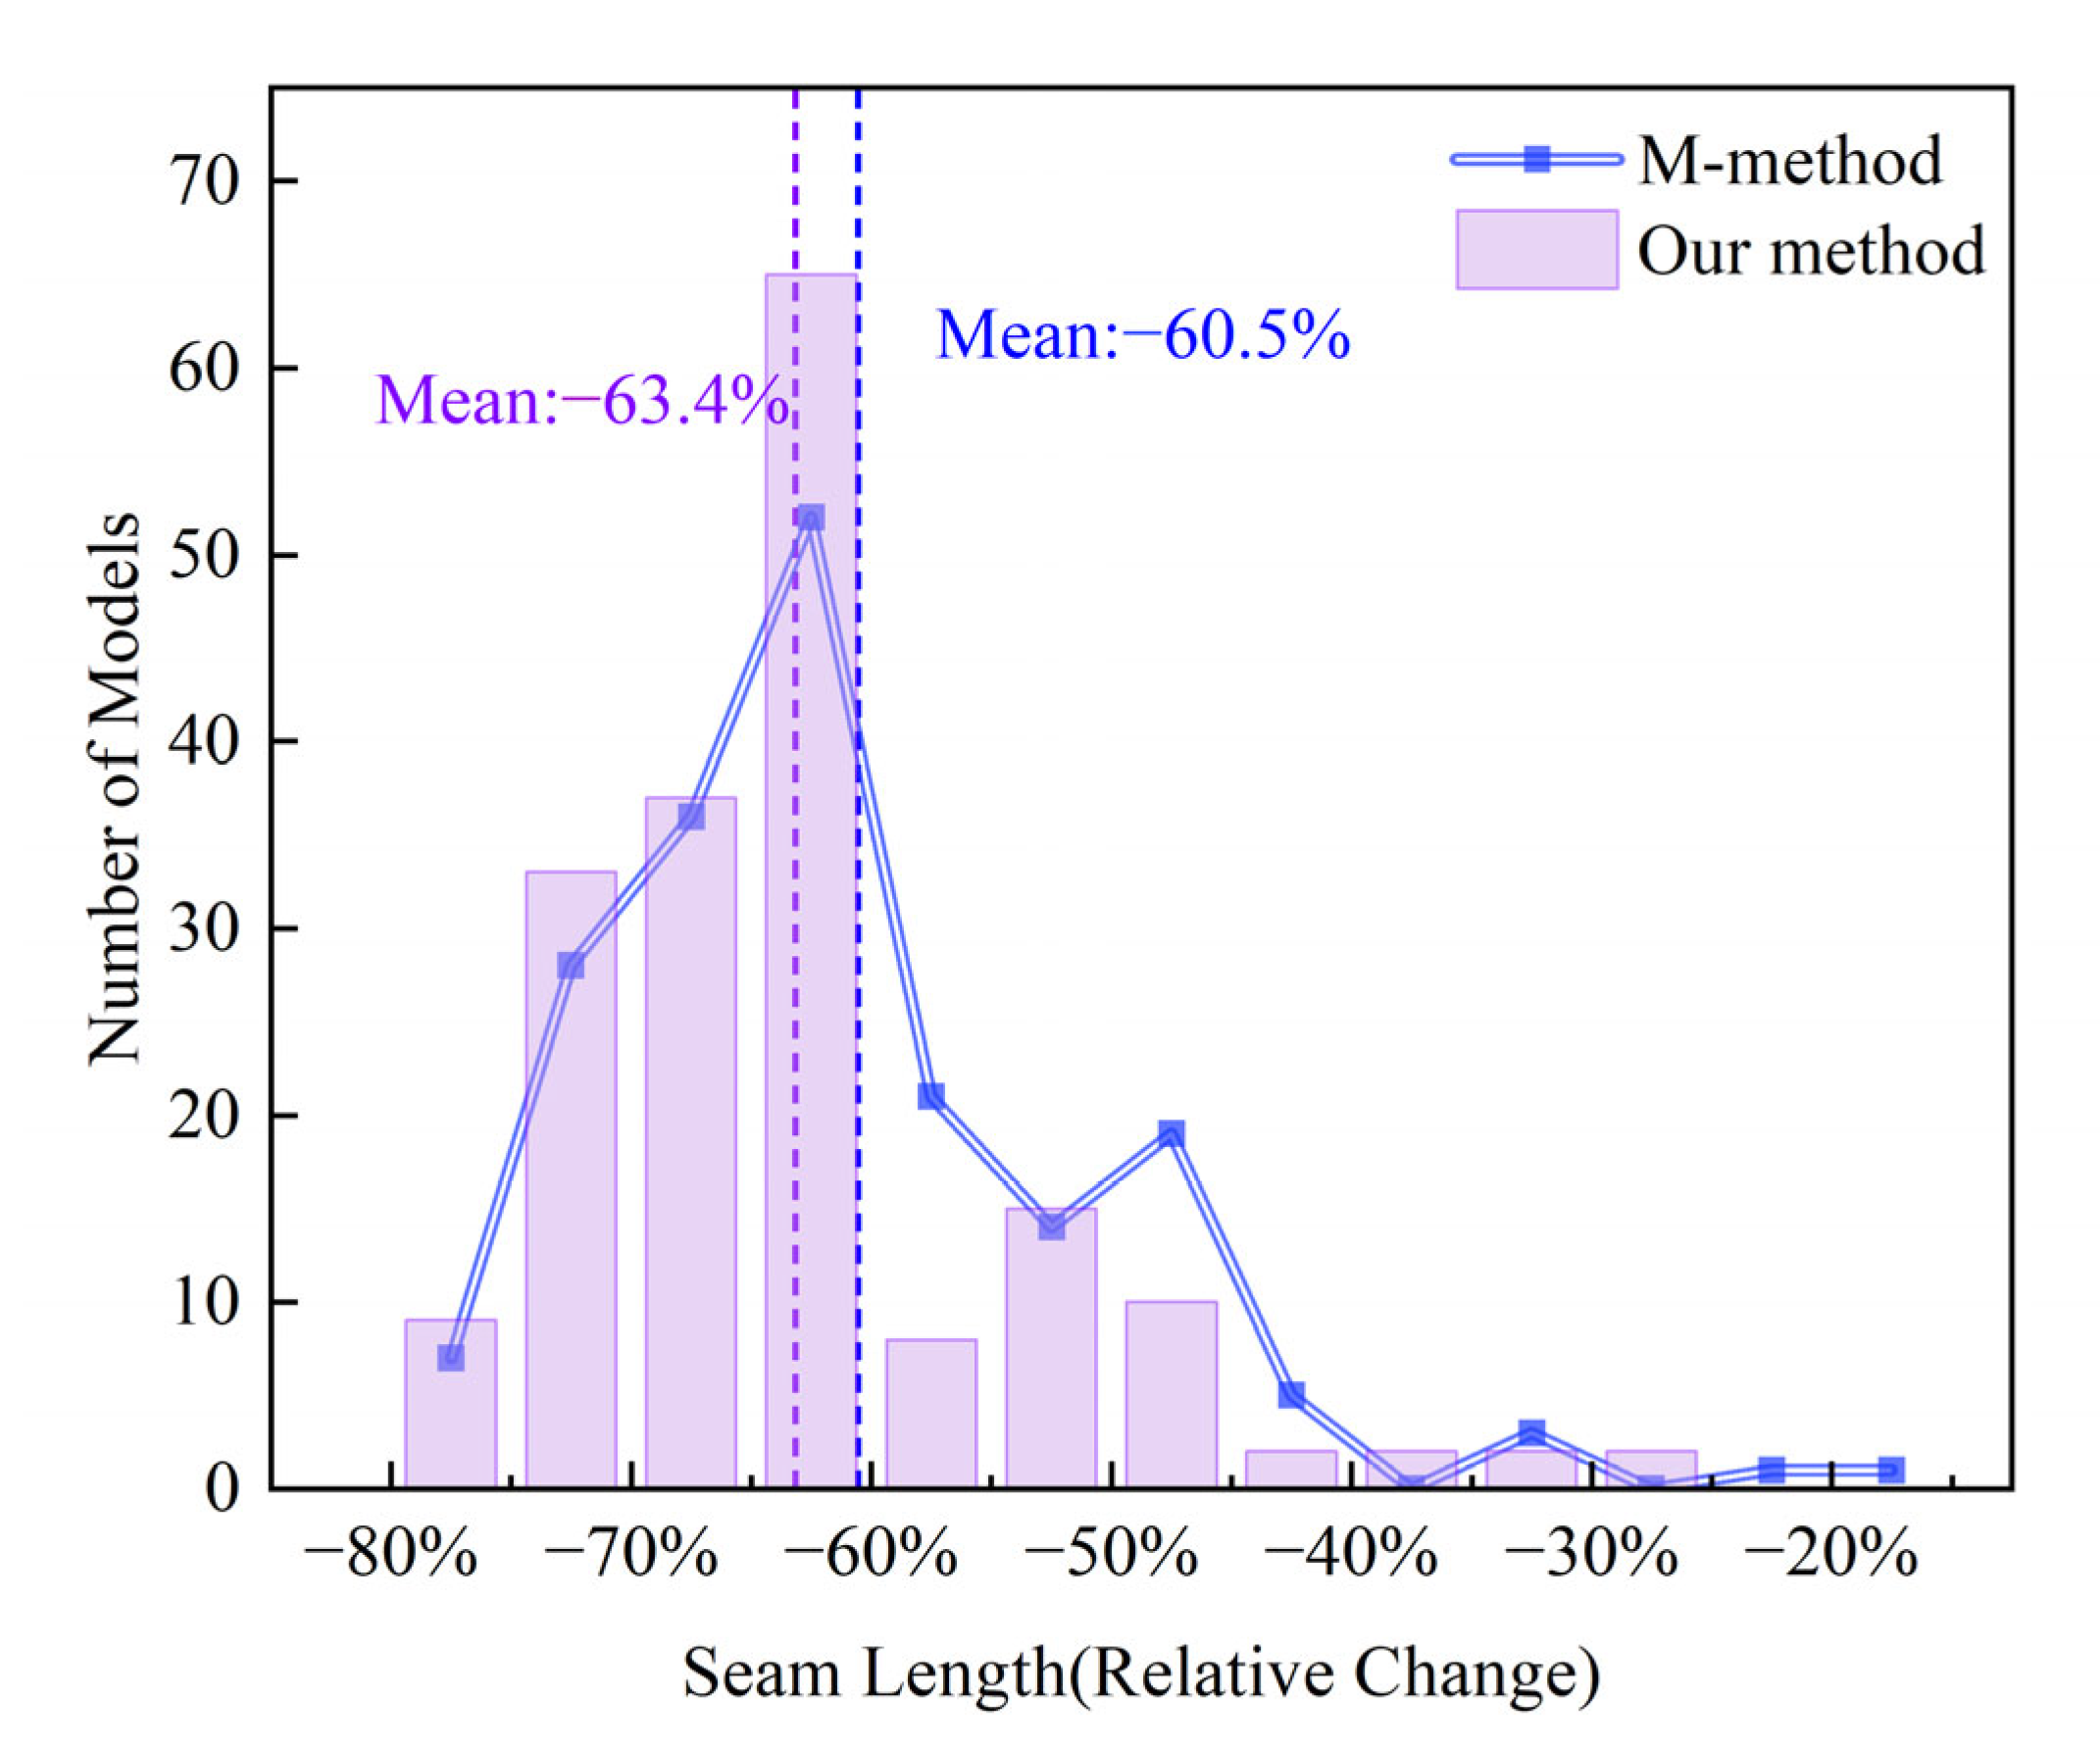
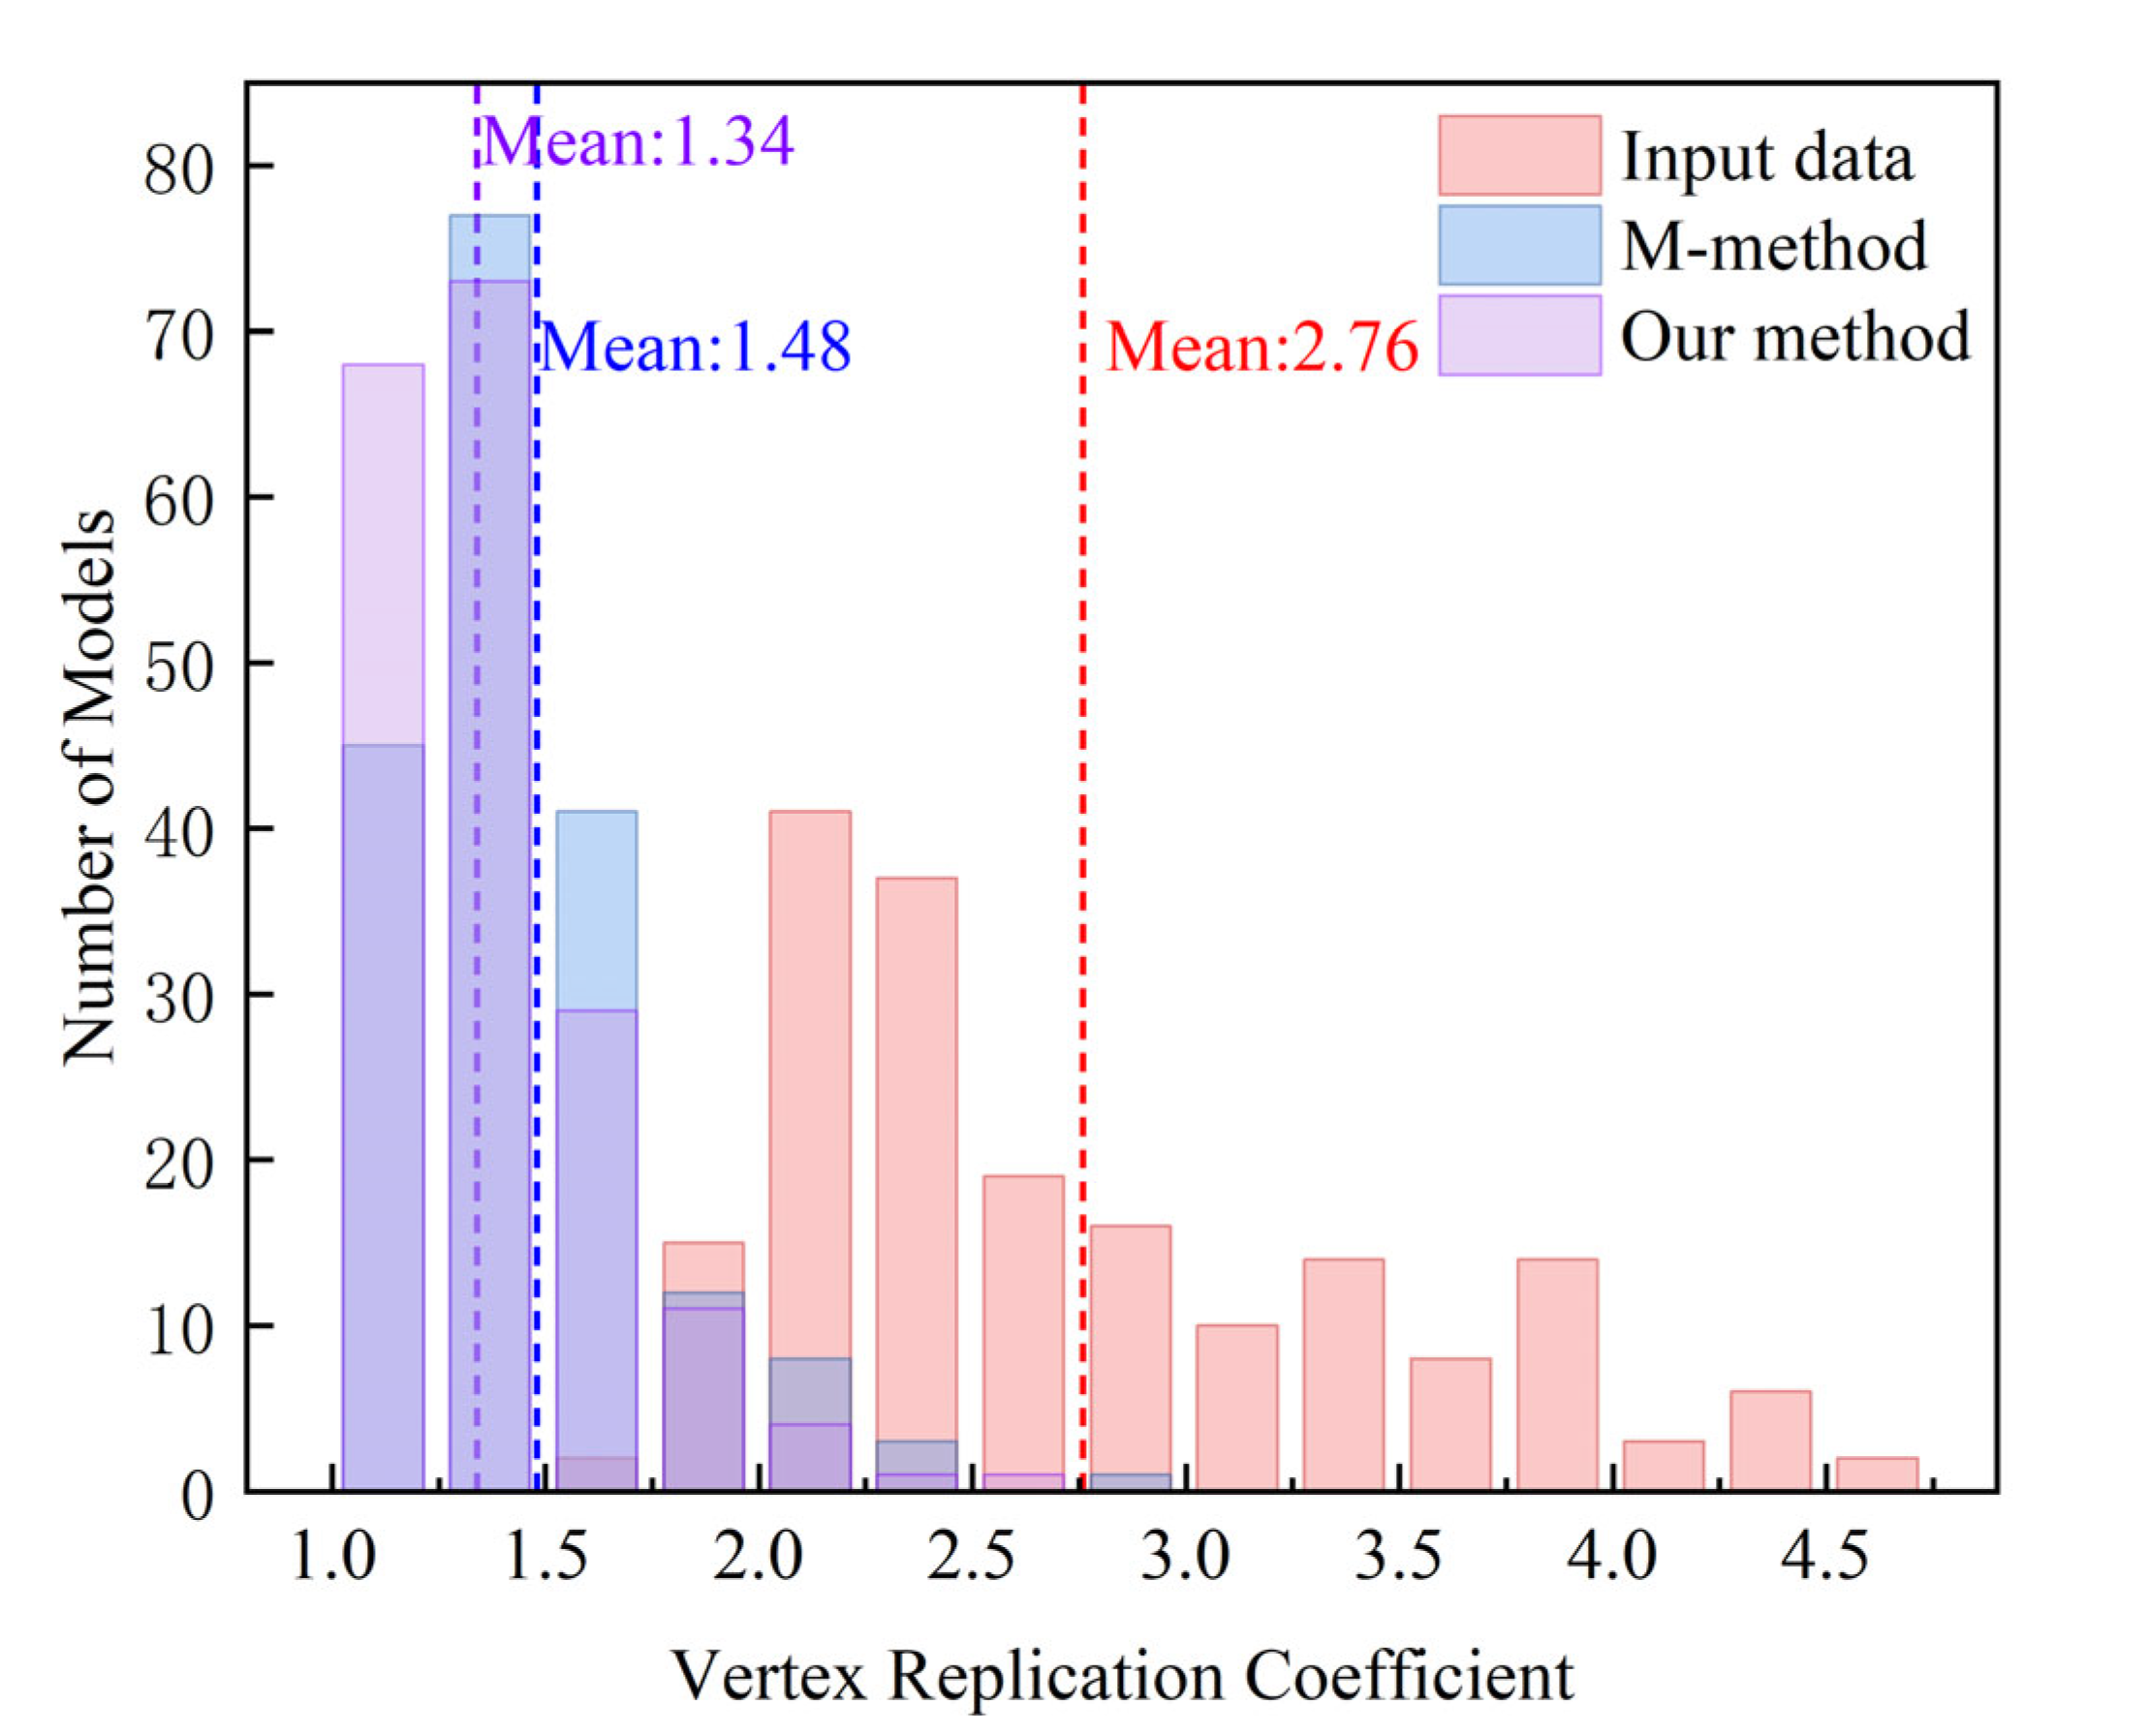
3.2.2. Comparison of Fragmentation Improvement

Figure 16 and Figure 17 present a quantitative assessment of the relative reduction in the number of texture charts and the length of texture seams. They both demonstrate a substantial decrease in fragmentation, with more than half of the models achieving a reduction exceeding 90% in the number of texture charts and over 70% in the length of texture seams. In terms of the chart number metric, while most models using the M-method fall within an 80–95% reduction range, our method’s peak interval ranges from 90 to 95%. The introduction of planar constraints suggests that texture seams at planar boundaries are inherently present to some extent. Consequently, the metric of texture seam length does not exhibit a distinct advantage over the M-method.

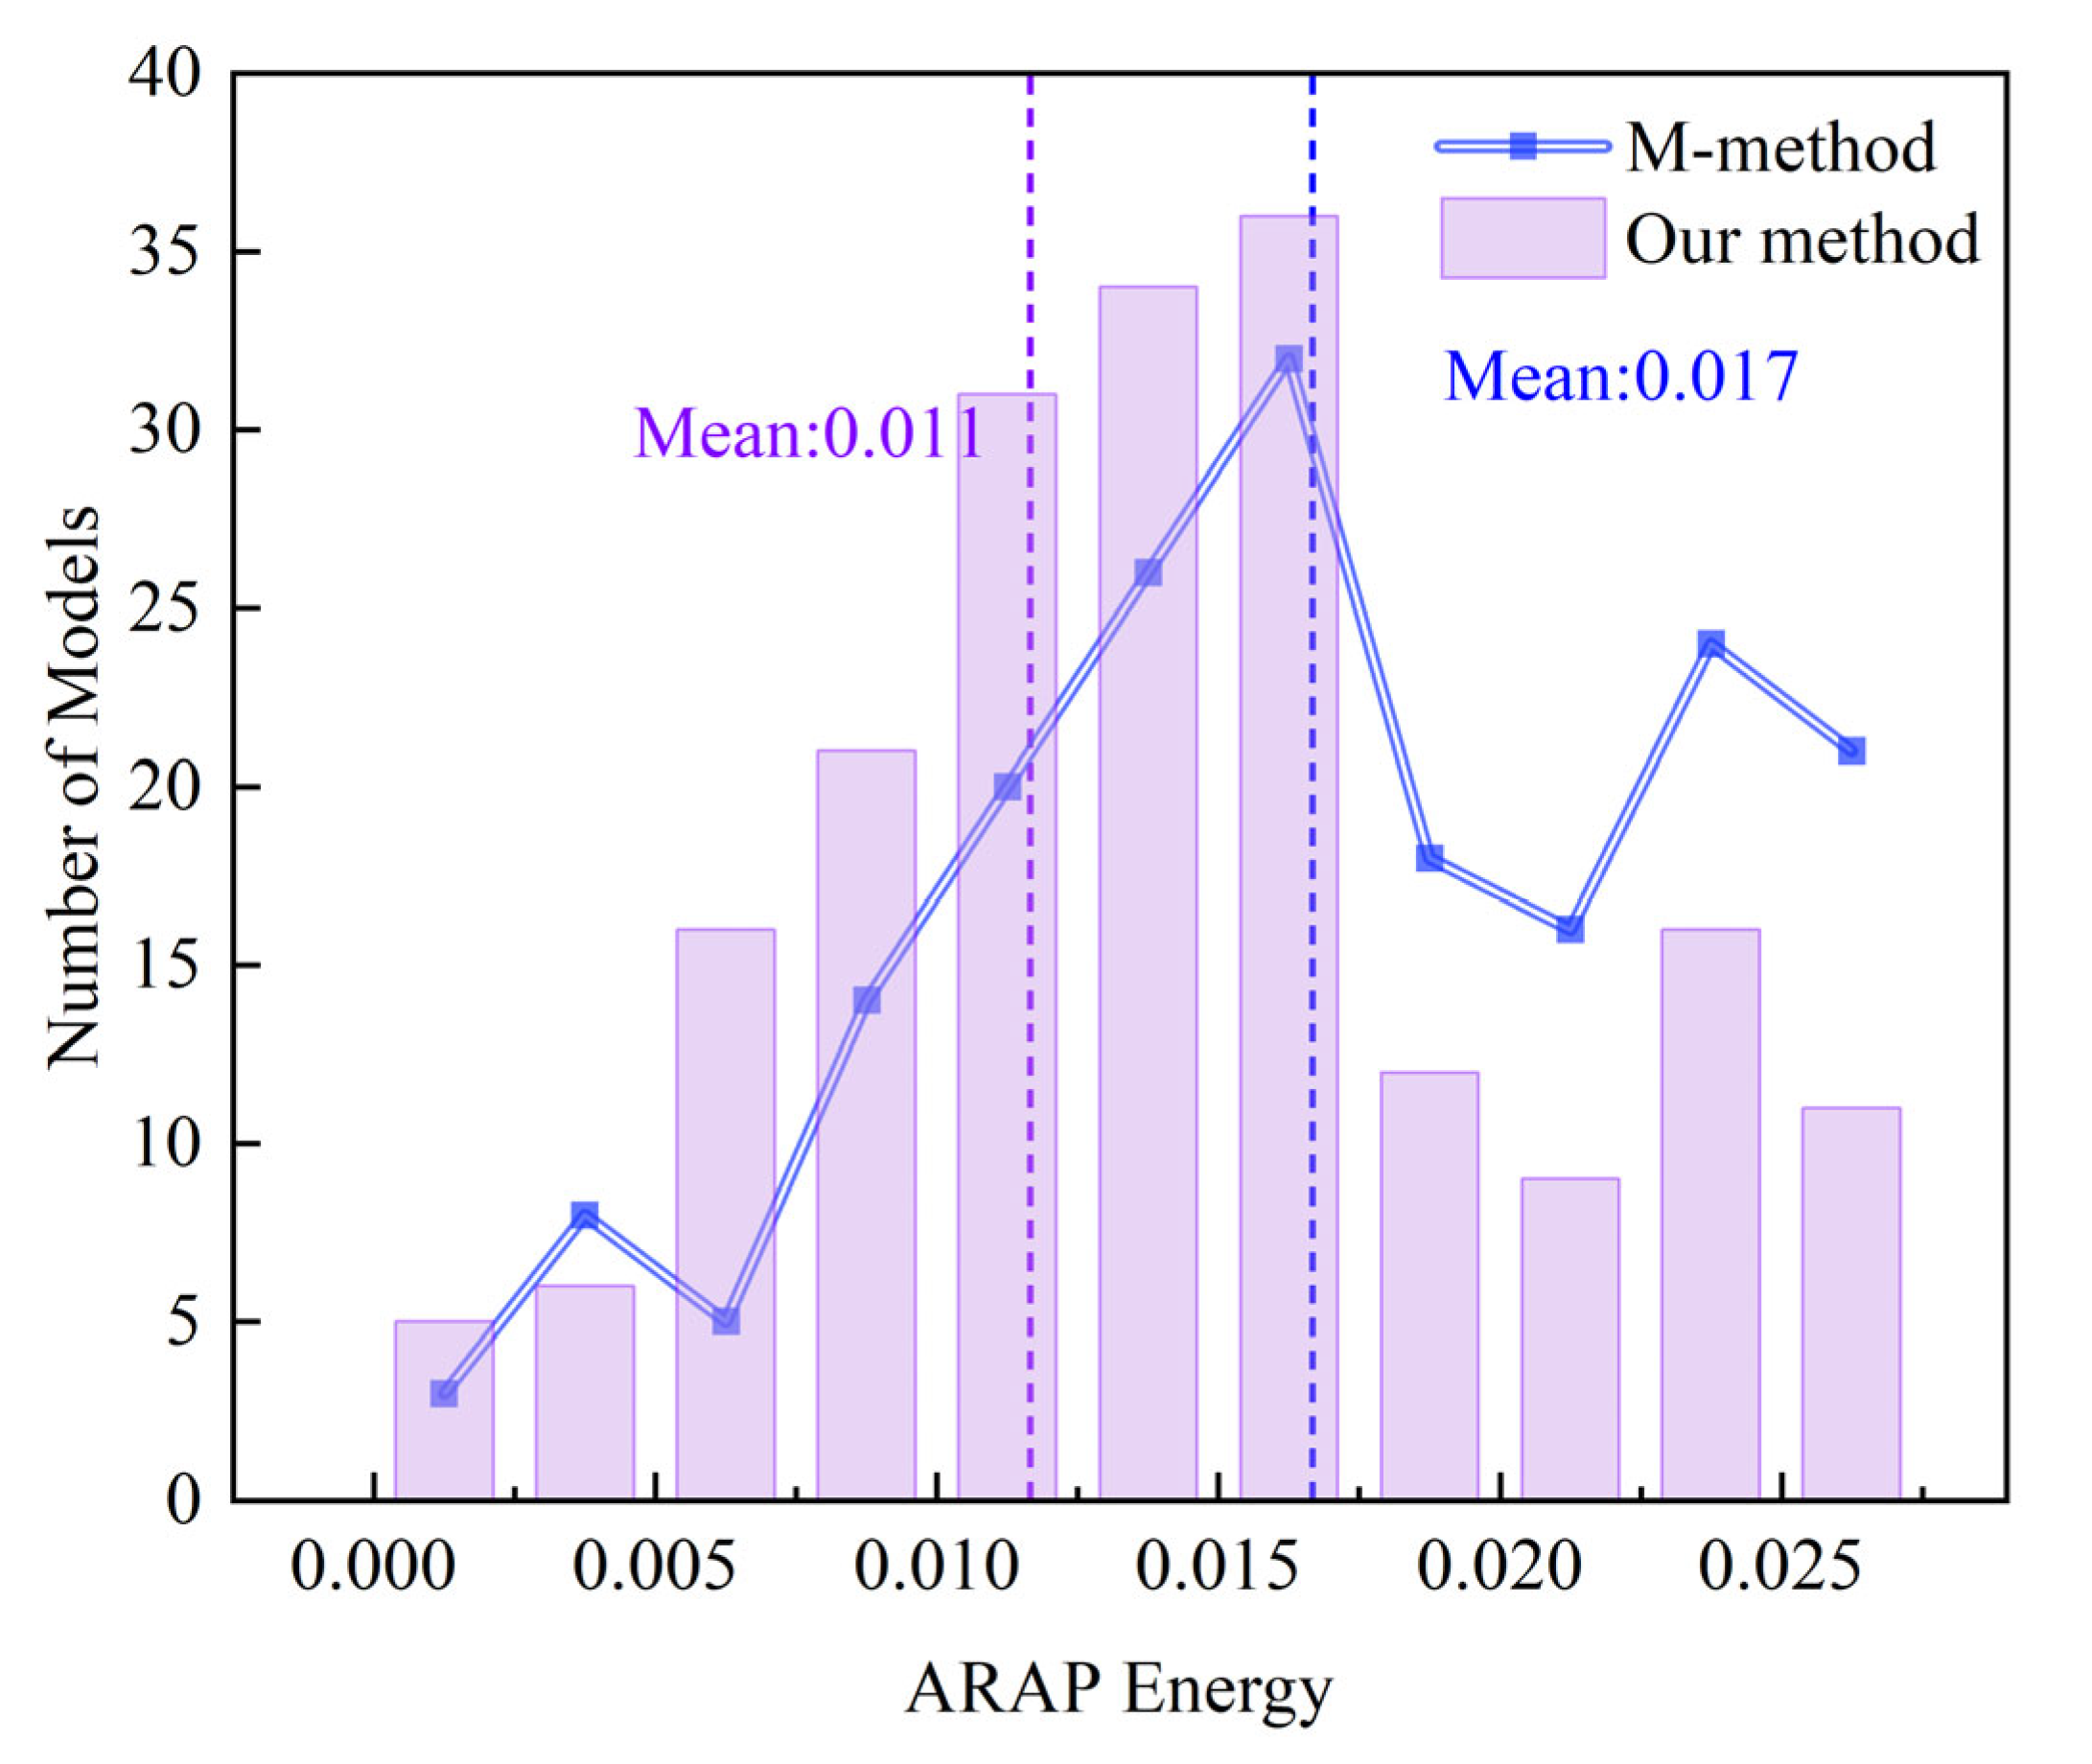
3.2.3. Evaluation of Global Distortion

A quantitative evaluation was performed to measure the global distortion of textures in comparison to the original textures by analyzing the values of the ARAP energy function between the M-method and our approach. As indicated in Figure 18, the median value for our method is 0.011, in contrast to the M-method’s median of 0.017, signifying a consistently lower degree of texture deformation with our method. It is noteworthy that both methods set the maximum global energy during the merging process at 0.025; hence, the median value rather than the mean provides a more accurate reflection of the overall deformation.

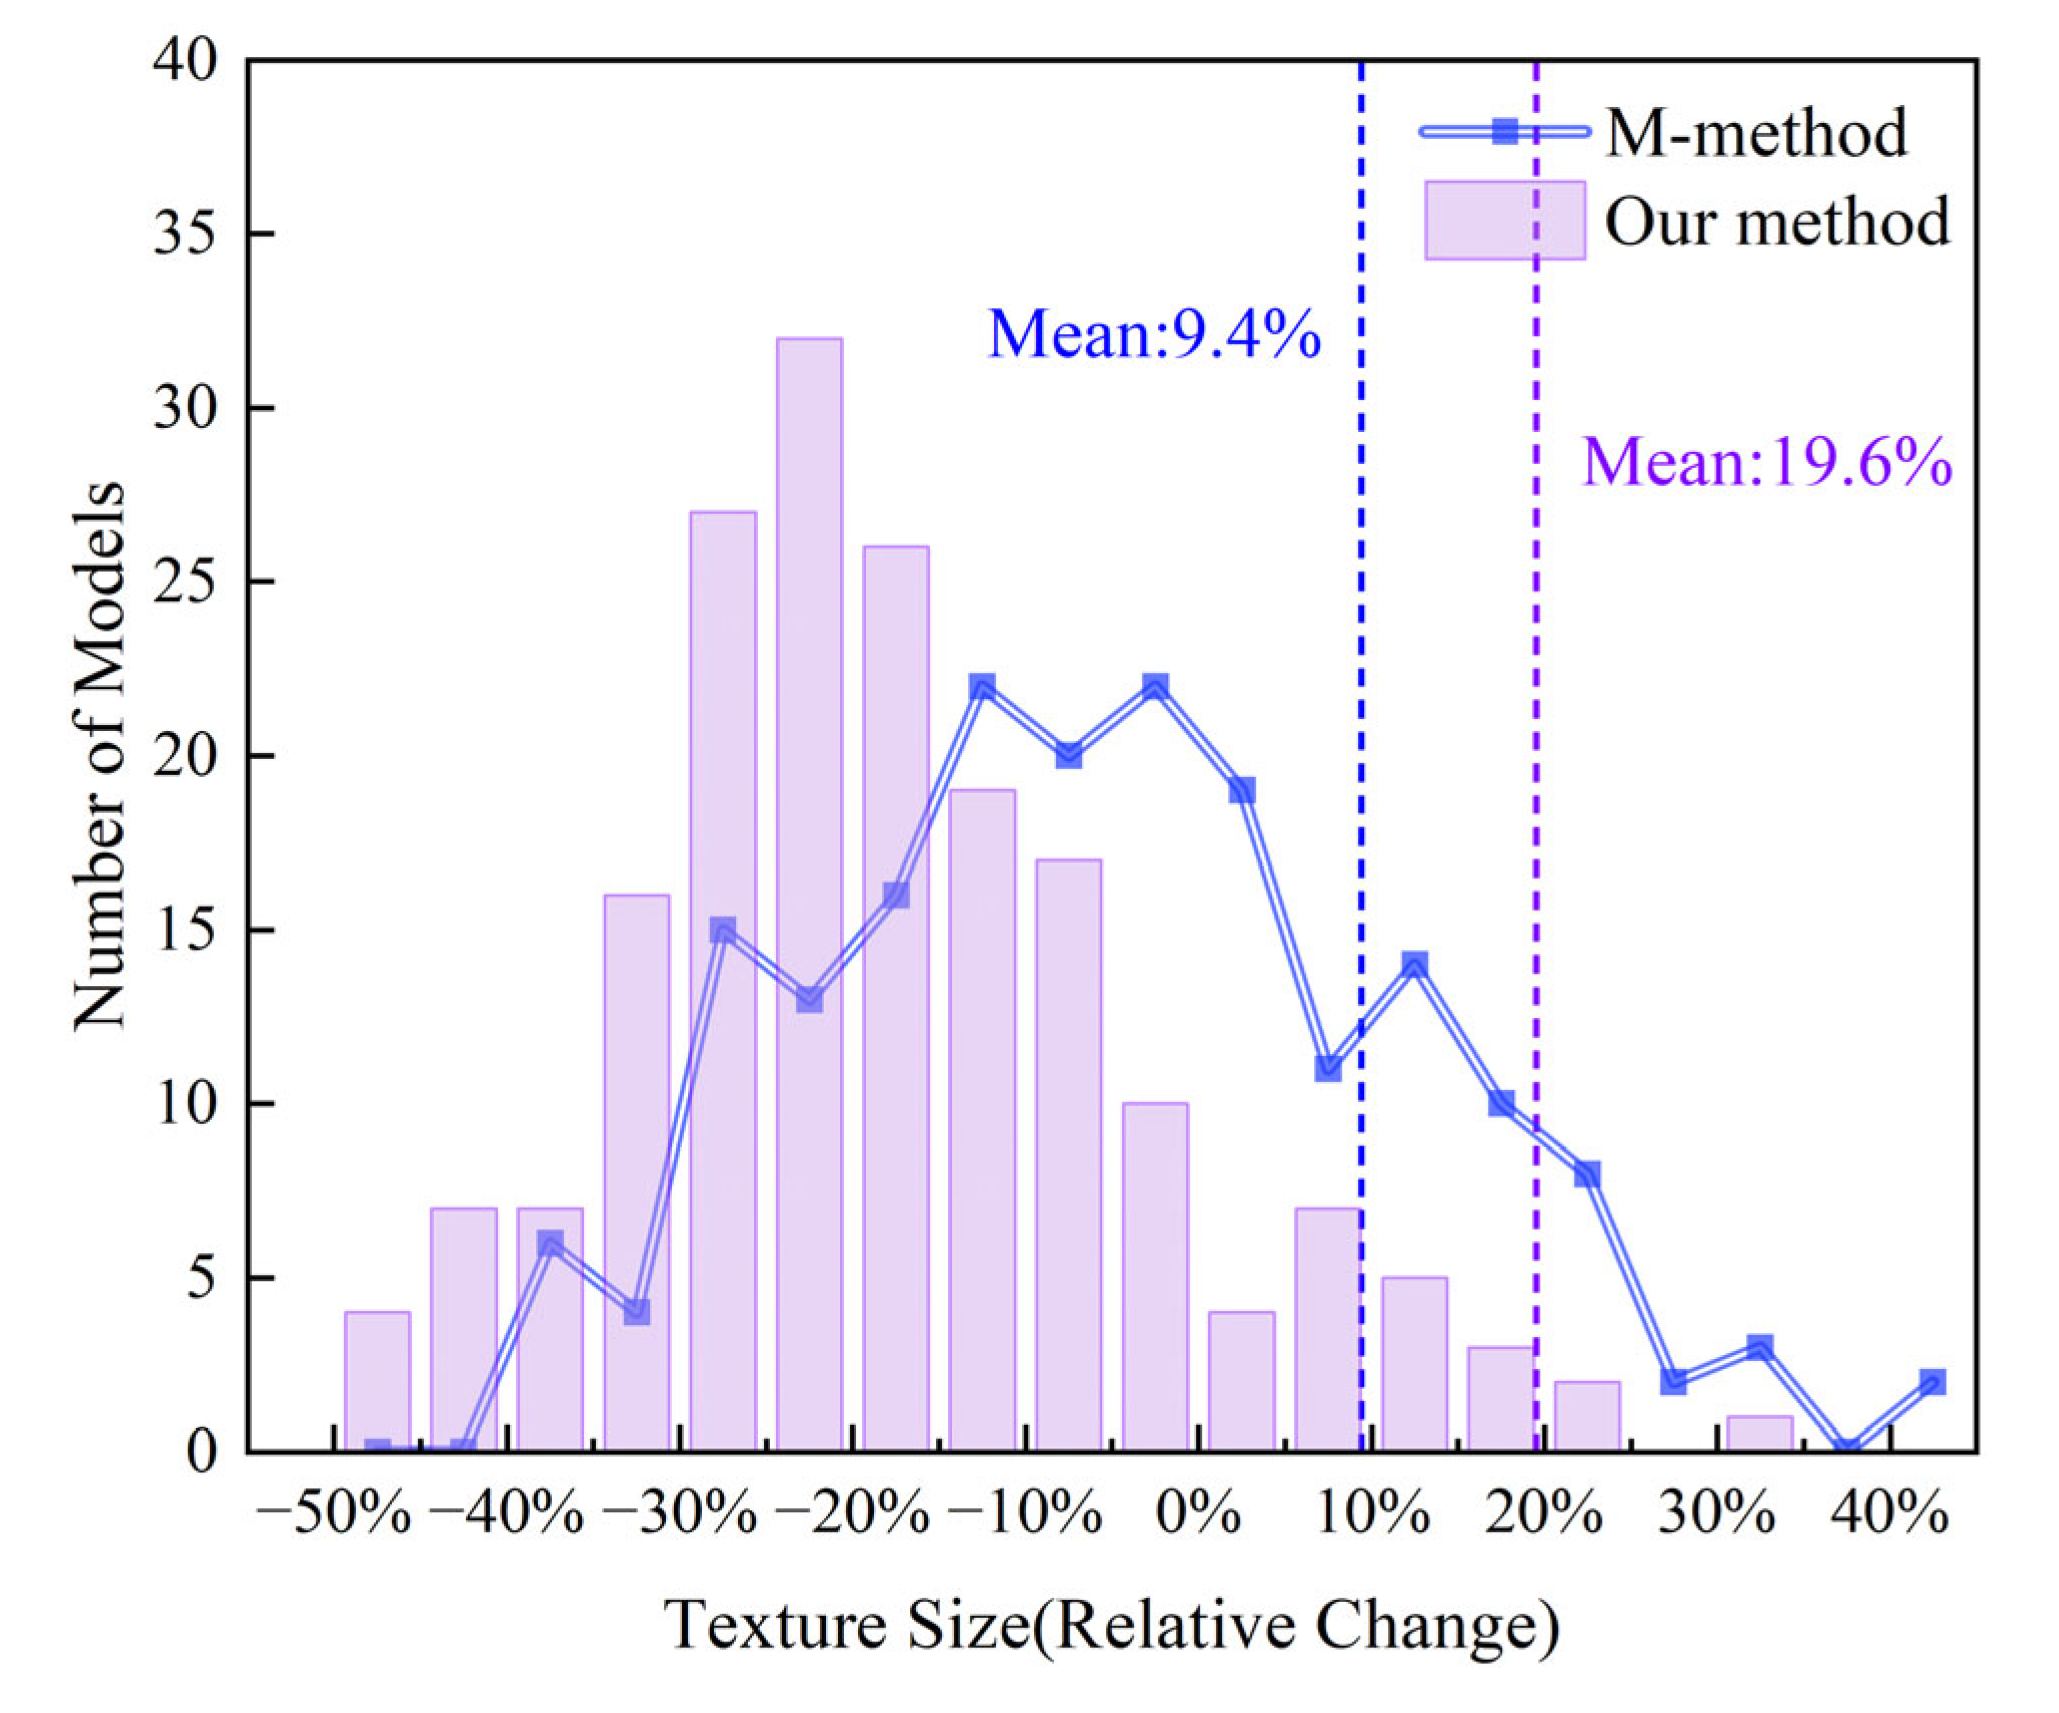
3.2.4. Evaluation of Memory Usage

Figure 19 illustrates the relative change in resource space utilization for texture images within the OBJ file of the model post texture merging. Our method averages a 19.6% reduction in space usage, which marks a significant improvement over the M-method’s overall average reduction of 6.4%. In some instances, merged textures may be larger than the inputs due to the inherent padding size used to ensure correct MIP-mapping filtering, along with space inefficiencies caused by the minimum bounding rectangle for complex shapes. Nevertheless, our approach still maintains a higher packing efficiency for large and geometrically regular charts compared to the M-method.
In Figure 20, we illustrate the variation in vertex replication coefficients before and after applying our method and the M-method, which refers to the ratios of the number of 2D vertices to 3D vertices. Vertex replication is essential for the formation and storage of seams, impacting key metrics affecting model rendering such as the memory required for storage and GPU buffer utilization. Our method effectively reduces the vertex replication rates of building models, achieving superior results compared to the M-method.

3.3. Discussion

When compared with the general texture defragmentation method [12], our texture merging strategy under the constraint of planar features is more effective for building models with clear, sharp geometric characteristics. Firstly, it is more effective in reducing texture fragmentation, leading to a more cohesive visual appearance. Secondly, it efficiently optimizes the use of texture space, reducing unnecessary waste. Thirdly, the textures generated by our method are more uniform and align well with the building’s architecture. Our method provides a possibility to modify textures directly, which can be achieved without the need for complex mapping software, thereby streamlining the workflow for modelers.
In terms of application scenarios, our method is particularly advantageous for constructed solid geometry buildings and simple urban scenes where planar features are prominent and easily definable. However, it does encounter limitations when applied to more complex or diverse urban environments where the geometric features are not as clear-cut. The method’s reliance on the distinctness of planar features can be a constraint in itself, as it may not fully capture the intricacy of more elaborate architectural elements. For further research, the texture fragmentation results could be improved by refining the definition of merging constraints of building models.

4. Conclusions

Texture fragmentation presents an inherent challenge in the texture reconstruction process of the digital photogrammetric pipeline. This study specifically addresses texture fragmentation in urban building models while maintaining their geometric integrity. We methodically merge and reorganize the texture charts. Initially, the inherent patch structure is identified, followed by optimized patch-based region-growing to detect the planar features of buildings. These planar results effectively preserve most intrinsic structural elements, including facades and roofs, establishing the foundational framework for subsequent texture chart merging. Then, within planar features constraints, a rule-based merging strategy is specified, considering the merging potential at each texture seam. The merge operation comprises two steps: alignment and optimization of charts. Finally, a “Square Tetris” packing method, apt for regular textures, is employed to pack and generate the texture atlas, yielding the final textured models. Compared to traditional texture merging methods, our approach effectively enhances texture fragmentation while controlling distortion and minimizing texture size.
Looking to the future, we see several avenues for research that could extend the capabilities of our method. A primary objective will be to refine the criteria we use to determine how texture charts are merged. This refinement will involve two specific strategies: incorporating semantic constraints and applying preprocessing to accentuate the geometric characteristics of the model. These advancements could broaden the applicability of our method, making it a more versatile tool for urban development and 3D modeling across a wider range of scenarios.

Author Contributions

Conceptualization, X.H., Z.L. and F.Z.; methodology, B.L., W.L., Z.L. and F.Z.; writing—original draft preparation, B.L. and W.L.; writing—review and editing, B.L., X.H. and T.M.A.; funding acquisition, T.M.A. All authors have read and agreed to the published version of the manuscript.

Funding

This research was supported by the Fundamental Research Funds for the Central Universities (Grant No. 2042024KF0035) and the Deanship of Scientific Research at Northern Border University, Arar, Kingdom of Saudi Arabia (Project Number NBU-FFR-2024-1907-06).

Data Availability Statement

Data are contained within the article.

Acknowledgments

This research was supported by the Fundamental Research Funds for the Central Universities (Grant No. 2042024KF0035). The authors extend their appreciation to the Deanship of Scientific Research at Northern Border University, Arar, KSA for funding this research work through project number NBU-FFR-2024-1907-06.

Conflicts of Interest

Authors Wenxuan Liu, Fan Zhang and Xianfeng Huang are employees of the Wuhan Daspatial Technology Co., Ltd. The research was conducted in the absence of any commercial or financial relationships that could be construed as a potential conflict of interest.

References

  1. Li, Z.; Yuxuan, L.; Yangjie, S.; Chaozhen, L.; Haibin, A.; Zhongli, F. A Review of Developments in the Theory and Technology of Three-Dimensional Reconstruction in Digital Aerial Photogrammetry. Acta Geod. Cartogr. Sin. 2022, 51, 1437. [Google Scholar]
  2. Maggiordomo, A.; Ponchio, F.; Cignoni, P.; Tarini, M. Real-World Textured Things: A Repository of Textured Models Generated with Modern Photo-Reconstruction Tools. Comput. Aided Geom. Des. 2020, 83, 101943. [Google Scholar] [CrossRef]
  3. Yuksel, C.; Lefebvre, S.; Tarini, M. Rethinking Texture Mapping. Comput. Graph. Forum 2019, 38, 535–551. [Google Scholar] [CrossRef]
  4. Li, M.; Kaufman, D.M.; Kim, V.G.; Solomon, J.; Sheffer, A. OptCuts: Joint Optimization of Surface Cuts and Parameterization. ACM Trans. Graph. 2018, 37, 247. [Google Scholar] [CrossRef]
  5. Liu, L.; Zhang, L.; Xu, Y.; Gotsman, C.; Gortler, S.J. A Local/Global Approach to Mesh Parameterization. Comput. Graph. Forum 2008, 27, 1495–1504. [Google Scholar] [CrossRef]
  6. Aigerman, N.; Lipman, Y. Orbifold Tutte Embeddings. ACM Trans. Graph. 2015, 34, 190:1–190:12. [Google Scholar] [CrossRef]
  7. Sawhney, R.; Crane, K. Boundary First Flattening. ACM Trans. Graph. 2017, 37, 5. [Google Scholar] [CrossRef]
  8. Claici, S.; Bessmeltsev, M.; Schaefer, S.; Solomon, J. Isometry-Aware Preconditioning for Mesh Parameterization. Comput. Graph. Forum 2017, 36, 37–47. [Google Scholar] [CrossRef]
  9. Rabinovich, M.; Poranne, R.; Panozzo, D.; Sorkine-Hornung, O. Scalable Locally Injective Mappings. ACM Trans. Graph. 2017, 36, 16. [Google Scholar] [CrossRef]
  10. Jiang, Z.; Schaefer, S.; Panozzo, D. Simplicial Complex Augmentation Framework for Bijective Maps. ACM Trans. Graph. 2017, 36, 186:1–186:9. [Google Scholar] [CrossRef]
  11. Chu, L.; Pan, H.; Liu, Y.; Wang, W. Repairing Man-Made Meshes via Visual Driven Global Optimization with Minimum Intrusion. ACM Trans. Graph. 2019, 38, 158. [Google Scholar] [CrossRef]
  12. Maggiordomo, A.; Cignoni, P.; Tarini, M. Texture Defragmentation for Photo-Reconstructed 3D Models. Comput. Graph. Forum 2021, 40, 65–78. [Google Scholar] [CrossRef]
  13. Li, Y.; Gong, G.; Liu, C.; Zhao, Y.; Qi, Y.; Lu, C.; Li, N. Hybrid Method of Connection Evaluation and Framework Optimization for Building Surface Reconstruction. Remote Sens. 2024, 16, 792. [Google Scholar] [CrossRef]
  14. Lempitsky, V.; Ivanov, D. Seamless Mosaicing of Image-Based Texture Maps. In Proceedings of the 2007 IEEE Conference on Computer Vision and Pattern Recognition, Minneapolis, MN, USA, 17–22 June 2007; pp. 1–6. [Google Scholar] [CrossRef]
  15. Gal, R.; Wexler, Y.; Ofek, E.; Hoppe, H.; Cohen-Or, D. Seamless Montage for Texturing Models. Comput. Graph. Forum 2010, 29, 479–486. [Google Scholar] [CrossRef]
  16. Fu, Y.; Yan, Q.; Liao, J.; Xiao, C. Joint Texture and Geometry Optimization for RGB-D Reconstruction. In Proceedings of the 2020 IEEE/CVF Conference on Computer Vision and Pattern Recognition (CVPR), Seattle, WA, USA, 13–19 June 2020; pp. 5949–5958. [Google Scholar] [CrossRef]
  17. Li, S.; Xiao, X.; Guo, B.; Zhang, L. A Novel OpenMVS-Based Texture Reconstruction Method Based on the Fully Automatic Plane Segmentation for 3D Mesh Models. Remote Sens. 2020, 12, 3908. [Google Scholar] [CrossRef]
  18. Xiang, H.; Huang, X.; Lan, F.; Yang, C.; Gao, Y.; Wu, W.; Zhang, F. A Shape-Preserving Simplification Method for Urban Building Models. ISPRS Int. J. Geo-Inf. 2022, 11, 562. [Google Scholar] [CrossRef]
  19. Drobnyi, V.; Hu, Z.; Fathy, Y.; Brilakis, I. Construction and Maintenance of Building Geometric Digital Twins: State of the Art Review. Sensors 2023, 23, 4382. [Google Scholar] [CrossRef]
  20. Oechsle, M.; Mescheder, L.; Niemeyer, M.; Strauss, T.; Geiger, A. Texture Fields: Learning Texture Representations in Function Space. In Proceedings of the 2019 IEEE/CVF International Conference on Computer Vision (ICCV), Seoul, Republic of Korea, 27 October–2 November 2019; IEEE: Piscataway, NJ, USA, 2019; pp. 4530–4539. [Google Scholar] [CrossRef]
  21. Sander, P.V.; Snyder, J.; Gortler, S.J.; Hoppe, H. Texture Mapping Progressive Meshes. In Proceedings of the 28th Annual Conference on Computer Graphics and Interactive Techniques (SIGGRAPH ’01), Los Angeles, CA, USA, 12–17 August 2001; Association for Computing Machinery: New York, NY, USA, 2001; pp. 409–416. [Google Scholar] [CrossRef]
  22. Vo, A.-V.; Truong-Hong, L.; Laefer, D.F.; Bertolotto, M. Octree-Based Region Growing for Point Cloud Segmentation. ISPRS J. Photogramm. Remote Sens. 2015, 104, 88–100. [Google Scholar] [CrossRef]
  23. Schnabel, R.; Wahl, R.; Klein, R. Efficient RANSAC for Point-Cloud Shape Detection. Comput. Graph. Forum 2007, 26, 214–226. [Google Scholar] [CrossRef]
  24. Wang, X.; Zou, L.; Shen, X.; Ren, Y.; Qin, Y. A Region-Growing Approach for Automatic Outcrop Fracture Extraction from a Three-Dimensional Point Cloud. Comput. Geosci. 2017, 99, 100–106. [Google Scholar] [CrossRef]
  25. Smith, J.; Schaefer, S. Bijective Parameterization with Free Boundaries. ACM Trans. Graph. 2015, 34, 70. [Google Scholar] [CrossRef]
  26. Milenkovic, V.J. Rotational Polygon Containment and Minimum Enclosure Using Only Robust 2D Constructions. Comput. Geom. 1999, 13, 3–19. [Google Scholar] [CrossRef]
  27. Sander, P.V.; Wood, Z.J.; Gortler, S.J.; Snyder, J.; Hoppe, H. Multi-Chart Geometry Images. In Proceedings of the 2003 Eurographics/ACM SIGGRAPH Symposium on Geometry Processing, Aachen, Germany, 23–25 June 2003; Eurographics Association: Goslar, Germany, 2003; pp. 146–155. [Google Scholar]
  28. Lévy, B.; Petitjean, S.; Ray, N.; Maillot, J. Least Squares Conformal Maps for Automatic Texture Atlas Generation. ACM Trans. Graph. 2002, 21, 362–371. [Google Scholar] [CrossRef]
Figure 1. Pipeline of the proposed method. We first identify patch structures on the mesh based on texture charts, using them as primitives for plane detection. Subsequently, we iteratively merge and optimize charts constrained by planes. Finally, we tightly pack the relatively regular texture charts into a new texture atlas.
Remotesensing 16 04154 g001
Figure 2. Association between vertices at seams and their corresponding 2D texture coordinates in (a) the mesh, (b) its corresponding texture mapping, and (c) the textured model.
Remotesensing 16 04154 g002
Figure 4. Improvement of common issues in plane detection using our methods. (a) Jagged borders. (b) Elongated strip-like regions. (c) Small components with smooth curvature.
Remotesensing 16 04154 g004
Figure 5. Texture chart alignment diagram.
Remotesensing 16 04154 g005
Figure 6. Texture merging optimization diagram.
Remotesensing 16 04154 g006
Figure 7. Square Tetris packing strategy.
Remotesensing 16 04154 g007
Figure 8. Real-world three-dimensional scene data used for experiments.
Remotesensing 16 04154 g008
Figure 9. Building models with texture mapping. (a) Residential building. (b) Factory workshop. (c) Hotel.
Remotesensing 16 04154 g009
Figure 10. Texture maps of building models stored in the form of texture images. (a) Residential building. (b) Factory workshop. (c) Hotel.
Remotesensing 16 04154 g010
Figure 11. Visualization of the workflow results. (a) Shaded models of various building structures, showcasing their geometric characteristics. (b) Distribution of original texture patches on the 3D models, where different colors represent distinct texture charts. (c) Results of plane detection, with different colors indicating different planar regions. (d) Final results of texture merge under plane constraints.
Remotesensing 16 04154 g011
Figure 12. Local details of planar detection and merging results. (a) Plane detection of localized details including the intersection of eaves, small roof components, and facade windows, among others. (b) Local details of the texture merging results under plane constraints.
Remotesensing 16 04154 g012
Figure 13. Output results of the texture atlas generated by our method. (a) Residential building. (b) Factory workshop. (c) Hotel.
Remotesensing 16 04154 g013
Figure 14. Output results of the texture atlas generated by the M-method. (a) Residential building. (b) Factory workshop. (c) Hotel.
Remotesensing 16 04154 g014
Figure 15. Rendering comparison. (a) The original model of the factory. (b) The model after texture merging.
Remotesensing 16 04154 g015
Figure 16. A comparative analysis of the number of texture charts between the M-method and our approach.
Remotesensing 16 04154 g016
Figure 17. A comparative analysis of the length of texture seams between the M-method and our approach.
Remotesensing 16 04154 g017
Figure 18. A comparative analysis of the degree of texture distortion between the M-method and our approach.
Remotesensing 16 04154 g018
Figure 19. A comparative analysis of the texture size between the M-method and our approach.
Remotesensing 16 04154 g019
Figure 20. A comparative analysis of the vertex replication coefficient before and after texture defragmentation methods.
Remotesensing 16 04154 g020
Disclaimer/Publisher’s Note: The statements, opinions and data contained in all publications are solely those of the individual author(s) and contributor(s) and not of MDPI and/or the editor(s). MDPI and/or the editor(s) disclaim responsibility for any injury to people or property resulting from any ideas, methods, instructions or products referred to in the content.

