Technical Note

Boosting Point Set-Based Network with Optimal Transport Optimization for Oriented Object Detection

Research Center for Space Optical Engineering, Harbin Institute of Technology, Harbin 150001, China
*
Author to whom correspondence should be addressed.
These authors contributed equally to this work.
Remote Sens. 2024, 16(22), 4133; https://doi.org/10.3390/rs16224133
Submission received: 31 July 2024 / Revised: 7 October 2024 / Accepted: 15 October 2024 / Published: 6 November 2024

Abstract

:
When handling complex remote sensing scenarios, rotational angle information can improve detection accuracy and enhance algorithm robustness, providing support for fine-grained detection. Point set representation is one of the most commonly used methods in arbitrary-oriented object detection tasks, leveraging discrete feature points to represent oriented targets and achieve high accuracy in angle prediction. However, due to the inherent discreteness of point set representation, it is prone to significant impact from isolated points and representational ambiguity in harsh application scenarios, leading to inaccurate detection. To address this issue, an efficient aerial object detector named BE-Det is proposed, which uses the optimal transport (OT) strategy to constrain the positions of isolated points. Additionally, a candidate point set quality evaluation scheme is designed to effectively assess the quality of candidate point sets. Experimental results on two challenging aerial datasets demonstrate that the proposed method outperforms several advanced detection methods.

1. Introduction

Object detection in aerial images is aimed at classifying and locating remote-sensing instances and serves as an essential module for numerous applications such as aviation control, maritime rescue, and port management. Oriented bounding boxes can more precisely define the position and boundaries of targets, reducing false positives and missed detection, which supports higher-level pose recognition and intent inference. Methods such as SCRDet [1], CADNet [2], and GWD [3] have improved the detection performance of oriented objects to a certain extent. The aforementioned methods directly regress the angle parameters of the oriented bounding boxes, resulting in a discontinuity in angle loss and inconsistency in angle and localization regression. The point set representation method characterizes the oriented target through several discrete feature points and localizes the oriented target through the conversion process between the point set and the target box, which avoids the loss discontinuity and regression inconsistency caused by directly predicting the angle of objects. However, in various remote sensing application scenarios, object detection tasks are often affected by unclear boundary problems such as adjacent similar objects and background with strong correlation features, as shown in Figure 1a, which prevent good detection results from being achieved. For point set representation methods, the trade-off between angle and position prediction results in weak localization ability, making it difficult to fully study unclear boundary geometric features when facing those situations.
As shown in Figure 1b, the above problems lead to a situation where some learned points are easily misguided and move to positions far away from the ground-truth target boundary. To effectively address the above issues, we revisited the supervision method for point set representation and the label assignment method, aiming to mitigate the impact of unclear boundaries. Previous methods typically selected a few points from the point set to construct a convex quadrilateral, using one-to-one point matching or Intersection over Union (IoU) for localization supervision. However, this supervision method cannot effectively constrain all discrete points in the point set, and inconsistencies between the point set-to-bounding box conversion methods during training and inference lead to outlier points. Additionally, in the label assignment process, the existence of unclear boundaries causes inconsistencies between classification loss and bounding box quality. Therefore, using the simple sum of classification and localization losses as the basis for positive sample matching fails to select the relatively optimal candidates for ground-truth targets.
In this work, to address practical application scenarios involving mutual interference between adjacent targets and background misguidance issues, a rotated object detector is proposed for remote sensing images, named Boundary Enhancement Detector (BE-Det). Mutual interference and background misguidance cause point set misplacement in harsh application scenarios. To achieve comprehensive constraint of the point set during localization supervision, unlike previous point set representation methods, the optimal transport theory is introduced to construct a one-to-many point matching mode based on the original one-to-one point matching method. By learning the matching relationship between ground-truth corner points and discrete feature points in the point set, we optimize the rotated box localization capability and prevent the occurrence of outlier points. Additionally, to construct target classification scores with localization awareness, an effective candidate point set quality evaluation scheme is proposed. By combining the target’s rotation attributes and the correlation of matching points, we effectively evaluate and rank candidate point sets.
To address the issue of unclear boundaries, the main contribution of this work is summarized as follows:
  • An effective remote sensing image object detector is proposed, which can significantly optimize the point set localization supervision process through a one-to-many matching method.
  • A novel comprehensive quality evaluation scheme for point set representation methods is proposed, which contributes to the selection of high-quality candidate point sets.
The remainder of this article is organized as follows. We introduce the related works and existing problems of oriented object detection in Section 2. Section 3 illustrates the rationale and details of the proposed framework. In Section 4, we validate the effectiveness of the proposed method and present the experimental results based on two public datasets. Finally, we draw the conclusions in Section 5.

2. Related Work

2.1. Oriented Object Detection Based on Point Set Representation

Remote sensing object detection methods primarily focus on introducing angle regression into classical general object detectors. Methods such as SCRDet [1], CADNet [2], DRN [4], R3Det [5], ReDet [6], AO2-DETR [7], RTMDet [8], LSKDet [9] and Oriented RCNN [10] directly predict the rotation angles of the bounding boxes, achieving relatively satisfactory detection performance. To address the inconsistency between angle regression and coordinate regression metrics, Gliding Vertex [11] and RSDet [12] improve detection performance by constructing new representations for rotated bounding boxes. Additionally, to alleviate the discontinuity problem in angle regression, CSL [13] and ARS-DETR [14] transforms the angle prediction regression problem into a classification problem, avoiding the abrupt changes in angle regression. GWD [3], KLD [15] and RHINO [16] utilize new Gaussian loss functions to achieve IoU-based optimization for rotated bounding box regression. However, these methods’ performance and robustness are limited by the periodicity of angle regression.
Inspired by the idea of RepPoints [17] representing bounding boxes with discrete feature points, the point set representation-based method for rotated object detection uses the positional relationships between discrete feature points to represent the position and rotation information of bounding boxes, effectively avoiding the limitations of traditional angle regression. CFA [18] leverages the spatial constraint capability of sampling points to generate a convex hull for each rotated object and optimizes it using the CIoU loss. To explore the rotational information within the point set, Oriented RepPoints [19] further designs an Adaptive Point Assessment and Allocation (APAA) scheme, evaluating each candidate point set from the aspects of classification, localization, directional alignment, and point-by-point correlation, achieving good detection performance in anchor-free methods. G-Rep [20] transforms the point set into a gaussian distribution form and optimizes the parameter regression method. The point set representation method extracts geometric feature information of the object in the form of feature points, eliminating the localization errors caused by direct angle regression and enhancing sensitivity to the object’s rotational information. While these point set representation methods overcome the limitations of angle regression on detection performance, the discrete nature of the point set regression process cannot effectively eliminate the impact of outlier points.

2.2. Quality Assessment and Sample Assignment for Object Detection

Many object detection algorithms evaluate the quality of candidate samples using object classification loss and set fixed IoU thresholds to select positive samples [21,22,23]. However, this approach does not ensure the overall quality of the training samples. Additionally, many works have attempted to use label assignment methods with self-learning optimization strategies to select high-quality samples and further improve detection performance. FreeAnchor [24] allocates k candidate anchor boxes to each ground-truth target based on IoU and then proposes a customized detection likelihood estimate to perform positive and negative sample division within each candidate set. ATSS [25] divides candidate samples using the concept of centerness and then uses the mean and variance in the IoU values of candidate samples as the threshold for positive and negative samples. PAA [26], based on ATSS [25], assumes that the joint loss distribution of positive and negative samples follows a Gaussian distribution and adaptively selects positive and negative samples through probability distribution.
In the task of rotated object detection in remote sensing images, the inclusion of rotational information leads to the issue of prediction diversity. To select higher-quality samples for training, DAL [27] introduces a matching degree parameter to evaluate the localization quality of rotated boxes and uses a matching sensitive loss to strengthen the correlation between classification and localization tasks. Oriented RepPoints [19] incorporates directional alignment information into the sample assignment process, enhancing the directional alignment capability in sample quality evaluation.
Due to issues like background interference, the classification features at the object boundary are weakened, causing severe distortion of classification loss during sample quality evaluation. To address this, VFNet [28] and GFLV1 [29] reconstruct classification loss functions with IoU evaluation capability. In this work, we need to design an effective quality evaluation and sample assignment scheme that includes directional alignment capability while achieving classification metric design guided by localization information.

3. Proposed Method

3.1. Overview

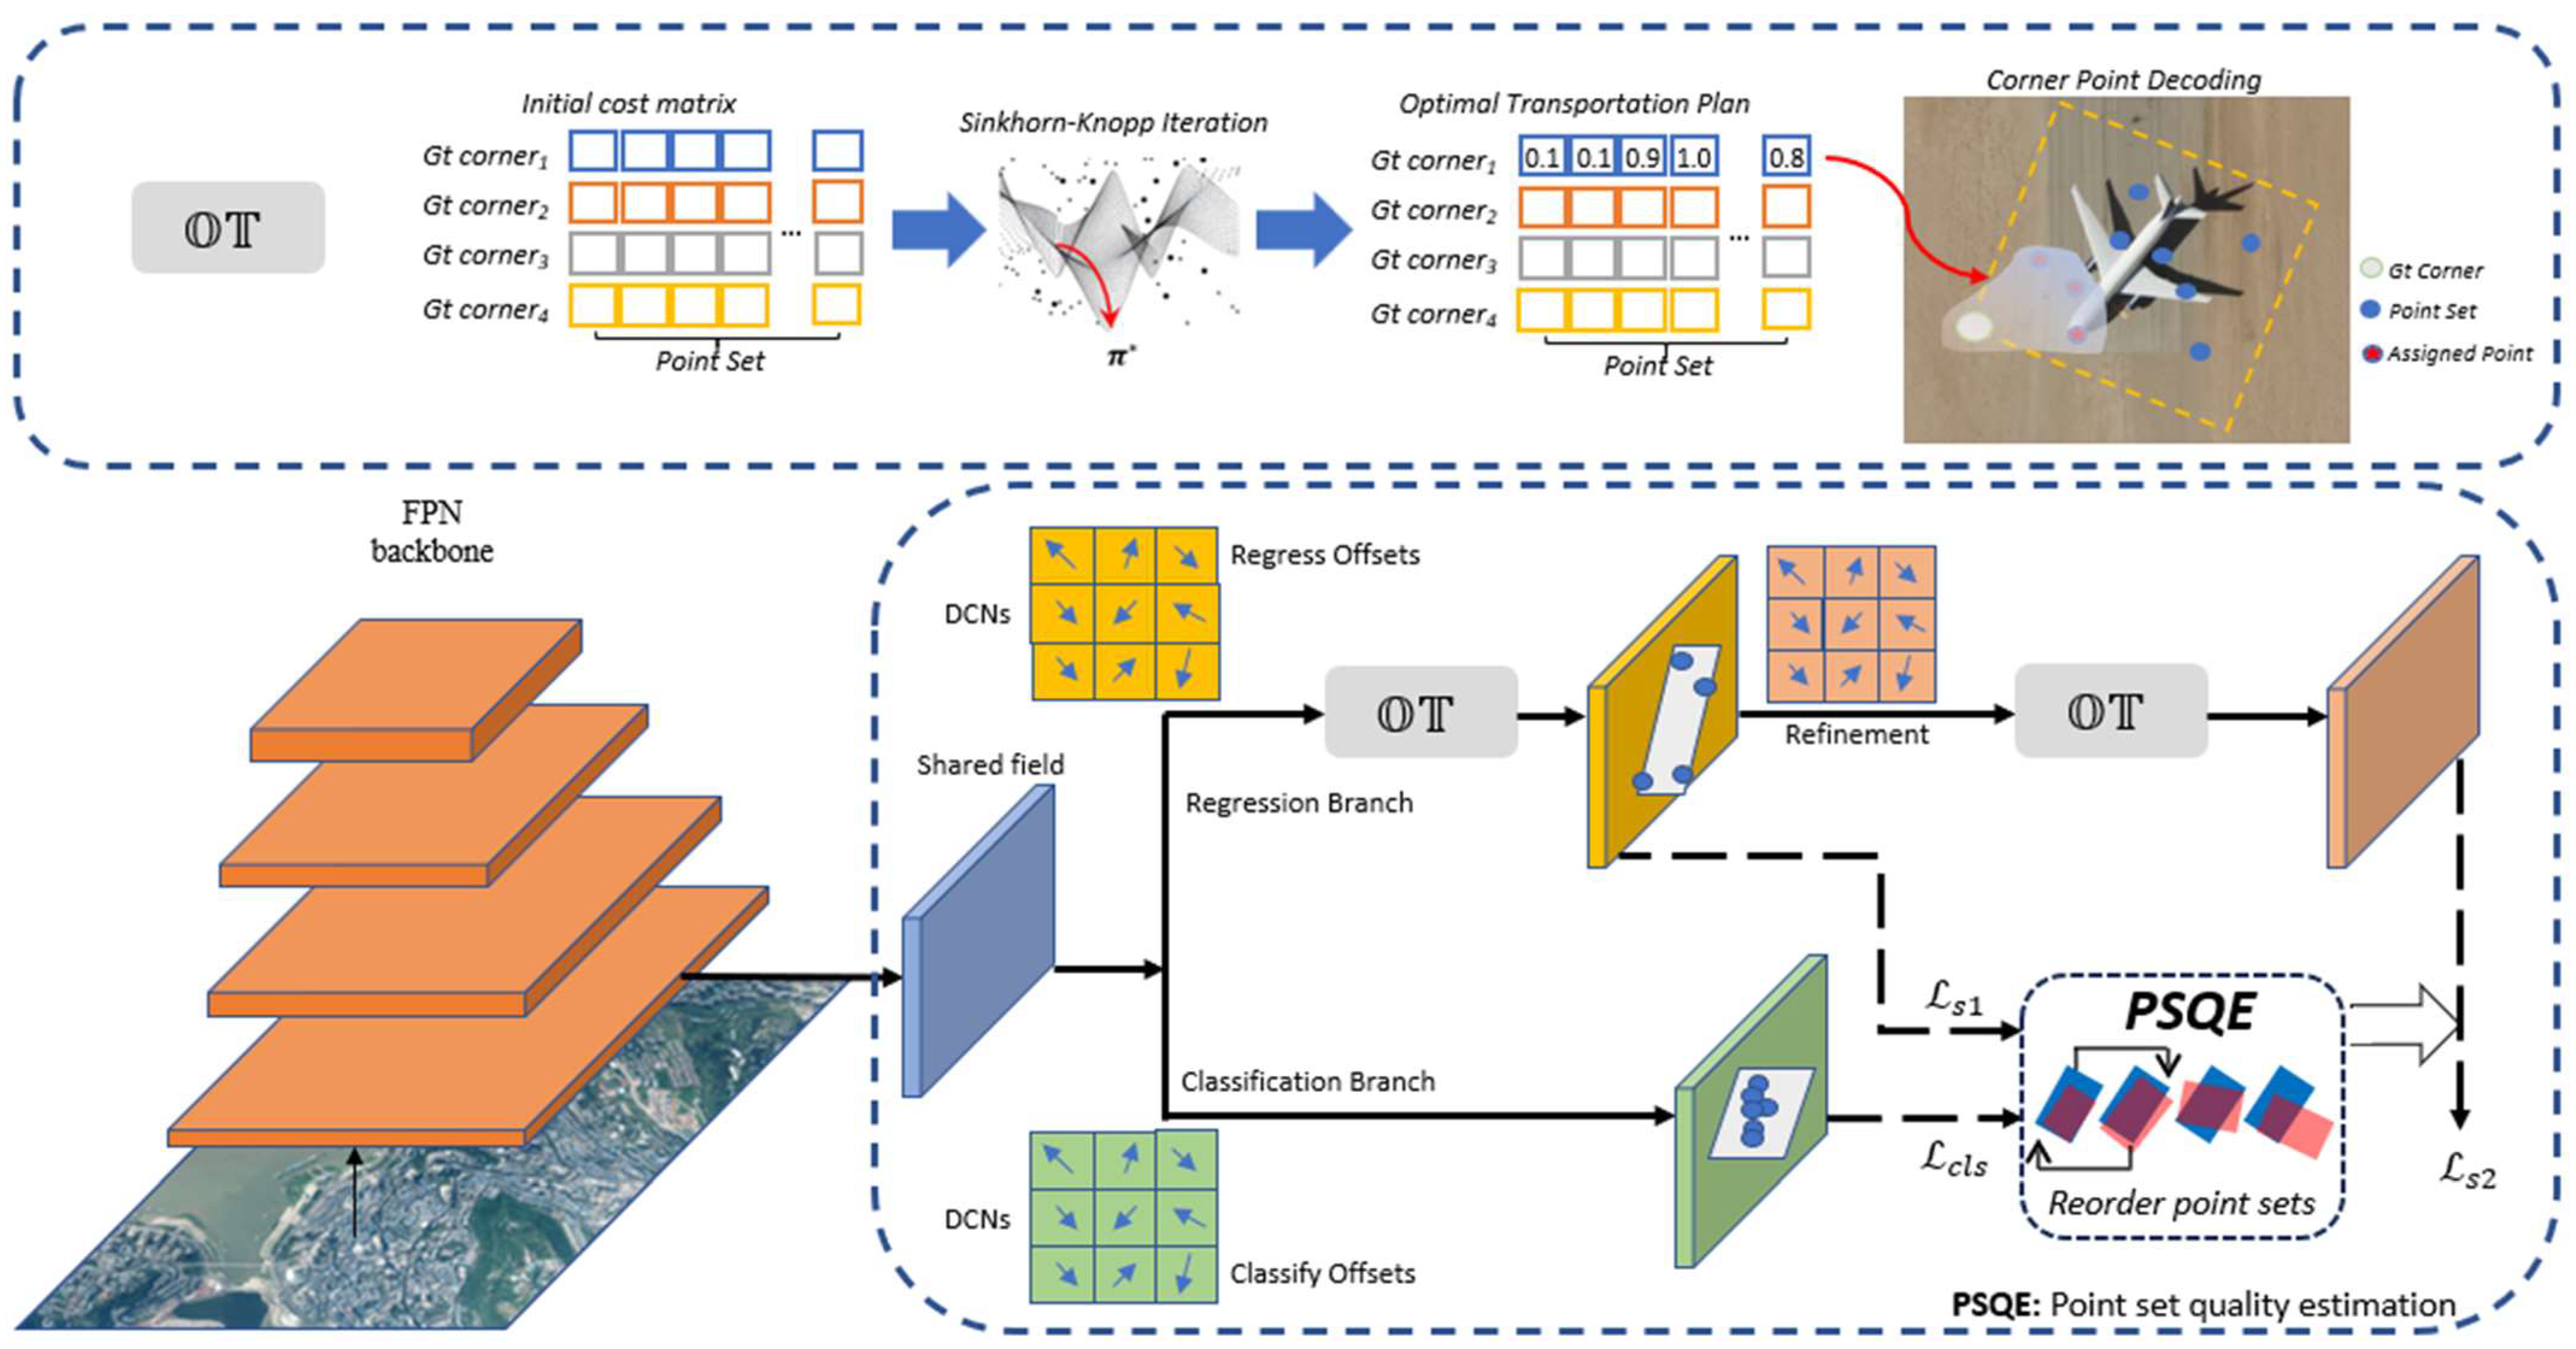
The proposed framework is illustrated in Figure 2. Similar to Oriented RepPoints [19], the widely used ResNet-50 and ResNet-101 are employed as backbones, combined with the FPN (Feature Pyramid Network) to extract features for point set representation. The point set representation is introduced in Section 3.2 as the preliminary architecture. To address the issue of representative point deviation when converting point sets into oriented bounding boxes, the OT conversion function is proposed. This function can jointly optimize and drive representative points to adaptively move to appropriate positions within an annotated bounding box. A more detailed explanation of this module is provided in Section 3.3.
Additionally, to select high-quality candidate point sets for model optimization, a quality evaluation scheme for point set representation is proposed, detailed in Section 3.4. Combining the proposed methods, we explain the loss function module in detail in Section 3.4.

3.2. Point Set Representation

The point set representation is driven by object localization and classification loss, which adaptively move feature points toward the appropriate positions and extract discriminative features. Object extent can be accurately covered while avoiding orientation ambiguity for modeling objects as point set representations. Specifically, for the i-th location on the feature maps, X R H × W × C , where H , W and C denote the height, width, and channel number of the feature maps, respectively. A point set models a set of adaptive sample points as
R = x k , y k k = 1 n
where n indexes the sampled points used in the representation and n is set to 9 as a 3 × 3 feature grid.
For better matching of the ground-truth box and point set, progressively refining bounding box localization and feature extraction is important. For point set representation, the refinement can be expressed simply as
R r = x k + Δ x k , y k + Δ y k k = 1 n
where Δ x k , Δ y k k = 1 n are the predicted offsets created by deformable convolution layers (DCNs) with respect to the previous predictions.
To take advantage of the bounding box annotations in the training phase, point set methods utilize the conversion function to transform point sets into oriented bounding boxes. During the inference stage, a standard rotated rectangle is constructed as the final prediction box based on the minimum area of the point set.

3.3. OT for Conversion Function

Conventional methods are incapable of learning complete semantic information and geometric features caused by the filtering process of point sets. For instance, Oriented RepPoints selects four out of n points to build a quadrilateral, and ConvexHull [18] constructs a convex shape by discarding some predicted points from the learning point set. Compared with those methods, we propose a new conversion function paradigm based on the optimal transport strategy that takes advantage of the overall point set features.

3.3.1. Optimal Transport

Optimal transport is a mathematical theory and computational method used to describe the distance or correspondence between two probabilities or sets. The objective of the optimal transport problem is to find the best resource transfer plan to minimize the cost of resource transfer.
Imagine there are m suppliers and n demanders in a specific area. The i-th supplier possesses s i units of goods, while the j-th demander requires d j units. The cost of transporting each unit of goods from supplier iii to demander j is represented by c i j . The objective of the optimal transport (OT) problem is to determine a transportation plan π * = π i , j i = 1 , 2 , m , j = 1 , 2 , n that minimizes the total transportation cost while ensuring all goods from the suppliers are delivered to the demanders [30,31].
m i n π i = 1 m   j = 1 n   c i j π i j s . t .   i = 1 m   π i j = d j , j = 1 n   π i j = s i , i = 1 m   s i = j = 1 n   d j , π i j 0 , i = 1 , 2 , m , j = 1 , 2 , n .
On the premise of maintaining data integrity and accuracy, the cost of data transmission is minimized by selecting the optimal transmission method, while ensuring the reliability and stability of transmission. The optimal transmission problem can be transformed into a linear programming problem or a convex optimization problem, which can be solved using numerical optimization algorithms.

3.3.2. Conversion Function Construction
The predicted point set and the set of four object corners can be treated as two distributions. In the context of the point set conversion process, supposing there are n representative points in a point set corresponding to an anchor and a 4 gt (ground-truth) corner corresponding to a ground-truth box, we assume each gt corner as a supplier that holds k i units of points ( i . e . ,   s i = k i , i = 1 , 2 , 3 , 4 ), and each representative point as a demander that needs one unit of a point ( i . e . ,   d j = 1 ,   j = 1 , 2 , , n ). The transporting cost C for one unit of a point from the gt corner to the representative point is defined as the weighted summation of pointwise correlation P i j c o r r and localization distance P i j r e g of each representative point:
C i j = P i j c o r r + α P i j r e g
where α is the balanced coefficient.
In order to construct the corresponding relationship between predicted points and ground-truth corner points in the localization aspect, we define P i j r e g as the SmoothL1 loss [32] between the predicted point and the corner point. P i j r e g is defined as follows:
P i j r e g = L i j r e g R j c o r n e r ( θ ) , G i b o x
where θ stands for model’s parameters. L i j r e g denotes the SmoothL1 loss function. P j c o r n e r denotes the predicted point location and G i b o x denotes the ground-truth corner point.
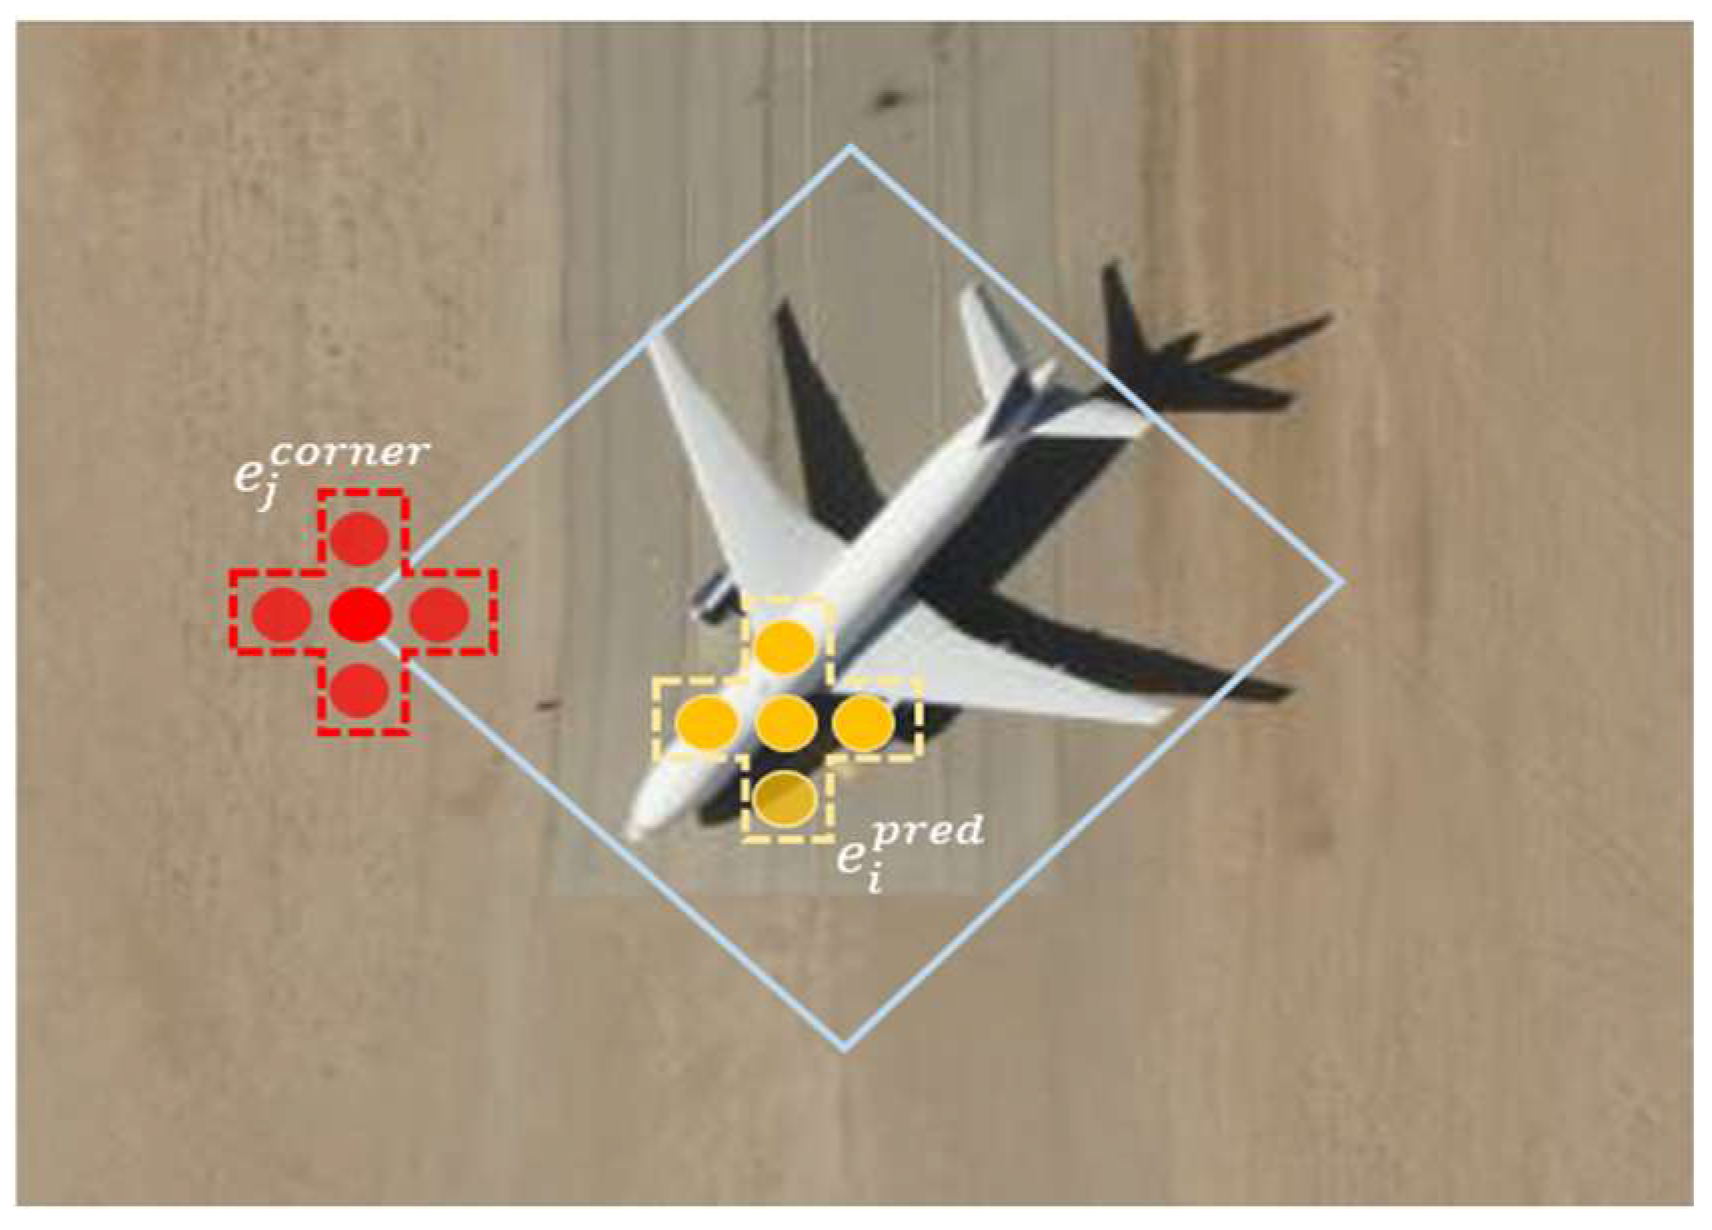
To measure the pointwise association upon a representative point for a gt corner, we extract the pointwise features and employ the cosine similarity with the corner feature vectors as the correlation for each representative point. As shown in Figure 3, we denote e j c o r n e r and e i p r e d as the averaged embedding feature vectors of each point and its adjacent points. The pointwise correlation P i j c o r r can be formulated as the cosine similarity between e j c o r n e r and e i p r e d as below:
P i j c o r r = 1   c o s < e j c o r n e r , e i p r e d >
P i j c o r r and P i j r e g is only used in characterizing transporting cost. In a standard OT problem, the total supply must be equal to the total demand, which is n in our case. Therefore, k i should be restricted as below:
i = 1 4   k i n , 1 k i n 3
In order to optimize the process with every predictied point in the training phase, the above assignment should be more inclined towards equal distribution. Therefore, we can solve this OT problem via the Sinkhorn–Knopp Iteration [33] to make the transportation plan well distributed by adding an entropic regularization term in minimizing the transportation cost:
m i n π   i = 1 m   j = 1 n   C i j π i j + γ E π i j
where E π i j = π i j l o g π i j 1 , and γ is a constant-controlling regularization term.
Figure 3. Pointwise feature extraction for pointwise correlation measurement.
Remotesensing 16 04133 g003
After obtaining π * , we decode the corresponding conversion function by assigning k i representative points to the gt corner that transports the largest number of units. The completed OT conversion procedure is described in Algorithm 1.
Algorithm 1: The pseudo-code of the optimal transport conversion strategy
Input:
I is an input image
R is a point set
G represents the gt corner points for each object
T is the number of iterations in Sinkhorn–Knopp iteration
α is the balanced coefficient
Output:
π * is the optimal assigning plan
1: 4 | G | , n | R |
2: pairwise localization cost: P i j r e g = S m o o t h L 1 L o s s R j c o r n e r ( θ ) , G i b o x
3: e c o r n e r , e p r e d F o r w a r d ( I , R , G )
4: pairwise correlation cost: P i j c o r r = 1   c o s < e j c o r n e r , e i p r e d >
5: compute final cost matrix: C i j = P i j c o r r + α P i j r e g
6: v 0 , u 0 i n i t i a l i z e   u n i t   m a t r i x
7: for t = 0 to T do:
8: u t + 1 , v t + 1 S i n k h o r n I t e r C , u t , v t , R , G
9: compute optimal assigning plan π *
10: k i i = 1 , 2 , , m Dynamic   k   Estimation
11: return π *
By minimizing the transportation cost, the correspondence between each point in the point set and the target corners is determined, and the SmoothL1 loss is used to calculate the position loss between each two points, thereby strengthening the position constraints on each point in the point set and reducing the possibility of outlier isolated points occurring during the inference phase.

3.3.3. Dynamic k i Estimation

Intuitively, the appropriate number of points for each corner should be different and based on many factors, like object semantic information center, offset initialization, etc. It is difficult to map those factors to the representative point number; hence, we propose a simple but effective method to roughly estimate the appropriate number of representative points of each ground-truth corner point based on the calculated transporting plan matrix. Specifically, for each corner point, we first calculate the mean value of the transporting plan and assign representative points above average to the corresponding corner. If a representative point is assigned repeatedly, only the assignment with the highest transporting plan score will be retained. We name this method Dynamic k i Estimation. We present a detailed comparison between the fixed k i and Dynamic k i Estimation strategies in experiments.

3.3.4. Spatial Decoupled Sampling Strategy

OT optimization aims at directionally moving adaptive point object localization, which leads to an inability to obtain points with enriched classification features. Furthermore, the object detection task suffers from inconsistent feature sensitivity (IFS) [34] between localization and classification tasks, which makes the two separate tasks compromise each other.
In response to the above problems, we propose a concise module to decouple the regression and classification stream. As shown in Figure 2, the model extracts features through the backbone and FPN and outputs them to the dual branches of regression and classification, which decouples the tasks into two streams. After that, different sampling offsets constructed by DCNs are designed for regression and classification. The regression branch follows the coarse-to-fine routine proposed by RepPoints and predicts OBBs utilizing OT optimization. The classification branch aims to seek feature-enriched points and confirms object’s class.
Furthermore, to form a standard oriented rectangle during the inference phase, we utilize the MinAeraRect function in OpenCV to construct the minimum external bounding rectangle of the point set.

3.4. Point Set Quality Evaluation

Taking inspiration from VFNet [28], we design a classification coefficient using IoU as a soft label to address the inconsistency between point set quality and classification loss in the evaluation process. Moreover, we combine the localization coefficient, orientation alignment coefficient, and matching point correlation coefficient to construct a comprehensive quality evaluation of the candidate point set.
IoU-Guided Classification Coefficient. We implement IoU-guided classification loss by reforming VFLoss as the classification loss, and then obtain the rectified classification evaluation coefficient C c l s . Following VFNet, the classification loss is defined as below:
F c l s = q q l o g p p > 0 α p γ log 1 p p = 0
where p represents the predicted probability for the foreground, q is the IoU between the predicted bbox (bounding box) and its ground truth, and α is the penalty term inherited from the focal loss. We first use the MinAeraRect function to obtain the rectangular bbox corresponding to the point set and calculate the IoU. Afterwards, the IoU is embedded into the classification loss to enhance the impact of boundary features on the classification loss. Unlike VFLoss, in order to adapt to the small size of most remote sensing image targets, we remove the construction form of the cross-entropy loss when the IoU is greater than zero. We employ F c l s as the IoU-guided classification coefficient, which is defined as below:
C c l s = F c l s r , r * , I o U
where r and r * is are predicted label and assigned ground-truth label, respectively.
Localization Coefficient. We utilize the SmoothL1 loss between predicted points and gt corner points as the localization coefficient C l o c , which is used to determine the position constraints of candidate point sets on outliers. Therefore, C l o c is defined as below:
C l o c = i = 1 m   F reg   δ i , t i *
Orientation Alignment Coefficient. To enhance the orientation assessment, we adopt the orientation alignment representation [19] to evaluate the point set. The converted rectangular bbox and the gt box are outlined with n points; this is carried out to evaluate the alignment by Chamfer distance [35]. The orientation alignment coefficient C o r i is defined as below:
C o r i = x R i p   m i n y R i g   x y 2 2 + y R i g   m i n x R i p x y   2 2
where R i p and R i g denote the points that outline the converted rectangular bbox and the gt box, respectively.
Matching Point Correlation Coefficient. According to Section 3.2, the discrete points in the predicted point set are assigned to each corner point according to the position distance and pointwise feature correlation P i j c o r r . Therefore, we utilize the pointwise feature correlation to characterize the matching point correlation coefficient C m a t c h .
As we have already defined four partial quality estimation coefficients, the overall quality estimation C is defined as below:
C = μ 1 C c l s + μ 2 C l o c + μ 3 C o r i + μ 4 C m a t c h
The overall loss function of the proposed framework is constructed in two stages, and during the training phase, the proposed point set quality evaluation strategy is utilized in the refinement stage to select a high-quality candidate point set. The initialization stage and the refinement stage generate consecutive offsets to obtain an adjustment from the object center point. Following the previous methods, the loss function is as below:
L = λ 1 L c l s + λ 2 L s 1 + λ 3 L s 2
where λ 1 , λ 2 and λ 3 are weights. L c l s denotes the classification loss:
L c l s = 1 N g t i = 1 N   F c l s r i , r *
where i is the index of the candidate point set and N g t denotes the total number of point sets. F c l s stands for reformed VFLoss, which was described in Section 3.
L s 1 and L s 2 represent the localization loss from the regression branch at the initialization and refinement stage, respectively. L s can be denoted as below:
L s = 1 N p p i * i = 1 N   j = 1 k   F reg   δ i j , t i k * + L W
where N p denotes the total number of the positive point set samples. t i k * denotes the corner points of ground-truth OBB, and δ i j indicates the predicted representative points of each point set. F reg   is the SmoothL1 loss for the oriented polygon during parameter update. L W denotes the rotated GIoU loss. OT also utilizes the SmoothL1 loss to calculate the transportation cost between points, which is not contained in the final loss function.
The proposed conversion function assigns representative points to each corner, which facilitates all points in the point set to participate in the optimization process through SmoothL1 loss. Such optimization utilizes the overall semantic information in the point set and achieves joint optimization by incorporating rotated GIoU loss.

4. Experimental Results

4.1. Datasets and Evaluation Metrics

We evaluate our method on public aerial image dataset HRSC2016 [36] and a self-constructed dataset named Opt-Aircraft.
Opt-Aircraft. This dataset is constructed for aircraft-oriented object detection. It contains 3903 aerial plane images with a wide variety of scales, orientations, and shapes of objects. These images are collected from different platforms with resolutions ranging from 600 × 600 to 1024 × 1024 pixels. The fully annotated images contain 23,012 instances. The dataset images involve the crowd and small objects in a large image.
HRSC2016. This dataset comprises numerous strip-like oriented objects with varied appearances, gathered from several well-known harbors for ship recognition. It includes a total of 1061 images, with resolutions ranging from 300 × 300 to 1500 × 900 pixels. For fair comparison purposes, 436 images are used for training, 181 images for validation, and 444 images for testing.
To evaluate the model’s performance on the Opt-Aircraft dataset, we utilize the average precision (AP) metric. The AP metric is selected to evaluate the detection performance of our method. AP, representing the area under the precision–recall curve, is defined as follows:
A P = 0 1   p r e c i s i o n   ( r e c a l l ) d ( r e c a l l )
where recall denotes the number of TPs divided by the sum of TP and FN, and precision denotes the number of TPs divided by the sum of TP and FP; these are calculated as below:
  p r e c i s i o n = T P T P + F P
  r e c a l l = T P T P + F N
Following the previous methods, the IoU threshold with the ground-truth bounding box is set to 0.5.
For practical applications, the false alarm rate (FAR) is a crucial metric that directly indicates the algorithm’s ability to meet task requirements. Hence, we also incorporate this evaluation index to assess the overall effectiveness of the proposed algorithm.
F A R = n u m   o f   d e t e c t e d   f a l s e   a l a r m s n u m   o f   d e t e c t e d   c a n d i d a t e s
To provide a comprehensive comparison for HRSC2016, we present the results using both the VOC2007 and VOC2012 metrics. Those two metrics are subsequently referred to as mAP(07) and mAP(12), respectively.

4.2. Implementation Details

The proposed approach is implemented on the ResNet-50 [37] backbone with the FPN [38]. The stochastic gradient descent (SGD) optimizer is used in training. Following Oriented RepPoints, the learning rate is set to 0.008 in the warming up of 500 iterations, and it will be decreased by a factor of 0.1 at each decay step. The hyperparameters of focal loss are set to α = 0.25 and γ = 2.0 . In Equation (14), we set the balanced weights for each stage, λ 1 = 0.3 , λ 2 = 0.8 and λ 3 = 1 , empirically. During the training phase, BE-Det utilizes the proposed OT conversion function to transform a point set into an oriented polygon in both the initialization stage and refinement stage. The RepPoints points assigner is used at the initialization stage. For each object, all the point set candidates are sorted according to their quality estimation scores. At the refinement stage, the proposed point set quality evaluation (PSQE) scheme is used to select the high-quality candidates. For each oriented object, the top 50 candidates are assigned as the positive samples. During the inference stage, a standard rotated rectangle is constructed as the final prediction box based on the minimum area of the point set. The experiments are trained on a server with 2 RTX 4090 GPUs using a batch size of 8, and a single RTX 4090 GPU is employed for inference.

4.3. Ablation Study

To examine the effectiveness of each component in our proposed framework, we implement ablation experiments on the HRSC2016 dataset.
Oriented RepPoints first proposed the concept of oriented conversion functions dealing with aerial objects with arbitrary orientations. Therefore, we make Oriented RepPoints our baseline. To make a reasonable comparison, we compare the different oriented conversion functions with ResNet-50 as the backbone, and the original RepPoints [17] label assigner is used to roughly select the predicted point set. Table 1 shows that the two oriented conversion functions in Oriented RepPoints achieves 87.12% and 88.56% mAP, respectively. Compared to them, the proposed OT conversion function achieves 89.14% mAP under the same conditions, which indicates that the OT strategy makes the point set have a good fitting effect on the objects after divergence.
The value of k i serves as the number of candidate points for each corner. When adopting k i as 1, the proposed OT conversion function is equivalent; this allows us to find the closest point from the learned point set for each corner, which has a similar effect to that of the NearestGTCorner function in Oriented RepPoints. Table 2 shows that setting k i as 2 achieves better performance and that Dynamic k i Estimation achieves the best performance, which demonstrates that our proposed Dynamic k i Estimation method is effective for point set divergence.
To evaluate the effectiveness of the proposed point set label assignment, we compare it against the baseline method. As shown in Table 3, we observe that point set label assignment gives a decent mAP improvement. It proves that a comprehensive quality evaluation can effectively filter high-valued predicted bboxes, and the classification coefficients guided by IoU can significantly improve the localization ability at the target boundary.

4.4. Time Cost Analysis

In practical applications, timeliness and accuracy are generally considered comprehensively. For detection tasks, accuracy often determines the upper limit of the algorithm. Therefore, we take accuracy as the priority principle of algorithm design.
Table 4 compares the time cost of BE-Det with that of the other two methods. Compared with the two-stage ReDet, the proposed BE-Det has fewer parameters and faster inference speed while ensuring improved detection accuracy. Compared with the baseline Oriented RepPoints, although there is a certain degree of decrease in inference speed, BE-Det has better detection performance.
Therefore, our algorithm can achieve the best mAP without significantly affecting the timeliness, allowing it to meet the needs of practical applications.

4.5. Comparison with the State-of-the-Art Methods

Table 5 compares our proposed method to other state-of-the-art methods on the HRSC2016 dataset. Our proposed BE-Det achieves 90.59% mAP(07) and 97.88% mAP(12), outperforming other methods with oriented predictions. Notably, it performs better than Oriented RepPoints, which shows the advantage of having comprehensive constraints on a point set. It also indicates that the optimal transport method can not only be applied in label assignment tasks, but also help detection algorithms achieve precise positioning of objects at arbitrary angles.
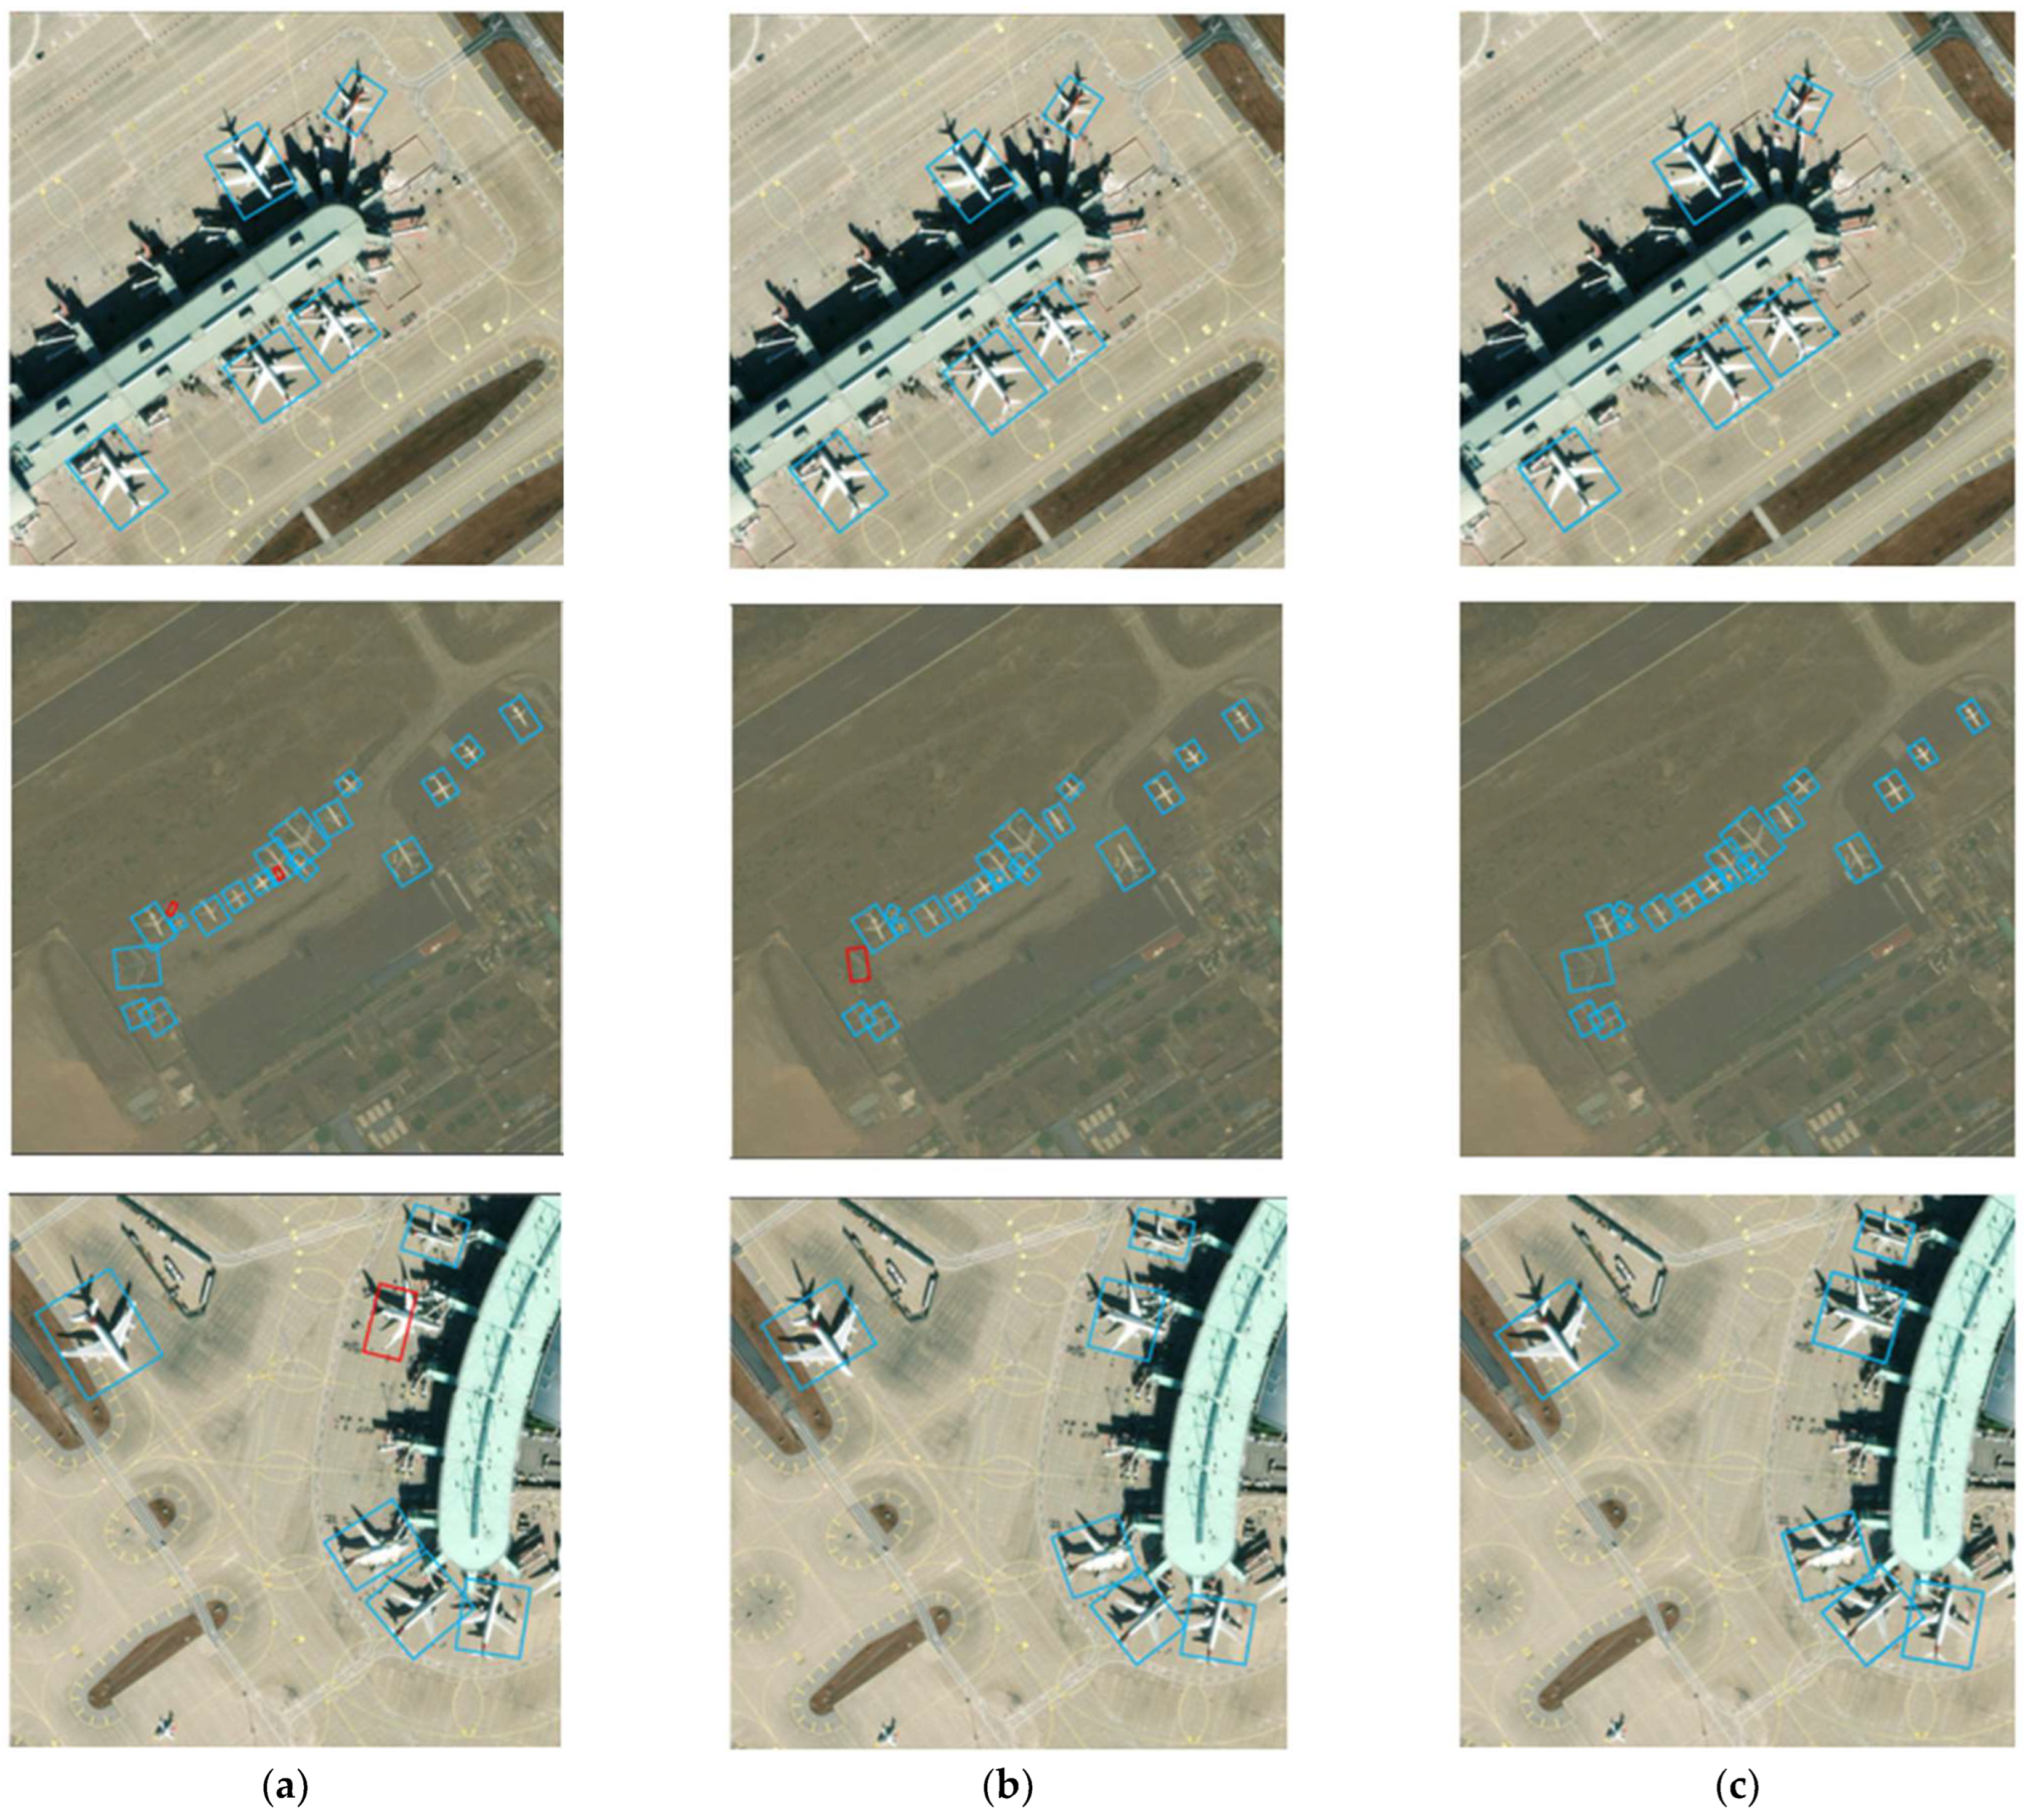
A visualization of results on the HRSC2016 dataset is shown in Figure 4. In comparison with the other methods, BE-Det can better distinguish targets with similar features from the background. In scenarios where multiple similar targets are close to each other, BE-Det exhibits superior boundary differentiation capability. Other point set representation models, due to the presence of isolated outlier points, are prone to false alarms and inaccurate localization issues. Additionally, the IoU-guided classification coefficient enhances BE-Det’s ability to differentiate blurry boundaries, significantly alleviating false-alarm problems caused by background resembling the target.
From the detection results, it can be seen that BE-Det can detect ship targets under various complex environmental disturbances. This effectiveness is mainly due to the ability to enhance the target feature of point set learning. In contrast, in these complex scenarios, Oriented RepPoints has difficulty effectively distinguishing between boundaries with similar features. This problem is mainly due to the insufficient penalty for outliers in this point set method; ReDet can suppress the interference caused by similar features to some extent, but there are still some missed detections and false alarms when facing strong background interference. This problem arises because this method focuses on adaptive learning of target rotation features, but the background can interfere with the target shape and angle information. Remote sensing images may have a certain degree of blurring due to degradation effects in the transmission link, which limits the performance of this method.
The results of comparison experiments on the Opt-Aircraft dataset are listed in Table 6. BE-Det also performs better than the existing methods in plane detection, where the detection of square regular objects is significant. Figure 5 shows that BE-Det predicts more accurately and with fewer false alarms for oriented bounding boxes compared to other methods.

4.6. More Discussion

Although the experiments conducted confirm that our proposed BE-Det is superior to many advanced oriented detection methods, our method still requires the use of rotated non-maximum suppression (NMS) to remove duplicate prediction results, which may limit the final performance of the model. DETR-based methods can provide a potential solution to this problem, which will be explored in future work. Moreover, our proposed BE-Det has good performance on general remote sensing datasets such as DOTA, but there is still a certain gap compared to the SOTA method, indicating that we still need to design corresponding modules for the model’s generalization ability in future work.

5. Conclusions

This paper proposed an effective aerial object detector named BE-Det based on RepPoints, which improves the detection accuracy to a great extent. For our proposed architecture, by taking advantage of the optimal transport (OT) strategy, BE-Det can constrain the positions of the isolated points and alleviate the issue of inconsistency between training and inference in generating bounding boxes in point set representation methods. Moreover, to address the issue of unclear boundaries, a candidate point set quality evaluation scheme is proposed. This scheme constructs a target classification coefficient with localization awareness, allowing for the evaluation and ranking of candidate point sets. This approach overcomes the problem of severe distortion in classification loss during sample quality assessment. Extensive experiments were performed on two testbeds, the promising results of which demonstrate the efficacy of our proposed approach.

Author Contributions

Investigation, analysis of the literature, methodology, writing—original draft, validation, B.Y.; funding acquisition, project administration, J.H.; supervision, X.Z.; revision and editing, W.Z. All authors have read and agreed to the published version of the manuscript.

Funding

This work was supported by the National Natural Science Foundation of China under Grant 62305088 and China Postdoctoral Science Foundation (Number: 2023M740900).

Data Availability Statement

The HRSC2016 dataset for this research was released in 2016, and is available at https://www.kaggle.com/datasets/guofeng/hrsc2016 (accessed on 14 October 2024).

Acknowledgments

The authors would like to thank Zikun Liu from the Northwestern Polytechnical University for providing the HRSC2016 dataset.

Conflicts of Interest

The authors declare no conflicts of interest.

References

  1. Yang, X.; Yang, J.; Yan, J.; Zhang, Y.; Zhang, T.; Guo, Z.; Xian, S.; Fu, K. SCRDet: Towards More Robust Detection for Small, Cluttered and Rotated Objects. In Proceedings of the IEEE/CVF International Conference on Computer Vision, Seoul, Republic of Korea, 27 October–2 November 2019. [Google Scholar]
  2. Zhang, G.; Lu, S.; Zhang, W. CAD-Net: A Context-Aware Detection Network for Objects in Remote Sensing Imagery. IEEE Trans. Geosci. Remote Sens. 2019, 57, 10015–10024. [Google Scholar] [CrossRef]
  3. Yang, X.; Yan, J.; Ming, Q.; Wang, W.; Zhang, X.; Tian, Q. Rethinking Rotated Object Detection with Gaussian Wasserstein Distance Loss. In Proceedings of the International Conference on Machine Learning, Baltimore, MD, USA, 17–23 July 2022. [Google Scholar]
  4. Pan, X.; Ren, Y.; Sheng, K.; Dong, W.; Yuan, H.; Guo, X.; Ma, C.; Xu, C. Dynamic Refinement Network for Oriented and Densely Packed Object Detection. In Proceedings of the 2020 IEEE/CVF Conference on Computer Vision and Pattern Recognition (CVPR), Seattle, WA, USA, 13–19 June 2020; IEEE: Piscataway, NJ, USA, 2020; pp. 11204–11213. [Google Scholar]
  5. Yang, X.; Yan, J.; Feng, Z.; He, T. R3Det: Refined Single-Stage Detector with Feature Refinement for Rotating Object. In Proceedings of the AAAI Conference on Artificial Intelligence, Virtually, 2–9 February 2021; Volume 35, pp. 3163–3171. [Google Scholar] [CrossRef]
  6. Han, J.; Ding, J.; Xue, N.; Xia, G.-S. ReDet: A Rotation-Equivariant Detector for Aerial Object Detection. In Proceedings of the 2021 IEEE/CVF Conference on Computer Vision and Pattern Recognition (CVPR), Nashville, TN, USA, 20–25 June 2021; IEEE: Piscataway, NJ, USA, 2021; pp. 2785–2794. [Google Scholar]
  7. Dai, L.; Liu, H.; Tang, H.; Wu, Z.; Song, P. AO2-DETR: Arbitrary-Oriented Object Detection Transformer. Available online: https://arxiv.org/abs/2205.12785v1 (accessed on 5 September 2024).
  8. Lyu, C.; Zhang, W.; Huang, H.; Zhou, Y.; Wang, Y.; Liu, Y.; Zhang, S.; Chen, K. RTMDet: An Empirical Study of Designing Real-Time Object Detectors. arXiv 2022, arXiv:2212.07784. [Google Scholar] [CrossRef]
  9. Li, Y.; Hou, Q.; Zheng, Z.; Cheng, M.-M.; Yang, J.; Li, X. Large Selective Kernel Network for Remote Sensing Object Detection. In Proceedings of the IEEE/CVF International Conference on Computer Vision, Paris, France, 2–6 October 2023; pp. 16794–16805. [Google Scholar]
  10. Xie, X.; Cheng, G.; Wang, J.; Yao, X.; Han, J. Oriented R-CNN for Object Detection. In Proceedings of the 2021 IEEE/CVF International Conference on Computer Vision (ICCV), Montreal, QC, Canada, 10–17 October 2021; IEEE: Piscataway, NJ, USA, 2021; pp. 3500–3509. [Google Scholar]
  11. Xu, Y.; Fu, M.; Wang, Q.; Wang, Y.; Chen, K.; Xia, G.-S.; Bai, X. Gliding Vertex on the Horizontal Bounding Box for Multi-Oriented Object Detection. IEEE Trans. Pattern Anal. Mach. Intell. 2021, 43, 1452–1459. [Google Scholar] [CrossRef] [PubMed]
  12. Qian, W.; Yang, X.; Peng, S.; Yan, J.; Guo, Y. Learning Modulated Loss for Rotated Object Detection. In Proceedings of the AAAI Conference on Artificial Intelligence, Virtually, 2–9 February 2021; Volume 35, pp. 2458–2466. [Google Scholar] [CrossRef]
  13. Yang, X.; Yan, J. Arbitrary-Oriented Object Detection with Circular Smooth Label. In Computer Vision—ECCV 2020; Vedaldi, A., Bischof, H., Brox, T., Frahm, J.-M., Eds.; Lecture Notes in Computer Science; Springer International Publishing: Cham, Switzerland, 2020; Volume 12353, pp. 677–694. ISBN 978-3-030-58597-6. [Google Scholar]
  14. Zeng, Y.; Chen, Y.; Yang, X.; Li, Q.; Yan, J. ARS-DETR: Aspect Ratio-Sensitive Detection Transformer for Aerial Oriented Object Detection. IEEE Trans. Geosci. Remote Sens. 2024, 62, 1–15. [Google Scholar] [CrossRef]
  15. Yang, X.; Yang, X.; Yang, J.; Ming, Q.; Wang, W.; Tian, Q.; Yan, J. Learning High-Precision Bounding Box for Rotated Object Detection via Kullback-Leibler Divergence. Adv. Neural Inf. Process. Syst. 2022, 34, 18381–18394. [Google Scholar]
  16. Lee, H.; Song, M.; Koo, J.; Seo, J. Hausdorff Distance Matching with Adaptive Query Denoising for Rotated Detection Transformer. arXiv 2023, arXiv:2305.07598. [Google Scholar]
  17. Yang, Z.; Liu, S.; Hu, H.; Wang, L.; Lin, S. RepPoints: Point Set Representation for Object Detection. In Proceedings of the IEEE/CVF International Conference on Computer Vision, Seoul, Republic of Korea, 27 October–2 November 2019. [Google Scholar]
  18. Guo, Z.; Liu, C.; Zhang, X.; Jiao, J.; Ji, X.; Ye, Q. Beyond Bounding-Box: Convex-Hull Feature Adaptation for Oriented and Densely Packed Object Detection. In Proceedings of the IEEE/CVF Conference on Computer Vision and Pattern Recognition, Nashville, TN, USA, 20–25 June 2021; pp. 8792–8801. [Google Scholar]
  19. Li, W.; Chen, Y.; Hu, K.; Zhu, J. Oriented RepPoints for Aerial Object Detection. In Proceedings of the IEEE/CVF Conference on Computer Vision and Pattern Recognition, New Orleans, LA, USA, 18–24 June 2022. [Google Scholar]
  20. Hou, L.; Lu, K.; Yang, X.; Li, Y.; Xue, J. G-Rep: Gaussian Representation for Arbitrary-Oriented Object Detection. Remote Sens. 2023, 15, 757. [Google Scholar] [CrossRef]
  21. Merugu, S.; Jain, K.; Mittal, A.; Raman, B. Sub-scene Target Detection and Recognition Using Deep Learning Convolution Neural Networks. In Proceedings of the ICDSMLA 2019, Proceedings of the 1st International Conference on Data Science, Machine Learning and Applications, Lecture Notes in Electrical Engineering, Hyderabad, India, 26–27 December 2021; Springer: Singapore, 2019; Volume 601, pp. 1082–1101. [Google Scholar] [CrossRef]
  22. Haq, M.A.; Rahim Khan, M.A. DNNBoT: Deep Neural Network-Based Botnet Detection and Classification. Comput. Mater. Contin. CMC 2022, 71, 1729–1750. [Google Scholar] [CrossRef]
  23. Merugu, S.; Tiwari, A.; Sharma, S.K. Spatial–Spectral Image Classification with Edge Preserving Method. J. Indian Soc. Remote Sens. 2021, 49, 703–711. [Google Scholar] [CrossRef]
  24. Zhang, X.; Wan, F.; Liu, C.; Ji, R.; Ye, Q. FreeAnchor: Learning to Match Anchors for Visual Object Detection. In Proceedings of the Advances in Neural Information Processing Systems, Vancouver, BC, Canada, 8–14 December 2019; Curran Associates, Inc.: New York, NY, USA, 2019; Volume 32. [Google Scholar]
  25. Zhang, S.; Chi, C.; Yao, Y.; Lei, Z.; Li, S.Z. Bridging the Gap Between Anchor-Based and Anchor-Free Detection via Adaptive Training Sample Selection. In Proceedings of the IEEE/CVF Conference on Computer Vision and Pattern Recognition, Seattle, WA, USA, 13–19 June 2020. [Google Scholar]
  26. Kim, K.; Lee, H.S. Probabilistic Anchor Assignment with IoU Prediction for Object Detection. In Computer Vision—ECCV 2020; Vedaldi, A., Bischof, H., Brox, T., Frahm, J.-M., Eds.; Lecture Notes in Computer Science; Springer International Publishing: Cham, Switzerland, 2020; Volume 12370, pp. 355–371. ISBN 978-3-030-58594-5. [Google Scholar]
  27. Ming, Q.; Zhou, Z.; Miao, L.; Zhang, H.; Li, L. Dynamic Anchor Learning for Arbitrary-Oriented Object Detection. In Proceedings of the AAAI Conference on Artificial Intelligence, Virtually, 2–9 February 2021; Volume 35, pp. 2355–2363. [Google Scholar] [CrossRef]
  28. Zhang, H.; Wang, Y.; Dayoub, F.; Sunderhauf, N. VarifocalNet: An IoU-Aware Dense Object Detector. In Proceedings of the 2021 IEEE/CVF Conference on Computer Vision and Pattern Recognition (CVPR), Nashville, TN, USA, 20–25 June 2021; IEEE: Piscataway, NJ, USA, 2021; pp. 8510–8519. [Google Scholar]
  29. Li, X.; Wang, W.; Wu, L.; Chen, S.; Hu, X.; Li, J.; Tang, J.; Yang, J. Generalized Focal Loss: Learning Qualified and Distributed Bounding Boxes for Dense Object Detection. In Proceedings of the Advances in Neural Information Processing Systems, Virtual, 6–12 December 2020; Curran Associates, Inc.: New York, NY, USA, 2020; Volume 33, pp. 21002–21012. [Google Scholar]
  30. Ge, Z.; Liu, S.; Li, Z.; Yoshie, O.; Sun, J. OTA: Optimal Transport Assignment for Object Detection. In Proceedings of the IEEE/CVF Conference on Computer Vision and Pattern Recognition, Nashville, TN, USA, 20–25 June 2021. [Google Scholar]
  31. De Plaen, H.; De Plaen, P.-F.; Suykens, J.A.K.; Proesmans, M.; Tuytelaars, T.; Van Gool, L. Unbalanced Optimal Transport: A Unified Framework for Object Detection. In Proceedings of the 2023 IEEE/CVF Conference on Computer Vision and Pattern Recognition (CVPR), Vancouver, BC, Canada, 17–24 June 2023; IEEE: Piscataway, NJ, USA, 2023; pp. 3198–3207. [Google Scholar]
  32. Girshick, R. Fast r-cnn. In Proceedings of the IEEE International Conference on Computer Vision, Santiago, Chile, 7–13 December 2015; pp. 1440–1448. [Google Scholar]
  33. Cuturi, M. Sinkhorn Distances: Lightspeed Computation of Optimal Transport. In Proceedings of the Advances in Neural Information Processing Systems, Lake Tahoe, NV, USA, 5–8 December 2013; Curran Associates, Inc.: New York, NY, USA, 2013; Volume 26. [Google Scholar]
  34. Huang, Z.; Li, W.; Xia, X.-G.; Wang, H.; Tao, R. Task-Wise Sampling Convolutions for Arbitrary-Oriented Object Detection in Aerial Images. IEEE Trans. Neural Netw. Learn. Syst. 2024. [Google Scholar] [CrossRef] [PubMed]
  35. Fan, H.; Su, H.; Guibas, L. A Point Set Generation Network for 3D Object Reconstruction from a Single Image. In Proceedings of the 2017 IEEE Conference on Computer Vision and Pattern Recognition (CVPR), Honolulu, HI, USA, 21–26 July 2017; IEEE: Piscataway, NJ, USA, 2017; pp. 2463–2471. [Google Scholar]
  36. Liu, Z.; Yuan, L.; Weng, L.; Yang, Y. A High Resolution Optical Satellite Image Dataset for Ship Recognition and Some New Baselines. In Proceedings of the 6th International Conference on Pattern Recognition Applications and Methods, Porto, Portugal, 24–26 February 2017; SCITEPRESS—Science and Technology Publications: Setúbal, Portugal, 2017; pp. 324–331. [Google Scholar]
  37. He, K.; Zhang, X.; Ren, S.; Sun, J. Deep Residual Learning for Image Recognition. In Proceedings of the 2016 IEEE Conference on Computer Vision and Pattern Recognition (CVPR), Las Vegas, NV, USA, 27–30 June 2016; IEEE: Piscataway, NJ, USA, 2016; pp. 770–778. [Google Scholar]
  38. Lin, T.-Y.; Dollár, P.; Girshick, R.; He, K.; Hariharan, B.; Belongie, S. Feature Pyramid Networks for Object Detection. In Proceedings of the IEEE Conference on Computer Vision and Pattern Recognition, Honolulu, HI, USA, 21–26 July 2017. [Google Scholar]
  39. Ding, J.; Xue, N.; Long, Y.; Xia, G.-S.; Lu, Q. Learning RoI Transformer for Oriented Object Detection in Aerial Images. In Proceedings of the 2019 IEEE/CVF Conference on Computer Vision and Pattern Recognition (CVPR), Long Beach, CA, USA, 15–20 June 2019; IEEE: Piscataway, NJ, USA, 2019; pp. 2844–2853. [Google Scholar]
  40. Yi, J.; Wu, P.; Liu, B.; Huang, Q.; Qu, H.; Metaxas, D. Oriented Object Detection in Aerial Images with Box Boundary-Aware Vectors. In Proceedings of the IEEE/CVF Winter Conference on Applications of Computer Vision, Snowmass Village, CO, USA, 1–5 March 2020. [Google Scholar]
  41. Han, J.; Ding, J.; Li, J.; Xia, G.-S. Align Deep Features for Oriented Object Detection. IEEE Trans. Geosci. Remote Sens. 2021, 60, 1–11. [Google Scholar] [CrossRef]
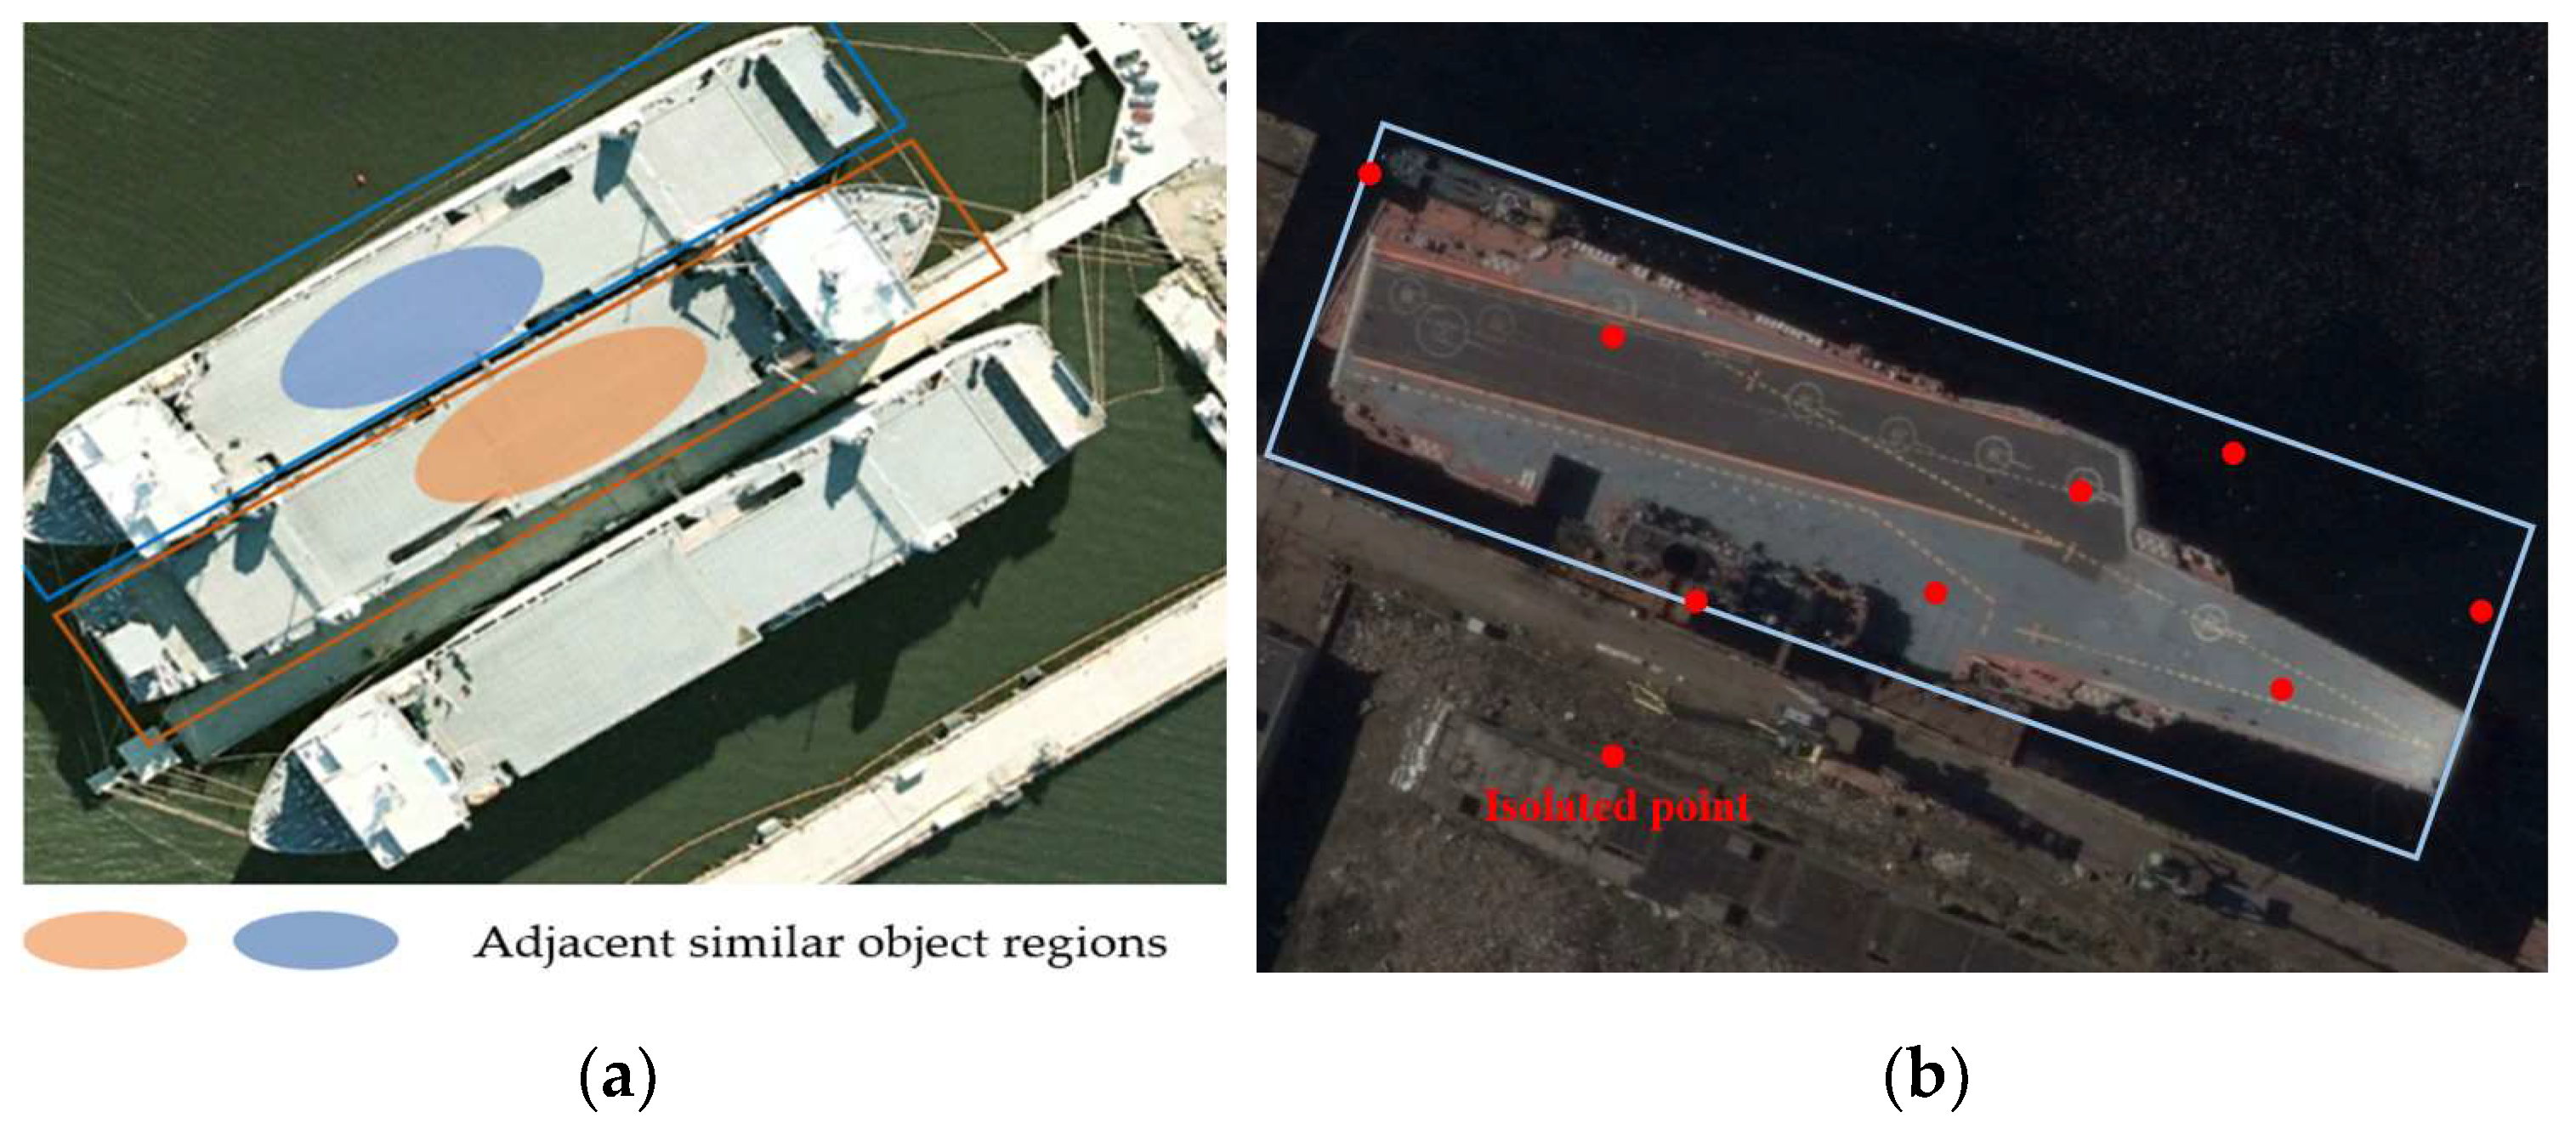
Figure 1. Illustrations for unclear boundary problems: (a) Adjacent similar objects cause target boundaries to become indistinguishable. (b) Oriented bounding box (OBB) descriptions for objects with an isolated point; the isolated point is misguided by background with strong correlation features.
Remotesensing 16 04133 g001
Figure 2. The overall architecture of the BE-Det.
Remotesensing 16 04133 g002
Figure 4. Comparison of the visualization results of Oriented RepPoints, ReDet and BE-Det on the HRSC2016 dataset. (a) Oriented RepPoints, (b) ReDet, and (c) our proposed BE-Det. The red box represents a false alarm or a low-quality prediction box, and the blue box represents a high-quality prediction box.
Remotesensing 16 04133 g004
Figure 5. Comparison of the visualization results of Oriented RepPoints, ReDet and BE-Det on the Opt-Aircraft dataset. (a) Oriented RepPoints, (b) ReDet, and (c) our proposed BE-Det. The red box represents a false alarm or a low-quality prediction box, and the blue box represents a high-quality prediction box.
Remotesensing 16 04133 g005
Table 1. Ablation study of different conversion functions.
MethodsConversion FunctionmAP(07)
Oriented RepPointsNearestGTCorner87.12
ConvexHull88.56
BE-DetOptimal Transport89.14
Table 2. Performance of different units of points assigned for each corner point.
MethodsOriented RepPointsBE-Det
k i \12dynamic
mAP(07)87.1287.1988.8290.59
Table 3. Ablation studies on each component in BE-Det. C c l s stands for IoU-guided classification coefficient, and C stands for overall quality estimation for BE-Det.
Ablation Studies on Each Component in BE-Det
baseline
OT
C c l s
C
mAP(07)87.1289.1489.7990.59
Table 4. Comparison of the time cost for the Opt-Aircraft.
MethodsmAPParamsSpeed
Oriented RepPoints90.2936.4 M22.3 fps
ReDet87.8340.2 M18.4 fps
BE-Det92.3736.8 M21.9 fps
Table 5. Comparisons of state-of-the-art methods on HRSC2016.
MethodsBackbonemAP(07)mAP(12)
Rotated Faster-rcnn
RoI-Transformer [39]
R-50-FPN84.30-
R-101-FPN86.20-
BBAVectors [40]R-101-FPN88.60-
R3Det R-101-FPN89.2696.01
ReDet ReR-5089.92 96.63
S2A-Net [41]R-101-FPN90.1795.01
Oriented RepPoints R-50-FPN90.3897.26
BE-DetR-50-FPN90.5997.88
BE-DetR-101-FPN90.6397.95
Table 6. Comparisons of state-of-the-art methods on Opt-Aircraft.
MethodsBackbonemAPFAR
RoI-Transformer
R3Det
R-101-FPN85.889.69
R-101-FPN87.628.06
ReDetReR-5087.837.98
S2A-NetR-101-FPN88.177.38
Oriented RepPointsR-50-FPN90.295.01
BE-DetR-50-FPN92.373.92
BE-DetR-101-FPN92.673.77
Disclaimer/Publisher’s Note: The statements, opinions and data contained in all publications are solely those of the individual author(s) and contributor(s) and not of MDPI and/or the editor(s). MDPI and/or the editor(s) disclaim responsibility for any injury to people or property resulting from any ideas, methods, instructions or products referred to in the content.