Technical Note

Characterization of Electric Field Fluctuations in the High-Latitude Ionosphere Using a Dynamical Systems Approach: CSES-01 Observations

by
Virgilio Quattrociocchi
1,
Paola De Michelis
1,*,
Tommaso Alberti
1,2,
Emanuele Papini
2,
Giulia D’Angelo
3 and
Giuseppe Consolini
2
1
Istituto Nazionale di Geofisica e Vulcanologia, Via di Vigna Murata 605, 00143 Roma, RM, Italy
2
INAF—Istituto di Astrofisica e Planetologia Spaziali, Via del Fosso del Cavaliere 100, 00133 Roma, RM, Italy
3
Dipartimento di Scienze Fisiche e Chimiche, Università dell’Aquila, 67100 Coppito, AQ, Italy
*
Author to whom correspondence should be addressed.
Remote Sens. 2024, 16(21), 3919; https://doi.org/10.3390/rs16213919
Submission received: 16 September 2024 / Revised: 16 October 2024 / Accepted: 19 October 2024 / Published: 22 October 2024
(This article belongs to the Special Issue Ionosphere Monitoring with Remote Sensing (3rd Edition))

Abstract

:
We present an analysis of the ionospheric electric field dynamics at high latitudes during periods of quiet and disturbed geomagnetic activity by exploiting recent advancements in dynamical systems and extreme value theory. Specifically, we employed two key indicators: the instantaneous dimension d, which evaluates the degrees of freedom within the system, and the extremal index θ , which quantifies the system’s persistence in a given state. Electric field measurements were obtained from the CSES-01 satellite at mid- and high latitudes in the Southern Hemisphere. Our analysis revealed that the instantaneous dimension increases upon crossing specific ionospheric regions corresponding to the auroral oval boundaries. Outside these regions, the instantaneous dimension fluctuates around the state-space dimension, suggesting an ergodic nature of the system. As geomagnetic activity intensifies, differences in the properties of various ionospheric regions persist, albeit with an increased system instability characterized by higher θ values, thus indicating the externally driven nature of the electric field response to geomagnetic activity. This study provides new insights into the spatial and temporal variability of electric field fluctuations in the ionosphere, highlighting the complex interplay between geomagnetic conditions and ionospheric dynamics.

1. Introduction

The dynamics of plasmas within the ionosphere at high latitudes, especially in the F region, are significantly influenced by electric fields transmitted from Earth’s magnetosphere along magnetic field lines. These electric fields are primarily generated by interactions between the solar wind and Earth’s magnetosphere, which drive complex current systems, including the polar electrojets and field-aligned currents (FACs). However, other forcings such as subauroral polarization streams, solar flares, storm-time thermospheric winds, and ambipolar diffusions [1,2], as well as solar eclipse [3], may also play a significant role.
Studies have shown that these electric fields can penetrate into the high-latitude ionosphere, where they interact with the local plasma, creating various dynamic phenomena, such as plasma convection, auroral electrojets, and particle precipitation. This interaction leads to the formation of large-scale plasma structures and turbulence, which are particularly evident in the F region due to its higher altitude and lower collision frequency compared with the E region [4].
When analyzing the plasma dynamics, two distinct components are typically identified: large-scale convection motion and small-scale motion. While extensive research [4] has elucidated the characteristics of large-scale spatial motion, the dynamics at smaller spatial and temporal scales remain less understood. These small-scale dynamics significantly impact the efficacy of predictive statistical models and contribute to energy deposition in the atmosphere through processes such as Joule heating and mechanical energy transfer.
Various hypotheses have been made regarding the nature and origin of small-scale electric field fluctuations, yet a cohesive understanding remains elusive. These fluctuations are often attributed to intermittent turbulence, as suggested for example in [5,6,7,8], and are thought to stem from external sources beyond the ionosphere (e.g., [9,10]). Some theories link this turbulence to magnetospheric structures driven by shear flow instabilities, while others suggest a direct connection between ionospheric turbulence and solar wind turbulence (e.g., [8,11]).
Numerous studies have examined the scaling properties of electric field fluctuations to understand their turbulent characteristics and origins (e.g., [6,7,12,13]). Additionally, statistical analyses have been conducted to estimate the contribution of small-scale electric field variability to the overall electric field within the ionosphere and its impact on atmospheric energy input (e.g., [7,14,15,16]).
Such complex dynamics are particularly pronounced in the auroral region, where particle precipitation and variability of field-aligned currents (FACs) induce turbulent fluctuations in both magnetic and electric fields across the Ultra-Low-Frequency (ULF) and Extremely-Low-Frequency (ELF) spectral ranges [17,18]. Power spectral densities, scaling features, and non-Gaussian distribution functions of small-scale increments make evident the turbulent nature of electric and magnetic field fluctuations within the high-latitudes ionosphere. For instance, Kintner [5] documented variations and broadband spectra of electric fields within auroral zones, suggesting correlations with the acceleration of auroral ions and electrons. Additionally, Tam et al. [6] proposed a mechanism underlying the emergence of ELF electric field turbulent fluctuations, introducing the concept of intermittent turbulence due to localized and rapid interactions among field-aligned coherent multiscale structures.
Improving the characterization of the electric field fluctuations at short timescales (typically below 1 s) represents an intriguing avenue of exploration. It is essential to understand whether electric field fluctuations depict a system with a fixed number of degrees of freedom over time or if this number fluctuates during geomagnetically disturbed periods. Indeed, an increase in degrees of freedom denotes a more complex system that becomes more sensitive to external fluctuations and variations.
To address this challenge, we employ a new methodology combining principles from dynamical systems and extreme value theory [19,20]. This approach allows us to investigate the active number of degrees of freedom, as well as the persistent nature of electric field perturbations across different latitudes and levels of geomagnetic activity.
In our investigation, we used data collected on board the China Seismo-Electromagnetic Satellite (CSES-01) [21], which offers promising applications in earthquake science, geophysics, and space sciences. In particular, the high-resolution (5 kHz) electric field measurements collected by the electric field detector (EFD) [22] on board CSES-01 allow for a thorough investigation of the electric field fluctuations at the smallest scales accessible to date. Indeed, EFD data have already been used to characterize the multifractal statistical properties of the auroral electric field [23] and to detect the electric activity generated by FACs at auroral latitudes [24].
This paper is structured as follows: Section 2 details the data acquisition and preprocessing methods utilized in this study. We describe the specifics of the CSES-01 satellite’s instrumentation and the criteria for selecting the relevant high-latitude crossings during both geomagnetically quiet and disturbed periods. Section 3 introduces the dynamical systems approach and the extreme value theory framework employed to analyze the electric field fluctuations. In Section 4, we present the results, highlighting the differences in electric field dynamics under varying geomagnetic conditions. We also discuss the instantaneous dimensions and persistence of electric field perturbations across different latitudinal regions. Finally, Section 5 offers a comprehensive discussion of our findings, their implications for understanding ionospheric dynamics, and potential avenues for future research. We conclude with a summary of the key insights gained from this study and their relevance to space weather modeling and prediction.

2. Data

Launched on 2 February 2018, CSES-01 [21] orbits at an approximately 507 km altitude on a 97.4° inclined Sun-synchronous orbit, crossing descending and ascending nodes at around 14:00 local time (LT) at the day side and 02:00 LT at the night side. It gathers scientific data within the geographical latitude range of −65° to +65°. Consequently, the observation of high-latitude phenomena is limited by the spacecraft’s orbital characteristics. While the tilt angle of Earth’s magnetic field relative to the rotation axis remains relatively stable, the exact latitudinal position of CSES-01 varies over time due to the gradual precession of its orbit. This means that the spacecraft may occasionally access higher latitudes depending on its orbital phase. Additionally, during periods of increased geomagnetic activity, the auroral oval can expand to lower latitudes, allowing for sporadic data acquisition within the auroral regions and even into the polar cap. However, the ability to consistently observe high-latitude phenomena is inherently constrained by these orbital and geomagnetic factors.
The CSES-01 spacecraft is equipped with various instruments, among them an electric field detector (EFD). We analyze the electric field data collected by EFD during two passes through the southern polar ionosphere. In particular, we study one quiet period and one period characterized by a high level of geomagnetic activity (i.e., a disturbed period). These passes were chosen during specific periods when the satellite was flying over both the auroral region and part of the polar cap in the southern hemisphere and on the night side. Passes were also selected based on varying levels of geomagnetic disturbances, classified using the auroral electrojet (AE) index values. Indeed, the AE index is designed to provide a global quantitative measure of auroral zone magnetic activity produced by enhanced ionospheric currents flowing below and within the auroral oval [25,26]. Based on the AE index values, we selected one passage under geomagnetically disturbed conditions and one under quiet ones. Specifically, we selected a crossing between 18:32:36 UT and 18:39:45 UT on 6 August 2018, during which the mean AE value was 40 nT, representing quiet conditions. The other crossing occurred between 20:06:46 UT and 20:13:54 UT on 26 August 2018 with a mean AE value of 800 nT, indicating disturbed conditions. As already mentioned, we utilized electric field data obtained by the EFD instrument. More specifically, we used the full vector electric field measurements collected in the ELF band, i.e., in the frequency range from DC up to 2.2 kHz. In the ELF band, EFD collects electric field data with a sampling frequency of 5 kHz.
ELF data have been downsampled to 250 Hz. Given that the satellite velocity is roughly 8 km/s and that the chosen resolution is 250 samples per second, and assuming that Taylor’s hypothesis is valid (see, e.g., discussion in Refs. [23,27,28]), such downsampling corresponds to being able to analyze electric fluctuations down to scales of around 30 m. This enables us to explore the plasma dynamics at sub-ion scales, considering that the ion inertial length scale ranges from approximately 2 to 3 km for O + ions and from 10 to 20 m for electrons. In this work, we used electric field measurements in the geomagnetic (MAG) reference frame. Such measurements have been obtained by rotating the original EFD data, which are given in the World Geodetic System 1984 (WGS84) coordinate system, to the MAG frame. In such frame, the the x component is parallel to the geomagnetic field (calculated using the CHAOS 7.14 model [29]); the y component is in the plane defined by the radial direction and the magnetic field, directed in the direction perpendicular to the magnetic field toward Earth; and the third component is given by the vector product of the other two components, i.e., roughly in the east–west direction.
Figure 1 illustrates the variations in the electric field components recorded by CSES-01 during the two selected periods: a geomagnetically quiet period on 6 August 2018 and a disturbed period on 26 August 2018.
For both selected passages, the variations in the electric field components are plotted as a function of magnetic latitude (MLat), ranging between −80° and −50°. In both cases, the satellite passes through part of the polar cap, the auroral oval, and finally reaches the mid-latitudes closest to the equator. The electric field data appear to accurately identify these zones. For instance, upon analyzing the trends in the first panel corresponding to a period of geomagnetic quiet, we immediately notice that the electric field experiences intense fluctuations as CSES-01 crosses the edges of the auroral oval. Within this region, the electric field fluctuations diminish considerably, nearly attenuating completely as CSES-01 leaves the auroral oval and moves towards lower magnetic latitudes. A similar pattern emerges in the panel depicting the data of disturbed day, with the auroral oval expanding as expected, covering the area between the two edges. Therefore, the transition from the auroral oval to mid-latitudes remains somewhat constrained within the latitudinal range under consideration. Nevertheless, the characteristic attributes of the electric field, encompassing fluctuation intensity across different zones, endure even during periods of geomagnetic disturbance.

3. Methods

We use a dynamical systems approach to characterize the degree of persistence of electric field fluctuations at different latitudes [19,20]. We consider the electric field E ( t ) = [ E x ( t ) , E y ( t ) , E z ( t ) ] as the key variable providing us a time-dependent view of the conditions of the ionosphere environment under certain geomagnetic conditions and for a specific latitudinal band. This means that we define a state s ( t ) as the triad of values of the electric field.
The mathematical foundation of the adopted method comes from a connection made between Poincaré’s Recurrence Theorem and the extreme value theory [30].
For each state s = s ( t ) of the system, the probability of observing the same state (or a similar one within a confidence interval of size ϵ ) at a different time t > t , according to the Freitas–Freitas–Todd theorem [31] modified by Lucarini et al. [32], is a Generalized Pareto-Like Distribution, as follows:
P | s ( t ) s | < ϵ exp s ( t ) σ ( s ) .
where the inverse of σ ( s ) corresponds to the so-called instantaneous dimension d, as follows:
d = 1 σ ,
which provides information on the number of active processes/mechanisms ( d > 0 ) beyond each state s . It must be remarked that d cannot be interpreted in absolute terms but rather in relative terms [33]. This means that, s 1 and s 2 being two reference states, if, e.g., d ( s 1 ) > d ( s 2 ) , then the number of effective active mechanisms of state s 1 is larger than that of s 2 [34,35].
In the framework of the extreme value theory, it is possible to introduce an additional metric, known as extremal index θ [33,36,37], which measures the recurrences of similar configurations s . We refer the reader to [19,20,36,37] for further details on the numerical evaluation of the extremal index. In contrast with d, θ is confined between 0 and 1, with θ closer to 0 indicating a more similar configuration and closer to 1 indicating a less similar configuration [33,37].

4. Results and Discussion

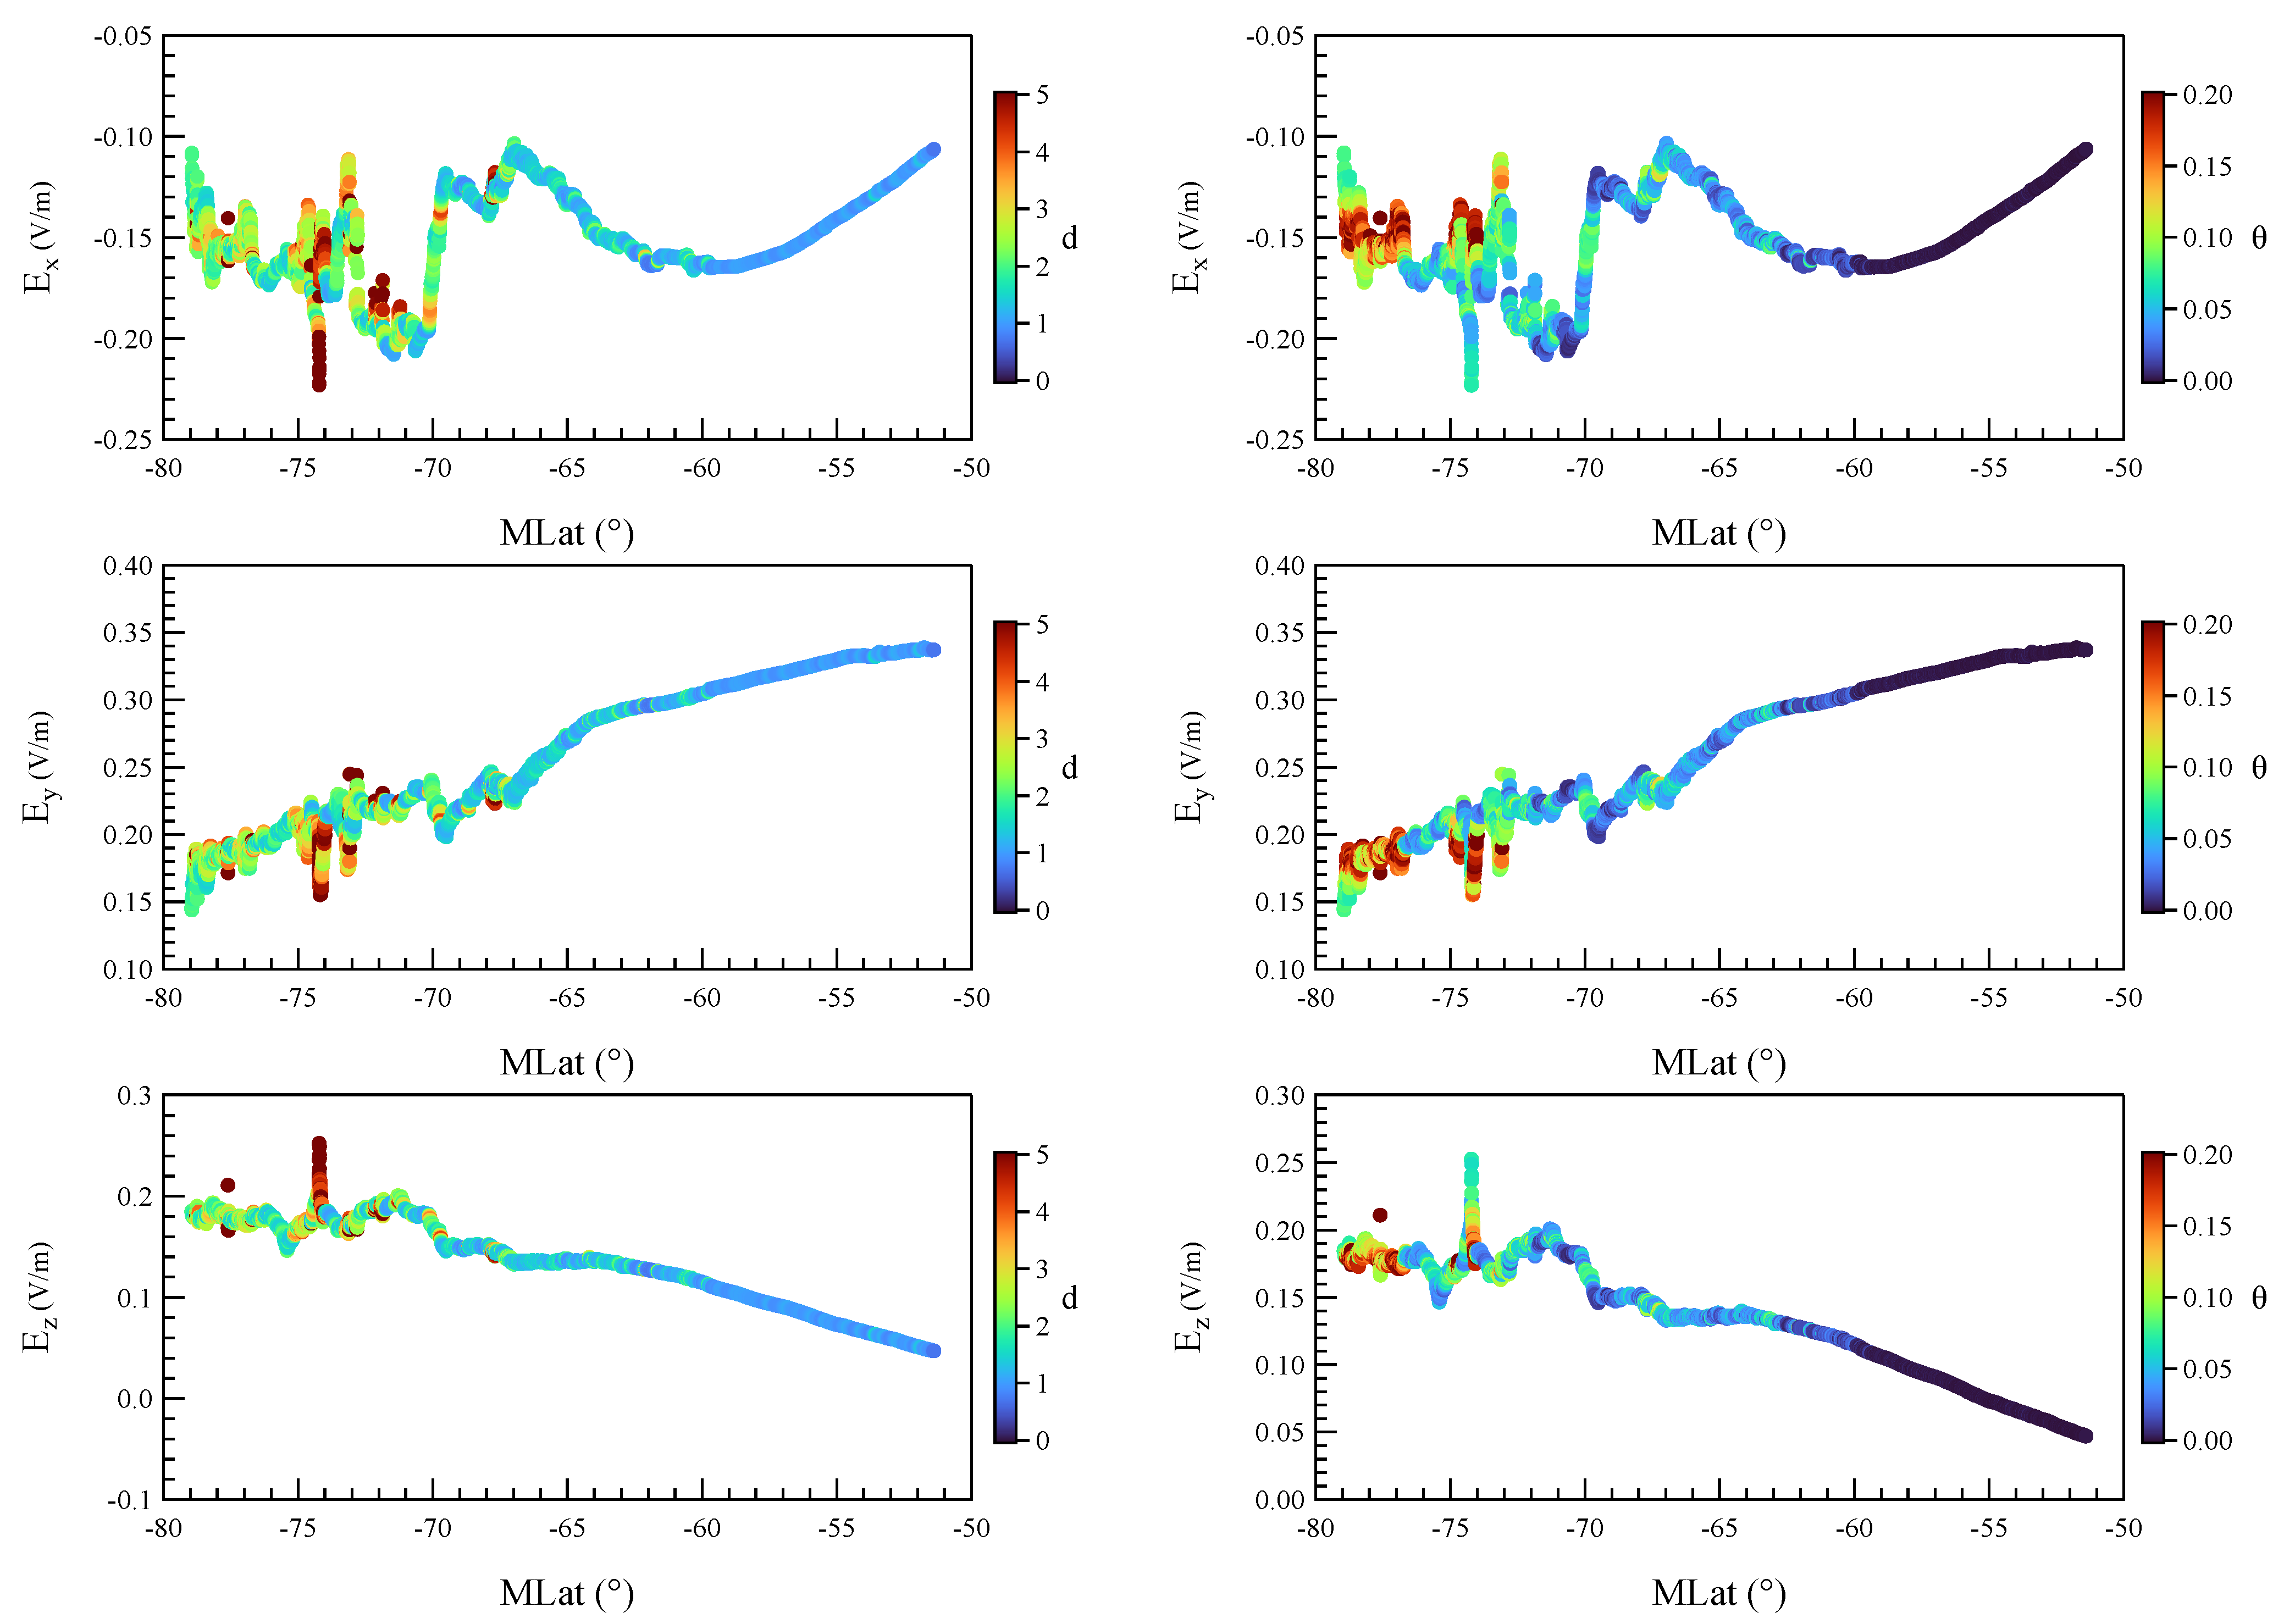
We begin our analysis by investigating some properties of our dataset. As described in the Data section, the analysis of electric field fluctuations during quiet and disturbed geomagnetic periods reveals distinct patterns across different ionospheric regions (see Figure 1). In particular, the auroral oval exhibits enhanced variability, especially during geomagnetically active periods. As is well known and extensively documented in the scientific literature [4], this increased variability is primarily driven by external factors, such as geomagnetic storms and substorms, which significantly influence the dynamics of the electric field at high latitudes. However, to gain deeper insight into these fluctuations, we conducted a spectral analysis of the available electric field measurements, as shown in Figure 2. In detail, it reports the traces of the power spectral density (PSD) of the electric field components for the two selected periods. We remind that by the term trace, we refer to the sum of the PSDs of the three components. Significant differences are observed between the quiet and disturbed periods. In particular, while the quiet interval is mainly characterized by a single power-law PSD with a spectral exponent β 1.9 , the PSD for the disturbed interval exhibits two different power-law regimes: the first at frequencies below f c 4 Hz, characterized by a spectral exponent β 3 / 2 , and the second at frequencies higher than f c , with a spectral slope β 7 / 3 . Furthermore, at frequencies near 100 Hz, the PSD of the disturbed period shows an increase in energy content, confirmed by high-resolution data (data not shown), which could be associated with a particular resonance frequency. Focusing our discussion on the PSD shown in Figure 2, we note that the low-frequency spectral density (below f c ) aligns well with the typical spectral features of Alfvénic turbulence [38], which involves Alfvén modes. Moreover, assuming an O+ ion density on the order of 2 × 10 5 cm−3, we derive a corresponding ion-inertial length d i 2 km, which, assuming Taylor’s hypothesis, corresponds to a frequency f = v s / d i 4 Hz, i.e., a frequency very close to the observed spectral break at f c . In this context, the high-frequency spectral range f 7 / 3 could be the manifestation of Hall-MHD turbulence [39,40,41], which accounts for the effects of the Hall term, J × B , in Ohm’s law within the magnetic field evolution equation. Regarding the quiet-period PSD, the observed single power law may be related to stochastic fluctuations, perhaps due to polar cap ion precipitation. Similar spectral features were observed by Basu et al. [42] in the polar cap and are also expected in the case of current-convective turbulence [43]. These spectral characteristics provide further evidence of the ionospheric electric field’s sensitivity to geomagnetic activity, with increased system instability during disturbed conditions. To explore whether similar patterns of variability across different latitudes are also reflected in the instantaneous dimension and persistence metrics, we examine the behavior of the two parameters, d and θ , in the selected datasets. This allows us to assess whether electric field measurements describe a system that maintains a similar number of degrees of freedom over time, or if this number fluctuates depending on both the region traversed (auroral oval, polar cap, or mid-latitude ionosphere) and the level of geomagnetic activity (quiet or disturbed). Figure 3 reports (in colors) the dependence of the instantaneous dimension (d, left panels) and the inverse persistence ( θ , right panels), as a function of the magnetic latitude, during the selected quiet period on 6 August 2018, superimposed to the latitudinal variation of each electric field component.
By examining variations of the instantaneous dimension d, depicted in the three plots on the left, we observe that its values change consistently, moving from low to high latitudes. Specifically, d settles at low values from mid-latitudes to −66° magnetic latitude, where it experiences a sudden increase. Then, moving progressively towards higher latitudes, d, which generally tends to decrease, showing anyway higher values than those observed at mid-latitudes, experiences other increments at around −74° and −77/78° of magnetic latitudes.
By observing right panels of Figure 3, it is possible to note that θ shows a similar behavior as d, assuming low values at mid-latitudes and sudden increases approximately at the same magnetic latitudes where abrupt changes in d are observed. Since θ is a measure of the persistence of the system in a given state, the lower values observed at mid-latitudes suggest a lower variability of the electric field, which indeed shows much fewer fluctuations than those recorded at high latitudes where, at the same time, higher values of θ occur. At high latitudes, indeed, θ increases up to 0.2 , denoting a decreased level of persistence and an increasing activity in the electric field fluctuations.
In order to investigate how the behavior of both d and θ relates to the ionospheric dynamics, we investigated the auroral radiance as measured by the Special Sensor Ultraviolet Spectrographic Imager (SSUSI) on board the Defense Meteorological Satellite Program (DMSP) F17. SSUSI consists of sensors able to provide global auroral observations at five wavelengths in the ultraviolet range (namely, 115–180 nm) with high spatial resolution (7–9 km at nadir) by scanning across the track of the satellite trajectory every 15 s [44,45]. Here, according to [46], we used the emission from the N2 Lyman–Birge–Hopfield long filter band (165–180 nm) to represent the aurora.
Specifically, as shown in Figure 4, we investigated the location of CSES-01 with respect to the auroral precipitation regions. Figure 4, indeed, illustrates the CSES-01 trajectory on 6 August 2018 (solid red curve) superposed over the auroral radiance as measured by DMSP-F17 at 18:12 UT. This figure also reports, with red dashed contours, the upper and lower boundaries of the auroral oval as derived from the auroral radiance data. As it is visible, CSES-01 was traveling from the southern polar cap towards the equator on the night side and crossed a region characterized by low auroral radiance, as expected during a low level of geomagnetic activity testified by low values of the AE index (around 50 nT at 18:12 UT). However, by comparing variations in Figure 3 with the CSES-01 location (as shown in Figure 4), it is possible to deduce that the greater values of both d and θ and then the highest electric field fluctuations occurred when CSES-01 was crossing the auroral oval boundaries and within the polar cap. Such fluctuations reflect the diverse processes occurring in these regions, encompassing various spatio-temporal scales and a wide range of physical mechanisms (see, e.g., [47,48]).
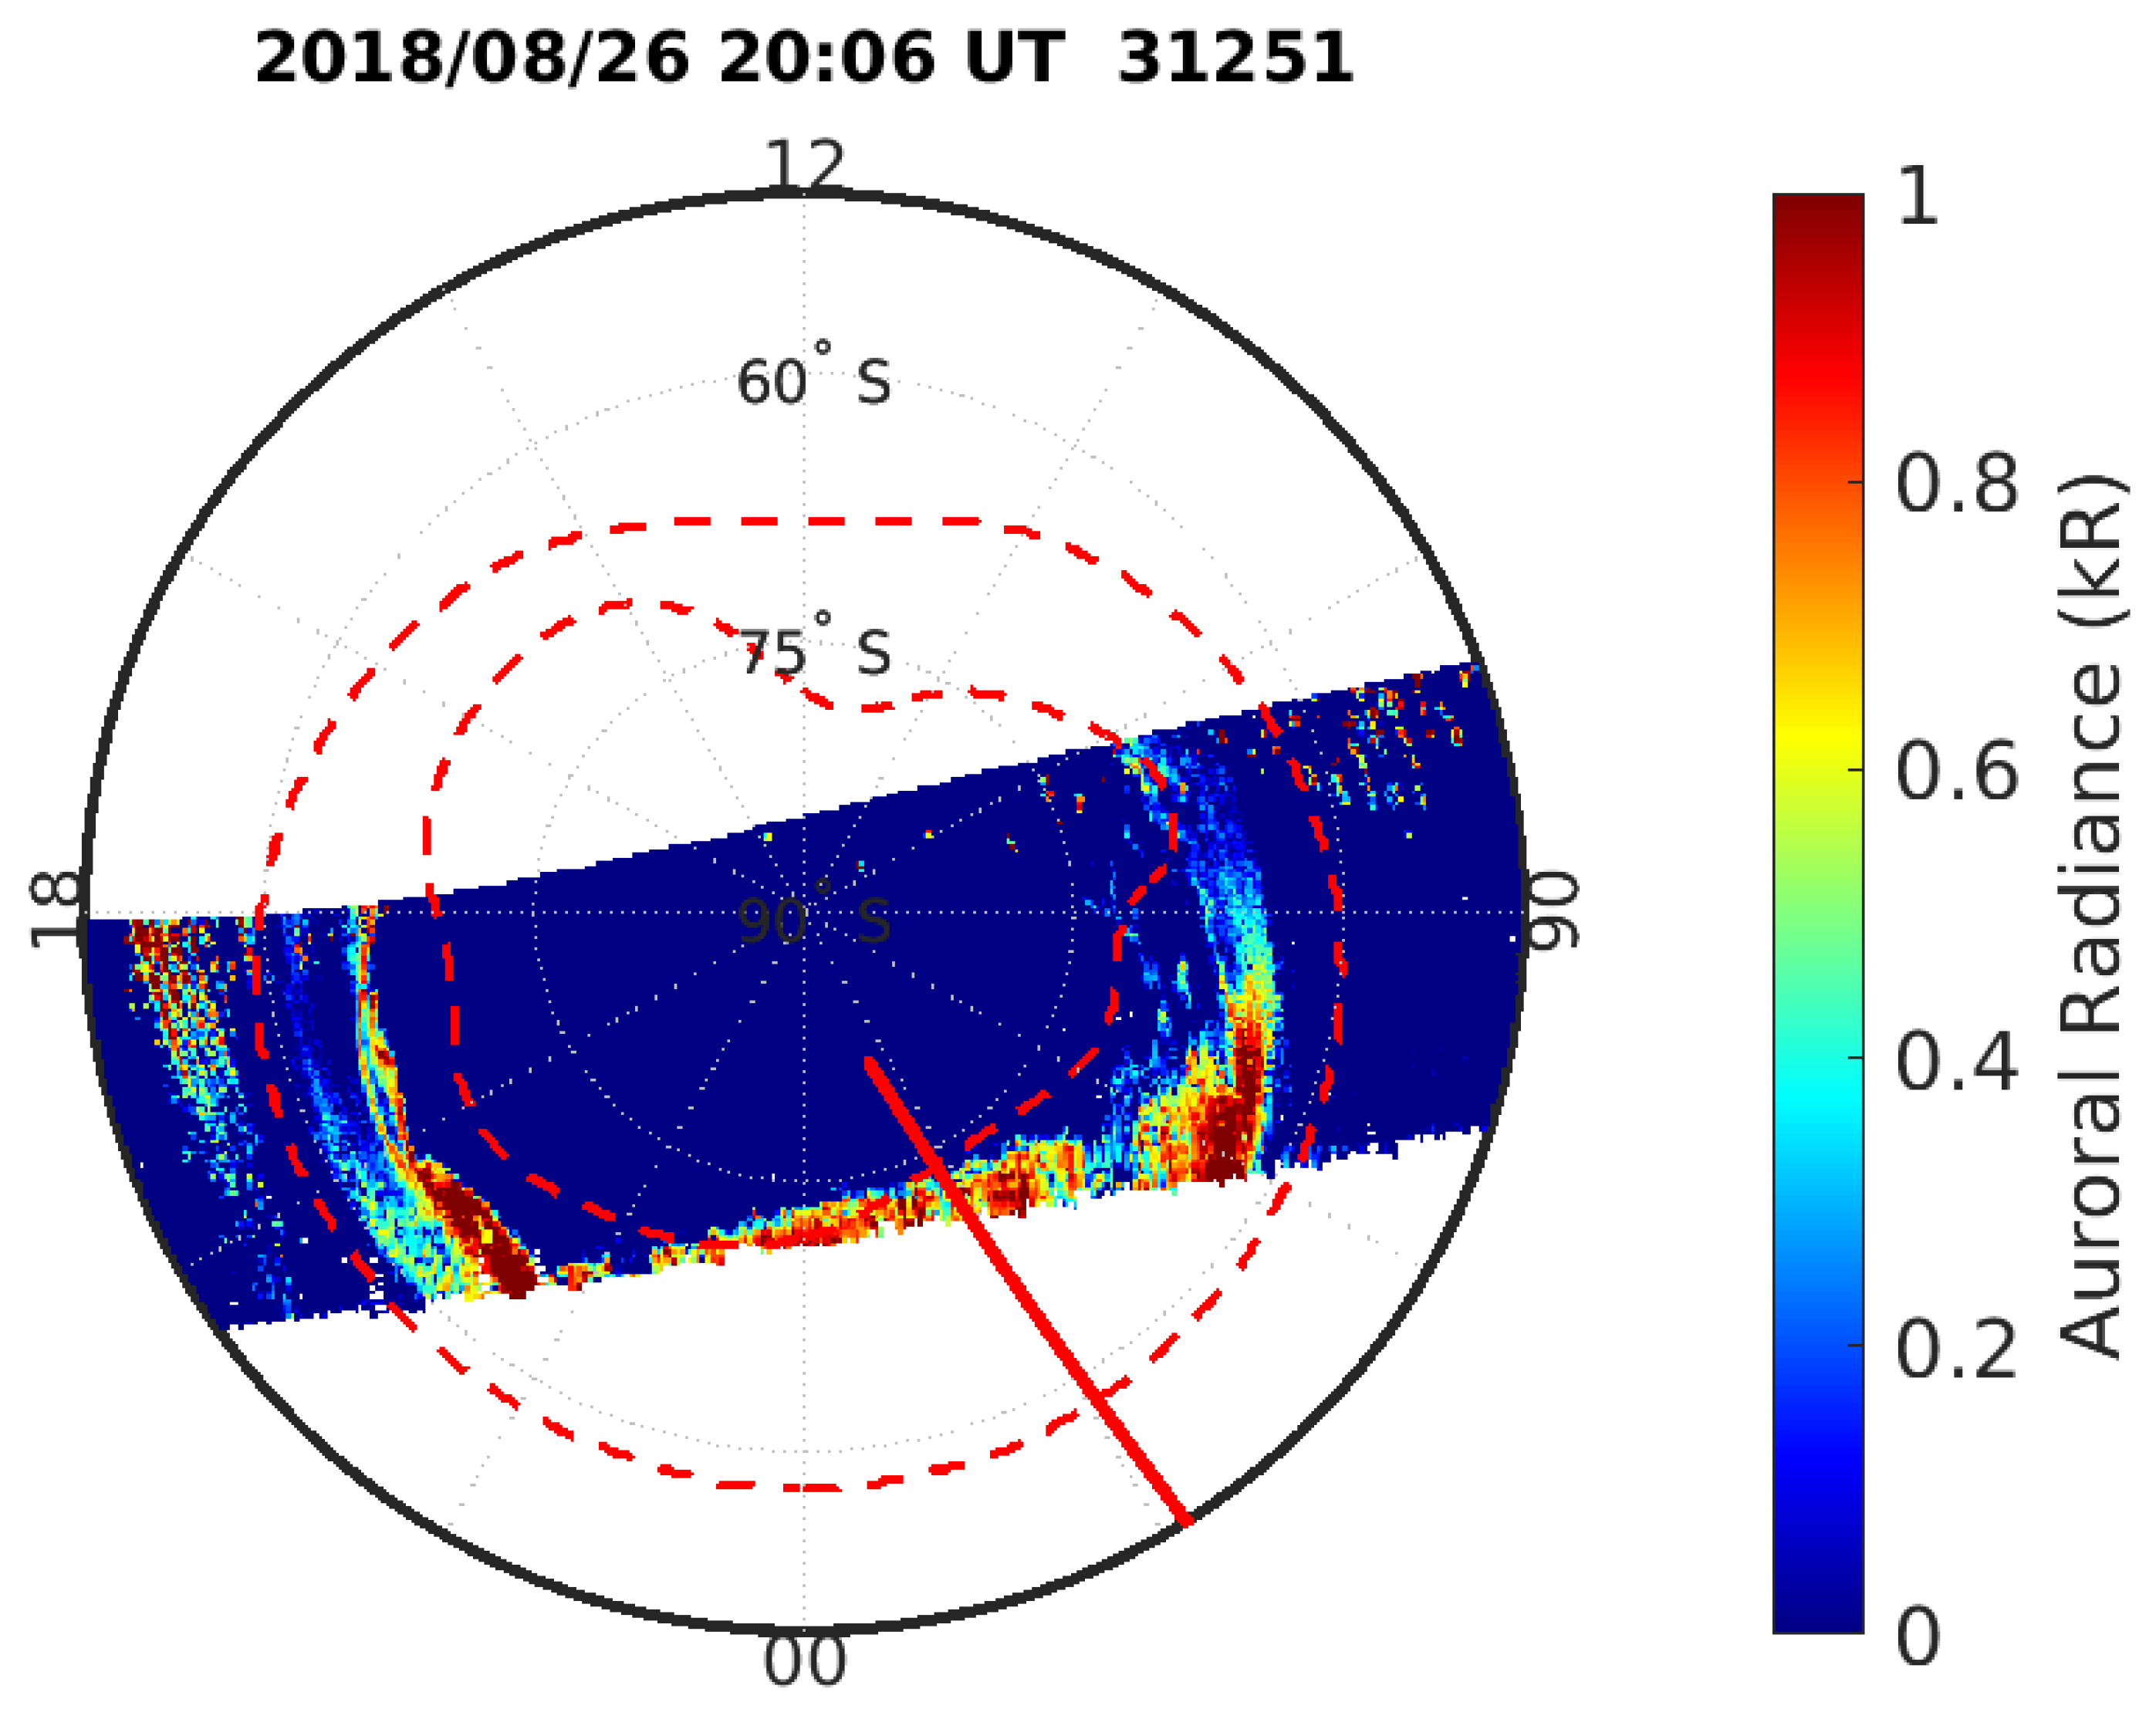
We performed the same investigation during a geomagnetically disturbed period that occurred on 26 August 2018. Figure 5 reports the temporal dependence of the instantaneous dimension (d, left panels) and the inverse persistence ( θ , right panels) as a function of the magnetic latitude superimposed on the temporal behavior of each electric field component.
By examining values of the d parameter (left panels), we observe a pattern closely resembling that observed during the quiet period. Two extensive bands emerge, expanding further in latitude, marked by moderately higher d values. The first band goes roughly from a −55° to −62° magnetic latitude, whereas the second band ranges from −70° to −75°. Outside of these zones, d sets on the lowest values, although, at higher latitudes, they appear higher than mid-latitude. Additionally, in this case, higher d values occurred in the same ionospheric regions characterized by elevated θ values.
Figure 6 illustrates the trajectory of CSES-01 (solid red curve) on 26 August 2018 superposed over the auroral radiance as measured by SSUSI on board DMSP-F17 at 20:06 UT. Once more, the upper and lower modeled boundaries of the auroral oval are represented by red dashed curves. Additionally, in this case, higher values of both d and θ , as shown in Figure 5, occur close to the auroral oval boundaries, where also the most intense fluctuations of the electric field occur.
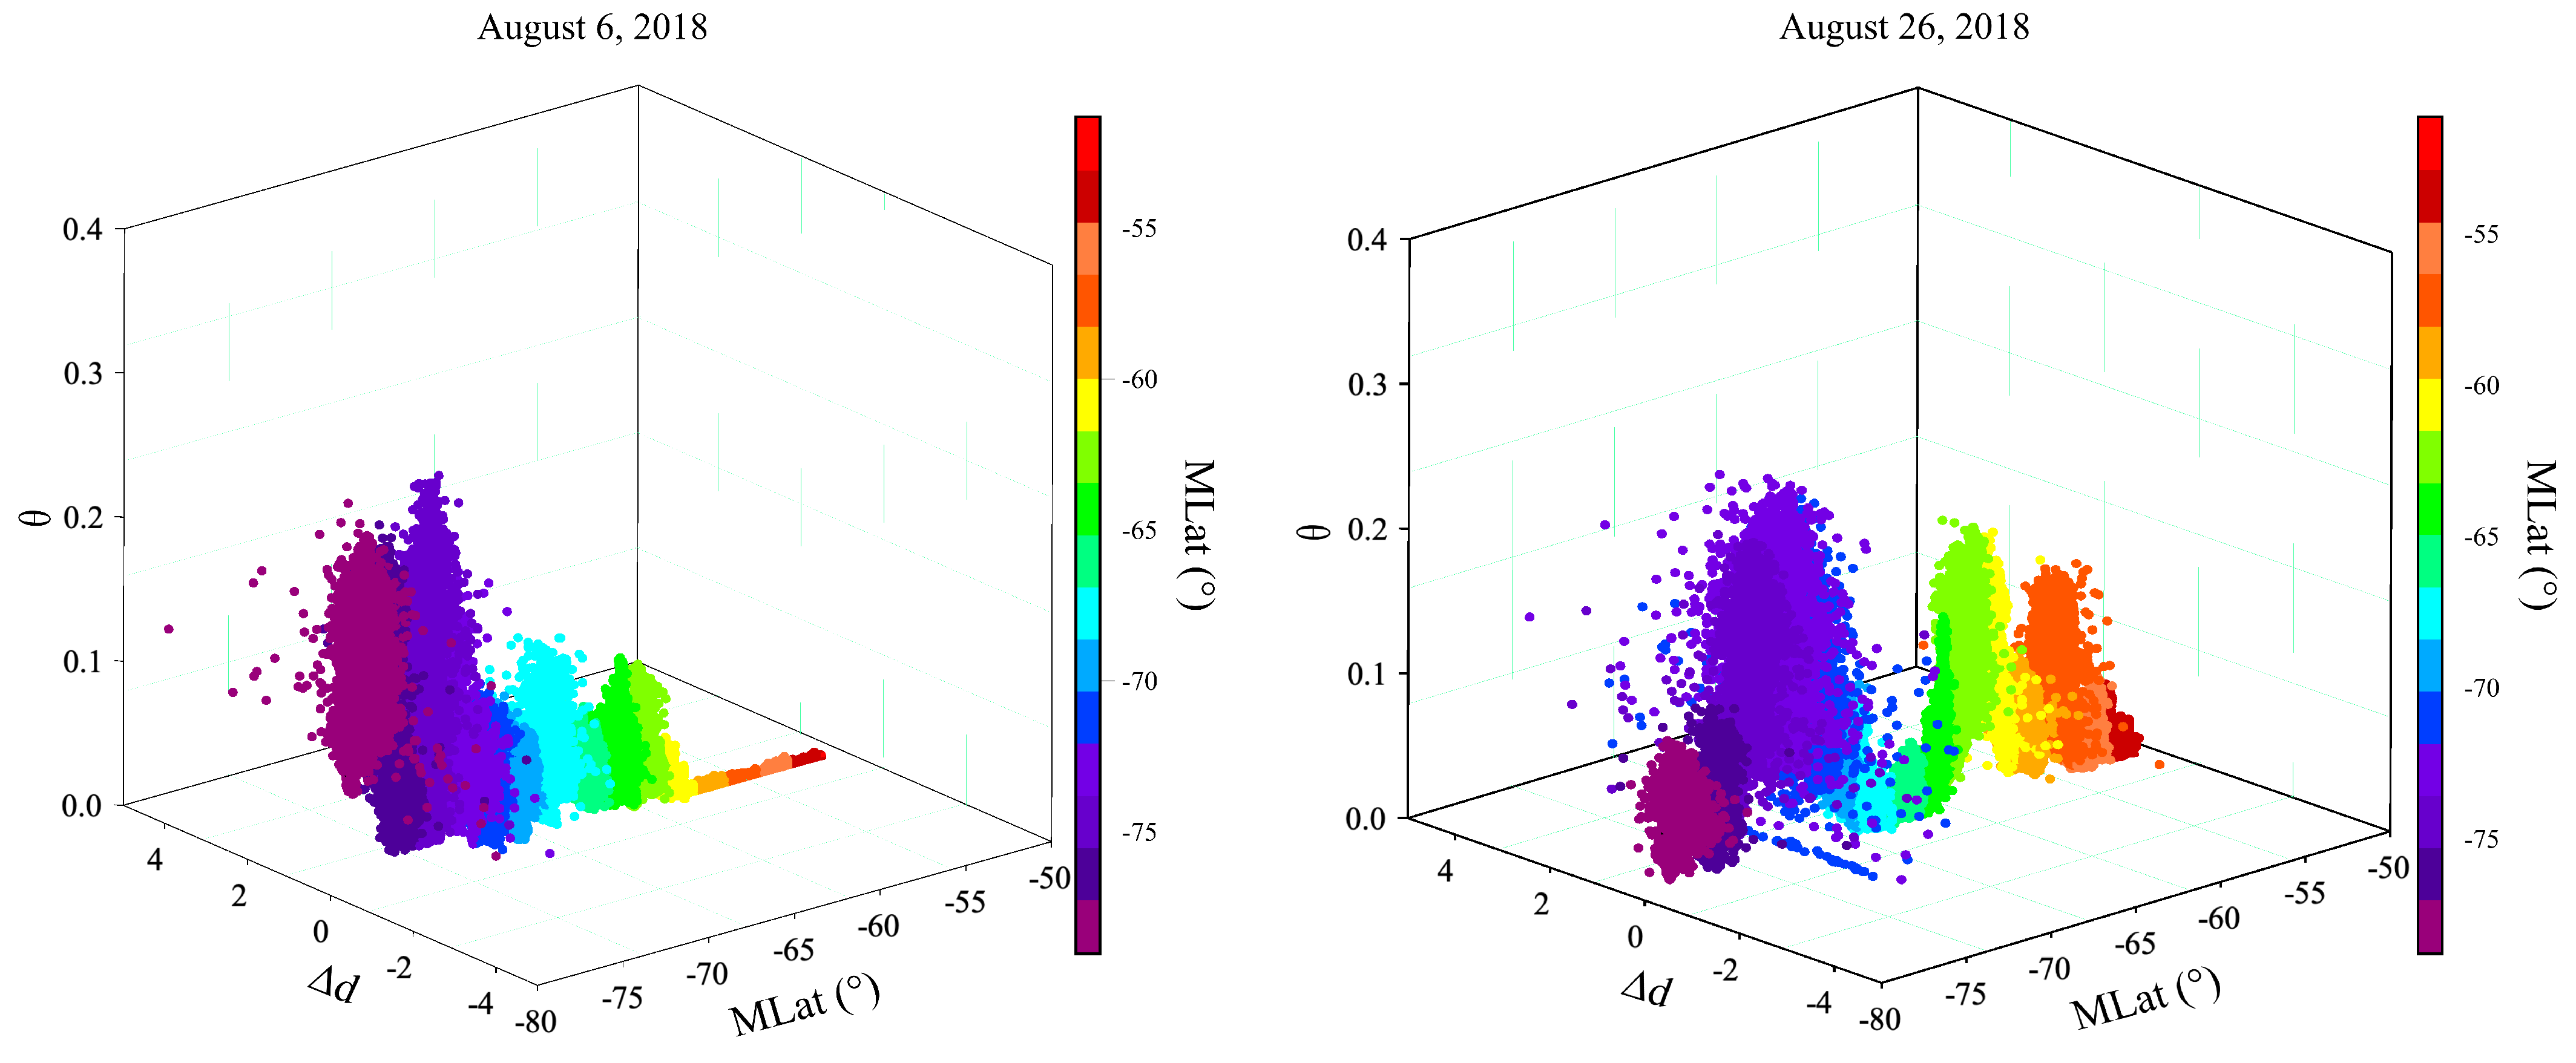
Since d cannot be interpreted as an absolute value [34], Figure 7 shows the three-dimensional scatter plot of Δ d versus θ as a function of geomagnetic latitude (color bar) during both quiet (left) and disturbed (right) periods. Here, Δ d is defined as the variation between a given d parameter value and the subsequent value.
During the quiet period (Figure 7, left panel), variations in d at mid-latitudes are small, while at higher latitudes, the spread of both d and θ increases. In addition, the largest variations in d and the highest values of θ occur, entering the auroral oval (green) and exiting (deep blue) it. Outside these transition zones, namely, in the mid-latitudes, inside the auroral oval, and in the polar cap, values of both d and θ are generally lower.
A similar situation is observed during the disturbed period (Figure 7, right panel). In this case, as shown in Figure 6, the auroral oval is positioned at lower latitudes and occupies a much larger spatial region compared with the quiet period. Correspondingly, the equatorial edge of the auroral oval (colors from red to orange color Figure 7, right panel) is characterized by increased variations in d and higher values of θ , similar to the quiet period. The same characteristics also occur, approaching the polar edge of the auroral oval (in correspondence with light blue and blue in the right panel of Figure 7). Ionospheric regions inside the auroral oval and the polar cap appear characterized by smaller variations in d and lower values of θ .

5. Conclusions

This study presents an analysis of the electric field dynamics during periods of quiet and disturbed geomagnetic activity, utilizing recent advancements in dynamical systems and extreme value theory. Specifically, we utilized two key indicators: the instantaneous dimension d, which evaluates the degrees of freedom within the system, and the index θ , which quantifies the system’s persistence in a given state. Electric field measurements were obtained from the CSES-01 spacecraft at mid- and high latitudes in the Southern Hemisphere and on the night side. Our analysis revealed that the instantaneous dimensions increase upon crossing specific ionospheric regions corresponding to the auroral oval boundaries. Outside these regions, the instantaneous dimensions fluctuate around the state-space dimension, suggesting an ergodic (more stochastic, less predictable) nature of the system. As geomagnetic activity intensifies, differences in the properties of various ionospheric regions persist, albeit with increased system instability characterized by higher values of θ , indicating the externally driven nature of the electric field response to geomagnetic activity. These results underscore the critical role of the auroral oval in modulating the dynamics of the ionospheric electric field. The variations observed in d and θ across different latitudes and geomagnetic conditions suggest that diverse physical processes are at play, ranging from particle precipitation to turbulence driven by geomagnetic activity. This is in agreement with the finding in [23], which analyzed the multifractal features of electric field fluctuations observed by CSES-01 at auroral latitudes under similar geomagnetic conditions, revealing the turbulent nature of these fields. Our study also highlights the importance of high-resolution measurements, such as those provided by CSES-01, in capturing the intricate details of these processes. Additionally, the increase in degrees of freedom, represented by d, indicates the system’s dynamic response to external geomagnetic forces. Although this metric may not directly integrate into predictive models, the insights it provides regarding the system’s complexity and behavior during geomagnetic disturbances can serve as input for refining space weather models. These findings enhance our understanding of the underlying physical processes, facilitating the development of improved forecasts and mitigation strategies for the impacts of space weather on technological systems. Consequently, this study lays the groundwork for integrating such data into more robust modeling approaches for space weather.
Building on the insights from this research, several avenues for future investigation can be pursued. Conducting extended observational campaigns during various magnetospheric substorms will enhance our understanding of the variability and drivers of electric field dynamics in the high-latitude ionosphere. Additionally, comparing data from multiple satellites operating simultaneously in different ionospheric regions can provide a more comprehensive overview of global electric field dynamics and their interactions with geomagnetic disturbances. By exploring these future directions, we can further advance our understanding of the complex processes governing the high-latitude ionosphere, which is a crucial step toward improving space weather forecasting and protecting both space-based and ground-based technological infrastructure.

Author Contributions

Conceptualization, V.Q., G.C. and P.D.M.; methodology, T.A.; formal analysis, V.Q., T.A. and P.D.M.; investigation, V.Q., P.D.M. and G.C.; data curation, E.P. and G.D.; writing—original draft preparation, V.Q., P.D.M., T.A. and G.C.; writing—review and editing, All; funding acquisition, P.D.M. and G.C. All authors have read and agreed to the published version of the manuscript.

Funding

This research received financial support from the Italian Space Agency under the contract ASI “LIMADOU Scienza+” No. 2020-31-HH.0.

Data Availability Statement

The original data collected by CSES-01 and used in this work are available at the official CSES-01 mission data repository, http://www.leos.ac.cn/#/home (accessed on 1 February 2022), upon registration. The Special Sensor Ultraviolet Spectrographic Imager (SSUSI) data are available and documented at https://ssusi.jhuapl.edu/ (accessed on 26 July 2024). The SSUSI Principal Investigator is Dr. Larry J. Paxton.

Acknowledgments

This work is in the framework of the CSES-LIMADOU Collaboration (http://cses.roma2.infn.it, accessed on 15 October 2024). T.A. acknowledges funding from the “Bando per il finanziamento di progetti di Ricerca Fondamentale 2022” of the Italian National Institute for Astrophysics (INAF)—Mini Grant: “The predictable chaos of space weather events”. We thank Davide Faranda for publicly providing the numerical resources to perform the dynamical analysis at https://fr.mathworks.com/matlabcentral/fileexchange/95768-attractor-local-dimension-and-local-persistence-computation (accessed on 28 November 2023).

Conflicts of Interest

The authors declare no conflicts of interest.

Abbreviations

The following abbreviations are used in this manuscript:
AACGMAltitude Adjustment Corrected Geomagnetic
AOauroral oval
AEauroral electrojet
CSESChina Seismo-Electromagnetic Satellite
DMSPDefense Meteorological Satellite Program
EFDelectric field detector
ELFExtremely-Low-Frequency
FACsfield-aligned currents
LBHLLyman-Birge-Hopfield long
LTlocal time
MLatmagnetic latitude
MLTMagnetic Local Time
SSUSISpecial Sensor Ultraviolet Spectrographic Imager
ULFUltra-Low-Frequency
UTUniversal Time

References

  1. Liu, J.; Nakamura, T.; Liu, L.; Wang, W.; Balan, N.; Nishiyama, T.; Hairston, M.R.; Thomas, E. Formation of polar ionospheric tongue of ionization during minor geomagnetic disturbed conditions. J. Geophys. Res. Space Phys. 2015, 120, 6860–6873. [Google Scholar] [CrossRef]
  2. Zhang, K.; Wang, H.; Liu, J.; Zheng, Z.; He, Y.; Gao, J.; Sun, L.; Zhong, Y. Dynamics of the tongue of ionizations during the geomagnetic storm on 7 September 2015. J. Geophys. Res. Space Phys. 2021, 126, e2020JA029038. [Google Scholar] [CrossRef]
  3. Dang, T.; Lei, J.; Wang, W.; Burns, A.; Zhang, B.; Zhang, S.R. Suppression of the polar tongue of ionization during the 21 August 2017 solar eclipse. Geophys. Res. Lett. 2018, 45, 2918–2925. [Google Scholar] [CrossRef]
  4. Kelly, M.C. The Earth’s Ionosphere: Plasma Physics and Electrodynamics, 2nd ed.; Academic Press Inc.: San Diego, CA, USA, 2009. [Google Scholar]
  5. Kintner, P.M., Jr. Observations of velocity shear driven plasma turbulence. J. Geophys. Res. 1976, 81, 5114–5122. [Google Scholar] [CrossRef]
  6. Tam, S.W.Y.; Chang, T.; Kintner, P.M.; Klatt, E. Intermittency analyses on the SIERRA measurements of the electric field fluctuations in the auroral zone. Geophys. Res. Lett. 2005, 32, L05109. [Google Scholar] [CrossRef]
  7. Golovchanskaya, I.V.; Ostapenko, A.A.; Kozelov, B.V. Relationship between the high-latitude electric and magnetic turbulence and the Birkeland field-aligned currents. J. Geophys. Res. 2006, 111, A12301. [Google Scholar] [CrossRef]
  8. Abel, G.A.; Freeman, M.P.; Chisham, G. IMF clock angle control of multifractality in ionospheric velocity fluctuations. Geophys. Res. Lett. 2009, 36, L19102. [Google Scholar] [CrossRef]
  9. Gurnett, D.A.; Huff, R.L.; Menietti, J.D.; Burch, J.L.; Winningham, J.D.; Shawhan, S.D. Correlated low-frequency electric and magnetic noise along the auroral field lines. J. Geophys. Res. 1984, 89, 8971–8985. [Google Scholar] [CrossRef]
  10. Weimer, D.R.; Goertz, C.K.; Gurnett, D.A.; Maynard, N.C.; Burch, J.L. Auroral zone electric fields from DE 1 and 2 at magnetic conjunctions. J. Geophys. Res. 1985, 90, 7479–7494. [Google Scholar] [CrossRef]
  11. Parkinson, M.L. Dynamical critical scaling of electric field fluctuations in the greater cusp and magnetotail implied by HF radar observations of F-region Doppler velocity. Ann. Geophys. 2006, 24, 689–705. [Google Scholar] [CrossRef]
  12. Heppner, J.P.; Liebrecht, M.C.; Maynard, N.C.; Pfaff, R.F. High-latitude distributions of plasma waves and spatial irregularities from DE 2 alternating current electric field observations. J. Geophys. Res. 1993, 98, 1629–1652. [Google Scholar] [CrossRef]
  13. Abel, G.A.; Freeman, M.P.; Chisham, G.; Watkins, N.W. Investigating turbulent structure of ionospheric plasma velocity using the Halley SuperDARN radar. Nonlinear Process. Geophys. 2007, 14, 799–809. [Google Scholar] [CrossRef]
  14. Johnson, E.S.; Heelis, R.A. Characteristics of ion velocity structure at high latitudes during steady southward interplanetary magnetic field conditions. J. Geophys. Res. 2005, 110, A12301. [Google Scholar] [CrossRef]
  15. Golovchanskaya, I.V. On the seasonal variation of electric and magnetic turbulence at high latitudes. Geophys. Res. Lett. 2007, 34, L13103. [Google Scholar] [CrossRef]
  16. Matsuo, T.; Richmond, A.D. Effects of high-latitude ionospheric electric field variability on global thermospheric Joule heating and mechanical energy transfer rate. J. Geophys. Res. 2008, 113, A07309. [Google Scholar] [CrossRef]
  17. Consolini, G.; Quattrociocchi, V.; D’Angelo, G.; Alberti, T.; Piersanti, M.; Marcucci, M.F.; De Michelis, P. Electric Field Multifractal Features in the High-Latitude Ionosphere: CSES-01 Observations. Atmosphere 2021, 12, 646. [Google Scholar] [CrossRef]
  18. Zhang, H.; Zong, Q.; Connor, H.; Delamere, P.; Facskó, G.; Han, D.; Hasegawa, H.; Kallio, E.; Kis, Á.; Le, G.; et al. Dayside Transient Phenomena and Their Impact on the Magnetosphere and Ionosphere. Space Sci. Rev. 2022, 218, 40. [Google Scholar] [CrossRef]
  19. Faranda, D.; Messori, G.; Yiou, P. Diagnosing concurrent drivers of weather extremes: Application to warm and cold days in North America. Clim. Dyn. 2020, 54, 2187–2201. [Google Scholar] [CrossRef]
  20. Faranda, D.; Messori, G.; Yiou, P. Dynamical proxies of North Atlantic predictability and extremes. Sci. Rep. 2017, 7, 41278. [Google Scholar] [CrossRef]
  21. Shen, X.; Zhang, X.; Yuan, S.; Wang, L.; Cao, J.; Huang, J.; Zhu, X.; Piergiorgio, P.; Dai, J. The state-of-the-art of the China Seismo-Electromagnetic Satellite mission. Sci. China E Technol. Sci. 2018, 61, 634–642. [Google Scholar] [CrossRef]
  22. Huang, J.; Lei, J.; Li, S.; Zeren, Z.; Li, C.; Zhu, X.; Yu, W. The Electric Field Detector (EFD) onboard the ZH-1 satellite and first observational results. Earth Planet. Phys. 2018, 2, 469–478. [Google Scholar] [CrossRef]
  23. Consolini, G.; De Michelis, P.; Alberti, T.; Giannattasio, F.; Coco, I.; Tozzi, R.; Chang, T. On the multifractal features of low-frequency magnetic field fluctuations in the field-aligned current ionospheric polar regions: Swarm observations. J. Geophys. Res. Space Phys. 2020, 125, e2019JA027429. [Google Scholar] [CrossRef]
  24. Papini, E.; Piersanti, M.; D’Angelo, G.; Cicone, A.; Bertello, I.; Parmentier, A.; Diego, P.; Ubertini, P.; Consolini, G.; Zhima, Z. Detecting the Auroral Oval through CSES-01 Electric Field Measurements in the Ionosphere. Remote Sens. 2023, 15, 1568. [Google Scholar] [CrossRef]
  25. Davis, T.N.; Sugiura, M. Auroral electrojet activity index AE and its universal time variations. J. Geophys. Res. 1966, 71, 785–801. [Google Scholar] [CrossRef]
  26. Kamide, Y.; Rostoker, G. What Is the Physical Meaning of the AE Index? EOS Trans. 2004, 85, 188–192. [Google Scholar] [CrossRef]
  27. Chaston, C.; Salem, C.; Bonnell, J.; Carlson, C.; Ergun, R.; Strangeway, R.; McFadden, J.P. The turbulent Alfvénic aurora. Phys. Rev. Lett. 2008, 100, 175003. [Google Scholar] [CrossRef]
  28. Tchen, C.; Pecesli, H.; Larsen, S.E. Strong turbulence in low-β plasmas. Plasma Phys. 1980, 22, 817. [Google Scholar] [CrossRef]
  29. Finlay, C.C.; Kloss, C.; Olsen, N.; Hammer, M.D.; Tøffner-Clausen, L.; Grayver, A.; Kuvshinov, A. The CHAOS-7 geomagnetic field model and observed changes in the South Atlantic Anomaly. Earth Planets Space 2020, 72, 156. [Google Scholar] [CrossRef]
  30. Lucarini, V.; Faranda, D.; Wouters, J.; Kuna, T. Towards a General Theory of Extremes for Observables of Chaotic Dynamical Systems. J. Stat. Phys. 2014, 154, 723–750. [Google Scholar] [CrossRef]
  31. Moreira Freitas, A.C.; Milhazes Freitas, J.; Todd, M. Extremal Index, Hitting Time Statistics and periodicity. arXiv 2010, arXiv:1008.1350. [Google Scholar]
  32. Lucarini, V.; Faranda, D.; Wouters, J. Universal Behaviour of Extreme Value Statistics for Selected Observables of Dynamical Systems. J. Stat. Phys. 2012, 147, 63–73. [Google Scholar] [CrossRef]
  33. Lucarini, V.; Faranda, D.; de Freitas, A.C.G.M.M.; de Freitas, J.M.M.; Holland, M.; Kuna, T.; Nicol, M.; Todd, M.; Vaienti, S. Extremes and Recurrence in Dynamical Systems; Wiley: Hoboken, NJ, USA, 2016. [Google Scholar]
  34. Faranda, D.; Messori, G.; Alberti, T.; Alvarez-Castro, C.; Caby, T.; Cavicchia, L.; Coppola, E.; Donner, R.; Dubrulle, B.; Galfi, V.M.; et al. A statistical physics and dynamical systems perspective on geophysical extreme events. arXiv 2023, arXiv:2309.15393. [Google Scholar] [CrossRef]
  35. Alberti, T.; Florindo, F.; Rohling, E.J.; Lucarini, V.; Faranda, D. Dimensional analysis identifies contrasting dynamics of past climate states and critical transitions. arXiv 2023, arXiv:2309.12693. [Google Scholar] [CrossRef]
  36. Süveges, M. Likelihood estimation of the Extremal index. Extremes 2007, 10, 41–55. [Google Scholar] [CrossRef]
  37. Moloney, N.R.; Faranda, D.; Sato, Y. An overview of the extremal index. Chaos 2019, 29, 022101. [Google Scholar] [CrossRef]
  38. Bruno, R.; Carbone, V. The solar wind as a turbulence laboratory. Living Rev. Sol. Phys. 2013, 10, 2. [Google Scholar] [CrossRef]
  39. Shaikh, D.; Shukla, P. 3D simulations of fluctuation spectra in the Hall-MHD plasma. Phys. Rev. Lett. 2009, 102, 045004. [Google Scholar] [CrossRef]
  40. Galtier, S.; Buchlin, E. Multiscale Hall-magnetohydrodynamic turbulence in the solar wind. Astrophys. J. 2007, 656, 560. [Google Scholar] [CrossRef]
  41. Alexandrova, O.; Carbone, V.; Veltri, P.; Sorriso-Valvo, L. Small-scale energy cascade of the solar wind turbulence. Astrophys. J. 2008, 674, 1153. [Google Scholar] [CrossRef]
  42. Basu, S.; Basu, S.; MacKenzie, E.; Coley, W.; Sharber, J.; Hoegy, W. Plasma structuring by the gradient drift instability at high latitudes and comparison with velocity shear driven processes. J. Geophys. Res. Space Phys. 1990, 95, 7799–7818. [Google Scholar] [CrossRef]
  43. Kintner, P.M.; Seyler, C.E. The status of observations and theory of high latitude ionospheric and magnetospheric plasma turbulence. Space Sci. Rev. 1985, 41, 91–129. [Google Scholar] [CrossRef]
  44. Paxton, L.J.; Meng, C.I.; Fountain, G.H.; Ogorzalek, B.S.; Darlington, E.H.; Gary, S.A.; Goldsten, J.O.; Kusnierkiewicz, D.Y.; Lee, S.C.; Linstrom, L.A.; et al. SSUSI: Horizon-to-horizon and limb-viewing spectrographic imager for remote sensing of environmental parameters. In Society of Photo-Optical Instrumentation Engineers (SPIE) Conference Series; Ultraviolet Technology IV; Huffman, R.E., Ed.; SPIE: Bellingham, WA, USA, 1993; Volume 1764, pp. 161–176. [Google Scholar] [CrossRef]
  45. Paxton, L.J.; Schaefer, R.K.; Zhang, Y.; Kil, H. Far ultraviolet instrument technology. J. Geophys. Res. Space Phys. 2017, 122, 2706–2733. [Google Scholar] [CrossRef]
  46. D’Angelo, G.; Piersanti, M.; Pignalberi, A.; Coco, I.; De Michelis, P.; Tozzi, R.; Pezzopane, M.; Alfonsi, L.; Cilliers, P.; Ubertini, P. Investigation of the physical processes involved in gnss amplitude scintillations at high latitude: A case study. Remote Sens. 2021, 13, 2493. [Google Scholar] [CrossRef]
  47. Keskinen, M. The structure of the high-latitude ionosphere and magnetosphere. Johns Hopkins Apl Tech. Dig. 1984, 5, 154–158. [Google Scholar]
  48. Hunsucker, R.D.; Hargreaves, J.K. The High-Latitude Ionosphere and Its Effects on Radio Propagation; Cambridge University Press: Cambridge, UK, 2007. [Google Scholar]
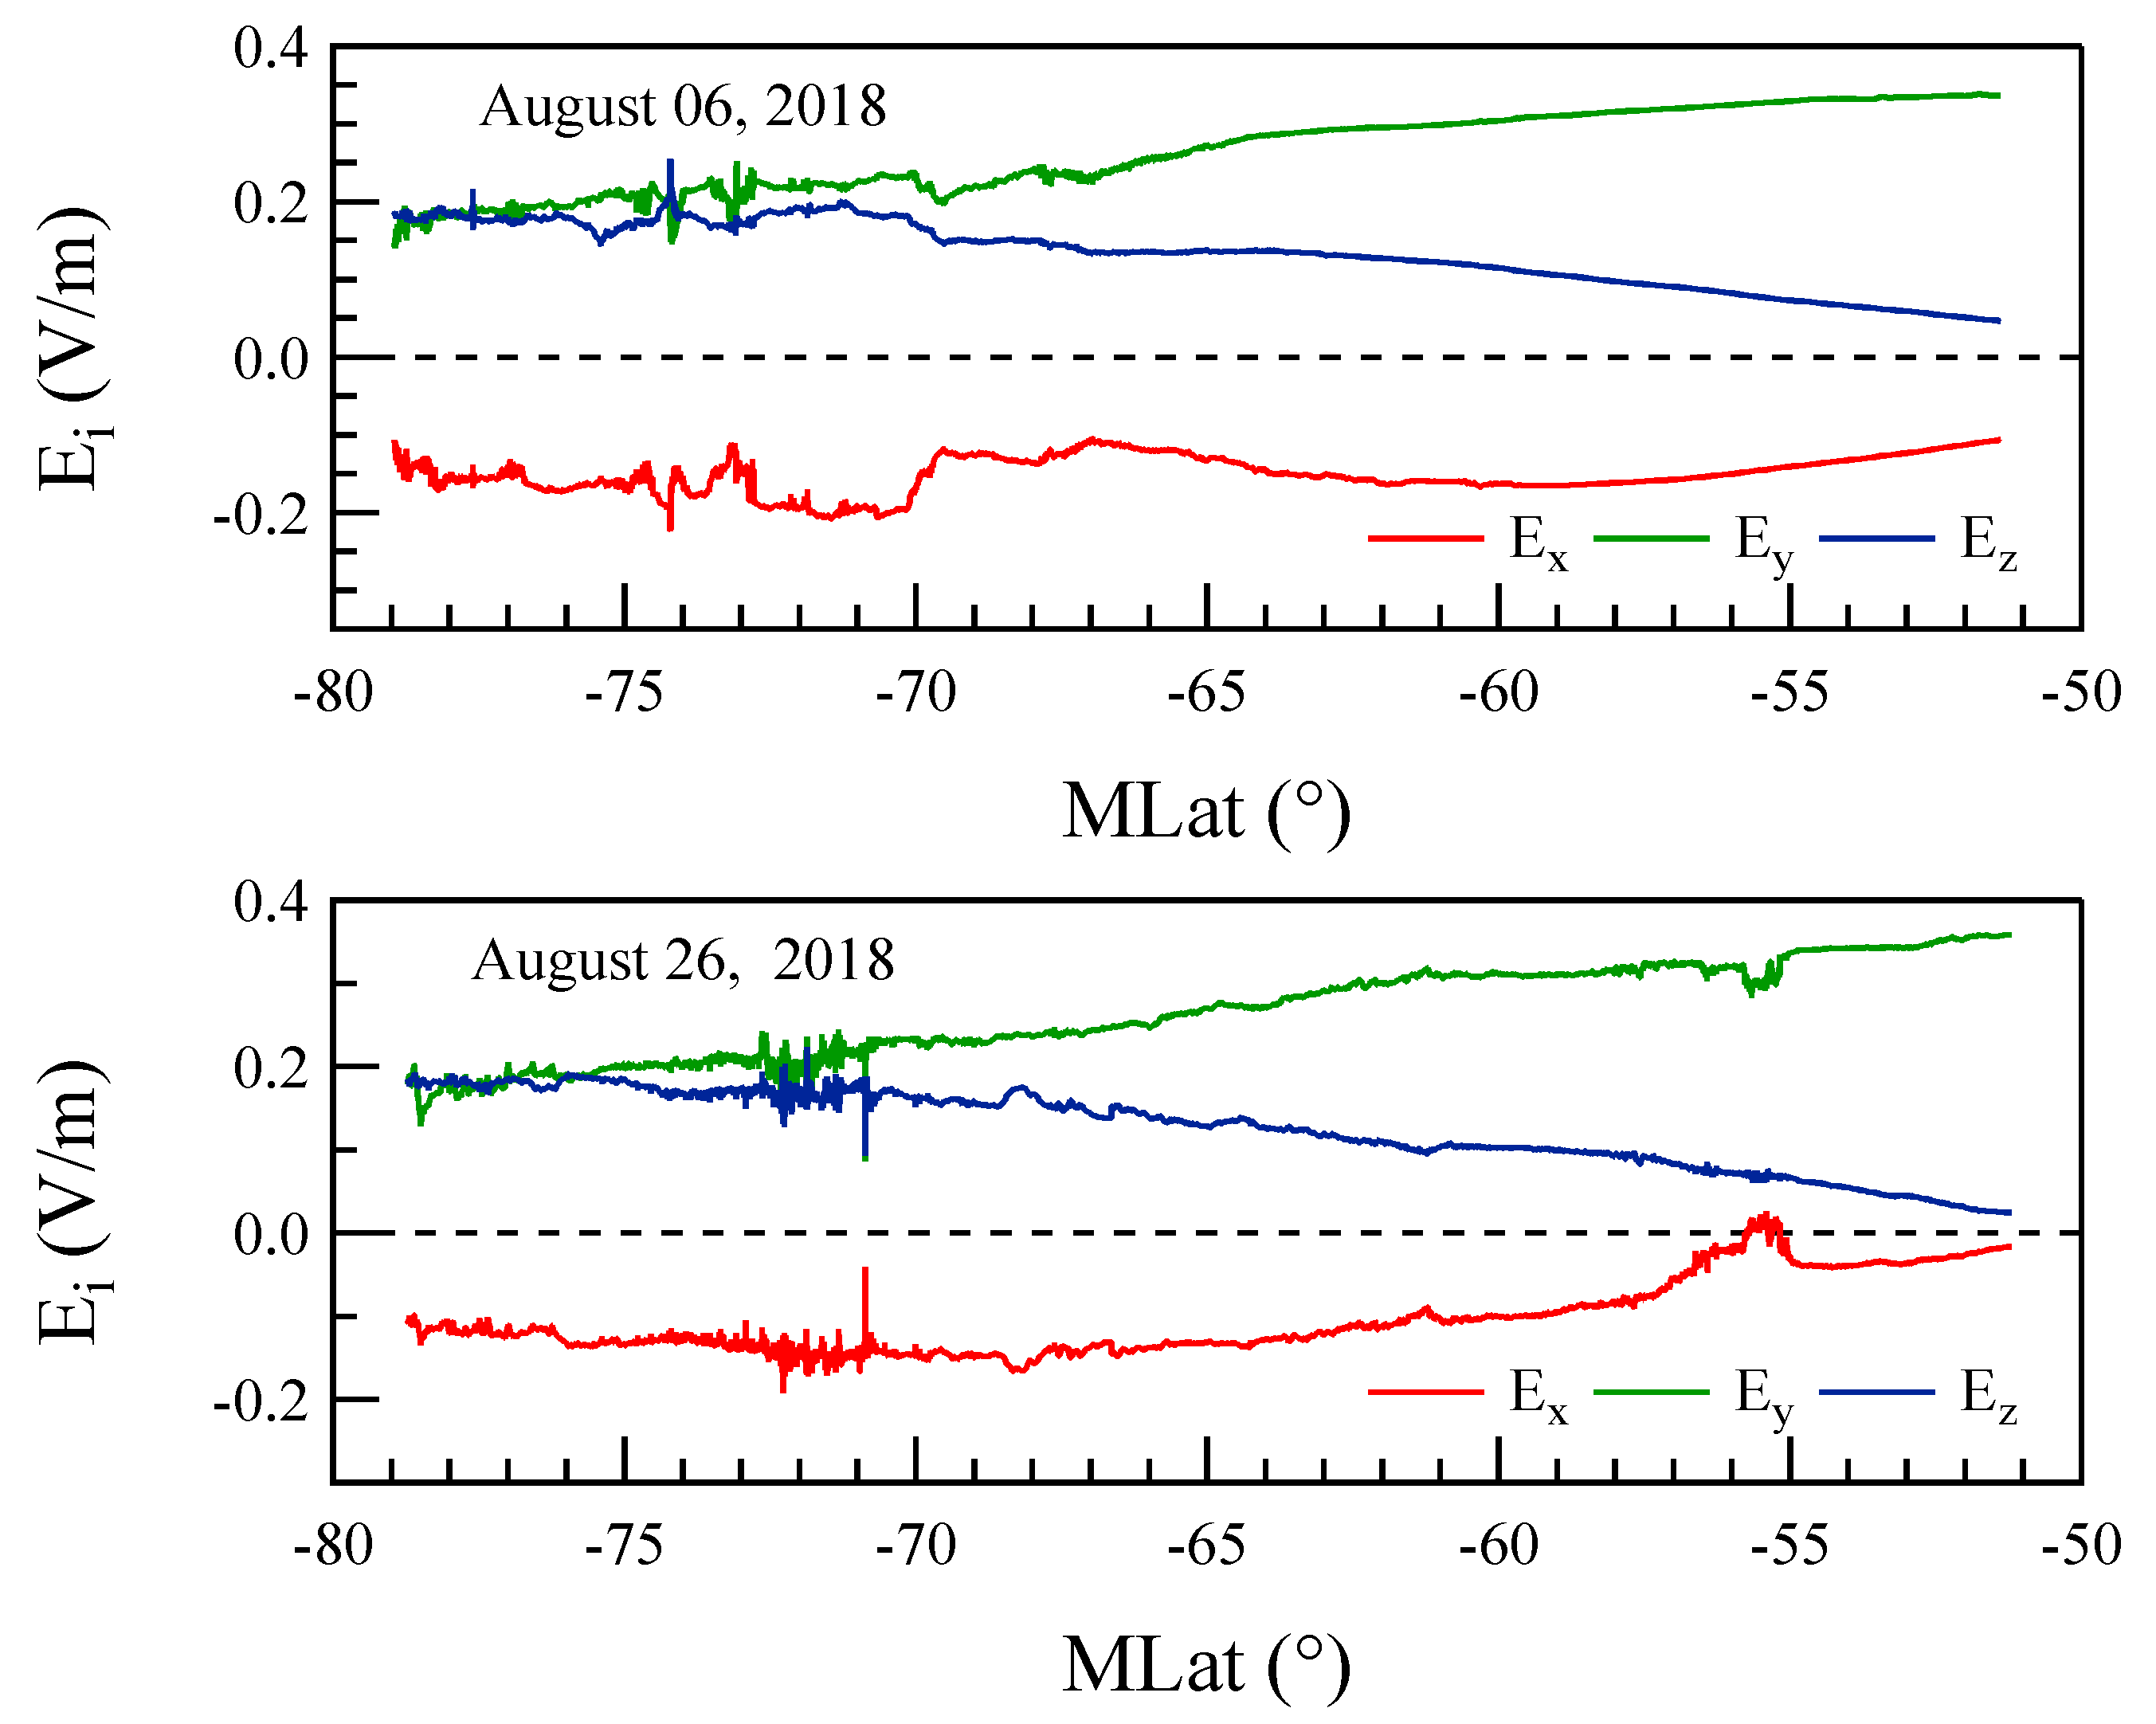
Figure 1. The three components of the electric field as a function of magnetic latitude during quiet (top panel) and disturbed (bottom panel) periods measured by CSES-01. The data correspond to the satellite passages between 18:32:36 UT and 18:39:45 UT on 6 August 2018 (top panel) and between 20:06:46 UT and 20:13:54 UT on 26 August 2018 (bottom panel).
Remotesensing 16 03919 g001
Figure 2. The traces of the power spectra density (PSD) for the two selected crossings of the southern polar ionosphere are shown. The PSD for the disturbed period (26 August 2018) has been shifted by a factor of 100. The dotted and dashed lines represent power-law behaviors. The vertical red dashed line indicates the spectral break f c 4 Hz, relative to the PSD of the disturbed period.
Remotesensing 16 03919 g002
Figure 3. Dependence of the instantaneous dimension d (left panels) and the inverse persistence θ (right panels) as a function of the magnetic latitude during the selected quiet period on 6 August 2018 superimposed on the latitudinal variation of each electric field component (from top to bottom, E x , E y , and E z ). The color bar for d is saturated to a maximum value of 5 to improve visualization.
Remotesensing 16 03919 g003
Figure 4. The colored contour of the auroral emission as detected in the Lyman-Birge-Hopfield long (LBHL) band by the SSUSI instrument on board DMSP-F17 in the geomagnetic AACGM (MLat, MLT) reference frame. The auroral image was acquired by the SSUSI instrument at 18:12 UT on 6 August 2018. The red dashed curves show the modeled borders of the auroral oval (AO), whereas the solid red curve depicts the orbital trajectory of CSES-01 (orbit 2820 (1)).
Remotesensing 16 03919 g004
Figure 5. The dependence of the instantaneous dimension (d, left panels) and the inverse persistence ( θ , right panels) as a function of the magnetic latitude during the selected disturbed period on 26 August 2018, superimposed on the temporal behavior of each electric field component (from top to bottom, E x , E y , and E z ). The color bar for d is saturated to a maximum value of 5 to improve visualization.
Remotesensing 16 03919 g005
Figure 6. The colored contour of the auroral emission as detected in the LBHL band by the SSUSI instrument on board DMSP-F17 in the AACGM (MLat, MLT) coordinate reference frame. The auroral image was acquired by the SSUSI instrument at 20:06 UT on 26 August 2018. The red dashed curves indicate the modeled borders of the auroral oval (AO), while the solid red curve represents the orbital trajectory of CSES-01 (orbit 3125 (1).
Remotesensing 16 03919 g006
Figure 7. Three-dimensional plot of Δ d vs. θ as a function of geomagnetic latitude for quiet (left) and disturbed (right) periods. To aid in visualization, the magnetic latitude values are color-coded from red to blue, representing mid- to high latitudes.
Remotesensing 16 03919 g007
Disclaimer/Publisher’s Note: The statements, opinions and data contained in all publications are solely those of the individual author(s) and contributor(s) and not of MDPI and/or the editor(s). MDPI and/or the editor(s) disclaim responsibility for any injury to people or property resulting from any ideas, methods, instructions or products referred to in the content.