Abstract
Despite the swift advancement of geometric calibration techniques, the geometric performance of remote sensing imagery remains heavily contingent upon the quality and distribution of ground control data. Securing precise ground control data is often laborious, and the accuracy of open-source control data is subject to variability. This paper explores the potential of the globally dispersed International GNSS Service (IGS) network to enhance the geometric performance of remote sensing images. The IGS network, with its extensive reach, offers superior positioning and navigation products that surpass the previously mentioned sources. To establish a connection between the IGS network and remote sensing images, high-resolution GEM chips (GEMs) are firstly utilized for precise positioning. Geolocation biases of these GEMs are refined based on the identified IGS information. After that, the calibrated GEM chips are applied as control information for the geometric calibration of raw satellite images. A test dataset from the Chinese Gaofen-2 (GF-2) with various forms of coverage is experimented, with LiDAR-derived Digital Surface Models (DSMs) serving as reference for the validation of the proposed method. Compared with traditional methods using the GEMs as a direct reference, the experimental results demonstrate that the introduced IGS information enhances the geometric performance of remote sensing images, exhibiting robust generalization performance across remote sensing data from various source domains.
1. Introduction
1.1. Motivation
Over the past few decades, there has been a dramatic increase in the volume of Earth Observation Data. This has facilitated the collection of multi-source images for the same geographic locations. Satellite remote sensing images, with their vast coverage, provide unique benefits in a range of applications, including mineral resource exploration, agricultural and forestry monitoring, disaster prevention, tracking global land surface changes, and ecological environment monitoring [1,2,3].
However, the geolocation accuracy of multi-view remote sensing images would vary significantly when subjected to the influence of spatial environment, viewing angle, and atmospheric refraction. Consequently, geometric processing is indispensable for aligning the observed targets with the ground truth and correcting the existing misalignments.
Spatial accuracy of the information extracted from high-resolution remote sensing images highly depends on the accuracy of the geometric performance of images provided by vendors [4]. Typically, there are three primary types of ground control data utilized for this purpose: calibration fields, ground control points (GCPs), and reference geographical data [5]. Calibration fields, as the most rudimentary method for enhancing geolocation precision, are characterized by their uniform distribution. However, they come with the downsides of high costs and limited portability due to their fixed infrastructure. In contrast, GCPs are manually measured at conspicuous features and offer greater adaptability. They can achieve remarkable accuracy, often at the centimeter or millimeter scale. GCPs are extensively applied in aerial photogrammetry for smaller areas. Nonetheless, the process of collecting GCPs for larger regions demands a substantial workload. The variety of reference geographical data is vast, with digital ortho maps (DOMs), OpenStreetMap (OSM), and light detection and ranging (LiDAR) point cloud being the most frequently employed. Acquiring extensive reference geographical data is more cost-efficient, yet the potential inaccuracies in the calibration process may not suffice for certain advanced applications.
In contrast, the globally distributed International GNSS Service (IGS) stations can provide reference geolocation information for navigation and geodesy continuously, which provides better performance in stability and uniformity as ground control data [6]. Thus, this paper investigated the suitability of the International GNSS Service, a globally distributed reference framework, to provide reference geopositioning information for the calibration of very-high-resolution (VHR) remote sensing images.
1.2. Related Works
Due to the influence of factors such as the space thermal and mechanical environment during the satellite launch and operation process, the laboratory calibration parameters of the optical remote sensing satellite imaging system have significant errors and are not applicable [7]. In the early 20th century, the US Geological Survey (USGS) sponsored construction for the efficient calibration of metric quality aerial cameras by setting the Madison aerial calibration field [8], as well as the Vaihingen/Enz test site [9]. As for the large-scale coverage satellite remote sensing images, globally distributed calibration sites are required to produce convincing results. Twenty-one geometric calibration fields were built worldwide for the SPOT series satellite [10], while the Geoeye-1 satellite was calibrated using reference information from twenty-four ground calibration fields [11]. To facilitate the development of the domestic earth observation, calibration fields in Baotou, Zhongwei and Songshan were built with the support from the Chinese government and communities [7,12,13].
With the assistance of calibration fields, the geometric quality of obtained remote sensing images can be improved. For example, the intra-image distortion of SPOT-5 images was reduced within 0.5 pixels based on the high-accuracy reference data from the MANOSQUE calibration field [14]. Accurate interior and exterior orientation parameters of the IKONOS satellite was refined to achieve high geometric accuracy with ground control information [15]. The geometric performance of Ziyuan (ZY) series and Gaofen (GF) series satellites was also prompted based on reference information from the domestic calibration fields [16,17,18]. As can be seen from previous research, the use of a calibration field greatly enhances the performance of the satellite images. However, the establishment and maintenance of existing calibrations are laborious and costly, and the long-term update of calibration parameters may not meet the requirement of some emergency applications. In comparison, the acquisition of control points is more flexible and convenient [19,20]. The GCPs are usually located at areas where features are evident, including at the crossing of roads and corner points. The coordinates of these GCPs can be obtained using the GNSS-based receivers [21]. Based on the Real-Time Kinematic (RTK) positioning technology, the measurement accuracy of GCPs can reach the centimeter level. Therefore, it is widely used in aerial mapping [22,23]. Research has also been conducted for the geometric correction of satellite remote sensing images based on manually measured GCPs. Zhou et al. [24] and Yilmaz et al. [25] investigated the influence of the number and distribution of GCPs in the geometric correction of satellite remote sensing images. The results indicated that uniformly distributed GCPs covering the whole image gave the best performance, and the geolocation accuracy could reach the pixel-level for satellite remote sensing images [26,27]. Influenced by the large-scale coverage of satellite remote sensing images, the collection of GCPs is also laborious and time-consuming. As time goes on, the surface of the observed area would have changed, which would introduce extra errors in geometric correction [28,29].
Hence, digital reference geographical data, also known as “cloud control” data, have been widely applied in satellite remote sensing image correction [30,31]. In 2017, Aguilar et al. used DOM and the digital elevation model (DEM) as reference for the geometric correction of WorldView-2 and GeoEye-1 imagery [32]. LiDAR point cloud, digital line graphics (DLGs) and images with known orientation parameters (such as WorldView-1/2/3/4 and TerraSAR-X) can be regarded as “cloud control” data, which are not always accessible to most users [33,34,35]. Benefiting from the open sources and global distribution, the OpenStreetMap (OSM) and Google Earth Map (GEM) are widely applied in geometric correction [36,37]. The open-sourced geographical data, including the GEM and OSM, suffer from instability in geolocation accuracy, thereby influencing the final performance of these calibrated images when directly applied. The accuracy of volunteered open-sourced geographical data usually ranges from several meters to tens of meters, which is influenced by many influences such as terrain, time, and location [37,38,39,40]. Although Chandelier et al. introduced the Space Reference Points (SRPs), a new worldwide 3D GCP database built from a very large SPOT 6/7 multi-view imagery [41], the accuracy and resolution still cannot meet the requirement of high-accuracy mapping of VHR imagery.
In order to provide global reference information with high accuracy and which is easily accessible to users, the IGS information is considered as a substitute in this paper. Globally distributed IGS stations can provide reference geolocation information for navigation and geodesy continuously [6]. Compared with the above three kinds of ground control data, the stability and uniformity of IGS data give better performance, and the coordinates of all control information in satellite image geometric processing are calculated with reference to the published IGS information [6,42,43]. In 2015, Mukul et al. used the post-processed location of IGS information for the accuracy analysis of open-sourced Shuttle Radar Topography Mission (SRTM) elevation models [42]. Recently, Wang et al. verified the geometric performance of GEM over typical regions in Australia with the IGS information [44]. The geolocation of the provided IGS information, usually considered as the center of the monument, is difficult to be directly identified in most spaceborne remote sensing images. Therefore, the introduction of high-resolution GEM chips (GEMs) and close-range images is intended to transfer the control information from IGS data to remote sensing images [45].
1.3. Contribution
Based on the above analysis, this paper aims to introduce the IGS information as a reference for remote sensing image geometric calibration. The main contributions of this paper can be summarized as follows:
- An IGS-assisted geolocation method is introduced to transform the IGS information into satellite image geometric calibration.
- High-resolution GEMs are applied for the accurate extraction and location of the footprint of the IGS monument, and the calibrated GEMs are considered as the “cloud control” data.
1.4. Organization
The rest of this paper is organized as follows: Section 2 introduces the detailed information of the experimental dataset. Section 3 presents our method of introducing the IGS information as control data for satellite image geometric calibration. Experimental results and analysis are shown in Section 4. Section 5 draws the conclusion based on the findings of this study.
2. Study Area and Dataset
Within the scope of this study, satellite images covering different types of land in America were obtained from the Chinese GF-2 satellite to be geometrically calibrated using ground control data from the IGS information. In this sense, the dataset used is presented as follows.
2.1. Study Sites
The study areas are located in the main land of America as shown in Figure 1. Six IGS sites located in the east, middle and west of America are selected in this study. Four of them, namely BLYT00USA, MRC100USA, NLIB00USA, and SGPO00USA, are located in plain areas, while the other two (namely P77900USA and QUIN00USA) are located in mountainous areas. Figure 2 gives the overview and its corresponding close-range images of all test IGS sites. The overview images with very high resolution are obtained from the GEM, and the IGS sites are easy to extract due to the very-high-resolution images and its high contrast in this scene. The corresponding close-range images can be found in https://igs.org/network-resources (accessed on 13 October 2024), which is recorded to show the relative location of the IGS monument. The close-range images are obtained from different views to show the installation as well as the surroundings.
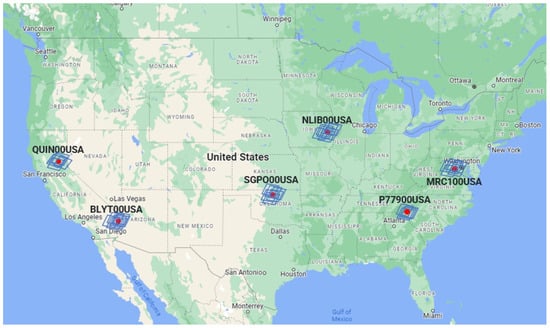
Figure 1.
Dataset distribution. Red points are the location of tested IGS stations, while blue rectangles are the coverage of raw satellite images.
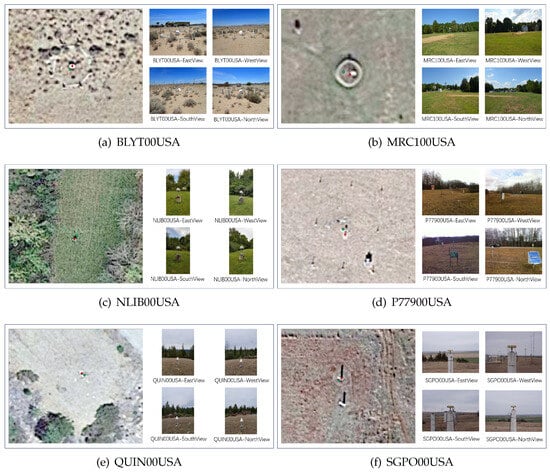
Figure 2.
Illustration of the IGS antenna monuments investigated in our experiment. The left images of each sub-image are the satellite-view DOMs, and the right images are its corresponding close-range photos.
In most cases, the IGS sites are located in open areas to guarantee the full transmission of signals. All IGS stations are uniformly distributed all over the world to satisfy the worldwide mapping of the Earth.
2.2. Raw Satellite Imagery
Multi-view images from the Chinese GF-2 satellite were included in this study. The GF-2 satellite is the second high resolution imaging satellite of China high resolution earth observation system (CHEOS). The nominal resolution is designed as 0.81 m for panchromatic and 3.24 m for multispectral sensors. The coverage area of standard level 1 products can reach about 45 km. Detailed information of the GF-2 satellite images can be found in Table 1.

Table 1.
Detailed information of the GF-2 satellite imagery.
As showin in Figure 1 and Table 2, six IGS stations were completely covered by these images, and the overlap in each test sites ranges from 4 to 8, and the acquisition time of these images varied from 13 January 2020 to 23 February 2023. The multi-view remote sensing images provide redundant information of the tested sites, which plays a key role in geometric calibration without any control information. The constraints between images will leading a more acceptable result under some specific conditions [29,46]. However, these conditions are not easy to satisfy, thereby decreased the suitability of these methods.

Table 2.
Detailed information of the experimental satellite remote sensing images.
2.3. Ground Truth
To verify the geometric performance of the proposed IGS-assisted geolocation method, LiDAR point cloud produced DSMs are applied as the ground truth. These LiDAR point cloud were obtained based on the 3d elevation project (3DEP, https://www.usgs.gov/3d-elevation-program (accessed on 13 October 2024)). The objective of this project is to obtain full national coverage elevation data with high quality. There are three kinds of source data products:LiDAR point clouds, source (original) resolution DEMs from which the 3DEP standard DEM datasets were produced, and additional data types produced from IfSAR collections. The LiDAR point cloud are the foundational data in this project, and the accuracy usually can reach decimeter level. Most of them are collected in 2014, and some of them are be updated periodically. The publication of the nationwide elevation data greatly encourages the development in scientific research as well as government applications.
In most cases, the LiDAR point cloud collected from the 3DEP is stored in LAS file in the form of coordinates. Therefore, these LAS files is firstly transfered into a raster file with the resolution of 0.5 m and the WGS 1984 geodetic coordinate system. Considering the discrepancy in acquisition time between the LiDAR point cloud and the raw satellite images, a time-difference mask is labeled manually to avoid the inconsistency.
3. Methodology
In this paper, we aim to build an IGS-assisted geometric calibration method to provide high-accuracy as well as open-source reference information for satellite remote sensing images. Figure 3 illustrates the workflow of this study. Firstly, the geolocation information are collected from the official IGS website. Based on the published actual location, we can find the approximate coverage in open-source DOMs (such as Google Earth Maps). Sometimes there are more than one similar targets around the monument, therefore the official provided close-range photos are utilized for identification of the correct monument. After that, the geolocation of the monument in open-sources DOMs can be calculated, and the bias between the calculated location and the true location, and the DOM chips with a coverage of 1 km2 are cutted. By image matching process, ground control points from the corrected DOM chips are extracted, and tie points between raw images are matched wo build relative constraints. The geolocation accuracy of raw satellite images are improved by multi-view block adjustmant, and the LiDAR produced point clouds are utilized for the verification of the improved results.
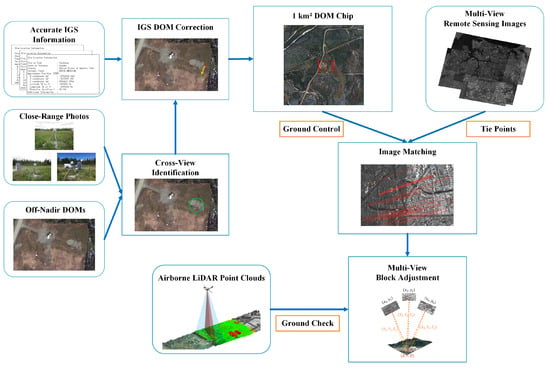
Figure 3.
The workflow of our proposed method.
The geometric bias of GEMs was firstly corrected with the extracted IGS reference data. To ensure the geolocation accuracy of the corrected DOMs, tiles with a coverage of 1 km2 are cropped as refernece data for satellite remote sensing images. After that, the IGS control information was transformed into a remote sensing view, and automatically matched points from the corrected GEM tiles were applied as GCPs. Distortions are inevitable in vendor provided images, so that a coarse-to-fine calibration model is proposed using constraints from multi-view images as well as the reference data. The proposed method provided a generic way for the extraction of high-precision global control information with lower cost, and the calibrated multi-view images can be used as for cartography and further analysis.
3.1. GCP Extraction from IGS
Figure 4 gives the main steps for GCP extraction from IGS information. At the first stage, the geolocation information of the IGS monuments is collected from the official provided log files. Then, DOM chips coveraging an area of 1 km2 are extracted from open-sources DOMs (such as Google Earth Maps, Bing Maps, and others). To accurate identify the target of the IGS monuments, close-range photos are introduced to separate the target from the surroundings. After that, the projected coordinates of the IGS monument and its true geolocation information are used for the calibration of open-source DOM chips. The calibrated DOM chips share the same plane geolocation accuracy with the IGS monuments, while the height control information are obtained from the open-sources DSM information. Based on the phase congruency (PC) based image matching method, control points can be extracted from the calirbated DOM chips.
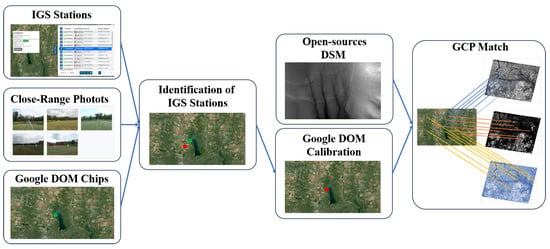
Figure 4.
Flowchart of GCP extraction from IGS information.
As shown in Figure 5, more than 500 IGS stations distributed globally provide fundamental positioning information around the world nowadays. The IGS services compose a stable, long-term network to provide powerfully supportment the geodesy and navigation. The distribution and surroundings are carefully planed to avoid discontinuities in the time-series position. Therefore, standard geolocation information of the IGS monument are suitable to be applied as ground control information in the calibration of biased satellite remote sensing images. In most cases, the footprint of the IGS monuments are considered as the selected control points because they share the same longitude and latitude coordinates with the recorded location while the height information are used as the terrain surface. Moreover, Close-range images provided officially and very high resolution GEMs are applied for accurate extraction of the geolocation information of the IGS data from a satellite view.
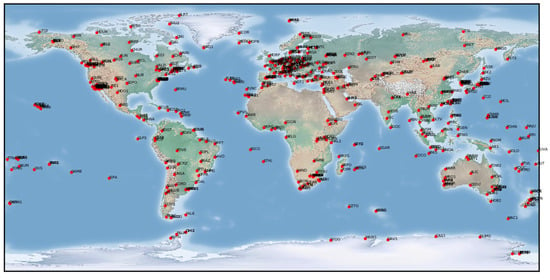
Figure 5.
Global distribution of IGS stations (copyright @ 2020 International GNSS Service).
In most cases, close-range images obtained using digital cameras or other devices can be found in the official website of IGS services from different views. The first three rows of Figure 6 give some examples of obtained photos from handheld devices. These photos provide the detailed structure as well as the surroundings of the monuments from different views. Combined with the displayed scene, we can easily identify the geolocation of these monuments in GEMs as shown in the last row of Figure 6. The red crosses in these images are the projected coordinates of the footprint of IGS monuments in GEMs, while green points are the official provided geolocation. Biases between the GEMs and the reference IGS data should be calibrated first.
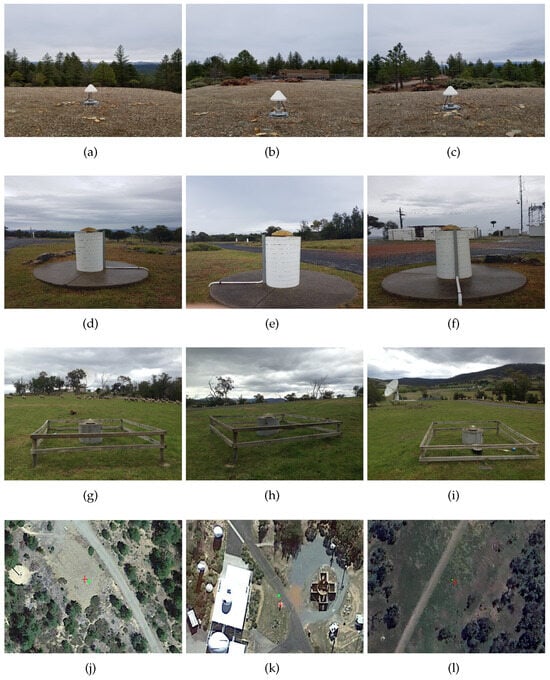
Figure 6.
Illustration of placement of different antenna monuments. (a–i) Photos of different IGS antenna monuments obtained from handheld devices in different views, respectively. (j–l) The Google Earth remote sensing images (the green points are the published coordinates of IGS antenna monuments, and the red crosses are the corresponding projected coordinates), respectively.
Given the image-space coordinate , the projected geodetic longitude and latitude can be obtained with an affine transformation model as follows:
where represent the affine transformation coefficients. L and P represent the geodetic longitude and latitude, respectively.
It is noteworthy that the GEMs are mosaic products of ortho-rectifited aerial or satellite remote sensing images. Distortions and misalignment error would decrease the internal consistency of the GEMs. Therefore, GEM chips covering an area of 1 km × 1 km without seamlines passing through are cropped and extracted as a substitute of the reference data.
Unlike the high cost of the collection of traditional GCPs or the uncertainty for most open-sourced “cloud control” data, the IGS can provide high-accuracy reference information for satellite image calibration. Figure 6 showd the established IGS antenna monuments and its surroundings. Considering the small volume of the IGS antenna monuments, the GEM chips with very high resolution can build a bridge between the IGS service and satellite images.
After calibration, the GEM chips are considered as having the same horizontal accuracy in a small coverage of 1 km × 1 km as the IGS information. GCPs are then automatically obtained by matching the GF-2 satellite images with the calibrated GEM chips. Herein, a robust template matching method, which combines radiometric-invariant features and phase correlation, is applied for automatic GCP extraction. Considering the intensity variation between the GF-2 images and GEM chips, we adopt the histogram of phase congruency (HOPC) [47,48] to construct radiometric-invariant features. Evenly distributed corner points are first detected in the GEM chips, and then matched based on the phase correlation method using the HOPC feature of a certain template, as follows:
where and represent the coordinates of a key point in the spatial domain and frequency domain, respectively. z denotes the feature dimension. and are the image shifts between GEM chips and raw satellite images. represents the fast Fourier transformation. N and E represent the phase correlation coefficient in the spatial domain and frequency domain. and represent the phase congruency feature descriptors of the GEM chips and raw GF-2 satellite images, while and are the corresponding Fourier transformations. ∗ denotes the complex conjugate and represents the exponential function. More detail can be found in our previous work [49]. Initial correspondences can be obtained by choosing the maximum result of Equation (2), which is ideally a Dirac function (also known as the pulse function). It is clear that the translation shifts between correspondences are calculated without presetting the size of the search region, which can improve the automation degree and efficiency of the proposed algorithm.
After outlier removal, the remaining matches are set as GCPs for the subsequent geometric calibration process.
3.2. Geometric Calibration Model
With the improvement of image resolution, image distortion errors contribute more to geolocation errors. Therefore, a coarse-to-fine geometric calibration model is introduced. This model is composed of two parts: a coarse calibration model and a fine calibration model. The coarse calibration model is developed based on the traditional affine transformation model, which can mostly eliminate the geolocation bias. After that, the fine calibration model is introduced for the fine calibration of geometric distortions between images. The entire model is developed based on the rational function model (RFM) due to its simplicity and accessibility. Traditionally, the RFM is defined by a ratio of two polynomials building the relationship between image-space points and ground targets as follows:
where are the third-order polynomials consisting of 80 rational polynomial coefficients. represent the normalized image points, and denote the normalized longitude, latitude and height, respectively. , , and are the coefficients of the RFM, which we call the rational polynomial coefficients (RPCs). The normalized image-space and object-space coordinates can be obtained with the provided normalization parameters as follows:
where represent the sample and line indexes in an image, and are the geodetic longitude, latitude and height. Influenced by the sensor and platform error, the derived RPCs also suffer from geolocation bias. Therefore, an affine transformation model defined in image-space is usually added for the calibration of RPCs:
where are the calibrated image-space coordinates. and are the affine transformation parameters.
Compared with the imaging swath of high-resolution remote sensing images, the number of covered IGS monuments in each image may not be greater than one in most cases. Therefore, a rigid translation model with rather than the affine transformation model is used for the bias calibration of vendor-provided RPCs. Influenced by attitude oscillation and other measurement errors, image distortions are inevitable in most remote sensing images. And the transformation model is incapable of correcting the distortion errors. Therefore, multi-view remote sensing images, usually obtained at different times, are introduced to provide constraints and model the distortion errors for better geometric performance.
The affine transformation model cannot model the distortion error accurately. Therefore, the coarse-to-fine geometric calibration model is applied to perform block adjustment based on our previous work [50]. Based on the coarse-corrected parameters with the affine transformation model and the extracted ground control points, large geolocation biases between images are mostly calibrated. After an analysis of the geolocation bias, we found that the residual error in the row direction varies a lot as a trigonometric function, while the error in the column direction is rather stable as a second-order function. To accurately model the geolocation distortion between images, tie points are used to form a fine calibration model for the misalignment decomposition and geolocation accuracy improvement. The fine calibration model is proposed as
where m is a ratio factor to define the periodic characteristics of trigonometric functions. ∼ and ∼ are the corresponding calibration parameters. Combining the tie information obtained between multi-view images and control information transformed from the IGS monuments, the coarse-to-fine calibration model can be derived as
where and are the image-space residual vectors for control information and tie information, respectively. is the coefficient matrix built with the control information, and is the coefficient matrix for the corrected image-space affine transformation parameter t, and is the designed coefficient matrix of the object-space coordinates . and are the observation vectors for control points and tie points, respectively.
4. Results
In this section, the IGSForGC datasets covering six stations in America are experimented, and the geometric calibration results of different models are compared to verify the calibration performance as well as the efficiency of the proposed method.
4.1. GCP Extraction from IGS
Usually, the open-sourced GEMs are randomly biased from the centimeter level to larger than 10 m compared with the ground truth. Therefore, the geodetic coordinates of the IGS monuments are used as control information during the production of high-precision GEM chips. The bias between the initial GEM chips and the projected IGS monuments is shown in Figure 2. With the help of close-range images, the footprint of the IGS monuments is easy to be identified from the GEM chips. After calibration, the geometric performance of these chips can reach the same accuracy with the IGS data in the central area. Due to the sparse distribution of the IGS, translation errors can be easily compensated, while distortion errors cannot be identified and calibrated.
Based on the collected LiDAR point cloud, the produced high-precision DSMs are used for the evaluation of the calibrated GEM chips. In this experiment, different GEM chips’ sizes are verified with the reference DSM. Based on our experimental results, the geolocation bias between the calibrated GEM chips and the DSM is under 1.5 pixels in a rectangular area with a side length of 1 km, which meets the requirement of a GCP. As the size increases to about 2 km, the average bias can reach 2 pixels in X and Y directions and the maximum error is larger than 4 pixels, which will introduce extra errors during calibration. Therefore, the size of GEM chips in this experiment is 1 km × 1 km. Figure 7 also gives the geolocation differences between the calibrated GEM chips and the reference DSMs. The results show that the calibrated chips are highly consistent with the high-precision DSMs in the 1 km2 area.
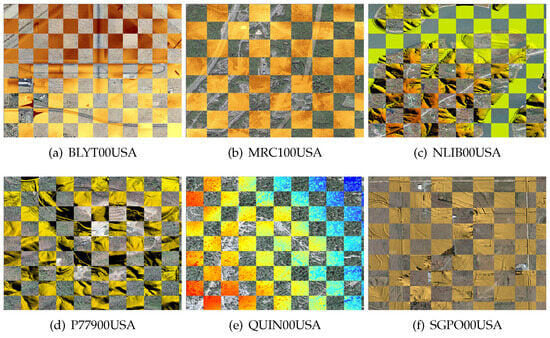
Figure 7.
Illustration of geolocation differences between the calibrated GEM chips and LiDAR-derived DSMs.
4.2. Geolocation Accuracy Improvement Evaluation
Figure 8 gives some examples of the matching results between the calibrated GEM chips and raw satellite images. To verify the plane geolocation accuracy, elevation information from the DSMs are used as the reference terrain height. To improve the geometric performance of remote sensing images, matched points extracted from the calibrated chips are considered as GCPs, while relative constraints between satellite images are built as tie information. In this experiment, the relative geolocation accuracy represents the geolocation consistency between images, and the geolocation difference between raw satellite images and the ground truth is the absolute geolocation accuracy.
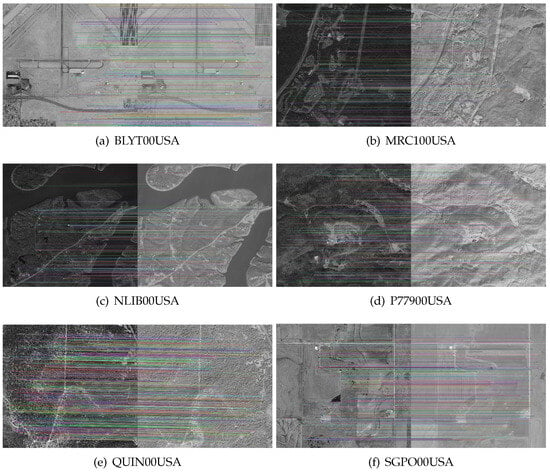
Figure 8.
Matching results between raw satellite images and the calibrated GEM chips.
Figure 9, Figure 10, Figure 11, Figure 12, Figure 13 and Figure 14 show the geolocation accuracy of each dataset. As the result indicated, the initial geolocation accuracy of the experimental dataset ranges from the sub-meter level to hundreds of meters. The various geolocation accuracies of raw images are influenced by many factors, such as the sensor calibration accuracy, attitude measurement accuracy, as well as the influence of atmospheric refraction. Without ground control information, the geolocation bias is hardly to be significantly eliminated. In contrast, the relative geolocation accuracy can be greatly improved after free block adjustment, as shown in the second sub-image in Figure 9, Figure 10, Figure 11, Figure 12, Figure 13 and Figure 14. After free calibration, the relative performance between images can converge to the pixel level.
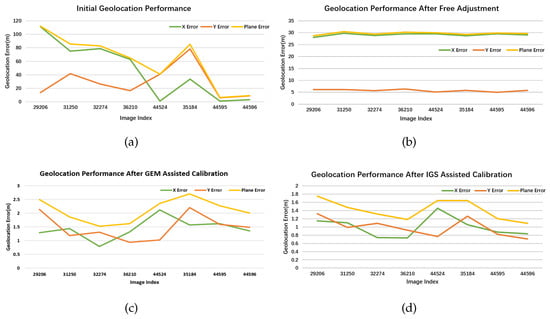
Figure 9.
The geolocation performance of the experimental datasets in the IGS stations of BLYT00USA. (a) The original geolocation accuracy of multi-view remote sensing images; (b) the geometric performance after free block adjustment; and (c,d) the corresponding performance after being processed with the GEM reference information and IGS reference information, respectively.
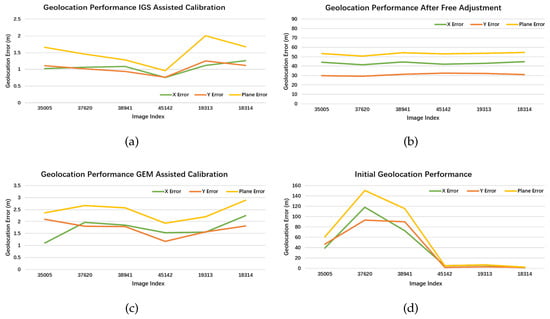
Figure 10.
The geolocation performance of the experimental datasets in the IGS stations of MRC100USA. (a) The original geolocation accuracy of multi-view remote sensing images; (b) the geometric performance after free block adjustment; and (c,d) the corresponding performance after being processed with the GEM reference information and IGS reference information, respectively.
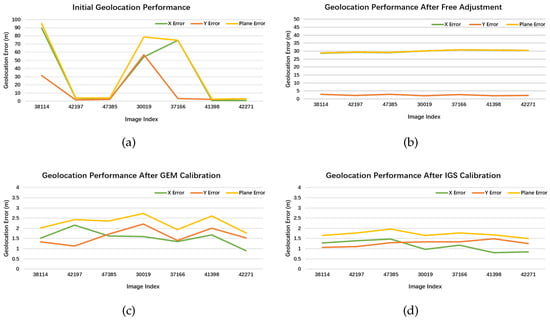
Figure 11.
The geolocation performance of the experimental datasets in the IGS stations of NLIB00USA. (a) The original geolocation accuracy of multi-view remote sensing images; (b) the geometric performance after free block adjustment; and (c,d) the corresponding performance after being processed with the GEM reference information and IGS reference information, respectively.
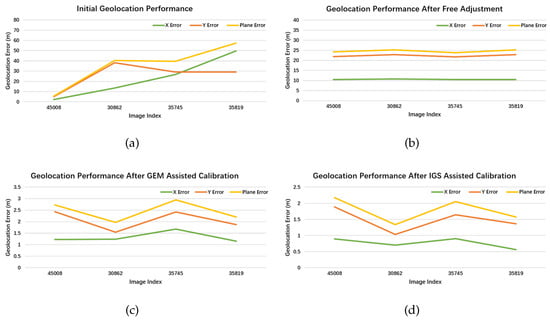
Figure 12.
The geolocation performance of the experimental datasets in the IGS stations of P77900USA. (a) The original geolocation accuracy of multi-view remote sensing images; (b) the geometric performance after free block adjustment; and (c,d) the corresponding performance after being processed with the GEM reference information and IGS reference information, respectively.
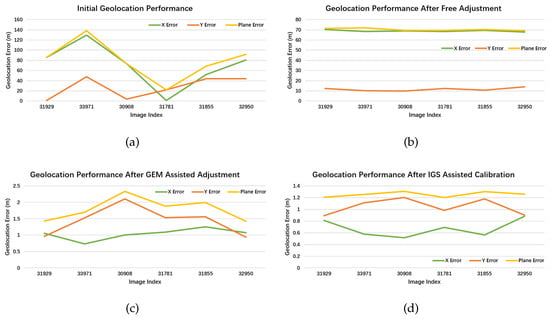
Figure 13.
The geolocation performance of the experimental datasets in the IGS stations of QUIN00USA. (a) The original geolocation accuracy of multi-view remote sensing images; (b) the geometric performance after free block adjustment; and (c,d) the corresponding performance after being processed with the GEM reference information and IGS reference information, respectively.
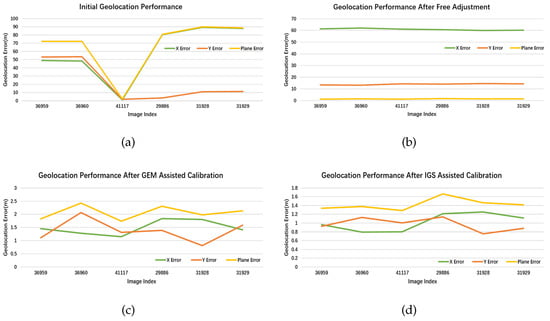
Figure 14.
The geolocation performance of the experimental datasets in the IGS stations of SGPO00USA. (a) The original geolocation accuracy of multi-view remote sensing images; (b) the geometric performance after free block adjustment; and (c,d) the corresponding performance after being processed with the GEM reference information and IGS reference information, respectively.
The instability in the absolute geolocation accuracy of free calibration results greatly restricts the applications of these images. The collection of GCPs requires a significant amount of manpower and resources, while the performance of open-sourced geospatial information is of high uncertainty. Instead, the IGS information widely applied in navigation and mapping shows much higher accuracy. Therefore, the geolocation information of the calibrated GEM chips based on the IGS information is considered as GCPs. As previously mentioned, high-resolution GEM chips are firstly calibrated based on the geolocation of IGS information so that the geometric performance of the GEM-assisted geometric calibration results are compared with the proposed IGS-assisted model. As the results in Figure 9, Figure 10, Figure 11, Figure 12, Figure 13 and Figure 14 show, the geolocation accuracy of the calibrated images with ground control information from the IGS stations is about 1 m in both X and Y directions. Table 3 also gives the root mean square error (RMSE) of absolute geolocation accuracy in each dataset. The performance of the traditional calibration models using GEM chips is usually over 2 m. And the geolocation error will exceed about 2.5 m, especially for the test datasets in mountainous areas. In contrast, the introduced IGS information can obviously prompt the absolute geometric performance of all experimental datasets. With the assistance of IGS-produced GCPs, the geolocation accuracy of all tested images is improved by about 30% in total.

Table 3.
Absolute geometric accuracy of tested remote sensing images in each dataset before and after geometric calibration (GC is the abbreviation of geometric calibration, X and Y denote the geolocation in the direction of longitude and latitude, and P is the plane error).
5. Conclusions
To find a global network that can provide high-accuracy ground control information as well as uniform distribution, this paper investigated the IGS-assisted geometric calibration for raw satellite images. With the assistance of open-sourced high-resolution GEMs, the IGS information can be transferred into satellite view. Based on the published geolocation information, the IGS sites are firstly used for the correction of open-sourced GEMs. After that, ground control information from the IGS and restraints between multi-view raw remote sensing images are combined together to improve the geometric performance of raw images. Compared with results obtained directly using the uncorrected GEMs, the introduction of IGS information can improve the geolocation accuracy by about 30%, thereby guaranteeing robustness performance across remote sensing data from various sources.
Author Contributions
Conceptualization, F.W. and N.J.; methodology, F.W. and G.Z.; software, N.J. and Y.X.; validation, N.J., Y.X. and H.Y.; formal analysis, H.Y.; investigation, F.W. and G.Z.; resources, G.Z.; data curation, N.J. All authors have read and agreed to the published version of the manuscript.
Funding
This research was funded by Future Star Foundation of Aerospace Information Research Institute, Chinese Academy of Sciences under grant number E3Z10801.
Data Availability Statement
The data presented in this study are available on request from the corresponding author. The data are not publicly available due to confidentiality.
Conflicts of Interest
The authors declare no conflicts of interest.
References
- AbdelRahman, M.A. An overview of land degradation, desertification and sustainable land management using GIS and remote sensing applications. Rend. Lincei. Sci. Fis. Nat. 2023, 34, 767–808. [Google Scholar] [CrossRef]
- Xiao, J.; Aggarwal, A.K.; Duc, N.H.; Arya, A.; Rage, U.K.; Avtar, R. A review of remote sensing image spatiotemporal fusion: Challenges, applications and recent trends. Remote Sens. Appl. Soc. Environ. 2023, 32, 101005. [Google Scholar] [CrossRef]
- Tadono, T.; Shimada, M.; Watanabe, M.; Hashimoto, T.; Iwata, T. Calibration and validation of PRISM onboard ALOS. Int. Arch. Photogramm. Remote Sens. Spat. Inf. Sci. 2004, 35, 13–18. [Google Scholar]
- Joshi, A.; Pradhan, B.; Gite, S.; Chakraborty, S. Remote-sensing data and deep-learning techniques in crop mapping and yield prediction: A systematic review. Remote Sens. 2023, 15, 2014. [Google Scholar] [CrossRef]
- Zhang, Z.; Tao, P. An overview on “cloud control” photogrammetry in big data era. Acta Geod. Cartogr. Sin. 2017, 46, 1238. [Google Scholar]
- Li, B.; Ge, H.; Bu, Y.; Zheng, Y.; Yuan, L. Comprehensive assessment of real-time precise products from IGS analysis centers. Satell. Navig. 2022, 3, 12. [Google Scholar] [CrossRef]
- Wang, M.; Tian, Y.; Cheng, Y. Development of on-orbit geometric calibration for high resolution optical remote sensing satellite. Geomat. Inf. Sci. Wuhan Univ. 2017, 42, 1580–1588. [Google Scholar]
- Merchanta, D.; Schenka, A.; Habibb, A.; Yoona, T. USGS/OSU progress with digital camera in situ calibration methods. In Proceedings of the Post-Launch Calibration of Satellite Sensors: Proceedings of the International Workshop on Radiometric and Geometric Calibration, Gulfport, MI, USA, 2–5 December 2003; p. 77. [Google Scholar]
- Michael, C. 10 Years ifp Test Site Vaihingen/Enz: An Independent Performance Study. Photogramm. Week 2005, 5, 79–92. [Google Scholar]
- Breton, E.; Bouillon, A.; Gachet, R.; Delussy, F. Pre-flight and in-flight geometric calibration of SPOT5 HRG and HRS images. Int. Arch. Photogramm. Remote Sens. Spat. Inf. Sci. 2002, 34, 20–25. [Google Scholar]
- Bresnahan, P.C. Geolacation Accuracy Re-Evalution of GeoEye-1 and QuickBird-2. In Proceedings of the JACIE Workshop, New York, NY, USA, 2012. [Google Scholar]
- Zhang, Y. Design and Implenmentation of Songshan Test Field for High Resolution Remote Sensing and Mapping. J. Geomat. Sci. Technol. 2012, 29, 79–82. [Google Scholar]
- Li, C.; Ma, L.; Tang, L.; Gao, C.; Qian, Y.; Wang, N.; Wang, X. A comprehensive calibration site for high resolution remote sensors dedicated to quantitative remote sensing and its applications. Natl. Remote Sens. Bull. 2021, 25, 198–219. [Google Scholar]
- Gachet, R. SPOT5 In-flight Commission: Inner Orientation of HRG and HRS Instruments. Int. Arch. Photogramm. Remote Sens. Spat. Inf. Sci. 2004, 35, 535–539. [Google Scholar]
- Grodecki, J.; Lutes, J. IKONOS geometric calibrations. In Proceedings of the ASPRS 2005 Annual Conference, Baltimore, MD, USA, 7–11 March 2005; pp. 7–11. [Google Scholar]
- Cao, J.; Yuan, X.; Fang, Y.; Gong, J. Geometric calibration of Ziyuan-3 three-line cameras using ground control lines. Photogramm. Eng. Remote Sens. 2016, 82, 893–902. [Google Scholar] [CrossRef]
- Zhang, Y.; Wang, T.; Zheng, T.; Zhang, Y.; Li, L.; Yu, Y.; Li, L. On-Orbit Geometric Calibration and Performance Validation of the GaoFen-14 Stereo Mapping Satellite. Remote Sens. 2023, 15, 4256. [Google Scholar] [CrossRef]
- Lu, X.; Wang, J.; Yang, X.; Lyu, Y.; Hu, Y.; Cao, B.; Zhou, J. On-orbit Geometric Calibration and Preliminary Accuracy Evaluation of GF-14 Satellite. J. Geod. Geoinf. Sci. 2023, 6, 62. [Google Scholar]
- Wang, J.; Ge, Y.; Heuvelink, G.B.; Zhou, C.; Brus, D. Effect of the sampling design of ground control points on the geometric correction of remotely sensed imagery. Int. J. Appl. Earth Obs. Geoinf. 2012, 18, 91–100. [Google Scholar] [CrossRef]
- Tawfeik, H.M.; Hamza, E.; Shawky, A. Determination of suitable requirements for geometric correction of remote sensing satellite images when using ground control points. Int. Res. J. Eng. Technol. 2016, 3, 54–62. [Google Scholar]
- Sanz-Ablanedo, E.; Chandler, J.H.; Rodríguez-Pérez, J.R.; Ordóñez, C. Accuracy of unmanned aerial vehicle (UAV) and SfM photogrammetry survey as a function of the number and location of ground control points used. Remote Sens. 2018, 10, 1606. [Google Scholar] [CrossRef]
- Agüera-Vega, F.; Carvajal-Ramírez, F.; Martínez-Carricondo, P. Assessment of photogrammetric mapping accuracy based on variation ground control points number using unmanned aerial vehicle. Measurement 2017, 98, 221–227. [Google Scholar] [CrossRef]
- Szypuła, B. Accuracy of UAV-based DEMs without ground control points. GeoInformatica 2024, 28, 1–28. [Google Scholar] [CrossRef]
- Zhou, P.; Tang, X.; Wang, Z.; Cao, N.; Wang, X. Vertical accuracy effect verification for satellite imagery with different GCPs. IEEE Geosci. Remote Sens. Lett. 2017, 14, 1268–1272. [Google Scholar] [CrossRef]
- Yilmaz, H.; Yakar, M.; Mutluoglu, O.; Yildiz, F. Selection of the most suitable sizes of ground control points in the satellite images. In Proceedings of the ISPRS Congress Istanbul. Citeseer, Istanbul, Turkey, 12–23 July 2004; Volume 12, p. 13. [Google Scholar]
- Ulvi, A. The effect of the distribution and numbers of ground control points on the precision of producing orthophoto maps with an unmanned aerial vehicle. J. Asian Archit. Build. Eng. 2021, 20, 806–817. [Google Scholar] [CrossRef]
- Zhang, Y.; Lu, Y.; Wang, L.; Huang, X. A New Approach on Optimization of the Rational Function Model of High-Resolution Satellite Imagery. IEEE Trans. Geosci. Remote Sens. 2012, 50, 2758–2764. [Google Scholar] [CrossRef]
- Pi, Y.; Li, X.; Yang, B. Global iterative geometric calibration of a linear optical satellite based on sparse GCPs. IEEE Trans. Geosci. Remote Sens. 2019, 58, 436–446. [Google Scholar] [CrossRef]
- Jiao, N.; Wang, F.; You, H.; Liu, J.; Qiu, X. A generic framework for improving the geopositioning accuracy of multi-source optical and SAR imagery. ISPRS J. Photogramm. Remote Sens. 2020, 169, 377–388. [Google Scholar] [CrossRef]
- Zhou, S.; Pan, H.; Huang, T.; Zhou, P. High Accuracy Georeferencing of GF-6 Wide Field of View Scenes Toward Analysis Ready Data. IEEE Trans. Geosci. Remote Sens. 2023, 61, 1–12. [Google Scholar] [CrossRef]
- Zhang, Y.; Li, H.; Yu, J.; Tao, P. Georeferencing of Satellite Images with Geocoded Image Features. ISPRS Ann. Photogramm. Remote Sens. Spat. Inf. Sci. 2024, 10, 313–319. [Google Scholar] [CrossRef]
- Aguilar, M.A.; Nemmaoui, A.; Aguilar, F.J.; Novelli, A.; Garcia Lorca, A. Improving georeferencing accuracy of Very High Resolution satellite imagery using freely available ancillary data at global coverage. Int. J. Digit. Earth 2017, 10, 1055–1069. [Google Scholar] [CrossRef]
- Liu, X.; Zhang, Z.; Peterson, J.; Chandra, S. LiDAR-derived high quality ground control information and DEM for image orthorectification. GeoInformatica 2007, 11, 37–53. [Google Scholar] [CrossRef]
- Qiu, C.; Schmitt, M.; Zhu, X.X. Towards automatic SAR-optical stereogrammetry over urban areas using very high resolution imagery. ISPRS J. Photogramm. Remote Sens. 2018, 138, 218–231. [Google Scholar] [CrossRef]
- Jiang, Y.H.; Wei, S.; Xu, M.; Zhang, G.; Wang, J.Y. Combined adjustment pipeline for improved global geopositioning accuracy of optical satellite imagery with the aid of SAR and GLAS. IEEE JOurnal Sel. Top. Appl. Earth Obs. Remote Sens. 2022, 15, 5076–5085. [Google Scholar] [CrossRef]
- Marsetič, A.; Pehani, P. Towards sub-pixel automatic geometric corrections of very-high resolution panchromatic satellite data of urban areas. Remote Sens. 2019, 11, 1097. [Google Scholar] [CrossRef]
- Özcihan, B.; Özlü, L.D.; Karakap, M.İ.; Sürmeli, H.; Algancı, U.; Sertel, E. A comprehensive analysis of different geometric correction methods for the Pleiades-1A and Spot-6 satellite images. Int. J. Eng. Geosci. 2023, 8, 146–153. [Google Scholar] [CrossRef]
- Potere, D. Horizontal positional accuracy of Google Earth’s high-resolution imagery archive. Sensors 2008, 8, 7973–7981. [Google Scholar] [CrossRef]
- Helbich, M.; Amelunxen, C.; Neis, P.; Zipf, A. Comparative spatial analysis of positional accuracy of OpenStreetMap and proprietary geodata. Proc. Gi_Forum 2012, 4, 24. [Google Scholar]
- Brovelli, M.A.; Zamboni, G. A new method for the assessment of spatial accuracy and completeness of OpenStreetMap building footprints. ISPRS Int. J. Geo-Inf. 2018, 7, 289. [Google Scholar] [CrossRef]
- Chandelier, L.; Coeurdevey, L.; Bosch, S.; Favé, P.; Gachet, R.; Orsoni, A.; Tilak, T.; Barot, A. A worldwide 3D GCP database inherited from 20 years of massive multi-satellite observations. ISPRS Ann. Photogramm. Remote Sens. Spat. Inf. Sci. 2020, 2, 15–23. [Google Scholar] [CrossRef]
- Mukul, M.; Srivastava, V.; Mukul, M. Analysis of the accuracy of shuttle radar topography mission (SRTM) height models using international global navigation satellite system service (IGS) network. J. Earth Syst. Sci. 2015, 124, 1343–1357. [Google Scholar] [CrossRef]
- Ren, X.; Chen, J.; Li, X.; Zhang, X.; Freeshah, M. Performance evaluation of real-time global ionospheric maps provided by different IGS analysis centers. GPS Solut. 2019, 23, 113. [Google Scholar] [CrossRef]
- Wang, X.; Wang, F. The Precision of Google Earth Map Analysis With the Coordinates of IGS Stations. Int. Arch. Photogramm. Remote Sens. Spat. Inf. Sci. 2020, 42, 1053–1056. [Google Scholar] [CrossRef]
- Zhang, M.; Huang, H.; Li, Z.; Hackman, K.O.; Liu, C. Automatic high-resolution land cover production in madagascar using sentinel-2 time series, tile-based image classification and google earth engine. Remote Sens. 2020, 12, 3663. [Google Scholar] [CrossRef]
- Fu, Q.; Tong, X.; Liu, S.; Ye, Z.; Jin, Y.; Wang, H.; Hong, Z. GPU-accelerated PCG method for the block adjustment of large-scale high-resolution optical satellite imagery without GCPs. Photogramm. Eng. Remote Sens. 2023, 89, 211–220. [Google Scholar] [CrossRef]
- Ye, Y.; Shan, J.; Bruzzone, L.; Shen, L. Robust Registration of Multimodal Remote Sensing Images Based on Structural Similarity. IEEE Trans. Geosci. Remote Sens. 2017, 55, 2941–2958. [Google Scholar] [CrossRef]
- Xiang, Y.; Tao, R.; Wan, L.; Wang, F.; You, H. OS-PC: Combining Feature Representation and 3-D Phase Correlation for Subpixel Optical and SAR Image Registration. IEEE Trans. Geosci. Remote Sens. 2020, 58, 6451–6466. [Google Scholar] [CrossRef]
- Xiang, Y.; Tao, R.; Wang, F.; You, H.; Han, B. Automatic Registration of Optical and SAR Images Via Improved Phase Congruency Model. IEEE J. Sel. Top. Appl. Earth Obs. Remote Sens. 2020, 13, 5847–5861. [Google Scholar] [CrossRef]
- Jiao, N.; Wang, F.; Xiang, Y.; Wang, L.; You, H. A Coarse-to-Fine Geometric Calibration Framework of RPCS for Remote Sensing Images. In Proceedings of the IGARSS 2023—2023 IEEE International Geoscience and Remote Sensing Symposium, Pasadena, CA, USA, 16–21 July 2023; pp. 6350–6353. [Google Scholar] [CrossRef]
Disclaimer/Publisher’s Note: The statements, opinions and data contained in all publications are solely those of the individual author(s) and contributor(s) and not of MDPI and/or the editor(s). MDPI and/or the editor(s) disclaim responsibility for any injury to people or property resulting from any ideas, methods, instructions or products referred to in the content. |
© 2024 by the authors. Licensee MDPI, Basel, Switzerland. This article is an open access article distributed under the terms and conditions of the Creative Commons Attribution (CC BY) license (https://creativecommons.org/licenses/by/4.0/).