Article

Response of Upper Ocean to Parameterized Schemes of Wave Breaking under Typhoon Condition

1
College of Meteorology and Oceanography, National University of Defense and Technology, Changsha 410073, China
2
School of Hydraulic and Environmental Engineering, Changsha University of Science & Technology, Changsha 410114, China
3
Key Laboratory of Water-Sediment Sciences and Water Disaster Prevention of Hunan Province, Changsha 410114, China
*
Author to whom correspondence should be addressed.
Remote Sens. 2024, 16(18), 3524; https://doi.org/10.3390/rs16183524
Submission received: 25 July 2024 / Revised: 7 September 2024 / Accepted: 11 September 2024 / Published: 23 September 2024

Abstract

:
The study of upper ocean mixing processes, including their dynamics and thermodynamics, has been a primary focus for oceanographers and meteorologists. Wave breaking in deep water is believed to play a significant role in these processes, affecting air–sea interactions and contributing to the energy dissipation of surface waves. This, in turn, enhances the transfer of gas, heat, and mass at the ocean surface. In this paper, we use the FVCOM-SWAVE coupled wave and current model, which is based on the MY-2.5 turbulent closure model, to examine the response of upper ocean turbulent kinetic energy (TKE) and temperature to various wave breaking parametric schemes. We propose a new parametric scheme for wave breaking energy at the sea surface, which is based on the correlation between breaking wave parameter R B and whitecap coverage. The impact of this new wave breaking parametric scheme on the upper ocean under typhoon conditions is analyzed by comparing it with the original parametric scheme that is primarily influenced by wave age. The wave field simulated by SWAVE was verified using Jason-3 satellite altimeter data, confirming the effectiveness of the simulation. The simulation results for upper ocean temperature were also validated using OISST data and Argo float observational data. Our findings indicate that, under the influence of Typhoon Nanmadol, both parametric schemes can transfer the energy of sea surface wave breaking into the seawater. The new wave breaking parameter R B scheme effectively enhances turbulent mixing at the ocean surface, leading to a decrease in sea surface temperature (SST) and an increase in mixed layer depth (MLD). This further improves upon the issue of uneven mixing of seawater at the air–sea interface in the MY-2.5 turbulent closure model. However, it is important to note that wave breaking under typhoon conditions is only one aspect of wave impact on ocean disturbances. Therefore, further research is needed to fully understand the impact of waves on upper ocean mixing, including the consideration of other wave mechanisms.

1. Introduction

In recent years, as research on the coupling of physical processes between the upper ocean and the lower atmosphere has deepened, wave motion studies have garnered unprecedented attention. This focus is not on the wave phenomenon itself but rather on waves’ influence on other oceanic dynamic processes. Predominant mechanisms through which ocean wave motion induces upper ocean mixing include turbulent mixing triggered by wave radiation stress, turbulent mixing resulting from wave breaking, and Langmuir circulation mixing, which forms due to interaction between Stokes drift and wind-driven shear flow [1,2,3]. Building on prior work, this paper examines the impact of turbulent mixing induced by wave breaking on upper ocean temperature simulations.
Wave breaking, often manifesting as whitecaps, is a prevalent physical phenomenon in the ocean. Wave breaking denotes the collapse of a wave front when it reaches a critical state and can no longer maintain stability. This phenomenon occurs across a multi-scale range and exhibits strong nonlinear characteristics. Consequently, this physical phenomenon is parameterized within wave models [4]. Wave breaking constrains wave heights at the sea surface, facilitating the transfer of mass, momentum, and heat between the atmosphere and the ocean. It plays a crucial role in upper ocean dynamics and air–sea interactions, and is regarded as the predominant mechanism for wave energy dissipation [5]. However, there are still some differences in the comparison between numerical simulation and measured results that require further investigation.
While many early numerical simulations of ocean circulation overlooked the impacts of ocean waves and wave breaking, it is now recognized that wave breaking can significantly influence model outcomes, particularly in the context of simulating sea surface temperature (SST) during intense marine conditions. Ocean circulation models are believed to overstate sea surface temperatures and underestimate the mixed layer’s depth, attributed to insufficient upper mixing due to an inadequate consideration of surface action and wave breaking [6]. Wave breaking serves as a primary source of turbulent kinetic energy (TKE), injecting wave energy into the water column. This creates a near-surface turbulent boundary layer where the injected energy is ultimately dissipated through turbulence [3,7]. Wada et al. [8] showed that under strong wind events, wave energy dissipation from wave breaking dominates the strong vertical mixing of the continental shelf. Carniel et al. [9] incorporated turbulent kinetic energy (TKE) derived from wave breaking into oceanic models by employing a universal length scale (GLS) scheme for parameterizing vertical mixing. They underscored the necessity of including wave-induced turbulence to enhance the precision of ocean surface temperature profiles. Thomson et al. [10] introduced the TKE flux caused by wave breaking into the numerical model and found that the depth of influence of wave breaking is related to the vertical reference frame. Utilizing the integrated circulation model NEMO and the wave model WAM, Alari et al. [11] incorporated the effects of wave breaking and ascertained its significant impact on sea surface temperature (SST), vertical temperature distribution, and upwelling phenomena. Breivik et al. [12], working with the NEMO circulation model, explored the implications of sea surface stress, turbulent kinetic energy (TKE) flux from wave breaking, and Stokes Coriolis stress on the mixed layer. They discerned that these three physical mechanisms substantially contribute to diminishing deviations in sea surface temperature (SST). Guan et al. [13] determined that wave breaking acts as a generator of turbulence close to the sea surface, creating an influential magnetosphere within the upper section of the mixed layer. In this region, the distribution of the turbulent dissipation rate deviates from the prescriptions of the solid wall law, with the penetrative depth of wave breaking potentially extending to five to ten times the significant wave height. Mellor and Blumberg [14] augmented the original M-Y scheme to account for wave breaking effects by refining the surface boundary conditions of the turbulent kinetic energy (TKE) equation. To examine the influence of wave breaking on the turbulent energy budget within the mixed layer, Sun et al. [15] employed a one-dimensional vertical turbulent enclosed mixing model and integrated the turbulent kinetic energy (TKE) flux produced by wave breaking by adjusting the TKE equation’s upper boundary conditions. Their findings revealed that the TKE flux stemming from wave breaking at the sea surface influences the local equilibrium among diverse turbulent energy components within the mixed layer.
Despite years of research and advancements, the impact of wave breaking on oceanic mixing remains a subject of debate. Within the upper boundary conditions of uncoupled current numerical models, wave parameterization predominantly relies on wind parameters. In coupled models, wave attributes such as wave age and wave steepness are frequently employed to characterize the wave breaking phenomenon. Toba and Koga [16] introduced a pioneering dimensionless parameter, the wind and sea Reynolds number R B . This parameter amalgamates wind and wave properties, offering, in their view, a more accurate depiction of whitecap coverage compared to isolated measures like wave age or wave steepness. Building on this, Zhao [17] employed the breaking wave parameter R B to quantify the extent of sea wave breaking and demonstrated that R B can effectively represent the overall wave breaking behavior under the action of locally balanced wind waves. Later, R B has been widely used in the air–sea boundary layer. It is used to study sea surface gasses, momentum transport [17,18], and the generation of sea droplets [19,20]. Hence, in alignment with Zhao’s pertinent studies [17,21], we advocate for the integration of the whitecap dissipation rate, calibrated using the breaking wave parameter R B , into the wave breaking energy equation. This integration would enable the wave breaking parameterization method to concurrently consider both wind field attributes and wave characteristics, thereby facilitating a comprehensive investigation into the upper ocean’s responses to various wave breaking parameterization methods.
To explore the impact of wave breaking on upper ocean temperature during extreme sea conditions, this study utilizes the FVCOM-SWAVE coupled wave and current model. The turbulent kinetic energy (TKE) flux resulting from wave breaking is calculated using the whitecap coverage rate, which is determined by the wind and sea Reynolds number. This approach differs from the original model by Craig and Banner et al. [22], which employs a wave age-dominated wave breaking parameterization method. The boundary conditions of the FVCOM ocean circulation model were modified to examine the effects of wave breaking during typhoon conditions on the TKE and temperature of the upper layer in the Western Pacific Ocean.

2. Methodology

2.1. Descriptions of the Modeling System

The FVCOM is a three-dimensional, free-surface, primitive equation model initially developed by Chen et al. [23]. It has been widely used in coastal oceans, estuaries, lagoons, and large lakes, as referenced in studies [24,25,26,27,28]. Utilizing unstructured triangular meshes and sigma coordinates for horizontal and vertical dimensions, respectively, the FVCOM effectively delineates intricate coastlines and the pronounced variability in nearshore bathymetry. The model incorporates the modified Mellor and Yamada level 2.5 scheme (MY-2.5) [29] and Smagorinsky’s [30] turbulent closure parameterizations to compute vertical and horizontal mixing processes. The model employs hydrostatic and Boussinesq approximations, wherein density variations are disregarded except in the term that is multiplied by gravity in the buoyancy force equation.
The Surface Wave Model SWAVE, a third-generation wave model [23], has been extensively utilized to elucidate wave dynamics in coastal oceans, the Great Lakes, and the Arctic Ocean, as cited in studies [31,32,33]. This model characterizes wave evolution processes in both deep and shallow waters through the solution of the wave action balance equation. The governing equation incorporates numerous factors such as wind-induced wave generation, wave propagation, three- and four-wave nonlinear interactions, whitecapping, bottom frictional dissipation, and depth-induced breaking. Frequency and directional space are discretized using the flux-corrected transport algorithm and an implicit Crank–Nicolson solver, respectively. In geographic space, an implicit second-order upwind finite-volume scheme is employed. For detailed model descriptions, refer to Qi et al. [34] and Mao et al. [32].
Driven by the wind field, the wave model SWAVE calculates the significant wave height H s , spectral peak period T p , wave direction D i r , and wavelength L of the ocean current model. Therefore, the wave model can provide a simulation wave field for FVCOM to study the impact of turbulent mixing caused by wave breaking on the ocean.

2.2. Wave Breaking Parameterization

In the FVCOM-SWAVE model of wave and current coupling, the MY-2.5 level q 2 q 2 l (where q 2 is the turbulent kinetic energy and l is the turbulent macroscale) proposed by Mellor and Yamada [35] is used. MY-2.5 is for the parameterization of vertical eddy viscosity ( K m ) and vertical thermal diffusion coefficient ( K h ). In this study, the air–sea boundary scheme of the classical MY-2.5 turbulent closure model [35] was used as the control group, and the wave breaking parameterization scheme of wave age [14] and breaking wave parameter R B was used as the experimental group.

2.2.1. Classical Boundary Layer Scheme

In the MY-2.5 model, in the boundary layer approximation, the shear generation of TKE is generated by the vertical shear of the horizontal flow near the boundary; q 2 and q 2 l of the equation of the sum can be simplified as follows [23]:
q 2 t + u q 2 x + v q 2 y + w q 2 z = 2 P s + P b ε + z K q q 2 z + F q
q 2 l t + u q 2 l x + v q 2 l y + w q 2 l z = l E 1 P s + P b W ˜ E 1 ε + z K q q 2 l z + F l
where q 2 = u 2 + v 2 + w 2 / 2 is turbulence kinetic energy (TKE); u , v , w , respectively, represent the variance of the velocity in three directions; l is the turbulence macroscopic scale; K q is the vertical eddy diffusion coefficient of turbulent kinetic energy; P s = K m u z 2 + v z 2 and P b = g K h ρ z / ρ 0 are the shear and buoyancy generation terms of TKE; K m is the vertical eddy viscosity coefficient; K h is the thermal vertical eddy diffusion coefficient; ε = q 3 / B 1 l is the turbulent kinetic energy dissipation rate, B 1 = 0.74 ; W ˜ = 1 + E 2 l 2 / κ L 2 is a wall proximity function where L 1 = æ z 1 + H + z 1 ; κ = 0.4 is the von Karman constant; H is the water depth; and æ is the free-surface elevation; z represents the water depth at which the grid point is calculated [23]. F q and F l represent local boundary forcing and the remaining four terms of each equation represent vertical diffusion, generation by vertical shear, conversion to and from potential energy, and dissipation [35].
In the classical MY-2.5 model, the surface and bottom boundary conditions of the turbulent kinetic energy (TKE) are
q 2 l = 0 ,   q 2 = B 1 2 3 u τ s 2 ,   z = ζ x , y , t
q 2 l = 0 ,   q 2 = B 1 2 3 u τ b 2 ,   z = H ( x , y )
where u τ s and u τ b are the water friction velocity associated with the water surface and the sea floor, z is the mean surface elevation, and since q 2 0 at both the surface and the bottom, l is identical to 0 at the boundary, which means that K m , K h , and K q are identical to zero at the surface. This simplification is developed by the MY-2.5 turbulent closure model for layered boundary layers near rigid surfaces, where the main equilibrium in the turbulent kinetic energy (TKE) equation is the equilibrium between local shear generation, buoyancy generation, and dissipation [35]. This hypothesis may work for atmospheric models, but not for ocean models where surface waves are present.

2.2.2. Wave Age Parameterization

Mellor and Blumberg [14], utilizing the wave age one-dimensional turbulence model of the upper ocean introduced by Craig and Banner [22], derived the wave age parameterization scheme (5). This scheme was achieved by adapting Formulas (1) and (2) to the M-Y format:
q 2 z = 2 α C B u τ s 3 K q ,   z = ζ x , y , t
where α C B is the parameter related to wave age. Based on the best fitting of the existing observational data [36], α C B can be approximated as
α C B = 15 c p u exp 0.04 c p / u 4
where c p is the phase velocity of the wave at the main frequency; u is the air friction speed u = 30 u τ s ; and β = c p / u is the wave age. The value of α C B varies significantly with the wave age [14].

2.2.3. Breaking Wave Parameter R B Parameterization

Toba et al. [18] believe that the parameter R B may be better than the wave age β or the friction speed u to study the changing behavior of the sea surface drag coefficient. R B was first proposed by Toba and Koga [16] and called the wind–sea Reynolds number. At first, R B was used as the breaking wave parameter [17] to measure the breaking degree of sea waves. Later, it was widely used in the air–sea boundary layer to study the gas and momentum transport [17,18] and the generation of sea droplets [19,20]. The specific expression is
R B = u 2 ω p ν
where u is the friction velocity, where ν = 1.5 × 10 5   m 2 / s is the air kinematic viscosity coefficient, and ω p = 2 π / T s is the circular frequency corresponding to the wind wave spectrum peak.
Wave age β , wave period T s , and wind and sea Reynolds number R B are all called wind wave parameters, and they can all describe the properties of wind waves, but which of these wind wave parameters can best describe the change in the whitecap coverage of wave breaking? In order to answer this question, Zhao [21] summarizes previous experimental observation data including wind and wave elements, drag coefficient, and wind; calculates regression correlation coefficients of whitecap coverage with wave age β , period T s , wind speed U , friction velocity u , and breaking wave parameters R B by the least square method; and gives regression formulas of correlation coefficients. Formulas (8) to (12):
  W = 4.69 × 10 3 β 1.27     r = 0.43
  W = 3.14 × 10 2 T s 1.82     r = 0.78
  W = 2.98 × 10 5 U 4.04     r = 0.79
W = 8.59 u 3.42           r = 0.80
  W = 3.88 × 10 5 R B 1.09     r = 0.88
Although wave age β has been employed to indicate the extent of wind wave development relative to local wind conditions, its correlation coefficient with whitecap coverage is a modest 0.43. Consequently, its effectiveness as a parameterization for whitecap coverage is suboptimal. The breaking wave parameter R B , as proposed by Toba and Koga [18], amalgamates the characteristics of both wind and wind-driven waves, offering a superior description of whitecap coverage and boasting the highest correlation coefficient. Hence, we advocate for the adoption of R B as the wave breaking scheme. Combined with Komen et al. [37], who summarized the contribution of wave energy dissipation, we employ a straightforward parametric method to estimate the energy dissipated due to wave breaking:
R d i s = γ ρ w g W ω p E
where R d i s denotes the turbulent kinetic energy flux caused by wave breaking in the water column per unit area, and γ is the percentage of the energy dissipated per unit whitecap in the total wave energy dissipation, generally taken as 0.1. ρ w is the sea water density, W is the whitecap coverage, ω p is the wave frequency, and E = F ( k ) d k = 1 16 H 1 / 3 2 is spectral density.
The wave breakage rate W of Zhao [21] is obtained by substituting (7) and (12) into (13) through the parametric scheme R B fitted with measured data.
R dis = 3.88 × 10 5 γ ρ w g u 2 ω p ν 1.09 ω p E
When considering the impact of wave breaking on sea surface temperature, a turbulent kinetic energy flux is generated at the sea surface. Under these circumstances, the wave breaking parameterization scheme can be incorporated into the equation used to calculate turbulent kinetic energy.
K q q 2 z z = 0 = 0.703 ρ w g u 2.18 ω p 0.09 E
The SWAVE coupled wave model is employed to replicate wave data. Moreover, the upper boundary conditions for the TKE within the general circulation model FVCOM are conveyed via online coupling. By incorporating the TKE flux induced by wave breaking, this study aims to examine the impact of wave breaking on typhoon simulations.

3. Materials and Methods

3.1. Typhoon Introduction

The experimental typhoon, Nanmadol, originated in the northwest Pacific Ocean, southeast of Kyushu Island, Japan, at 2:00 on 14 September 2022 (UTC). It attained typhoon status at 14:00 on September 15 (UTC). On the afternoon of September 16, Nanmadol underwent swift intensification, transitioning from a standard typhoon to a super typhoon. The central maximum wind speed escalated from 38 m/s to 52 m/s prior to its west–northward movement. On the afternoon of September 18, Typhoon Nanmadol reached the coast of Shinjuku City, Kyushu Island, Japan. Post-landfall, its strength diminished, and it veered towards the northeast. At 8:00 on September 20 (UTC), Typhoon Nanmadol transitioned to an extratropical system over northern Honshu, Japan. Figure 1’s circles depict the typhoon’s position every six hours. Nanmadol generated significant wind and wave activity in the East China Sea and led to severe damage in Japan.

3.2. Model Setup

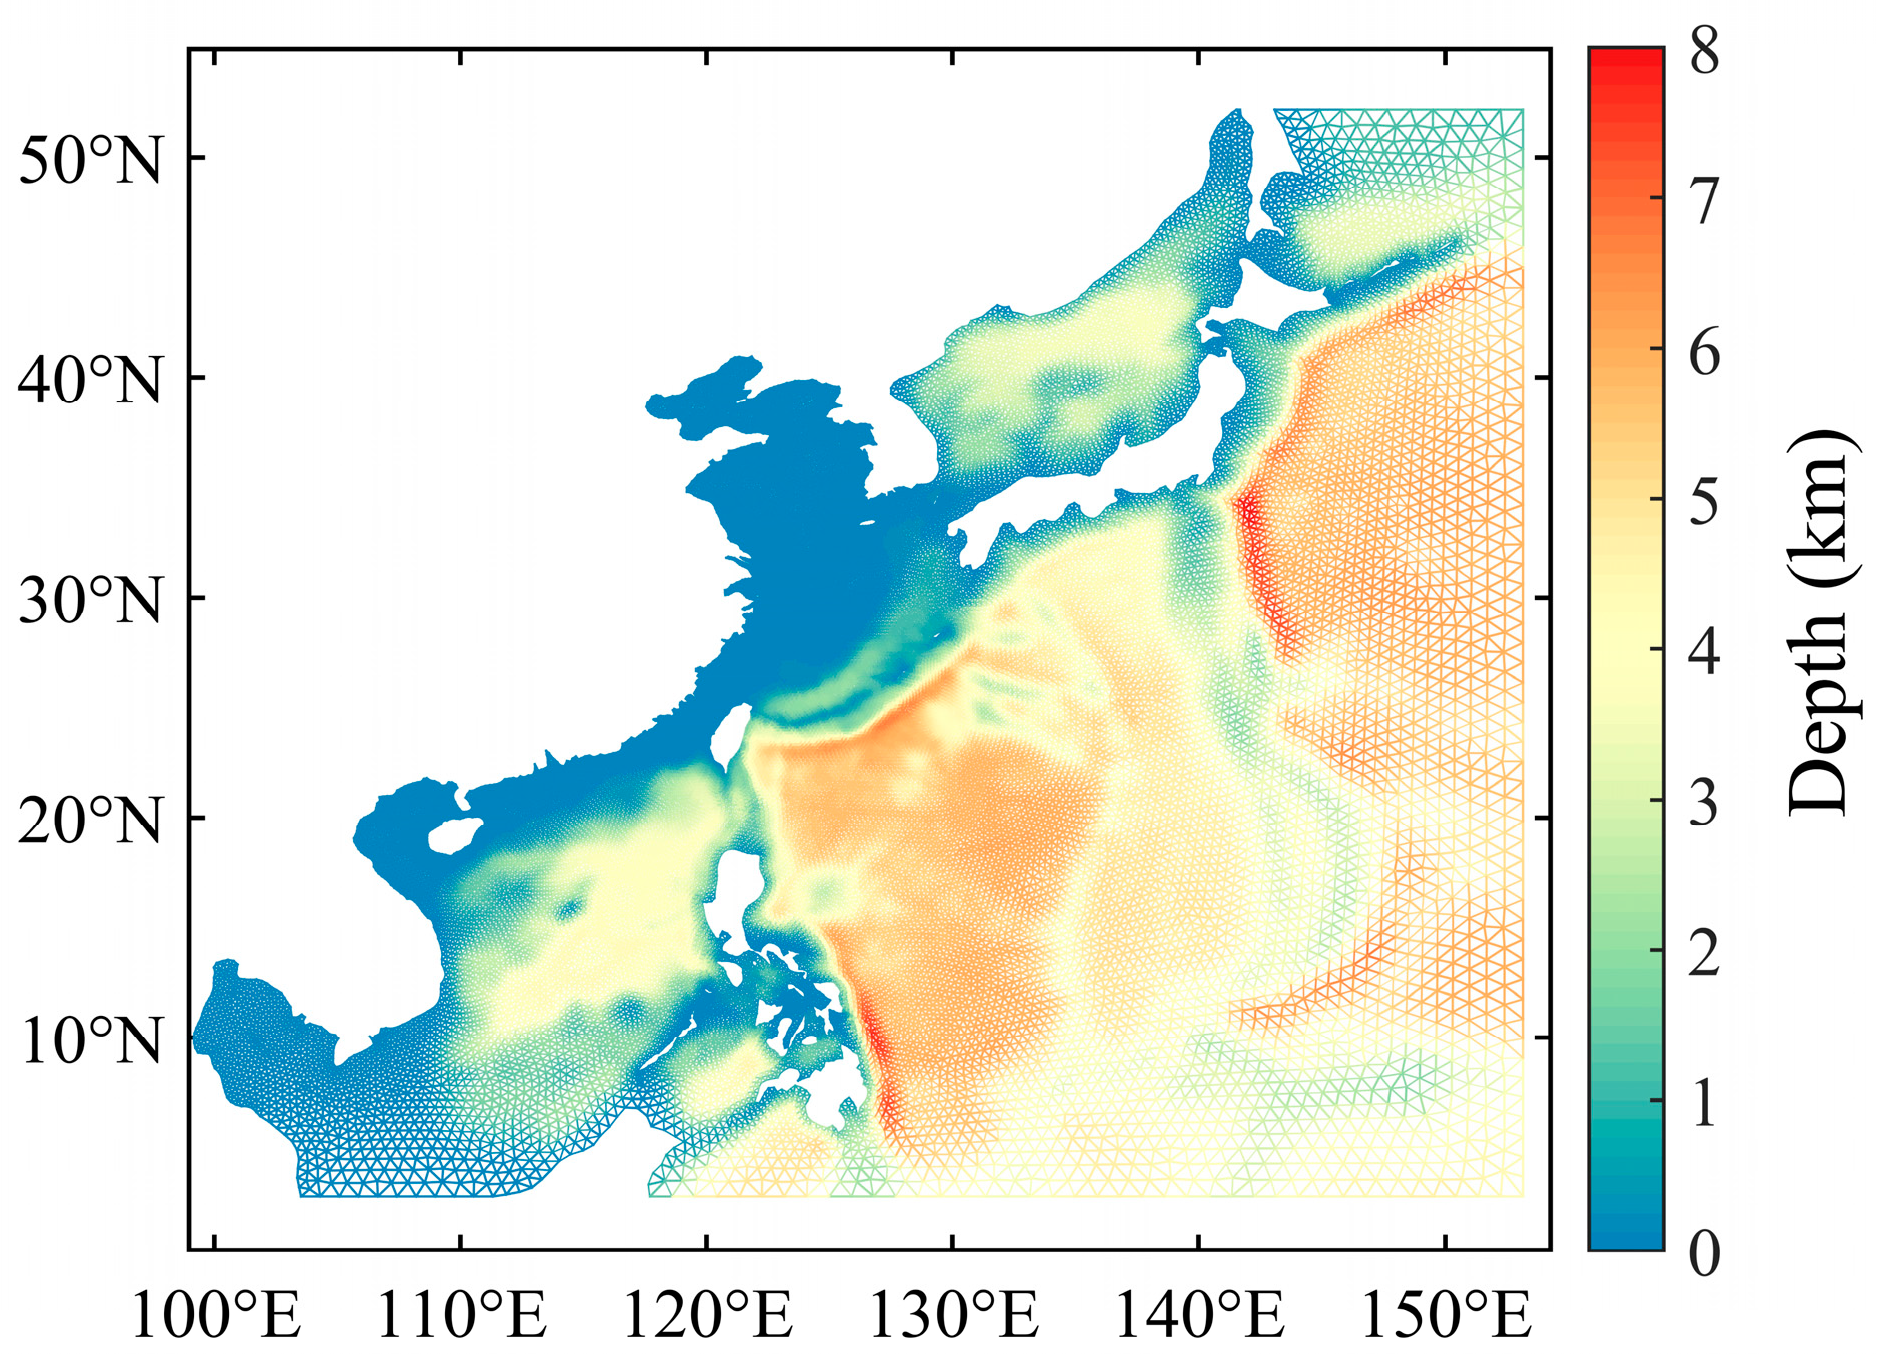
The model domain covers offshore China and the Western Pacific Ocean (100°E–155°E, 3°N–55°N) with an average horizontal resolution of 0.1° and vertical resolution of 55 layers, encrypted in water depths of 100 m. The unstructured triangular mesh has 26073 mesh points and 50244 mesh elements. The bathymetric data come from ETOPO1 data (Figure 2). Using NAO.99b tide inversion software (https://www.miz.nao.ac.jp/staffs/nao99/index_En.html, accessed on 1 June 2024), the tidal drives at the most open boundary of the eight tidal components (M2, S2, K1, O1, N2, K2, P1, Q1) are calculated. Atmospheric forcing is applied in the form of a global formula, the wind (10 m), sea level pressure, and short-wave and long-wave radiation by hour ERA—5 mesoscale reanalysis dataset (https://cds.climate.copernicus.eu/#!/home, accessed on 1 June 2024) drives; the ERA—5 reanalysis dataset is the most commonly used data source in marine science [38,39]. The model was initialized on 14 September 2022, at 00:00 UTC using the Global HYCOM (hybrid coordinate ocean model) ocean data (https://www.hycom.org/, accessed on 1 June 2024) in its initial state of 1/12 degrees. We obtained a stable state of the ocean before the 15 September analysis. The typhoon path data were from the China Meteorological Administration (CMA) tropical cyclone data center (https://tcdata.typhoon.org.cn/zjljsjj.html, accessed on 1 June 2024) every 6 h for a path point (Figure 1).
Our research focuses on the upper ocean’s response to the wave breaking parameterization scheme during the period from Typhoon Nanmadol formation to its initial landfall in Japan in the Western Pacific Ocean. Utilizing the Jason-3 satellite altimeter (https://www.aviso.altimetry.fr/en/home.html, accessed on 1 June 2024), we verified the wave height and confirmed that the SWAVE wave model can generate an accurate and efficient wave field. The Daily Optimal Interpolation Sea Surface Temperature (OISST) incorporates data from various platforms, including satellites, ships, and Argo floats, as well as Argo observations (https://www.ncei.noaa.gov/products/optimum-interpolation-sst, accessed on 1 June 2024). These data sources were juxtaposed with the simulated upper ocean temperatures, and the vertical profile data (https://argo.ucsd.edu/, accessed on 1 June 2024) were used for comparison.

4. Results and Discussion

4.1. Wave Simulation Result

Typhoon Nanmadol generated significant waves, as depicted in Figure 3. This figure illustrates four key stages of the significant wave height (SWH) and influence range on the ocean surface, resulting from the intense wind field of Typhoon Nanmadol. On September 16, Nanmadol neared its development into a strong typhoon (Figure 3a). At this stage, the central wind speed reached approximately 38 m/s, generating wave heights of around 6.6 m on the right side of its track. Between September 17 and September 18 (Figure 3b,c), Nanmadol evolved further into a super typhoon. Its maximum central wind speed hit 62 m/s, producing waves ranging from 12 m to a peak of 13.4 m in the Western Pacific. This significantly broadened its impact area, encompassing the entire East China Sea. On September 19, prior to Nanmadol landfall, its structural characteristics underwent alteration [40]. The typhoon diminished in strength before making landfall in southern Japan with a robust wind speed of 40 m/s, resulting in substantial waves of approximately 10 m.
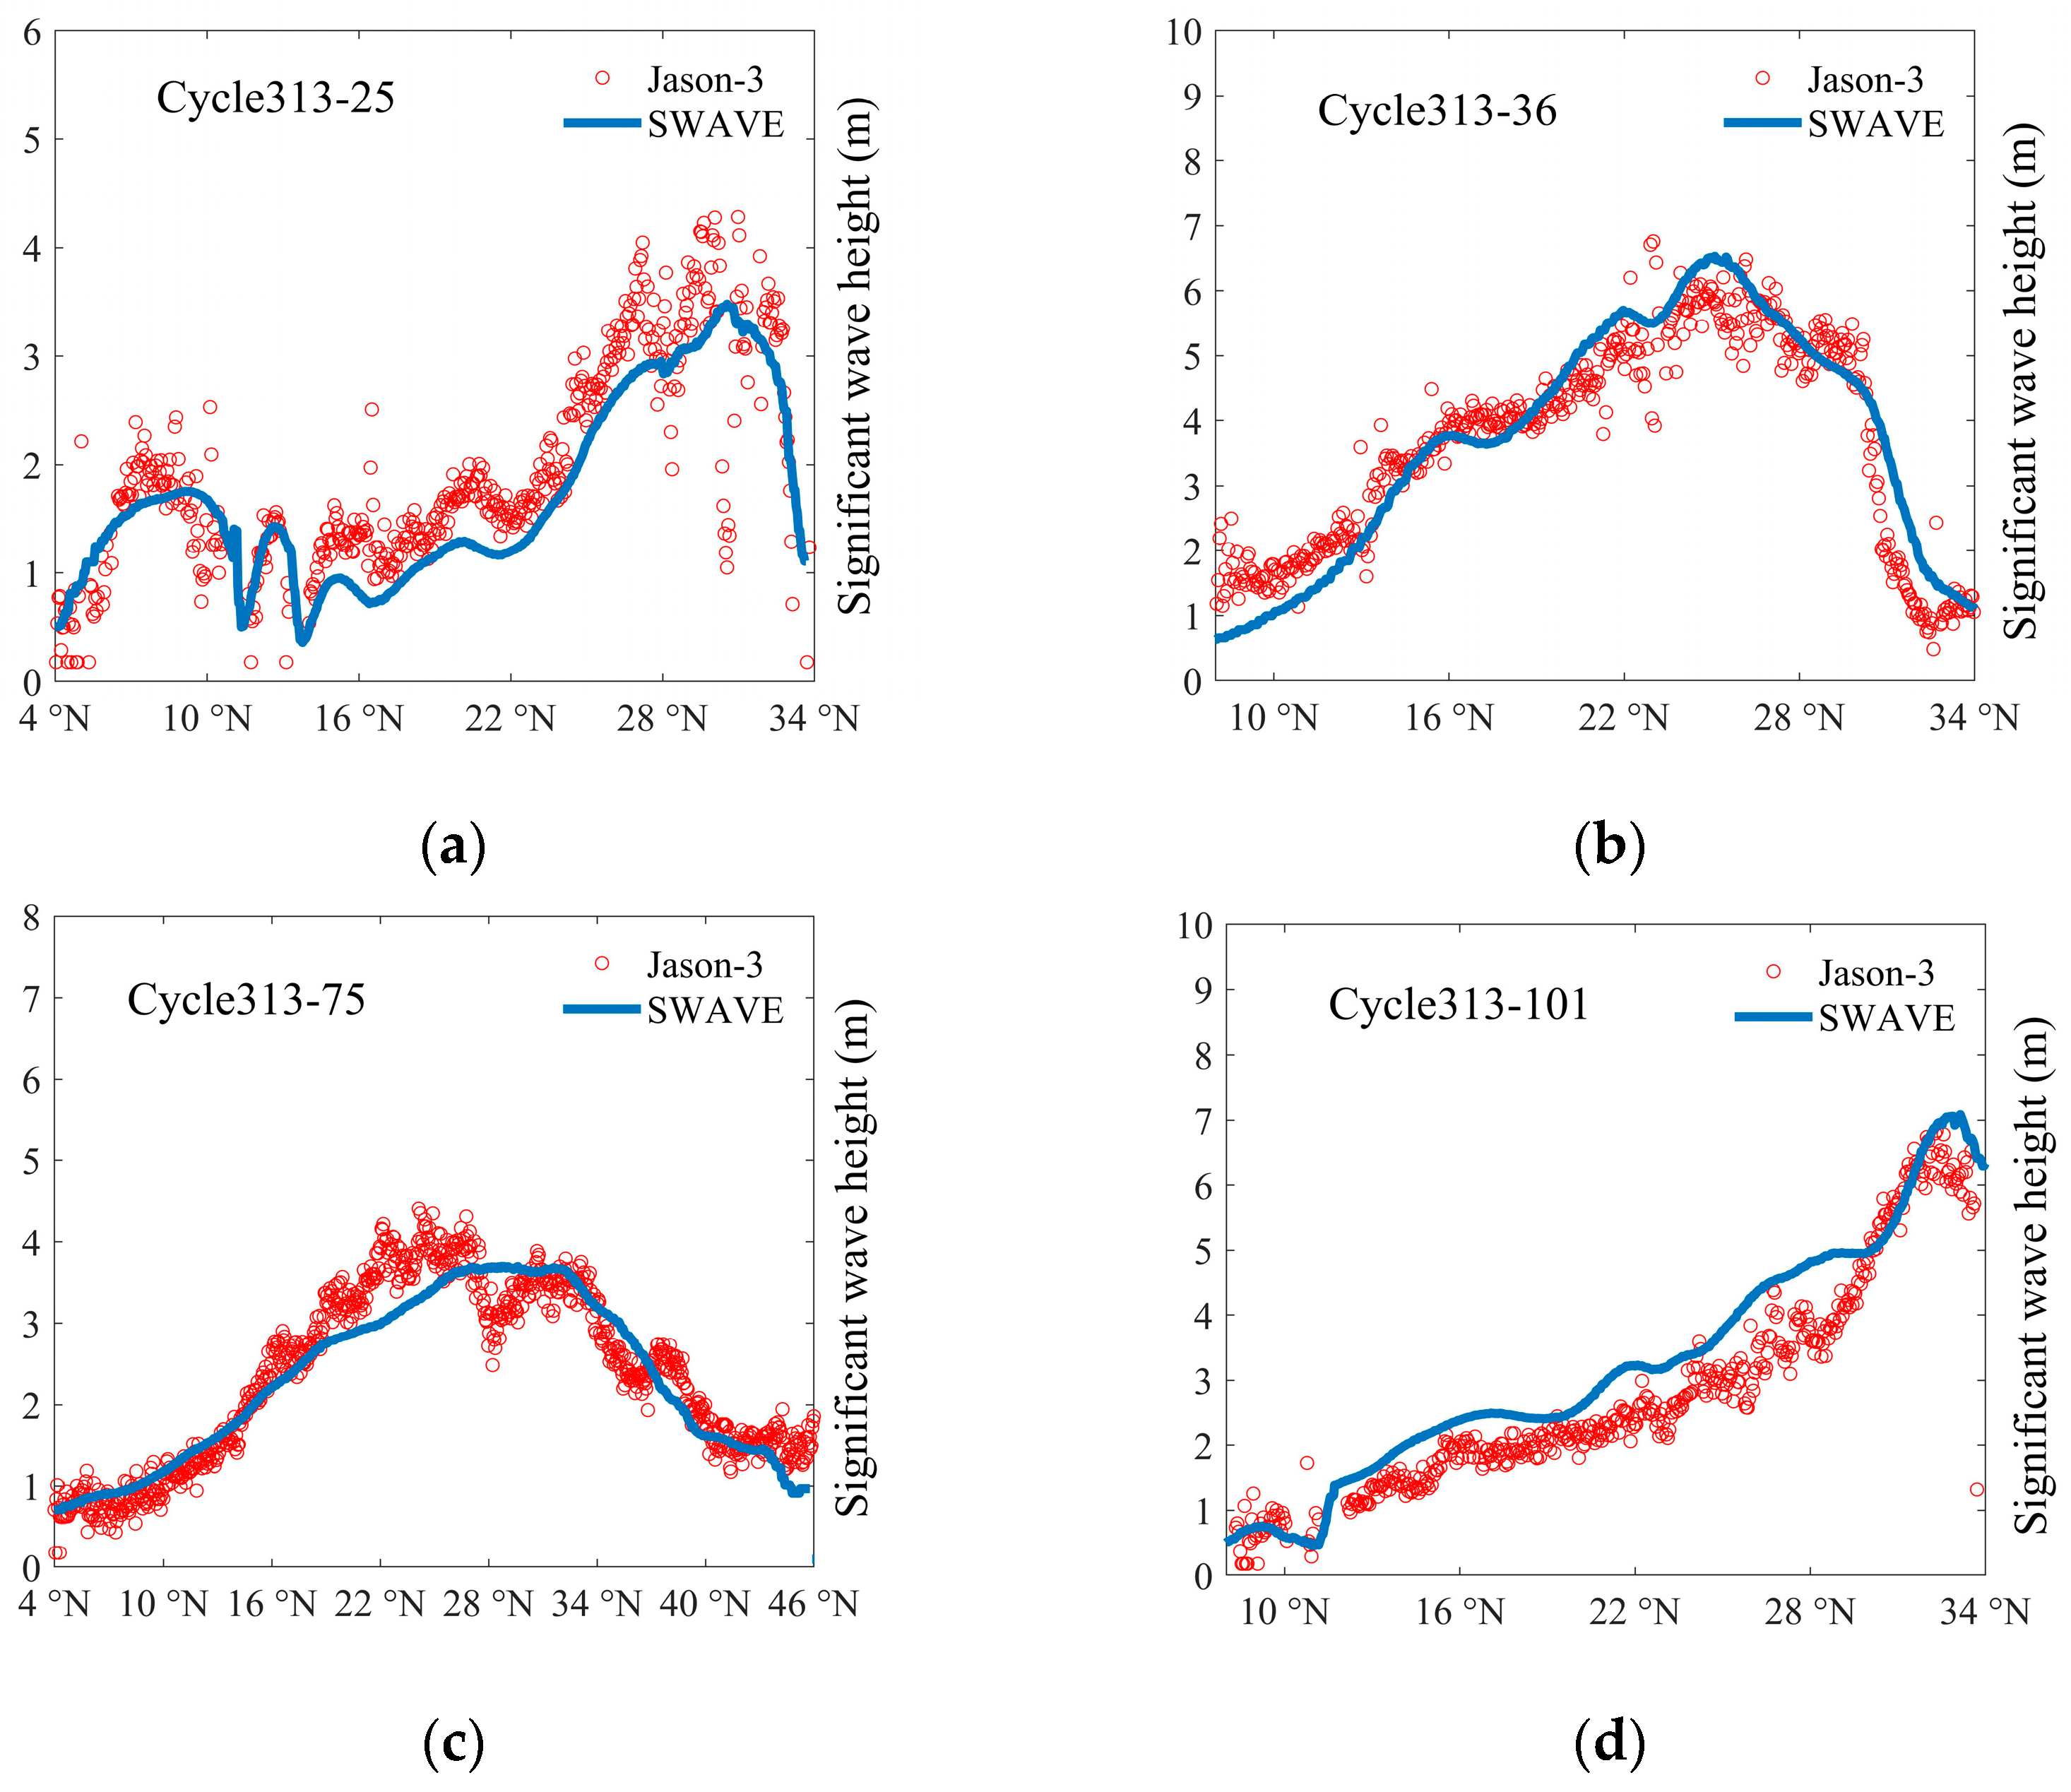
Before examining the impact of wave breaking on upper ocean mixing, it is essential to ensure that the wave model offers satisfactory performance. The significant wave height (SWH) derived from the Ku-band inversion of the Jason-3 satellite altimeter is utilized to further validate the simulations of ocean waves. Figure 4a–d illustrate the four trajectories surveyed by the observation satellite during Typhoon Nanmadol. We compared the SWH observed by the satellite with our simulation results and conducted an error analysis.
When compared with the significant wave height (SWH) derived from the satellite altimeter inversion (Figure 4), the observed wave heights varied between 0.5 and 7 m during this period. The SWAVE wave model, utilizing the wave age scheme, accurately replicates both the timing and magnitude of the significant wave heights observed by the satellite altimeter in orbit (represented by the blue lines in Figure 4). This model can simulate the strong wave field caused by the typhoon more accurately. The accuracy of wave height simulation results is measured by comparing the correlation coefficient ( C O R ), mean absolute error ( M A E ), and root mean square error ( R M S E ). The specific formula is as follows:
C O R = i = 1 N x i x ¯ y i y ¯ i = 1 N x i x ¯ 2 i = 1 N y i y ¯ 2
M A E = 1 N i = 1 N x i y i
R M S E = 1 N i = 1 N x i y i 2
where x i and y i , respectively, represent the simulated value and the measured value (inversion value); x ¯ and y ¯ , respectively, represent the average value of the two. The calculated results are shown in Table 1. In general, the simulated value is close to the satellite altimeter data, the correlation ( C O R ) between the simulated value and the measured value is 0.85 or more, the overall mean absolute error ( M A E ) is less than 0.5 m, and the root mean square error ( R M S E ) is about 0.5 m. It can be considered that there is a strong similarity between the simulated SWH and the observed significant wave height, which can better reflect the wave conditions in the offshore sea under the typhoon.

4.2. Simulation Results of Turbulent Kinetic Energy

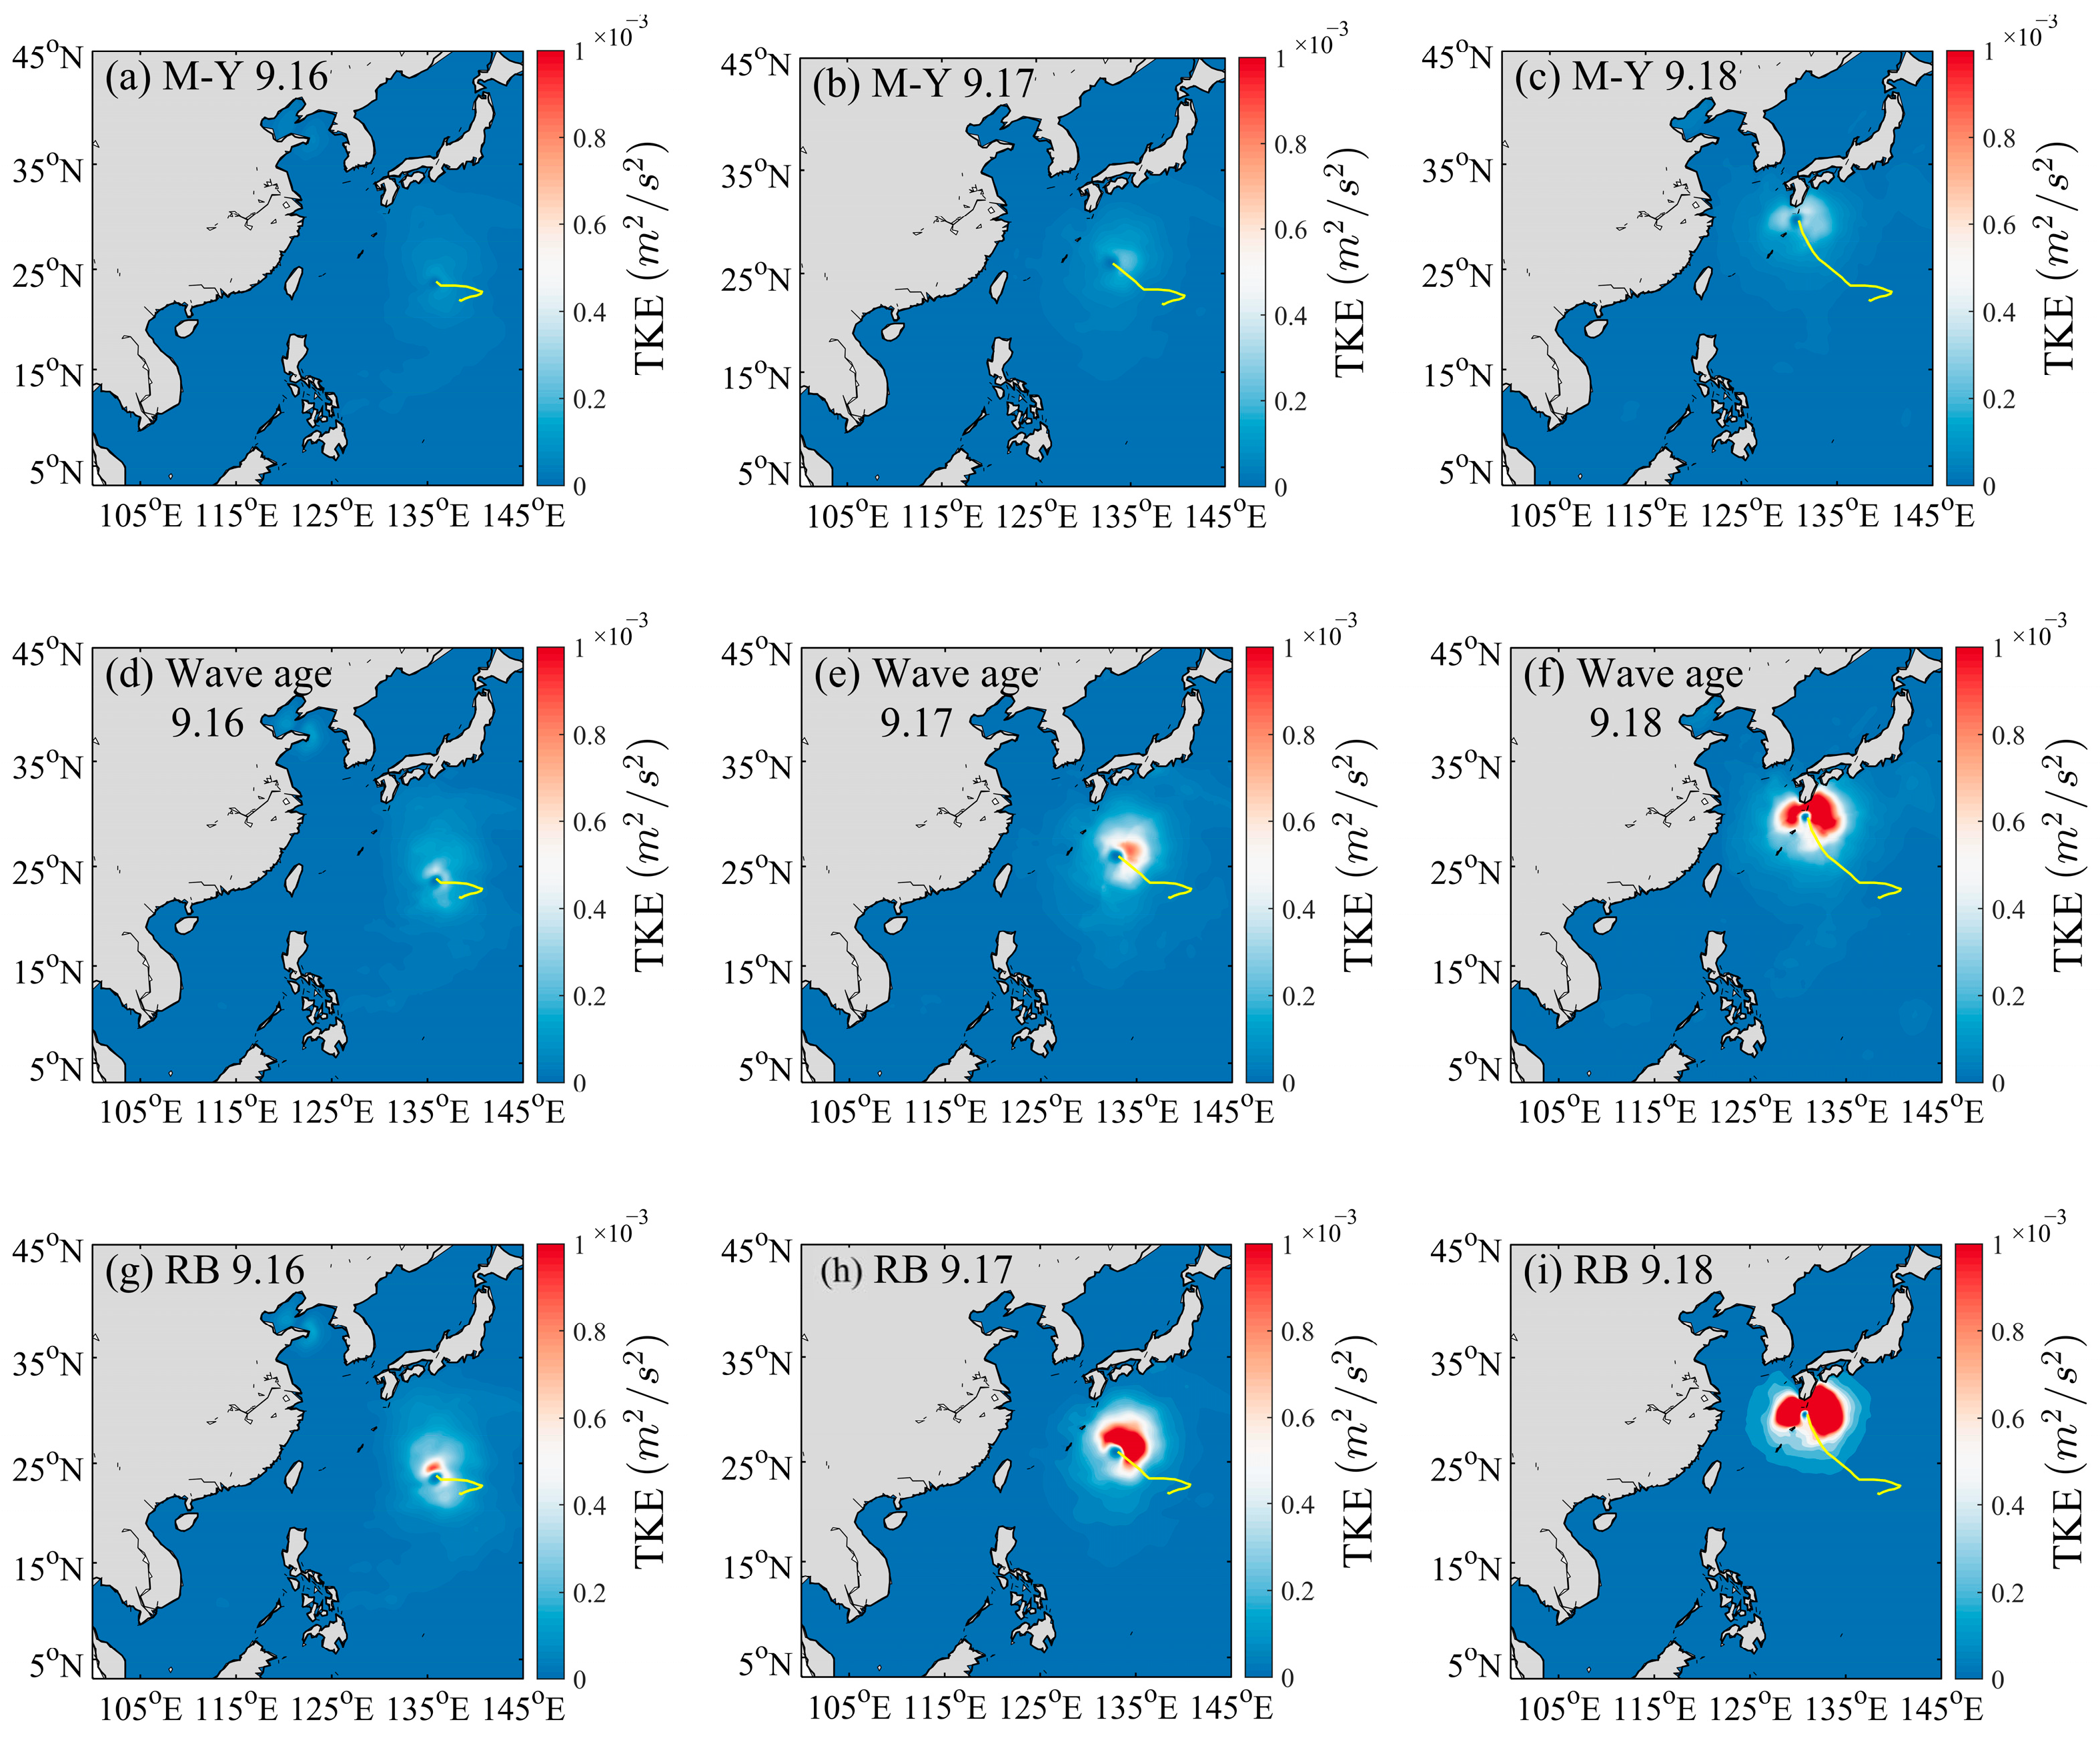
In fluid dynamics, turbulent kinetic energy (TKE) represents the mean kinetic energy per unit mass associated with turbulent vortices. The alteration in TKE over time indicates the net budget of this energy, serving as a metric for the evolution or decay of turbulence. Wave breaking modulates the TKE within the mixed layer by augmenting surface energy and momentum, thereby increasing the mixed layer depth (MLD). This process intensifies the mixing of heat, momentum, and salinity proximate to the ocean’s surface [5]. To investigate the variations in sea surface TKE induced by wave breaking, we examined the magnitude and distribution of sea surface TKE under three distinct sea–air boundary conditions daily at midnight (September 16 to September 18, UTC). Furthermore, we studied the direct impact of the wave breaking parameterization scheme on sea surface TKE (Figure 5).
As observed in Figure 5, the traditional MY-2.5 boundary layer scheme, serving as the control group, overlooked the presence of waves at the air–sea interface. This omission resulted in diminished turbulent kinetic energy (TKE) at the sea surface and neglected the effects of wave breaking on the upper ocean layers. Both the wave age and wave breaking parameter R B schemes induce alterations in the turbulent energy input along the typhoon’s trajectory. Viewing exclusively from the ocean surface perspective, the sea surface TKE is significantly influenced by the wind field. The wind speed gradually increases from the periphery to the center of the typhoon, but in the central area with a diameter of tens of kilometers, the wind speed rapidly decreases, and the sea surface TKE also follows this law, and the central position is synchronized with the moving position of the typhoon, without time delay. This indicates that friction velocity u significantly influences sea surface turbulence.
Upon calculating the difference between the sea surface turbulent energy results of the two experimental groups (subtracting the wave age scheme from the broken wave parameter R B scheme) at corresponding times, it is evident that the broken wave parameter R B scheme exhibits notably higher sea surface turbulent energy throughout all stages within the typhoon region. Outside the typhoon’s influence, both schemes yield similar outcomes. As depicted in Figure 6, the two schemes influence distinct areas in terms of TKE. The broken wave parameter R B scheme leads to a more expansive wave breaking zone on the sea surface. The wave age parameter scheme evaluates the effect of sea surface wave breaking on TKE based on the maturity level of the wave age ( c p / u ). Conversely, the broken wave parameter is chiefly influenced by the wind and sea Reynolds numbers. Once the wave breaking parameter R B surpasses 1000, wave breaking is deemed to occur [21]. Concurrently, it is incorporated into the wave energy dissipation equation through whitecap coverage. Zhao’s findings [21] suggest that the broken wave parameter R B , serving as an indicator, offers superior alignment with observed whitecap coverage relative to alternative wave parameters. This superior performance in modeling whitecap coverage compensates for the wave age scheme’s limitations in wave breaking regions. Nonetheless, the implications of turbulence induced by sea surface wave breaking on subsurface waters necessitate a more detailed analysis.
Besides examining the ocean surface, we also investigated the vertical turbulent kinetic energy (TKE) within the subsurface. A comparative analysis was conducted on the annular vertical mean value of the most intense turbulence, approximately 150 km from the typhoon’s center, across three typhoon intensities, typhoon (33 m/s), strong typhoon (48 m/s), and super typhoon (62 m/s), as shown in Figure 7. As wind field intensity increases, so does the penetration depth of TKE, reaching up to 70 m in the case of a super typhoon (Figure 7f). Upon reviewing the three air–sea boundary schemes, as depicted in Figure 5a, it is evident that the classical boundary layer scheme exhibits notably deficient TKE at the sea surface. However, the magnitude beneath the sea surface aligns with the other two schemes, suggesting that the subsurface ocean current’s intensity, influenced by the wind field, remains largely consistent across schemes. In the wave age scheme (Figure 7b,e), the TKE near the sea surface closely matches the values closer to the surface, failing to clearly demonstrate the impact of wave breaking on the sea surface. Moreover, the contribution of sea surface TKE does not satisfy the criterion where it should be more robust than subsurface levels. In the breaking wave parameter R B scheme, the TKE of the sea surface increases sharply and gradually decreases with depth, which is more consistent with the vertical TKE of wave breaking simulated by Wang [41] under one-dimensional conditions, and significantly enhances the turbulent energy of the ocean surface. As observed in Figure 7a,c, the impact depth of TKE induced by the broken wave parameter R B scheme (represented by the red line) either extends deeper or exhibits greater energy at equivalent depths. This phenomenon facilitates the perturbation of cold waters beneath the mixing layer upwards. Nonetheless, to ascertain the actual magnitude of this impact, an analysis of the mixing layer’s simulation results is necessary.

4.3. Sea Surface Temperature Simulation Results

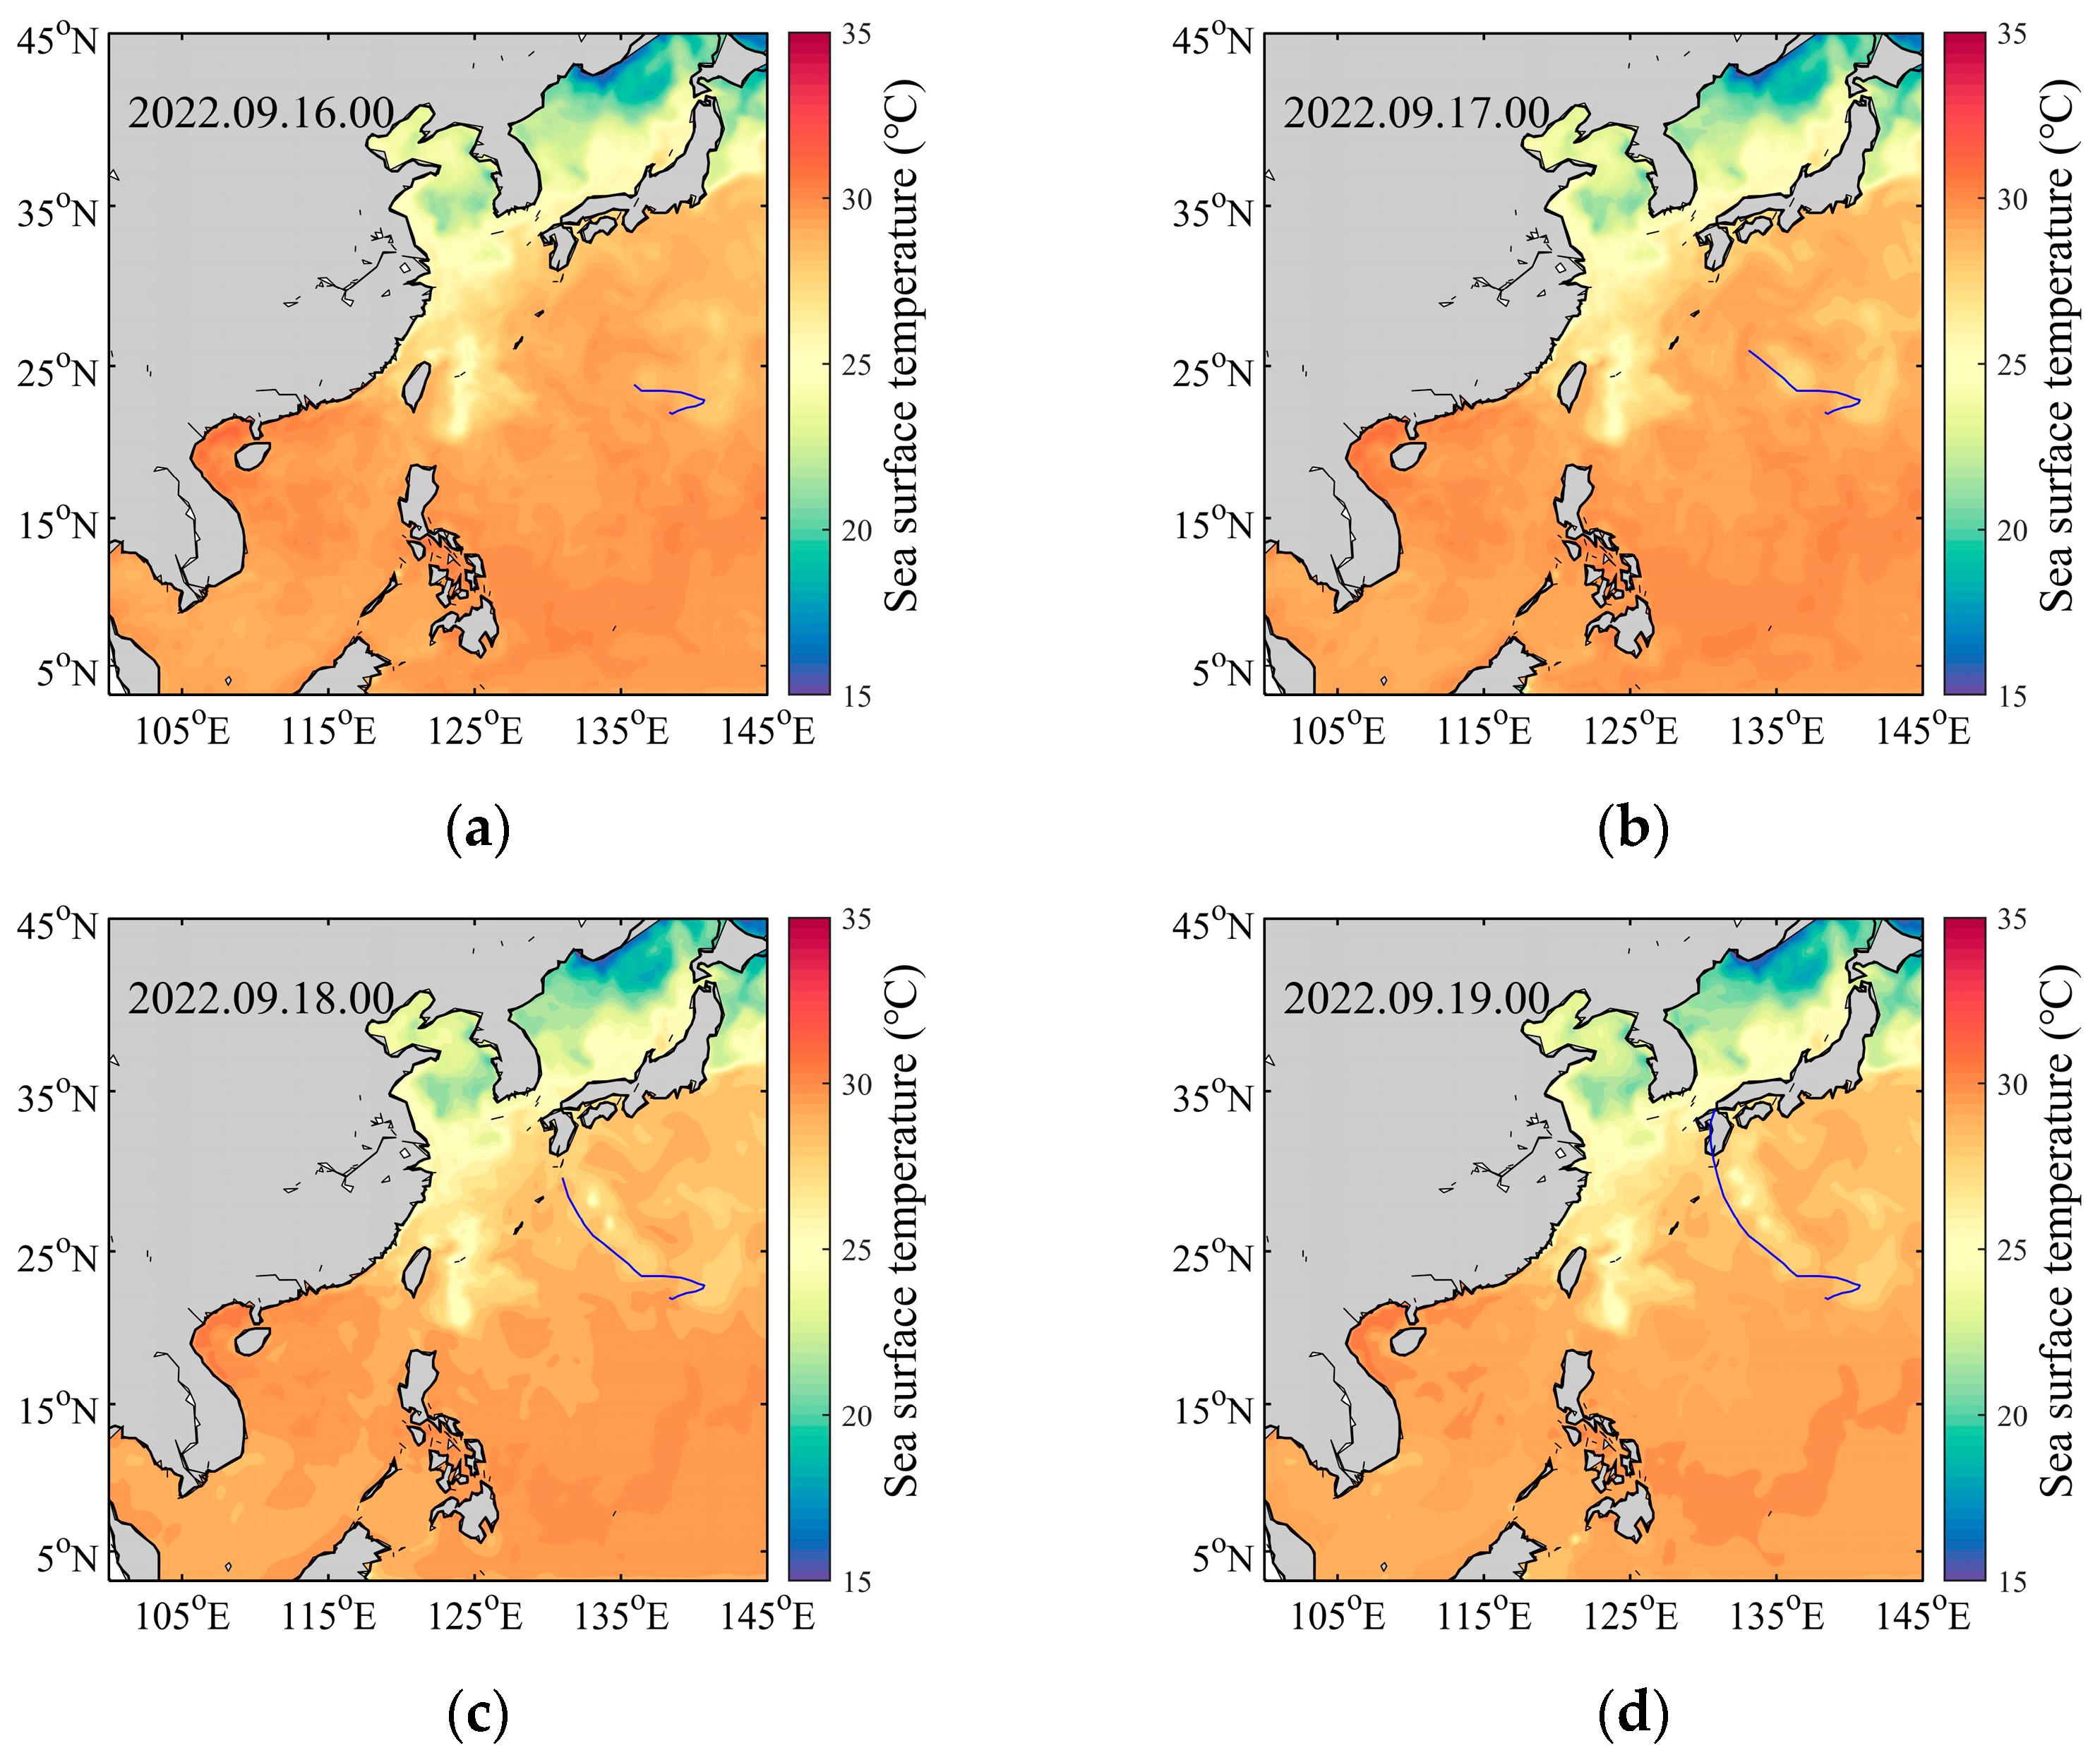
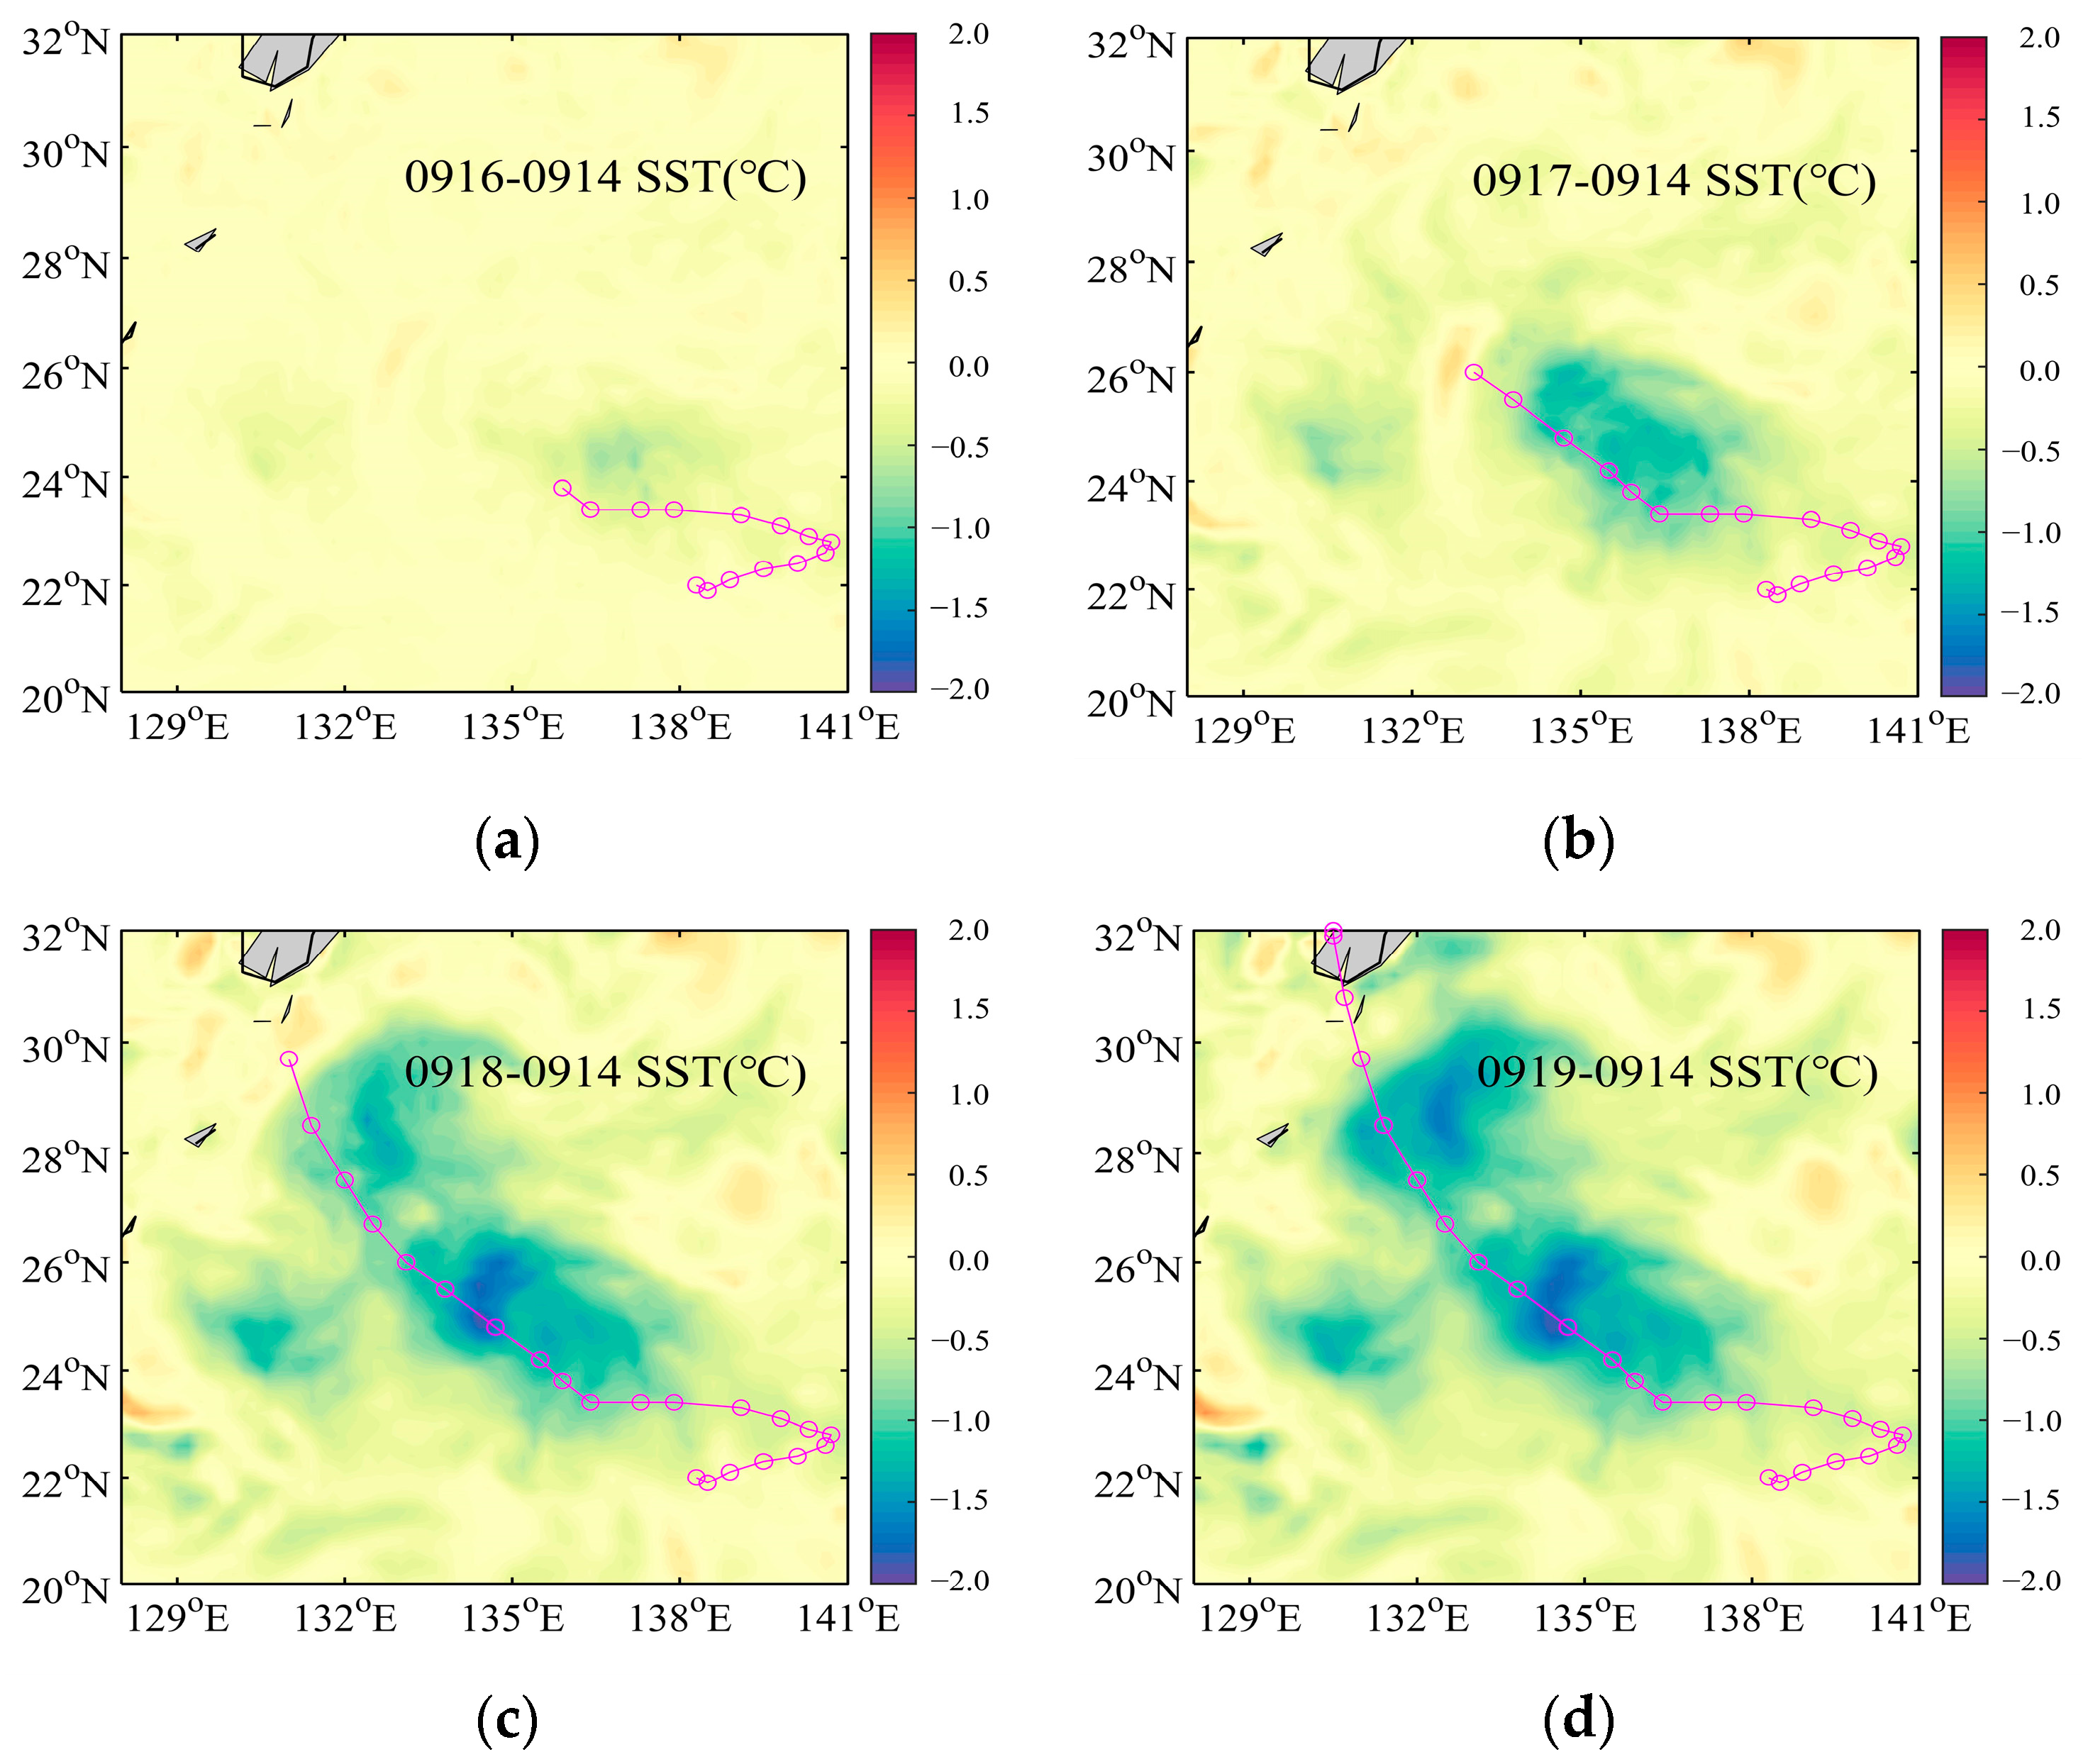
Sea surface temperature (SST), acting as the ocean’s forcing mechanism on the atmosphere, is crucial for the formation, trajectory, and fluctuation in intensity of typhoons. Conversely, typhoon transits significantly impact the SST in affected marine regions [42,43]. Under the influence of a typhoon’s robust wind stress, the surface water within the typhoon’s oceanic vortex flows centrifugally, generating robust waves. This process induces seawater divergence and prompts the upwelling of deeper sea waters. Consequently, the SST in the region experiencing the most pronounced divergence of the typhoon’s oceanic vortex is notably cooler than in areas with less divergence. Figure 8 illustrates the alterations in sea surface temperature (SST) induced by Typhoon Nanmadol, as well as the temperature variations surrounding the typhoon’s trajectory.
Under the significant influence of Typhoon Nanmadol, there was a notable decrease in SST as the typhoon progressed. The SST recorded on 14 September 2022, before Typhoon Nanmadol formed, was designated as the baseline temperature. Consequently, the variation in SST is calculated by subtracting the SST of 14 September 2022 from the current SST in Figure 9a–d. Along the typhoon path, both the experimental and observed sea surface temperatures responded to the typhoon, with a maximum cooling value of 2.5 °C. It can be found that the maximum cooling value area is behind the current position of Typhoon Nanmadol; that is, after Typhoon Nanmadol passed through this sea area, the cooling amplitude caused by the maximum cooling value area continues to increase. The findings reveal a pronounced temporal delay in the cooling effects induced by Typhoon Nanmadol over the Western Pacific, with an approximate lag time of 1 day.
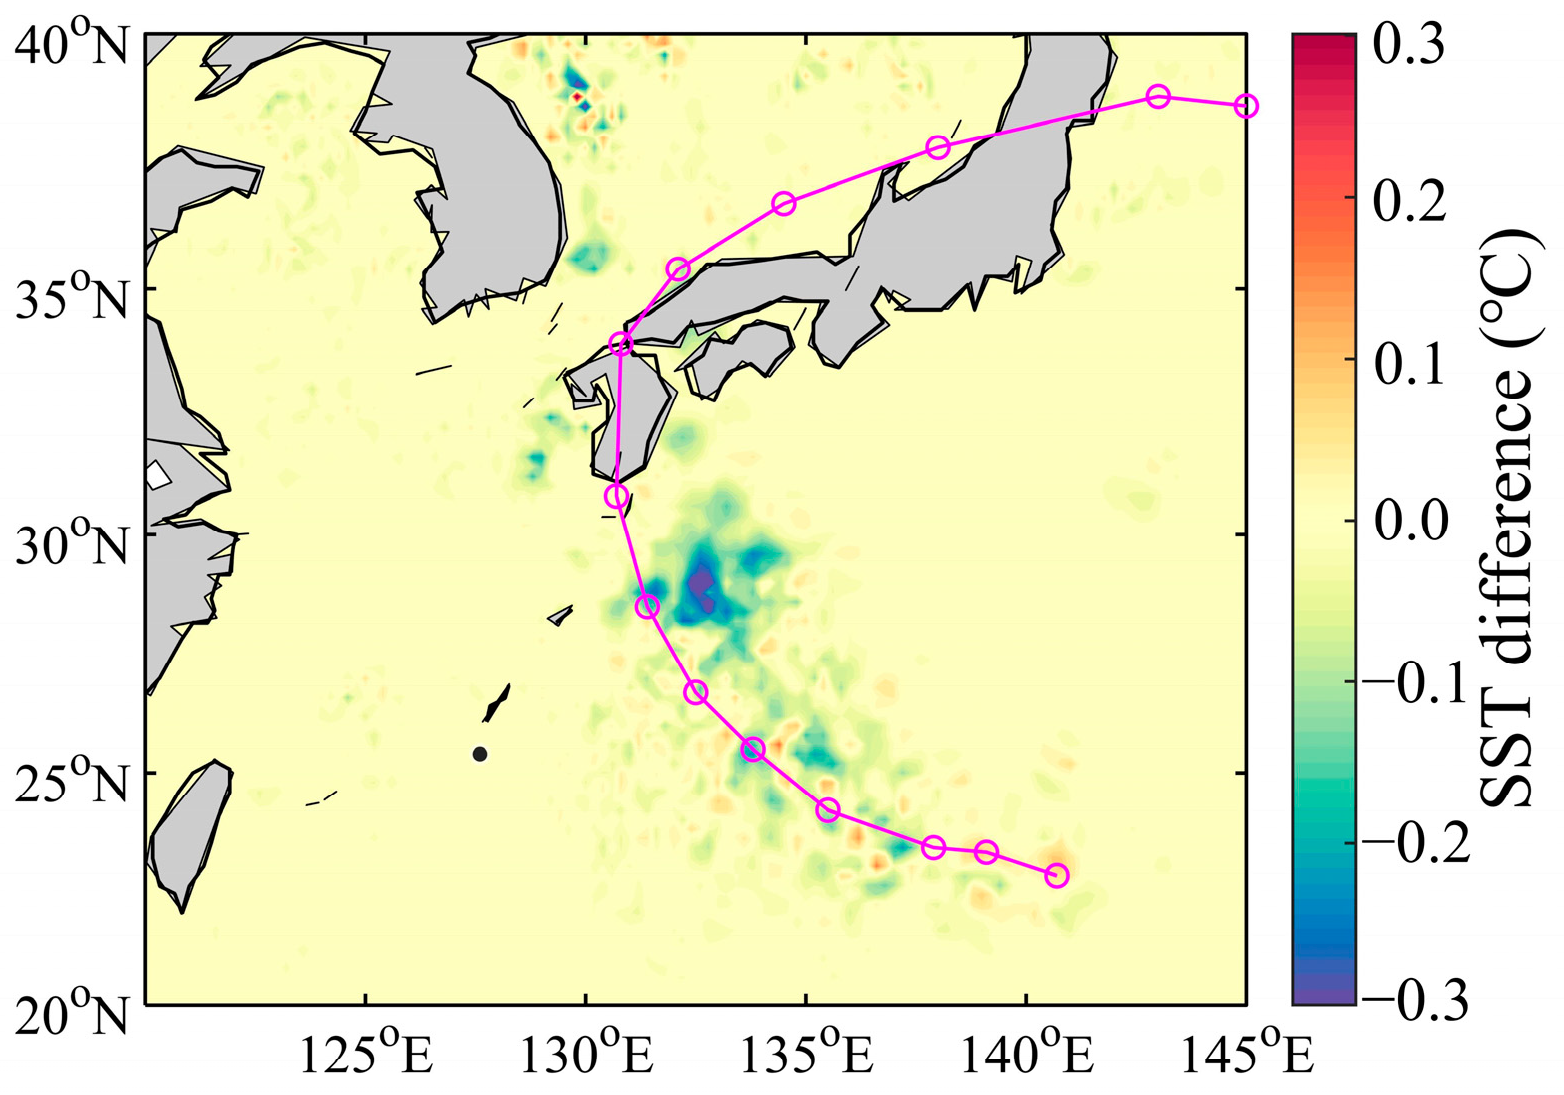
As concluded in the preceding section, the breaking wave parameter R B scheme amplifies the infusion of turbulent kinetic energy (TKE) into the ocean via wave breaking at the sea surface. This process intensifies oceanic turbulence, upwells cooler water from lower layers to the surface, and consequently reduces the temperature of both the mixed layer and the sea surface. We calculated the difference between the minimum SST values during typhoons as simulated by the two wave breaking schemes (refer to Figure 10). There is a positive correlation between typhoon intensity and the disparity in SST as depicted by the two schemes, with the SST variation reaching approximately 0.3 °C at the peak wind field intensity. The regions experiencing temperature alterations appear as patchy, suggesting varying impacts of identical wind speeds and wave conditions on the incidence and magnitude of wave breaking when comparing the wave age scheme with the breaking wave parameter R B scheme. We found that although the breaking wave parameter R B scheme led to a sharp increase in the TKE of the sea surface (Figure 7d–f), the sea surface temperature did not decrease dramatically, indicating that the depth of the wave breaking influence was relatively shallow, and the low-temperature water below the mixing layer did not stir more into the upper layer, and the mixing effect on the subsurface seawater was weak.
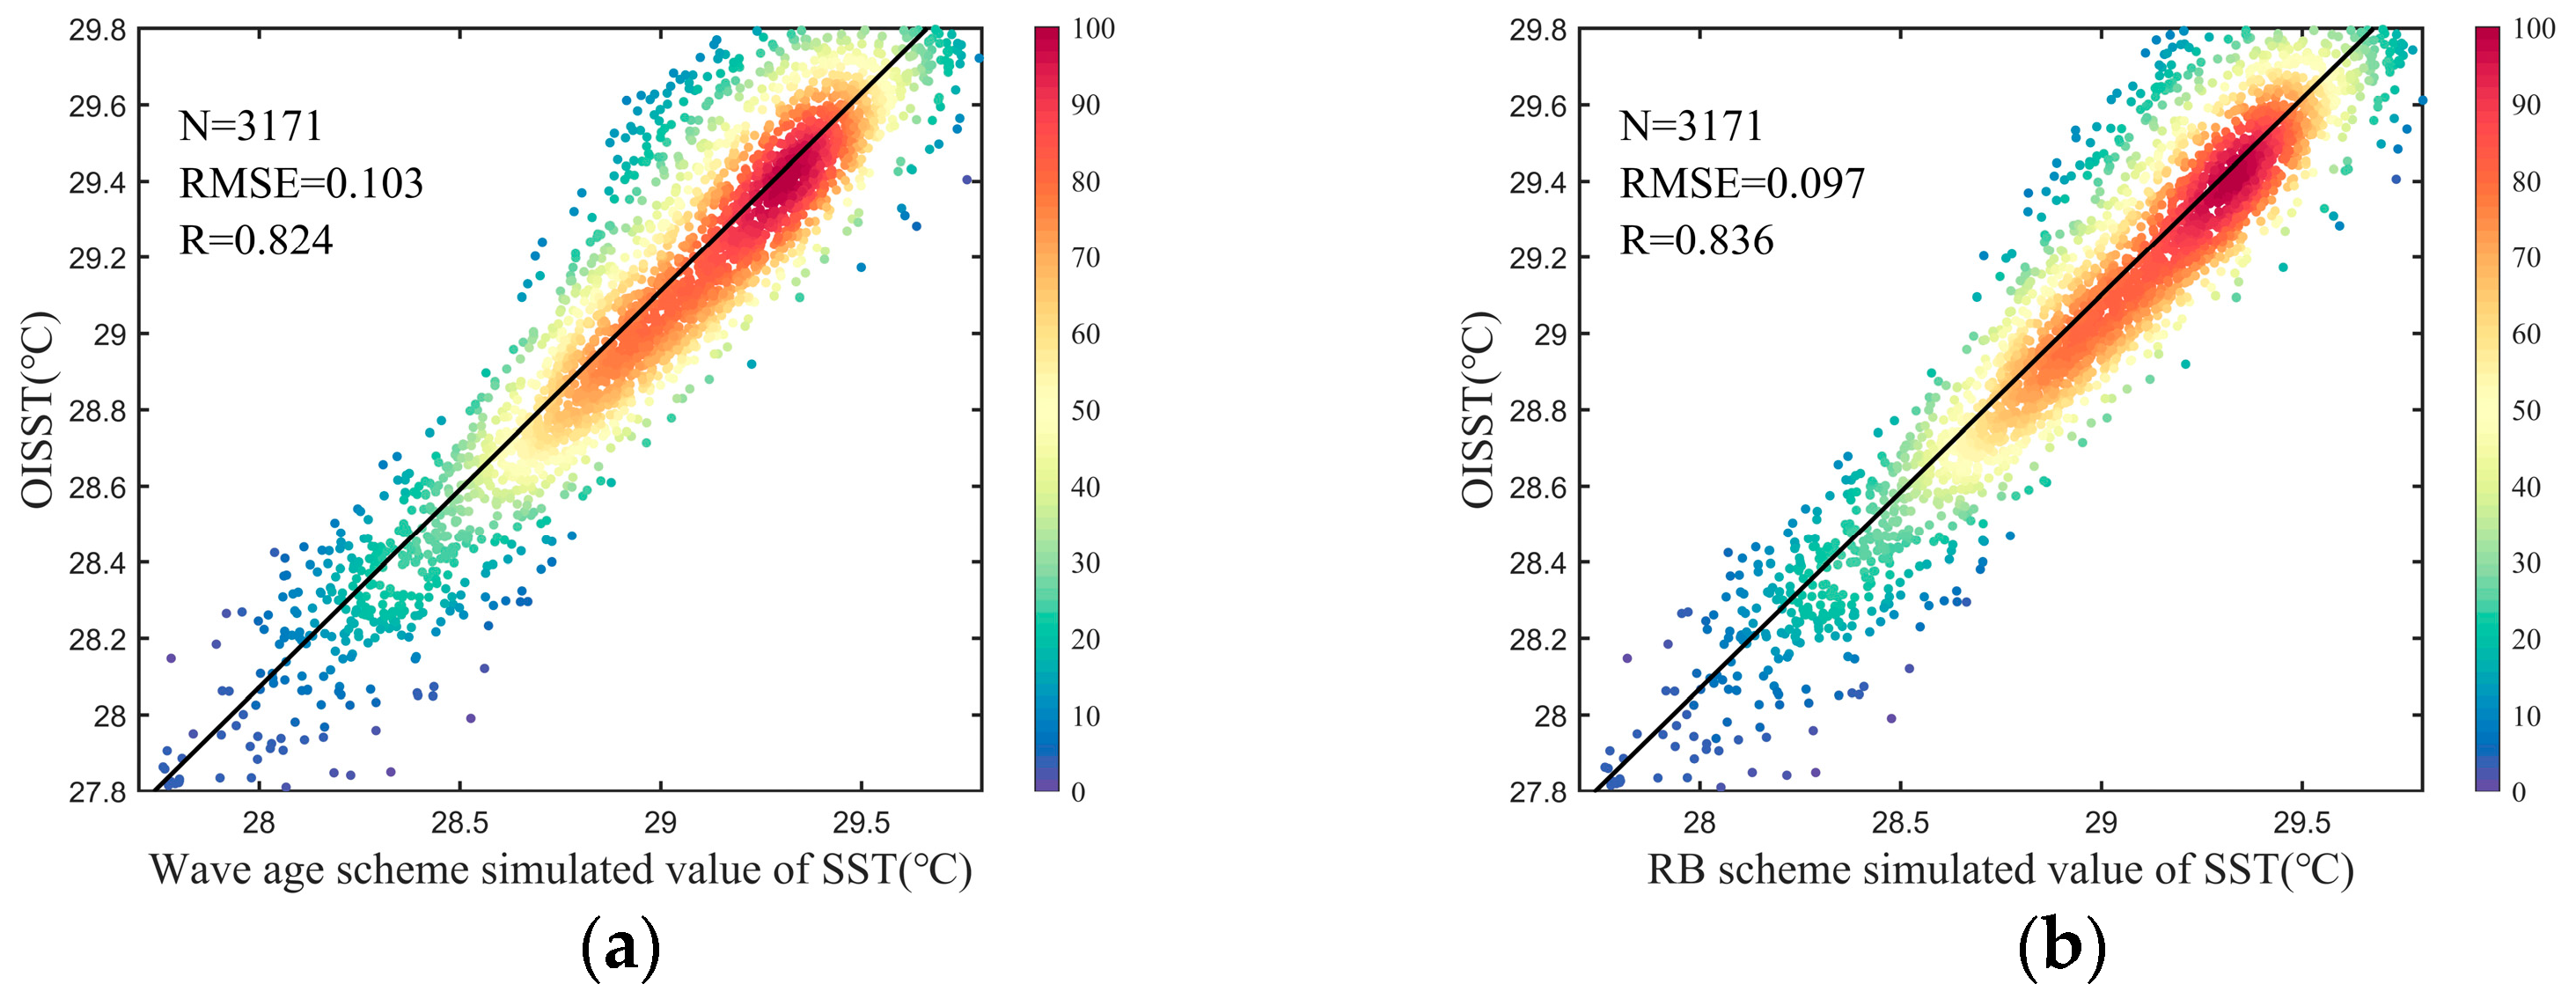
The grid points in the range of 128–141°E and 20–32°N affected by Nanmadol were selected for comparison with OISST; both the wave age and broken wave parameter R B schemes produced satisfactory simulations of SST (see Figure 11a,b). The correlation coefficients C O R for both schemes reached 0.82, and the root mean square errors R M S E were about 0.1 degrees Celsius. We posit that wave breaking constitutes just one aspect of wave influence on the ocean, which explains why the variations introduced by different schemes are not substantial. The broken wave parameter R B scheme offers advantages over the wave age parameterization scheme as it amplifies the TKE at the sea surface, leading to changes in sea surface temperature of up to 0.3 °C. This enhancement refines the simulation outcomes for sea surface temperature during typhoon events.

4.4. Mixed Layer Simulation Results

Due to solar radiation heating in seawater, sea surface air cooling, and wind and wave mixing, the vertical structure of ocean temperature can be divided into three layers: the mixed layer, thermocline layer, and bottom layer with a weak vertical temperature gradient [44,45]. Serving as a direct interface with the atmosphere, the mixed layer absorbs solar radiative energy. Concurrently, turbulent diffusion, induced by the wind field, wave action, and sea surface air cooling, facilitates vertical heat transfer within the ocean. Consequently, the characteristics of the mixed layer emerge as a crucial indicator for assessing the upper ocean’s thermal response to typhoons [46]. We define the base of the surface mixed layer at the depth where the temperature becomes lower by 0.5 °C than that at the ocean surface [47,48].
We selected representative sample points along the path of Typhoon Nanmadol to illustrate the alterations in vertical ocean temperature stratification throughout the entire typhoon simulation. The horizontal axis represents time progression, while the vertical axis indicates ocean depth. The paramount influence of the typhoon on the mixed layer is characterized by the robust sea surface wind field’s continuous agitation of seawater, leading to intense turbulence that thoroughly blends the contents of the mixed layer. The primary dynamic mechanism driving subsurface seawater temperature variations is the upwelling of deeply cooled seawater, a phenomenon also referred to as cold suction (see Figure 12a). Consequently, there was an overall temperature reduction of approximately 2 °C in the mixed layer, and the MLD at the sample location expanded by roughly 10 m. The period of the maximum cooling degree was always behind Typhoon Nanmadol. In other words, the cooling effect induced by Typhoon Nanmadol in the affected region persisted and amplified even one day after the typhoon had traversed the sea area. Moreover, the mixed layer’s recovery from the temperature and depth modifications induced by the typhoon was not immediate. Influenced by elements like the wind field and surge, the cooling phenomenon persisted for roughly three days before beginning to dissipate (refer to Figure 12b).
To more precisely delineate the variations in MLD, we chose Argo floats situated proximately to the typhoon’s pathway during its passage. We juxtaposed the vertical temperature simulation findings with the empirical data obtained from these Argo floats and examined the impact of the wave breaking parameterization schemes on the MLD. According to Figure 13, the simulation results are relatively close to the Argo floats’ observation results on the whole, which can well present the change in sea surface temperature, but there are still problems such as a high sea surface temperature and insufficient depth of the mixed layer. Contrasted with the wave age scheme, there is a modest decline in mixed layer temperature ranging between 0.2 and 0.3 °C, accompanied by a diminution in MLD of 0.2–0.5 m. The breaking wave parameter R B scheme generates enhanced TKE within the surface layer. This increased energy facilitates the agitation of deeper, colder waters into the mixing layer, resulting in an augmented depth of the mixing layer.
Thus, preliminary findings suggest that the wave breaking R B parameterization scheme outperforms the wave age scheme. Furthermore, the wave breaking parameter more accurately captures the wave breaking dynamics induced by local wind waves. Meanwhile, TKE is increased in the sea surface, and the ocean mixing caused by it improves the simulation results of the upper ocean. However, it still underestimated the mixed layer MLD and overestimated the SST. In contrast, the wave age parameterization scheme has a smaller range of wave breaking, insufficient input of turbulent energy to the ocean, and insufficient exchange of heat and organic matter in the mixed layer. Notwithstanding, the influence of wave breaking on sea surface temperature and the mixed layer is marginal. Additionally, the effects of other wave-related factors on the ocean during a typhoon should be taken into account.

5. Conclusions

The simulation of Typhoon Nanmadol in the Western Pacific Ocean was conducted using the unstructured grid FVCOM-SWAVE coupled wave and current model. To address the issue of inadequate air–sea mixing in the MY-2.5 turbulent closure model, we examined the upper ocean temperature’s response to the wave breaking parameterization scheme. Particular attention was given to the wave breaking energy dissipation parameterization scheme that incorporates the breaking wave parameter R B . Model results were validated using data derived from the Jason-3 satellite altimeter, merged sea surface temperature (OISST), and Argo floats. This process also showcased the capability to simulate waves across extensive regions under extreme wind conditions.
The surface turbulent kinetic energy (TKE) exhibits varying responses to the three distinct air–sea interface schemes. Within the traditional MY-2.5 model, the air–sea interface, originally designed for a layered boundary layer adjacent to a rigid surface, inadequately addresses the upper ocean boundary interfacing with surface waves. Consequently, the TKE value associated with surface turbulence is notably low, insufficient to catalyze turbulent mixing and facilitate material exchange at the sea surface. Craig and Banner [22] employed wave age as the primary parameter in calculating TKE magnitudes. However, their simulation outcomes revealed that the TKE present at the sea surface was inadequate to thoroughly induce turbulent mixing within the upper ocean layers. Utilizing the breaking wave parameter R B introduced by Zhao [21] as the principal parameter yielded the wave breaking energy dissipation equation. This equation adeptly captures the comprehensive wave breaking dynamics influenced by locally balanced wind waves. The simulation of vertical turbulent energy resulting from wave breaking aligns more closely with observed phenomena, substantially amplifying the turbulence at the ocean’s surface.
The wave breaking parameterization scheme indirectly influences variations in sea surface and mixed layer temperatures. This enhancement occurs because the breaking wave parameter R B scheme amplifies the TKE within the sea surface and mixed layer. Consequently, both the sea surface temperature and mixed layer temperature remain lower compared to the wave age scheme, thereby refining the simulation outcomes of the MY-2.5 turbulent closure model. However, wave breaking is only a part of the effect of waves on the ocean, and the model still has the problems of a higher sea surface temperature under typhoon forcing and insufficient depth of the mixed layer. To more thoroughly investigate the wave impact on the ocean during severe marine conditions, it is imperative to holistically account for factors such as wave radiation stress, Langmuir circulation, and Stokes drift, among other wave-induced phenomena.
It can be seen from the results that a single wave breaking parameterization scheme has little effect on the results of SST, but SST plays an important role in the process of air–sea interaction, which largely controls the sensible heat and latent heat fluxes. These processes affect the dynamic circulation of the ocean and atmosphere. SST is also a very important term for tropical cyclone forecasting because it controls the transport of energy between the ocean and the atmosphere. It can influence the intensity and track of tropical cyclones [49]. Both in climate models and in weather forecasting models, it is necessary to consider the impact of wave breaking on upper ocean mixing to improve SST simulations.
The results indicate that while enhancements in the wave breaking parameterization scheme have a minimal impact on sea surface temperature (SST) outcomes, SST significantly influences air–sea interaction processes. This influence primarily regulates the fluxes of sensible heat and latent heat. Such processes modulate the dynamic circulation patterns within both the ocean and the atmosphere. Moreover, SST serves as a crucial variable in tropical cyclone forecasting, given its regulatory function in energy transfer between the ocean and the atmosphere. This regulatory function can directly impact the intensity and trajectory of tropical cyclones [49]. Consequently, in both climate models and weather forecasting models, accounting for the effects of wave breaking on upper ocean mixing is essential to refine SST simulations.

Author Contributions

Conceptualization, J.S. and X.C.; methodology, X.C., J.C. and J.S.; formal analysis, J.S., J.C. and X.C.; writing—original draft preparation, J.X., W.Z., Z.Y., H.W., S.Z. and X.C.; writing—review and editing, S.Z., J.L., Q.W., Z.Z. and X.C.; funding acquisition, J.C. and J.X.; supervision, J.C. and J.S. All authors have read and agreed to the published version of the manuscript.

Funding

This research was funded by the Natural Science Foundation of Hunan Province (Grant No. 2022JJ10047 and 2023JJ20046), the National Natural Science Foundation of China (Grant No. 52271257 and 12201636), and the National Key Research and Development Program of China (Grant No. 2021YFB2601100).

Data Availability Statement

The typhoon best track dataset was obtained from the National Weather Service (https://tcdata.typhoon.org.cn/zjljsjj.html, accessed on 1 January 2024). The topographic data were available from NOAA National Centers (http://www.ngdc.noaa.gov/mgg/global/global.html, accessed on 1 January 2024). The wind data can be found in the ECMWF (https://www.ecmwf.int/, accessed on 1 January 2024). The daily averaged heat flux data were provided by the NCEP (https://downloads.psl.noaa.gov/Datasets/ncep.reanalysis/surface_gauss/, accessed on 1 January 2024). The initial temperature field and the salinity field were obtained from the HYCOM (https://www.hycom.org/, accessed on 1 January 2024). The Argo float profile data are available from the International ARGO Program and the national programs (http://www.argo.org.cn, accessed on 1 January 2024). Satellite fusion OISST was used to obtain SST (https://www.ncei.noaa.gov/products/optimum-interpolation-sst, accessed on 1 January 2024). Significant wave height was obtained using the Jason-3 satellite altimeter (https://www.aviso.altimetry.fr/en/home.html, accessed on 1 January 2024).

Acknowledgments

The authors thank the National Weather Service for providing the best track dataset of typhoons, NOAA National Centers for providing the topographic data, ECMWF for providing the wind data, NCEP for providing the daily averaged heat flux data, and the International Argo Program and the national programs for the Argo float profile data.

Conflicts of Interest

The authors declare no conflicts of interest.

References

  1. Wu, L.; Rutgersson, A.; Sahlée, E. Upper-ocean mixing due to surface gravity waves. J. Geophys. Res. Oceans 2015, 120, 8210–8228. [Google Scholar] [CrossRef]
  2. Qiao, F.; Yuan, Y.; Yang, Y.; Zheng, Q.; Xia, C.; Ma, J. Wave-induced mixing in the upper ocean: Distribution and application to a global ocean circulation model. Geophys. Res. Lett. 2004, 31, 11. [Google Scholar] [CrossRef]
  3. Rascle, N.; Chapron, B.; Ardhuin, F.; Soloviev, A. A note on the direct injection of turbulence by breaking waves. Ocean Model. 2013, 70, 145–151. [Google Scholar] [CrossRef]
  4. Liang, S.; Zhang, Y.; Sun, Z.; Chang, Y. Laboratory study on the evolution of waves parameters due to wave breaking in deep water. Wave Motion 2017, 68, 31–42. [Google Scholar] [CrossRef]
  5. Cai, Y.; Wen, Y.; Wu, L.; Zhou, C.; Zhang, F. Impact of wave breaking on upper-ocean turbulence. J. Geophys. Res. Oceans 2017, 122, 1513–1528. [Google Scholar] [CrossRef]
  6. Agrawal, Y.C.; Terray, E.A.; Donelan, M.A.; Hwang, P.A.; Williams, A.J.; Drennan, W.M.; Kahma, K.K.; Krtaigorodskii, S.A. Enhanced dissipation of kinetic energy beneath surface waves. Nature 1992, 359, 219–220. [Google Scholar] [CrossRef]
  7. Ardhuin, F.; Orfila, A. Wind Waves. In New Frontiers in Operational Oceanography; CreateSpace Independent Publishing Platform: Scotts Valley, CA, USA, 2018; pp. 393–422. [Google Scholar]
  8. Wada, A.; Niino, H.; Nakano, H. Roles of vertical turbulent mixing in the ocean response to Typhoon Rex (1998). J. Oceanogr. 2009, 65, 373–396. [Google Scholar] [CrossRef]
  9. Carniel, S.; Warner, J.C.; Chiggiato, J.; Sclavo, M. Investigating the impact of surface wave breaking on modeling the trajectories of drifters in the northern Adriatic Sea during a wind-storm event. Ocean Model. 2009, 30, 225–239. [Google Scholar] [CrossRef]
  10. Thomson, J.; Schwendeman, M.S.; Zippel, S.F.; Moghimi, S.; Gemmrich, J.; Rogers, W.E. Wave-Breaking Turbulence in the Ocean Surface Layer. J. Phys. Oceanogr. 2016, 46, 1857–1870. [Google Scholar]
  11. Alari, V.; Staneva, J.; Breivik, O.; Bidlot, J.R.; Mogensen, K.; Janssen, P. Surface wave effects on water temperature in the Baltic Sea: Simulations with the coupled NEMO-WAM model. Ocean Dyn. 2016, 66, 917–930. [Google Scholar]
  12. Breivik, Y.; Mogensen, K.; Bidlot, J.R.; Balmaseda, M.A.; Janssen, P.A.E.M. Surface Wave Effects in the NEMO Ocean Model: Forced and Coupled Experiments. J. Geophys. Res. Ocean. 2015, 120, 135–143. [Google Scholar] [CrossRef]
  13. Guan, C.; Zhang, W.; Zhu, D.; Wei, L. A review of research on wave-induced mixing in the upper ocean: Research progress and existing problems. Period. Ocean. Univ. China 2014, 44, 20–24. [Google Scholar]
  14. Mellor, G.; Blumberg, A. Wave Breaking and Ocean Surface Layer Thermal Response. J. Phys. Oceanogr. 2004, 34, 693–698. [Google Scholar] [CrossRef]
  15. Sun, Q.; Song, G.J. Wave breaking on turbulent energy budget in the ocean surface mixed layer. Chin. J. Oceanol. Limnol. 2008, 26, 9–13. [Google Scholar] [CrossRef]
  16. Toba, Y. A parameter describing overall conditions of wave breaking, whitecapping, sea-spray production and wind stress. In Oceanic Whitecaps; Springer: Dordrecht, The Netherlands, 1986. [Google Scholar]
  17. Zhao, D.; Toba, Y.; Suzuki, Y.; Komori, S. Effect of wind waves on air-sea gas exchange: Proposal of an overall CO2 transfer velocity formula as a function of breaking-wave parameter. Tellus Ser. B Chem. Phys. Meteorol. 2003, 55, 478–487. [Google Scholar] [CrossRef]
  18. Toba, Y.; Komori, S.; Suzuki, Y.; Zhao, D. Similarity and dissimilarity in air-sea momentum and CO2 transfers: The nondimensional transfer coefficients in light of the windsea Reynolds number. In Atmosphere-Ocean Interactions; WIT Press: Southampton, UK, 2006; pp. 53–82. [Google Scholar]
  19. Shi, J.; Zhao, D.L.; Xun-Qiang, L.I.; Zhong, Z. New wave-dependent formulae for sea spray flux at air-sea interface. J. Hydrodyn. 2009, 21, 573–581. [Google Scholar] [CrossRef]
  20. Zhao, D.; Toba, Y.; Sugioka, K.I.; Komori, S. New sea spray generation function for spume droplets. J. Geophys. Res. Oceans 2006, 111, C2. [Google Scholar] [CrossRef]
  21. Zhao, D.; Toba, Y. Dependence of Whitecap Coverage on Wind and Wind-Wave Properties. J. Oceanogr. 2001, 57, 603–616. [Google Scholar] [CrossRef]
  22. Craig, P.D.; Banner, M.L. Modeling Wave-Enhanced Turbulence in the Ocean Surface Layer. J. Phys. Oceanogr. 1994, 24, 2546–2559. [Google Scholar] [CrossRef]
  23. Chen, C.; Liu, H.; Beardsley, R.C. An Unstructured Grid, Finite-Volume, Three-Dimensional, Primitive Equations Ocean Model: Application to Coastal Ocean and Estuaries. J. Atmos. Ocean. Technol. 2003, 20, 159–186. [Google Scholar] [CrossRef]
  24. Niu, Q.; Xia, M.; Rutherford, E.S.; Mason, D.M.; Anderson, E.J.; Schwab, D.J. Investigation of interbasin exchange and interannual variability in Lake Erie using an unstructured-grid hydrodynamic model. J. Geophys. Res. Ocean. 2015, 120, 2212–2232. [Google Scholar] [CrossRef]
  25. Jiang, L.; Xia, M. Dynamics of the Chesapeake Bay outflow plume: Realistic plume simulation and its seasonal and interannual variability. J. Geophys. Res. Oceans 2016, 121, 1424–1445. [Google Scholar] [CrossRef]
  26. Kang, X.; Xia, M.; Pitula, J.S.; Chigbu, P. Dynamics of water and salt exchange at Maryland Coastal Bays. Estuar. Coast. Shelf Sci. 2017, 189, 1–16. [Google Scholar] [CrossRef]
  27. Chen, J.; Weisberg, R.H.; Liu, Y.; Zheng, L.; Zhu, J. On the Momentum Balance of Tampa Bay. J. Geophys. Res. Oceans 2019, 124, 4492–4510. [Google Scholar] [CrossRef]
  28. Liu, Y.; Weisberg, R.H.; Zheng, L. Impacts of Hurricane Irma on the Circulation and Transport in Florida Bay and the Charlotte Harbor Estuary. Estuaries Coasts 2020, 43, 1194–1216. [Google Scholar] [CrossRef]
  29. Galperin, B.; Kantha, L.H.; Hassid, S.; Rosati, A. A Quasi-equilibrium Turbulent Energy Model for Geophysical Flows. J. Atmos. Sci. 1988, 45, 55–62. [Google Scholar] [CrossRef]
  30. Smagorinsky, J. General Circulation Experiments with the Primitive Equations: I The Basic Experiment. Mon. Weather. Rev. 1962, 91, 99–164. [Google Scholar] [CrossRef]
  31. Niu, Q.; Xia, M. Wave climatology of Lake Erie based on an unstructured-grid wave model. Ocean Dyn. 2016, 66, 1271–1284. [Google Scholar] [CrossRef]
  32. Mao, M.; Xia, M. Dynamics of wave–current–surge interactions in Lake Michigan: A model comparison. Ocean Model. 2016, 110, 1–20. [Google Scholar] [CrossRef]
  33. Zhang, Y.; Chen, C.; Beardsley, R.C.; Perrie, W.; Lin, H. Applications of an unstructured grid surface wave model (FVCOM-SWAVE) to the Arctic Ocean: The interaction between ocean waves and sea ice. Ocean Model. 2019, 145, 101532. [Google Scholar] [CrossRef]
  34. Qi, J.; Chen, C.; Beardsley, R.C.; Perrie, W.; Lai, Z. An unstructured-grid finite-volume surface wave model (FVCOM-SWAVE): Implementation, validations and applications. Ocean Model. 2009, 28, 153–166. [Google Scholar] [CrossRef]
  35. Mellor, G.L.; Yamada, T. Development of a turbulence closure model for geophysical fluid problems. Rev. Geophys. 1982, 20, 851–875. [Google Scholar] [CrossRef]
  36. Terray, E.A.; Donelan, M.A.; Agrawal, Y.C.; Drennan, W.M.; Kahma, K.K.; Williams, A.J.; Hwang, P.A.; Kitaigorodskii, S.A. Estimates of Kinetic Energy Dissipation under Breaking Waves. J. Phys. Oceanogr. 1996, 26, 792–807. [Google Scholar] [CrossRef]
  37. Komen, G.J.; Cavaleri, L.; Donelan, M.; Hasselmann, K.; Hasselmann, S.; Janssen, P. Dynamics and Modelling of Ocean Waves. Dyn. Atmos. Ocean. 1994, 25, 276–278. [Google Scholar]
  38. Xiong, J.; Yu, F.; Fu, C. Evaluation and improvement of the ERA5 wind field in typhoon storm surge simulations. Appl. Ocean. Res. 2022, 118, 103000. [Google Scholar] [CrossRef]
  39. Zhai, R.; Huang, C.; Yang, W. Applicability evaluation of ERA5 wind and wave reanalysis data in the South China Sea. J. Oceanol. Limnol. 2023, 41, 495–517. [Google Scholar] [CrossRef]
  40. Wu, Z.; Zhang, Y.; Zheng, Z.H. Interaction of Cloud Dynamics and Microphysics during the Rapid Intensification of Super-Typhoon Nanmadol (2022) Based on Multi-Satellite Observations. Geophys. Res. Lett. 2023, 50, e2023GL104541. [Google Scholar] [CrossRef]
  41. Wang, Z. Stokes-Drift Effect on the Upper Ocean. Ph.D. Thesis, Ocean University of China, Qingdao, China, 2012. [Google Scholar]
  42. Lai, Q.-Z.; Wu, L.-G.; Xie, Z.-L. Sea Surface Temperature Response to Typhoon Morakot(2009) and Its Influence. J. Trop. Meteorol. 2015, 21, 111–120. [Google Scholar]
  43. Yin, K.; Xu, S.; Zhao, Q.; Zhang, N.; Li, M. Effects of sea surface warming and sea-level rise on tropical cyclone and inundation modeling at Shanghai coast. Nat. Hazards 2021, 109, 755–784. [Google Scholar] [CrossRef]
  44. Li, X.; Zhao, D.; Zou, Z. A numerical study of Stokes drift and thermal effects on the oceanic mixed layer. Acta Oceanol. Sin. 2020, 39, 39–49. [Google Scholar] [CrossRef]
  45. Chuanjiang, H.; Fangli, Q. Effects of horizontal mixing on the upper ocean temperature in the equatorial Pacific Ocean. Acta Oceanol. Sin. 2012, 31, 16–23. [Google Scholar]
  46. Yu, C.; Yang, Y.; Yin, X.; Sun, M.; Shi, Y. Impact of Enhanced Wave-Induced Mixing on the Ocean Upper Mixed Layer during Typhoon Nepartak in a Regional Model of the Northwest Pacific Ocean. Remote Sens. 2020, 12, 2808. [Google Scholar] [CrossRef]
  47. Price, J.F.; Weller, R.A.; Pinkel, R. Diurnal Cycling: Observations and Models of the Upper Ocean Response to Diurnal Heating, Cooling, and Wind Mixing. J. Geophys. Res. Ocean. JGR 1986, 91, 8411–8427. [Google Scholar] [CrossRef]
  48. Watanabe, M.; Hibiya, T. Global estimates of the wind-induced energy flux to inertial motions in the surface mixed layer. Geophys. Res. Lett. 2002, 29, 64-1–64-3. [Google Scholar] [CrossRef]
  49. Chen, Y.-J.; Xie, Q.; Meng, W.-G.; Yuan, J.-N.; Wang, X.-D. An Experiment Study on the Influence of Different Sea Surface Temperature on Typhoon Dujuan Over the South China Sea. J. Trop. Meteorol. 2009, 25, 401–406. [Google Scholar]
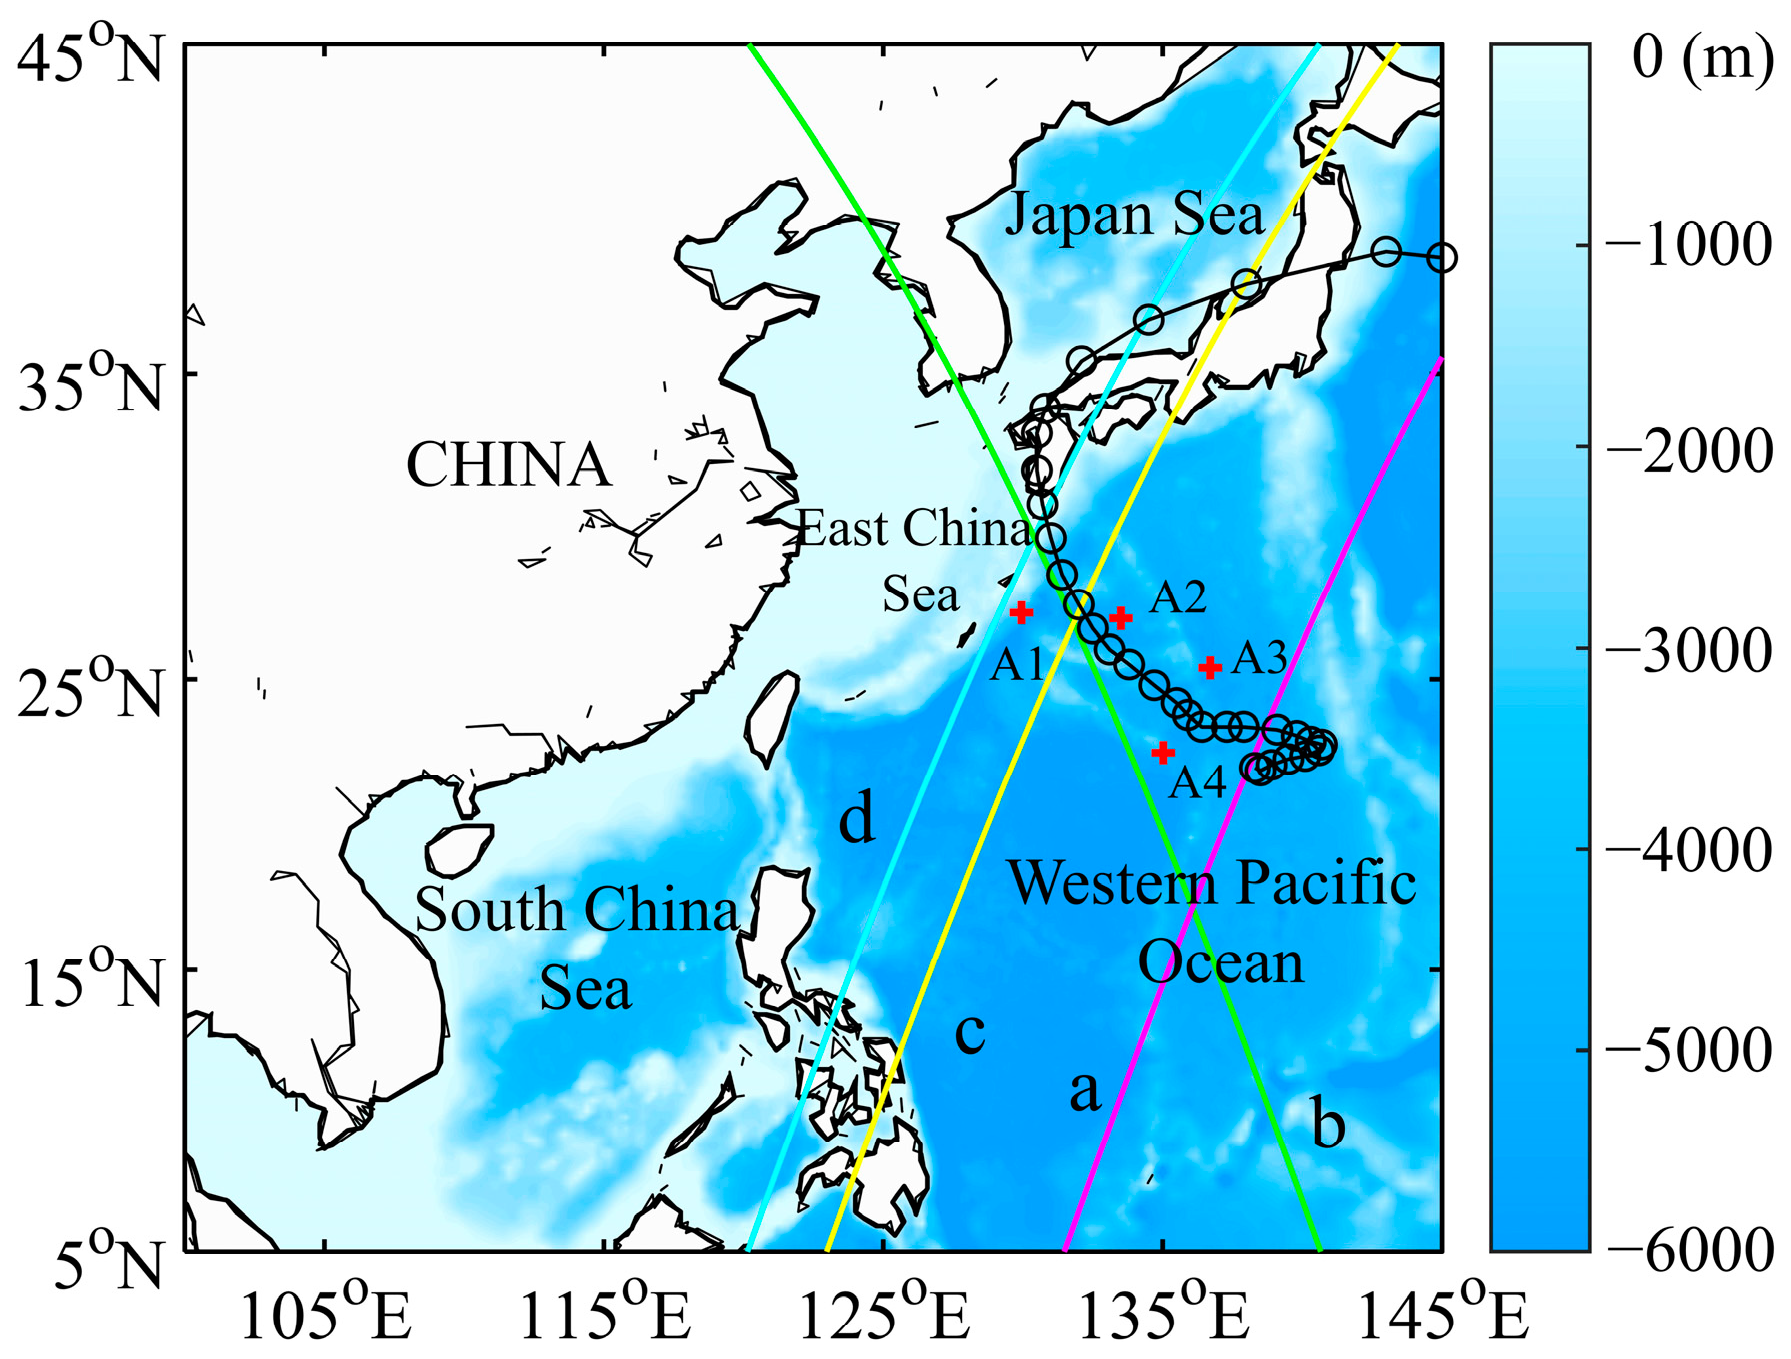
Figure 1. Location information of the Western Pacific region, water depth, typhoon track, and verification data: the illustrated area is the model range. (a–d) The four color lines are the paths of the Jason-3 satellite altimeter during the typhoon. (A1–A4) The red “+” indicates the location of the Argo buoy. The black “-o” line segment indicates the path of Typhoon Nanmadol, and the circle indicates the position of the typhoon every 6 h.
Remotesensing 16 03524 g001
Figure 2. The Western Pacific unstructured grid domain and model water depth information.
Remotesensing 16 03524 g002
Figure 3. Significant wave height (SWH) range affected by typhoon wind field; (ad) stand for 0 o’clock every day from September 16 to 19; the blue “-o” line segment indicates the path of Typhoon Nanmadol, and the circle indicates the position of the typhoon every 6 h.
Remotesensing 16 03524 g003
Figure 4. Comparison of simulated significant wave height (SWH) with satellite altimeter data; (ad) represent the four tracks passing through the typhoon area, corresponding to the four colored lines (a–d) in Figure 1.
Remotesensing 16 03524 g004
Figure 5. The intensity and distribution of turbulent kinetic energy of the sea surface at 0 o’clock every day, and each row represents three different schemes, respectively; the yellow line indicates the path the typhoon has passed and its current location.
Remotesensing 16 03524 g005
Figure 6. Comparison of sea surface turbulent kinetic energy (TKE) simulation results between wave age scheme and broken wave parameter R B scheme; the red line indicates the path the typhoon has passed and its current location.
Remotesensing 16 03524 g006
Figure 7. The vertical turbulent energy of the ocean changes with the intensity of Typhoon Nanmadol (typhoon (33 m/s), strong typhoon (48 m/s), and super typhoon (62 m/s)). The green circle and straight line in (ac) represent the TKE selected position and the direction of typhoon movement, respectively, and the curves in (df) represent the results of the three schemes, respectively.
Remotesensing 16 03524 g007
Figure 8. Sea surface temperature (SST) simulation results; (ad) indicates the change of sea surface temperature at the current position of typhoon; the blue line indicates the path the typhoon has passed and its current location.
Remotesensing 16 03524 g008
Figure 9. Difference between daily SST and pre-typhoon SST, (ad) represents the difference between the daily SST of the typhoon and that before the typhoon; the purple “-o” line segment indicates the path of Typhoon Nanmadol, and the circle indicates the position of the typhoon every 6 h.
Remotesensing 16 03524 g009
Figure 10. Comparison of simulated sea surface temperature between wave age parametric scheme and broken wave parameter R B scheme; the purple “-o” line segment indicates the path of Typhoon Nanmadol, and the circle indicates the position of the typhoon every 6 h.
Remotesensing 16 03524 g010
Figure 11. Comparison of sea surface temperature simulation results with OISST observation assimilation results; (a,b) represent the comparison between SST temperature and OISST temperature of wave age scheme and broken wave parameter scheme in typhoon region respectively.
Remotesensing 16 03524 g011
Figure 12. Simulation results of mixed layer temperature; (a,b) represent the cold pumping and heat pump effects of typhoon on the upper ocean, respectively; the dotted yellow line shows the boundary between the mixed layer and the thermocline.
Remotesensing 16 03524 g012
Figure 13. Comparison of vertical temperature simulation results with Argo floats’ data; (ad) denotes four different Argo float locations.
Remotesensing 16 03524 g013
Table 1. Comparison of significant wave height simulation values with satellite data.
TrackCORMAE (m)RMSE (m)
a0.850.220.50
b0.910.260.59
c0.920.120.23
d0.870.430.64
Average0.890.260.49
a–d represent the four satellite orbits.
Disclaimer/Publisher’s Note: The statements, opinions and data contained in all publications are solely those of the individual author(s) and contributor(s) and not of MDPI and/or the editor(s). MDPI and/or the editor(s) disclaim responsibility for any injury to people or property resulting from any ideas, methods, instructions or products referred to in the content.