Abstract
Synthetic aperture radar (SAR) simulation is a vital tool for planning SAR missions, interpreting SAR images, and extracting valuable information. SAR imaging is essential for analyzing sea scenes, and the accuracy of sea surface and scattering models is crucial for effective SAR simulations. Traditional methods typically employ empirical formulas to fit sea surface scattering, which are not closely aligned with the principles of electromagnetic scattering. This paper introduces a novel approach by constructing multiple sea surface models based on the Pierson–Moskowitz (P-M) sea spectrum, integrated with the stereo wave observation projection (SWOP) expansion function to thoroughly account for the influence of wave fluctuation characteristics on radar scattering. Utilizing the shooting and bouncing ray-physical optics (SBR-PO) method, which adheres to the principles of electromagnetic scattering, this study not only analyzes sea surface scattering characteristics under various sea conditions but also facilitates the computation of scattering coupling between multiple targets. By constructing detailed scattering distribution data, the method achieves high-precision SAR simulation results. The scattering model developed using the SBR-PO method provides a more nuanced description of sea surface scenes compared to traditional methods, achieving an optimal balance between efficiency and accuracy, thus significantly enhancing sea surface SAR imaging simulations.
1. Introduction
Synthetic aperture radar (SAR) imaging is extensively used in Earth observation, environmental monitoring, and military reconnaissance. It offers 24 h detection capabilities and operates effectively in the presence of clouds and fog, serving as a valuable complement to optical detection methods [1,2,3,4]. Robust SAR imaging simulation methods enable thorough testing and optimization before actual deployment, thereby reducing costs and risks while enhancing the performance and reliability of SAR systems. Sea surface SAR imaging typically operates in the X, L, and C bands [5]. Compared to optical methods, SAR imaging provides insights into the electromagnetic characteristics of the sea surface across different wavebands [6,7]. To achieve superior sea surface SAR imaging simulations, it is essential to establish an electromagnetic scattering model that adheres closely to the principles of electromagnetism.
Sea surface SAR imaging necessitates the development of an accurate sea surface scene model, which includes the representation of sea surface waves and ship models, as well as a radar echo generation method [8,9]. Several studies have addressed various aspects of sea surface SAR imaging, including the modeling of sea surfaces and ships, along with SAR imaging methodologies [10,11,12]. The initial step in SAR imaging of the sea surface involves creating a sea surface model. For over 150 years, the linear theory of sea surface gravity waves has been employed to describe ocean waves [13]. This model treats the sea surface as an inviscid, incompressible, and irrotational fluid, utilizing random phase superposition to describe the height of the irregular sea surface. The Pierson–Moscowitz (P-M) spectrum model is a dimensionless spectrum based on observational data from the North Atlantic collected between 1955 and 1960 [14,15]. It describes a fully developed, steady-state sea spectrum related to wind speed.
To accurately describe the scattering of the sea surface, various methods have been proposed. Both Bragg and non-Bragg scattering mechanisms, including those from breaking waves and specular reflection, have been studied [16,17,18]. A two-dimensional sea surface electromagnetic wave scattering calculation method was proposed in [19]. This method is based on the fundamental principles of electromagnetic scattering and employs an iterative approach to solve the multiple scattering problem of a two-dimensional medium sea surface. In 2006, Ye et al. utilized the Kirchhoff approximation-conjugate gradient (KA-CG) hybrid algorithm to study the scattering of the sea surface and targets, using KA-CG to simulate the rough surface and target, respectively, and iteratively calculating the coupling between the two [20,21]. In 2020, Dong et al. developed a hybrid algorithm that combines geometric optics-physical optics/physical theory of diffraction (GO-PO/PTD) with the capillary wave modification facet scattering model (CWMFSM) to calculate the composite scattering of the sea surface and ships and investigated its imaging [22].
In the study of sea surface SAR imaging, the sea surface model is often examined independently of the principles of electromagnetic scattering. Sea surface SAR imaging simulations typically rely on simplified scattering models [23,24,25], which do not account for multiple scattering interactions between the sea surface and the ship. Establishing a sea surface scattering model that aligns closely with electromagnetic principles presents several challenges, primarily due to the complexity of solving electromagnetic scattering in large-scale scenarios.
There are two main electromagnetic scattering algorithms for targets. The first is the full-wave simulation method, exemplified by the Method of Moments (MOM) [26] and the Multilevel Fast Multipole Method (MLFMM) [27]. The second is the high-frequency approximation method, which includes GO [28], PO [29,30], and their derivative methods [31]. Given the constraints of computational resources, using full-wave algorithms to calculate the scattering of sea surface scenes is impractical. Employing high-frequency approximation methods to solve sea surface scattering can effectively balance efficiency and accuracy.
PO has clear physical concepts and is easy to understand. It is an efficient method for calculating primary scattering on the target surface. The bouncing ray method (SBR) combined with GO is an effective means to calculate multiple scattering on the target surface. For scenes with numerous single-scattering events on the sea surface, PO is used for the solution. For scenes with coupled scattering between ships and the sea surface, SBR is used for the solution. Segmenting the scattering scene on the sea surface and selectively using SBR or PO based on the number of scattering events can further improve computational efficiency.
Based on the results of electromagnetic scattering solutions, constructing scattering distribution data can achieve better SAR imaging simulation results. Compared with the SAR image obtained by simulating the target using the scattering center method, this method better reflects the characteristics of the target.
In this paper, we construct detailed sea surface scenes and integrate them with electromagnetic scattering calculation methods. This approach allows us to analyze the scattering properties of sea surface scenes under various conditions. By employing SBR-PO, a hybrid accelerated high-frequency electromagnetic scattering algorithm [32,33,34], accurate scattering results for large-scale scenes can be achieved with relatively low computational costs. The variations in the scattering characteristics of the sea surface are examined with respect to different frequencies, polarizations, incident angles, and other factors of electromagnetic waves. Scattering distribution data are constructed to fully represent the details of sea targets.
The main contributions of this study can be summarized as follows:
- In combination with the SWAP directional extension function, the sea surface model based on the P-M spectrum is established, accounting for sea surface wave fluctuations under different wind speeds.
- The SBR-PO method is utilized to perform the scattering calculations for multiple composite targets on the sea surface. The fundamental principles of sea surface scattering are investigated, along with the scattering characteristics under various sea surface conditions and electromagnetic incidence scenarios.
- Using the scattering simulation results, SAR imaging of composite targets, including the sea surface, ships, and interference, is conducted. The influence of various factors on composite scattering is also analyzed.
The remainder of this paper is organized as follows. Section 2 constructs a sea surface model, considers the sea surface fluctuation characteristics under different wind conditions, and introduces the sea surface scattering computation method for composite targets. Section 3 constructs various sea surface scattering scenarios, ranging from simple to complex, and uses the SBR-PO method to analyze the scattering characteristics of these different scenarios in detail. Section 4 presents the high-precision SAR imaging simulation using the sea surface scattering simulation results and analyzes the imaging outcomes. Section 5 provides a discussion, and Section 6 presents the conclusions of this paper.
2. Computation of Composite Target Scattering on the Sea Surface
The scattering computation requires the construction of a sea surface model and the application of an accurate electromagnetic scattering calculation method. The construction of the sea surface model must account for the complex reality and the presence of wave fluctuation characteristics. Unlike empirical methods that fit electromagnetic scattering data, the electromagnetic scattering calculation method fully considers the propagation process of electromagnetic waves and enables the coupling analysis of different targets on the sea surface.
2.1. Construction of Sea Surface Geometry Model
Before performing scattering calculations on the composite scene of the sea surface, sea surface modeling must be performed first. The sea spectrum is one of the basic methods for sea surface modeling. It is a power spectrum that reflects the frequency distribution of wave energy. The sea spectrum is usually obtained through experiments. Then, using the obtained sea spectrum, the spectrum correlation theory can be applied to extract the required sea surface parameters and reconstruct the sea surface model.
The P-M spectrum is introduced, and then the directional spectrum is constructed in combination with the stereo wave observation projection (SWOP) directional spread function [35,36]. It reflects the distribution of wave energy with respect to frequency and direction, and the parameters required for each unit wave are extracted from the directional spectrum to reconstruct the sea surface geometry model.
The P-M spectrum is an empirical ocean spectrum established by Pierson and Moskowitz. The data used for this spectrum are based on Moskowitz’s records of wind waves in the fully developed sea state after several hours of wind blowing over an unlimited fetch in the North Atlantic. It is a wave spectrum with wind speed as the parameter. The spectrum expression is
where , g is the gravity acceleration, , and U is the average wind speed at a height of 19.5 m above the sea surface. is the ocean spectrum angular frequency, and its relationship with the ocean wave number K is
where is a physical quantity related to seawater density and sea surface tension, and its calculated value is 3.63 rad/cm. Based on the relationship between the angular frequency and the wave number K in the above formula, (1) can be rewritten as
Figure 1 shows the characteristic curve of the above P-M spectrum as the wave number K changes under four different wind speed conditions.
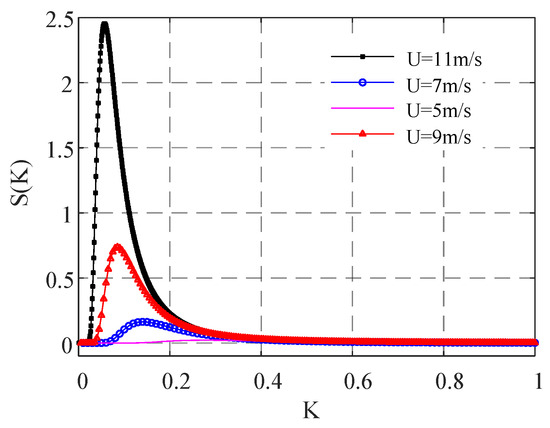
Figure 1.
P-M spectrum at different wind speeds.
As can be seen in Figure 1, the trend of changing with K is the same at different wind speeds. As K increases, shows a trend of increasing first and then decreasing, and there is a peak value in the sea spectrum. Among all the harmonics used to construct the sea surface, the wave energy represented by the wave number corresponding to the sea spectrum peak is the largest. As shown in Figure 1, the greater the wind speed, the higher the sea spectrum peak, which moves in the direction of smaller K. K is proportional to the frequency, indicating that the spectrum energy moves toward the low-frequency direction, while the wavelength is inversely proportional to the frequency. Therefore, the greater the wind speed, the more the spectrum energy moves toward the low frequency, and the sea surface is more composed of long-wavelength waves, showing a large waveform; the smaller the wind speed, the more the spectrum energy moves toward the high frequency, and the sea surface is more composed of short-wavelength waves.
The directional spectrum is constructed by combining the SWOP directional expansion function. The directional spectrum reflects the distribution of wave energy with respect to frequency and direction, and a more realistic sea surface model related to wind direction and wind speed can be obtained based on it. The constructed directional spectrum expression is as follows:
where is the wind direction. The expression of is as follows:
where is the peak frequency of the spectrum.
Based on the directional spectrum function, the sea surface model is obtained by linear superposition. Figure 2 shows a 3D sea surface, where the ups and downs of the sea surface can be clearly seen. Figure 3 presents several sea surface simulation diagrams under different wind speeds and directions. It can be clearly observed that as the wind speed decreases, the height of sea surface fluctuations diminishes, resulting in a relatively calm state characterized by dense small waves. Conversely, as the wind speed increases, the height of sea surface fluctuations rises, and the sea surface gradually transitions into a state characterized by larger waves.
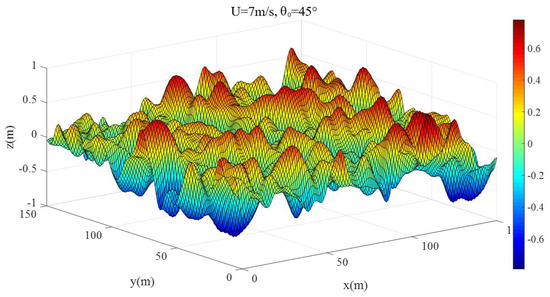
Figure 2.
Three-dimensional sea surface simulation diagram.
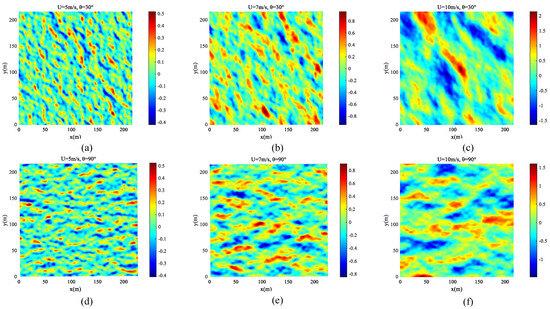
Figure 3.
Schematic diagram of sea surface simulation at different wind speeds and directions. (a) the wind speed is 5 m/s, and the wind direction is 30°; (b) the wind speed is 7 m/s, and the wind direction is 30°; (c) the wind speed is 10 m/s, and the wind direction is 30°; (d) the wind speed is 5 m/s, and the wind direction is 90°; (e) the wind speed is 7 m/s, and the wind direction is 90°; (f) the wind speed is 10 m/s, and the wind direction is 90°.
2.2. Computation of Composite Target Scattering on the Sea Surface
Introducing an electromagnetic computation method to accurately describe the scattering behavior of the sea surface is a challenging task. This paper adopts the SBR-PO method, an approximate electromagnetic scattering approach that combines the strengths of both SBR and PO. This combination makes SBR-PO particularly suitable for large-scale scene scattering computations. When dealing with electrically large targets, the method effectively balances efficiency and accuracy.
SBR is based on ray-tube tracing and integration, eliminating integration errors typically caused by inconsistent segmentation accuracy between the sea surface and targets. As a comprehensive forward-tracing algorithm, SBR can account for all scattering paths within a predefined reflection threshold without the need for dividing the coupling path. However, traditional SBR faces a significant challenge in the computational demands of tracking an enormous number of ray tubes, resulting in slow calculations.
To address this, we utilized a tree-like acceleration data structure and a virtual ray-tube acceleration algorithm, leveraging the powerful computing capabilities of GPUs. These enhancements significantly improved the calculation speed of SBR. For instance, the single-angle calculation time for a composite scene of a 300 m sea surface and a 170 m complex ship in the C band is approximately 80 s, demonstrating impressive computational efficiency.
Despite these advancements, single SBR has limitations, particularly in sea surface simulations. The dense ray tubes generated by SBR are often unnecessary for numerous single scattering events. To optimize the simulation of composite scenes, SBR can be effectively combined with the PO method, reducing redundancy and improving overall computational efficiency.
As shown in Figure 4, the electromagnetic scattering of the sea surface and target composite scene can be roughly divided into the following six categories:

Figure 4.
Schematic diagram of the scattering path of composite targets on the sea surface.
- Single scattering by target;
- Single scattering by sea surface;
- Multiple scattering by target;
- Multiple scattering by sea surface;
- Coupled scattering between the sea surface and target;
- Coupled scattering between the target and target.
The six types of scattering paths can be categorized into four primary types of scattering, as described below.
Target Self-Scattering (): This refers to the scattering from a single target that is only related to itself, including both single and multiple scattering events, corresponding to paths 1 and 3. For multiple ship targets in a sea surface composite scene, target self-scattering is the sum of the individual scattering from each target, excluding any inter-target scattering.
Sea Surface Self-Scattering (): This encompasses scattering from the sea surface that is not coupled with any other object, including both single and multiple scattering events on the sea surface itself, corresponding to paths 2 and 4.
Coupled Scattering Between the Sea Surface and Targets (): This involves the coupled scattering related to the interaction between the sea surface and the targets. It includes the coupled fields involving the sea surface and multiple targets, represented by the sum of the scattering fields obtained after rays are reflected by the sea surface or several targets in any order, corresponding to path 5.
Coupled Scattering Between Targets (): This refers to the scattering that involves at least two different targets without any interaction with the sea surface, corresponding to path 6.
By distinguishing these types of scattering, we can better analyze and understand the complex interactions within the sea surface composite scene, leading to more accurate modeling and simulation of scattering phenomena.
According to the scattering conditions of different parts of the sea surface, PO is used to calculate the single scattering of the target. For the calculation of multiple scattering, SBR is used. Depending on the actual situation, the accuracy of the model can be further optimized. The electromagnetic calculation method is mainly used to accurately understand the scattering characteristics of the target and to lay the foundation for the scattering of complex sea surface scenes later. This paper combines SBR with PO. First, the composite geometric model is divided into single scattering and multiple scattering regions, and scattering solutions are obtained using PO and SBR, respectively. In this way, the efficiency of the scattering solution can be greatly improved, and the propagation behavior of electromagnetic waves in space can be understood.
As shown in Figure 5a, taking the composite scene where electromagnetic waves are incident from the left side of the ship at an angle of 30° as an example, the simulation time for the blanking and ray-tracing components is compared. Additionally, the related variables of the SBR and SBR-PO algorithms are compared in the accompanying table to illustrate the theoretical and computational efficiency improvements of the SBR-PO method.

Figure 5.
Sea surface–single ship scattering model. (a) Schematic diagram of the sea surface–single ship composite scenario model. (b) Ship size.
For this scenario, with seawater parameters of tan , which represents the loss tangent, and , the relative permittivity, these values are consistently used in subsequent analyses. The ship’s dimensions are shown in Figure 5b. The operating frequency is 5 GHz, and horizontal-horizontal (HH) polarization is used. As previously discussed, ray tracing is the primary source of time consumption in the SBR algorithm, with the ray-tracing time almost entirely determining the total CPU time of SBR. Therefore, by employing the PO method to calculate single scattering on the sea surface and reducing the number of SBR ray tubes, the algorithm’s efficiency can be significantly improved.
As demonstrated by the comparison of the two algorithms in Table 1, the combined use of the PO method reduces the number of ray tubes by 94.7%, leading to a corresponding increase in overall CPU calculation speed. Moreover, by implementing the CUDA parallel algorithm design [37,38,39], PO blanking and SBR ray tracing are executed on the GPU, which substantially enhances operational efficiency and reduces the simulation time for sea surface scenes at a single angle to approximately half a minute.

Table 1.
Comparison of algorithm running times.
3. Composite Scattering Calculation and Analysis
To understand the scattering characteristics of a composite scene comprising a sea surface and a ship, scattering calculations and analyses are first conducted on a model combining a flat plate and a cube. This initial analysis aims to examine the variation in scattered fields across different parts of the model. Following this, factors influencing scattering from the sea surface and a single ship are explored through analogy. The effect of varying distances between multiple ships on the scattering characteristics in a composite sea surface–multiple-ship scenario is then calculated and analyzed. Finally, the scattering distribution in a sea surface–ship-corner reflector interference scenario at various angles is evaluated. The radar cross-section (RCS) is used as the metric for measuring scattering intensity [40].
3.1. Plate–Cube Combined Scattering Model
The composite scattering of a square plate and a cube is presented in Figure 6a. The radar operates at a frequency of 10 GHz with HH polarization. This combined model is used as a simplified representation of a single ship and sea surface composite scene. The total scattering field is divided into three components: the plate, the cube, and the cube–plate coupling field. The scattering fields of these components are analyzed separately, and the RCS curve trend for each part is examined as the incident wave angle changes. This analysis provides a theoretical foundation for understanding sea surface–ship scattering using a simplified model.
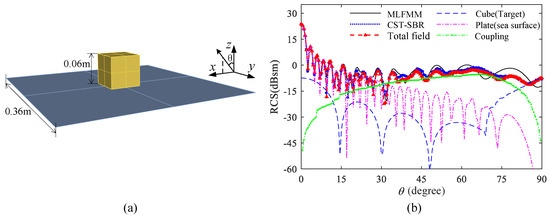
Figure 6.
Plate–cube combined scattering model. (a) Schematic diagram of the flat plate–cube composite scene model. (b) Composite scattering field of the combined model under different incident wave angles .
Figure 6b illustrates the total scattering field, plate scattering field, cube scattering field, and coupled field of the composite model as varies, with an incident azimuth angle of 0°. The total field RCS curve obtained using the SBR-PO method shows a good fit with the calculation results from SBR incorporated into the commercial software CST Microwave Studio. Additionally, both sets of results are in good agreement with the numerical solution obtained from the MLFMM. These findings confirm that the SBR-PO method is suitable for composite scattering calculations.
From the changes observed in the scattering curves of each component in Figure 6b, it is evident that both the plate–cube coupling field and the cube (target) field exhibit noticeable inflection points around 68.2°. To further understand this behavior, we analyze the geometric structure characteristics of the composite model, as shown in Figure 7. By comparing Figure 7b,c, which correspond to the inflection point (only the incident light related to the cube is shown), we provide a detailed analysis of the scattering behavior of the composite model.
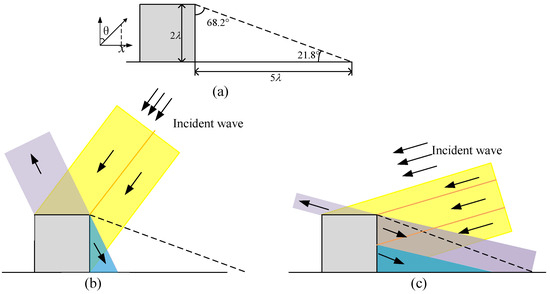
Figure 7.
Composite scattering field of the combined model under different incident wave angles . (a) Schematic diagram of the scattering corner. (b) The incident wave is divided into two parts. (c) The incident wave is divided into three parts.
The scattering behavior of the composite model can be summarized as follows:
- The scattering field of the flat plate generally exhibits the characteristics of a single flat plate as changes. However, due to the obstruction by the cube, discrepancies from the single flat plate scattering characteristics occur at certain angles.
- When 68.2°, the incident wave is divided into two parts. One part irradiates the upper surface of the cube and then is emitted, corresponding to the cube scattering component. The other part irradiates the side surface of the cube, is completely reflected on the flat plate, and then is emitted, corresponding to the cube-flat plate coupled scattering component. Therefore, when 68.2°, as increases, the coupled scattering exhibits dihedral scattering characteristics and gradually increases, while the cube scattering presents flat plate scattering characteristics, with its contribution coming from the upper surface of the cube.
- When 68.2°, the incident wave is divided into three parts. One part continues to irradiate the upper surface of the cube and is emitted, corresponding to the cube scattering component. The incident wave irradiating the side surface of the cube can be further divided into two parts: one part is reflected on the flat plate and then is emitted, corresponding to the cube–flat plate-coupled scattering component, and the other part is reflected and directly emitted, corresponding to another cube scattering component. Therefore, when 68.2°, as increases, the coupled scattering gradually decreases, while the cube scattering gradually increases. At this point, the scattering contribution comes not only from the upper surface of the cube but also from a portion of the side surface of the cube.
3.2. Sea Surface–Single Ship Scattering Model
The scattering of the composite scene, as depicted in Figure 5a, is calculated and analyzed. The appearance and size of the ship are shown in Figure 5b, with the x-axis oriented toward the bow. For this composite scene, the total scattering field is divided into three components: the sea surface, the ship, and the ship–sea surface coupling field. By analyzing the scattering fields of these components, the influence of various factors on the monostatic scattering of the composite target model is investigated using the SBR-PO method.
The two graphs in Figure 8 depict the curves of the total scattering field, sea surface scattering field, ship scattering field, and the coupled field of the composite scene as the angle changes for incident azimuth angles 0° and 90°.
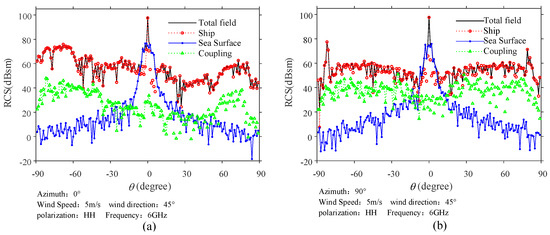
Figure 8.
Scattering field of the composite scene at different incident wave azimuths. (a) The azimuth is 0°. (b) The azimuth is 90°.
- The sea surface scattering field exhibits good symmetry with the change in angle , generally following a trend similar to the scattering characteristics of the flat plate. As changes, the sea surface scattering significantly varies, peaking at normal incidence. As the direction deviates from normal incidence, the sea surface scattering field gradually weakens.
- The ship scattering field shows a degree of symmetry when 90°, attributed to the bilateral symmetry of the ship’s structure, with minor differences in details. It is not symmetrical when 0° because as changes from 90° to 0°, the incident wave transitions from the stern to the top of the ship. During this transition, several large dihedral-like structures or grooves on the hull generate significant multiple scattered field values. When changes from 0° to 90°, the incident wave shifts from the top of the ship to the bow, where the hull structure is more complex and the dihedral-like structures are less regular, resulting in a reduced overall scattering value.
- The fluctuation of the total field is determined by the combined contributions of the sea surface, the ship, and the coupled fields. However, due to the strong scattering from the ship, the total field fluctuation is primarily influenced by the ship’s scattering at most angles. Only within a small angle range near normal incidence ( 0°) does the sea surface scattering become more pronounced, causing the total field fluctuation to follow the sea surface scattering.
- The analysis of sea surface–ship scattering can be informed by the example of plate–cube scattering. When 90°, the incident wave deviates from the normal incidence angle of the sea surface. As increases, the coupled scattering initially increases and then decreases. The coupled scattering caused by the large-scale dihedral-like structure formed by the sea surface and the ship hull gradually intensifies. Near the angle close to grazing incidence on the sea surface, the coupled scattering intensity weakens. Similarly, when 0°, the coupled field generally shows a trend of first increasing and then decreasing as the incident wave transitions from normal incidence to grazing incidence. However, since the dihedral-like structure formed by the front and rear hulls of the ship and the sea surface is smaller than that formed by the left and right hulls of the ship and the sea surface, and the front and rear of the ship are not symmetrical, the coupled field lacks symmetry and has a smaller overall value compared to when 90°.
3.2.1. Effects of Different Sea Surface Wind Speeds on Composite Scattering
Figure 9 presents the average scattered field values derived from simulations using five randomly selected sea surface models. The four sub-graphs are the composite scattering field variation curves corresponding to wind speeds U of 5, 7, and 10 m/s at a fixed azimuth angle of 90°, and the curves of the coupling field changing with the angle at different wind speeds. The constant value lines in Figure 9d are the mean lines of the same type of curves, and the mean lines drawn in subsequent figures all have this meaning.
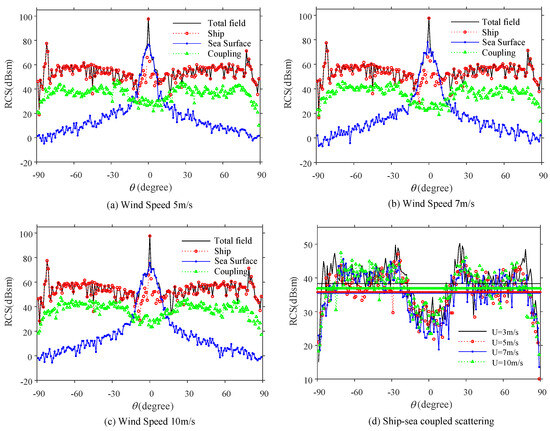
Figure 9.
Scattering field of the composite scene under different sea surface wind speeds. (a) The wind speed is 5 m/s. (b) The wind speed is 7 m/s. (c) The wind speed is 10 m/s. (d) The ship–sea coupled scatting.
The effects of different sea surface wind speeds on composite scattering can be described as follows:
- Ship Scattering: Ship scattering is independent of the sea surface wind speed; it essentially does not change under different wind speeds.
- Sea Surface Scattering: The sea surface scattering under different wind speeds has the same trend as the change in . When the incident wave changes from normal incidence to grazing incidence, it presents a gradually decreasing flat-plate scattering characteristic. Near the normal incidence sea surface angle, the sea surface mirror scattering is strong. With the increase in wind speed, the undulation of the sea surface gradually increases, and the peak range near the normal incidence angle is slightly widened. However, as the angle increases further, the undulating sea surface almost no longer has mirror conditions for the incident wave, and the overall law of sea surface scattering at different wind speeds tends to be consistent.
- Coupled Scattering: The corresponding RCS values are 38.3, 35.8, 35.5, and 36.9 dBsm when the wind speeds U are 3, 5, 7, and 10 m/s, respectively. Among them, when m/s, the coupled scattering is the strongest. With the increase in wind speed, the coupled scattering tends to decrease, but it is not strictly decreasing. This is because the coupled scattering is a multiple scattering field generated by the dihedral structure composed of the sea surface and the ship hull. The sea surface corresponding to the small wind speed is relatively stable, and the sea surface is in a low-undulation and small wave shape, which can make the incident wave have more stable multiple scattering between the ship and the sea surface, thereby obtaining a stronger coupling field. The sea surface corresponding to the larger wind speed is more violent, and the sea surface is in a large wave shape, making the multiple scattering of the incident wave between the ship and the sea surface unstable. Therefore, when the wind speed is small, the sea surface area is stable and the coupling is strong. When the wind speed increases, the sea surface area fluctuates violently, and the coupling is unstable. The change law of the coupling field with the wind speed is not significant.
- Total Field: The total field fluctuation is determined by the sea surface, the ship, and the coupled field. At most angles, the total field fluctuation is consistent with the ship’s target scattering field fluctuation. In the small angle range of normal incidence on the sea surface, the total field fluctuation is related to the fluctuation of the sea surface scattering field. For different wind speeds, the ship scattering is essentially unaffected, and the peak angle of the sea surface near the normal incidence angle slightly widens with the increase in wind speed. Therefore, changes in the total field are mainly observed near the angle range of 0°.
3.2.2. The Influence of Different Sea Surface Wind Angles on Composite Scattering
The change in the sea surface wind direction angle results in varying sea surface textures, primarily affecting sea surface scattering and the coupled scattering field, and consequently influencing the total field of the composite scene. Since this study focuses on the impact of the sea surface on composite scattering, to minimize the error caused by the randomness of the sea surface, five different sea surface models are randomly selected. Figure 10 presents the curves of the composite scene under three different wind directions, illustrating the variation in each scattering field with the angle .
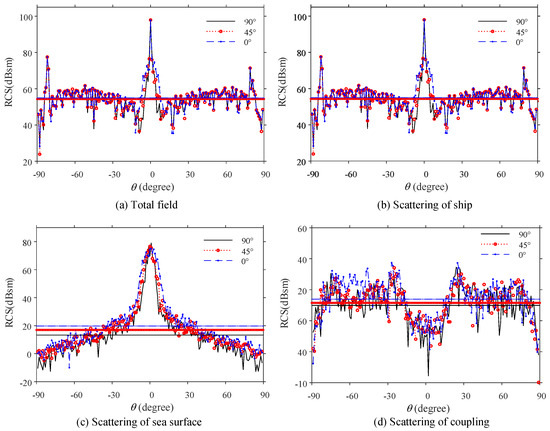
Figure 10.
Scattering field of the composite scene under different sea surface wind angles. (a) Total field. (b) Scattering of a ship. (c) Scattering of the sea surface. (d) Scattering of coupling.
As seen in Figure 10, the ship scattering values corresponding to wind direction angles of 0°, 45°, and 90° relative to the incident wave are generally consistent. The average values of the sea surface scattering field are 19.8, 16.9, and 13.3, respectively, while the average values of the coupled scattering field are 36.9, 35.8, and 34.9, respectively. Overall, the sea surface and coupled scattering tend to increase as the angle between the wind direction and the incident wave decreases. However, as noted in previous analyses, variations in sea surface and coupled scattering have a minimal impact on the total field and do not significantly affect its overall behavior. Only within the small angle range near normal incidence on the sea surface does the sea surface scattering significantly influence the total field. The smaller the angle between the wind direction and the incident wave, the more aligned the surface element orientation, caused by wave fluctuations, becomes with the incident wave. This alignment broadens the peak angle range of the sea surface when the incident wave is normally incident. As a result, the overall sea surface scattering is stronger at larger angles, which is reflected in the total field as a widening of the peak when the incident wave is normally incident on the sea surface.
3.2.3. Effects of Different Incident Wave Polarization Modes and Frequencies on Composite Scattering
From the above analysis, it is evident that the magnitude of the total field and the fluctuation trend of the curve with angle changes are primarily determined by the scattering field intensity of the ship. The sea surface has a significant impact only within a small angle range where the electromagnetic wave is incident on the sea surface. This indicates that the sea surface and coupled scattering are not the main sources of radar-received energy. Consequently, the following section provides an analysis of the changes in the total field under different polarizations and frequencies.
As shown in Figure 11, the total scattered field varies with the angle under different polarization modes when the incident wave originates from two different azimuth angles. The figure indicates that the polarization mode has a minimal effect on the composite scattering of the sea surface and the ship, with HH polarization being slightly greater than vertical-vertical (VV) polarization. Figure 12 demonstrates that the scattering intensity of the composite scene increases with the frequency. From the above analysis, it is evident that the total field intensity is primarily influenced by the ship, whose scattering mechanism mainly consists of surface scattering and multiple scattering. This includes single-surface scattering and multiple-surface scattering caused by quasi-dihedral and quasi-trihedral angles. The scattering intensity of these mechanisms is inversely proportional to the wavelength or to a power of the wavelength. Therefore, as the frequency increases, the scattering intensity of the composite scene correspondingly increases.
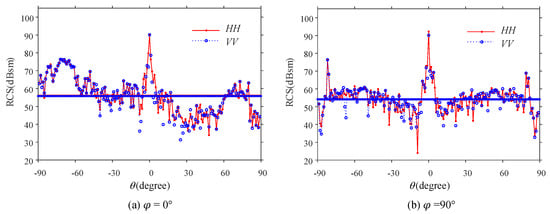
Figure 11.
Scattering field of the composite scene under different incident wave polarization modes. (a) The azimuth is 0°. (b) The azimuth is 90°.
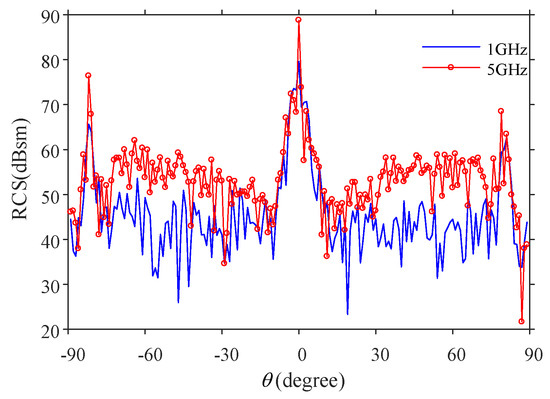
Figure 12.
Scattering field of the composite scene with different incident wave frequencies.
3.3. Sea Surface–Multiple Ships Scattering Model
This subsection calculates and analyzes the scattering of a composite scene consisting of a sea surface and two ships. The model schematic is shown in Figure 13a. For the composite scene of multiple ships and the sea surface, the total scattering field can be divided into four parts: the sea surface scattering field, the ship scattering field, the ship–sea surface coupling field, and the ship–ship coupling field.

Figure 13.
Multiple ships scattering model. (a) Schematic diagram of sea surface–multi-ship composite scene model. (b) Schematic diagram of the relative positions of two ships.
The previous subsection focused on the composite scattering analysis of a single ship and the sea surface. This subsection calculates and analyzes the monostatic scattering of the sea surface–multi-ship model using the SBR-PO method, primarily examining the influence of the lateral and longitudinal spacing between ships on the ship–ship coupling scattering. The basic parameters for the multi-ship simulation are as follows: incident wave frequency of 4.2 GHz, HH polarization, azimuth angle fixed at 90°, sea surface wind speed of 5 m/s, and wind direction angle of 45°.
As shown in Figure 13b, the following electromagnetic simulation and analysis are performed on the scattering components of the sea surface–multi-ship composite scenes constructed with two configurations: ships side by side ( m) and ships not side by side ( m) with different left–right spacings () between ships.
The scattering results for two configurations, side-by-side ( 0 m) and non-side-by-side with a front-to-back spacing of 100 m ( 100 m) between the two ships, are compared in Figure 14 and Figure 15. Figure 14 illustrates the variation in scattering as a function of the angle , with relative position relationships of 80 m and 120 m for side-by-side and non-side-by-side configurations. Figure 15 presents a curve and average comparison of the coupled scattering between ships at three different left–right spacings. Based on these sea–two-ship scattering results, the following observations can be made:
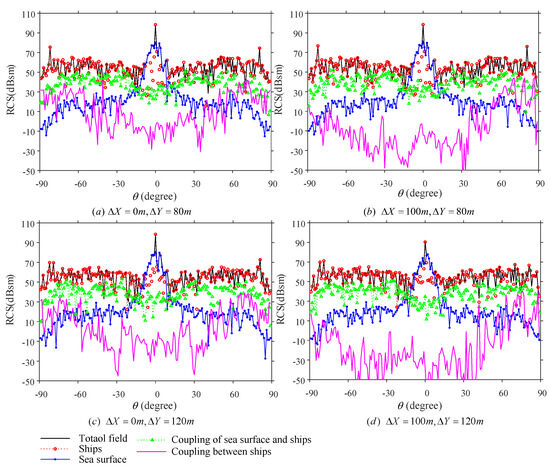
Figure 14.
Monostatic scattering of ships at different left and right distances in the sea surface–two-ship composite scene. (a) , . (b) , . (c) , . (d) , .
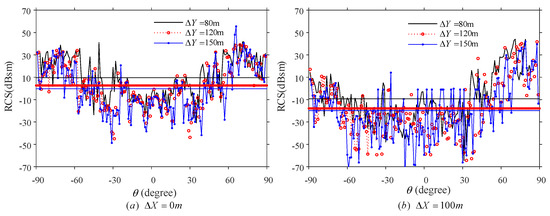
Figure 15.
Ship–ship coupled scattering in the composite scene of the sea surface and two ships. (a) 0 m. (b) 100 m.
- Sea Surface and Ship Scattering: There is no significant change with varying distances between the two ships. The scattering field’s variation with the angle exhibits good symmetry.
- Coupled Scattering: The coupled scattering of the ships is similar to that of the sea surface–single ship interaction. Near the angles of normal incidence ( 0°) and grazing incidence (90°) of the electromagnetic wave on the sea surface, the coupled scattering is weak. At other angles, numerous rays propagate between the sea surface and the ship, resulting in strong coupled scattering. Similar to the plate–cube coupled scattering, when the electromagnetic wave changes from 0° to 90°, the coupled scattering between the ship and the sea surface first increases and then decreases.
- Ship–Ship Coupling: As shown in Figure 15, the inter-ship coupling scattering values for side-by-side ships at left–right spacings of 80 m, 120 m, and 150 m are 9.6, 2.6, and −0.3, respectively. For non-side-by-side ships, the inter-ship coupling scattering values are −8.3, −17.9, and −19.8, respectively. This indicates that the coupling between the two ships weakens significantly as the left–right spacing increases. The coupling field between the ships shows a pronounced fluctuation with the angle, essentially forming a “V” shape, determined by the sea surface–ship composite model structure. At angles near grazing incidence (90°), the inter-ship coupling scattering is strong, with many rays reflected from one ship to the other. Starting from 70° and decreasing to 0°, the inter-ship coupling scattering significantly decreases, as most rays reflect off the sea surface after reaching one of the ships. At normal incidence ( 0°), the coupling scattering between the ships is the weakest near 0°, with only a few rays contributing to the scattering field due to reflections in the groove structure formed by the two ships. As the distance between the ships increases, the coupling effect diminishes at certain angles near normal incidence. For non-side-by-side ships, the coupling scattering does not exhibit good symmetry with angle changes. The coupling scattering is significantly stronger when changes from 60° to 90°, compared to when it changes from 90° to 60°, due to the ship’s structure. Electromagnetic waves incident on the left front side of the rear ship are more likely to reach the other ship, resulting in stronger coupling scattering in this range. Overall, the magnitude of the inter-ship coupling is small and has a minimal impact on the total scattering trend.
3.4. Distribution Scattering Data Construction
Scattering distribution data refers to dividing the entire scene into scattering cube units, summing the scattering contribution in each unit as the scattering intensity of the scattering unit, and summing the intensities of all scattering units as the scattering intensity of the target under the current parameters. Conversely, it can be understood as dispersing the target scattering intensity into each divided scattering unit. Scattering distribution data can more intuitively show the distribution characteristics of the scattering intensity and provide raw data for SAR imaging.
A composite scenario comprising the sea surface, ship, and corner reflector interference is modeled, and the corresponding scattering distribution data are generated. The schematic diagram of the composite model is shown in Figure 16a. The shape and size information of the ship is provided in Figure 16b. Three icosahedron corner reflectors are grouped to form a corner reflector string, with these strings positioned at the left rear and right front of the ship. All six corner reflectors are identical in size and structure, each with a maximum dimension of 3 m. They have different floating postures and are made of metal material. When electromagnetic waves strike the surfaces of the corner reflectors, they produce strong scattering due to multiple reflections, which contributes to the overall interference.

Figure 16.
Sea surface–ship-interference model. (a) Schematic diagram of the sea surface–ship-interference composite scenario model. (b) Ship size.
To more intuitively visualize the distribution of the scattering intensity, this subsection integrates the scattering unit intensity in the z-direction to produce a two-dimensional scattering distribution map. This simplification aids in the visualization, but it should be noted that three-dimensional scattering distribution data are used for actual imaging applications. The simulation parameters are set as follows: the incident wave frequency is 6 GHz, with HH polarization, and the angle is fixed at 45°. The sea surface wind speed U is 5 m/s with a wind direction angle of 45°, matching the incident wave direction. These incident wave directions are illustrated with thick arrows in the left figure of each diagram, providing a clear guide to the azimuths of incidence.
As depicted in Figure 17, the six corner reflectors consistently produce strong scattering at all azimuth angles. The following observations can be made:
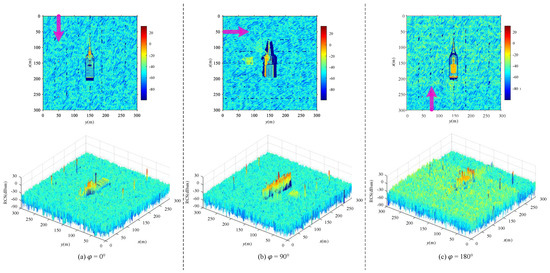
Figure 17.
Composite scene scattering distribution when the incident wave azimuth angles are 0°, 90°, and 180°. (a) The azimuth is 0°. (b) The azimuth is 90°. (c) The azimuth is 180°.
- In Figure 17a, when the incident wave approaches from the bow (the azimuth is 0°), strong scattering is observed not only at the corner reflectors but also at the ship’s front. This scattering is attributed to the intense scattering from the ship’s superstructure and the multiple scatterings caused by the dihedral angle formed between the superstructure and the front deck. Notably, there is a scattering-free dark area at the stern, resulting from the ship obstructing this region.
- In Figure 17b, when the incident wave comes from the left side (the azimuth is 90°), the quasi-dihedral structure formed between the ship’s left side and the adjacent sea surface results in strong scattering on the ship’s left side. This is primarily due to the initial strong scattering from the entire left-side hull and the subsequent multiple scatterings caused by reflections from the sea surface to the ship’s side. A relatively strong scattering area emerges on the sea surface in front of and to the left of the ship, facilitated by the quasi-dihedral structure between the ship and the sea surface that reflects rays from the ship to the sea surface. Given the hull’s inclination on the left bow, the two intense scattering zones are separate but are positioned close to the ship on the sea surface: in front of and to the left.
- As shown in Figure 17c, when the incident wave is directed at the stern (the azimuth is 180°), the stern and nearby sea surface form a quasi-dihedral structure, leading to a scattering pattern similar to that at a 90° azimuth. The line of strong scattering at the stern is mainly due to the primary scattering off the stern and multiple scatterings from rays incident on the sea surface and then reflected back to the stern. A strong scattering area appears directly behind the ship on the sea surface, caused by the quasi-dihedral structure between the ship and the sea surface, reflecting rays from the stern hull back onto the sea surface. Additionally, a significant scattering area on the middle and rear of the ship, similar to the 0° azimuth scenario, results from multiple intense scatterings created by the quasi-dihedral formed between the ship’s superstructure and the rear deck.
As depicted in Figure 18, the scattering distribution is consistent when the incident waves come from azimuth angles of 45° and 225°. The six corner reflectors yield strong scattering, and there is notable strong scattering on the ship’s surface. Additionally, several intense scattering zones appear in the sea near the ship. This strong scattering on the ship’s surface, as previously analyzed, primarily results from primary scattering off the ship’s hull and the multiple scattering caused by rays incident on the sea surface and reflecting off the hull. The positions of these scattering zones shift with the changing incident angle.
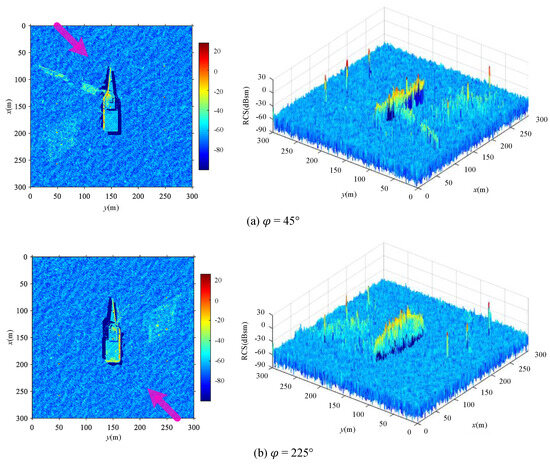
Figure 18.
Composite scene scattering distribution when the incident wave azimuth angles are 45° and 225°. (a) The azimuth is 45°. (b) The azimuth is 225°.
In Figure 18a, three strong scattering areas emerge on the sea surface on the left side of the ship. These are attributable to the rays incident on the middle section of the ship’s hull, the superstructure, and the middle and rear sides of the ship, which then reflect onto the sea surface. Similarly, as illustrated in Figure 18b, a strong scattering area appears on the sea surface on the right side of the ship. This area results from rays incident in the middle and rear sides of the ship reflecting onto the sea surface, a phenomenon also observed in Figure 17b,c. At certain incident angles, the interaction between the ship and the sea surface creates a potent multiple-scattering structure, enhancing the coupled scattering between them and resulting in prominent scattering areas on the sea surface.
The simulation results and analysis of the sea surface–ship-corner reflector composite scene scattering reveal that the corner reflectors consistently exhibit strong scattering characteristics across various electromagnetic wave incident angles. In addition to the strong scattering from the corner reflectors, the primary intense scattering is concentrated on the ship’s surface facing the incident direction of the electromagnetic wave, as well as from the ship’s multiple reflection structures. Furthermore, due to the multiple reflection structures formed between the ship and the sea surface, several strong scattering zones also emerge on the sea surface.
4. SAR Imaging Simulation and Analysis of Composite Targets on the Sea Surface
Building on the scattering analysis detailed in the previous section, this section proceeds in two main stages. Firstly, we simulate the SAR image of the sea surface–ship interaction. An analysis is provided, examining how the image quality and characteristics vary under different incident wave angles and varying sea surface wind speeds. This analysis helps to understand how environmental and operational parameters affect radar imagery, which is crucial for realistic applications and interpretations.
Secondly, we image and analyze the sea surface–ship-corner reflector scenario. This step extends the imaging process to more complex scenarios where corner reflectors are used. These reflectors are typically employed to enhance the radar signature of objects and are thus critical in understanding how they can modify the detectability and imaging characteristics of naval vessels under various conditions.
Both imaging processes aim to validate the scattering models developed earlier and to demonstrate how these models can be applied to real-world SAR imaging scenarios. This helps to bridge the gap between theoretical scattering models and their practical applications in maritime surveillance and naval operations. Range-Doppler (RD) imaging is used to achieve SAR imaging, which is not explained here [41].
4.1. Sea Surface–Ship Composite Model SAR Imaging
The sea surface–ship composite model is depicted in Figure 19a. The parameters relevant to this imaging simulation are presented in Table 2. The resolution in both the distance and azimuth directions is set to 1 m, ensuring high detail in the imaging results. From the analysis of composite scattering in sea surface scenes presented earlier, it is evident that the sea surface scattering intensity decreases as the incident wave angle increases from normal incidence to grazing incidence. This means that as increases, the sea surface scattering gradually weakens. This finding is consistent with the SAR images of the sea surface–ship scene at different angles and azimuths shown in Figure 20.
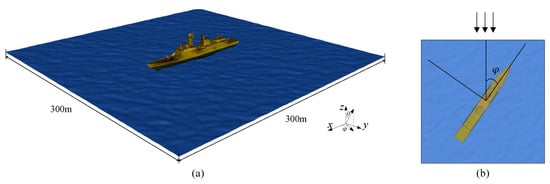
Figure 19.
Composite model SAR Imaging. (a) Schematic diagram of the sea surface–frigate composite scenario model. (b) Schematic diagram of radar wave incident angle in the sea surface–ship composite scenario model.

Table 2.
SAR imaging simulation 1 parameters.

Figure 20.
Comparison of sea surface–ship imaging results at different incident wave angles. (a) The pitch is 30°, and the azimuth is 30°. (b) The pitch is 60°, and the azimuth is 30°. (c) The pitch is 30°, and the azimuth is 60°. (d) The pitch is 60°, and the azimuth is 60°.
The imaging results demonstrate that for the same incident azimuth but different incident angles , the sea surface clutter background varies significantly. When the incident angle is smaller, the sea surface clutter background is stronger, which appears in the images as a brighter, light-colored background. Conversely, at a larger incident angle , such as 60° compared to 30°, bright spots or continuous bright areas may appear on the sea surface due to strong coupled scattering. This indicates the complex interaction between the sea surface and the ship’s structure, which affects the overall scattering and imaging results.
As illustrated in Figure 21, the imaging results of the sea surface–ship scene are presented for different sea surface wind speeds when the electromagnetic wave is incident at an angle of 45° and an azimuth angle of 30°. The imaging results reveal that smaller wind speeds result in gentler sea surface fluctuations. As the wind speed increases, the sea surface waves become more turbulent, and the sea surface clutter background exhibits a stronger trend. This is depicted in the figure by the sea surface presenting a strong light-colored background at high wind speeds.

Figure 21.
Comparison of sea surface–ship imaging results at different sea surface wind speeds. (a) The wind speed is 3 m/s. (b) The wind speed is 5 m/s. (c) The wind speed is 7 m/s. (d) The wind speed is 10 m/s.
Moreover, as the wind speed increases, the violent sea surface fluctuations gradually reduce the presence of coupled scattering bright spots or bright areas near the ship. When the wind speed is 3 m/s, the sea surface is relatively calm, making the strong scattering area near the ship most noticeable. This indicates that the calmness of the sea surface enhances the visibility of strong scattering areas, while increased wind speeds and resultant turbulence obscure these areas due to the heightened sea surface clutter.
As illustrated in Figure 22, the imaging results of the sea surface–ship scene under different sea surface wind direction angles are shown when the sea surface wind speed is , and the electromagnetic wave is incident at an angle of 42° and an azimuth angle of 45°. The imaging results reveal that when the angle between the incident wave and the wind direction is 0°, meaning the incident wave aligns with the direction of the sea surface fluctuations, the sea surface exhibits a strong clutter background.
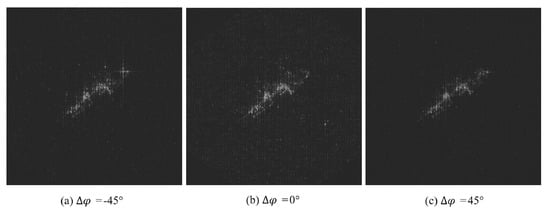
Figure 22.
Comparison of sea surface–ship imaging results under different sea surface wind angles, with m/s. (a) 45°. (b) 0°. (c) 45°.
Conversely, when the sea surface wind speed is , the sea surface is relatively calm. As depicted in Figure 23, the relationship between the intensity of the sea surface background and the incident wave’s direction relative to the wind direction is not as pronounced.
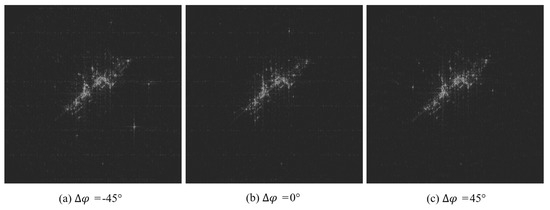
Figure 23.
Comparison of sea surface–ship imaging results under different sea surface wind angles, with m/s. (a) 45°. (b) 0°. (c) 45°.
In summary, the relationship between the angle of the incident wave and the sea surface wind direction and the intensity of the sea surface background is more noticeable when the sea surface is experiencing violent fluctuations. When the incident wave aligns with the wave direction, the sea surface in the image presents a strong light-colored background. However, when the sea surface is calmer, this relationship becomes less obvious.
4.2. Sea Surface–Ship-Corner Reflector Interference SAR Imaging
The simulation and analysis of SAR images of the sea surface–ship under different incident wave angles, sea surface wind speeds, and wind direction angles were conducted. Next, SAR imaging and analysis of the sea surface–ship-corner reflector composite scene are presented.
The sea surface–ship-corner reflector interference composite scene model is shown in Figure 17a. This model is consistent with the sea surface–ship-corner reflector composite scene described in Section 3.4. The image simulation for the model was carried out, and the relevant parameter settings for the imaging simulation are detailed in Table 3. This simulation aimed to further understand the scattering and imaging characteristics of the composite scene involving a ship and corner reflectors under various environmental and operational conditions.

Table 3.
SAR imaging simulation 2 parameters.
Figure 24 presents the SAR imaging results of the composite scene at various azimuth angles with an incident wave angle of 60°. In the earlier part of this section, which focused on sea surface–ship imaging simulation, unprocessed SAR images were used to analyze the impact of different factors on the images.

Figure 24.
SAR imaging results of the sea surface–ship interference composite scene. (a) 0°. (b) 48°. (c) 270°. (d) 105°.
For the sea surface–ship interference composite scene, image enhancement techniques were applied to improve image clarity and facilitate subsequent image recognition. The images were pre-processed, and the parameters of each image were adjusted to enhance the contrast of different parts of the image.
As shown in the figure, due to their varying postures, the icosahedral corner reflectors consistently produce strong scattering across most incident angles. This strong scattering can simulate the interference of several bright scattering spots on the ship’s surface. At specific angles, there is strong coupling between the sea surface and the ship, resulting in corresponding interference bright spots in the sea area close to the ship. This coupling effect highlights the interaction between the ship and the sea surface, which is crucial for understanding the scattering and imaging characteristics of such composite scenes.
5. Discussion
The SAR imaging results were successfully obtained based on the scattering distribution data. It was clearly observed that the intensity of the sea surface scattering background varies with the angle between the incident wave and the sea surface wind direction, demonstrating the importance of applying the electromagnetic scattering principle.
Using the SBR-PO method combined with CUDA parallel acceleration technology, the simulation time of the 300 m × 300 m sea surface scene does not exceed 20 s. The SBR-PO method effectively considers the electromagnetic coupling of multiple sea surface scenes and ships. Nevertheless, the proposed method requires the use of a GPU, which is sufficient for general SAR simulation scenarios. When the simulated scene is too large, there may be a problem of insufficient computing power.
The sea surface in this paper is of a specific size and is artificially truncated, making it necessary to consider methods such as cone waves to address the sea surface truncation issue. This paper only simulates and analyzes a linear sea surface, without accounting for nonlinear sea surfaces or the micro-undulations of the sea surface, and it overlooks the changes in the sea surface caused by the movement of the ship. Therefore, further in-depth research on sea surface modeling is required. Additionally, this paper does not consider the presence of various materials in the ship, each with different electromagnetic properties. Although the SBR-PO algorithm can accommodate different material settings, for simplicity, all ship materials in this paper are set as ideal conductors. These limitations do not affect the applicability of the SBR-PO method in SAR simulation.
6. Conclusions
In this paper, a sea surface model was established by integrating the P-M sea surface spectrum with the SWOP directional spread function, and the SBR-PO electromagnetic scattering method was employed to accurately calculate the sea surface scattering characteristics. This approach was found to effectively balance accuracy and efficiency, achieving results comparable to the full-wave MLFMM algorithm, while offering enhanced computational speed, particularly with GPU acceleration. Although a certain amount of electromagnetic calculation time is required, it was demonstrated that an accurate scattering model can be obtained with a reduced computational time cost compared to traditional SAR simulation methods.
The method proposed in this paper also allows for full consideration of electromagnetic coupling between different regions of the sea surface and the reflectivity of various materials, which traditional methods are unable to achieve. By applying the SBR-PO algorithm, the scattering characteristics of sea surface scenarios under varying wind speeds, wind directions, and incident wave directions were studied. In-depth analysis was conducted on electromagnetic coupling phenomena, including interactions between ships and between the sea surface and ships.
Based on the scattering simulation results, SAR imaging of composite targets, including the sea surface, ships, and interference, was carried out. The influence of various factors on composite scattering was also analyzed, contributing to a more comprehensive understanding of these complex interactions.
Author Contributions
Conceptualization, Y.H., L.X. and J.H.; methodology, Y.H., L.X. and J.H.; software, Y.H., L.X. and J.H.; validation, Y.H. and L.X.; formal analysis, Y.H. and J.H.; investigation, L.X.; writing—original draft preparation, Y.H.; writing—review and editing, Y.H., L.X. and J.H.; supervision, L.X. and X.S.; project administration, L.X. and H.Z.; funding acquisition, L.X. and H.Z. All authors have read and agreed to the published version of the manuscript.
Funding
This research was funded by the National Natural Science Foundation of China (grant number 62231027).
Data Availability Statement
The raw data supporting the conclusions of this article will be made available by the authors on request.
Conflicts of Interest
The authors declare no conflicts of interest.
References
- Rizaev, I.G.; Karakuş, O.; Hogan, S.J.; Achim, A. Modeling and SAR Imaging of the Sea Surface: A Review of the State-of-the-Art with Simulations. ISPRS J. Photogramm. Remote Sens. 2022, 187, 120–140. [Google Scholar] [CrossRef]
- Budillon, A.; Schirinzi, G. Remote Monitoring of Civil Infrastructure Based on TomoSAR. Infrastructures 2022, 7, 52. [Google Scholar] [CrossRef]
- Rao, A.; Jung, J.; Silva, V.; Molinario, G.; Yun, S.H. Earthquake Building Damage Detection Based on Synthetic-Aperture-Radar Imagery and Machine Learning. Nat. Hazards Earth Syst. Sci. 2023, 23, 789–807. [Google Scholar] [CrossRef]
- Berens, P.; Walterscheid, I.; Saalmann, O.; El-Arnauti, G. High Resolution Multi-Aspect SAR Imaging of Military Vehicles. In Proceedings of the EUSAR 2021—13th European Conference on Synthetic Aperture Radar, Online, 29–31 April 2021; pp. 1–4. [Google Scholar]
- Yang, C.S.; Kim, Y.S.; Ouchi, K.; Na, J.H. Comparison with L-, C-, and X-band Real SAR Images and Simulation SAR Images of Spilled Oil on Sea Surface. In Proceedings of the 2009 IEEE International Geoscience and Remote Sensing Symposium, Cape Town, South Africa, 12–17 July 2009; Volume 4, pp. IV-673–IV-676. [Google Scholar] [CrossRef]
- Oliver, C.J. Synthetic-Aperture Radar Imaging. J. Phys. D Appl. Phys. 1989, 22, 871. [Google Scholar] [CrossRef]
- Agrawal, S.; Khairnar, G.B. A Comparative Assessment of Remote Sensing Imaging Techniques: Optical, Sar and Lidar. Int. Arch. Photogramm. Remote Sens. Spat. Inf. Sci. 2019, 42, 1–6. [Google Scholar] [CrossRef]
- Diao, G.; Xu, X.; Hong, N.; Lu, J. Synthetic Aperture Radar Signal Simulation of Ships on Sea Surface. J. Syst. Simul. 2020, 27, 1989–1996. [Google Scholar]
- Jiang, W.Q.; Wang, L.Y.; Li, X.Z.; Liu, G.; Zhang, M. Simulation of a Wideband Radar Echo of a Target on a Dynamic Sea Surface. Remote Sens. 2021, 13, 3186. [Google Scholar] [CrossRef]
- Li, Q.; Zhang, Y.; Wang, Y.; Bai, Y.; Zhang, Y.; Li, X. Numerical Simulation of SAR Image for Sea Surface. Remote Sens. 2022, 14, 439. [Google Scholar] [CrossRef]
- Li, X.M.; Qin, T.; Wu, K. Retrieval of Sea Surface Wind Speed from Spaceborne SAR over the Arctic Marginal Ice Zone with a Neural Network. Remote Sens. 2020, 12, 3291. [Google Scholar] [CrossRef]
- Elyouncha, A.; Eriksson, L.E.B.; Johnsen, H. Direct Comparison of Sea Surface Velocity Estimated from Sentinel-1 and TanDEM-x SAR Data. IEEE J. Sel. Top. Appl. Earth Obs. Remote Sens. 2022, 15, 2425–2436. [Google Scholar] [CrossRef]
- Holthuijsen, L. Waves in Oceanic and Coastal Waters; Cambridge University Press: Cambridge, UK, 2010. [Google Scholar]
- Pierson, W.J., Jr.; Moskowitz, L. A Proposed Spectral Form for Fully Developed Wind Seas Based on the Similarity Theory of SA Kitaigorodskii. J. Geophys. Res. 1964, 69, 5181–5190. [Google Scholar] [CrossRef]
- Chen, X.; Zhou, L.; Zhou, M.; Shao, A.; Ren, K.; Chen, Q.; Gu, G.; Wan, M. Infrared Ocean Image Simulation Algorithm Based on Pierson–Moskowitz Spectrum and Bidirectional Reflectance Distribution Function. Photonics 2022, 9, 166. [Google Scholar] [CrossRef]
- Kudryavtsev, V.; Hauser, D.; Caudal, G.; Chapron, B. A Semiempirical Model of the Normalized Radar Cross-Section of the Sea Surface 1. Background Model. J. Geophys. Res. Ocean. 2003, 108, FET 2-1–FET 2-24. [Google Scholar] [CrossRef]
- Plant, W.J. Bragg Scattering of Electromagnetic Waves from the Air/Sea Interface. In Surface Waves and Fluxes: Volume II—Remote Sensing; Springer: Dordrecht, The Netherlands, 1990; pp. 41–108. [Google Scholar]
- Barman, K.K.; Chanda, A.; Tsai, C.C.; Hsu, T.W. Bragg Scattering of Gravity Waves by a Sea Bed of Varying Depth in the Presence of Uniform Current Covered by a Floating Membrane. Phys. Fluids 2024, 36, 012118. [Google Scholar] [CrossRef]
- Luo, W.; Yang, Y.; Ni, Z. Iterated Method for Multiple Electromagnetic Wave Scattering of Two-Dimensional Sea Surface. In Proceedings of the 2019 IEEE International Conference on Computational Electromagnetics (ICCEM), Shanghai, China, 20–22 March 2019; pp. 1–3. [Google Scholar] [CrossRef]
- Huang, Y.; Chen, P. Research on Numerical Methods of Electromagnetic Scattering from Rough Surfaces. Master’s Thesis, Huazhong University of Science and Technology, Wuhan, China, 2008. [Google Scholar]
- Zhang, X.Y.; Sheng, X.Q. An Efficient Hybrid KA-MoM Method for Scattering from Objects above a Rough Surface. In Proceedings of the IEEE 2008 Asia-Pacific Microwave Conference, Hong Kong, China, 16–28 December 2008; pp. 1–4. [Google Scholar]
- Dong, C.L.; Guo, L.X.; Meng, X. An Accelerated Algorithm Based on GO-PO/PTD and CWMFSM for EM Scattering from the Ship over a Sea Surface and SAR Image Formation. IEEE Trans. Antennas Propag. 2020, 68, 3934–3944. [Google Scholar] [CrossRef]
- Jianxiong, Z.; Zhiguang, S.; Xiao, C.; Qiang, F. Automatic Target Recognition of SAR Images Based on Global Scattering Center Model. IEEE Trans. Geosci. Remote Sens. 2011, 49, 3713–3729. [Google Scholar] [CrossRef]
- He, Y.; He, S.Y.; Zhang, Y.H.; Wen, G.J.; Yu, D.F.; Zhu, G.Q. A Forward Approach to Establish Parametric Scattering Center Models for Known Complex Radar Targets Applied to SAR ATR. IEEE Trans. Antennas Propag. 2014, 62, 6192–6205. [Google Scholar] [CrossRef]
- Xing, X.Y.; Yan, H.; Yin, H.C.; Huo, C.Y. A Bistatic Attributed Scattering Center Model for SAR ATR. IEEE Trans. Antennas Propag. 2021, 69, 7855–7866. [Google Scholar] [CrossRef]
- Gao, Y.; Akbar, M.F.; Jawad, G.N. Stabilized and Fast Method for Compressive-Sensing-Based Method of Moments. IEEE Antennas Wirel. Propag. Lett. 2023, 22, 2915–2919. [Google Scholar] [CrossRef]
- Limkilde, A.; Borries, O.; Meincke, P.; Jørgensen, E. Full-Wave Monostatic Radar Cross Section Using the Multilevel Fast Multipole Method. In Proceedings of the 2023 17th European Conference on Antennas and Propagation (EuCAP), Florence, Italy, 26–31 March 2023; pp. 1–5. [Google Scholar] [CrossRef]
- Balanis, C.A. Advanced Engineering Electromagnetics; John Wiley & Sons: Hoboken, NJ, USA, 2012. [Google Scholar]
- Shah, M.A.; Tokgoz, C.; Salau, B.A. Radar Cross Section Prediction Using Iterative Physical Optics with Physical Theory of Diffraction. IEEE Trans. Antennas Propag. 2022, 70, 4683–4690. [Google Scholar] [CrossRef]
- Huo, J.; Xu, L.; Shi, X.; Yang, Z. An Accelerated PO for EM Scattering from Electrically Large Targets. IEEE Antennas Wirel. Propag. Lett. 2021, 20, 2300–2304. [Google Scholar] [CrossRef]
- Dong, C.; Guo, L.; Meng, X.; Li, H. An Improved GO-PO/PTD Hybrid Method for EM Scattering From Electrically Large Complex Targets. IEEE Trans. Antennas Propag. 2022, 70, 12130–12138. [Google Scholar] [CrossRef]
- Niu, X.; He, H.; Jin, M. Application of Ray-Tracing Method in Electromagnetic Numerical Simulation Algorithm. In Proceedings of the 2021 International Applied Computational Electromagnetics Society (ACES-China) Symposium, Chengdu, China, 28–31 July 2021; pp. 1–2. [Google Scholar] [CrossRef]
- Huo, J.; Xu, L.; Shi, X.; Yang, Z. An Accelerated Shooting and Bouncing Ray Method Based on GPU and Virtual Ray Tube for Fast RCS Prediction. IEEE Antennas Wirel. Propag. Lett. 2021, 20, 1839–1843. [Google Scholar] [CrossRef]
- Wu, T.D.; Hsieh, Y.C.; Liou, H.W.; Yen, Y.; Lee, H.W.; Wang, H.F. SAR Image Simulation Based on SBR/PO Method for Polarimetric Feature Analysis. In Proceedings of the 2020 International Workshop on Electromagnetics: Applications and Student Innovation Competition (iWEM), Makung, Taiwan, 26–28 August 2020; pp. 1–2. [Google Scholar] [CrossRef]
- Chang, Z.; Han, F.; Sun, Z.; Gao, Z.; Wang, L. Three-Dimensional Dynamic Sea Surface Modeling Based on Ocean Wave Spectrum. Acta Oceanol. Sin. 2021, 40, 38–48. [Google Scholar] [CrossRef]
- Sun, L.; Yang, X.Q.; Bu, S.X.; Zheng, W.T.; Ma, Y.X.; Jiao, Z.L. Analysis of FPSO Motion Response under Different Wave Spectra. J. Mar. Sci. Eng. 2023, 11, 1467. [Google Scholar] [CrossRef]
- Meng, H.T. Acceleration of Asymptotic Computational Electromagnetics Physical Optics—Shooting and Bouncing Ray (PO-SBR) Method Using CUDA. Ph.D. Thesis, University of Illinois at Urbana-Champaign, Champaign, IL, USA, 2011. [Google Scholar]
- Zhou, T.; Cai, Q.M.; Cao, X.; Jiang, W.; Zhu, Y.; Zhu, Y.; Fan, J. GPU-accelerated HO-SIE-DDM Using NVIDIA CUDA for Analysis of Multiscale Problems. In Proceedings of the 2022 Asia-Pacific International Symposium on Electromagnetic Compatibility (APEMC), Beijing, China, 8–11 May 2022; pp. 201–203. [Google Scholar] [CrossRef]
- Chi, Z.; Guo, X. CUDA Acceleration for Solving Three-Dimension Time-Dependent Parabolic Partial Differential Equation. In Proceedings of the 2021 2nd International Conference on Intelligent Computing and Human-Computer Interaction (ICHCI), Shenyang, China, 17–19 November 2021; pp. 99–103. [Google Scholar] [CrossRef]
- Eaves, J.; Reedy, E. Principles of Modern Radar; Springer Science & Business Media: New York, NY, USA, 2012. [Google Scholar]
- Chen, K.S. Principles of Synthetic Aperture Radar Imaging: A System Simulation Approach; CRC Press: Boca Raton, FL, USA, 2016. [Google Scholar]
Disclaimer/Publisher’s Note: The statements, opinions and data contained in all publications are solely those of the individual author(s) and contributor(s) and not of MDPI and/or the editor(s). MDPI and/or the editor(s) disclaim responsibility for any injury to people or property resulting from any ideas, methods, instructions or products referred to in the content. |
© 2024 by the authors. Licensee MDPI, Basel, Switzerland. This article is an open access article distributed under the terms and conditions of the Creative Commons Attribution (CC BY) license (https://creativecommons.org/licenses/by/4.0/).