1. Introduction
Unlike conventional phased arrays (PAs), frequency diverse arrays (FDAs) exhibit a more flexible ability in beampattern control and signal processing by applying the frequency diverse technique across the array’s aperture [
1,
2]. Therefore, it can provide potential applications in detecting targets in severely cluttered environment [
3,
4,
5], jointly estimating the range, angle, and velocity parameters of targets [
6], suppressing swarm interference [
7] and suppressing deception jamming while interrupting and interfering with the enemy’s radar signal [
8], providing high resolution and wide bandwidth imaging [
9,
10], detecting moving targets in partially homogeneous environments [
11], secure communications [
12,
13,
14,
15], wide-swath synthetic aperture radar (SAR) imaging [
16,
17], SAR ground moving target indication (SAR GMTI) [
18,
19], spaceborne SAR scattered-wave deception jamming [
20], etc. It can be concluded that FDA is superior over conventional PA in future multi-task radars, satellites, navigation systems, radio astronomy, wireless security communications, etc., and has become one of the hot spots in relevant research fields.
Just as its name implies, the frequency offset (FO) applied between the adjacent elements plays a significant role in the beampattern control of an FDA. Theoretically, an S-shaped transmission beampattern is achieved for a uniformly spaced FDA with linearly increasing/decreasing FO, which is not suitable for accurate target positioning. Therefore, extensive research has been conducted to investigate the effects of different types of non-linearly varying FOs on FDAs’ performance. In specific, logarithmically increasing frequency offsets (log-FOs) [
21,
22], Cantor multi-stage FOs [
23], random permutation power increasing FOs [
24], sinusoidally increasing frequency offsets (sin-FOs) [
25,
26], tangent hyperbolic function FOs [
27], segmented triangular FOs [
28], window function-based FOs [
29,
30,
31,
32,
33], and other non-linearly varying FOs obtained with intelligent optimization algorithms [
34,
35,
36,
37] have been explored in detail. Meanwhile, the array’s configuration is also an important factor that greatly influences the performance of an FDA, such as non-uniform linear array configurations [
38,
39], circular array configurations [
40], semicircular array configurations [
41,
42], arc array configurations [
43,
44], and concentric circular array configurations [
45]. Among them, the semicircular configuration is a typical conformal structure which can enable the array to achieve the largest scanning angle with the least number of elements.
Another important issue of FDAs is the time-varying characteristic when only considering the transmission mode, which means that the phase term of each element in the FDA is accumulated with respect to time during the signal’s duration. This property enables an FDA to provide continuous electric beam steering during the signal’s duration, on one hand, and increases the difficulty in controlling the mainbeam on the other hand. To alleviate this problem, some researchers have devoted themselves to time-modulated FOs [
46,
47]. However, it has been pointed out that the time-varying issue inherently exists when only considering the transmission mode [
48,
49]. Under this circumstance, researchers have started to consider equivalent transmit beamforming at the receiver [
50,
51]. In the following, two transmit–receive signal processing chains are proposed along with the detailed derivation of the corresponding signal models [
41,
52]. In [
41], a series of mixers and low-pass filters (LPFs) were utilized to handle the time-varying terms where a series of analog-to-digital converters (ADCs) were adopted to facilitate the subsequent digital beamforming procedure, while only a mixer and an ADC were adopted in [
52] to greatly reduce the system’s cost.
In many scenarios, an array with large elements is prevalent, since it can provide a higher angle resolution. Nevertheless, the huge number of elements in the array would always mean the extremely high complexity of signal processing and a huge cost. In order to maintain the advantages of high resolution and high sensitivity of the array system while greatly reducing the consumption cost, sparse technology is considered to reduce the number of elements by percentages and consequently lower the complexity of the feed channel and network. Note that the generalized sparse arrays refer to non-uniform arrays, which can be divided into thinned arrays and sparse arrays according to whether the interelement spacing is an integer multiple of the initial interelement spacing. Thinned technology has been widely used in PA [
53,
54]. At present, some researchers have conducted studies on the sparse FDAs. In [
55], the modified genetic algorithm (GA) was used to create a sparse multi-carrier FDA with a linear configuration. In [
56], the artificial bee colony algorithm was used to create a sparse linear FDA. In [
57], the FO and element position of the linear FDA were optimized simultaneously to synthesize the thinned FDA. An effective non-iterative beamforming method for sparse FDAs was proposed in [
58]. Nevertheless, the works above mostly focused on the sparse linear FDAs, and corresponding investigations on conformal FDAs are quite limited. Furthermore, the works above only considered the transmission mode, and the time-varying issue was not resolved. Under these circumstances, we intended to conduct investigations on thinned and sparse semicircular FDAs in the transmit–receive dimensions. Note that the GA was adopted during the optimization, since it is one of the most efficient and effective algorithms that has been widely used in optimization problems of arrays’ configuration [
59,
60,
61,
62]. Our main contributions are briefly summarized as follows.
- (1)
A thinned transmit–receive beamforming for semicircular FDAs was investigated, where three types of non-linearly varying FOs, i.e., log-FO, sin-FO, and tanh-FO, were adopted to further disturb the range-angle-coupled characteristic of the FDA’s beampattern. Note that the amplitudes of excitation were also incorporated into the optimization to achieve low sidelobe level (SLL) during thinning, since a conformal array always exhibits a high SLL.
- (2)
A sparse transmit–receive beamform for semicircular FDAs was investigated successfully, the principle of which is to rearrange the elements at a certain angle interval under the premise of a fixed array aperture. In particular, the sparse elements of the redistributed arrangement were 50% of the full array’s elements, and the improved GA was used to carry out the sparse layout array. The differences in the angle between the two array elements were the individual genes, and the search space was reduced.
- (3)
The performance of the thinned and sparse forms of semicircular FDAs’ transmit–receive beamforming were examined. Note that the first and the last elements were fixed to guarantee the array’s resolution in the angle dimension. The resulting beampatterns are presented from various aspects. Comparisons and analysis of thinned and sparse semicircular arrays with the above three FOs are provided in detail to provide suggestions for other researchers.
The rest of the article is arranged as follows. In
Section 2, the transmit–receive beamforming signal model of semicircular FDAs is established. In
Section 3, thinned and sparse beamforming for semicircular FDAs in the transmit–receive domain using GA are proposed, which achieved a low SLL while reducing the number of elements.
Section 4 presents the simulation’s results and analyzes them in detail to demonstrate the effectiveness of the proposed method. Finally,
Section 5 summarizes the work and draws the conclusion of our work.
2. The Transmit–Receive Beamforming Signal Model of Semicircular FDAs
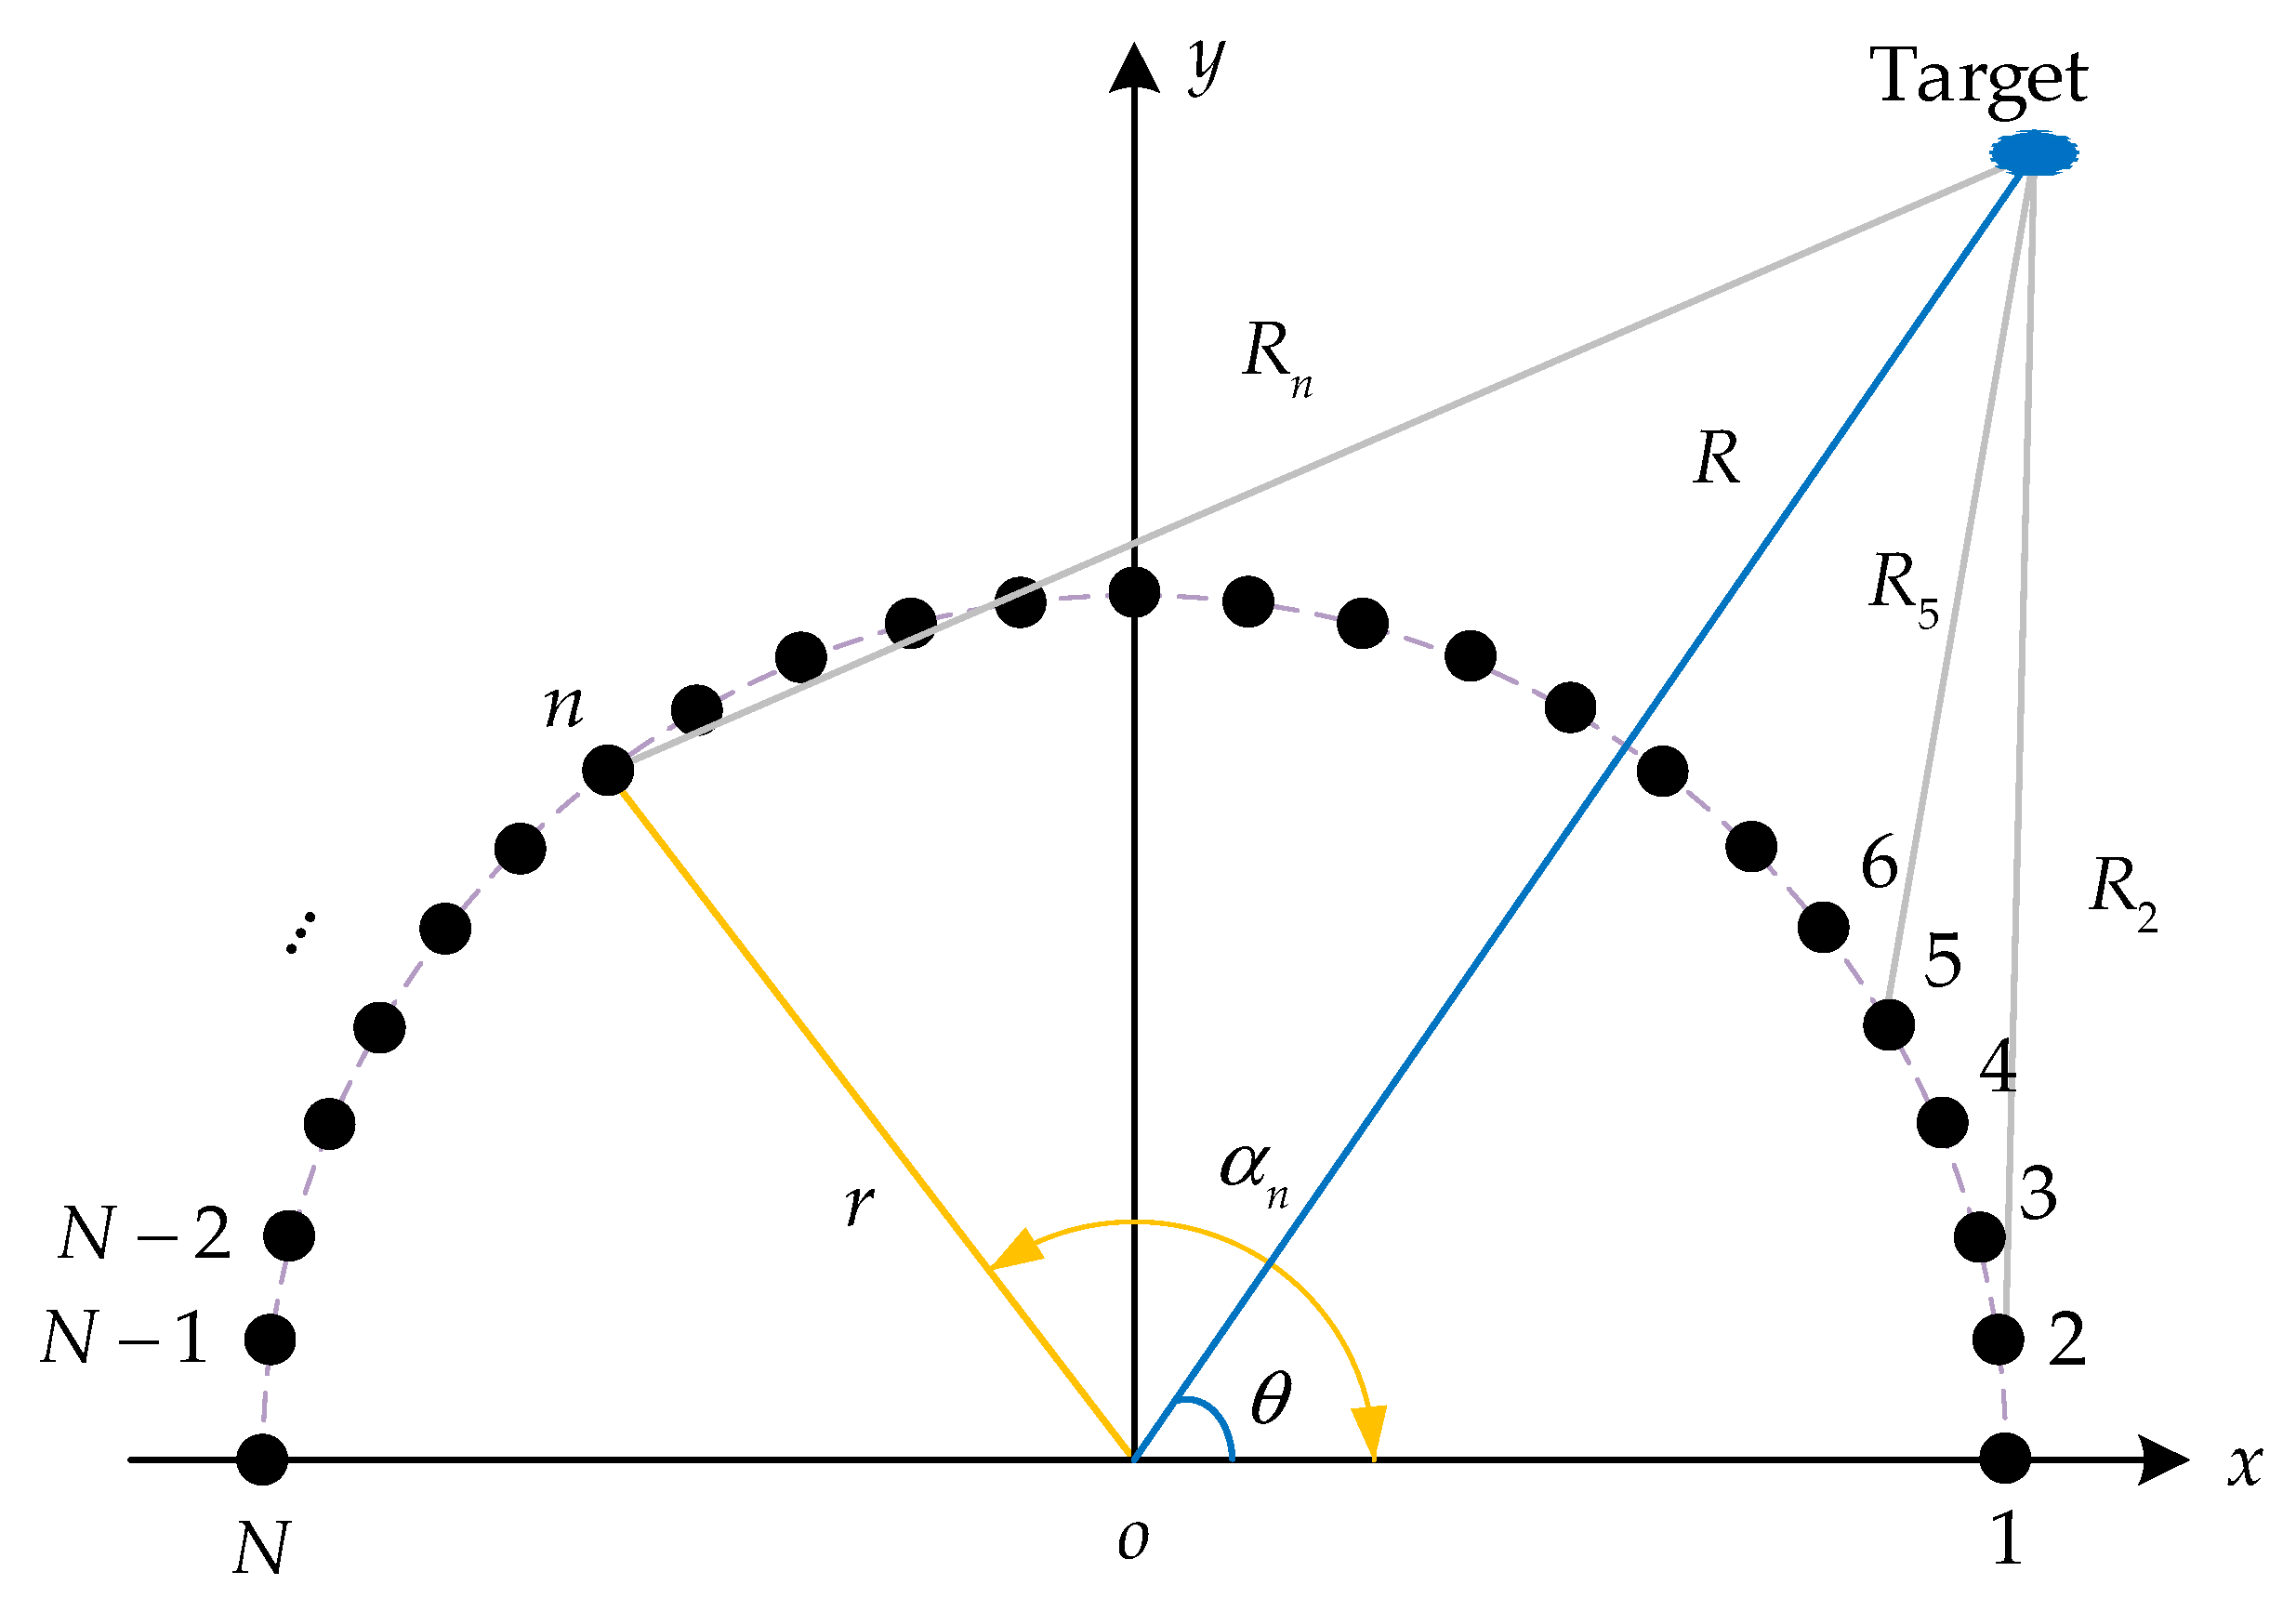
As depicted in
Figure 1, a semicircular array consisting of
N elements was considered, where the elements were uniformly distributed along a semicircular platform with a radius of
r.
The operating frequency of the
nth element can be written as
where
represents the reference frequency and
is the FO corresponding to the
nth element. To achieve the range-angle-decoupled beampattern, two types of non-linearly varying FOs, i.e., log-FO [
41] and sin-FO [
35], were adopted a linear FDAs in [
52]. For comparison, the log-FO and sin-FO of the same expressions were also adopted here, and an another non-linearly varying FO [
27] was also introduced. Secifically, the FO of the
nth element can be expressed as
The distance from the
nth element to the target can be expressed as
where
represents the angle of the
nth element deviating from the positive
x-axis, and
R and
, respectively, denote the range and angle parameters of the target from the coordinates’ origin. The signal radiated by the
nth element of the array has the form of
The signal transmitted by the
nth element, reflected by the target in the far field, and received by the
mth receiving element can be expressed as
where
, and
c is the speed of light.
Then the output of the
mth receiving element is the summation of all the transmitted and reflected signals, i.e.,
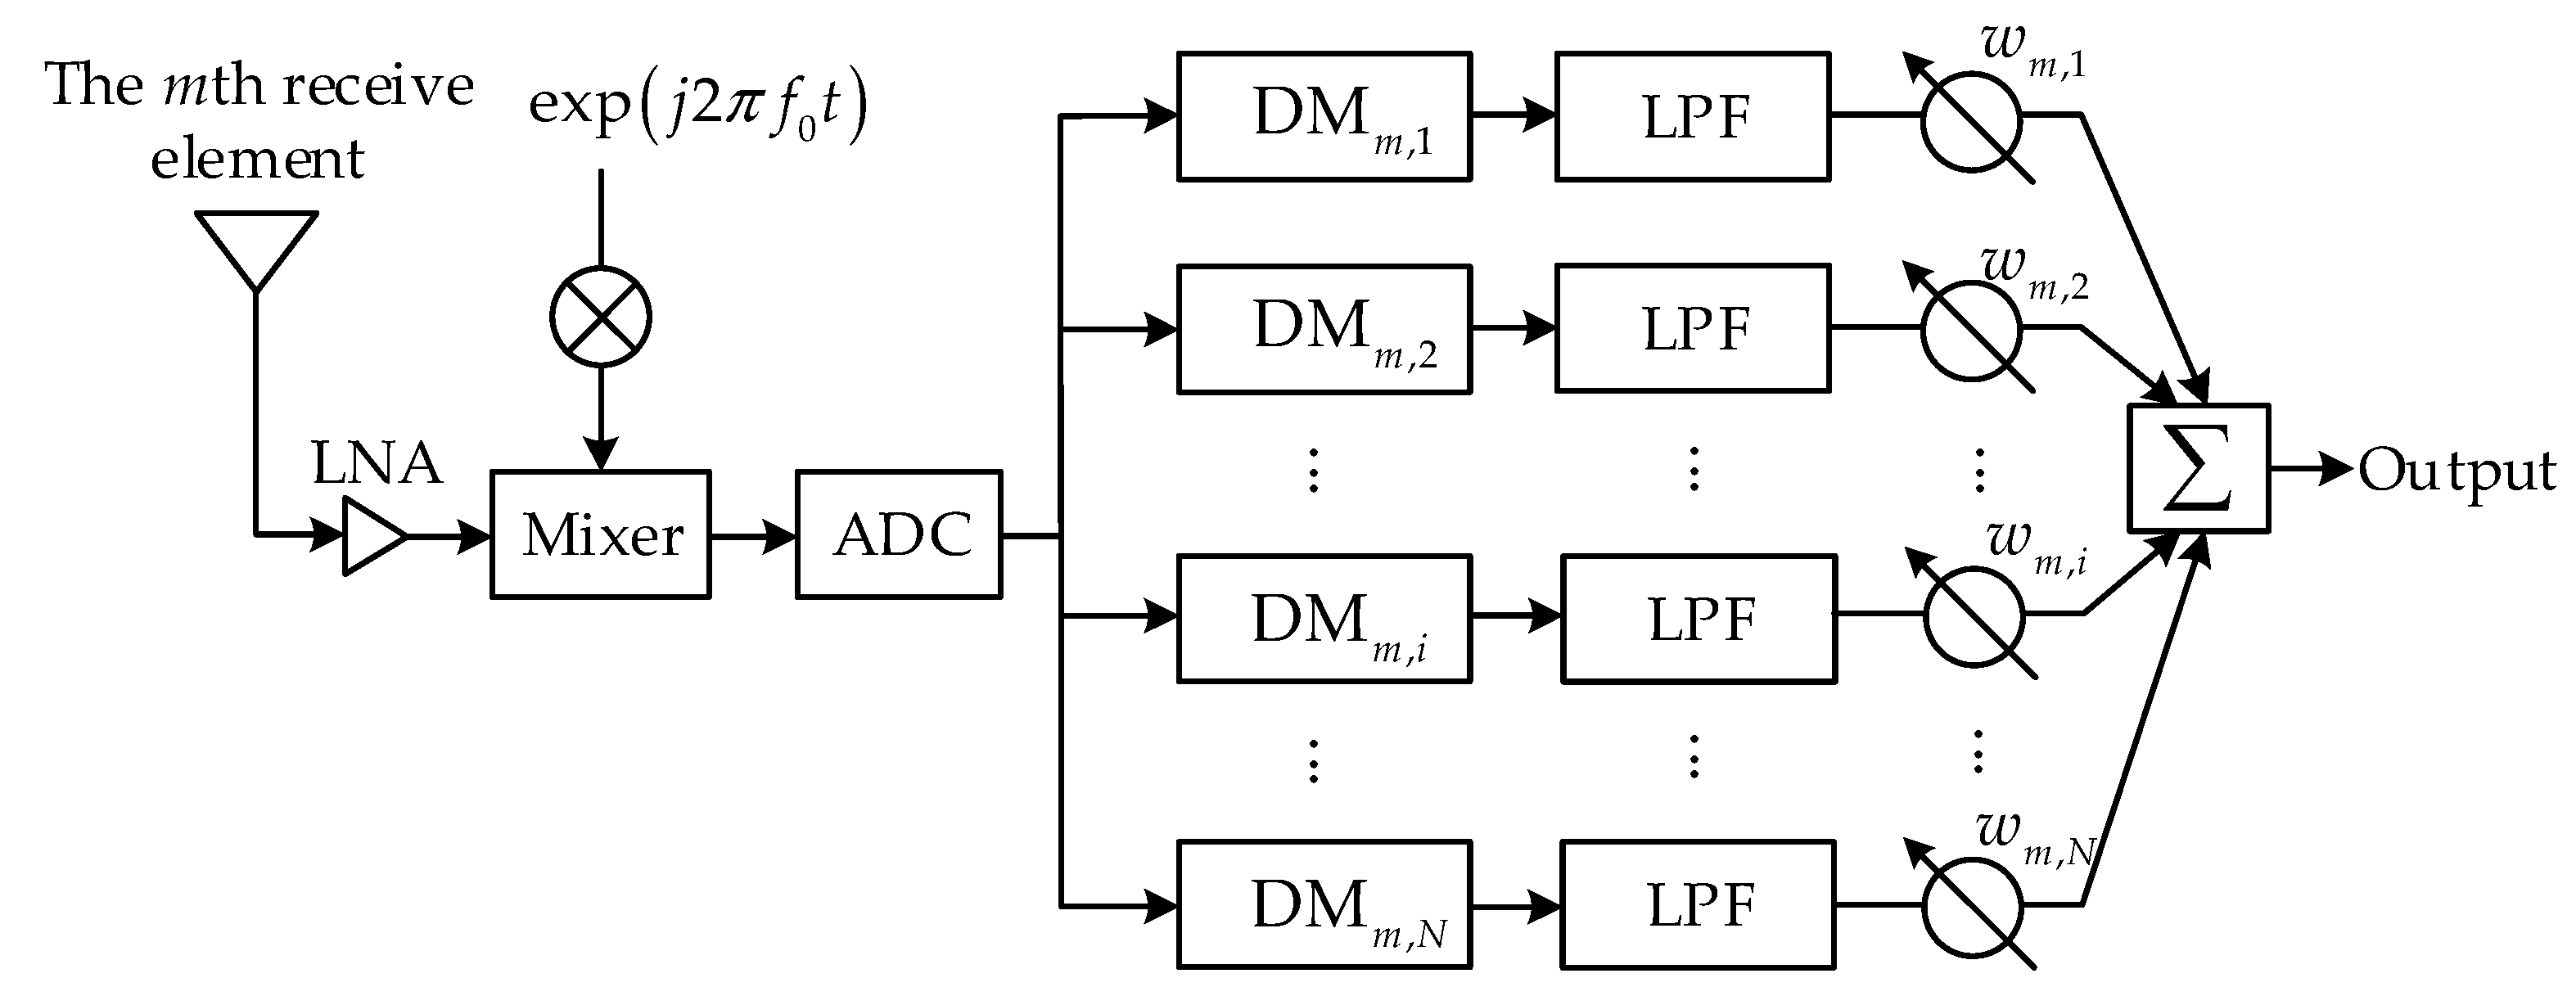
As described in the following, the inherent time-varying problem of the semicircular FDA was solved by combining the signal processing in the joint transmission and receiving domains. As shown in
Figure 2, after being amplified in a low-noise amplifier (LNA), the output of the
mth receiving element was mixed with a mixer of frequency
. Then the mixed signals were sampled with an analog-to-digital converter (ADC) before being further mixed with a set of digital mixers (DMs). In the sequel, the signal in each channel was filtered by a low-pass filter (LPF), weighted, and summed for digital beamforming.
The output signal of the
ith channel after filtered by LPF can be expressed as
where
is the bandwidth of the
ith DM used to compensate for the time-varying term caused by the FO.
represents the temporary response of a series of identical LPFs, and
denotes the convolution operator. At this time, the time-varying terms are eliminated.
Therefore, the output of the
mth receiving processing chain can be written as
where
represents the weight of the
ith channel in the
mth processing chain.
Consequently, the transmit–receive array factor of the semicircular FDA can be expressed as
where
, with
denoting the weight of the
mth transmit–receive processing chain.
3. Thinned and Sparse Beamforming for Semicircular FDAs in Transmit–Receive Domain
In this section, thinned and sparse beamforming for semicircular FDAs was investigated based on the signal model established in
Section 2. Specifically, the optimization model of thinned beamforming for semicircular FDAs was constructed as described in
Section 3.1, where the elements’ positions as well as the excitation amplitudes were incorporated into the problem. To realize the thinned semicircular FDA, some of the elements were deactivated and the positions of the remaining elements were not changed. In
Section 3.2, the optimization model of the sparse semicircular FDA is derived, where only the elements’ positions are considered. It should be highlighted that the interelements’ spacing in sparse semicircular FDAs is not an integer multiple of the initial interelements’ spacing. Note that the two elements at both ends of the array were retained to ensure that the array’s aperture remained unchanged after the optimization.
3.1. Thinned Transmit–Receive Beamforming of Semicircular FDAs
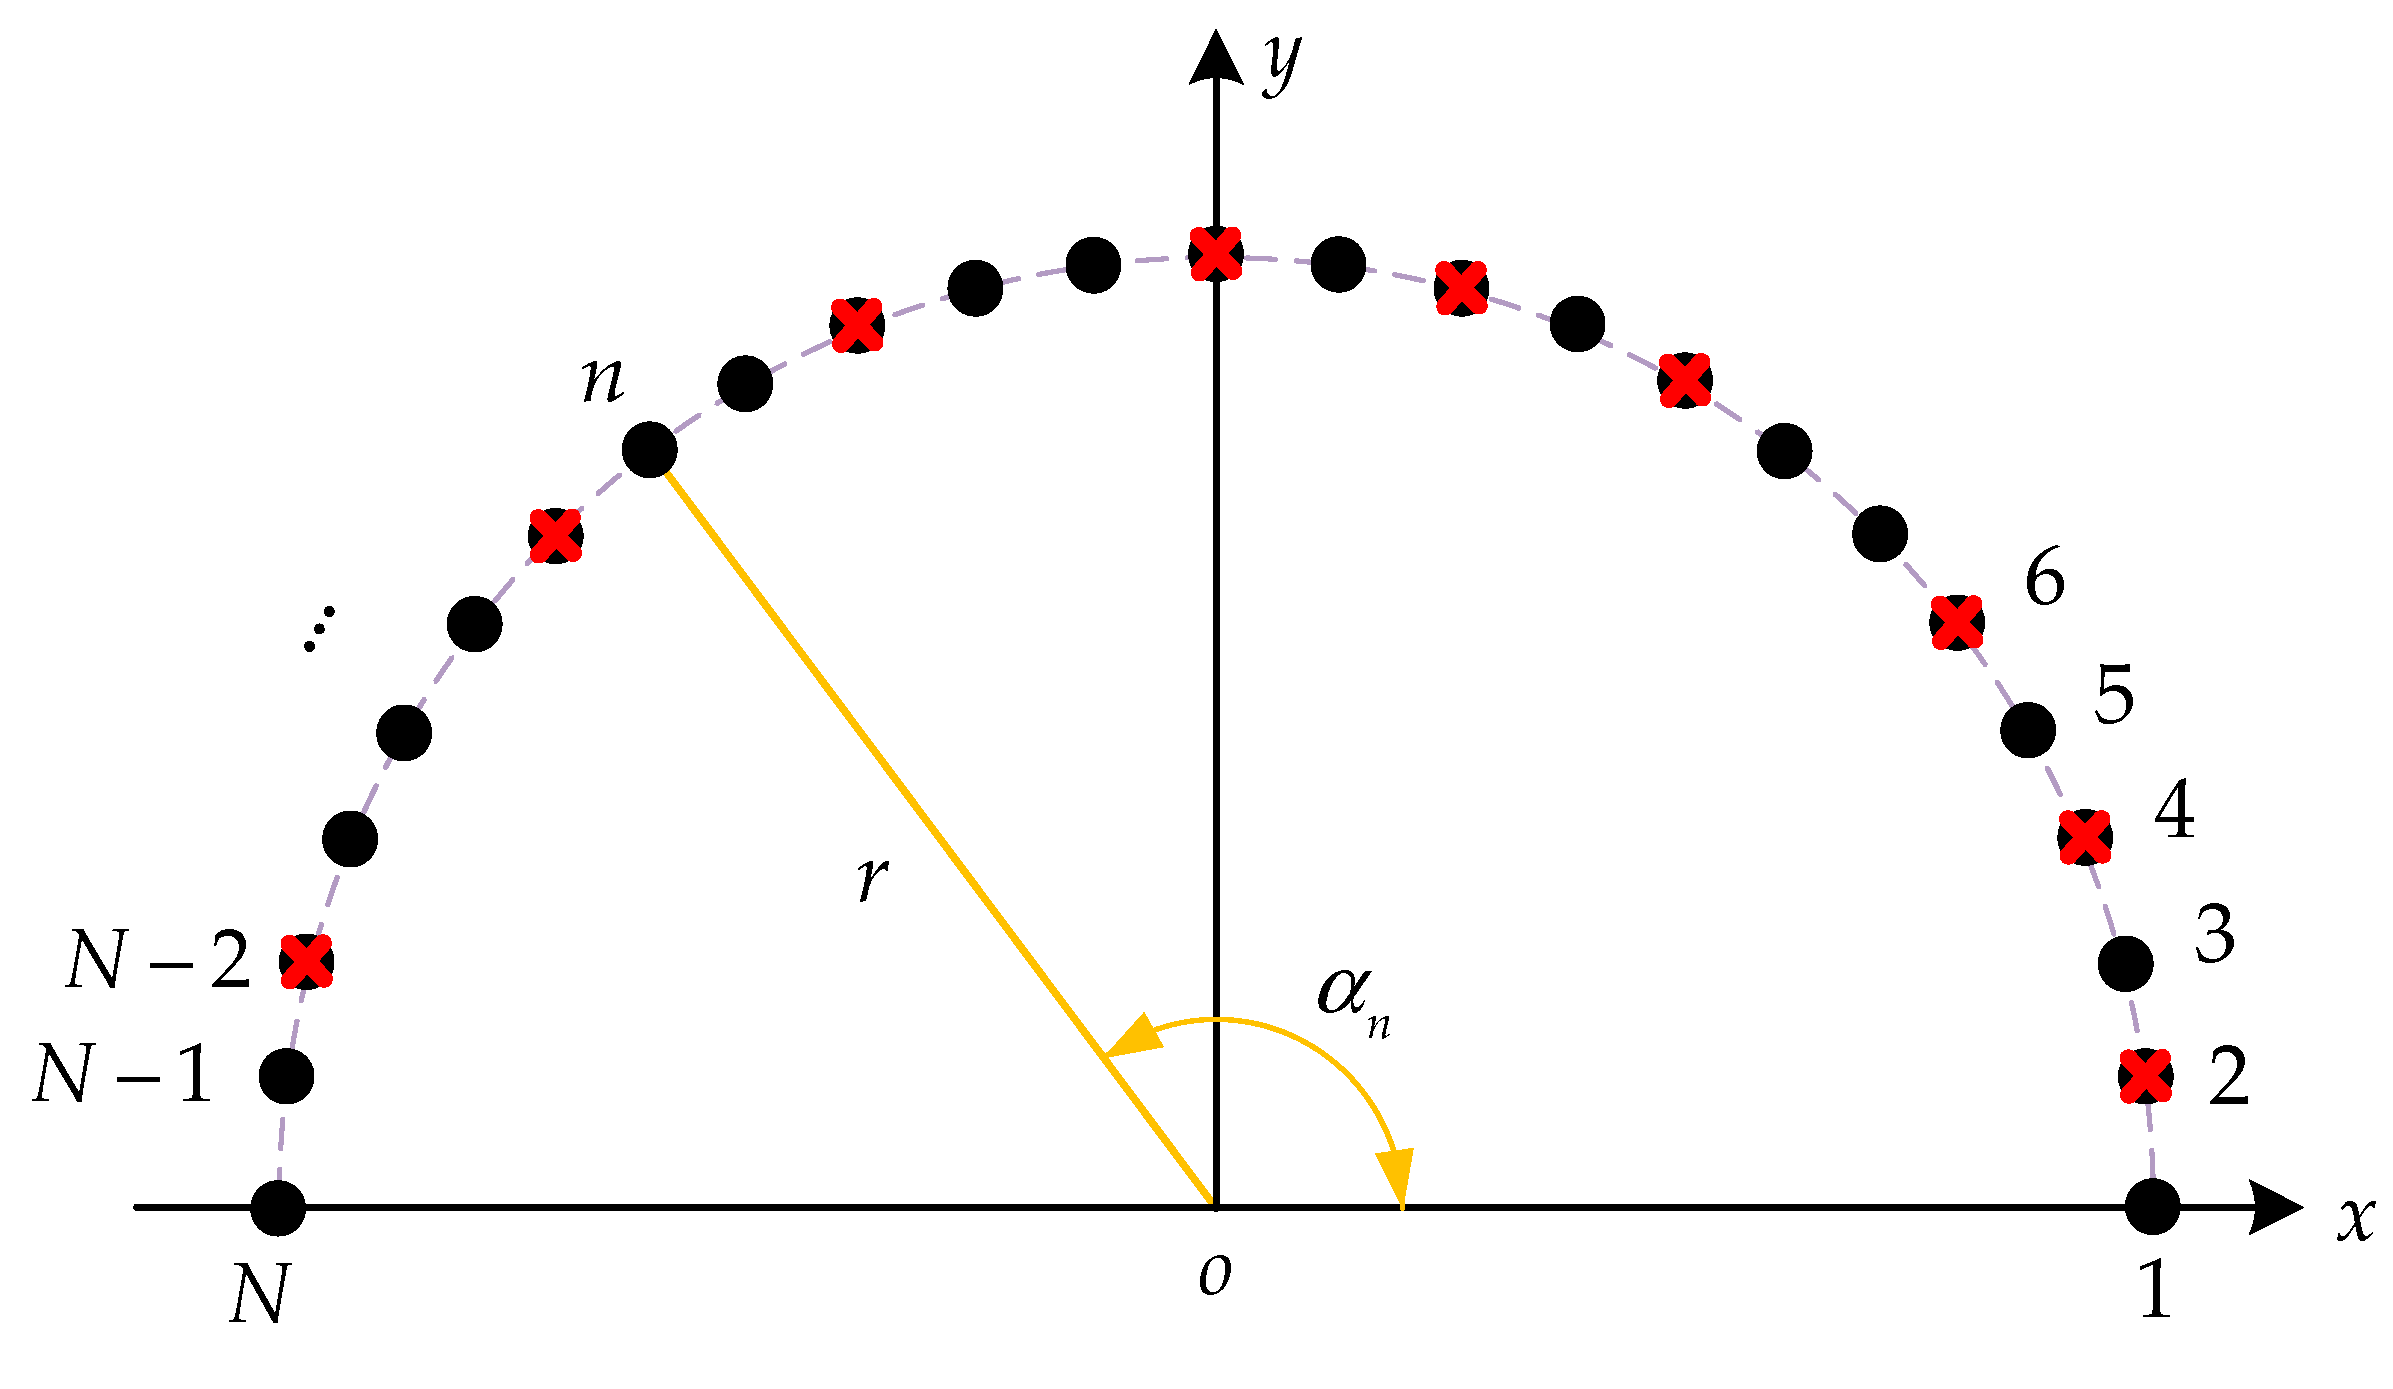
As depicted in
Figure 3, an illustration of the configuration of the thinned semicircular FDA is provided, where a series of black solid points is used to represent the full uniform semicircular array consisting of
N array elements. The red ‘×’ means that the elements are deactivated/removed from the uniform full array. Therefore, the remaining elements formed the non-uniform semicircular FDA with the spacing of the array’s elements being an integer multiple of a basic quantity. The aim in this subsection was to seek for an array configuration and its corresponding excitations simultaneously to make the generated beampattern approximate the desired beampattern as closely as possible.
The transmit–receive power pattern of the semicircular FDA can be expressed as
where
is the transmit–receive weight vector of the semicircular FDA and
. The superscripts
and
represent the transpose operator and the conjugate transpose operator, respectively.
represents the transmit–receive covariance matrix of the semicircular FDA, and
is the transmit–receive steering vector with
.
Note that the transmit–receive weight vector
plays an important role in the beamforming of thinned semicircular FDAs, rewritten the basic entry
of
as
where
represents the excitation amplitude of the
mth receiving element, and
is the selection variable. In particular,
indicates that the
mth element works, and
means that the
mth element does not work. To ensure that the array’s aperture did not change after the thinned optimization, it was necessary to retain the two elements located on the left and right boundaries of the semicircular FDA, i.e., when
and
,
.
For the optimization problem of the thinned semicircular FDA, the transmit–receive weight vector
of the semicircular FDA was incorporated into the optimization problem. The goal was to find the best weight vector
such that the generated beampattern
was, in some sense, the best approximation of the desired pattern
. The error function was defined as the integral of the weighted error between the currently generated beampattern and the desired beampattern in the range and angle space, and could be constructed as
where
represents the total observation area,
is the importance weight function, and
is generated by integration in the angle dimension.
The characteristics of the desired beampattern are described as
where
in (15) is the direction of the mainlobe;
,
,
, and
are the four prescribed edge points of the mainlobe in the range and angle dimensions in (16).
in (17) represents the expected position of the mainlobe, and
represents the acceptable peak SLL.
Therefore, the objective function of the transmit–receive beamforming optimization of the thinned semicircular FDAs can be established as
where
is updated iteratively. Considering discrete sampling, Equation (18) can be expressed as
According to the analysis above, the fitness function of the problem of transmit–receive beampattern synthesis for the thinned semicircular FDA can be expressed as
where
, and
denote the
ith and
jth sample points in the range and angle dimensions, respectively.
It is known that the GA is widely used in the synthesis of thinned arrays due to its unique 0 and 1 characteristics. Therefore, the GA was adopted here, and the corresponding GA-based procedures used to solve the thinned optimization above is provided in Algorithm 1, where N represents the number of elements of the full semicircular FDA, is the number of elements after synthesis of the thinned array, Q is the initial population, L is the number of iterations, is the probability of crossover, and is the probability of mutation.
Therefore, the transmit–receive beampattern of a semicircular FDA after synthesis of the thinned array can be written as
| Algorithm 1. GA-based optimization procedures of thinned semicircular FDAs |
| Input: |
| Step 1: Initialize Q populations, and each population has individuals. Under the constraint of , it is encoded by a decimal gene string. Set the generation number of l as . |
| Step 2: The fitness value of each individual is calculated according to (20). |
| Step 3: Select the optimal configuration parameters which can generate the minimum . |
| Step 4: Select a descendant from the elites of the last generation. |
| Step 5: New populations are generated according to the probability of crossover and the probability of mutation . |
| Step 6: Update l to , repeat Steps 2 to 5 until the maximum number of iterations L has been reached, and determine the optimal distribution of the elements’ positions and the distribution of the amplitude values. |
Step 7: Determine the optimal transmit–receive thinned weight vector .
Output: The array’s configuration and |
3.2. Sparse Transmit–Receive Beamforming of Semicircular FDAs
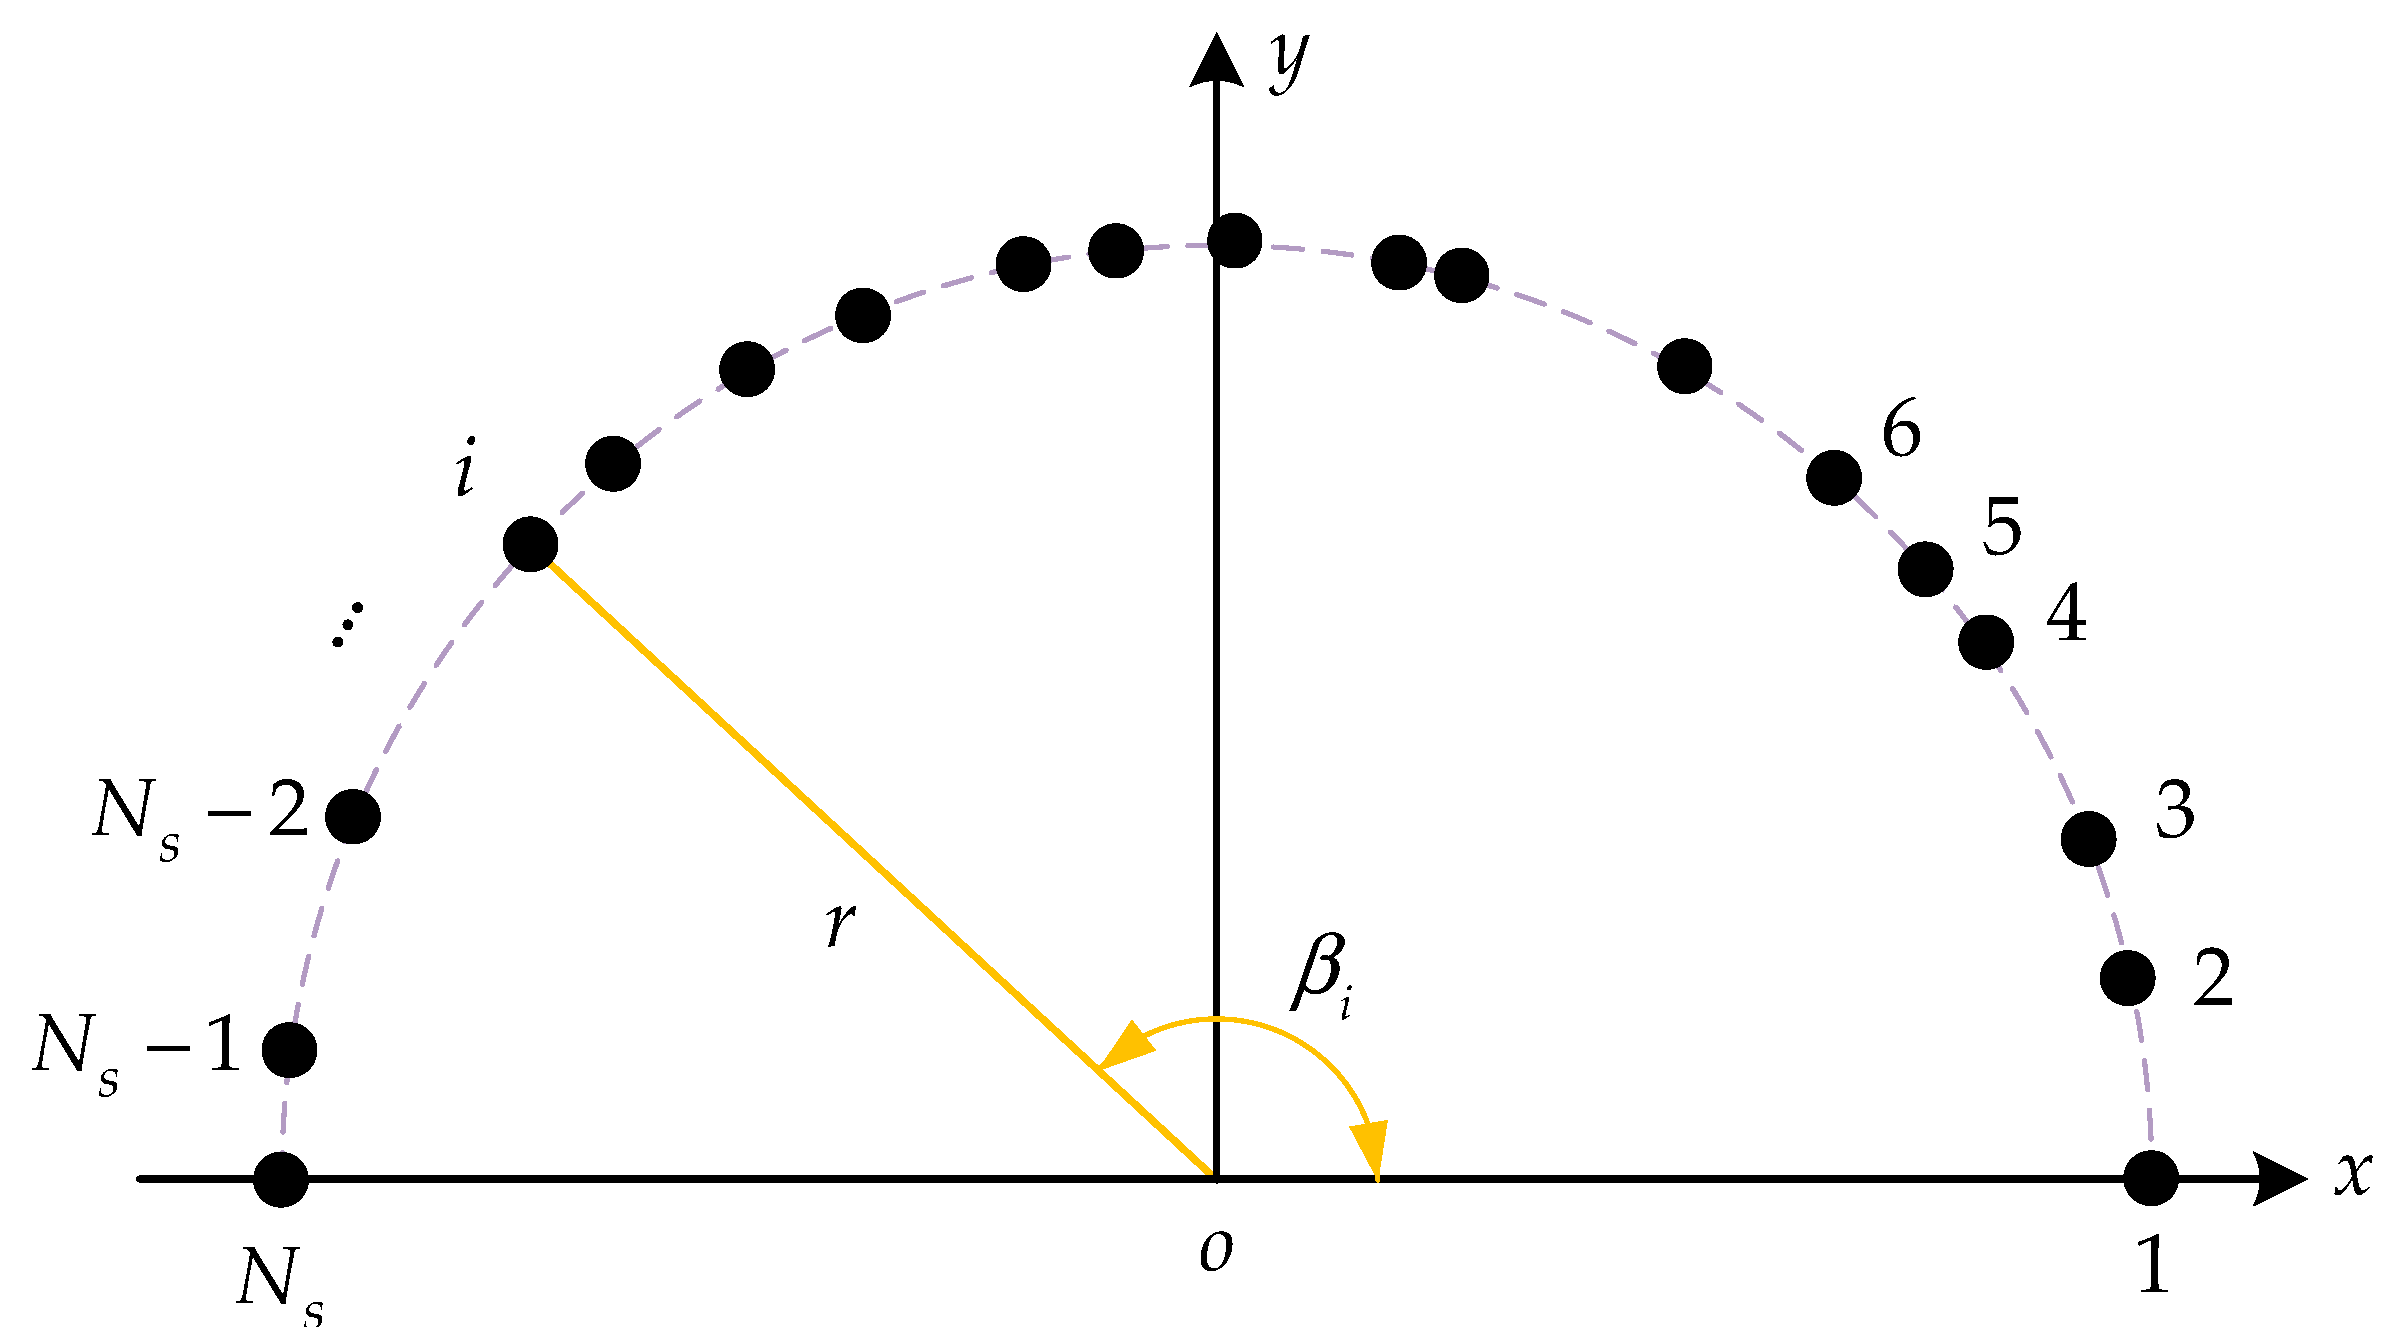
The model of an array with a non-uniform sparse semicircular FDA with
elements is shown in
Figure 4. All the elements are randomly distributed on a semicircular platform with the radius
r in the plane.
According to Equation (11), the transmit–receive array factor of sparsely distributed semicircular FDAs can be expressed as
where
is the angle parameter of the
th element deviating from the positive
x-axis, which is used to describe the position of the
ith element. All the elements’ positions are represented by a vector, i.e.,
, which is defined as
A new coding method is adopted. For a sparse array where the number of elements is and the total length is , the positions of the first element and the last element are already determined, i.e., , . Only the positions of the remaining elements need to be determined. This method uses decimal coding to quantify the distributed parameters.
In order to reduce the mutual coupling between the elements, there are certain requirements for the positions of adjacent elements. The interval of the angles between two adjacent elements of a semicircular FDA can be expressed as
where
is the minimum angle interval between two adjacent elements. The minimum angle interval
can be calculated from the minimum distance interval
and the semicircular FDA radius
r by the cosine theorem, as follows
where the minimum distance interval
is
.
Therefore, the azimuth angle of the
nth element should satisfy the following constraint
If we split
into
and
, the following equation can be obtained
In order to guarantee that Equations (24) and (27) hold, there must be
From Equations (26) and (27), it can be obtained that
From the two equations above, it can be seen that
In order to satisfy the constraint in (31), it is necessary to ensure that the generated random number
satisfies
and, after sorting it from small to large,
can be expressed as
Through the operation above, the value of an individual gene’s angle is indirectly converted into the difference in angle, which can reduce the searching space and consequently improve the efficiency of searching.
In the following, the element position vector
is incorporated into the sparse optimization problem of a semicircular FDA, i.e.,
where the expected beampattern is the same as that provided in
Section 3.1.
The objective function in the optimization process is as follows
The model optimizes the position of the element by optimizing the value of , so that the generated beampattern can approximate the desired one.
Considering discrete sampling, Equation (34) can be equivalently expressed as
According to the analysis above, the fitness function of the synthesis of the transmit–receive beampattern of the sparse semicircular FDA can be expressed as
The specific implementation of sparse transmit–receive beamforming of semicircular FDAs based on GA is provided in Algorithm 2.
| Algorithm 2. GA-based sparse optimization procedures of semicircular FDAs |
| Input: |
| Step 1: Initialize Q populations, symbolizing the distance vector from the element to the reference element, where each population has individuals. |
| Step 2: Generate an intermediate initial population with the difference in the adjacent elements’ angles as the individuals. |
| Step 3: Arrange each individual’s genes in an ascending order, transform the population of the differences in angle into the angle interval population. |
| Step 4: Let the generation and calculate the fitness value of each individual according to (36). |
| Step 5: Select the optimal parameters which can generate the minimum . |
| Step 6: The individual is updated according to the probability of crossover and the probability of mutation . |
| Step 7: Arrange the genes in an ascending order, convert them into a population with angular intervals, and update l to l = l + 1. |
| Step 8: Repeat Step 4 to Step 7. The new populations are evaluated. Iterations continue until the maximum number of iterations has been reached. |
Step 9: Determine the optimal element position vector .
Output: |
4. Numerical Results and Discussion
As described in this section, simulation experiments were carried out to examine the effectiveness of the proposed thinned and sparse transmit–receive beamforming of semicircular FDAs. The whole observation area was set as
:
,
, and the space of interest was
. The sparse ratio was defined as
. Other specific parameters of the simulation are listed in
Table 1.
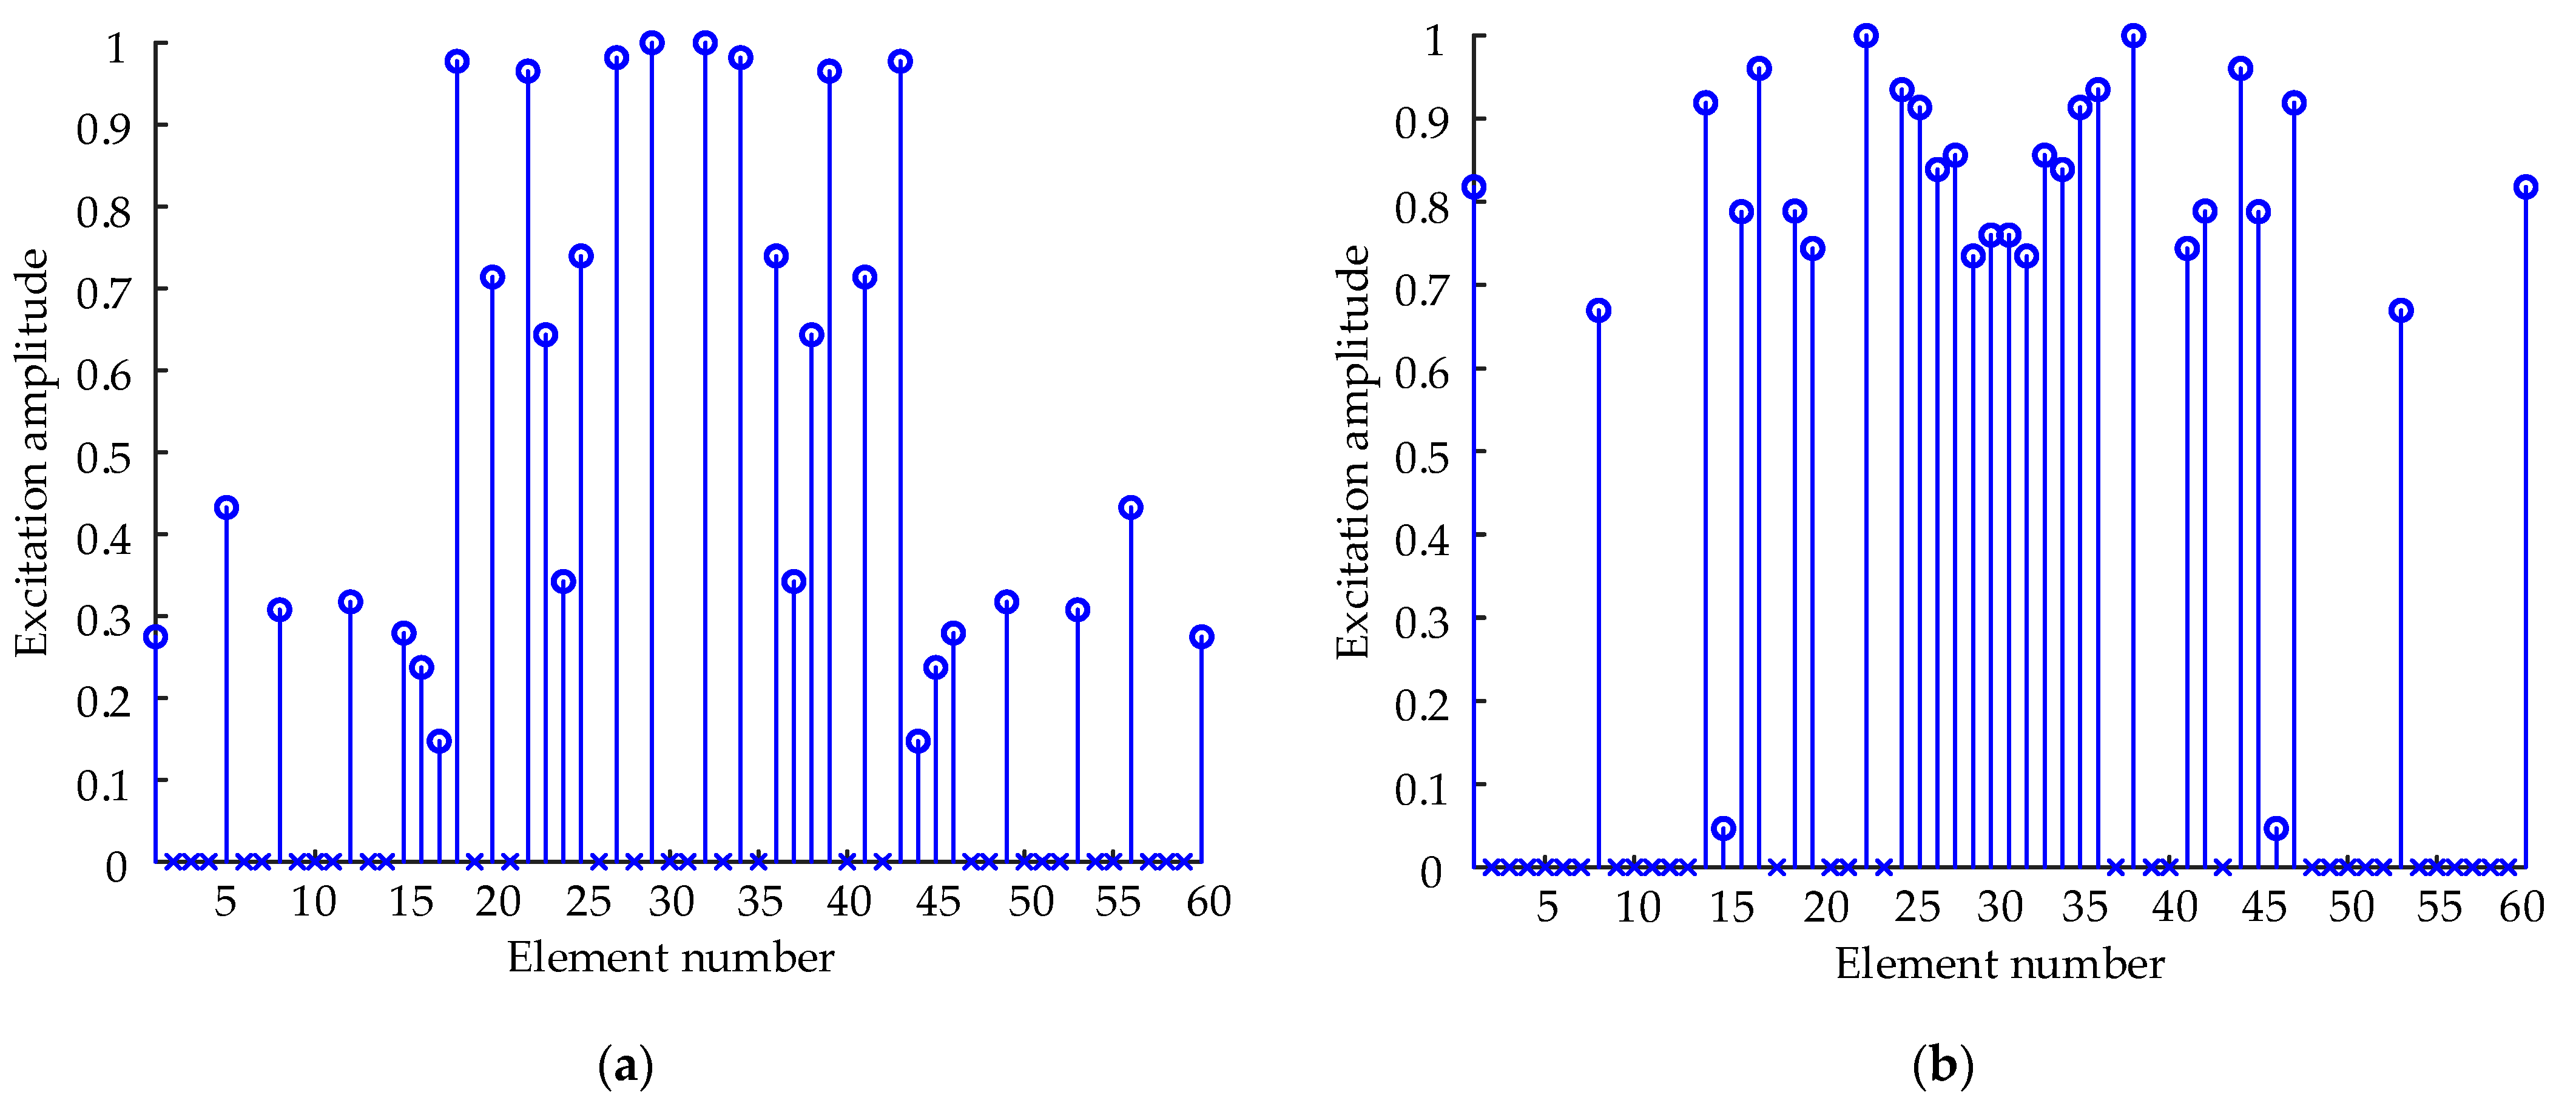
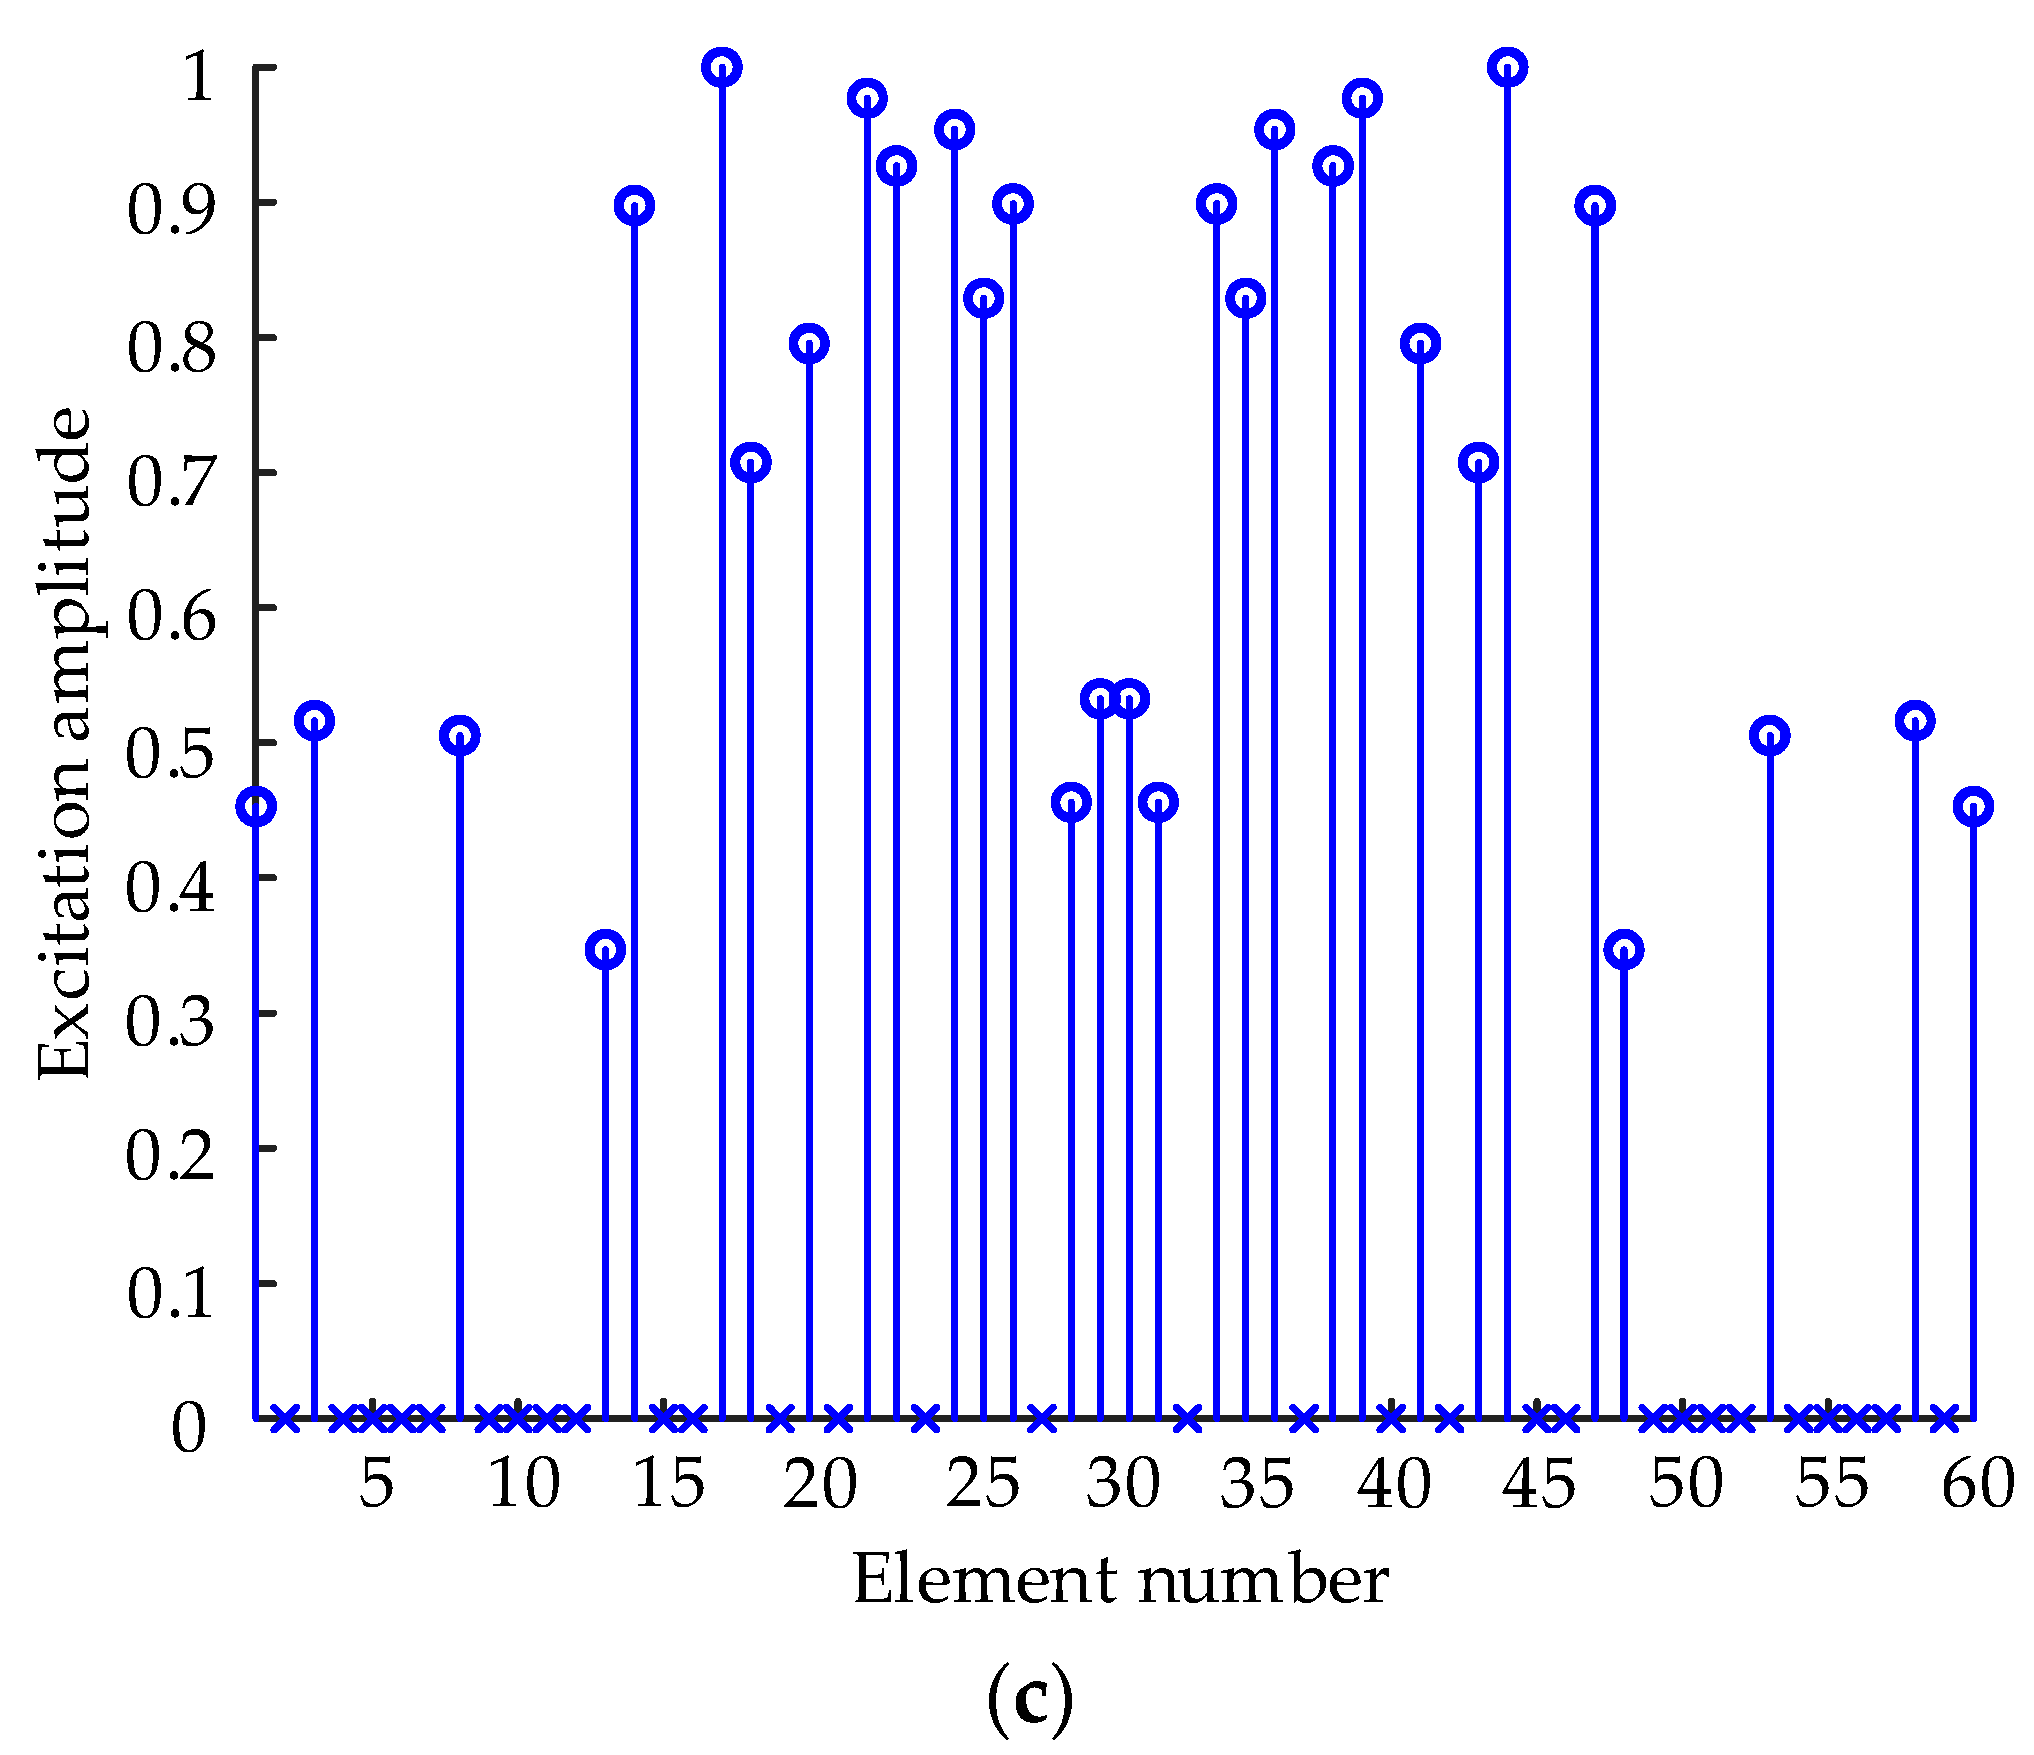
Figure 5 provides the optimal positions of the elements and the distributions of amplitude of the thinned semicircular FDAs with log-FO, sin-FO, and tanh-FO, where a series of circles is used to represent the selected elements and the corresponding excitation amplitudes, while ‘×’ is used to represent the unselected elements.
Figure 6 presents the distribution maps of the optimal positions of the elements of a semicircular FDA with log-FO, sin-FO, and tanh-FO after sparse distribution, where a series of circles is used to represent the distribution of elements in the full array, and a series of solid points is used to represent the distribution of the elements in the array of a sparse semicircular FDA. According to Equations (22)–(36), the synthesis of the sparse array took the elements’ spacing as the constraint condition and rearranged the other elements’ positions with the positions of the first and the last elements in the array being fixed.
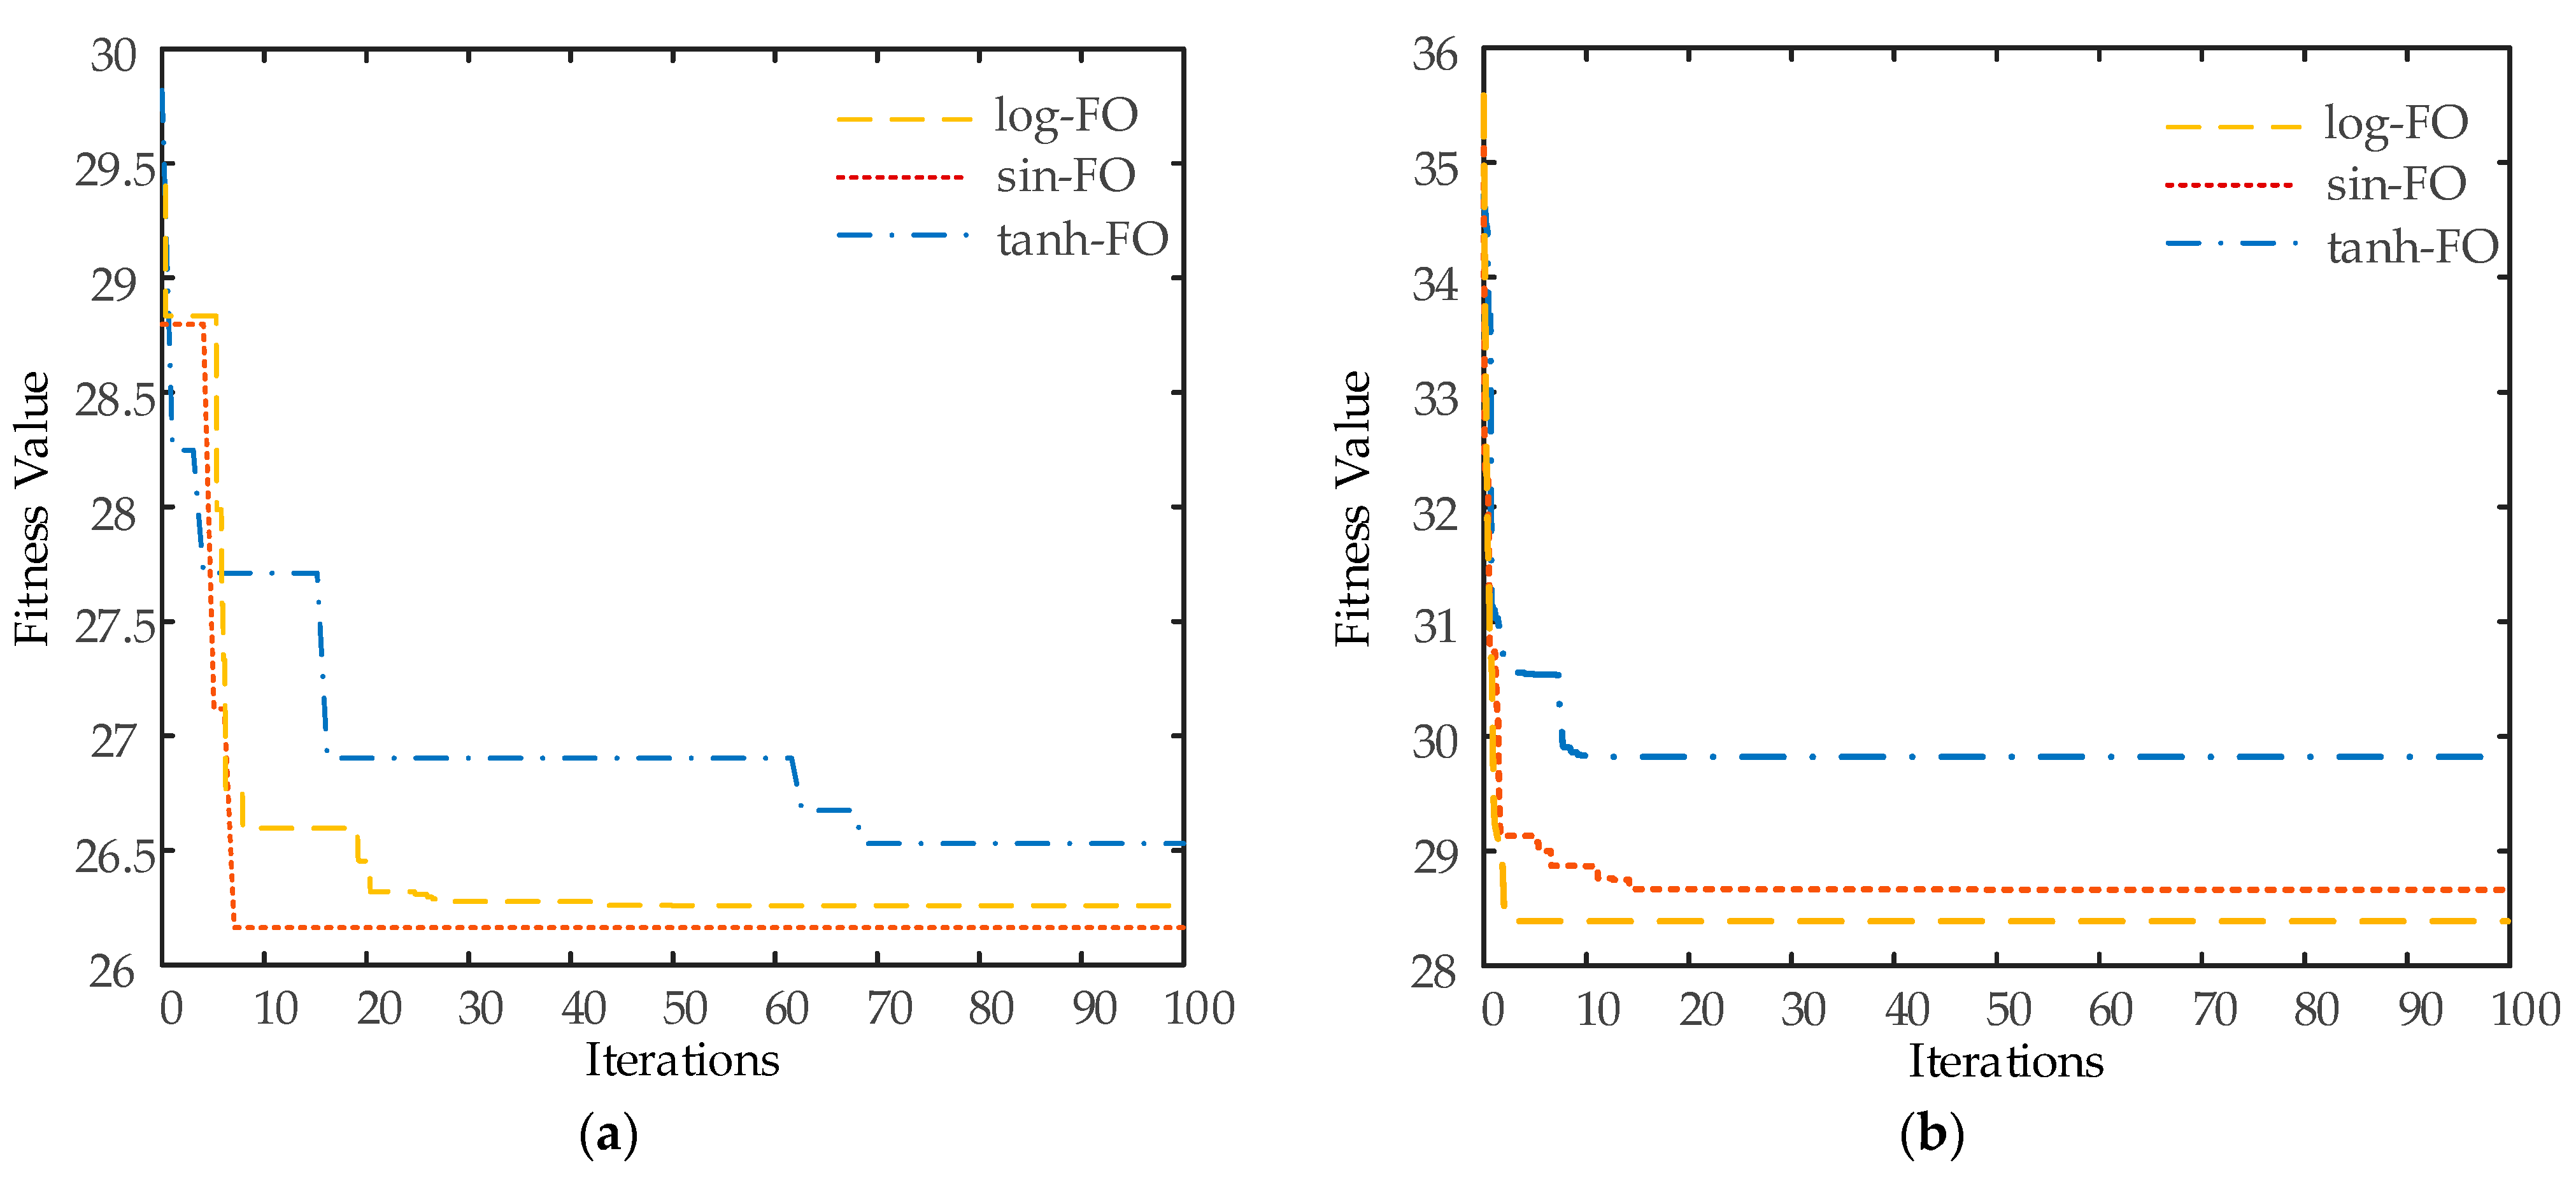
Figure 7 provides the convergent curves of the thinned and sparse synthesis of the semicircular FDAs with log-FO, sin-FO, and tanh-FO. From
Figure 7a, it can be seen that the fitness values decreased rapidly in the first 20 iterations and remained almost unchanged after 70 iterations. From
Figure 7b, we can see that the fitness values decreased rapidly in the 15 iterations and remained unchanged after 20 iterations.
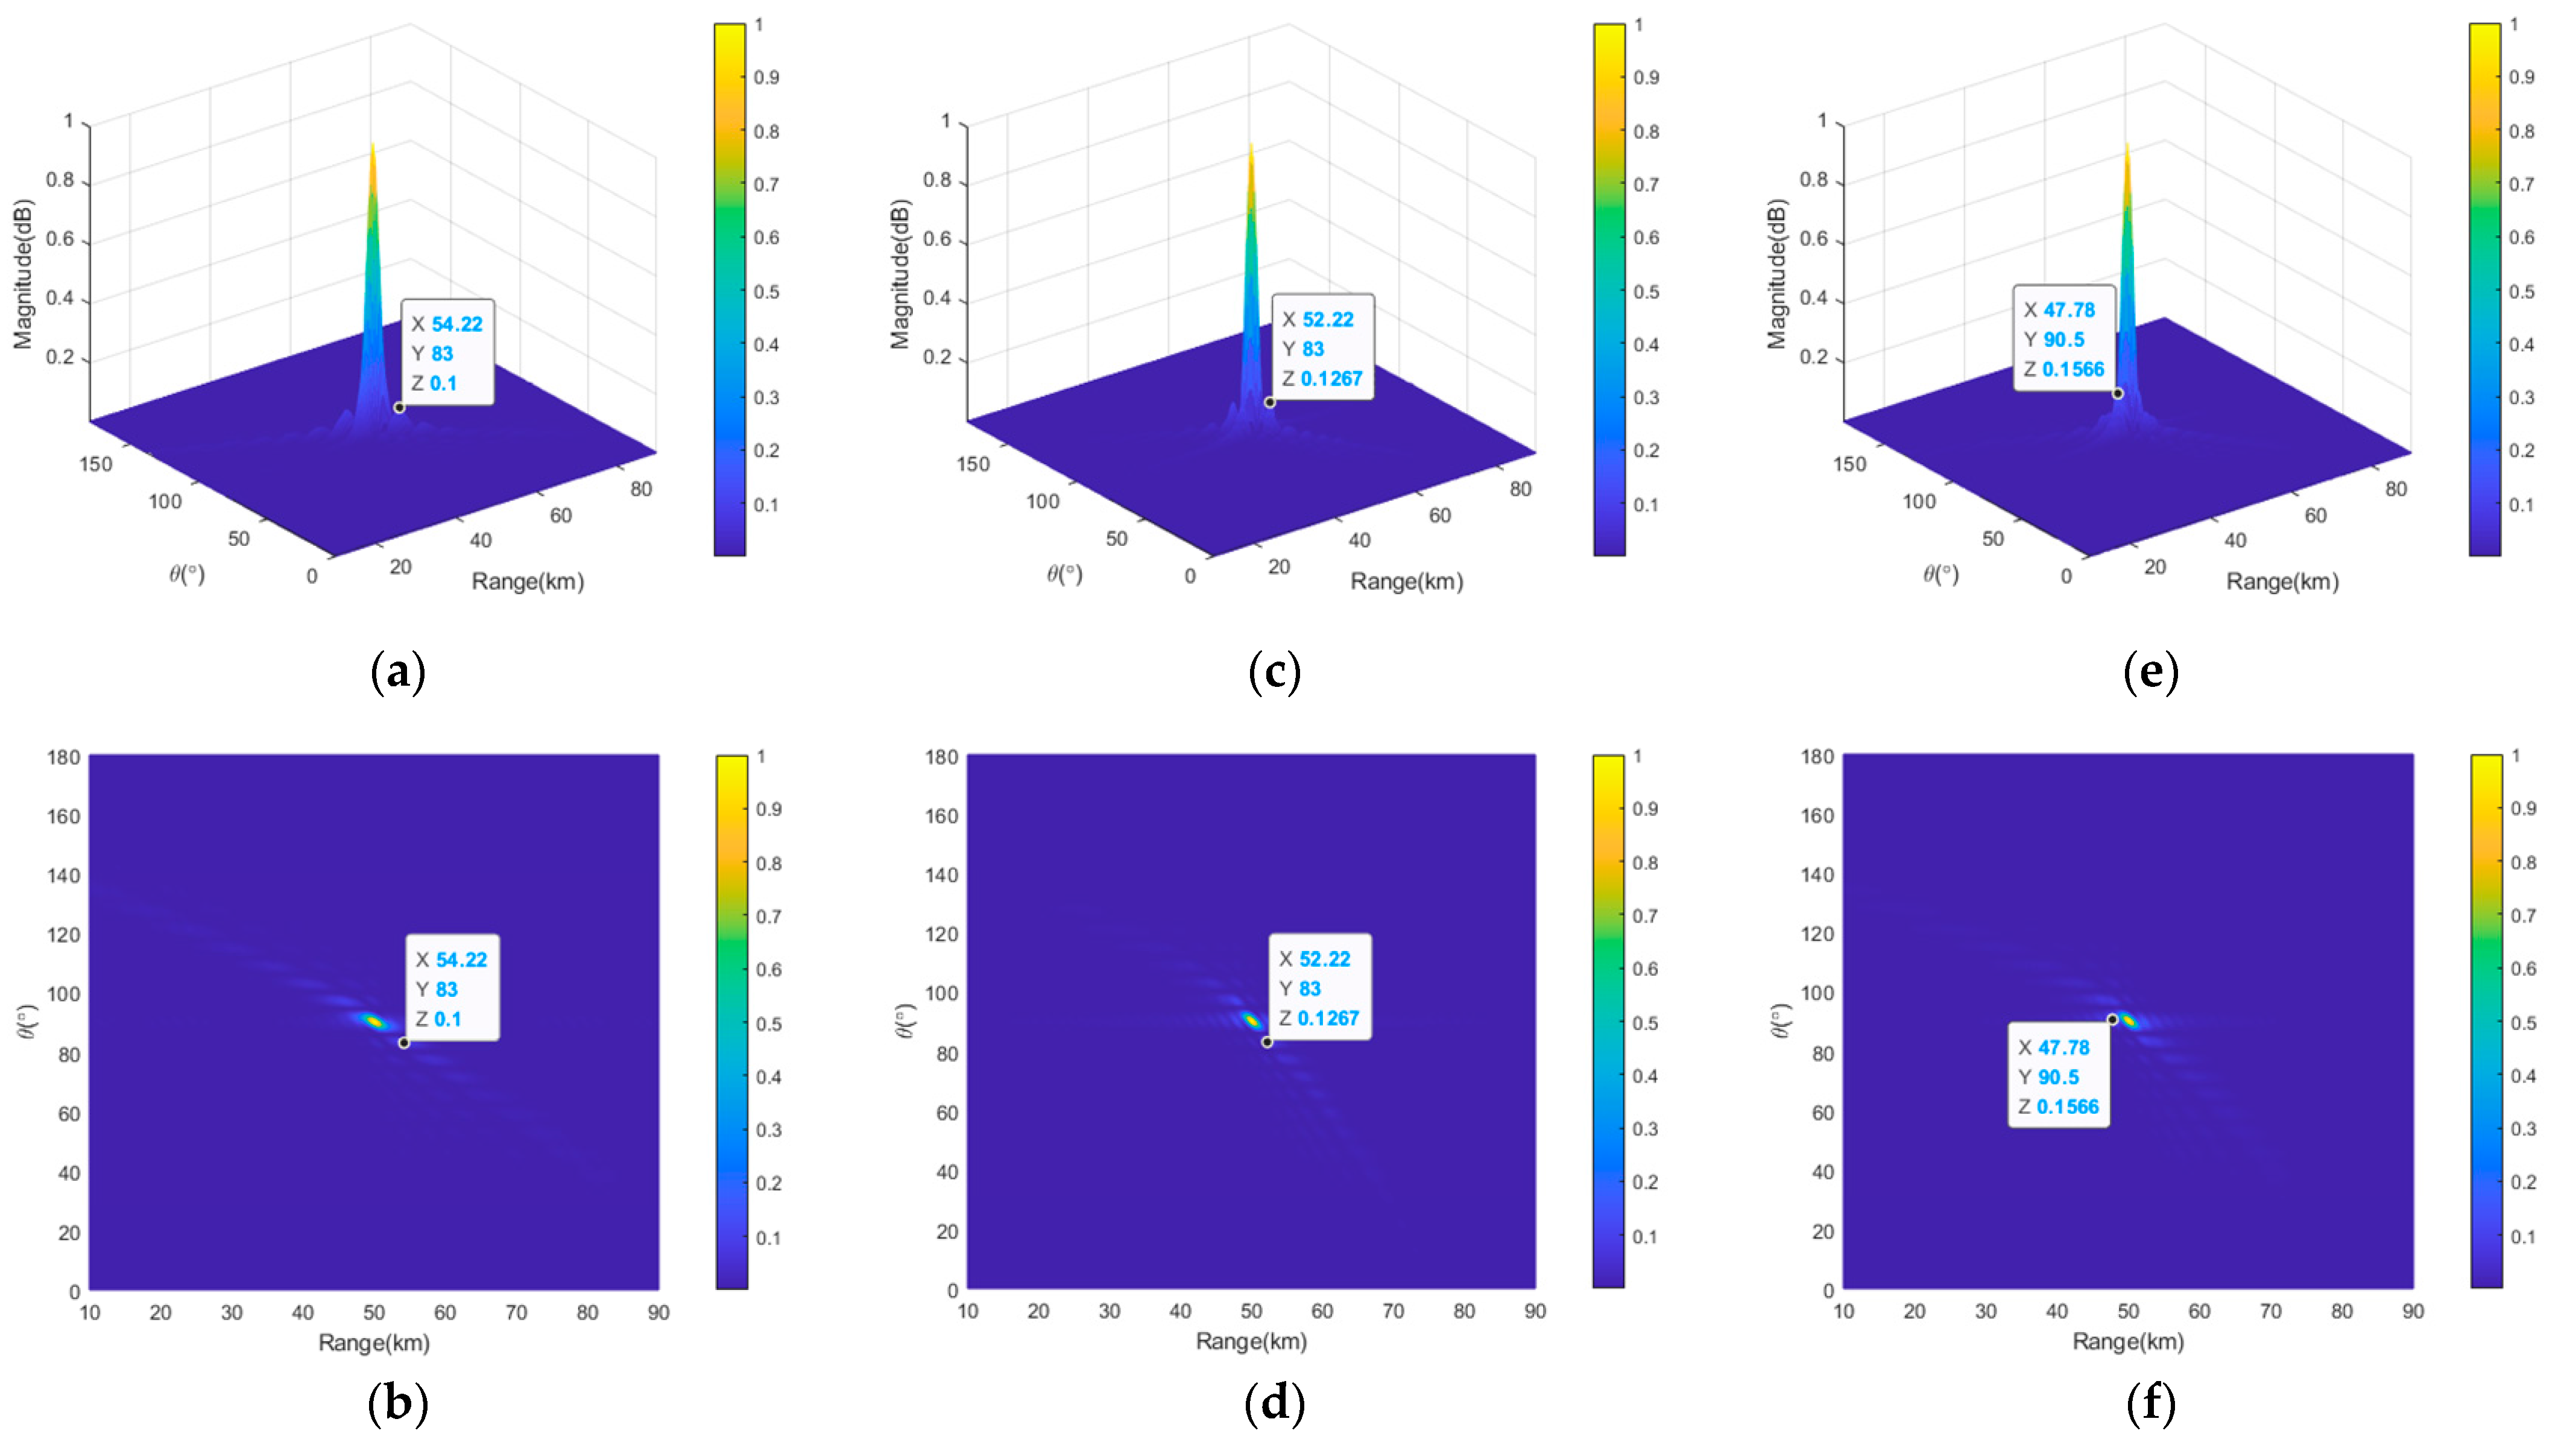
Figure 8 provides the transmit–receive beampatterns of the full semicircular FDAs with log-FO, sin-FO, and tanh-FO. As can be seen from this figure, only one mainbeam was generated in the desired location of
, and the peak SLLs were 10log10 (0.1) = −10 dB, 10log10 (0.1267) = −8.97 dB, and 10log10 (0.1566) = −8.05 dB, respectively, for these three full semicircular FDAs. The widths of the mainlobe of the transmit–receive beampattern of the full semicircular FDAs with log-FO, sin-FO, and tanh-FO were all 9° in the angle dimension, and the widths of the mainlobe in the range dimension wer 7.12 km, 3.56 km and 3.56 km, respectively, for log-FO, sin-FO, and tanh-FO.
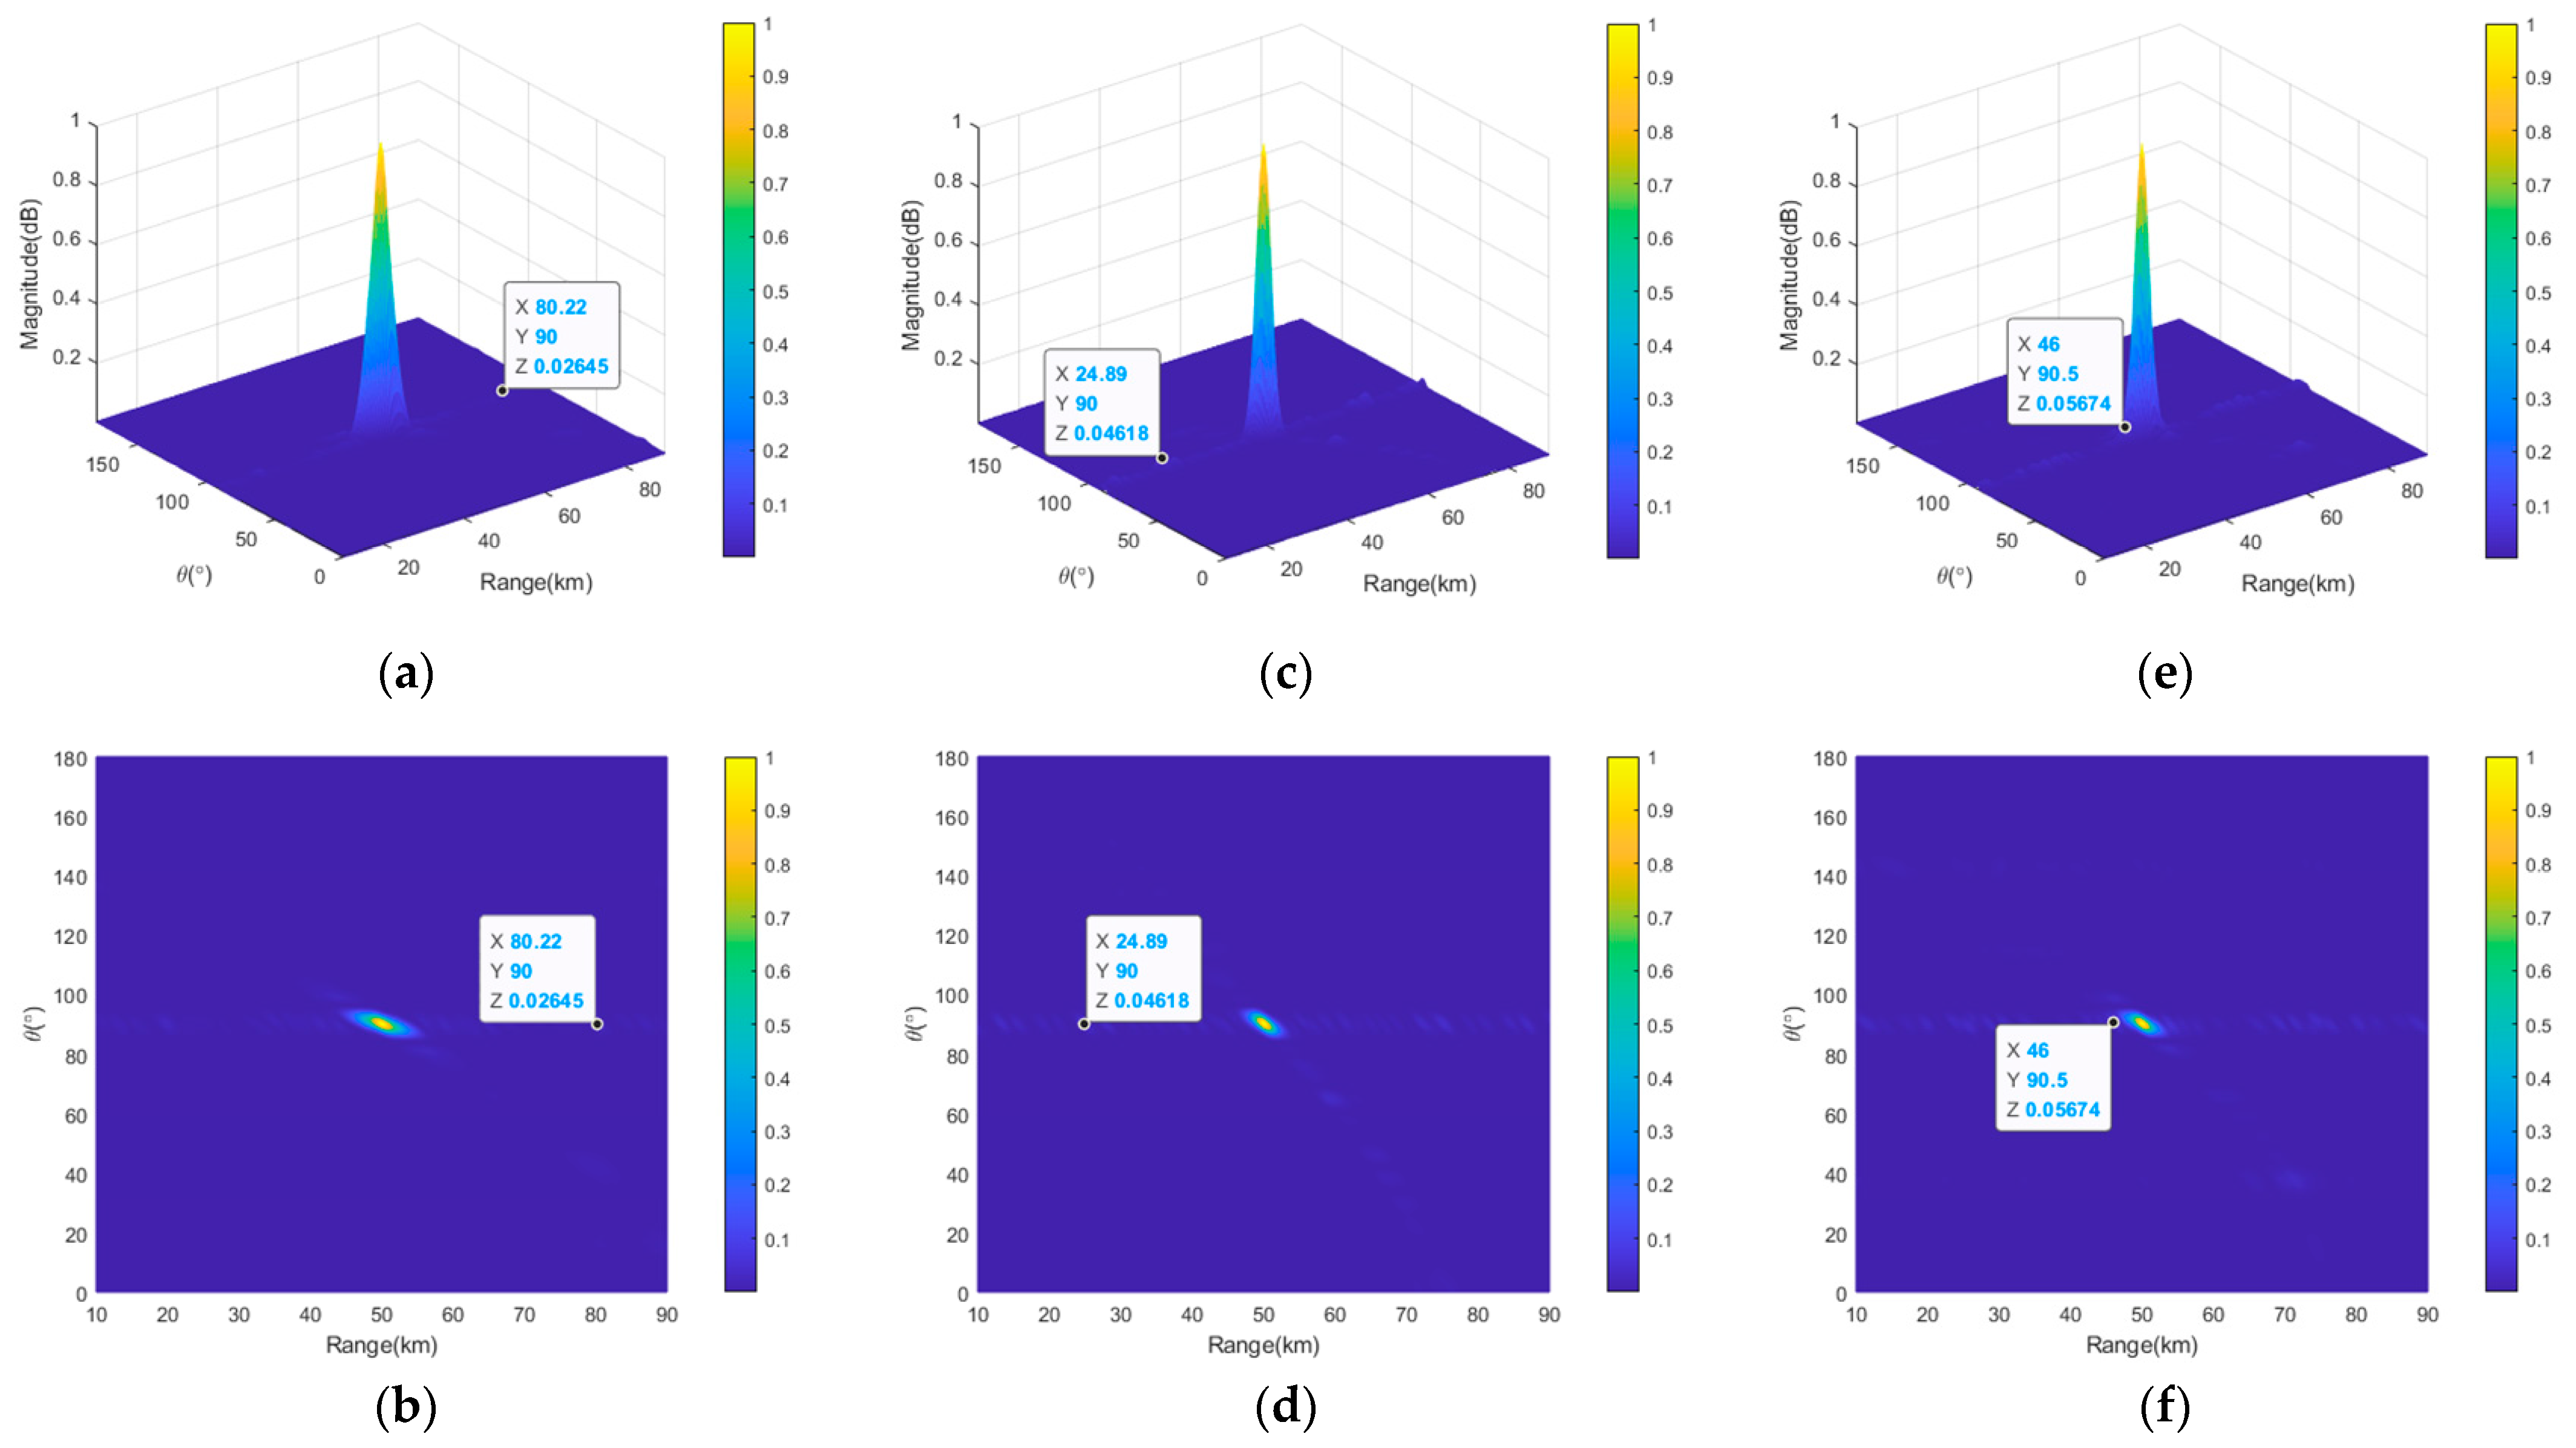
Figure 9 presents the transmit–receive beampatterns of the thinned semicircular FDAs with log-FO, sin-FO, and tanh-FO. As can be seen from this figure, similar phenomena can be seen, i.e., only one mainbeam was generated in the desired location of
. The peak SLLs lowered by 5.78 dB (from 10log10 (0.1) = −10 dB to 10log10 (0.02645) = −15.78 dB), 4.39 dB (from 10log10 (0.1267) = −8.97 dB to 10log10 (0.04618) = −13.36 dB), and 4.41 dB (from 10log10 (0.1566) = −8.05 dB to 10log10 (0.05674) = −12.46 dB), respectively, for log-FO, sin-FO, and tanh-FO. The widths of the mainlobes of the three thinned semicircular FDAs with log-FO, sin-FO, and tanh-FO were all 12° in the angle dimension, and the widths of the mainlobe in the range dimension were 12 km, 7.56 km and 7.12 km, respectively, for log-FO, sin-FO, and tanh-FO. Correspondingly, the widths of the mainlobe are all widened by 3° (from 9° to 12°) in angle dimension. The widths of the mainlobes were widened by 4.88 km (from 7.12 km to 12 km), 4 km (from 3.56 km to 7.56 km), and 3.56 km (from 3.56 km to 7.12 km) in the range dimension.
Figure 10 provides the transmit–receive beampatterns of the sparse semicircular FDAs with log-FO, sin-FO, and tanh-FO. It can also be clearly seen that only one mainbeam ws generated in the desired location of
. The peak SLLs were 10log10 (0.06038) = −12.19 dB, 10log10 (0.05448) = −12.64 dB, and 10log10 (0.07042) = −11.52 dB, respectively, for these three sparse semicircular FDAs. The widths of the mainlobe of the transmit–receive beampattern of the sparse semicircle-FDAs with log-FO, sin-FO, and tanh-FO were 10°, 9° and 10° in the angle dimension, and the widths of the mainlobe in the range dimension were 8.66 km, 4.88 km and 4.00 km, respectively. Compared with
Figure 8, the peak SLLs lowered by 2.19 dB (from 10log10 (0.1) = −10 dB to 10log10 (0.06038) = −12.19 dB), 3.67 dB (from 10log10 (0.1267) = −8.97 dB to 10log10 (0.05448) = −12.64 dB), and 3.47 dB (from 10log10 (0.1566) = −8.05 dB to 10log10 (0.07042) = −11.52 dB), respectively, for log-FO, sin-FO, and tanh-FO. The widths of the mainlobe were widened by 1° (from 9° to 10°), 0° (from 9° to 9°), and 1° (from 9° to 10°) in the angle dimension. The widths of the mainlobe were widened by 1.54 km (from 7.12 km to 8.66 km), 1.32 km (from 3.56 km to 4.88 km), and 0.44 km (from 3.56 km to 4 km) in the range dimension. Note that both in the thinned synthesis and in the sparse synthesis, the constraints imposed on the mainlobes’ widths were set as
in the angle dimension, which is the same as the counterpart before the synthesis, and
= 7.5 km, 4.0 km, and 4.0 km for the semicircular FDAs with log-FO, sin-FO, and tanh-FO, respectively, which were slightly larger than their counterparts in the range dimension before the synthesis. Comparisons between the thinned and sparse syntheses are listed in
Table 2. Moreover, it can be obviously seen from
Figure 8,
Figure 9 and
Figure 10 that the range-angle information decoupled beampattern of the semicircular FDAs with non-linearly varying FOs can be maintained after thinned and sparse synthesis.
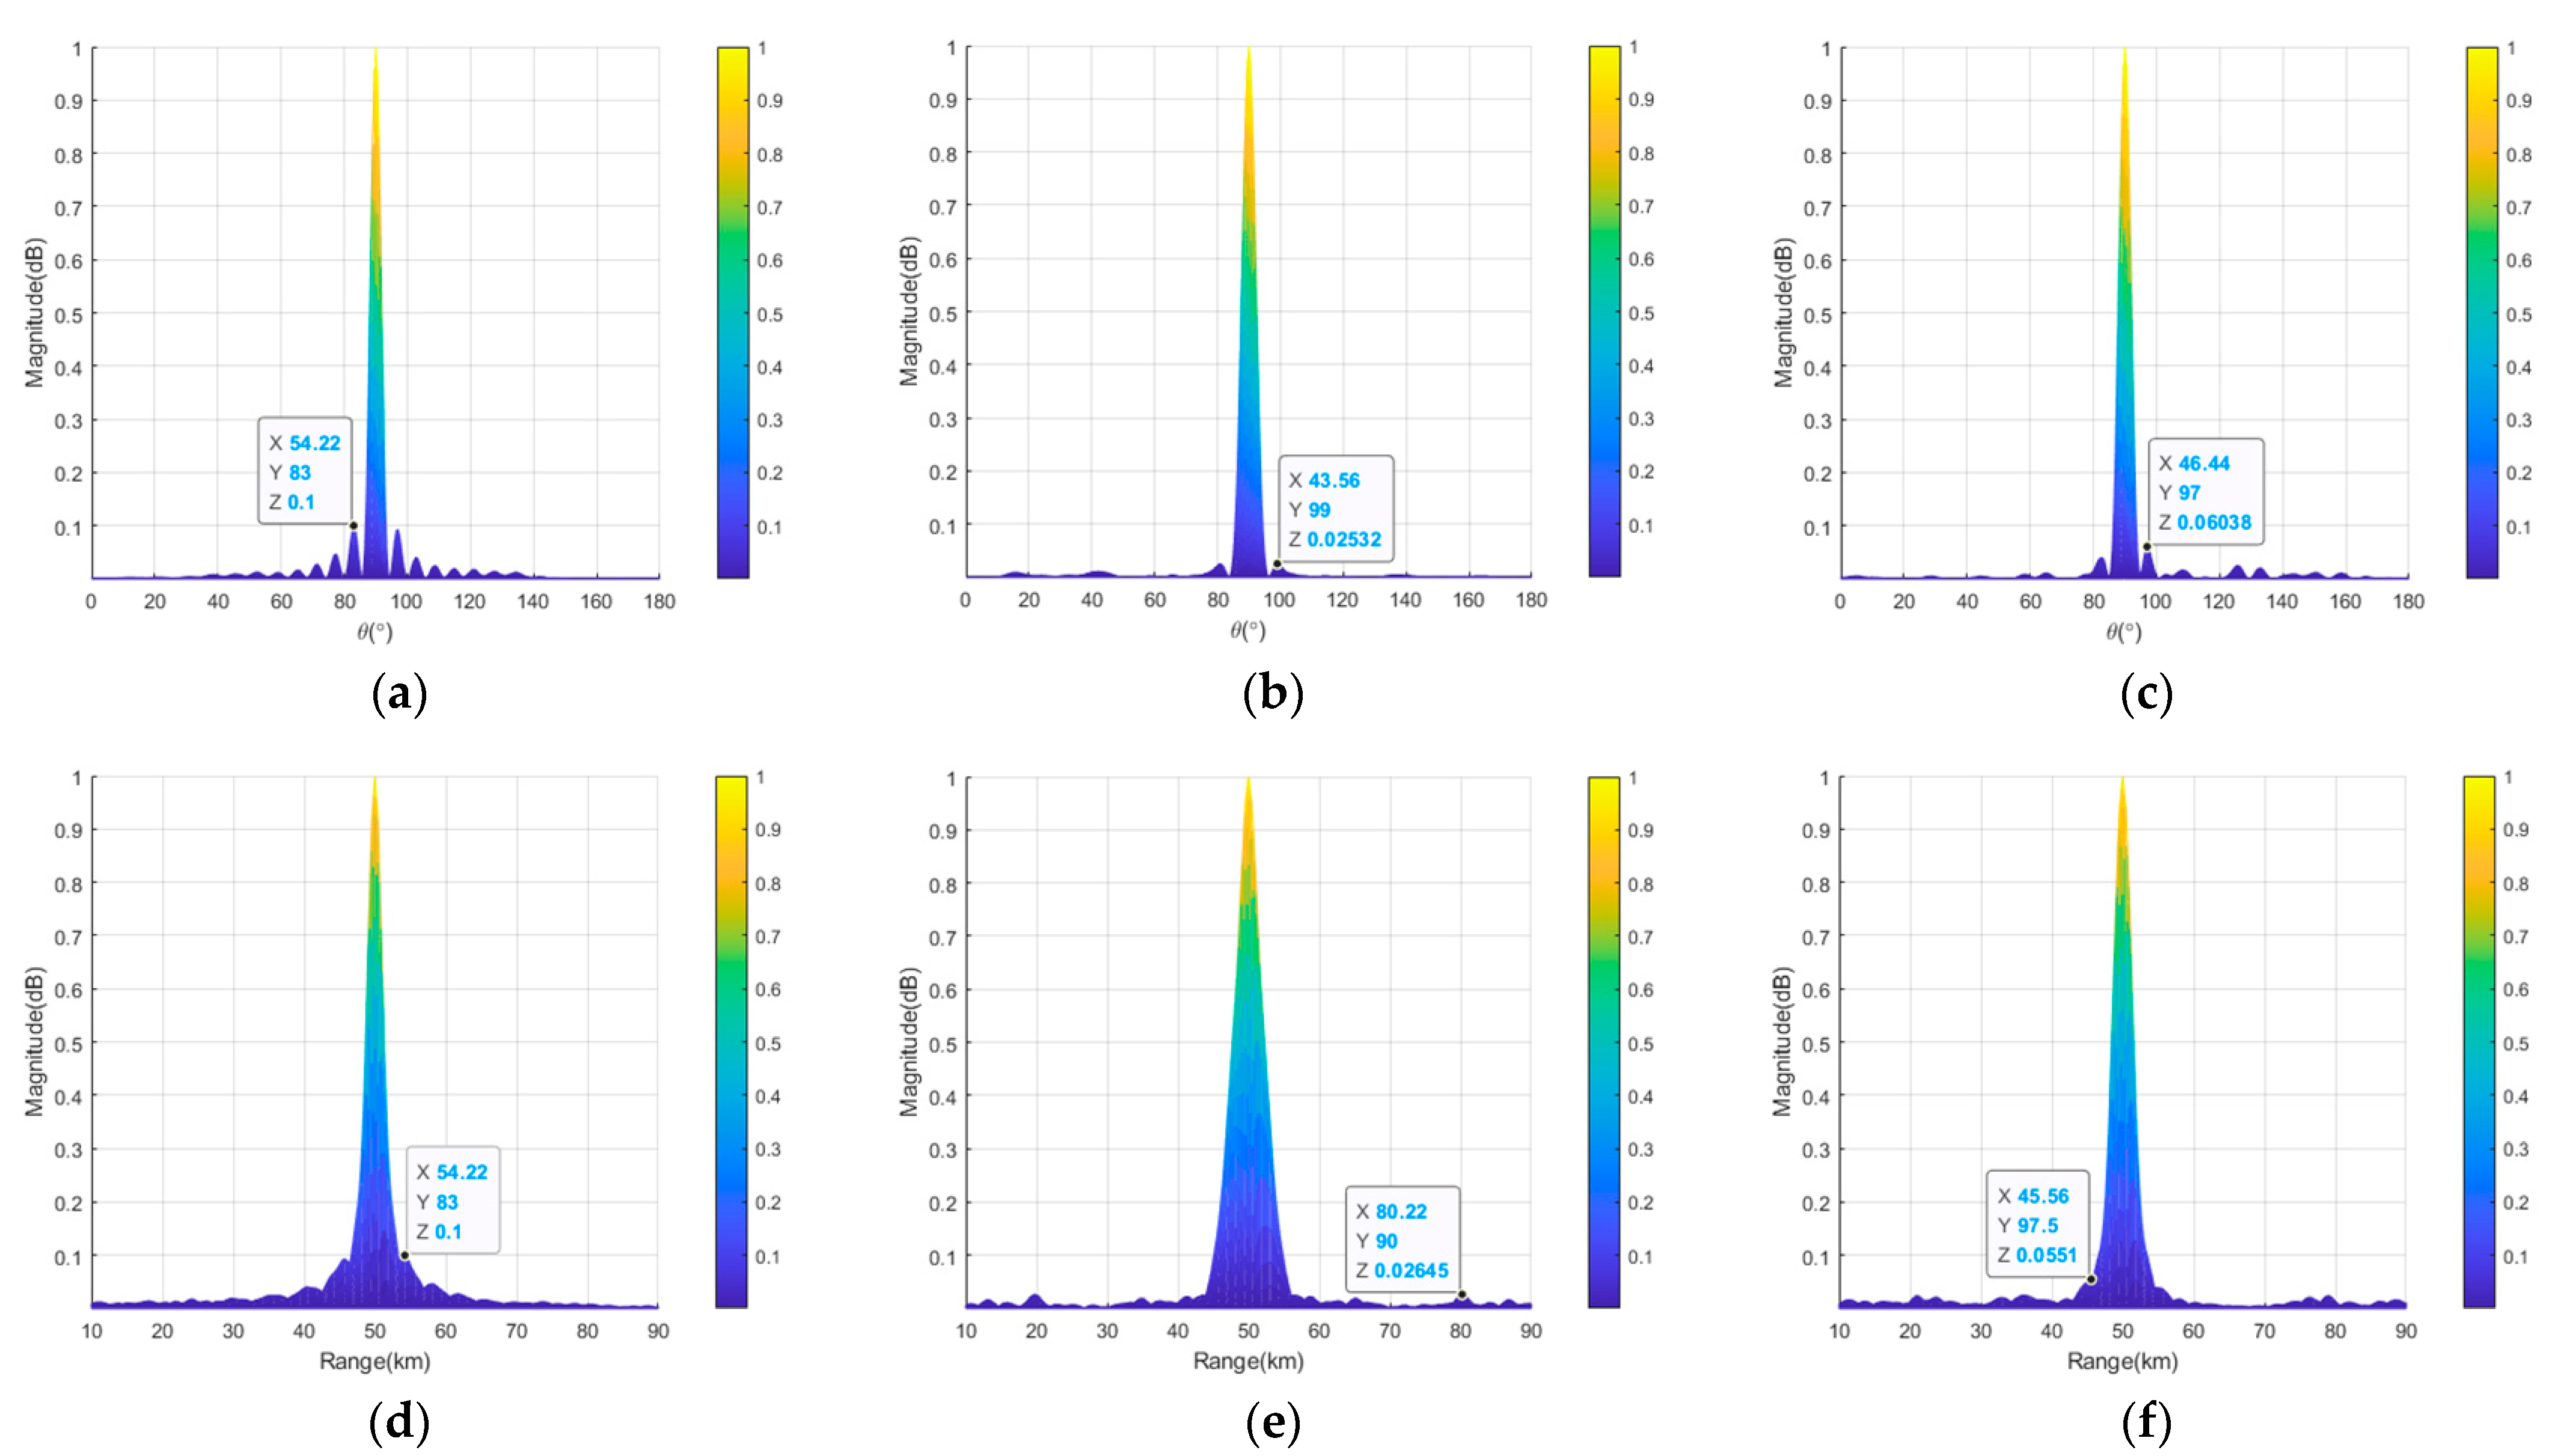
To further clearly compare the performance of the three semicircular FDAs before and after the thinned and sparse synthesis, the projections and profiles in the range and angle dimensions of the transmit–receive beampatterns are provided below.
Figure 11 shows the transmit–receive beampattern projections of the semicircular FDA with log-FO in the range and angle dimensions before and after thinned and sparse distribution. If we compare
Figure 11b,c with
Figure 11a, it can be seen that after the thinned and sparse synthesis, the peak SLL of the beampattern in the angle dimension was reduced by 5.97 dB and 2.19 dB, respectively (from 10log10 (0.1) = −10 dB to 10log10 (0.02532) = −15.97 dB and 10log10 (0.06038) = −12.19 dB). From
Figure 11d–f, it can be seen that after thinned and sparse synthesis, the peak SLL in the range dimension was reduced by 5.78 dB and 2.59 dB (from 10log10 (0.1) = −10 dB to 10log10 (0.02645) = −15.78 dB and 10log10 (0.0551) = −12.59 dB). The details of the peak SLLs are listed in
Table 3.
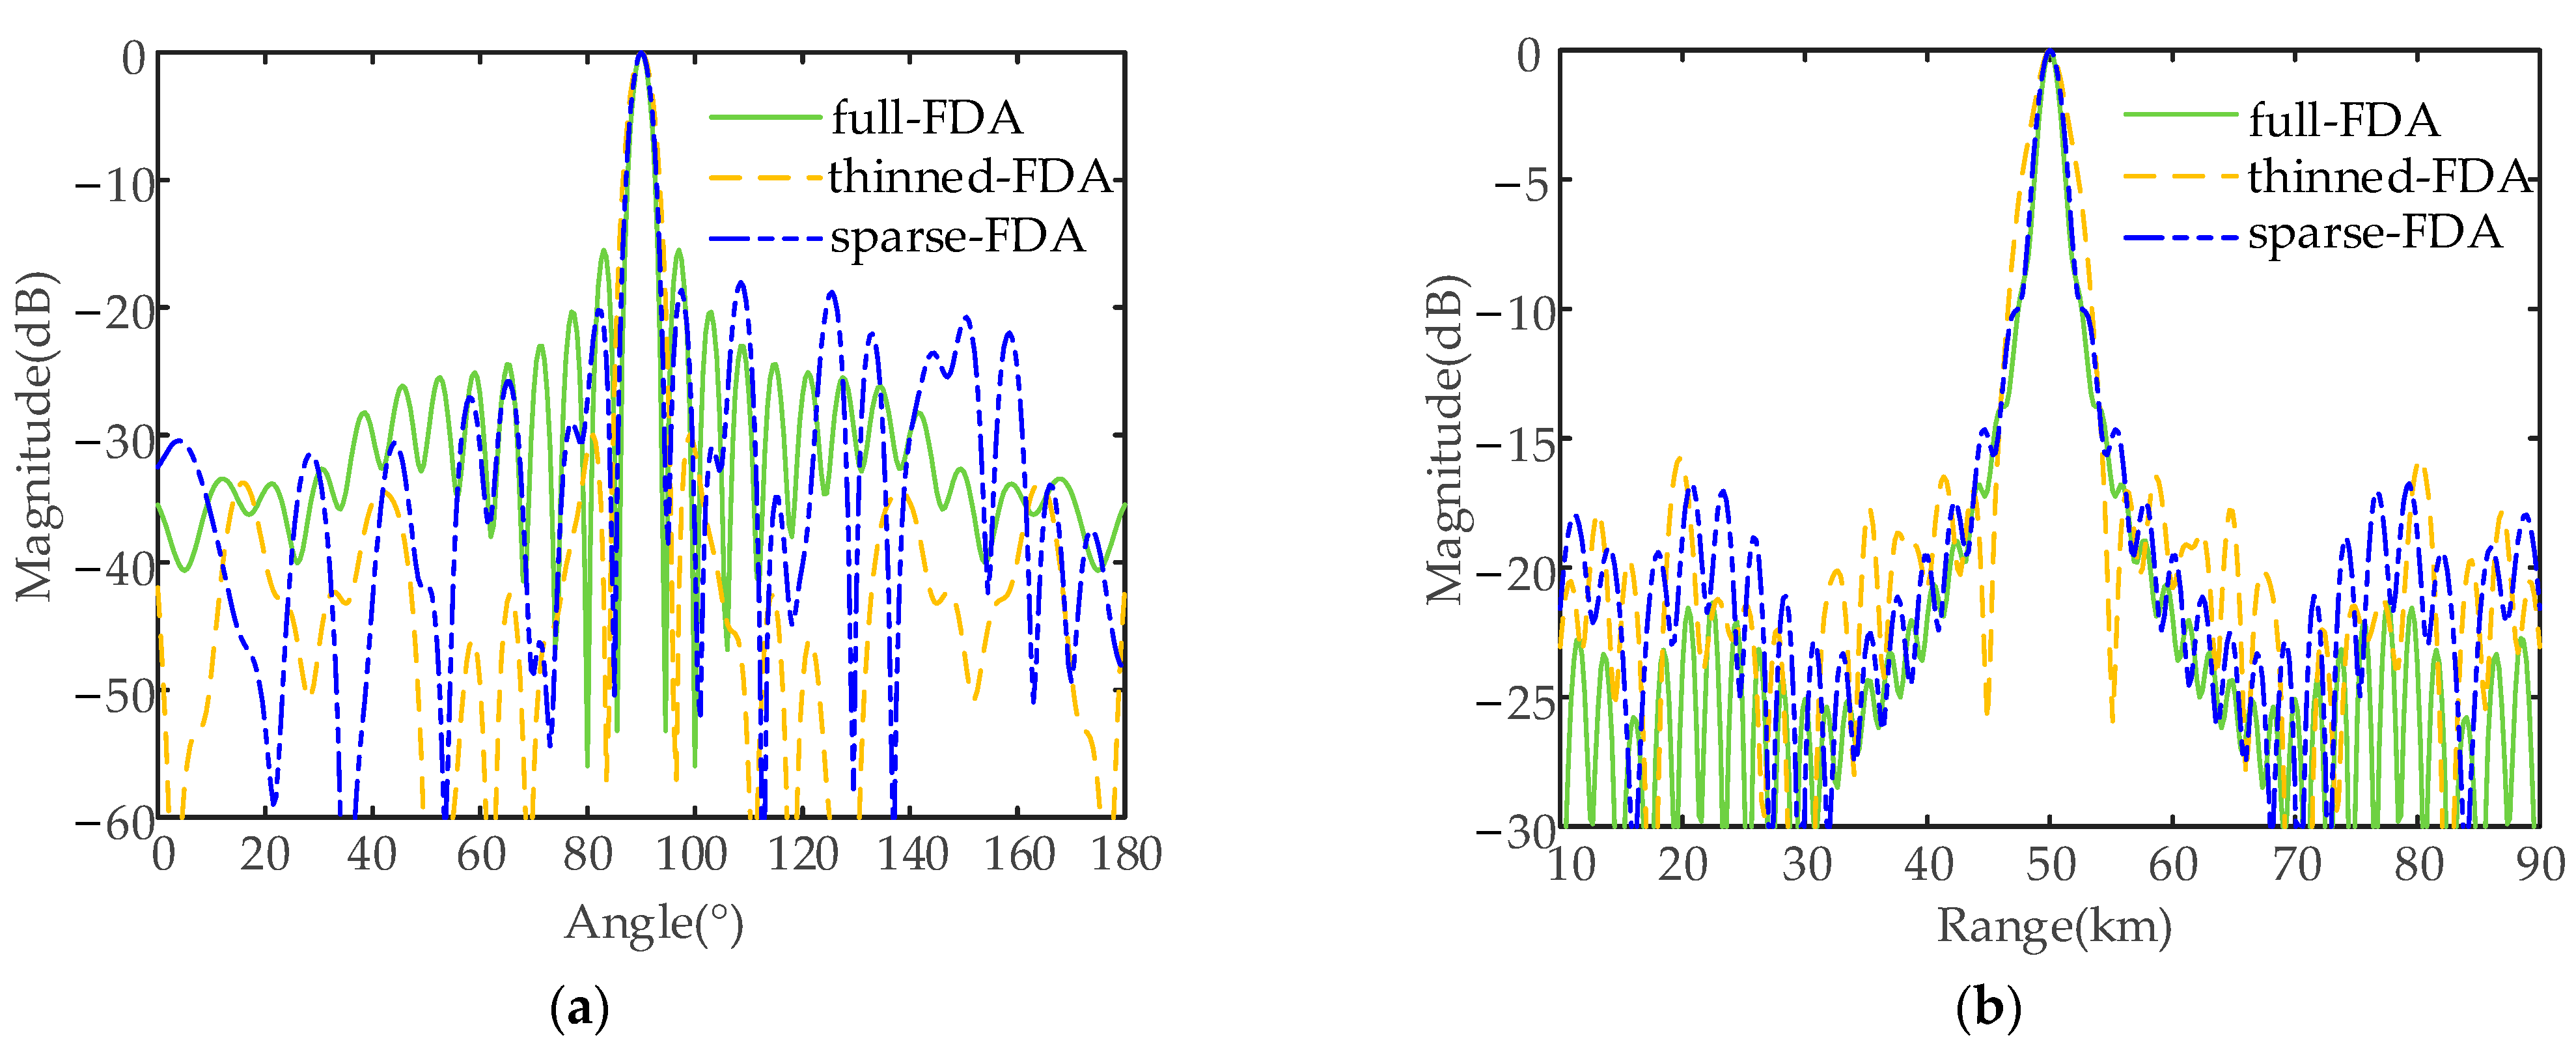
Figure 12 provides the transmit–receive beampattern profiles of the semicircular FDA with log-FO before and after thinned and sparse synthesis. It can be seen from
Figure 12a that the peak SLL of the semicircular FDA with log-FO was reduced by 14.51 dB and 2.52 dB (from −15.50 dB to −30.01 dB and −18.02 dB) in the angle dimension before and after the application of thinned and sparse synthesis, respectively. It can be seen from
Figure 12b that the corresponding part increased by 1.01 dB and 2.14 dB (from −16.79 dB to −15.78 dB and −14.65 dB) in the range dimension, respectively. The specific peak SLLs are provided in
Table 4.
Figure 13 shows the projections of transmit–receive beampatterns of the semicircular FDA with sin-FO in the range and the angle dimensions before and after thinned and sparse distribution. If we compare
Figure 13b,c with
Figure 13a, it can be seen that after the thinned and sparse synthesis, the peak SLL of the beampattern in the angle dimension was reduced by 5.55 dB and 7.3 dB, respectively (from 10log10 (0.1267) = −8.97 dB to 10log10 (0.03529) = −14.52 dB and 10log10 (0.02362) = −16.27 dB). From
Figure 13d–f, it can be seen that after thinned and sparse synthesis, the peak SLL in the range dimension was reduced by 4.39 dB and 3.67 dB (from 10log10 (0.1267) = −8.97 dB to 10log10 (0.04618) = −13.36 dB and 10log10 (0.05448) = −12.64 dB). The details of the peak SLLs are listed in
Table 5.
Figure 14 provides the transmit–receive beampattern profiles of the semicircular FDA with sin-FO before and after thinned and sparse synthesis. It can be seen from
Figure 14a that the peak SLL of the semicircular FDA with sin-FO was reduced by 10.58 dB and 3.15 dB (from −15.5 dB to −26.08 dB and −18.65 dB) in the angle dimension before and after the application of thinned and sparse synthesis, respectively. It can be seen from
Figure 14b that the corresponding part increased by 3.945 dB and 3.225 dB (from −9.415 dB to −13.36 dB and −12.64 dB) in the range dimension, respectively. The specific peak SLLs are provided in
Table 6.
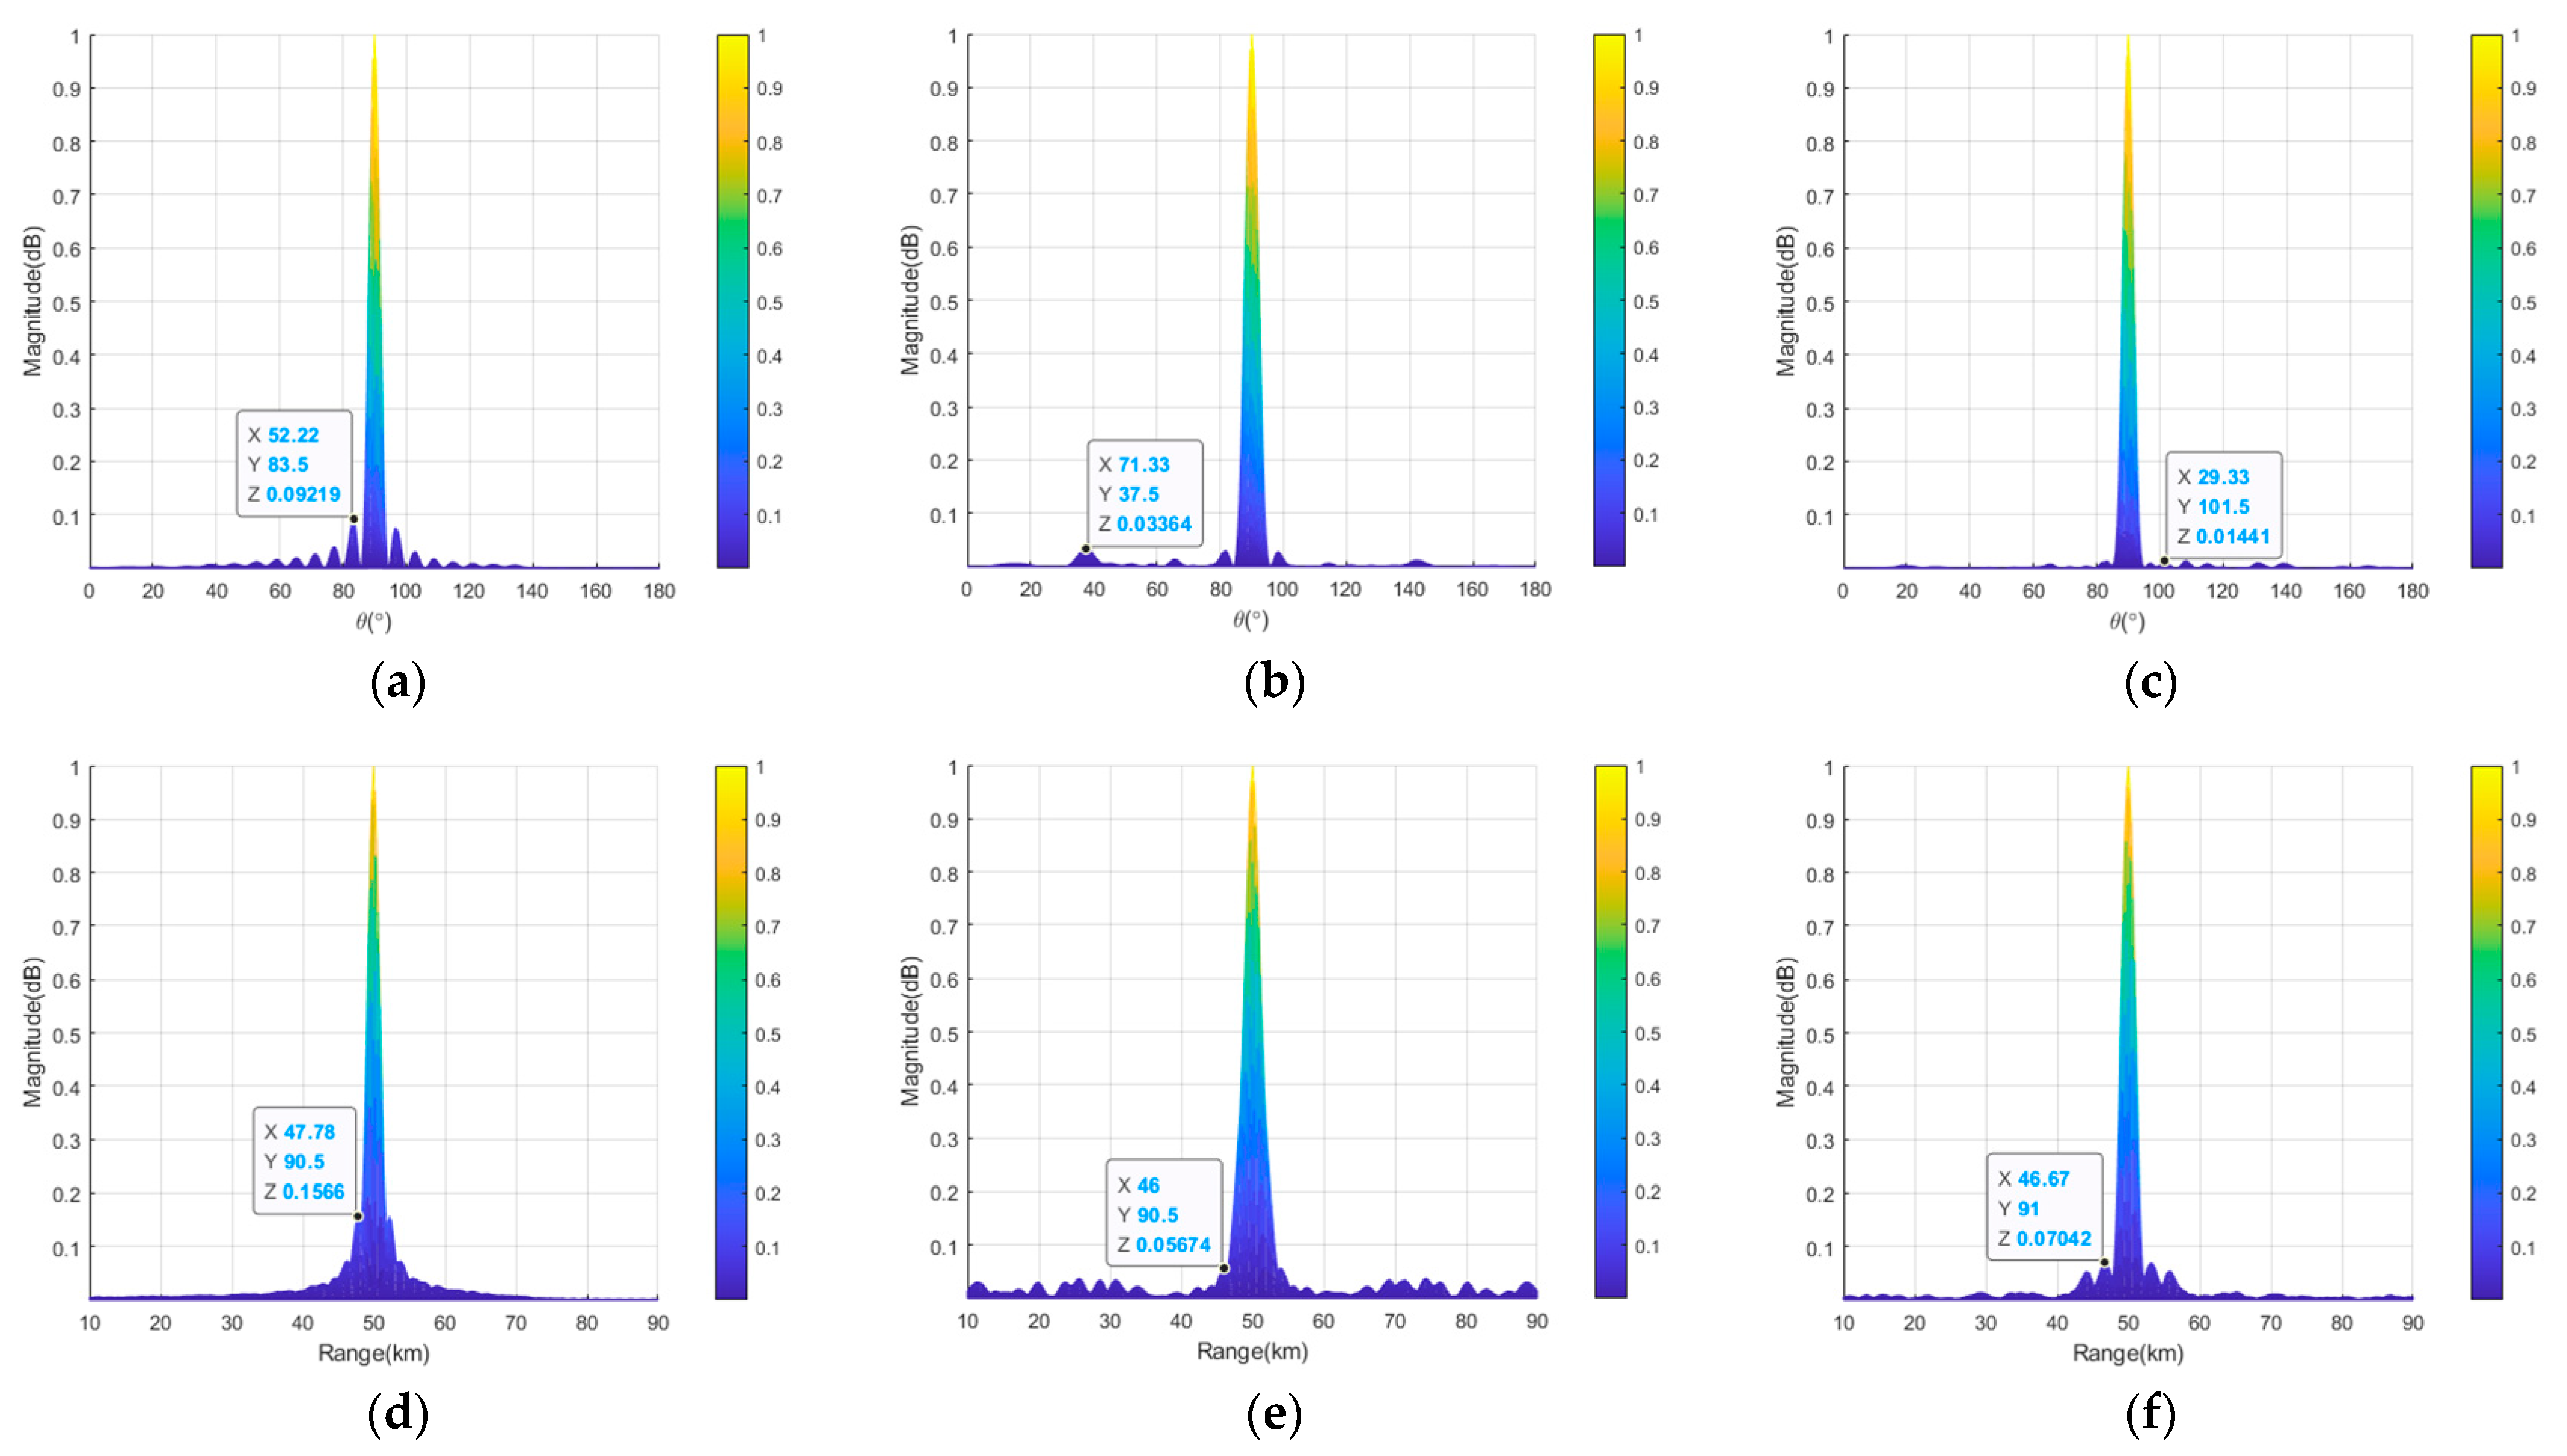
Figure 15 shows the projections of the transmit–receive beampatterns of the semicircular FDA with tanh-FO in the range and the angle dimensions before and after thinned and sparse distribution. If we compare
Figure 15b,c with
Figure 15a, it can be seen that after the thinned and sparse synthesis, the peak SLL of the beampattern in the angle dimension was reduced by 4.38 dB and 8.06 dB, respectively (from 10log10 (0.09219) = −10.35 dB to 10log10 (0.03364) = −14.73 dB and 10log10 (0.01441) = −18.41 dB). From
Figure 15d–f, it can be seen that after thinned and sparse synthesis, the peak SLL in the range dimension was reduced by 4.41 dB and 3.65 dB (from 10log10 (0.1566) = −8.05 dB to 10log10 (0.05674) = −12.46 dB and 10log10 (0.07042) = −11.52 dB), respectively. The details of the peak SLLs are listed in
Table 7.
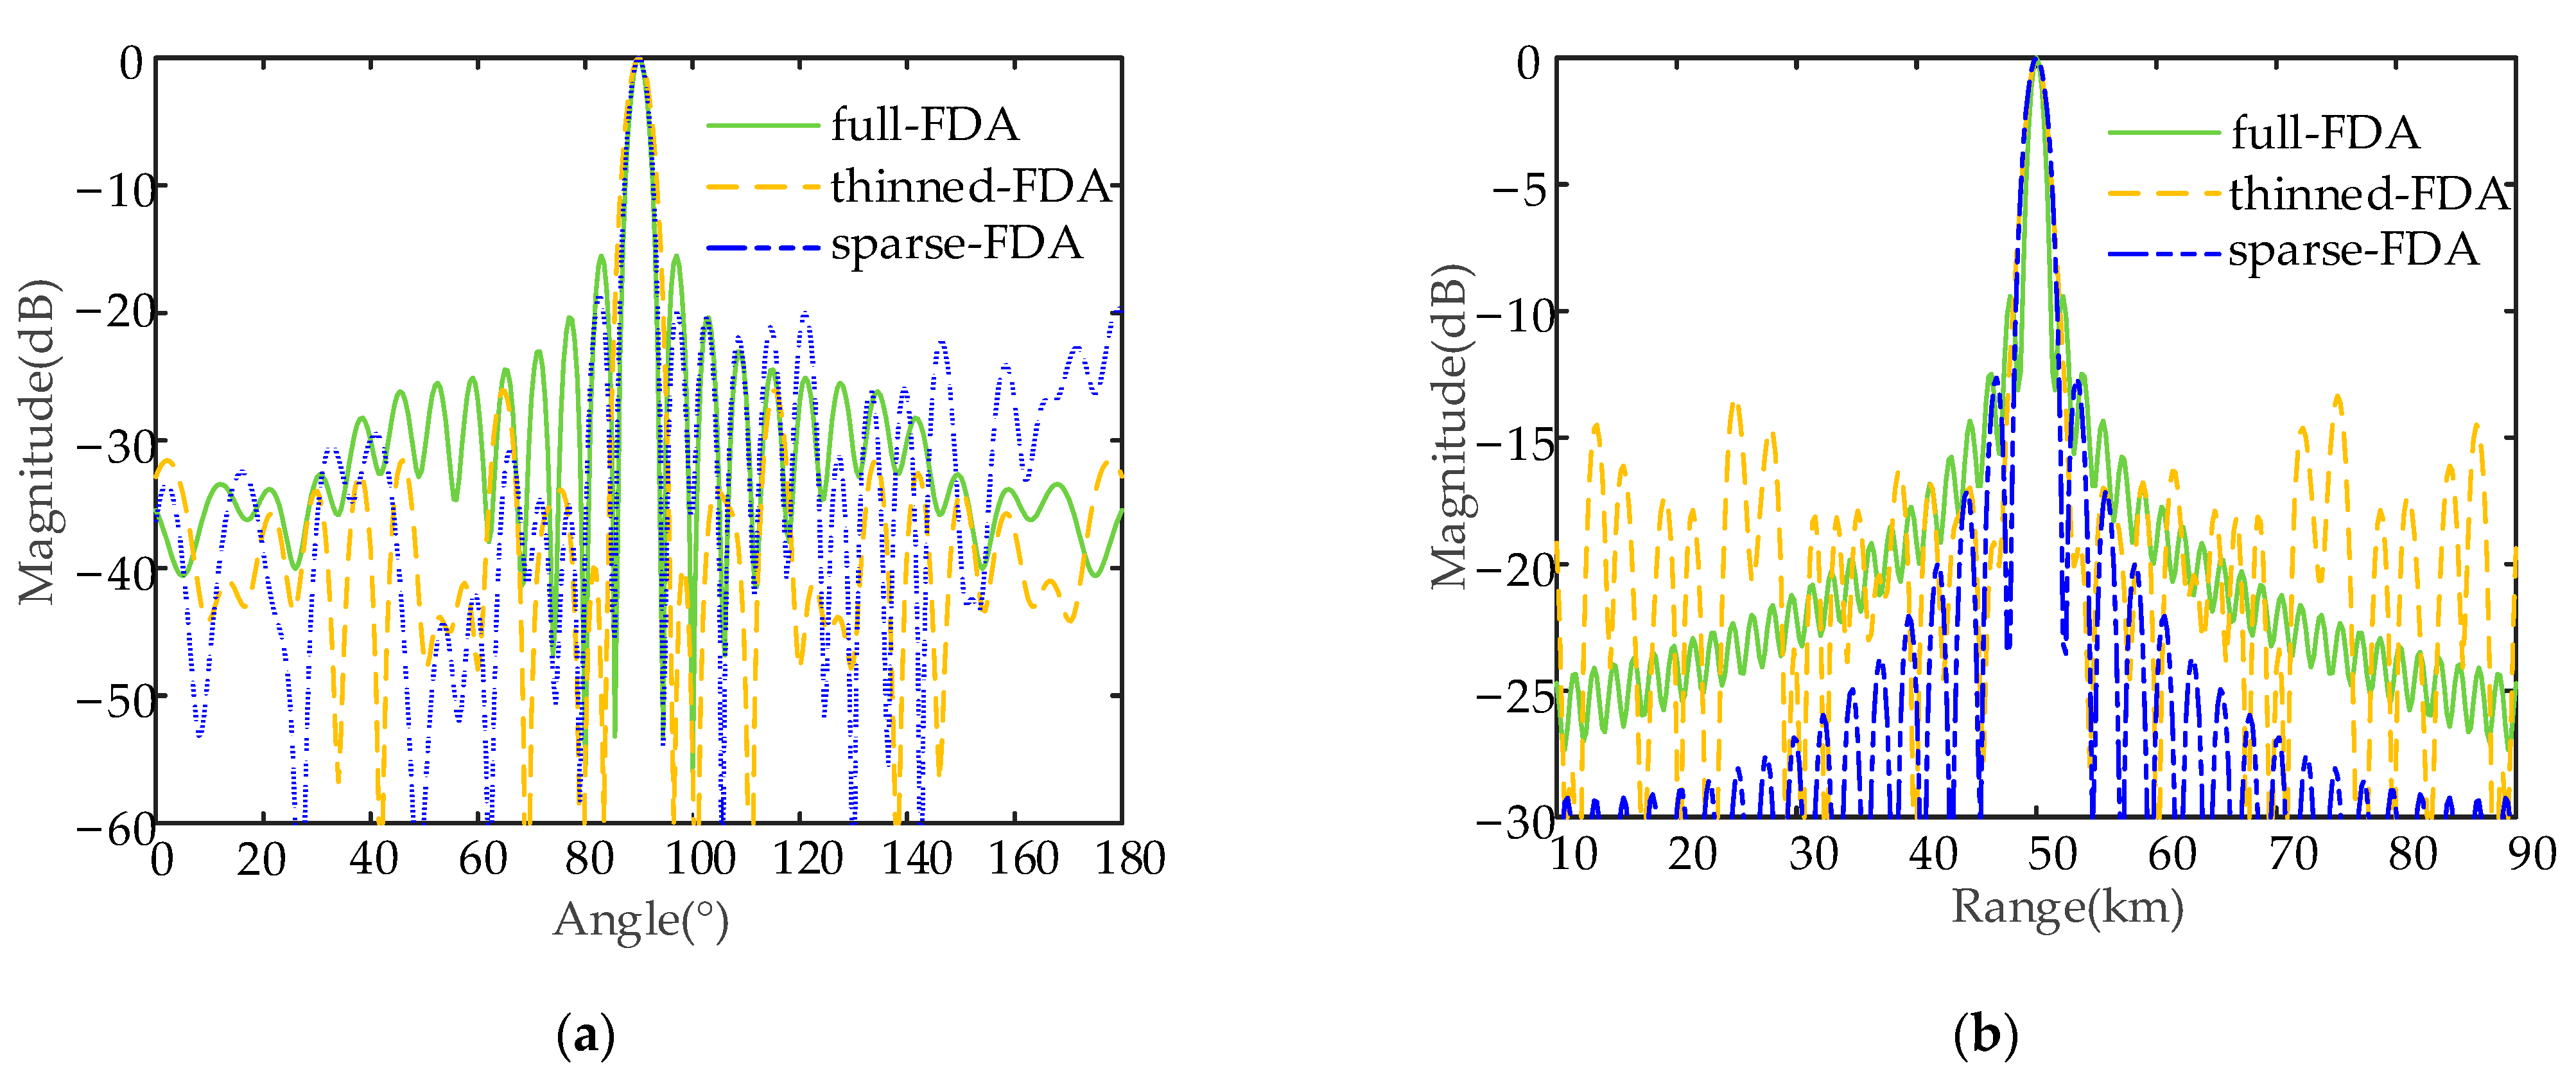
Figure 16 provides the transmit–receive beampattern profiles of the semicircular FDA with tanh-FO before and after thinned and sparse synthesis. It can be seen from
Figure 16a that the peak SLL of the semicircular FDA with tanh-FO was reduced by 7.45 dB and 4.59 dB (from −15.50 dB to −22.95 dB and −20.09 dB) in the angle dimension before and after the application of thinned and sparse synthesis, respectively. It can be seen from
Figure 16b that the corresponding part increased by 3.16 dB and 3.45 dB (from −8.35 dB to −11.51 dB and −11.80 dB) in the range dimension, respectively, for thinned and sparse synthesis. The specific peak SLLs are listed in
Table 8.
5. Conclusions
FDA applies a tiny FO across the array’s aperture, presenting a new choice for controlling the array’s beampattern. Meanwhile, conformal array configurations have been widely explored due to their remarkable advantage of being easily conformed to the surface of the carrier platforms. When high resolution is required, a vast amount of elements should be included in an array, which would induce great cost. Under these circumstances, this study investigated the thinned and sparse beamforming of semicircular FDAs. In the thinned semicircular FDA, lower peak SLLs could be achieved by strategically turning off some antenna elements while optimizing the excitation amplitudes. In the sparse semicircular FDA, the array’s position varied under the constraints. In particular, thinned and sparse synthesis were performed for semicircular FDAs with log-FO, sin-FO, and tanh-FO, respectively. Under the same assumption of saving 50% of the elements, the peak SLLs of the thinned semicircular FDAs were reduced by 5.8 dB, 4.4 dB, and 4.4 dB, respectively, for log-FO, sin-FO, and tanh-FO. Compared with the thinned semicircular FDA, the SLLs of sparse semicircular FDAs decreased by 2.2 dB, 3.7 dB, and 3.5 dB, respectively, for log-FO, sin-FO, and tanh-FO. Note that the sparse semicircular FDA with sin-FO did not widen the mainlobe in the angle dimension. It can be concluded that thinned optimization allows significant reduction of SLLs while sparse optimization allows nearly the same beamwidth in the angle dimension.
