Abstract
An investigation is undertaken to explore a sudden quasi-linear precipitation and gale event that transpired in the afternoon of 30 May 2024 over Beijing. It was situated at the southwestern periphery of a double-center low-vortex system, where a moisture-rich belt efficiently channeled abundant warm, humid air northward from the south. The interplay between dynamical lifting, convergent airflow-induced uplift, and the amplifying effects of the northern mountainous terrain’s topography creates favorable conditions that support the development and persistence of quasi-linear convective precipitation, accompanied by gale-force winds at the surface. The study also analyzes the impacts of five microphysics schemes (Lin, WSM6, Goddard, Morrison, and WDM6) employed in a weather research and forecasting (WRF) numerical model, with which the simulated rainfall and radar reflectivity are compared against ground-based rain gauge network and weather radar observations, respectively. Simulations with the five microphysics schemes demonstrate commendable skills in replicating the macroscopic quasi-linear pattern of the event. Among the schemes assessed, the WSM6 scheme exhibits its superior agreement with radar observations. The Morrison scheme demonstrates superior performance in predicting cumulative rainfall. Nevertheless, five microphysics schemes exhibit limitations in predicting the rainfall amount, the rainfall duration, and the rainfall area, with a discernible lag of approximately 30 min in predicting precipitation onset, indicating a tendency to forecast peak rainfall events slightly posterior to their true occurrence. Furthermore, substantial disparities emerge in the simulation of the vertical distribution of hydrometeors, underscoring the intricacies of microphysical processes.
1. Introduction
Severe convective weather phenomena, particularly those involving extreme events such as thunderstorms, gale-force winds, and intense short-duration rainfall, pose a significant threat to human life and property due to their sudden and unpredictable nature. These weathers represent a significant developmental challenge and a pressing research priority within the realm of modern meteorological forecasting [1,2,3,4,5].
To mitigate the disastrous losses stemming from extreme weather events, particularly heavy precipitation, and enhance forecasting precision, researchers worldwide have conducted exhaustive investigations and diagnostic analyses into the developmental mechanisms, dynamics, macro- and microphysical characteristics, etc., yielding many research findings [6,7,8,9,10,11,12,13]. These accomplishments methodologies and robust theoretical foundation for comprehending the formation and evolution of convective weather processes, refining forecasting methodologies, and improving forecast accuracy. China, with its vast expanse and diverse weather–climate patterns, experiences marked spatiotemporal variations in extreme precipitation events. Pre-flood season frequently witnesses heavy rainfall in south China, while the Jianghuai region is notorious for its wide-ranging and protracted Meiyu Front rainstorms during summer. In southwest China, low-vortex-induced precipitation sparks devastating natural disasters like flash floods and landslides [14,15,16,17,18]. Additionally, typhoons in coastal regions constitute another distinctively heavy precipitation pattern specific to China’s diverse geography [19,20,21,22].
Short-term heavy precipitation, characterized by its abruptness and high intensity within a condensed period, presents a significant challenge. It not only strains urban drainage systems but also threatens to unleash urban flooding and transportation disruptions. Consequently, forecasting and early warning systems for short-term heavy precipitation are of paramount importance [23,24,25,26]. north China is located in the mid-latitude westerly wind belt. The total number of annual heavy rainfall events, mostly occurring in July to August, in north China are relatively small, but the amount single rainfall events is usually large. Previous research has shown that the formation of heavy rainfall in north China is significantly influenced by the seasonal northward push of the East Asian summer winds. Additionally, the formation mechanism of north China’s heavy rainfall is related to north China’s cold vortex, warm shear lines, cold fronts, cold dry air intrusion, etc. [20]. Sun has posited that the squall lines (linear radar echoes) constitute a pivotal mechanism contributing to the occurrence of severe rainstorms in north China [27]. Chen conducted an exhaustive analysis of the patterns of the “7.21 Beijing torrential rainfall event”, observing a prominent linear alignment of radar echoes along the mountainous terrain prior to the frontal system’s arrival in Beijing [28]. Employing the Rotunno–Klemp–Weisman (RKW) framework, Chen et al. elucidated the crucial roles of vertical wind shear and cold pool dynamics in fostering the development of squall lines in north China [29]. Luo et al. delved into the temporal evolution and underlying mechanisms governing a powerful arc-shaped squall line that impacted Beijing in 2017 [30]. Sheng systematically examined the behavioral patterns and mechanisms of linear convective systems in north China [31]. These investigations into linear convection (squall line processes) in north China have primarily concentrated on the analysis of mechanisms, with relatively few focusing on the performance or impacts of numerical models. Beijing is situated in north China, and short-term heavy rainfall event is one of the main disastrous weather events in the summer, which has the characteristics of abruptness, locality, short-time and strong disaster [19].
On 30 May 2024, Beijing (39.2–41.2°N, 115–118°E) was struck by an unforeseen thunderstorm accompanied by gale winds in the afternoon. The Beijing Meteorological Service’s precipitation forecasts, hindered by the intricacies of short-term forecasting, failed to anticipate this event. In the realm of numerical modeling, cloud microphysics schemes hold a pivotal role in determining prediction accuracy [13]. Research has demonstrated that weather research and forecasting (WRF) models, utilizing varying microphysics schemes, often yield significantly disparate precipitation simulations due to their unique mathematical and theoretical frameworks in portraying process evolution [2,32,33]. While each cloud microphysics scheme boasts a solid mathematical and physical foundation, practical applications necessitate a deeper understanding of which scheme is most suitable and effective. To unravel the physical mechanisms underlying this sudden, short-term rainfall and gale event, this paper integrates observations from diverse sources, including satellites and ground stations. By utilizing numerical models, it simulates the development and evolution of the mesoscale system, conducts a comparative analysis of various microphysics schemes, and delves into their respective impacts on the simulation outcomes. The primary objective of this study is to augment our understanding of the dynamics and mechanisms of such events, ultimately enhancing the capabilities for the forecasting and issuing of early warnings pertaining to abrupt, short-term precipitation occurrences accompanied by gale-force winds in Beijing.
Section 2 of this paper provides a concise introduction to the observational and reanalysis datasets used in the study. Section 3 describes the synoptic weather conditions that preceded the event under investigation. In Section 4, the model performance and sensitivity with respect to microphysics schemes are investigated. Details of the microphysical properties of clouds are presented in Section 5. Finally, Section 6 summarizes our findings and provides concluding remarks, along with a discussion of the implications and limitations of the study.
2. Data and Methodology
The study employed data from nearly 600 automatic weather stations (AWS) in Beijing, encompassing temperature, humidity, pressure, wind, and precipitation, to scrutinize their fluctuations during the event. The rain gauges employed operate on a precise principle, where rainfall accumulates in a funnel, with each increment representing 0.1 mm of precipitation. To ensure accuracy, the integral time was meticulously set at 1 min. Notably, the rain gauge data served to form a vital cornerstone of the study, facilitating the real-time collection of high-frequency rainfall data across multiple locations in Beijing. The availability of high-frequency AWS data guaranteed the meticulous capture of intricate atmospheric and precipitation variations, offering a level of fidelity that is crucial for comprehensive analysis.
The European Centre for Medium-Range Weather Forecasts (ECMWF) reanalysis dataset (ECMWF-ERA5, available at https://cds.climate.copernicus.eu/cdsapp#!/home; accessed on 10 June 2024) was utilized to dissect the large-scale circulation backdrop, synoptic and thermodynamic conditions, and the formation and triggering mechanisms underlying the event. Furthermore, ERA5 data served to form the foundational initial and boundary conditions for all conducted simulations. These data offered an exceptionally detailed portrayal of atmospheric conditions, including wind speed, humidity, temperature, and pressure, with a spatial resolution of 0.25° × 0.25° and a temporal resolution of 1 h, thereby enhancing the accuracy and depth of the analysis.
The study leveraged weather radar reflectivity images, sourced from the China Meteorological Administration (http://www.nmc.cn/publish/radar/chinaall.html; accessed on 10 June 2024), to conduct an analysis of the temporal evolution and spatial distribution of clouds during the event. These radar images, with a temporal resolution of 6 min, facilitated a comprehensive comparison with the results obtained from model simulations, providing valuable insights into the accuracy and reliability of the modeling approach.
The Himawari L1 gridded data observed by the Advanced Himawari Imager on board the Himawari-8 satellite (https://www.eorc.jaxa.jp/ptree/index.html; accessed on 10 June 2024) were used to understand the origins, the transmission and the evolutions of the convective system during the event. The dataset has a temporal resolution of 10 min and a spatial resolution of 5 km, enabling a precise and comprehensive understanding of the system’s dynamics [34].
For the purposes of analysis and presentation in this paper, Beijing Time (which is also the local time) was adopted. Beijing Time is congruent with UTC + 8, ensuring consistency and clarity in the temporal references throughout the study.
3. Overview of the Weather Event on 30 May 2024
3.1. Synoptic Profile at Beijing
On 30 May 2024, between 14:00 and 16:00, sudden thunderstorms and gusty winds struck the city of Beijing. Ground observations revealed that Shunyi district recorded a peak rainfall rate of 2.7 mm per minute, while Fengtai district experienced a maximum wind speed of 37.2 ms−1. The intense winds caused widespread damage, with numerous trees toppling over within the city.
Utilizing Himawari-8 satellite observations, the origination and evolution of the convective system’s clouds were captured in vivid detail (Figure 1, showcasing a time-lapse from 10:00 to 18:00). Initially, the convective organization’s clouds formed in Inner Mongolia, situated northwest of Beijing (Figure 1a). Subsequently, the clouds rapidly advanced southeastward, undergoing a significant development marked by an increase in size, thickness, and intensity (Figure 1c,d). This evolution culminated in the formation of a quasi-linear convective system, with fresh, smaller convective cells emerging to the east (Figure 1e). At approximately 14:00, the center of this convective system entered Beijing from the northwest, traversing the central urban area before exiting the city around 18:00.
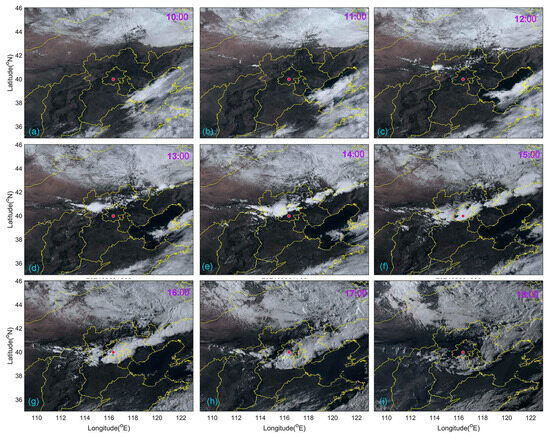
Figure 1.
Satellite images of the weather event observed by Himawari-8, obtained from observations at three visible bands (blue: 0.47 micron; green: 0.51 micron; red: 0.64 micron): (a–i) 1 h intervals from local time 10:00 to 18:00. The red dots represent the location of the Beijing urban area.
Drawing insights from the weather process’s trajectory, as depicted in the satellite images, five ground meteorological observation stations, strategically positioned along its movement path (Figure 2a), were chosen to representatively illustrate the fluctuations in rainfall and wind speed during the event. Figure 2b,d present the minute-by-minute recordings of rainfall and wind speed, documented at these five stations between 14:00 and 15:00 on 30 May 2024.
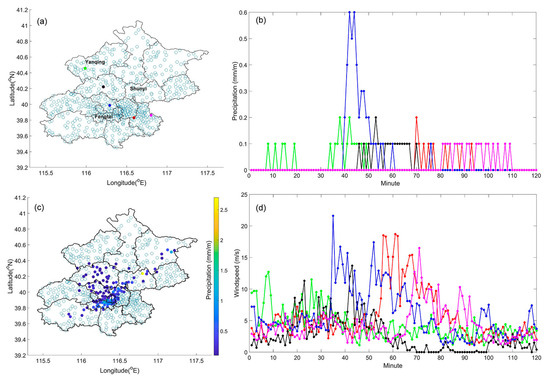
Figure 2.
Sites of all automatic weather stations and the measured rainfalls and wind speeds in Beijing. (a) Distribution of all AWS sites, the five selected representative sites are presented by green, black, blue, red and purple solid dots. (b) Variations of rainfall observed every minute from 14:00 to 15:00 at the five sites, the value 0 at the X-axis means 14:00 and 120 means 15:01. (c) Distribution of rainfall observed at the time of 14:55; (d) Variations of the wind speed observed every minute from 14:00 to 15:00 at the five sites. Unit of rainfall is mm and unit of the wind speed is ms−1.
The rainfall commenced first in Yanqing district, located northwest of Beijing, at around 14:05 (Figure 2b). Subsequently, the blue, black, and red stations experienced rainfall in succession, with the purple station being the last among the five to record precipitation, approximately at 15:20. Notably, the total duration of rainfall at each station was predominantly no longer than 30 min. Comprehensive analysis of all ground observation records reveals that the peak rainfall intensity during this process was 2.7 mm per minute, recorded in Shunyi at approximately 14:55. Figure 2c depicts the spatial distribution of rainfall at 14:55, showcasing a concentrated precipitation belt extending from southwest to northeast.
Furthermore, Figure 2d highlights a notable trend in wind-speed dynamics. Specifically, the wind speed escalated prior to the onset of rainfall, and, during rainfall, the maximum wind speed of five stations predominantly exceeded 10 ms−1. Among the five stations, the blue station recorded the highest wind speed, reaching a maximum of 22 ms−1. In summary, this weather event was characterized by its localized intensity, abrupt onset, and its concentrated duration and precipitation area, accompanied by severe gusty winds and thunderstorms.
The analysis of rainfall distribution, precipitation timing, and cloud imagery clearly indicates that the initial convective activity originated in the central-eastern part of Inner Mongolia, subsequently propagating in a southeasterly direction. As it strengthened, this system gradually transformed into a quasi-linear configuration. The entire convective system progressed rapidly, and, although the rainfall it brought to Beijing was fleeting, it was marked by intense, instantaneous precipitation accompanied by severe and damaging winds. Following the event, the rain abruptly halted and the winds diminished upon its passage, vividly illustrating the event’s characteristic short-lived and pronounced convective nature.
3.2. Circulation Background and Dynamic Characteristics
On 30 May 2024, an examination of the circulation background at 09:00 (Figure 3) reveals the presence of two distinct low-vortex centers at the 750 hPa level to the north of Beijing. This configuration signifies the existence of a pronounced mesoscale closed cold low-vortex circulation system at this level. The western low-vortex center is also visible in nearly the same location at the 500 hPa and 950 hPa levels, albeit not fully closed at 500 hPa. Conversely, the eastern low-vortex system is present at both 750 hPa and 950 hPa levels but absent at 500 hPa. Both low-vortex systems exhibit vorticity values reaching up to 20 × 10−5 s−1. At the 950 hPa level, the eastern low vortex encompasses a broader area compared with the western counterpart, suggesting a higher altitude for the western vortex center. These two low-vortex systems combine to form a cold low-vortex circulation system with an extensive spatial scale. The initial convective bubble, which later evolved into a thunderstorm gale event, emerged at the periphery of this double-centered low-vortex system, closer to the western vortex, where wind speeds approached 20 ms−1 at the 750 hPa level.
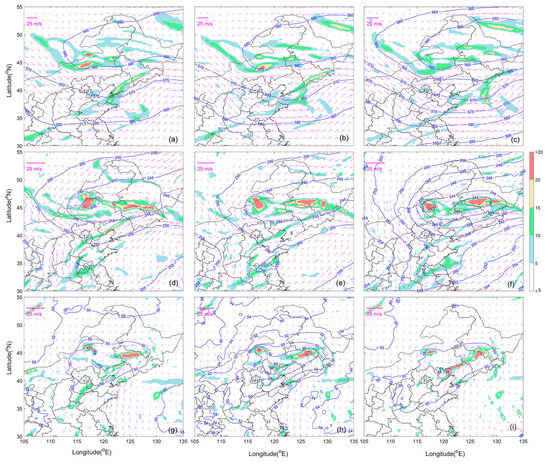
Figure 3.
Distribution of 500 hPa (a–c), 750 hPa (d–f), and 950 hPa (g–i) geopotential heights (contours, unit in dagpm), positive vorticity (filled color, unit in 10−5 s−1), and winds during the event. Left column: at 09:00; middle column: at 12:00; right column: at 15:00. The two red areas in (e) denote the low-vortex centers.
From 09:00 to 15:00, the double-centered low-vortex system lingered over the northern vicinity of Beijing, gradually intensifying, and slightly expanding its circulation range. The convective system responsible for the thunderstorms and gales in Beijing on 30 May 2024 was situated at the southern fringe of this circulation system. The development of a robust convective system is evidently tied to the progressive enhancement and expansion of this low-vortex system. Satellite images also reveal that the convective system’s evolution into a quasi-linear formation may be linked to the influx of water vapor from the south and the local terrain’s influence, contributing to its unique development pattern.
3.3. Distribution and Transportation of Water Vapor
The transportation of water vapor towards the low-vortex system was primarily confined to layers below 400 hPa. Figure 4 depicts the distribution of relative humidity (RH) and wind at three representative pressure levels—500 hPa, 750 hPa, and 950 hPa—at 09:00, 12:00, and 15:00 on 30 May 2024. The topographic feature is presented in Figure 5. At the 500 hPa level (Figure 4a–c), a distinct path of high water vapor flows from southwest to northeast, positioned on the eastern flank of Beijing. At the 750 hPa level (Figure 4d–f), this water vapor transport path (see the blue circle in Figure 4e) narrows compared with the 500 hPa layer, revealing a substantial northward influx of water vapor from the south, carried by southerly winds, and merging into the northern low-vortex system from the east.
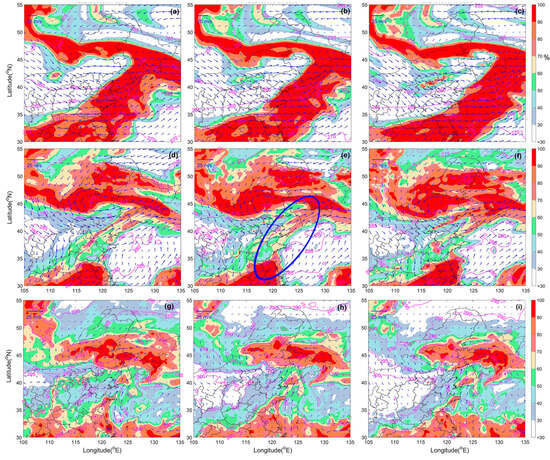
Figure 4.
Distribution of relative humidity (filled color, unit: %), and wind (blue arrows; unit: ms−1) at 500 hPa (a–c), 750 hPa (d–f), and 950 hPa (g–i) at different moments. Left column: 09:00; middle column: 12:00; right column: 15:00. Blue circle denotes water vapor transport path at 750 hPa.
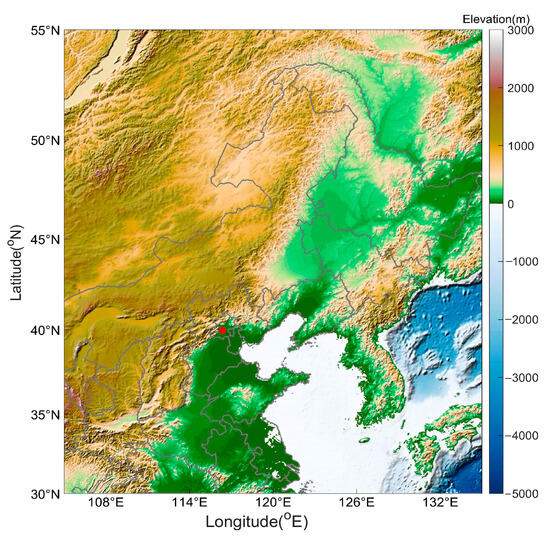
Figure 5.
Topographic map with the red solid dots marking the location of Beijing.
At 12:00, the wind patterns at both 750 hPa and 950 hPa levels (Figure 4e,h) indicate that the west region to Beijing is dominated by northwest winds. These winds gradually decelerate and experience directional shifts due to the influence of the northwestern mountains. Figure 4e,f reveal that the cold air emanating from the low-vortex system in the northwest collides with warm, humid air from the south over the mountainous regions north of Beijing, forming a band of intense updrafts and high humidity along the mountains between 115°E and 125°E. This region, bolstered by systematic dynamic uplift, convergence uplift, and topographic uplift, fosters rapid development, ultimately leading to the formation of a robust convective organization along the mountain.
Squall lines weather are known for their limited spatial extent, brevity, and abrupt shifts in pressure and wind conditions. These weather systems are commonly triggered by an air mass characterized by a distinct stratification of a dry upper layer and a moist lower layer positioned ahead of an upper-tropospheric trough. In the immediate vicinity of a squall line, not only do there occur drastic fluctuations in wind speed, pressure, and temperature, but also severe meteorological phenomena like lightning, thunderstorms, and extreme weathers may manifest [2,35]. The event on 30 May 2024, as analyzed above, exemplifies several defining features of squall-line weather systems.
4. Model Performance and Sensitivity with Respect to Microphysics Schemes
4.1. Model Configuration
In this study, the Advanced Research Weather Research and Forecasting model (WRF-ARW, version V4.4) was employed for conducting numerical simulations. This model is a collaborative effort between institutions, including the National Center for Atmospheric Research (NCAR), the National Oceanic and Atmospheric Administration (NOAA) and many research universities. Table 1 presents the key configurations and specifications of the WRF model utilized in this research.

Table 1.
Configures of the WRF model in this study.
The model was centered at the coordinates of 116.37°E and 39.97°N, utilizing initial and boundary conditions sourced from the ERA5 dataset, with 0.25° × 0.25° horizontal grid spacing. A hierarchical structure of three nested domains was designed, each featuring a progressively finer horizontal resolution of 27 km, 9 km, and 3 km. For the vertical dimension, a comprehensive resolution of 99 sigma levels was employed.
To assess the model’s performance and sensitivity, both single-moment and double-moment schemes were selected for analysis. Table 2 presents the hydrometeor types of the five microphysics schemes. The single-moment schemes solely predict the mass mixing ratio of hydrometeors, whereas the double-moment schemes provide a more comprehensive picture by predicting both the mass number concentration and mixing ratio. A total of five microphysics schemes were evaluated, comprising three single-moment schemes (the Lin, WSM6 and Goddard scheme) and two double-moment schemes (the Morrison and WDM6 scheme) [36,37,38,39,40]. For Domain 3, which boasts a horizontal resolution of 3 km, the cumulus microphysics scheme was deliberately omitted.

Table 2.
Hydrometeor types of the five microphysics schemes.
4.2. Assessment Results
To comprehensively assess the effectiveness and ramifications of the five microphysics schemes in simulating this particular weather event, we undertook a detailed comparative analysis, juxtaposing the simulation outcomes from the WRF model against actual radar reflectivity measurements and observations recorded by automatic weather stations. This approach allowed us to gain insights into how the influences of different microphysics schemes impact the model’s capacity to replicate the weather process under investigation.
4.2.1. Assessment of Simulated Radar Reflectivity
The radar reflectivity factor, Z, which is expressed in units of mm6m−3 (hereinafter simply “reflectivity”) under Rayleigh scattering conditions, is defined by the following equation:
Here, D represents the particle size, and n(D) denotes the particle spectral distribution. The formula 10 × log(Z) is used to convert this reflectivity factor into a more intuitive unit, dBZ. Weather radars operating at long wavelengths enable the backward scattering of clouds and rain droplets to be effectively modeled as Rayleigh scattering. As evident from the definition, the magnitude of Z is dependent on the particle spectral distribution, which comprehensively encapsulates the physical characteristics of cloud or rain particles.
To validate the WRF model’s performance in simulating radar reflectivity, the model’s output was compared with ground-based weather radar observations. Figure 6 offers a comprehensive comparison of radar reflectivity distributions at 14:30, juxtaposing ground-based observations against simulations with five microphysics schemes. Figure 6a presents the radar measurements, highlighting a prominent echo band stretching across the 39–41°N and 114–119°E regions. This reflectivity band, centered over Beijing, attains a peak intensity of approximately 55 dBZ, with reflectivity values spanning the 15–55 dBZ range.
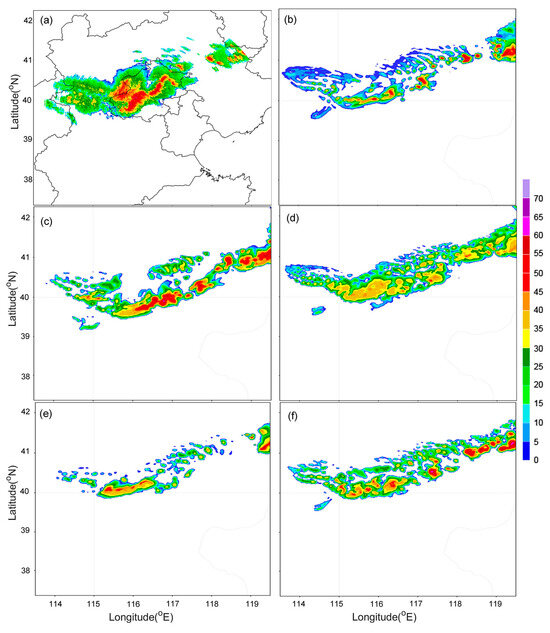
Figure 6.
Comparisons of radar reflectivity observed at 14:30 on 30 May 2024 simulated with five cloud microphysics schemes. (a) Observed, (b) Lin scheme, (c) WSM6 scheme, (d) Goddard scheme, (e) Morrison scheme, and (f) WDM6 scheme. Unit: dBZ.
The subsequent Figure 6b–f detail the simulation results for each microphysics scheme. In general, all simulations exhibit a spatial distribution in the form of a quasi-linear pattern that aligns with the observed data. The positions of reflectivity are in close proximity to the observed locations. However, upon closer scrutiny of finer details, notable differences emerge among the schemes. The Goddard scheme emerges as the top performer, producing a reflectivity distribution that is not only compact but also exhibits the highest degree of similarity to the observations. The WDM6 scheme follows suit, demonstrating a commendable level of accuracy. In contrast, the Morrison scheme falls short, yielding the sparsest spatial distribution and the most significant deviation from the radar observations. This analysis underscores the critical role of selecting an appropriate microphysics scheme in ensuring the fidelity and relevance of weather simulations.
Among the five microphysics schemes tested, the Lin scheme demonstrated the lowest mean reflectivity, particularly at the cloud’s periphery, which was significantly lower than the observed values. Similarly, the Goddard scheme also mostly underestimated reflectivity, predominantly in regions of high reflectivity within the cloud, with the simulated maximum reflectivity peaking at around 40 dBZ. This highlights a notable discrepancy between the simulated and measured reflectivity, especially in areas with intense echoes. In contrast, the WSM6 scheme stood out as the top performer, exhibiting the best simulation performance, as its simulated reflectivity and positions closely matched the observed data.
In summary, the numerical simulation of radar reflectivity by the five microphysics schemes has successfully captured the quasi-linear characteristics of the radar echoes. Nevertheless, variations exist in the simulations of echo intensity and positions, with some schemes exhibiting higher values while others are lower compared with the measurements. Among these schemes, the WSM6 single-moment scheme stands out for its superior agreement with observations, indicating its capability in accurately representing radar reflectivity patterns.
4.2.2. Assessment of Simulated Rainfall
The rainfall accumulation data for the event on 30 May 2024, spanning from 13:00 to 16:00 (units in mm), served as a benchmark by which to evaluate the performance of various microphysics schemes. Figure 7 presents a comparative analysis of the simulated and observed rainfall accumulations in Beijing. As depicted in Figure 7a, the rainfall varied significantly across different stations, ranging from 0 to 14 mm. Shunyi and the city center experienced substantial rainfall. Notably, the precipitations mostly last no longer than 30 min.
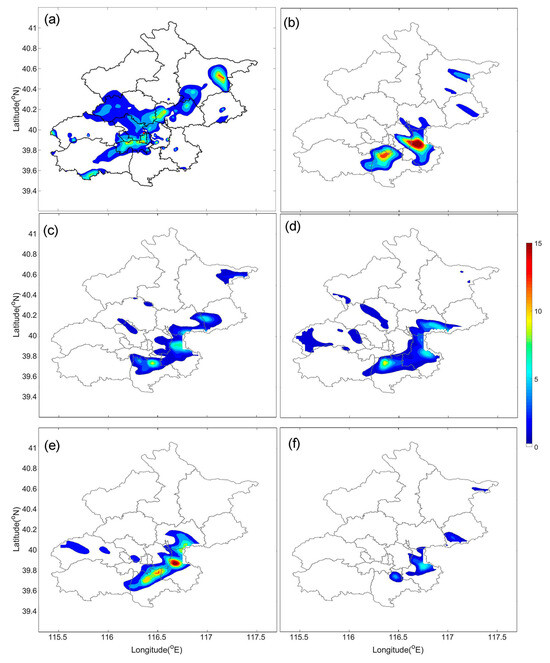
Figure 7.
Rainfall accumulation of the event on 30 May 2024 (accumulated 13:00~16:00, unit mm) observed by AWS and simulated by model. (a) Observed, (b) Lin scheme, (c) WSM6 scheme, (d) Goddard scheme, (e) Morrison scheme, and (f) WDM6 scheme.
The spatial distribution of rainfall, as recorded by all AWSs in Beijing, exhibited a distinct quasi-linear pattern, stretching from the southwest to the northeast. This spatial configuration aligns with both satellite and radar observations, further reinforcing the characteristics of convective precipitation that were observed during the event. Contrary to radar reflectivity, which was successfully simulated as a quasi-linear feature, the simulations of rainfall failed to reproduce such a clear linear-pattern distribution. As clearly depicted in Figure 7b–f, notable discrepancies exist between the simulated rainfall and the observations from AWSs. Specifically, the model’s simulations vary significantly from the AWS data in terms of the spatial extent of precipitation occurrence, the total rainfall amount, and the exact locations of precipitation. The observed area with precipitation is substantially larger than that simulated by all five microphysics schemes, despite the simulated rainfall tending to concentrate in a narrower band compared with the observed pattern. Additionally, the positioning of the simulated rainfall consistently appears to the southeast of the observed rainfall, with an average deviation of approximately 15 km, underscoring the need for further refinement in precipitation modeling. As the convective system progresses from northwest to southeast across Beijing, it becomes evident that the model’s simulated precipitation region is consistently positioned to the southeast of the true rainfall area. This suggests that the model’s prediction of rainfall onset is “delayed” in comparison with the actual event, pointing to a “late” triggering time. Notably, all five microphysics schemes exhibit a similar pattern of delayed predictions, highlighting the need for further refinement in rainfall forecasting capabilities.
Quantitative contrast results of the rainfall between model simulations and observations are presented in Figure 8. We adopt the mean absolute error (MAE) as a continuous score:
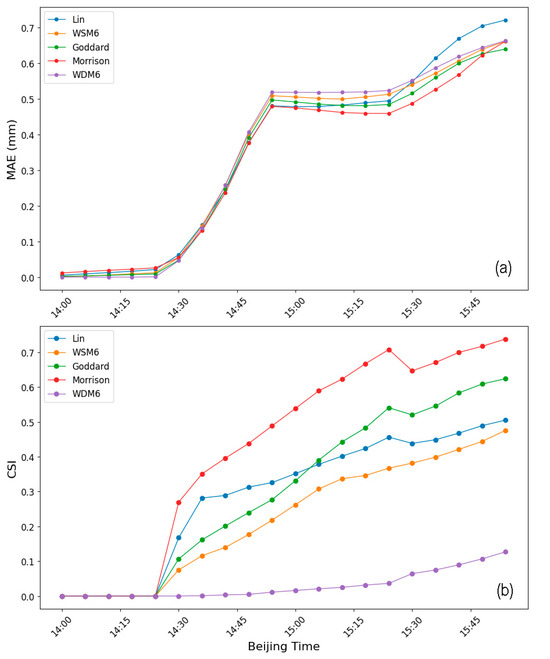
Figure 8.
Quantitative contrast of the rainfall accumulation between simulations and observations: (a) MAE is the mean absolute error; (b) CSI is the critical success index.
Here, obsi and simi represent the observed and model simulated rainfall values, respectively, for the ith pixel within the Beijing domain, and n is the total number of pixels.
Additionally, we utilize the critical success index (CSI) as a categorical score:
where hits, false alarms, and misses are defined according to a specified threshold value. In this study, we set the rainfall threshold at 0.125 mm/h for CSI calculations.
The two scores offer complementary insights into model performance. The MAE quantifies the magnitude of prediction errors in rainfall (lower values indicate better performance), while the CSI gauges model accuracy by capturing the fraction of correctly predicted forecast events (higher values signify better performance). Notably, the CSI does not differentiate between error sources, focusing solely on the overall prediction accuracy. As the data resolution of observations differs from simulations, they are firstly interpolated into same resolutions before calculating MAE and CSI.
As shown in Figure 7, the Lin and Morrison schemes consistently produce higher rainfall estimates than the other three microphysics schemes, with their maximum rainfall predictions exceeding the observed maximum. Conversely, the average and maximum rainfall intensities simulated by the WSM6, Goddard, and WDM6 schemes are lower than the observed values. Notably, the positions of these maxima are relatively close to each other. The MAE distributions (Figure 8a) of five schemes are close to each other. When rain started at about 14:30, the MAEs increased, then rapidly reached 0.5 within 30 min at about 15:00 when rain ended. In contrast, the Morrison model has the lowest MAE. The distributions of the CSI of the five schemes differ greatly. It can be found that Morrison has the highest CSI.
Upon comparing the simulated rainfall with observational data, it becomes apparent that the outcomes generated by the five microphysics schemes vary significantly from the observed rainfall in terms of location, time, and intensity. This underscores the need for substantial improvement in the numerical model’s predictive capabilities, particularly for quasi-linear convective weather processes. The above analysis reveals that, among the five microphysics schemes, the Morrison scheme demonstrates the best performance in simulating rainfall accumulation while WDM6 shows the worst performance.
5. Characteristics of the Cloud Microphysics
A comparative analysis of the vertical distributions of hydrometeors within clouds during system development, across various microphysics schemes, provides invaluable insights into their respective strengths and weaknesses in rainfall forecasting. To streamline our investigation and enable comprehensive comparisons, we have chosen a representative station (“blue” station, as illustrated in Figure 2a), serving as a focal point to delve deeply into the microphysical characteristics of diverse hydrometeors present within the cloud system.
For our analysis, we have meticulously selected three specific moments—14:00, 14:30, and 15:00 on 30 May 2024—as illustrative snapshots to explore the intricate evolution of cloud microphysics. Figure 8 depicts the vertical distributions of mixing ratios for various hydrometeors, including cloud droplets, rain, ice, snow, and graupel, at these three distinct temporal stages. This approach offers a comprehensive understanding of how different microphysics schemes diverge in their portrayal of cloud microphysics and its dynamic evolution over time.
Undoubtedly, the integration of satellite measurements, ground-based radar data, and AWS observations confirms that this quasi-linear convective system attained its mature phase around 14:30, marked by the commencement of rainfall at the “blue” station with an intensity of 0.6 mm per minute. At this pivotal moment, the simulated cloud manifested a thickness of approximately 2 km, situated at an altitude of 4–6 km. By 15:00, the cloud had significantly expanded to a thickness of 4 km, spanning the altitude range of 4–8 km, with the mixing ratios of each hydrometeor peaking concurrently. These findings indicate that the simulated weather system transitioned from a developmental stage at 14:30 to a mature phase by 15:00, with all five microphysics schemes displaying similar evolutionary trajectories. Notably, the model’s simulation of the weather development process lags behind observations by approximately 30 min. This slower-than-observed evolution rate within the model contributed to a delayed prediction of the rainfall onset. Given the rapid progression of the entire convective weather system, this lag in the simulated rainfall trigger time subsequently resulted in a substantial deviation in the predicted location of the primary rainfall zone from its actual position.
The rightmost columns of Figure 9 illustrate the vertical distribution of various hydrometeors during the simulated mature stage, as predicted by different microphysics schemes. The Lin scheme (Figure 9c) reveals distinct height variations among hydrometeors, with rain positioned at the cloud base, followed by graupel, while snow and cloud droplets occupy the upper regions of the cloud. Graupel particles exhibit the highest mixing ratio among the five types of hydrometeors, reaching 0.35 g/kg. In contrast, the WSM6 scheme (Figure 9f) displays minimal vertical segregation among hydrometeors, with ice particles and snow distributed throughout the 4–8 km altitude range. Notably, the mixing ratio of rain is zero, whereas snow achieves a maximum of 0.43 g/kg, accompanied by cloud droplets with mixing ratios up to 0.4 g/kg at the altitude of 4–5 km closing to cloud base. The Goddard scheme (Figure 9i) stands out, with snow dominating the mixing ratio values, peaking at 2 g/kg, while other hydrometeors show relatively lower mixing ratios. Specifically, ice particles, with the second-highest mixing ratio, reach only 0.5 g/kg. This scheme simulates hydrometeors exclusively in the ice phase, devoid of liquid hydrometeors, which explains the comparatively lower radar reflectivity, as the complex refractive index of ice is significantly lower than water. The Morrison scheme simulates an overwhelming presence of snow at 4 g/kg, followed by cloud droplets at around 1 g/kg. The WDM6 scheme, on the other hand, portrays a relatively uniform vertical distribution of hydrometeors, with cloud droplets exhibiting a high mixing ratio of 0.6 g/kg, primarily concentrated near the cloud base, and snow present throughout the cloud.
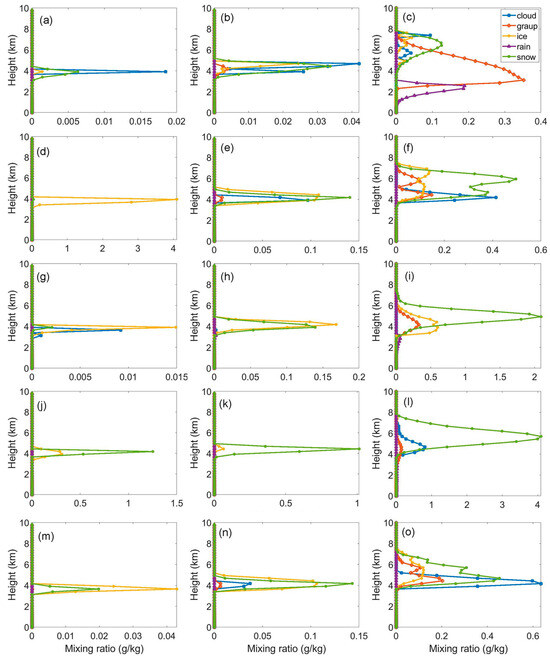
Figure 9.
The vertical distribution of mixing ratios of the cloud droplet, rain, ice, snow and graupel at different stages simulated with five cloud microphysics schemes. Left column: at 14:00, middle column: 14:30, and right column: 15:00. (a–c) Lin scheme, (d–f) WSM6 scheme, (g–i) Goddard scheme, (j–l) Morrison scheme, (m–o) WDM6 scheme. Unit of the mixing ratio in g kg−1.
Among the five microphysics schemes employed, only the Lin scheme successfully simulated rain with a notable mixing ratio of 0.2 g/kg, while the other schemes registered negligible rain mixing ratios. Upon analyzing the simulation outcomes, it was discovered that the chosen blue station was not positioned at the center of the simulated convective system. A consistent pattern emerged across all simulation results: an abundance of ice-phase particles and a relative scarcity of liquid-phase particles. This imbalance likely contributed to the lower simulated rainfall and narrower precipitation range compared with the observed data.
6. Conclusions and Discussion
A considerable portion of previous research on linear convective thunderstorms in Beijing has centered primarily on elucidating the underlying mechanisms, with a pronounced emphasis on the pivotal role of the topography of north China. Nevertheless, to the best of our knowledge, an exhaustive examination of the influence of diverse microphysics schemes employed in numerical models on these thunderstorms remains largely unexplored. In this paper, we utilize a WRF model to simulate a sudden quasi-linear convective weather event that occurred over Beijing on 30 May 2024. To delve into the impact of varying microphysics schemes on rainfall forecasting outcomes, we employ five distinct schemes: the Lin scheme, WSM6 scheme, Goddard scheme, Morrison scheme, and WDM6 scheme. We conduct an in-depth analysis of the spatial and temporal distribution and evolution of the precipitation and hydrometeors, aiming to evaluate the efficacy of each scheme in simulating or predicting quasi-linear convective thunderstorms events in north China. This comprehensive assessment serves as a valuable reference for enhancing the performance of microphysics schemes. The key findings of our study are summarized as follows:
- (1)
- The quasi-linear convective precipitation and gale-force wind weather unfolded on the periphery of a double-centered low-vortex system situated north of Beijing. The frigid northwest air originating from the northern low-vortex system converged and interacted with the warm, humid air streaming southwards, as both air masses converged around the mountainous regions north of Beijing. This interaction, coupled with the dynamic uplift generated by the low-vortex system, the convergence uplift, and the terrain-induced uplift, coalesced to forge a linear configuration of intense convection along the mountain ranges.
- (2)
- In terms of the spatial configurations of radar reflectivity simulated by the various microphysics schemes, these exhibit a remarkable congruence with the observed reflectivity. The simulated reflectivity locations closely correlate with observed patterns. Notably, the Goddard scheme excels in simulating a denser spatial dispersion of reflectivity, which most accurately reflects the observations, with the WDM6 scheme trailing behind. Conversely, the Morrison scheme deviates significantly from the observations due to its sparse spatial distribution of reflectivity. For areas marked by high radar reflectivity, the WSM6 scheme demonstrates the best agreement with the observations. Nevertheless, the Goddard scheme underestimates the reflectivity in the majority of areas, resulting in the largest deviation from the observed data.
- (3)
- In comparison with their radar reflectivity simulations, the performance of all five microphysical schemes in replicating cumulative rainfall falls short. None of the schemes effectively capture the distinct “quasi-linear” spatial arrangement of rainfall. When compared with precipitation observations, the simulated precipitation zones are narrower, and the cumulative rainfall amounts are underestimated. Additionally, the simulated location of the primary precipitation area is displaced towards the southeast of its true position, and the predicted timing of precipitation lags by approximately 30 min. In contrast, of the five schemes evaluated, the Morrison scheme exhibited the optimal performance in forecasting cumulative rainfall.
- (4)
- Among the five schemes, only the Lin scheme produced rain droplets in its outcomes. The mixing ratios of ice-phase hydrometeors simulated by each microphysics scheme surpassed those of liquid-phase hydrometeors. In general, the distinction between the single-moment and double-moment schemes was minimal.
This study comprehensively leverages multi-source data to investigate the spatial and temporal evolution of a quasi-line convective weather event, while meticulously examining the disparities in simulation performance among different microphysics schemes. For this special event, the study found inherent time “lag” characteristics of model simulations in comparison with observations, particularly in the context of a rapidly evolving weather system. Focusing on a quasi-linear convective thunderstorm over Beijing, the research employs five cloud microphysics schemes for numerical simulation and evaluation. Recognizing that diverse regions and weather processes may influence analysis results, some of the conclusions presented above necessitate further validation through a wider array of case studies, so as to ensure their robustness and representativeness. Additionally, the performance of other microphysics schemes, such as the NSSL scheme, Thompson scheme etc., remains unexplored, emphasizing the need for additional observational experiments and comparative analyses of simulations in future endeavors. These endeavors will contribute invaluable insights to refine and enhance the capabilities of numerical models.
Author Contributions
Conceptualization, J.H.; methodology, J.H.; software, J.H. and Z.Z.; validation, J.H., Y.B. and Q.S.; formal analysis, J.H.; investigation, J.H.; resources, J.H. and H.W.; data curation, Y.B. and Z.Z.; writing—original draft preparation, J.H. and Q.S.; writing—review and editing, C.H.; visualization, M.D.; supervision, M.D.; project administration, J.H.; funding acquisition, J.H. All authors have read and agreed to the published version of the manuscript.
Funding
This work was funded by the National Key R&D Program of China (grants 2023YFC3010700) and the National Natural Science Foundation of China (grants 42275081).
Data Availability Statement
The ground-based observation data presented in this study are available on request from the corresponding author due to legal reasons.
Acknowledgments
We appreciate the ECMWF ERA5 and Himawari science team for generously sharing their data. We thank the many contributors from the science team of the IAP who enabled our research and made this project possible.
Conflicts of Interest
The authors declare that they have no known competing financial interests or personal relationships that could have appeared to influence the work reported in this paper.
References
- Ding, Y.H. The major advances and development process of the theory of heavy rainfalls in China. Torrent Rain Disasters 2019, 38, 395–406. [Google Scholar] [CrossRef]
- Morrison, H.; Thompson, G.; Tatarskii, V. Impact of cloud microphysics on the development of trailing stratiform precipitation in a simulated squall line: Comparison of one- and two-moment schemes. Mon. Weather. Rev. 2009, 137, 991–1007. [Google Scholar] [CrossRef]
- Hersbach, H.; Bell, B.; Berrisford, P.; Hirahara, S.; Horányi, A.; Muñoz-Sabater, J.; Nicolas, J.; Peubey, C.; Radu, R.; Schepers, D.; et al. The ERA5 global reanalysis. Q. J. R. Meteorol. Soc. 2020, 146, 1999–2049. [Google Scholar] [CrossRef]
- Kim, D.K.; Suezawa, T.; Mega, T.; Kikuchi, H.; Yoshikawa, E.; Baron, P.; Ushio, T. Improving precipitation nowcasting using a three-dimensional convolutional neural network model from multi parameter phased array weather radar observations. Atmos. Res. 2021, 262, 10. [Google Scholar] [CrossRef]
- Skamarock, W.C.; Klemp, J.B.; Dudhia, J.; Gill, D.O.; Liu, Z.; Berner, J.; Wang, J.; Powers, J.; Duda, M.; Barker, D.; et al. A Description of the Advanced Research WRF Model Version 4; NCAR Technical Note NCAR/TN-556+STR; UCAR: Boulder, CO, USA, 2021; p. 145. [Google Scholar] [CrossRef]
- Bringi, V.N.; Huang, G.-J.; Chandrasekar, V.; Keenan, T.D. An areal rainfall estimator using differential propagation phase: Evaluation using a C-band radar and a dense gauge network in the Tropics. J. Atmos. Ocean. Technol. 2001, 18, 1810–1818. [Google Scholar] [CrossRef][Green Version]
- Chen, L.; Meng, Z.; Cong, C. An overview on the research of typhoon rainfall distribution. J. Mar. Meteorol. 2017, 37, 1–7. (In Chinese) [Google Scholar] [CrossRef]
- Coffer, B.E.; Parker, M.D.; Thompson, R.L.; Smith, B.T.; Jewell, R.E. Using near-ground storm relative helicity in supercell tornado forecasting. Weather Forecast. 2019, 34, 1417–1435. [Google Scholar] [CrossRef]
- Feingold, G.; Tzivion, S.; Leviv, Z. Evolution of raindrop spectra. part I: Solution to the stochastic collection/breakup equation using the method of moments. J. Atmos. Sci. 1988, 45, 3387–3399. [Google Scholar] [CrossRef]
- Morrison, H.; van Lier-Walqui, M.; Fridlind, A.M.; Grabowski, W.W.; Harrington, J.Y.; Hoose, C.; Korolev, A.; Kumjian, M.R.; Milbrandt, J.A.; Pawlowska, H.; et al. Confronting the challenge of modeling cloud and precipitation microphysics. J. Adv. Model. Earth Syst. 2020, 12, e2019MS001689. [Google Scholar] [CrossRef]
- Nor, M.; Holloway, C.E.; Inness, P.M. The role of local orography on the development of a severe rainfall event over western peninsular Malaysia: A case study. Mon. Weather. Rev. 2020, 148, 2191–2209. [Google Scholar] [CrossRef]
- Park, S.K.; Lee, E. Synoptic features of orographically enhanced heavy rainfall on the east coast of Korea associated with typhoon RUSA (2002). Geophys. Res. Lett. 2007, 34, 5. [Google Scholar] [CrossRef]
- Sun, J.M.; Zhang, J.; Deng, W.; Hu, W.H.; Wang, Y.Q. Cloud droplet nucleation simulation and parameterization. J. Atmos. Sci. 2022, 79, 2323–2342. [Google Scholar] [CrossRef]
- Chen, Y.; Zhai, P.M. Two types of typical circulation pattern for persistent extreme precipitation in central-eastern China. Q. J. R. Meteorol. Soc. 2014, 140, 1467–1478. [Google Scholar] [CrossRef]
- Ding, Y. Study on the Lasting Heavy Rainfalls over the Yangtze–Huaihe River Basin in 1991; China Meteorological Press: Beijing, China, 1993; pp. 254–255. (In Chinese) [Google Scholar]
- Guo, X.; Liu, X. Numerical simulation and observation study on microphysics formation processes of two different snowfall cases in northern mountain area of Beijing. Chin. J. Atmos. Sci. 2020, 44, 407–420. (In Chinese) [Google Scholar] [CrossRef]
- Sun, J.; Wei, J.; Fu, S. The multi-scale physical model for persistent heavy rainfall events in the Yangtze–Huaihe river valley. Chin. J. Atmos. Sci. 2018, 42, 741–754. (In Chinese) [Google Scholar] [CrossRef]
- Tao, S.; Ni, Y.; Zhao, S.; Chen, S.; Wang, J. The Study on Formation Mechanism and Forecasting of Heavy Rainfall in the Summer 1998; China Meteorological Press: Beijing, China, 2001; pp. 183–184. (In Chinese) [Google Scholar]
- Writing Group of Heavy Rain in North China. Heavy Rainfall in North China; China Meteorological Press: Beijing, China, 1993; p. 182. (In Chinese) [Google Scholar]
- Gao, S.; Zhou, Y.; Ran, L. A review on the formation mechanisms and forecast methods for torrential rain in China. Chin. J. Atmos. Sci. 2018, 42, 833–846. (In Chinese) [Google Scholar] [CrossRef]
- Sun, J.; Lei, L.; Yu, B.; Ding, Q. The fundamental features of the extreme severe rain events in the recent 10 years in the Beijing area. Acta Meteorol. Sin. 2015, 73, 609–623. (In Chinese) [Google Scholar] [CrossRef]
- Zhang, X.; HU, Y.; Zhang, F. Comparative study of the characteristics and causes of two low-vortex heavy rain events in north China. Chin. J. Atmos. Sci. 2023, 47, 1593–1610. (In Chinese) [Google Scholar] [CrossRef]
- Zhou, Z.; Du, M.; Hu, Y.; Kang, Z.; Yu, R.; Guo, Y. An evaluation and improvement of microphysical parameterization for a heavy rainfall process during the Meiyu season. Remote Sens. 2024, 16, 1636. [Google Scholar] [CrossRef]
- Shi, T.; Yang, Y.; Lu, G.; Wen, X.; Liu, L.; Qi, P. Observation analysis and numerical simulation of the urban barrier effect on thunderstorm organization. Remote Sens. 2024, 16, 1390. [Google Scholar] [CrossRef]
- Yang, Y.; Sun, J.M.; Shi, Z.; Tian, W.S.; Li, F.X.; Zhang, T.Y.; Deng, W.; Hu, W.; Zhang, J. The preliminary application of spectral microphysics in numerical study of the effects of aerosol particles on thunderstorm development. Remote Sens. 2024, 16, 2117. [Google Scholar] [CrossRef]
- Xue, F.; Zeng, Q.C.; Huang, R.H.; Li, C.Y.; Lu, R.Y.; Zhou, T.J. Recent advances in monsoon studies in China. Adv. Atmos. Sci. 2015, 32, 206–229. [Google Scholar] [CrossRef]
- Sun, J. The pattern structure and thermodynamic and dynamic processes of severe storms associated with linear convective gales. Meteor. Mon. 2023, 49, 1–11. (In Chinese) [Google Scholar]
- Chen, Y.; Sun, J.; Xu, J.; Yang, S.; Zong, Z.; Chen, T.; Fang, C.; Sheng, J. Analysis and thinking on the extremes of the 21 July 2012 torrential rain in Beijing Part l: Observation and thinking. Meteor. Mon. 2012, 38, 1255–1266. (In Chinese) [Google Scholar]
- Chen, M.; Wang, Y. Numerical simulation study of interactional effects of the low-level vertical wind shear with the cold pool on a squall line evolution in North China. Acta Meteorol. Sin. 2012, 70, 371–386. (In Chinese) [Google Scholar]
- Luo, Q.; Zheng, Y.; Chen, M. Evolution and development mechanisms of a strong arc shaped squall line that occurred in northern Beijing in 2017. Acta Meteorol. Sin. 2019, 77, 371–386. (In Chinese) [Google Scholar]
- Sheng, J. Characteristics and Mechanism of Quasi-Linear Convective Systems in North China. Ph.D. Thesis, Nanjing University of Information Science & Technology, Nanjing, China, 2020. (In Chinese). [Google Scholar]
- Wang, W.J.; Zhu, B.; Yang, S.J.; Lu, Q.F.; Liu, N.W.; Li, Y.; Wang, Z.H. Comparison and analysis of strong precipitation simulation capability of Morrison and Milbrandt-Yau two-moment cloud micro-physical schemes. Trans. Atmos. Sci. 2018, 41, 721–730. [Google Scholar] [CrossRef]
- Yin, J.; Wang, D.; Zhai, G. A study of characteristics of the cloud microphysics parameterization schemes in mesoscale models and its applicability to China. Adv. Earth Sci. 2014, 29, 238–249. [Google Scholar] [CrossRef]
- Bessho, K.; Date, K.; Hayashi, M.; Ikeda, A.; Imai, T.; Inoue, H.; Kumagai, Y.; Miyakawa, T.; Murata, H.; Ohno, T.; et al. An introduction to Himawari-8/9—Japan’s new-generation geostationary meteorological satellites. J. Meteorol. Soc. Jpn. 2016, 94, 151–183. [Google Scholar] [CrossRef]
- Rotunno, R.; Klemp, J.B.; Weisman, M.L. A theory for strong, long-lived squall lines. J. Atmos. Sci. 1988, 45, 463–485. [Google Scholar] [CrossRef]
- Lin, Y.-L.; Farley, R.; Orville, H.D. Bulk parameterization of the snowfield in a cloud model. J. Clim. Appl. Meteor. 1983, 22, 1065–1092. [Google Scholar] [CrossRef]
- Hong, S.-Y.; Lim, O.J. The WRF single-moment 6-class microphysics scheme (WSM6). J. Korean Meteorol. Soc. 2006, 42, 129–151. [Google Scholar]
- Tao, W.; Anderson, D.; Chern, J.; Houser, P.; Hou, A.; Entin, J. The Goddard multi-scale modeling system with unified physics. Ann. Geophys. 2009, 27, 3055–3064. [Google Scholar] [CrossRef][Green Version]
- Morrison, H.; Curry, J.A.; Khvorostyanov, V.I. A new double-moment microphysics parameterization for application in cloud and climate models. part I: Description. J. Atmos. Sci. 2005, 62, 1665–1677. [Google Scholar] [CrossRef]
- Lim, K.S.; Hong, S. Development of an effective double-moment cloud microphysics scheme with prognostic cloud condensation nuclei (CCN) for weather and climate models. Mon. Weather Rev. 2010, 138, 1587–1612. [Google Scholar] [CrossRef]
Disclaimer/Publisher’s Note: The statements, opinions and data contained in all publications are solely those of the individual author(s) and contributor(s) and not of MDPI and/or the editor(s). MDPI and/or the editor(s) disclaim responsibility for any injury to people or property resulting from any ideas, methods, instructions or products referred to in the content. |
© 2024 by the authors. Licensee MDPI, Basel, Switzerland. This article is an open access article distributed under the terms and conditions of the Creative Commons Attribution (CC BY) license (https://creativecommons.org/licenses/by/4.0/).