Article

From Do-It-Yourself Design to Discovery: A Comprehensive Approach to Hyperspectral Imaging from Drones

by
Oliver Hasler
1,*,
Håvard S. Løvås
2,
Adriënne E. Oudijk
1,
Torleiv H. Bryne
1 and
Tor Arne Johansen
1
1
Department of Engineering Cybernetics, Norwegian University of Science and Technology, NTNU, 7034 Trondheim, Norway
2
Department of Biology, Norwegian University of Science and Technology, NTNU, 7491 Trondheim, Norway
*
Author to whom correspondence should be addressed.
Remote Sens. 2024, 16(17), 3202; https://doi.org/10.3390/rs16173202
Submission received: 2 May 2024 / Revised: 18 July 2024 / Accepted: 15 August 2024 / Published: 29 August 2024
(This article belongs to the Section Engineering Remote Sensing)

Abstract

:
This paper presents an innovative, holistic, and comprehensive approach to drone-based imaging spectroscopy based on a small, cost-effective, and lightweight Unmanned Aerial Vehicle (UAV) payload intended for remote sensing applications. The payload comprises a push-broom imaging spectrometer built in-house with readily available Commercial Off-The-Shelf (COTS) components. This approach encompasses the entire process related to drone-based imaging spectroscopy, ranging from payload design, field operation, and data processing to the extraction of scientific data products from the collected data. This work focuses on generating directly georeferenced imaging spectroscopy datacubes using a Do-It-Yourself (DIY) imaging spectrometer, which is based on COTS components and freely available software and methods. The goal is to generate a remote sensing reflectance datacube that is suitable for retrieving chlorophyll-A (Chl-A) distributions as well as other properties of the ocean spectra. Direct georeferencing accuracy is determined by comparing landmarks in the directly georeferenced datacube to their true location. The quality of the remote sensing reflectance datacube is investigated by comparing the Chl-A distribution on various days with in situ measurements and satellite data products.

1. Introduction

Remote sensing, particularly the field of imaging spectroscopy, has evolved into an indispensable instrument for many users, with its applications steadily increasing. Agriculture, mining, fisheries, archeology, urban planning, environmental monitoring, defense, and security are just a few of the industries that have already embraced this fast-evolving technology [1].
Remote sensing from space often lacks the desired resolution and flexibility needed by the end user. Manned airborne platforms, while offering higher resolution, are expensive and subject to many regulations and restrictions. Drone-based remote sensing, on the other hand, offers high resolution comparable to that achieved by manned airborne platforms, in combination with higher versatility, efficiency, and cost-effectiveness that cannot be matched by satellites or traditional aircrafts [2,3].
Smaller and more powerful electronic components enable the miniaturization of sensors and Unmanned Aerial Vehicles (UAVs) [4], and hence push the boundaries for what is possible with these devices. A trend towards the use of UAVs for remote sensing applications, as well as new use cases for drone-based remote sensing applications, can therefore be observed [2]. This trend is not limited to airborne remote sensing platforms but reflects a general shift towards the use of robotics in field research [5].

1.1. Remote Sensing

The primary objective of the UAV mission presented in this work was to provide a conceptual proof-of-concept and test the novel miniaturized imaging spectroscopy payload and the data processing pipeline presented in this paper. This payload and proposed data processing approach require minimal ground support and allow for the retrieval of marine science data products related to habitat maps, ocean color, phytoplankton, and Chlorophyll-A (Chl-A) concentrations. The payload used for this has been designed and built in-house, including the push-broom imaging spectrometer [6]. The main scientific contribution of this paper is the experimental validation of this payload for oceanic research applications. More details about the payload can be found in Section 2 and in [7].

1.2. Contribution—Holistic Imaging Spectrometer Payload and Image Processing Pipeline

The high spectral and spatial resolution offered by push-broom imaging spectrometers [8], and the possibility to build such devices from Commercial Of-The-Shelf (COTS) components, make them particularly interesting for a wide range of applications [1]. Over the years, a multitude of miniaturized “Do-It-Yourself” (DIY) imaging spectrometer designs have been conceptualized and published [9,10,11]. Various imaging spectrometer designs were intended for air- and spaceborne platforms [6,12] and prompted the development of more complex imaging spectroscopy payloads for UAVs [13,14,15,16] and small aircrafts [17].
With a few exceptions, e.g., [18], these designs implement the push-broom imaging spectrometer architecture due to its simplicity and its high spectral resolution. While these DIY payloads are usually simpler, lighter, and more versatile than their commercial counterparts, such as [19,20,21,22], they lag behind their commercial alternatives when it comes to ruggedness, data quality, as well as tailored post-processing pipelines and operational user-friendliness. Versatile implies that it can be easily customized or modified for various applications, and it can be integrated into small UAVs.
In contrast to [23,24], where commercial imaging spectrometers were utilized in UAV payloads, the lightweight payload introduced in this work is novel in its design for economic long-range missions over rugged, coastal terrain. It uniquely features the capability for direct reflectance calculations by measuring downwelling irradiance and direct georeferencing, similar to [25], enabled by an INS/GNSS sensor suite that is precisely synchronized with the imaging spectrometer.
Sensor synchronization, particularly between the INS/GNSS sensor suite and the imaging spectrometer, is achieved using a dedicated hardware device. This device allows for synchronization with an accuracy of up to 10 n s , making a dedicated synchronization algorithm, e.g., as suggested in [26], redundant.
Commercial software used in remote sensing and imaging spectroscopy, such as ENVI 5.6, typically require calibrated and georeferenced datacubes as input. The processing software to obtain such a datacube is normally proprietary and comes with the procured imaging spectrometer hardware. Scientific publications related to hyperspectral data processing normally also refer to the processing and analysis of the calibrated and georeferenced hyperspectral datacube and not the low-level processing steps to obtain such a data product. Scientific publications related to obtaining a hyperspectral datacube with DIY imaging spectrometer designs and payloads are sparse. There are very few publications available that are specifically related to UAVs [13,14,15,16]. Most of the publications that do exist are related to other platforms, e.g., satellites [27,28] or focus only on a few selected processing steps. A comprehensive and complete approach to creating a calibrated and georeferenced remote sensing reflectance ρ RS λ datacube from raw data is missing in the scientific literature. Figure 1 represents a general approach to UAV-based imaging spectroscopy, showing the data gathering with UAV-based sensors in blue on the left, and the final product on the bottom right (green). The data Processing Levels, such as PL-L1 A/B to PL-L2 A/B in Figure 1, are rendered according to the processing levels used by ESA and NASA (data processing levels (accessed on 7 June 2024): https://www.earthdata.nasa.gov/engage/open-data-services-and-software/data-information-policy/data-levels).
The payload presented was deliberately designed without a gimbal. In this way, a weight- and energy-saving design can be achieved. The reduced mechanical complexity, however, places high demands on precise state estimation, which furthermore must be precisely synchronized to the imaging spectrometer frame captures.
The payload and methodology presented in this paper aim to bridge the gap for DIY imaging spectroscopy payloads on UAVs. This paper presents a holistic approach ranging from UAV-payload design, calibration, and georeferencing to operational considerations and finally the data product: a calibrated hyperspectral datacube. Last, various applications of the reflectance data product are presented, with a focus on the spectral angular mapping (SAM) and a non-linear spectral unmixing method to estimate Chl-A distribution over a sample area.

1.3. Paper Overview

Section 2 showcases the methodology, the overall system setup, and the specific payload designed and deployed on the field campaigns. Operational considerations and payload operation are discussed in Section 3. Section 4 and Section 5 elaborate on the data processing and calibration of the imaging spectrometer data. State estimation and georeferencing are covered in Section 6 and Section 7, respectively. Section 8 presents data analysis and information extraction from the gathered data. The paper concludes with the results and the conclusion in Section 9.

2. Payload Description

The miniaturized remote sensing payload designed for this mission is illustrated in Figure 2. The payload was first described in [7] and was first tested during the campaign described in [29]. The optical remote sensing components of the payload are a Red–Green–Blue (RGB) camera, a push-broom imaging spectrometer based on [6], and an upward-facing spectrometer. These sensors are described in Section 2.1: Optical Sensors.
An Inertial Measurement Unit (IMU) and two Global Navigation Satellite System (GNSS) receivers are used for precise state estimation and navigation. Section 2.2: Sensors for State-Estimation and Navigation elaborates further on this. These core elements are connected through various auxiliary components described in Section 2.3: Data Processing, Synchronization, and Storage.
Figure 3 shows a comprehensive layout of the payload components and their integration into the described remote sensing payload. The payload design presented in this paper is a significant improvement compared to the payload used in [13,14]. Key enhancements include the mechanically more rigid integration of the imaging spectrometer and the IMU into the payload frame (see Figure 2), which significantly reduces a major source of georeferencing uncertainty identified in [14]. Additionally, the direct integration of an RGB camera into the payload offers much greater situational awareness. The incorporation of an additional RTK-GNSS receiver further augments the precision of the state-estimation and thus enhances the accuracy of the directly georeferenced datacube. All this is complemented with a lighter and less power-hungry single Board Computer (SBC), and increased storage capacity. In the following sections, the most important components of the payload are described in more detail.

2.1. Optical Sensors

One of the most common imaging spectrometer designs is the push-broom imaging spectrometer. Their high spectral resolution makes these sensors particularly interesting for applications such as ocean color observation or Chl-A estimation [8,30]. The push-broom imaging spectrometer is the main remote sensing sensor of the presented payload. This push-broom imaging spectrometer is an extremely lightweight design weighing only 160 g . More information on the push-broom imaging spectrometer can be found in [6]. An RGB camera complements the imaging spectrometer [31]. The RGB camera permits the generation of photomosaics or Digital Surface Maps (DSM) of the overflown area using photogrammetry. A Camera Serial Interface (CSI) connects the RGB camera with the SBC (Figure 3). A Camera Serial Interface (CSI) connects the RGB camera with the SBC (Figure 3). Due to the reasonably high resolution of 8 MP, the RGB camera offers good image quality, compensating for the large Field-Of-View ( FOV ). An upward-facing spectrometer [32] is used to measure downwelling irradiance. The main purpose of this sensor is to directly calculate remote sensing reflectance as the ratio of the upwelling radiance L u λ and the downwelling irradiance E d λ . We note that due to issues of overexposure described in [7], this sensor was not used for the data analysis presented later in this paper. The optical properties of the sensors described in this section are listed in Table 1 and Table 2.

2.2. Sensors for State-Estimation and Navigation

The Safran STIM-300 [34], a tactical grade IMU, configured to output incremental velocity Δ ν and incremental angles Δ φ , is used as the primary navigation sensor. The sampling rate is configured to be f IMU = 1000 Hz .
Specific force f IMU b m / s 2 and angular rate ω IMU b rad   s 1 are related to the measurements as follows:
f IMU b = Δ ν IMU b T IMU
ω IMU b = Δ φ IMU b T IMU
To convert the IMU measurements to the UAV’s body-fixed coordinate frame { b } , a rotation matrix R IMU b is used (3).
R IMU b = 0 1 0 1 0 0 0 0 1 + R tuning
The tuning matrix R tuning is required to align the orientation of the IMU in the UAV and the corresponding trimmed flight attitude. The tuning matrix R tuning is defined so that the gravity vector g b e points to the center of the earth in level flight. R tuning and the corresponding tuning values are given in Appendix A.
Two GNSS receivers [35] are used to provide absolute position measurements. The positions of the GNSS antennas on the Mini Cruiser UAV, along with other sensors are illustrated in Figure 4. The GNSS antennas are labeled as g 1 and g 2 , respectively. The GNSS receiver for the GNSS antenna g 2 in Figure 4 is configured as a “moving baseline”, while the GNSS receiver for the GNSS antenna g 1 is configured as a “rover” ([36] (Ch. 10)). Both GNSS receivers were configured to output RAW-GNSS observables with a frequency of f GNSS = 1 Hz . With additional base station data, this allows for the use of post-processing kinematics (PPK-GNSS) in the navigation state-estimation algorithm.

2.3. Data Processing, Synchronization, and Storage

The SBC, Khadas-Vim3 [37] is the core component of the onboard data processing system. It was chosen for its light weight, good computational performance, low power consumption, and its small form factor. LSTS-DUNE [38] running on the operating system Ubuntu “Server 20.04.6 LTS” is used as a runtime environment to handle all tasks related to remote sensing, navigation, remote control, and data management.
Precise timestamping of the imaging spectroscopy data as well as timestamping of the navigation sensor data has a significant impact on the direct georeferencing accuracy. Special attention is therefore given to this task. A dedicated device, the SentiBoard [39] is used to timestamp all sensor data, except for the RGB camera, to an accuracy of Δ t = 10   n s . This setup allows precise synchronization of the imaging spectrometer and navigation data. The absolute time reference for the SentiBoard is provided through a Pulse Per Second (PPS) signal from one of the GNSS receivers (see Figure 3).
The data from all sensors is stored on a Solid State Drive (SSD) with a capacity of 2 TB . An Ethernet switch allows the payload to interface with the drone’s radio link, and through it, with an operator on the ground. These and all other components are schematically shown in Figure 3. The payload operator has the ability to modify the payload settings during operation in real-time through LSTS-NEPTUS [38] and monitor the data capturing process. This allows for remote control and a flexible mission execution, with on-the-fly adjustment of remote sensing parameters as well as the UAV flight plan. Furthermore, it is a stepping stone to closer integration, interoperability, and autonomy between robotic agents.

2.4. UAV Platform

Figure 5 shows the payload integrated into the UAV platform: “ET-Air/Mini Cruiser” [40]. The UAV platform was heavily customized by NTNUs UAVlab and provides the radio downlink through which real-time communication between an operator and the payload is possible.

3. Payload Operation and Operational Considerations

Image quality for airborne push-broom imaging spectrometers depends on the interplay between speed over ground v, altitude above the imaged surface h, UAV pitch rate θ ˙ , imaging spectrometer frame rate f IS = T IS 1 ( T IS is the frame interval), and exposure time e IS . Figure 6 shows the push-broom imaging from the side and from the back. The FOV along track κ and the FOV across track ζ are visualized in this image.
The following equations can be found in Appendix A, and describe pixel overlap O pix and the pixel length along track l pix for an airborne imaging spectrometer operating with speed v, altitude h, pitch rate θ ˙ , and the imaging spectrometer settings f IS and e IS :
O pix = h tan κ 2 + tan κ 2 θ ˙ f IS 1 e IS v f IS 1 e IS 0
l pix = h tan κ 2 + tan κ 2 + θ ˙ · e IS + v · e IS
It is assumed that all parameters in these equations ( θ ˙ , v and h) are constant during one imaging spectrometer frame capture and that the UAV is flying parallel to the ground. Figure 7 illustrates the relationship between the different parameters, which are described by Equations (4) and (5).
The overall image quality depends highly on these settings. To achieve optimal image quality, we propose the following approach. Given the imaging spectrometer parameters, the swath width (Figure 6) is determined by the altitude h. The aerial platform’s cruise speed and the local wind conditions determine the speed over the ground v. Given these parameters, the push-broom imaging spectrometers framerate f IS and the exposure time e IS ought to be chosen so that the pixel length l pix is minimal and there is a positive overlap O pix between consecutive pixels along the track.
While longer exposure times are usually beneficial for a better Signal-to-Noise (S/N) ratio, they also lead to elongated irregularly shaped pixels, which, depending on the aerial platform’s movements, do not necessarily remain rectangular. Long exposure times further increase motion blur in the image. Both effects cause a decrease in image quality (spatial resolution). Moreover, the inequality condition (4) must be fulfilled to avoid “gaps” between consecutive frames. There is a trade-off between high spatial resolution along the track, achieved by adopting a high frame rate f IS , or a high S/N ratio, achieved by adopting a long exposure time e IS . In addition, the exposure time is constrained by the need to avoid over-exposure.
Previous missions [14] have shown that if spatial resolution is important, a high frame rate f IS is preferable to a long exposure time e IS , despite the lower signal-to-noise ratio. This applies in particular to maneuverable aircrafts such as small UAVs. To achieve the best S/N ratio, (e.g., when spatial resolution is less important) the exposure time should be set to the highest value. Imaging spectrometers on small maneuverable platforms provide the best results for spatially resolved datacubes when the highest achievable frame rate f IS (considering the limitations of S/N ratio and overexposure) and the exposure time e IS = f IS 1 = T IS are selected. Consequently, (4) simplifies to: O pix = 2 · h · tan κ 2 . With these settings the inequality condition (4) will always be fulfilled, and the pixel length l pix will be minimal, leading to the best spatial resolution for the unprocessed image spectrometer datacube.
These settings might differ from push-broom imaging spectrometer settings on other platforms, such as satellites, aerostats, or high-altitude long endurance (HALE) platforms. Such platforms may fly using much less dynamic maneuvers and therefore allow for longer exposure times e IS . All flights that were conducted as part of the experiments described in this paper followed these considerations.

4. Processing of Payload Data

The following section elaborates on the onboard and offline data processing pipeline. A complete overview of the data processing pipeline for all sensors as it was implemented for the described UAV payload is shown in Figure 8. Much of the data processing steps shown in Figure 8 were performed offline. These processing steps are further discussed in Section 5, Section 6 and Section 7.

4.1. Processing of Navigation Sensors

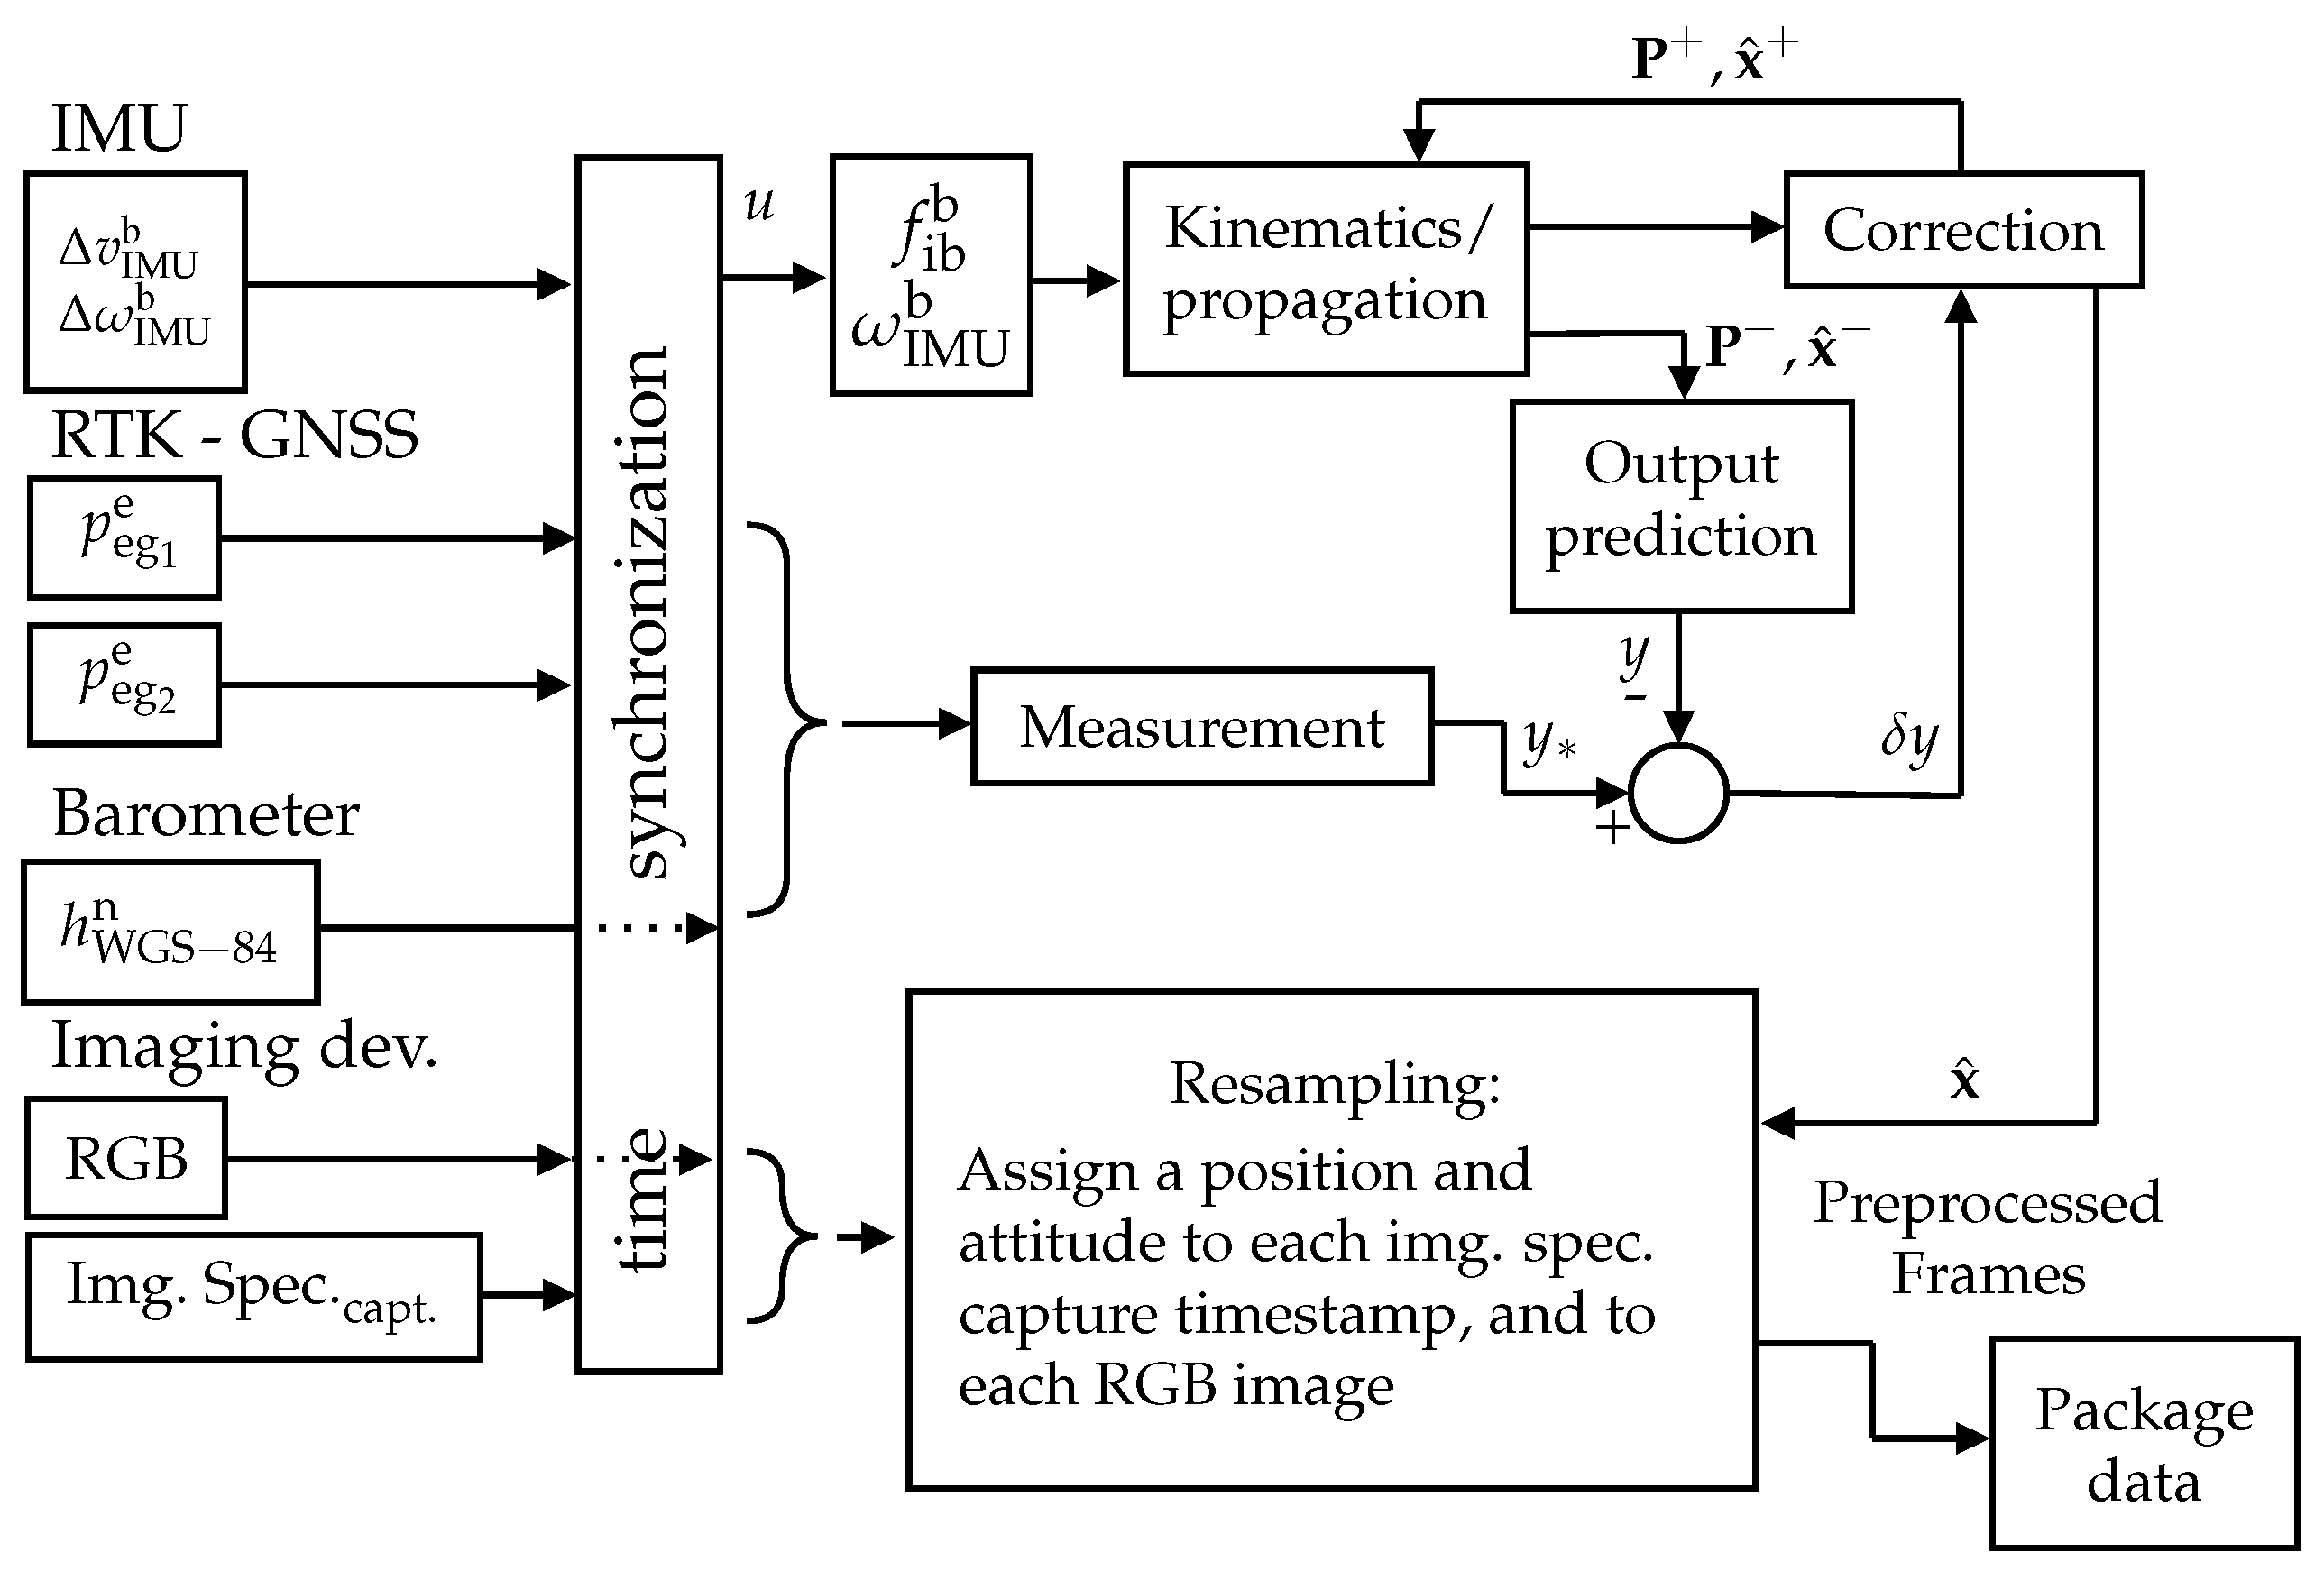
The SentiBoard functions as a timestamping and data-concentration device. IMU and GNSS data (among others) are received by the SentiBoard, where the data are timestamped with a precision of Δ t = 10   n s and sent as one data stream to the SBC (see Figure 3) which saves the data on the internal SSD (Section 2.3). All subsequent post-processing of navigation data is performed offline. The time reference for the sensor-logs timestamped by the SentiBoard is provided by the GNSS time from the moving-base GNSS receiver g 2 shown in Figure 4. This allows the conversion of all sensor data timestamped by the SentiBoard to UNIX time.
The RAW-GNSS observables were initially processed with the software RTKLIB, version b34g [41] before being integrated into the state-estimation algorithm (Section 6). Additionally, the PPK-GNSS logs were resampled and converted to UNIX time (Section 6.1.5). Post-processing of the IMU data involves the conversions (1) and (2), and the conversion of the measurement timestamp to UNIX time.

4.2. Image Spectrometer Data Processing

The software DUNE [38] manages the thread responsible for the push-broom imaging spectrometer captures. Four key parameters need to be configured for the correct operation of this sensor. A region of interest, abbreviated as w , must be defined on the imaging spectrometer’s complementary metal–oxide semiconductor (CMOS) sensor. This region of interest specifies an area on the sensor that is illuminated using the imaging spectrometer’s optics (see Figure 6). Excluding non-illuminated areas saves valuable processing time. The spectral dimension is binned with a binning factor of bin = 8 . This is done to reduce the frame size and data rate, consequently allowing for higher frame rates. The chosen binning factor does not affect the spectral resolution for this sensor, since the binned pixel is smaller than the full-width half maximum (FWHM) of the imaging spectrometer optics. Exposure time e IS and frame rate f IS are the final two parameters that must be configured by the user. This can either be done pre-flight or during field operations through the software LSTS-NEPTUS [42].
During operation, the imaging spectrometers camera sensor retains the set parameters until the DUNE thread updates them. When a frame is captured, the flash output of the imaging spectrometer sensor is raised to 5   VDC from its default state of 0   VDC , triggering a timestamp capture on the SentiBoard (Figure 3). In post-processing, this can be used to accurately determine the time at which a frame capture started. The imaging spectrometer frames and the imaging spectrometer timestamps generated by the SentiBoard are processed and stored separately on the payload. Table 3 shows an overview of the exposure times and frame rates chosen for the push-broom imaging spectrometer and the RGB camera for the flights which are analyzed in this paper.

4.3. RGB Data Processing

The exposure time for this sensor is adjusted by the camera’s internal drivers and the frame rate is handled by a dedicated DUNE task and can be chosen by the operator. All images are timestamped with the corresponding UNIX time derived from the SBC and saved in RAW file format in 8 MP image quality on the payload’s internal SSD (Figure 3). The post-processing of the stored files is performed offline.
During field operations, every 30 s , an RGB image is downscaled to a dimension of 468 × 432 pixels and sent to the payload operator through the UAV’s radio link connection as a JPG-file. This thumbnail image provides very useful information during field operations and allows the operator to perform real-time adjustments during the mission.
Due to varying lighting conditions and the camera’s internal drivers reacting to it, the RGB image quality varied widely within one flight. Addressing these inconsistencies during post-processing posed considerable challenges. The post-processing steps which are shown in Figure 9 resulted in the best image quality and the least color variations between consecutive image captures. Figure 10 shows an orthophoto generated with color-corrected images and the software Open Drone Map (ODM) version 3.5.3 [43].

5. Calibration

5.1. Preliminaries Push-Broom Imaging Spectrometer

The imaging spectrometers “spectral–spatial” frame, captured at timestamp t k R with time index k, is denoted as F IS k R b × n . The imaging spectrometer datacube is denoted as X IS R n × c × b . The spatial dimension n is equal to the pixels across the track, the dimension c is equal to the number of timestamps c = k , and the spectral dimension b is equal to the number of bands.

5.2. Imaging Spectrometer Calibration

The imaging spectrometer was spectrally and radiometrically calibrated. A smile correction algorithm was used to further improve the data quality. This section describes the calibration procedure in more detail.

5.2.1. Spectral Calibration

The imaging spectrometer bands were spectrally calibrated with a second-order polynomial (6). Each band index b gets assigned a wavelength λ b . The coefficients for (6) were determined using a calibration procedure similar to [44].
λ b = a 0 + a 1 · b + a 2 · b 2
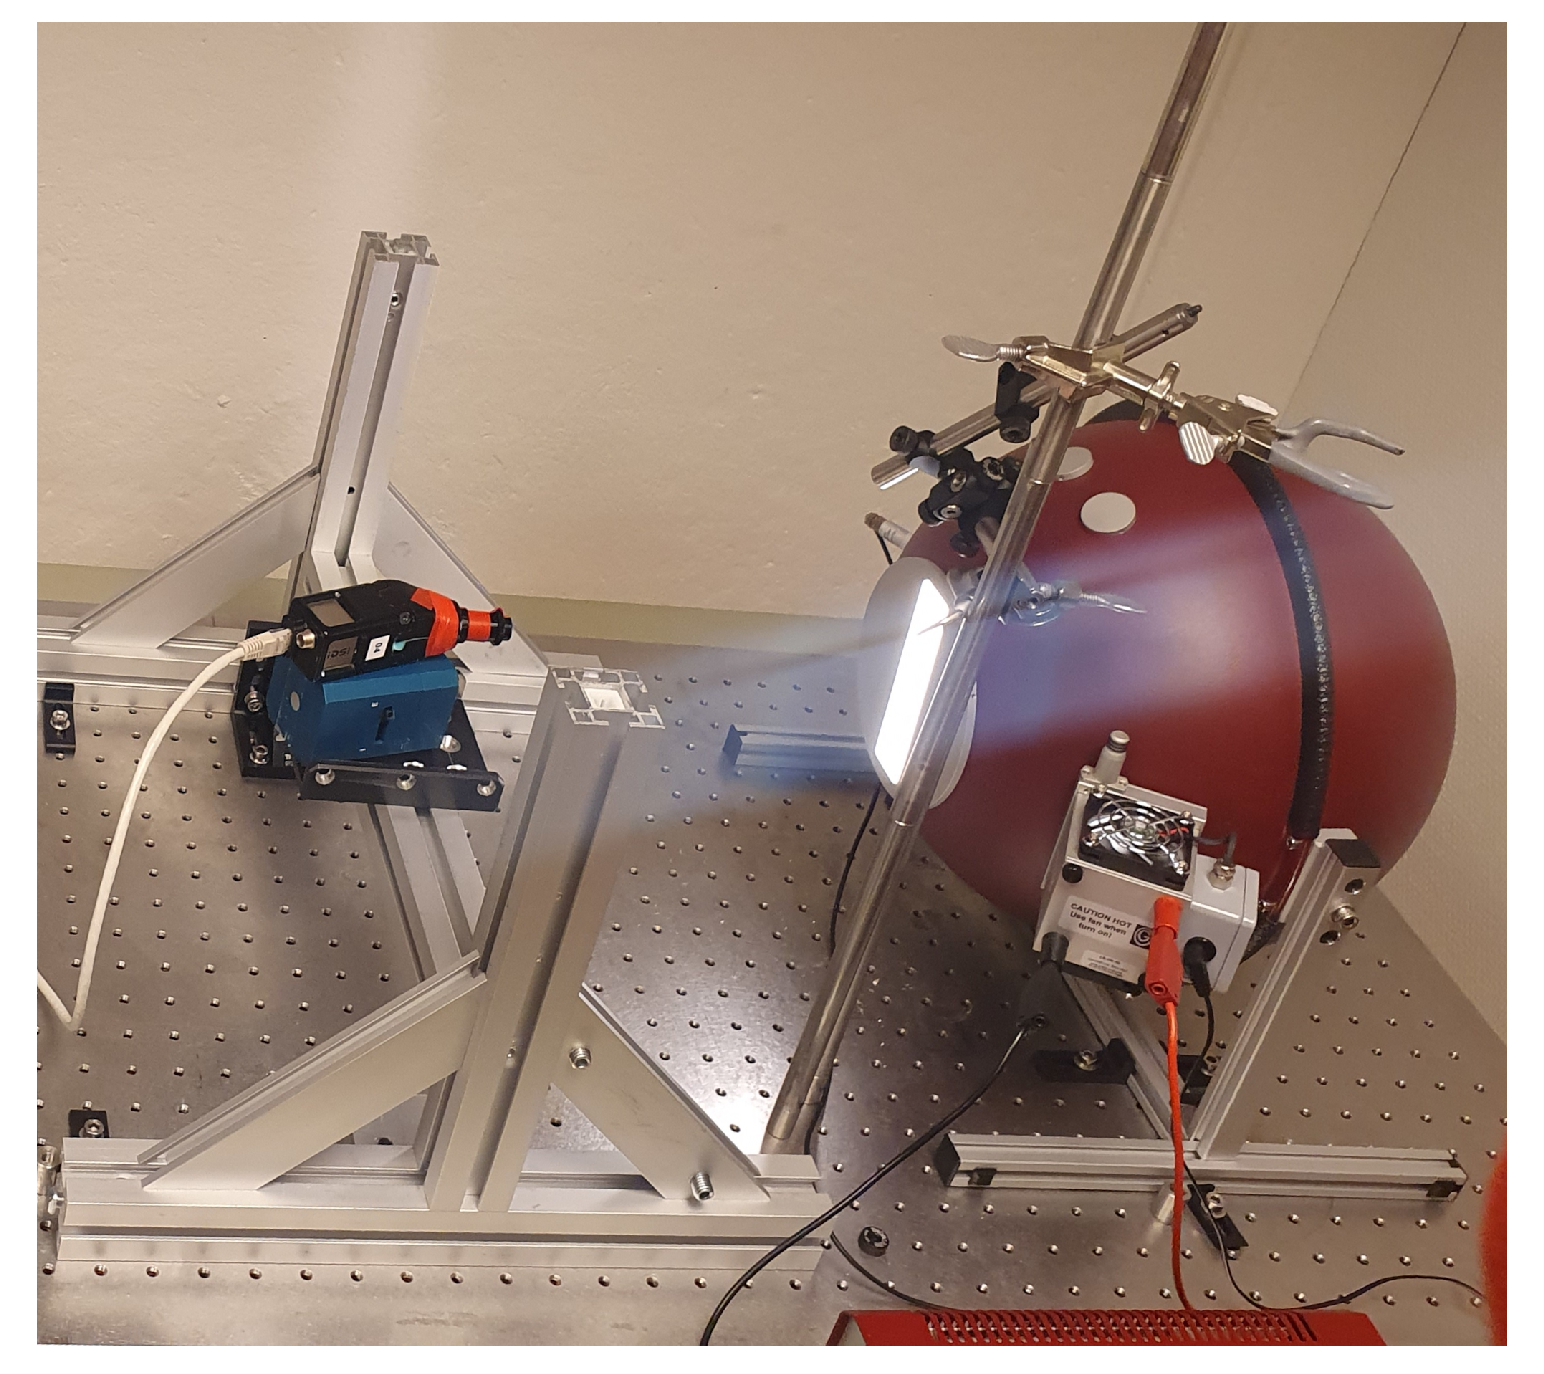
An argon and a mercury lamp were used in the Ulbricht sphere for this calibration step. The calibration coefficients determined by this calibration procedure are listed in Table 4.

5.2.2. Radiometric Calibration

The radiometric calibration data were collected during the same calibration procedure as depicted in Figure 11. Radiometric calibration data consist of the radiometric calibration matrix F c and a dark current image F dark . The radiometric calibration matrix F c was recorded with an exposure time of 0.04   s in the setting shown in Figure 11. The same exposure time was used for the dark current matrix F dark . With these calibration data, the radiometric calibration can be applied to all frames as shown below:
F IS k = F IS raw k F ¯ dark · F c e k
where e k is the exposure time during frame capture k. The matrices F c and F dark , each with dimensions of 1216 × 242 , were cropped to the region of interest w (see Figure 6) and binned with the same factor as F IS k ( bin = 8 ).

5.2.3. Spectral Smile Correction

Spectral smile and keystone are common optical distortions that reduce the image quality in push-broom imaging spectrometers [8]. The imaging spectrometer used in this project suffers especially from spectral smile distortions due to its small lenses and the resulting large curvature of these lenses. Reducing spectral smile was therefore prioritized in this work. The approach used is based on the calibration procedure ([45] (Ch. 8.2.2)). The central band of the spectral calibration matrix F c is used as a reference, while the spectra in the other rows are interpolated and resampled onto the same wavelength using basis-spline curve fitting.

5.3. Remote Sensing Reflectance and Atmospheric Corrections

Remote sensing reflectance ρ RS λ is defined as
ρ RS λ = L u BOA λ E d BOA λ
where surface-leaving radiance at the Bottom Of the Atmosphere (BOA) is denoted as L u BOA λ . L u λ is the upwelling radiance measured by the imaging spectrometer, which is L u BOA λ altered by the atmosphere between the UAV and BOA. E d BOA λ is the downwelling irradiance at the observed object due to solar illumination from the sky. These measurements were used to calculate ρ RS λ .
If L u λ is not measured at the surface level (BOA), it has to be corrected for atmospheric influence. For satellite-based imaging spectrometers, the atmosphere typically contributes 90–95% of the received signal ([30] (Ch. 15)). Since UAV-based imaging spectrometers have the major part of the atmosphere above them, the contribution of the atmosphere to the received signal is much smaller. Nevertheless, even a small effect will significantly reduce the radiometric accuracy. We therefore estimate the contribution of the atmosphere with a simple atmospheric correction algorithm.
Let α d λ be the atmospheric absorption of the entire atmosphere, expressed as a fraction related to the downwelling irradiance at the Top Of the Atmosphere (TOA) E d TOA λ :
α d λ = E d TOA λ E d BOA λ E d TOA λ
Δ α λ = α d λ p 0 p h p 0
The absorption of a fraction of the atmosphere Δ α λ can be calculated using the ratio of the local pressure p h to the pressure on the ground p 0 . This relationship is applicable because the atmospheric column above the UAV is directly proportional to the local air pressure p h at the UAVs flight level, as expressed in (10), and because there is a linear relationship between gas concentration and light attenuation due to Beer–Lambert’s law for absorption (see: Appendix B.2).
The radiance L u λ measured at the UAV’s altitude must be atmospherically corrected. This is done by reformulating (8) with (10), resulting in (11). The relationship (11) is more comprehensively elaborated on in [7].
L u λ = L u BOA λ · 1 Δ α λ
ρ RS λ = L u λ 1 Δ α λ 1 E d BOA corr λ
The derivation of (12) relies on the assumption that the mean atmospheric gas ratios are similar above and below the UAV flight level. Since the mass of distinctive atmospheric layers with different gas ratios (e.g., the ozone layer) are small in comparison to the whole atmosphere, and since most of the atmosphere is above the UAV, this approach can be justified for low-flying UAVs during bright weather conditions. It can therefore be used to calculate ρ RS λ and corrected with regards to the minor atmospheric influences found at this altitude. E d BOA corr λ in (12) is derived in the next two subsections, Section 5.3.1 and Section 5.3.2.

5.3.1. Calculation of the Atmospheric Absorption

The atmospheric absorption α d λ is calculated by (9), where E d TOA λ is derived from the spectral blackbody irradiance of the sun. The spectral blackbody irradiance from the sun’s surface F 0 λ is calculated as shown in (13) [46].
F 0 λ = 2 · π · h · c 2 λ 5 exp h · c k · λ · T Sun 1
The black body irradiance at the earth F E λ is calculated as shown in (14):
F E λ = R Sun 2 D Sun Earth 2 · F 0 λ
To calculate the irradiance E d TOA λ from F E λ , a cosine correction is done:
E d TOA λ = F E λ · cos ( θ Sun )
θ Sun is the angle between the unit vector on the local tangential plane n E and unit vector pointing at the sun n S , as illustrated in Figure 12. The angle θ Sun can be determined as follows:
θ Sun = 90 ϵ Sun
Table 5 shows the sun’s elevation ϵ Sun and the pressure on the ground p 0 on the relevant days of the field campaign in Ny-Ålesund, Svalbard [47]. All constants used in these calculations are shown in Table 6.

5.3.2. Indirect Illumination

In our experiments, the downwelling irradiance on the ground, E d BOA λ , was measured at the Ny-Ålesund ArcLight observatory [33]. However, the downwelling irradiance E d BOA λ does not only consist of rectilinear propagating light rays from TOA to BOA. Several effects cause indirect illumination and cause higher light measurements than expected when considering only light absorption and rectilinear light propagation, see also Appendix B. The two main effects which increase downwelling irradiance E d BOA λ in this scenario are:
  • Downwelling light reflected into the atmosphere by ArcLights surrounding. This reflected light is backscattered by the atmosphere into the ArcLight sensor. If ArcLight is surrounded by a surface with a high albedo, such as snow, this effect is more pronounced.
  • Rayleigh and forward scattering. This effect can lead to higher E d BOA λ measurements, especially during low sun elevations [48]. In contrast to the first described effect, this also happens on the ocean’s surface.
Eliminating these effects is not in the scope of this paper, however, a simple correction can reduce their impact, as described next.
Figure 13 shows in the top row a comparison of the downwelling irradiance at 12:00 UTC+1 (red, dotted) and at 17.30 UTC+1 (blue, dotted). The plot at the top left shows E d BOA λ as measured at the ArcLight observatory. The top right plot shows E d BOA corr λ (corrected), where E d BOA λ was reduced by a correction factor f to adjust the atmospheric absorption during the time with the highest sun position ϵ Sun . E d BOA corr λ can be calculated as:
E d BOA corr λ = E d BOA λ · 1 f
which allows for the calculation of the atmospheric absorption Δ α λ with (9) and (10). The lower left diagram show the absorption of the entire atmosphere calculated according to (9), α d λ . The indirect effects described above play a smaller role at higher sun elevations ϵ Sun and therefore also at times with high downwelling irradiance, E d TOA λ or E d BOA λ .
This approach does not eliminate the second-order effects described above but reduces them to a similar level for different lighting conditions. Therefore, a similar amount of atmosphere is removed from L u λ for different flights under the same atmospheric conditions. This approach is considered sufficient for low-altiude UAVs, as only part of the atmosphere needs to be removed (see Figure 12). Appendix B further justifies this approach with a simulation of the downward irradiance with RADTRANX [49]. The value f = 0.129 was estimated using regression, minimizing the Root Mean Square Error (RMSE) between the absorption spectra α d λ for the time with the highest sun elevation and the flight time specified in Appendix A, Table 10. The regression between the two curves resulted in a RMSE = 0.02 (see bottom right diagram in Figure 13).

5.3.3. Remote Sensing Reflectance

Using (16) in (12) allows for the calculation of an atmospherically corrected ρ RS λ datacube. Figure 14 shows on the left side the downwelling irradiance E d BOA corr λ measured (and corrected) by ArcLight (blue) and the atmospherically corrected upwelling radiance L u λ 1 Δ α λ 1 measured by the imaging spectrometer on the UAV over the ocean (red). The corresponding ρ RS λ is shown on the right-hand side of Figure 14. The spectrum shows a typical shape for ocean water [30].

6. State Estimation

A Multiplicative Error-state Kalman Filter (MEKF) is used to accurately estimate the UAV’s position and attitude. The results of this state estimation algorithm are used as input in the georeferencing algorithm described in Section 7. This section explains the state-estimation algorithm in detail.

6.1. State-Estimation Preliminaries

6.1.1. Coordinate Systems

Coordinate frames are denoted with { · } . z bc a R 3 denotes a vector z , from point { b } to point { c } decomposed in coordinate frame { a } .
Five different coordinate systems were used in this paper (see Figure 15 and Figure 16), [36,50]. The Earth-Centered Inertial (ECI) frame, denoted with { i } . The Earth Centered Earth Fixed (ECEF) frame, denoted with { e } . The North-East-Down (NED) frame, denoted with { n } . These coordinate frames were used for state estimation (Section 6) and georeferencing (Section 7). Furthermore, the body-fixed frame of the UAV is denoted with { b } and the imaging spectrometer coordinate frame is denoted with { s } . The imaging spectrometer coordinate frame is situated such that z s is perpendicular to the imaging spectrometer central axis, and y s and x b are collinear but point in opposite directions (see Figure 4 and Figure 16).
Latitude and longitude on Earth are represented by μ π / 2 , π / 2 and λ π , π .

6.1.2. Attitude Representations and Relationships

Quaternions of the Hamiltonian representation are used to describe the attitude of the UAV. The unit quaternion, representing a rotation from frame { γ } to frame { β } , is defined as follows:
q β γ = q s q v = q s q x q y q z H
where H : = q β γ q β γ = 1 ; q s R 1 ; q v R 3 [50,51]. The quaternion can be used to calculate the rotation matrix R β γ S O ( 3 ) [51]:
R β γ = f q β γ = q s q v q v I 3 + 2 q v q v + 2 q s S q v
The Hamilton quaternion product (⊗) is defined as in: [51].
q 3 = q 1 q 2 = q s 1 q s 2 q v 1 q v 2 q s 1 q v 2 + q s 2 q v 1 + q v 1 × q v 2
The kinematic equation of a given unit quaternion is given as in: [50,51].
q ˙ = 1 2 q ω = 1 2 Ω ω q
Ω ω = 0 ω ω S ( ω )
where a skew symmetric matrix is represented with S · S S 3 (e.g., S z 1 z 2 = z 1 × z 2 where z 1 , z 2 R 3 ). The conjugate of a quaternion is given as follows:
q = q s q v
Additionally, the Euler angles are given as follows, with ϕ = roll, θ = pitch, and ψ = yaw:
Θ = ϕ , θ , ψ
The true attitude quaternion is denoted with q , while the attitude error quaternion is denoted with δ q . δ a ^ represents the 3D attitude error and is used to calculate the attitude error quaternion δ q ^ δ a ^ . The attitude error quaternion δ q ^ δ a ^ is determined from the attitude change δ a ^ as follows: [52].
δ q ˜ δ a ^ = 1 16 + ( δ a ^ ) δ a ^ 16 δ a ^ δ a ^ 8 · δ a ^

6.1.3. Inertial Measurement Unit

An IMU can be described using the following simplified measurement model. Specific forces and Angular Rate Sensor (ARS) measurements are given as follows: [50]
f IMU b = f ib b + b ACC b + ε ACC b
ω IMU b = ω ib b + b ARS b + ε ARS b
where f ib b represents the specific force relating to the acceleration of the IMU. The variable ω ib b represents angular velocity, while v ib b and a ib b represent linear velocity, respectively. Acceleration (ACC) in the body frame is { b } .
f ib b = R e b · v ˙ ib e R e b · g b e = a ib b + S ω ib b · v ib b R e b · g b e
The gravity vector is represented by g b e
g b e = γ ib e + ω ie 1 0 0 0 1 0 0 0 0 r eb e
where ω ie in (27) is the angular rotation rate of the earth (see [36,50]) and S ω ib b · v ib b describes the centripetal acceleration. The accelerometer biases are described by b b . The ARS biases are described by ω b , and γ ib e describes the gravitational acceleration [36].

6.1.4. Kinematics—Strapdown Equations

The position and velocity of the body frame relative to the ECEF frame is represented by p eb e R 3 and v eb e R 3 . The superscript { e } indicates that these vectors are decomposed in the ECEF frame. The attitude between the body and the ECEF frame is given as the unit quaternion q b e , while the angular velocity of the body frame { b } relative to the ECEF frame { e } is given as ω eb e R 3 . The strapdown equations following the explanations mentioned above are:
p ˙ eb e = v eb e
v ˙ eb e = 2 · S ω ie e v eb e + R b e q b e · f eb b + g b e
q ˙ b e = 1 2 · Ω ω eb b · q b e
where the specific force acting on the UAV is:
f eb b = R b e q b e v ˙ eb e R b e q b e g b e

6.1.5. Time Conventions

The payload raw data were timestamped by a dedicated hardware, (Section 2.2). The timestamps t k were converted to UNiplexed Information Computing System (UNIX) time. The absolute time measurement to convert t k t UNIX was provided by the Global Positioning System (GPS) time T GPS , which is derived by the “interval time of week” i T o w , its fractional part f T o w and “weeks since GPS epoch” G P S week . All these signals are transmitted by the GPS satellite configuration and received by the GNSS receivers on the UAV. The GPS time T GPS is calculated as follows [53].
T GPS = i T o w · 10 3 + f T o w · 10 9 + G P S week · T s
The duration of a GPS week T s is defined as T s 604,800   s [54]. The International Atomic Time T TAI and the UNIX time T UNIX are calculated as follows:
T TAI = T GPS + Δ T TAI-GPS T UNIX = T TAI + Δ T UNIX-GPS T leap TAI-UTC
The leap seconds T leap TAI-UTC consist of a constant offset Δ T TAI-GPS and the leap seconds between T GPS and T UTC , T leap GPS-UTC [55].
T leap TAI-UTC = Δ T TAI-GPS + T leap GPS-UTC
The epochs for the GPS satellite configuration T GPS and the UNIX time system T UNIX are as follows:
T GPS T 0 = 06.01.1980 0 : 00 : 00 U T C + 0 T UNIX T 0 = 01.01.1970 0 : 00 : 00 U T C + 0
The offsets between T GPS , T TAI and T UNIX are therefore as follows (see Table 10):
T leap GPS-UTC = 18   s 01.01.2017-present Δ T TAI-GPS 19   s Δ T UNIX-GPS 315,964,800   s
The value for T leap GPS-UTC is given for the time period during which these experiments were conducted.

6.2. Multiplicative Error-State Kalman Filter—Prediction

The UAV’s Inertial Navigation System (INS) state vector is described as follows:
x ^ = p ^ eb e , v ^ eb e , q ^ eb e , b ^ ACC b , b ^ ARS b
The UAV kinematic is propagated as follows (Figure 17) [36,50].
ω ^ eb k b = ω IMU k b b ^ ARS k b R ^ e b ω ie e
Δ q b k e = cos T IMU 2 · ω ^ eb k b 2 sin T IMU 2 · ω ^ eb k b 2 · ω ^ eb k b ω ^ eb k b 2
q ^ b k e = q ^ b k 1 e Δ q b k e
R b k e = q s k 2 q v k q v k · I 3 × 3 + 2 q s k S q v k + 2 q v k q v k
R b avg k e = 1 2 R b k e + R b k 1 e
a ^ eb k e = 2 S ω ie e v ^ eb k 1 e + R b a v g k e q b e f ^ ib k b + g b k e
v ^ eb k e = v eb k 1 e + a ^ eb k e · T IMU
p ^ eb k e = p ^ eb k 1 e + v ^ eb k e · T IMU + T IMU 2 2 · a ^ eb k e
b ^ ACC k e = e T IMU T ACC · b ^ ACC k 1 e
b ^ ARS k e = e T IMU T ARS · b ^ ARS k 1 e
where the subscript k indicates the discrete time increment of the MEKF. ω IMU k b is given by (2) and f ^ ib k b by (26). Furthermore, for every new IMU measurement, the covariance matrix P ^ k is updated as follows ([36] (Ch. 3)) and ([50] (Ch. 4)):
Φ k = I 15 × 15 + F k · T IMU
P ^ k = Φ k P ^ k + Φ k + Q d k
P ^ k P ^ k + P ^ k / 2
where the matrices F k and Q d k are given in Appendix C.1.

6.3. Multiplicative Error-State Kalman Filter—Update

The error-state vector δ x ^ expresses the correction to x ^ after an aiding measurement has been received:
δ x ^ = δ p ^ , δ v ^ , δ a ^ , δ b ^ ACC , δ b ^ ARS
The error-state vector is calculated for each aiding measurement (Figure 17), and the Kalman filter update with a new aiding measurement is performed as follows:
K k = P k H k H k P k H k + R k 1
P ^ k + = I K k H k P ^ k I K k H k + K k R k K k
P ^ k + P ^ k + + P ^ k + / 2
δ x ^ k = K k · y k y ^ k
where R k is the measurement noise covariance matrix. Update of the state vector x ^ with error states in δ x ^ is described in (51)–(55).
p ^ k e + = p ^ k 1 e + δ p ^ k e
v ^ k e + = v ^ k 1 e + δ v ^ k e
q ^ k e + = q ^ k 1 e δ q ^ k e
b ^ ACC k e + = b ^ ACC k 1 e + δ b ^ ACC k e
b ^ ARS k e + = b ^ ARS k 1 e + δ b ^ ARS k e
After the INS states have been corrected, the error state vector δ x ^ is reset to 0.

6.3.1. Position Correction Using GNSS

As mentioned in Section 4, the GNSS receivers stored RAW-GNSS observables, allowing PPK-GNSS post-processing (Figure 8). Since there are two GNSS receivers (Figure 4) with position accuracies smaller than the distance between the two sensors (see Figure 4) the MEKF position updates using GNSS measurements also result in UAV heading corrections. The subscript j { 1 , 2 } in (56) indicates the GNSS antennae location, as shown in Figure 4. The MEKF position correction using GNSS measurements is based on the following:
y j = p e g j e + R ^ b e · p g j b b
y ^ = p ^ eb e
H = I 3 0 3 × 12
R = R ^ e n σ μ 2 0 0 0 σ λ 2 0 0 0 σ h 2 R ^ e n

6.3.2. Position Correction Using Barometer

To use the barometer as an aiding sensor in the MEKF, the altitude difference between earth’s geoid, here modeled using the EGM2008 [56], and the WGS-84 ellipsoid height must be determined. Using Vermeille’s [57] approach, the latitude, μ ^ , longitude λ ^ , and height above the WGS-84 ellipsoid h ^ wgs-84 are calculated from p ^ eb e [56]
μ ^ ; λ ^ ; h ^ wgs-84 p ^ eb e
where μ ^ and λ ^ , the geoid’s height over the WGS-84 ellipsoid, h geo can be calculated using EGM2008 [56]. As a result, the geoid height at the take-off position of the UAV h geo 0 can be determined and an offset between the measured GNSS altitude h wgs-84 and the corrected barometer height h b can be calculated. The value h cal was used to eliminate the remaining offset between the geoid and ellipsoid at the take-off position. To calibrate the barometer to the flight’s altitude (see Appendix A, Table 10), a scaling factor k sc was used. The absolute flight altitude for the calibration was obtained from GNSS sensor 1 (Figure 4). The values for h cal and k sc vary depending on atmospheric conditions and are listed in Table A2. The calibration procedure for the barometer is more thoroughly explained in Appendix C.2.
The measurement update with the calibrated barometer altitude h b is based on the following ([36] (Ch. 6)):
y = h b
y ^ = h ^ b = p ^ eb e p ^ es e 2
H = p ^ eb e p ^ es e p ^ eb e p ^ es e 2 , 0 1 × 12
R = σ b 2
where p ^ es e is calculated as:
p ^ es e = R N + h ^ geo μ ^ , λ ^ cos μ ^ cos λ ^ R N + h ^ geo μ ^ , λ ^ cos μ ^ sin λ ^ R N 1 e 2 + h g e o sin μ ^
R N = a / 1 e 2 sin μ ^ 2
R N is given as in (66) ([36] (Ch. 2.4.2)), with a and e given in Appendix Calculation of Earth Eccentricity.

6.4. Multiplicative Error-State Kalman Filter—Tuning and Performance

The measurement uncertainties for the two PPK-GNSS receivers and the barometer used in the MEKF are listed in Table 7. These values were determined by tuning and are in line with the datasheet for the GNSS receivers [35,53] and the barometer [58].
The process noise matrix is given by:
Q b = q ACC 0 0 0 0 q ARS 0 0 0 0 q ACC , bias 0 0 0 0 q ARS , bias
These values were selected by calculating the ARS and ACC sensor noise and bias models for the IMU [34] according to [36,50] and are listed in Table 8.
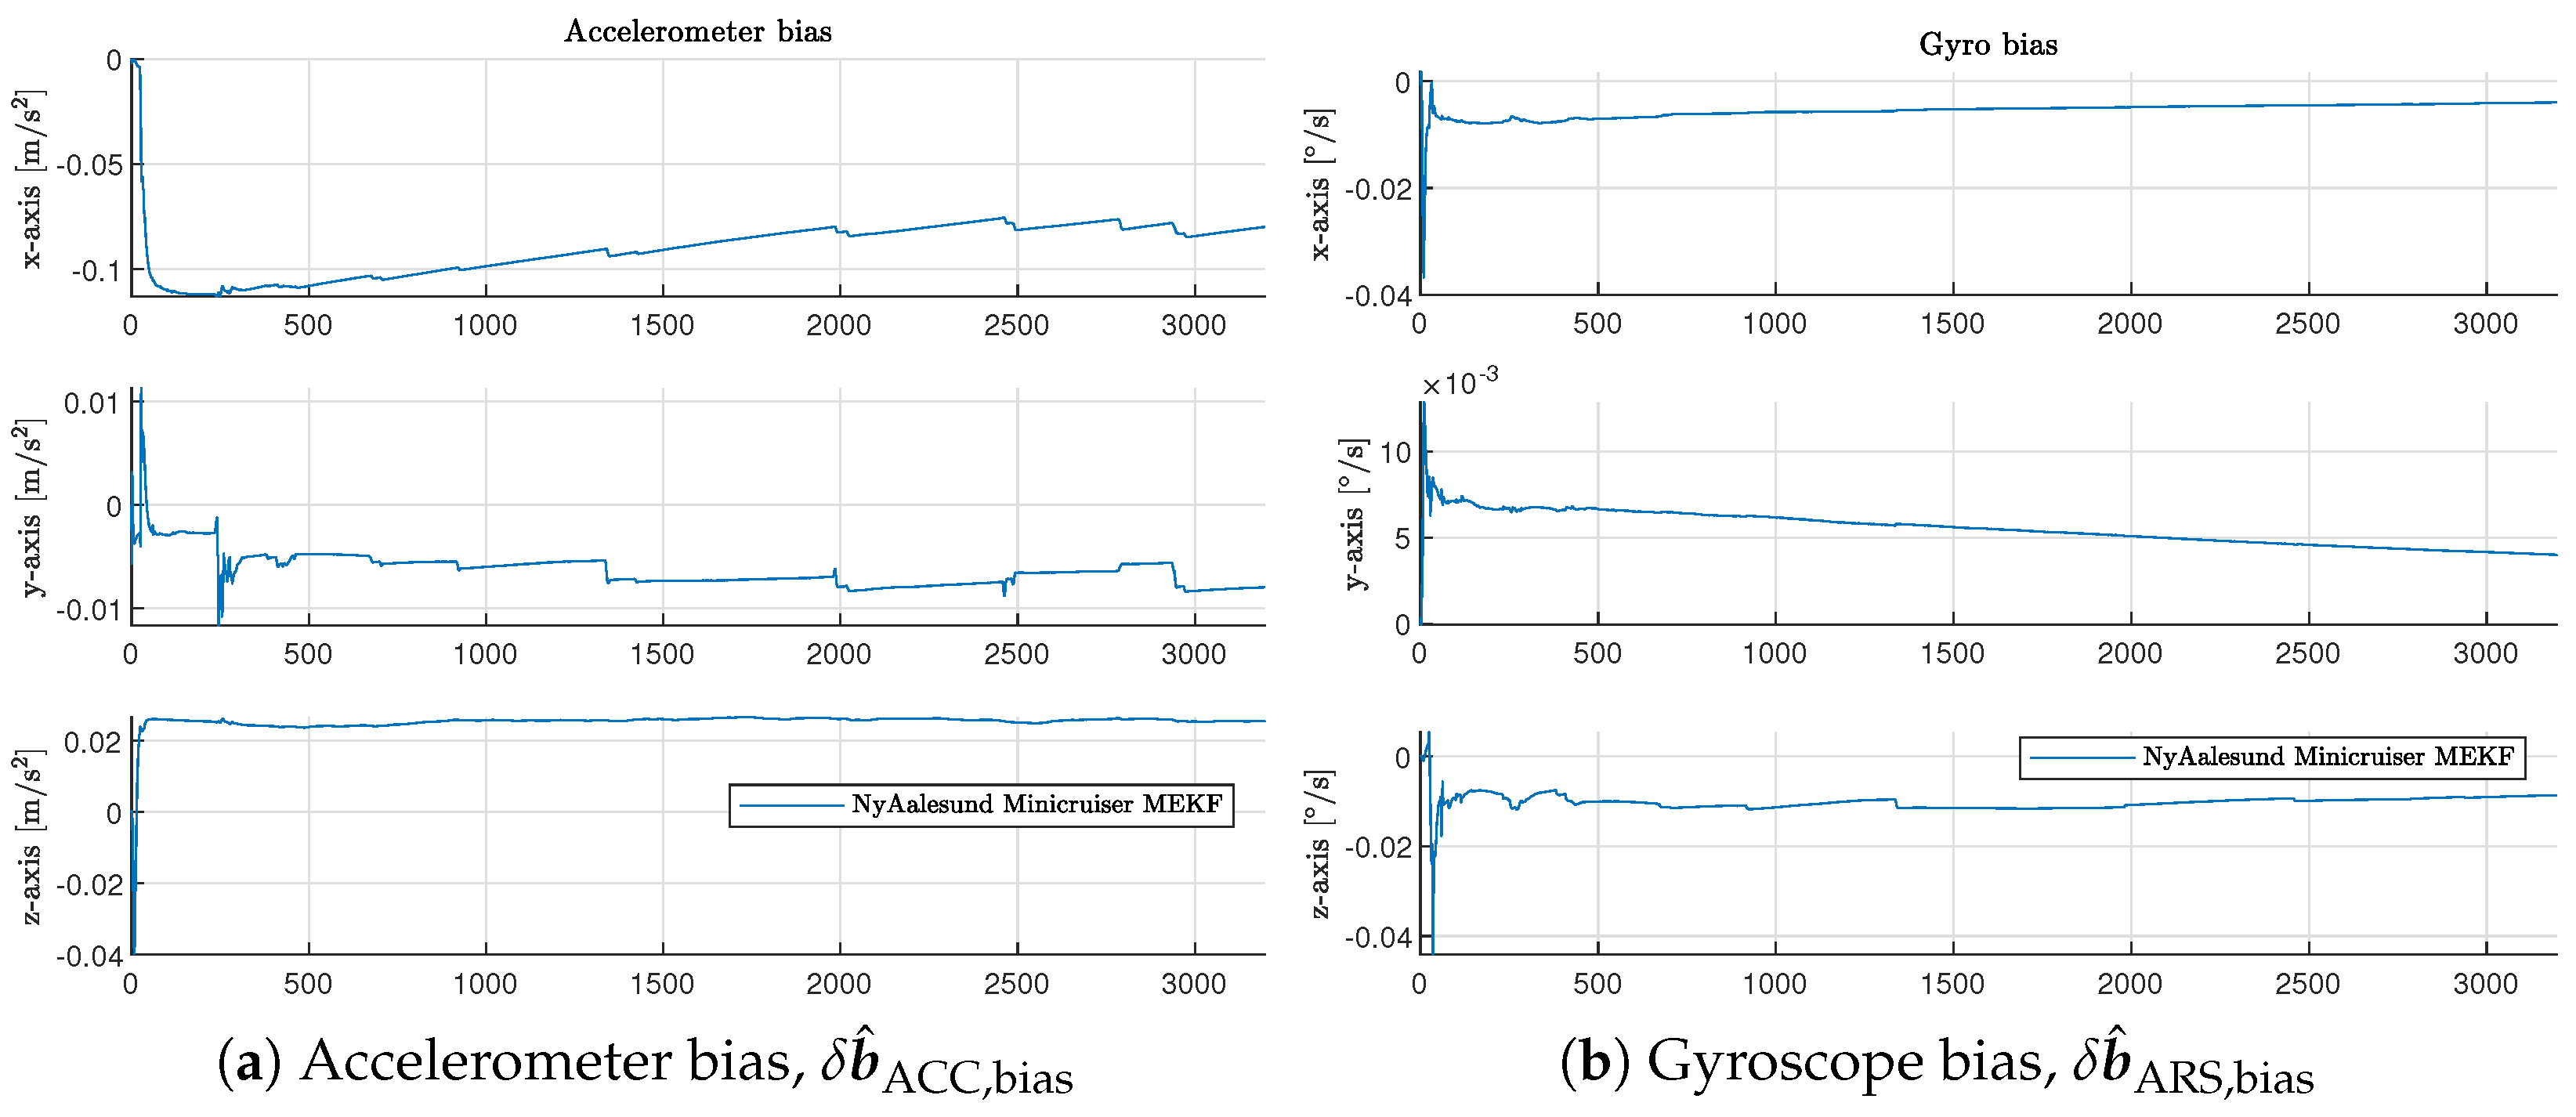
With these settings, the MEKF is able to estimate position p ^ eb e and altitude q b e with high accuracy, so that direct georeferencing (Section 7) is possible. As an example, Figure 18a,b show the MEKF acceleration bias δ b ^ ACC , bias and the MEKF gyroscope bias δ b ^ ARS , bias for flight 8, respectively.

6.5. Time Synchronization between Sensor Logs and MEKF Output

The MEKF output maintains the time granularity of Δ t = 10   n s of the IMU timestamps. Following data cleanup and correction for SentiBoard drift with T GPS , the converted T UNIX (Section 6.1.5) is used to synchronize the payload and UAV-autopilot logs.
The concluding state-estimation processing step is packing the data into chunks of N = 2000 imaging spectrometer frames F IS , together with the corresponding RGB images and MEKF output. Splitting the data into sizable packages ensures that file sizes are manageable. The data packages created in this way serve as input for the georeferencing step described in Section 7 and are referred to below as transects.

7. Georeferencing

The georeferencing approach used in this paper was based on the open-source gref4hsi python library (gref4hsi-GitHub: https://github.com/havardlovas/gref4hsi (accessed on 14 June 2024) PyPI: https://pypi.org/project/gref4hsi/) (see also [59] (accessed on 14 June 2024)), which is an expansion of the georeferencing approach used in [60]. This library is targeted towards the georeferencing (ray–terrain intersection), orthorectification (resampling), and coregistration (geometric calibration) of hyperspectral push-broom imagery. The data in this paper were georeferenced and orthorectified with default settings except that a geoid model was used as terrain model, and we orthorectified the datacube to a 1 × 1 m Universal Transverse Mercator (UTM) 33N grid. The input for the software is the imaging spectrometer data, navigation data, a push-broom camera model, and a terrain model. The output are orthorectified datacubes, RGB composites, and ancillary data.

7.1. State-Estimation Data—Time Interpolation and Pose Conversions

The gref4hsi software performs a ray–terrain intersection in ECEF { e } for each imaging spectroscopy capture. The closest position p eb e and orientation q n b of the state-estimation output to a capture are found. ECEF positions, p eb e , and NED quaternions, q b n , are used as input to the software.
At first, the software performs linear interpolation of p eb e and Spherical Linear Interpolation (SLERP) for orientations q b n to the timestamp of each imaging spectrometer frame, F IS . The interpolated orientation, q ^ b n , is then converted to the ECEF frame, { e } , by:
R n e μ ^ , λ ^ , h ^ p eb e
R ^ b n q ^ b n
q ^ b e R ^ b e = R n e · R ^ b n
The rotation matrices R n e depend on the UAV’s current location and are determined for each time step dependent on the latitude μ ^ , longitude, λ ^ and altitude h ^ , which are calculated from p eb e  (68). The origin of the local NED coordinate frame used for georeferencing is determined by the first N frames, where N is the number of spatial–spectral imaging spectrometer frames grouped into one transect, as defined in Section 6.5. The time-interpolated ECEF positions of the UAV can then be used in the georeferencing. Notably, the ECEF referred to here is WGS-84 with EPSG code 4978.

7.2. Push-Broom Camera Model

We hereunder include parameters describing the camera projection model as well as the relative pose of the imager on the UAV, sometimes referred to as boresight angles (three angles) and lever arms (three lever arms). For the low FOV imager, we omitted lens distortions and simply modeled the camera using a 1D pinhole model. We can calculate the angular field across the track, ζ , from the slit length, S l , and the focal length f of the objective lens (see Figure 6):
ζ = 2 · tan 1 S l 2 · f ; rad
Based on the principle of conformal triangles, we can calculate the equivalent focal length in pixels using the number of illuminated pixels along the spatial axis of the camera sensor, s w :
f pix = n p tan ζ 2 ; pix
The second parameter needed to define pixels as rays is the principal point, u c (defining the optical axis). It is commonplace to set it as the midpoint, i.e., u c n pix / 2 , where n pix is the number of pixels in the region of interest s w .
Using these camera parameters, we can compute a ray, given the pixel index. If we define pixel indices as i { 1 , , n pix } , a pixel can be defined by the ray, r i s , as:
r i s = u i u c f pix 0 1
where we should note that the x-axis of the imager is approximately aligned with the y-axis of the UAV due to different conventions. For further illustrations of the pinhole model see Figure 6. Moreover, since the MEKF estimates the UAV’s pose, we need to express the rays in the UAV’s coordinate reference system (CRS). The boresight angles describing the rotation from the imaging spectrometer frame { s } to the UAV body frame { b } are Euler angles parametrized R s b (defined in Appendix D). With R s b , the ray direction in the ECEF frame { e } is:
r ^ i e = R ^ b e · R s b · r i s
The position of the imaging spectrometer in the ECEF frame { e } , i.e., ray origin, is determined by:
p ^ es e = p ^ eb e + R b e · p bs b
The lever arm p bs b , here meaning the translation from body frame { b } to imaging spectrometer frame { s } , can be determined from Figure 4. For the configuration used in the work, we have p bs b = 0.08 , 0 , 0 .

7.3. Digital Elevation Model

A raster file representing the EGM2008 geoid [56] is used to represent the sea surface, and it was cropped to the survey area and used as a terrain model. The DEM is used to create a point cloud, which in turn is used to create a 3D-mesh, representing the geoid locally. The 3D mesh was then converted to ECEF and used for ray–terrain intersection.

7.4. Ray Tracing Methodology for 3D Mesh Intersection

Ray tracing is used to find the intersections between the rays extending from the imaging spectrometer r i e and the 3D mesh generated in Section 7.3. The intersection search is limited to a length of 500   m (see l i in (77)). The intersection point of a ray with the 3D mesh, decomposed using the ECEF coordinates { e } , is represented by p em e . The relationship between the 2D mesh intersection point p ^ em e , the vector from the imaging spectrometer to the 2D mesh p ^ sm e , and p ^ es e , respectively, r ^ i e and l i , is given by:
p ^ em e = p ^ es e + p ^ sm e
p ^ em e = p ^ es e + r ^ i e · l i
Since the MEKF outputs and thus p ^ sm e are timestamped, each mesh intersection point p ^ em e corresponds to a reflectance spectrum ρ RS λ generated in Section 5. This results in a 3D point cloud where each point represents a reflectance spectrum ρ RS λ .

7.5. Orthorectification

The point cloud generated in the geocentric coordinate system { e } , or ECEF, is transformed into a desired projected CRS, here UTM 33N. The projected point cloud is used to find the extent of the transect and to generate a shapefile describing the footprint, which in turn is used to generate a regular grid with a resolution of 1   m with the CRS coordinates x and y aligned with east and north. By determining the nearest neighbor of each grid point and each point in the point cloud, we get a resampling map. This allows for resampling of the recorded datacube into the orthorectified datacube, which spatially corresponds to a grid. The datacube is masked by the footprint and invalid pixels are given a “no-data” value. The metadata of each non-georeferenced datacube are supplemented with additional data related to the coordinate system and saved as a Band Sequential (BSQ) image file. An RGB composite of the datacube is also orthorectified, as it is easier to use for visualization, (Figure 19). The square in Figure 19 represents the area that is of interest for further analysis in Section 8 (see Appendix F).

7.6. Direct Georeferencing Accuracy

The presented payload was designed without a gimbal. An attitude or position error in the state-estimation step has therefore a direct impact on the georeferenced position of each spectrum. Georeferencing errors can mainly be attributed to the following factors:
Δ p ^ em e = Δ p ^ eb e + h · tan Δ Θ
where Δ Θ = Δ ϕ , Δ θ , Δ ψ is the attitude error. As (78) shows, the georeferencing accuracy becomes highly sensitive to attitude errors with increased altitude.
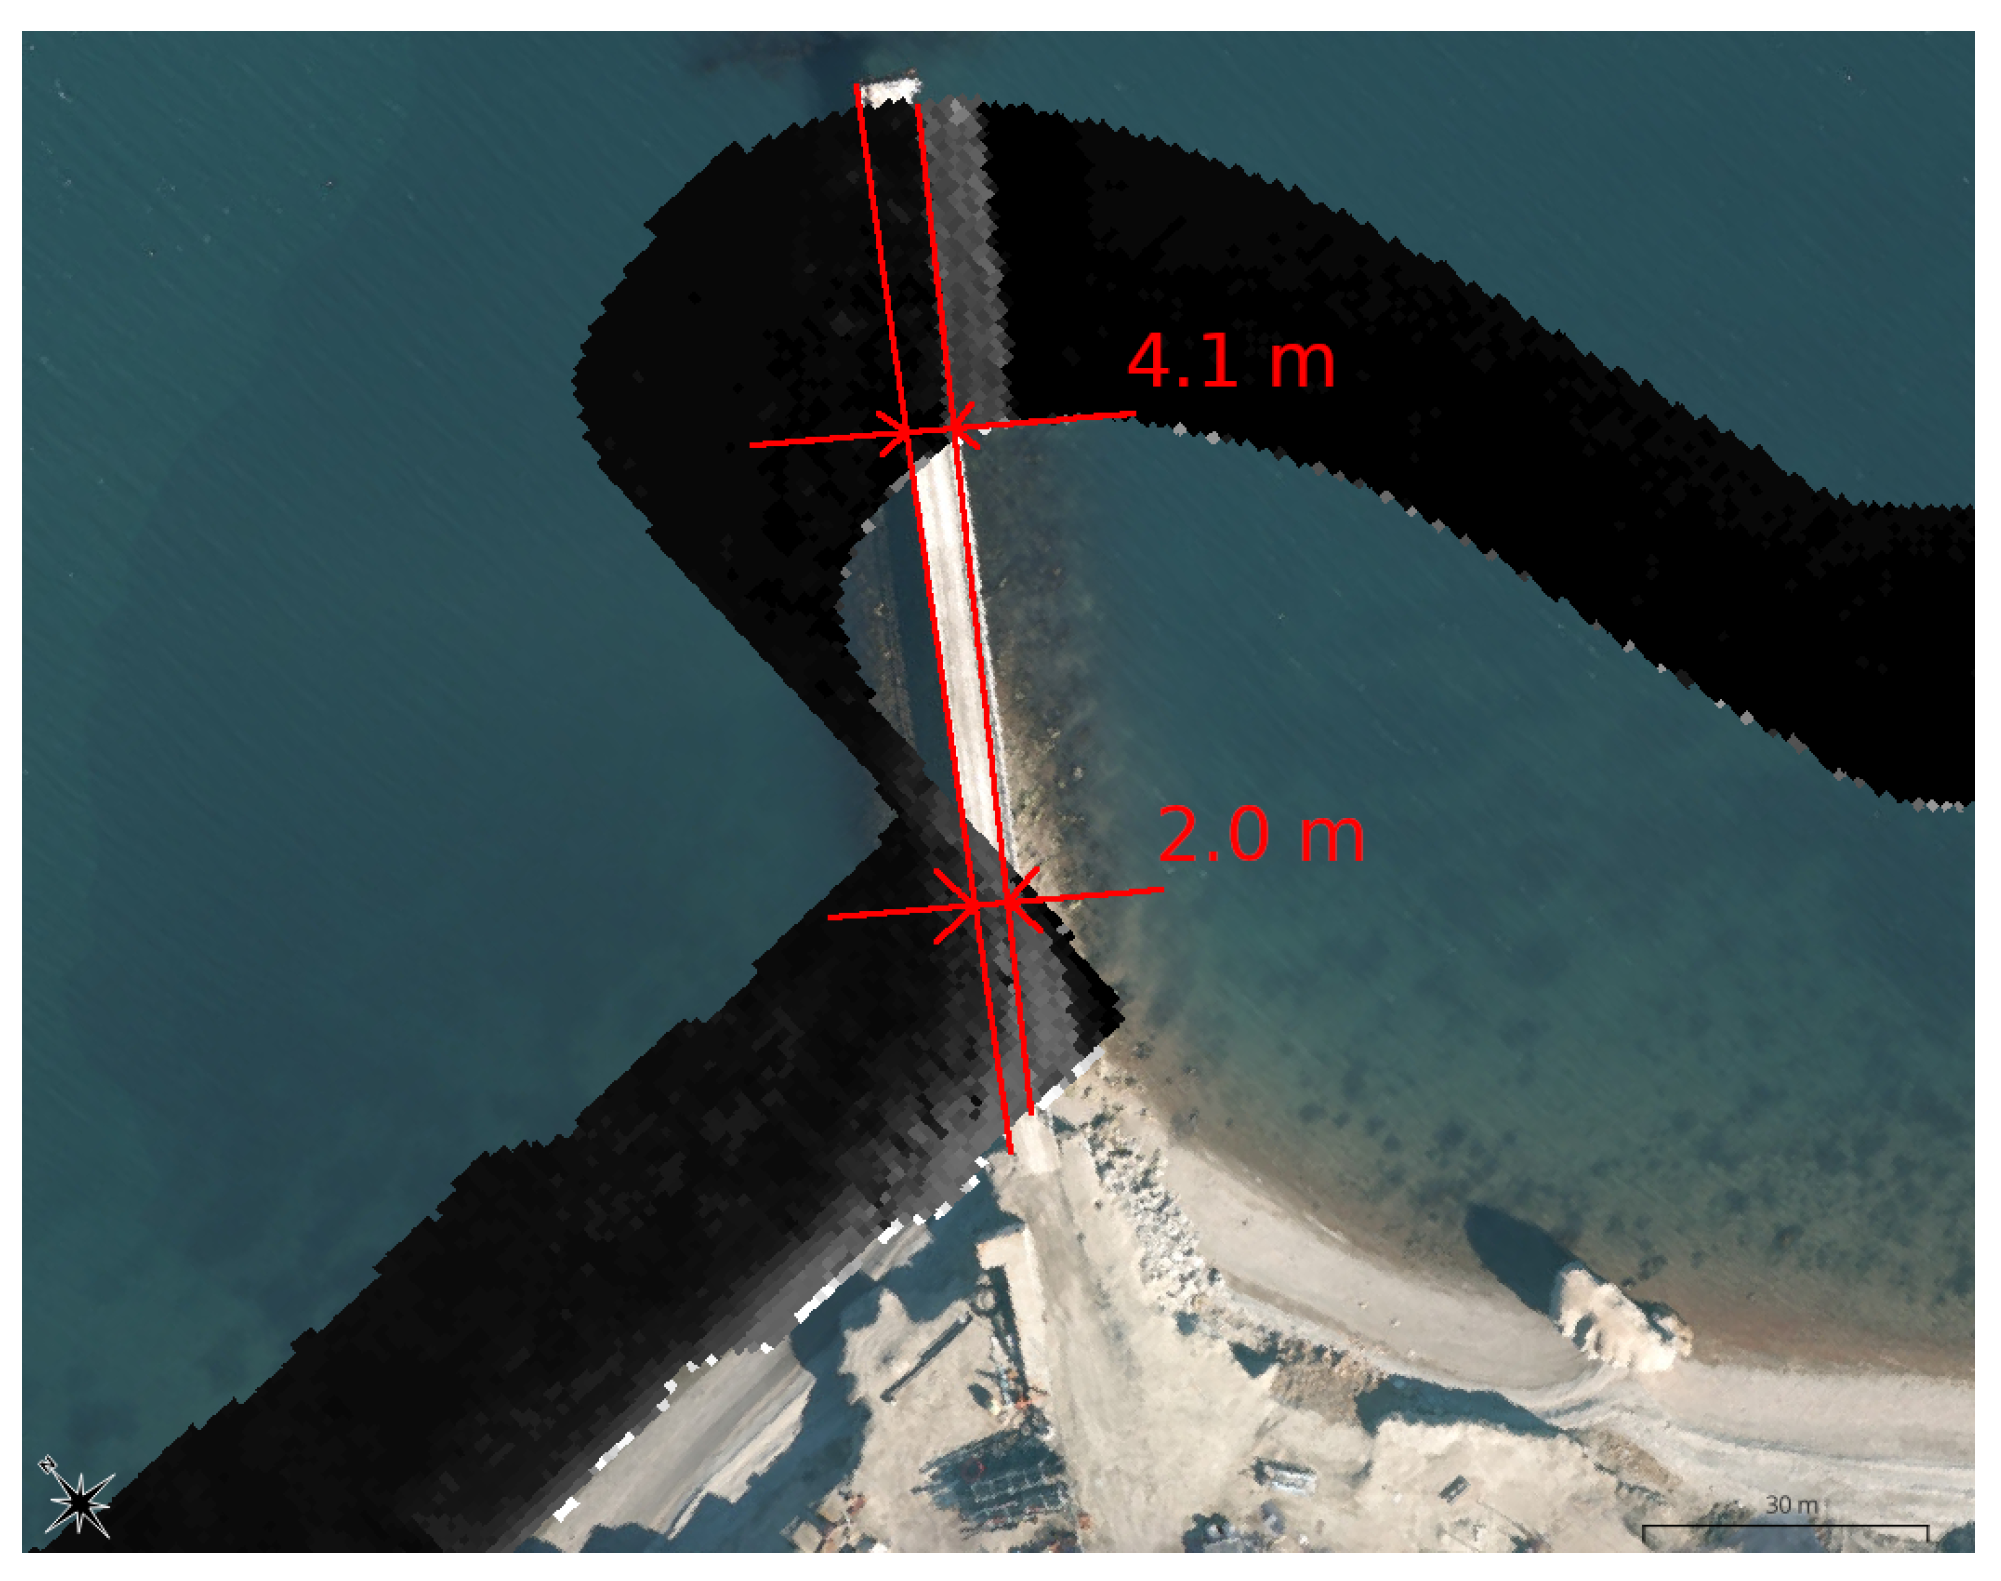
We rely on landmarks to determine the accuracy of the imaging spectrometer georeferencing approach discussed in this paper. Figure 20 shows the Ny-Ålesund pier (visible in the lower half of Figure 19). The distance between the base map and the directly georeferenced image gives an accuracy between 2.0   m and 4.1   m for this part of the flight. Over Ny-Ålesund (and the pier in Figure 20 the UAV flew at an altitude of h = 200   m . According to (78), for this flight altitude, the 1° attitude error corresponds to a 3.5   m georeferencing error.
When looking at Figure 21a, it is evident that the accuracy is not always as good as Figure 20 would suggest. The UAV was flying at an altitude of 300 m over the area shown in Figure 21a. As (78) shows, at higher altitudes h, attitude errors Δ Θ translate to higher georeferencing errors. At an altitude of 300 m , an attitude error of 1° already causes a georeferencing error of 5.24   m . The decrease in accuracy in Figure 21a compared to Figure 20 can be partly attributed to this, and partly to the highly dynamic maneuvering of the UAV flying over the area in Figure 21a,b. The overflight of the island shown in Figure 21a corresponds to the time points 900 s and 2950 s in Figure 18. It is visible in these two plots that the MEKF bias estimated δ b ^ ACC , bias and δ b ^ ARS , bias increased temporarily.
Figure 21b shows the Ny-Ålesund airport area. This image illustrates that the direct georeferencing accuracy degrades during dynamic UAV maneuvers such as the final approach or the climb after takeoff. Suggestions for improving image quality in these flight conditions are discussed in Section 9.2.

8. Ocean Color Estimation

8.1. Sun-Glint Removal

The low sun elevation during the UAV flights in Ny-Ålesund caused patches in the georeferenced ρ RS λ datacubes where considerable sun glint is visible. This is clearly seen in Figure 19 and Figure A5. For further processing, these images were therefore corrected for sun glint. The software hytools [61] with the method from [62] was used to correct the ρ RS λ datacubes for sun glint. An iceberg-free deep water sample in the middle of the fjord was selected for each flight and used to correct the ρ RS λ datacube for one complete flight. The method presented in [62] is particularly suited for data gathered with UAVs or aircraft, since it performs well with high-resolution data and does not require masking of land areas, icebergs, ships, or areas with other high ρ RS λ values. Figure 22 shows the transect with the “deep water/sun glint” sample (red box) used for the sun glint correction for flight 8. Similar samples were chosen for the other analyzed flights. The longest wavelength ( λ = 797   n m ), in the Near Infrared spectrum (NIR), which is assumed to not be heavily influenced by second-order optical effects, was used in this algorithm to correct for sunlight.

8.2. Extraction and Recombination of Imaging Spectroscopy Data

The imaging spectroscopy data gathered inside the sampling area visible in Figure 19 and Figure A5 are of particular interest for data analysis, since this box corresponds to the area defined for robotic missions and ground sampling in the overarching mission in Ny-Ålesund/Svalbard (see Appendix F).
For further analysis, Table A4, of the imaging spectroscopy data, the transects located inside the defined coordinates were merged into one connected datacube. Overlapping areas were avoided by removing transects for areas that were overflown previously in the same flight. The datacubes were clipped at the boundaries of the sampling area. Transects with corrupted or faulty data were removed. The extracted data cubes for flight 1, flight 5, and flight 8 are shown in Figure 23. These ρ RS λ datacubes form the basis for further analysis in this section.

8.3. Exploratory Data Analysis Approaches

A Principal Component Analysis (PCA) was performed on all three datacubes shown in Figure 23. The first Principal Component (PC-1) was used to derive a mask excluding non-water areas. The non-water areas are mainly icebergs/icefloes from the surrounding glaciers, boats, and robotic agents operating in the area. Two exploratory data analysis algorithms were applied to the ρ RS λ datacubes. The spectral angle mapper (SAM) and a nonlinear unmixing method based on Non-negative Matrix Factorization (NMF) were used.

8.3.1. Spectral Angle Mapper

A spectral angle θ SA as defined in:
θ SA = arccos ρ RS λ · ρ RS ref λ ρ RS λ 2 · ρ RS ref λ 2
where ρ RS ref λ is the reference spectrum. The SAM allows for visualizing small spatial variations in the ρ RS λ datacube. The masked datacube, created with PC-1, was further processed with the SAM published in [63] and implemented in [64].
In the first attempt, the mean spectrum ρ RS mean λ of the datacube was used as the reference spectra ρ RS ref λ . The mean spectrum was calculated as shown in (80). The results for this analysis are shown on the left-hand side of Figure 24 for flight 8 and in Figure A7 and Figure A8 for flights 1 and 5. The right-hand side in these figures shows the SAM results with the Chl-A reference spectrum ρ RS ref λ shown in Figure 25.
The Chl-A reference spectrum, ρ RS ref λ , was derived with the Ecolight-S ocean model [49,65] from the weight-specific in vivo absorption spectrum of the main Chl-A pigment, α sol i λ , m 2 m g 1 published in [66]. The simulation results for 5   m g m 3 Chl-A in pure water are shown in Figure 25. In the simulation, a concentration of 5   m g m 3 Chl-A was used for the surface layer up until a depth of 15 m . Infinitely deep water was used as a bottom boundary condition because we are simulating Chl-A in pure water. To simulate the water status of the fjord during the UAV mission, the bottom reflections should be included, as the waters were clear. In addition, other constituents should be modeled, for example, color Dissolved Organic Matter (cDOM), the different phytoplankton species and their scattering properties, and minerals. However, setting up this type of simulation is out of scope for this work. Figure 26 shows the deviation of the spectral angle θ SA from a reference Chl-A spectrum for flight 8, the right-hand side is a zoomed-in area of the θ SA variation. It can be seen that the white patches in the transect in the original image on the left are masked-out areas. When comparing Figure 26 with Figure A6 it becomes clear that these masked-out areas are mainly icebergs. Most of the icebergs in Kongsfjorden originate from glacier calving in that area (see Figure 10).
It is hypothesized that the higher Chl-A concentration, which increases with the density of icebergs, is related to the icebergs themselves. Icebergs originating from glaciers carry minerals and nutrients into the ocean, which could promote algal growth and thus lead to higher Chl-A concentrations. The freshwater inflow from these icebergs could also lead to ocean stratification, resulting in less ocean water mixing and thus a more stable Chl-A layer on the ocean surface, which can be detected by remote sensing applications such as the payload presented in this work ([67,68] (Ch. 4)).
Figure 27 shows the spectra with maximal and minimal Chl-A content (according to SAM), as well as the mean spectra ρ RS λ as calculated using (80) for flight 8.
ρ RS mean λ = 1 c · r i = 1 c j = 1 r X IS i , j

8.3.2. Nonlinear Spectral Unmixing, and Data Reduction

Water that leaves a radiance reaching the imaging spectrometer is typically consists of multiple materials, such as pure water molecules or Chl-A molecules. One cannot expect that there is a pixel with light that has only interacted purely with one material (e.g., Chl-A). Therefore, the assumptions required for a linear spectral unmixing algorithm are not met ([69,70] (10.9.2)). A more complex non-linear spectral unmixing approach, such as NMF, could be chosen. The NMF algorithm used here is thoroughly documented in [71].
NMF divides the flattened hyperspectral datacube X ˜ IS R P × b into two positive semidefinite matrices, a matrix containing the spectral endmembers H R P × e and a matrix containing the abundance of these endmembers W R e × b  (81).
X ˜ IS W · H
Solving this problem requires finding the minima of the non-convex cost function shown in (82).
min X ˜ IS W · H F 2
s . t . W 0 , H 0
The flattened hyperspectral datacube X ˜ IS is a two-dimensional representation of the three-dimensional datacube X IS , where P stands for the number of pixels and b for the number of spectral band. The superscript e stands for the number of extracted endmembers.
NMF can be used to find different spectral categories (endmembers) in the investigated data. A subsample of 10,000   ρ RS λ spectra of the flight 8 data was used to train the NMF algorithm. The resulting NMF transformation was applied to the complete ρ RS λ datacubes of flight 1, flight 5, and flight 8. This approach ensures the comparability of the NMF output between the different flights.
The NMF algorithm was configured to result in e = 4 spectral endmembers. The abundances of these endmembers are shown in Figure 28 for flight 8 and in Figure A9 and Figure A10 for flight 1 and flight 5, respectively.
These endmembers represent the most likely different concentrations of components dispersed or dissolved in the water. The exact chemical composition leading to the obtained spectra must be determined by in situ sampling. However, similar patterns are visible in the SAM results for flight 8. This strengthens the hypothesis that the ocean color variation in these images is heavily influenced by iceberg meltwater.

8.4. Satellite-Based Imaging Spectroscopy

On 28 May 2022, the HYPSO-I satellite was passing over Kongsfjorden and the area surveyed by the UAV. HYPSO-I was equipped with a comparable imaging spectrometer to the UAV payload presented in this paper [72].
For the following analysis, we utilized data from the satellite pass occurring on 28 May 2022 11:25 UTC+0. Spectral and radiometric calibration and atmospheric correction were done using the software hypso-package [73]. The radiometric transfer code 6SV1 [74] was chosen as the atmospheric correction algorithm. Corrupted bands were removed from the datacube and a PCA was used to create a land and cloud mask.
The resulting datacube formed the basis for further analysis, consisting of a SAM with the same settings as the UAV imaging spectrometer and a NMF where all spectra were used in the optimization function. Figure 29 shows the georeferenced RGB composite overlaid over the Svalbard coastline. Figure 30 and Figure 31 represent the SAM results with the endmember shown in Figure 25 and the θ S A variation from the mean spectrum in the datacube, respectively. Figure 32 shows the NMF endmembers. The color coding for these figures represents the maximal and minimal value for the corresponding data product.
When comparing Figure 32c,d with the RGB image in Figure 29 it becomes evident that the patterns which can be seen in these two last NMF plots correlate to the cloud distribution in the RGB image. Further analysis would have to be done to reduce the cloud impact in Figure 30 and Figure 31 further. However, Figure 30 and Figure 31 show that there is significant ocean color variation in the wider area of north Svalbard, the local variations seen in the UAV remote sensing images Figure 24 and Figure 26 are lost in this larger view.
Figure 33 shows the SAM results in the Ny-Ålesund area on the left and the K3 sampling area shown in Figure 19 is shown as a red box. On the right side of Figure 33 the K3 sampling area is zoomed out. When comparing the right-hand side of Figure 33 with Figure 26 it is visible that both images show a similar trend (more Chl-A to the upper right). In Figure 34 the spectrum with maximal Chl-A concentrations from the UAV mission (blue) and the HYPSO satellite (red) are compared. It is visible that the oxygen (O2) absorption band around λ = 759   n m for the satellite spectra goes in the wrong direction. This likely has to do with an inaccurate atmospheric correction in the satellite data.
The peak values of the spectrum and the shape of the spectrum match. At higher wavelengths, however, the two spectra deviate from each other. This can most likely also be attributed to inaccurate atmospheric correction, as well as second-order optical effects above 750 n m . Icebergs and other highly reflective materials that are smaller than a satellite pixel are not removed by the land mask. However, due to their higher reflectivity, these materials have an above-average influence on the measured ρ R S λ . To validate this hypothesis, it would be necessary to create a more refined landmask and employ various subpixel hyperspectral target detection algorithms to find the spectral endmembers resulting in the measured ρ RS λ .

8.5. In Situ Measurements

In situ measurements are a crucial part of remote sensing and imaging spectroscopy missions that should not be underestimated. These measurements provide essential ground truth data needed for validating remote sensing data. They furthermore contribute vital reference points for calibrating remote sensing data parameters.
In situ measurements were conducted during the field campaign described in Appendix F. These measurements were limited to several sampling areas. Among these is the sampling area shown in Figure 19, (Table A4). The in situ Chl-A measurements relevant to this mission are listed in Table 9. Measurements for the dates 22 May 2022 and 26 May 2022 were derived from surface probes using a fluorometer as described in ([75] (Ch. 2.2)) or ([76] (Ch. 2.5)). For 27 May 2022, water samples from various depths were analyzed. These water samples were analyzed using the High-Performance Liquid Chromatography (HPLC) method [77].
Analysing the values in Table 9, it is evident that the ocean during the field campaign was in “pre-bloom” condition (Chl-A concentration < 40   μ g / L ) and that the biological conditions varied over the duration of the mission. From Figure 24, Figure A7 and Figure A8, it is evident that the Chl-A concentration varied not only on a large scale within the fjord but also locally, forming distinct patches even within the sampling area. The ocean color variations observed in the NMF plots—Figure 28, Figure A9 and Figure A10—exhibit similar patchiness.
Closer temporal and spatial alignment of in situ measurement and remote sensing data are essential to map the Chl-A concentration derived from in situ measurements to remote sensing data values. Local variability in the measured in situ Chl-A concentration, such as the low Chl-A concentration on 26 May 2022, could partly be explained by the patchiness of the Chl-A concentration within the sampling area. This underscores the fact that a comprehensive understanding of biological and physical conditions can be achieved neither through remote sensing techniques nor in situ measurements alone. Both approaches are necessary for a truly comprehensive perspective.

9. Summary and Conclusions

A total of eight flights were performed in Ny-Ålesund/Svalbard over Kongsfjorden and all flights are listed in Table 10. The UAV took off and landed at the Ny-Ålesund airport and all flights took place during favorable weather conditions. A UAV control station was set up at the Ny-Alesund airport in the building in the background of Figure 35. More about this mission is explained in Appendix F. The flights that were analyzed for this paper are marked in blue in Table 10.
The payload constructed with COTS components which is presented in this paper functioned successfully during the Ny-Ålesund test campaign. The payload and the processing pipeline produced georeferenced ρ RS λ datacubes with a high data quality, both spatially and spectrally. The direct georeferencing algorithm presented in Section 7 yields good results in steady flight conditions. However, further improvements are desirable to improve image quality during turbulent flight conditions (see Section 9.2). Section 8 shows that the datacube’s spectral data quality allows for retrieving ocean properties for relevant scientific applications, such as Chl-A detection.
When comparing the flights with the in situ measurements in Table 9 it becomes obvious that the conditions in the fjord changed significantly between flight 1 and flight 8. This is reflected in the spectral angle mapper data as well as the NMF data shown in Section 8. The comparison of satellite and UAV data shows promising results. Section 8.4 shows that hyperspectral images from a wider area add valuable information to an imaging spectroscopy mission conducted with a UAV. Information gathered this way helps to put the UAV remote sensing data in a bigger context. However, as mentioned in the last section of Section 8.4, a more thorough investigation of the spectral endmembers would be required. Furthermore, when studying a dynamic environment, such as the biological system in a fjord, better temporal alignment of satellite and UAV data would be desirable.
Furthermore, the results in Section 8.4 show that atmospheric correction of satellite data might be inaccurate, while on the other hand, UAV data apparently provide more correct ρ RS λ spectra (when compared with [30]) as well as an obviously better spatial resolution.

9.1. Conclusions

Based on the results presented in this paper, it is evident that push-broom imaging spectrometers built with COTS components and data processing pipelines as presented in this paper are eligible for scientific use. With further design enhancements and an improved post-processing pipeline, such devices can compete with commercial imaging spectroscopy solutions. To achieve this goal, further enhancements in the imaging spectrometer and payload design are necessary, as well as further improvements in the post-processing pipeline (Section 9.2).
The SAM and NMF approaches presented in Section 8.3.1 and Section 8.3.2 are not able to quantify physical Chl-A units within the water. To derive physical Chl-A units an Ocean Color (OC) algorithm such as that described in [78] is needed. Such an algorithm, however, requires multiple field campaigns with in situ measurements to find the sensor-specific calibration coefficients used in these algorithms.

9.2. Future Work

The field-testing of the presented payload not only proved its capability of generating useful results but also revealed weaknesses in both payload design and post-processing techniques. The payload design would benefit greatly from an industrial, high-resolution monochrome or RGB camera which allows for tighter control of its system parameters. It would furthermore be very beneficial if its images could be timestamped by the SentiBoard. Additional sensors, such as a pressure, temperature, and humidity sensors could furthermore contribute to a more holistic picture of the sensed environment.
The imaging spectrometer design would also benefit from a wider FOV and a better smile and keystone calibration. Direct downwelling irradiance measurements would increase the versatility of the payload by allowing direct remote sensing reflectance calculation and the possibility to adapt to different lighting conditions.
While the georeferencing algorithm results in good direct georeferencing results during long, straight transects, its accuracy decreases rapidly when the UAV flies using dynamic maneuvers. This can become problematic when remote sensing operations are conducted in unfavorable wind conditions. The state-estimation algorithm has been identified as a major reason for this degradation. A state-estimation algorithm that better handles non-linearities and error sources during dynamic maneuvers is expected to yield better results. Smoothing using Factor Graph Optimization (FGO) or similar means would increase the state-estimation accuracy in post-processing, especially in states that are affected by nonlinear flight maneuvers. Further improvements could be made in the georeferencing algorithm with non-rigid pixel registration, which allows for the co-registration of imaging spectrometer spectra and the RGB camera pixels, similar to [79].

Author Contributions

Conceptualization, O.H.; Methodology, H.S.L. and A.E.O.; Software, O.H., H.S.L. and A.E.O.; Formal analysis, O.H.; Data curation, O.H.; Writing—original draft, O.H.; Writing—review & editing, O.H.; Visualization, O.H.; Supervision, T.H.B. and T.A.J. All authors have read and agreed to the published version of the manuscript.

Funding

The Research council of Norway funded the work within this paper through the projects: Arven etter Nansen (grant No. 276730), AMOS (grant No. 223254), HYPSCI (grant No. 325961), and NO Grants 2014–2021, under project ELO-Hyp, contract no. 24/2020.

Data Availability Statement

The original contributions presented in the study are included in the article, further inquiries can be directed to the corresponding author.

Acknowledgments

We thank the following people for their support and their discussions helping to create what made this paper possible: Cameron L. Penne, Stephen D. Grant, Joseph L. Garrett, Sanaa Majaneva, Glaucia Moreira Fragoso, Natalie M. Summers, Sivert Bakken, Kristoffer Gryte, Dennis D. Langer, Marie B. Henriksen, Yongmei Gong and Pål Kvaløy.

Conflicts of Interest

The authors declare no conflicts of interest.

Appendix A

Appendix A.1. Tuning of the IMU Position in the UAV Reference Frame

R tuning = a 11 a 12 a 13 a 21 a 22 a 23 a 31 a 32 a 33
The matrix coefficients are calculated with the tuning values ψ t , θ t and ϕ t as follows:
a 11 = cos ( ψ t ) cos ( θ t ) a 12 = sin ( ψ t ) cos ( ϕ t ) + cos ( ψ t ) sin ( θ t ) sin ( ϕ t ) a 13 = sin ( ψ t ) sin ( ϕ t ) + cos ( ψ t ) cos ( ϕ t ) sin ( θ t ) a 21 = sin ( ψ t ) cos ( θ t ) a 22 = cos ( ψ t ) cos ( ϕ t ) + sin ( ϕ t ) sin ( θ t ) sin ( ψ t ) a 23 = cos ( ψ t ) sin ( ϕ t ) + sin ( θ t ) sin ( ψ t ) cos ( ϕ t ) a 31 = sin ( θ t ) a 32 = cos ( θ t ) sin ( ϕ t ) a 33 = cos ( θ t ) cos ( ϕ t )
Table A1. IMU tuning values.
Roll ψ t [°]Pitch θ t [°]Yaw ϕ t [°]
2.0 2.0 0.0

Appendix A.2. Pixel Length and Pixel Overlap

Derivation of pixel length l pix and pixel overlap O pix  Figure A1.
l pix = l 1 + l 2 + l 3 O pix = l 1 l 4 l 5
Figure A1. Derivation of pixel length and overlap.
Remotesensing 16 03202 g0a1
The distances l 1 l 5 in Figure A1 are derived as follows:
l 1 = 2 · h · tan κ 2 l 2 = e IS · v l 3 = h · tan θ ˙ · T IS + κ 2 tan κ 2 l 4 = v · T IS e IS l 5 = h · tan κ 2 tan κ 2 θ ˙ · T IS e IS
With these, the pixel overlap O pix and the pixel length l pix can be calculated as follows:
l pix = h · tan κ 2 + tan θ ˙ · e IS + κ 2 + v · e IS
O pix = h · tan κ 2 + tan κ 2 θ ˙ · T IS e IS v · T IS e IS
With the relationship T IS = ^ f IS 1 between frame period T IS s and frame rate, f IS s 1 one arrives at (4) and (5). As mentioned in Section 3, this derivation assumes that the terrain is flat relative to the UAV height h above the terrain.

Appendix B

Appendix B.1. RADTRANX Simulation

The approach for atmospheric correction described in Section 2.1 is further elaborated here. The different light contributions measuring up to the total downwelling irradiance E d BOA meas λ are illustrated in Figure A2. The difference between the downwelling irradiance measured by the light observatory E d BOA meas λ and the downwelling irradiance over the ocean E d BOA λ are the surface reflection and backscattering effects illustrated in Figure A2. In Section 2.1 it was found that f = 0.129 in (16) corresponds best to the absorption curves α d λ for the two cases of solar altitude (see Figure 13). This means that during the high sun elevation case, an additional 12.9% of the light can be attributed to indirect illumination effects when compared to the low sun elevation case. However, indirect illumination effects as described in Section 5.3.2 are also present when the sun is at a high elevation. Their contribution to the measured total downward irradiance is, however, lower.
To get an estimate of the absolute contribution of the indirect illumination effects to the measured downwelling irradiance E d BOA meas λ in one specific case, a simulation with RADTRANX [49], in the wavelengths range, λ = 300   nm–1000   n m was conducted. Figure A3 shows the simulation results of RADTRANX for downwelling irradiance E d BOA λ at different times of the day. The simulation results are compared with the measured downwelling irradiance E d BOA λ in Figure A4. Figure A4 shows that the simulation and the measurement for the highest sun elevation case ϵ Sun = 32.126 match well. A coefficient of determination of R 2 = 0.9 was determined for these two curves. The RADTRANX simulation shows, furthermore, that the actual indirect illumination effects during the afternoon (17.31 UTC+1, and ϵ = 19.94 ) might be closer to 15.35%. This value has been ascertained by regressing the measurements to the simulated downwelling irradiance using the L1-regression method. These light simulations are outside the scope of this paper, therefore light simulations were only done for flight 8. To stay consistent, the approach presented in Section 5 with f = 0.129 was used in the atmospheric correction step in this paper. Furthermore, the difference in the reflectance spectra ρ RS λ when using the factor f = 0.1535 vs. f = 0.129 were found to be negligible.
Figure A2. Rayleigh and backscattering effects during various times of the day.
Remotesensing 16 03202 g0a2
Figure A3. RADTRANX simulation results for different times.
Remotesensing 16 03202 g0a3
Figure A4. Comparison of radtran simulation and light observatory measurements.
Remotesensing 16 03202 g0a4

Appendix B.2. Light Absorption

The amount of light that gets absorbed in a certain wavelength, λ , depends on how many and which particles light ray encounters. The Beer–Lambert law (A1) states that the following parameters affect light attenuation:
  • The molar absorption coefficient ϵ λ   m 2 · mol 1
  • The concentration C  mol · m 3 .
    Assuming a well-mixed atmosphere, the concentration C depends only on the local air pressure.
  • The path a light beam traveled h  m
This relationship is mathematically described by the Beer–Lambert law (A1) ([80] (Ch.2.7)), where A is the attenuation of light at wavelength λ . Light attenuation is the reduction of light intensity due to absorption or scattering as it travels through a medium.
A λ , h h = ϵ λ · C h A λ , h = 0 h ϵ λ · C h d h
Assuming a well-mixed atmosphere and taking (A1) into consideration, we validate the derivation of (10) for a simplified atmospheric correction for low-flying drones.

Appendix C

Appendix C.1. Supplements to MEKF

The following equations are supplements to the MEKF equations in Section 6.
F k = 0 3 × 3 I 3 0 3 × 3 0 3 × 3 0 3 × 3 0 3 × 3 2 S ω ie e V ff k V ACC k 0 3 × 3 0 3 × 3 0 3 × 3 A ff k 0 3 × 3 A ARS 0 3 × 3 0 3 × 3 0 3 × 3 T ACC 1 0 3 × 3 0 3 × 3 0 3 × 3 0 3 × 3 0 3 × 3 T ARS 1 R 15 × 15
where V ff k , V ACC k , A ff k and A ARS k are defined as follows ([50] (Ch. 4.7.2)):
V ff k = R ^ b k e q ^ b k e S f ib IMU k b b ACC INS k b V ACC k = R ^ b k e q ^ b k e A ff k = S ω IMU k b b ARS INS k b A ARS = I 3
The time constants T ACC and T ARS are given as follows:
T ACC = I 3 · T ACC T ARS = I 3 · T ARS
The matrix Q d k is given as follows [50] (Ch. 4.7.2):
Q d k Q ˜ k T IMU + T IMU 2 2 F k Q ˜ k + Q ˜ k F k + T IMU 3 6 F k 2 Q ˜ k + 2 F k Q ˜ k F k + Q ˜ k F k 2 + T IMU 4 24 F k 3 Q ˜ k + 3 F k 2 Q ˜ k F k + 3 F k Q ˜ k F k 2 + Q ˜ k F k 3
where
Q ˜ k = G k Q G k G k = 0 3 × 3 0 3 × 3 0 3 × 3 0 3 × 3 R b k e q b e 0 3 × 3 0 3 × 3 0 3 × 3 0 3 × 3 I 3 0 3 × 3 0 3 × 3 0 3 × 3 0 3 × 3 I 3 0 3 × 3 0 3 × 3 0 3 × 3 0 3 × 3 I 3 R 15 × 12 Q = blkdiag q ACC I 3 , q ARS I 3 , q ACC bias I 3 , q ARS bias I 3 ,

Appendix C.2. Barometer Calibration

Calculation of the barometer calibration values h cal and k sc are done as follows:
h cal = h wgs-84 h geo 0 h b 0
k sc = h max h b 0 h max b h b 0
h b 0 is the measured altitude of the uncalibrated barometer at the take-off position. The maximum altitude h max and the maximum altitude with the uncalibrated barometer measurements h max b are defined as follows:
h max = max p eb e p es e 2
h max b = max h b meas
where h b meas is the uncorrected altitude measurement of the barometer. With the calibration factors listed in Table A2, the altitude measurement with barometer h b is done as:
h b = h b meas + h geo + h cal h b 0 · k sc + h b 0
Table A2. Calibration values for the UAV barometer.
h cal
[ m ]
Scaling k sc
[ ]
Flight 1 38.5 0.9533
Flight 5 39.4 0.9455
Flight 8 39.5 0.9455

Calculation of Earth Eccentricity

The eccentricity of the earth WGS-84 ellipsoid is given by
e = 1 b 2 a 2
with the ellipsoid half axis of earth [50]:
a = 6,378,137   m b = 6,356,752.314   m .

Appendix D

The rotation matrix from the imaging spectrometer frame {s} to the UAV body frame {b} is defined as follows:
R s b = a 11 a 12 a 13 a 21 a 22 a 23 a 31 a 32 a 33
with the matrix entries:
a 11 = cos ( π + δ z 2 ) cos ( δ y ) a 12 = sin ( π + δ z 2 ) cos ( δ x ) + cos π + δ z 2 sin ( δ y ) sin ( δ x ) a 13 = sin ( π + δ z 2 ) sin ( δ x ) + cos π + δ z 2 cos ( δ x ) sin ( δ y ) a 21 = sin ( π + δ z 2 ) cos ( δ y ) a 22 = cos ( π + δ z 2 ) cos ( δ x ) + sin ( δ x ) sin ( δ y ) s ( π · δ z 2 ) a 23 = cos π + δ z 2 sin ( δ x ) + sin ( δ y ) sin π + δ z 2 cos ( δ x ) a 31 = sin ( δ y ) a 32 = cos ( δ y ) sin ( δ x ) a 33 = cos ( δ y ) cos ( δ x )
The values δ x , δ y , and δ z are tuning values for the imaging spectrometer misalignment. These values were determined by comparing the geolocation of landmarks in the georeferenced RGB image with their actual geographical location. All δ -values are listed in Table A3.
Table A3. Tuning values for R b s .
Value rad
δ x 0.0741879177
δ y −0.0741879177
δ z 0
Figure A5. RGB composite of flight 1, georeferenced imaging spectrometer data, overlay over Svalbard topographical map (this map is rotated 40 ).
Remotesensing 16 03202 g0a5

Appendix E

Figure A6 shows the amount of icebergs in the sampling area during flight 8. Figure A7 and Figure A8 show the SAM result for flights 1 and 5.
Figure A6. RGB image of Kongsfjorden/Svalbard during flight 8 giving an impression of the amount of icebergs in the fjord due to glacier calving.
Remotesensing 16 03202 g0a6
Figure A7. θ SA flight 1.
Remotesensing 16 03202 g0a7
Figure A8. θ SA flight 5.
Remotesensing 16 03202 g0a8
Figure A9. NMF, flight 1.
Remotesensing 16 03202 g0a9
Figure A10. NMF, flight 5.
Remotesensing 16 03202 g0a10

Appendix F

Appendix F.1. The Overarching Mission—Observation Pyramid
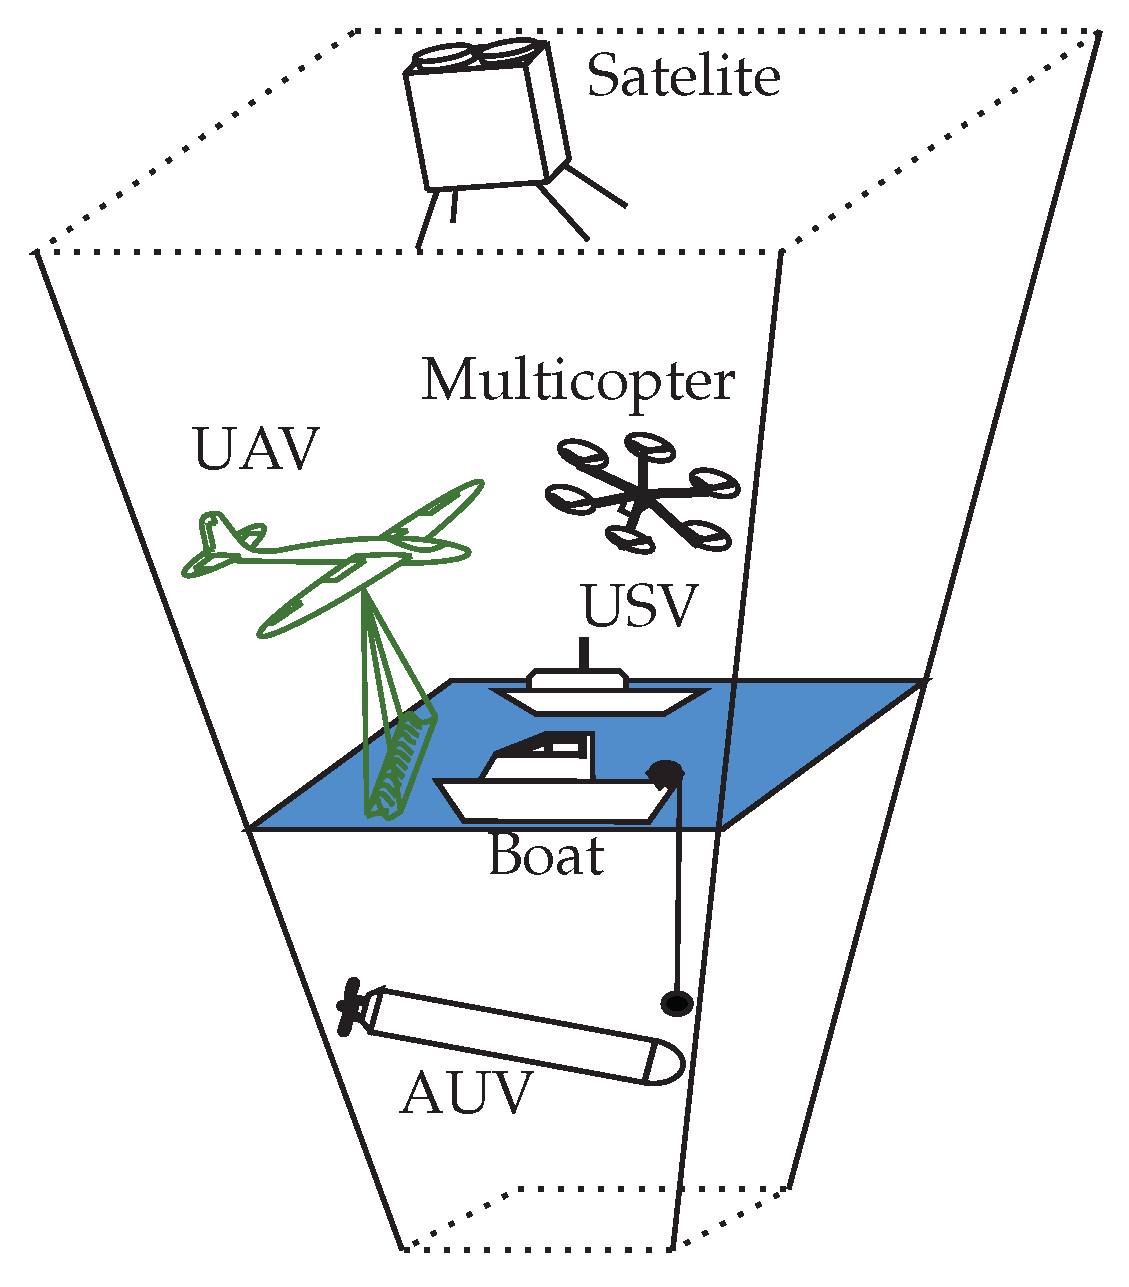
The mission outlined in this paper was part of a broader initiative that took place in Ny-Ålesund/Svalbard in May 2022. This overarching mission sought to implement and test the concept of the “observational pyramid”. Figure A11 shows this schematically. In addition to the UAV with remote sensing equipment described in this paper, several other robotic agents were deployed. Among them were several unmanned surface vehicles (USVs), autonomous underwater vehicles (AUVs), as well as satellite remote sensing [72]. On top of that, crewed boats were used to take in situ measurements, complementing the robotic measurements and providing ground truth to validate the measurements taken by the robotic agents.
Figure A11. Observational pyramid.
Remotesensing 16 03202 g0a11
Table A4. The coordinates for the sampling box defined for observational pyramid.
EPGS:4326 WGS-84EPGS:32633WGS-84/UTM Zone 33N
Longitude μ Latitude λ Northing [m] Easting [m]
178°57′41.888″11°57′34.84″9,261,245.4422,877,896.203
278°56′10.691″11°57′34.84″9,255,900.0232,875,579.055
378°56′56.264″12°1′32.665″9,252,422.4982,890,882.088
478°56′56.264″11°53′37.015″9,264,696.8132,862,566.410

References

  1. Khan, M.J.; Khan, H.S.; Yousaf, A.; Khurshid, K.; Abbas, A. Modern Trends in Hyperspectral Image Analysis: A Review. IEEE Access 2018, 6, 14118–14129. [Google Scholar] [CrossRef]
  2. Xiang, T.Z.; Xia, G.S.; Zhang, L. Mini-Unmanned Aerial Vehicle-Based Remote Sensing: Techniques, applications, and prospects. IEEE Geosci. Remote Sens. Mag. 2019, 7, 29–63. [Google Scholar] [CrossRef]
  3. Bhardwaj, A.; Sam, L.; Akanksha; Martín-Torres, F.J.; Kumar, R. UAVs as remote sensing platform in glaciology: Present applications and future prospects. Remote Sens. Environ. 2016, 175, 196–204. [Google Scholar] [CrossRef]
  4. Zolich, A.; Johansen, T.A.; Cisek, K.; Klausen, K. Unmanned aerial system architecture for maritime missions design & hardware description. In Proceedings of the 2015 Workshop on Research, Education and Development of Unmanned Aerial Systems (RED-UAS), Cancun, Mexico, 23–25 November 2015; pp. 342–350. [Google Scholar] [CrossRef]
  5. Whittaker, W. Field Robots for the Next Century. IFAC Proc. Vol. 1992, 25, 41–48. [Google Scholar] [CrossRef]
  6. Sigernes, F.; Syrjäsuo, M.; Storvold, R.; Fortuna, J.; Grøtte, M.E.; Johansen, T.A. Do it yourself hyperspectral imager for handheld to airborne operations. Opt. Express 2018, 26, 6021–6035. [Google Scholar] [CrossRef]
  7. Hasler, O.K.; Winter, A.; Langer, D.D.; Bryne, T.H.; Johansen, T.A. Lightweight UAV Payload for Image Spectroscopy and Atmospheric Irradiance Measurements. In Proceedings of the IGARSS 2023 Conference Proceedings, Pasadena, CA, USA, 16–21 July 2023. [Google Scholar]
  8. Eismann, M.T. Hyperspectral Remote Sensing; SPIE Press: Bellingham, WA, USA, 2012. [Google Scholar] [CrossRef]
  9. Riihiaho, K.A.; Eskelinen, M.A.; Pölönen, I. A Do-It-Yourself Hyperspectral Imager Brought to Practice with Open-Source Python. Sensors 2021, 21, 1072. [Google Scholar] [CrossRef]
  10. Salazar-Vazquez, J.; Mendez-Vazquez, A. A plug-and-play Hyperspectral Imaging Sensor using low-cost equipment. HardwareX 2020, 7, e00087. [Google Scholar] [CrossRef] [PubMed]
  11. Stuart, M.B.; Davies, M.; Hobbs, M.J.; Pering, T.D.; McGonigle, A.J.S.; Willmott, J.R. High-Resolution Hyperspectral Imaging Using Low-Cost Components: Application within Environmental Monitoring Scenarios. Sensors 2022, 22, 4652. [Google Scholar] [CrossRef] [PubMed]
  12. Henriksen, M.B.; Prentice, E.F.; van Hazendonk, C.M.; Sigernes, F.; Johansen, T.A. A do-it-yourself VIS/NIR pushbroom hyperspectral imager with C-mount optics. Opt. Contin. 2022, 1, 427–441. [Google Scholar] [CrossRef]
  13. Fortuna, J.; Johansen, T.A. A Lightweight Payload for Hyperspectral Remote Sensing using Small UAVS. In Proceedings of the 2018 9th Workshop on Hyperspectral Image and Signal Processing: Evolution in Remote Sensing (WHISPERS), Amsterdam, The Netherlands, 23–26 September 2018; pp. 1–5. [Google Scholar] [CrossRef]
  14. Hasler, O.; Løvås, H.; Bryne, T.H.; Johansen, T.A. Direct georeferencing for Hyperspectral Imaging of ocean surface. In Proceedings of the 2023 IEEE Aerospace Conference, Big Sky, MT, USA, 4–11 March 2023; pp. 1–19. [Google Scholar] [CrossRef]
  15. Burkart, A.; Cogliati, S.; Schickling, A. A Novel UAV-Based Ultra-Light Weight Spectrometer for Field Spectroscopy. Sens. J. IEEE 2014, 14, 62–67. [Google Scholar] [CrossRef]
  16. Mao, Y.; Betters, C.H.; Evans, B.; Artlett, C.P.; Leon-Saval, S.G.; Garske, S.; Cairns, I.H.; Cocks, T.; Winter, R.; Dell, T. OpenHSI: A Complete Open-Source Hyperspectral Imaging Solution for Everyone. Remote Sens. 2022, 14, 2244. [Google Scholar] [CrossRef]
  17. Langer, D.D.; Prentice, E.F.; Johansen, T.A.; Sørensen, A.J. Validation of Hyperspectral Camera Operation with an Experimental Aircraft. In Proceedings of the IGARSS 2022—2022 IEEE International Geoscience and Remote Sensing Symposium, Kuala Lumpur, Malaysia, 17–22 July 2022; pp. 7256–7259. [Google Scholar] [CrossRef]
  18. Saari, H.; Aallos, V.V.; Akujärvi, A.; Antila, T.; Holmlund, C.; Kantojärvi, U.; Mäkynen, J.; Ollila, J. Novel Miniaturized Hyperspectral Sensor for UAV and Space Applications. In Proceedings of the SPIE Remote Sensing, Berlin, Germany, 31 August–3 September 2009; Volume 7474. [Google Scholar] [CrossRef]
  19. Specim. Specim AFX Series. 2022. Available online: https://www.specim.fi/afx/ (accessed on 14 August 2024).
  20. HySpex, N.E.O. HySpex, Norsk Elektro Optikk, Hyperspectral Cameras. 2022. Available online: https://www.hyspex.com/hyspex-turnkey-solutions/uav/ (accessed on 14 August 2024).
  21. Solutions, R.H.I.; Pika, L. 2022. Available online: https://resonon.com/Pika-L (accessed on 14 August 2024).
  22. Lynch, K.; Hill, S. Miniaturized Hyperspectral Sensor for UAV Applications; Headwall Photonics, Inc.: Bolton, MA, USA, 2014. [Google Scholar]
  23. Kim, J.I.; Chi, J.; Masjedi, A.; Flatt, J.E.; Crawford, M.; Habib, A.F.; Lee, J.; Kim, H.C. High-resolution hyperspectral imagery from pushbroom scanners on unmanned aerial systems. Geosci. Data J. 2022, 9, 221–234. [Google Scholar] [CrossRef]
  24. Ravi, R.; Hasheminasab, S.M.; Zhou, T.; Masjedi, A.; Quijano, K.; Flatt, J.E.; Crawford, M.; Habib, A. UAV-based multi-sensor multi-platform integration for high throughput phenotyping. In Proceedings of the Autonomous Air and Ground Sensing Systems for Agricultural Optimization and Phenotyping IV; Thomasson, J.A., McKee, M., Moorhead, R.J., Eds.; International Society for Optics and Photonics, SPIE: Bellingham, WA, USA, 2019; Volume 11008, p. 110080E. [Google Scholar] [CrossRef]
  25. Habib, A.; Zhou, T.; Masjedi, A.; Zhang, Z.; Evan Flatt, J.; Crawford, M. Boresight Calibration of GNSS/INS-Assisted Push-Broom Hyperspectral Scanners on UAV Platforms. IEEE J. Sel. Top. Appl. Earth Obs. Remote Sens. 2018, 11, 1734–1749. [Google Scholar] [CrossRef]
  26. LaForest, L.; Hasheminasab, S.M.; Zhou, T.; Flatt, J.E.; Habib, A. New Strategies for Time Delay Estimation during System Calibration for UAV-Based GNSS/INS-Assisted Imaging Systems. Remote Sens. 2019, 11, 1811. [Google Scholar] [CrossRef]
  27. Garrett, J.L.; Bakken, S.; Prentice, E.F.; Langer, D.; Leira, F.S.; Honoré-Livermore, E.; Birkeland, R.; Grøtte, M.E.; Johansen, T.A.; Orlandić, M. Hyperspectral Image Processing Pipelines on Multiple Platforms for Coordinated Oceanographic Observation. In Proceedings of the 2021 11th Workshop on Hyperspectral Imaging and Signal Processing: Evolution in Remote Sensing (WHISPERS), Amsterdam, The Netherlands, 24–26 March 2021; pp. 1–5. [Google Scholar] [CrossRef]
  28. Langer, D.D.; Orlandić, M.; Bakken, S.; Birkeland, R.; Garrett, J.L.; Johansen, T.A.; Sørensen, A.J. Robust and Reconfigurable On-Board Processing for a Hyperspectral Imaging Small Satellite. Remote Sens. 2023, 15, 3756. [Google Scholar] [CrossRef]
  29. Oudijk, A.E.; Hasler, O.; Øveraas, H.; Marty, S.; Williamson, D.R.; Svendsen, T.; Garrett, J.L. Campaign For Hyperspectral Data Validation In North Atlantic Coastal Waters. In Proceedings of the 2022 12th Workshop on Hyperspectral Imaging and Signal Processing: Evolution in Remote Sensing (WHISPERS), Rome, Italy, 13–16 September 2022; pp. 1–5. [Google Scholar] [CrossRef]
  30. Mobley, C.D. The Oceanic Optics Book; International Ocean Colour Coordinating Group: Dartmouth, Canada, 2022. [Google Scholar]
  31. Datasheet: OS08A1 8MP HDR Camera. 2023. Available online: https://www.khadas.com/post/os08a10-8mp-hdr-camera (accessed on 14 August 2024).
  32. Datasheet: Mini-spectrometer Hamamatsu C12880MA. 2022. Available online: https://www.hamamatsu.com/eu/en/product/optical-sensors/spectrometers/mini-spectrometer/C12880MA.html (accessed on 14 August 2024).
  33. Grant, S.; Johnsen, G.; McKee, D.; Zolich, A.; Cohen, J.H. Spectral and RGB analysis of the light climate and its ecological impacts using an all-sky camera system in the Arctic. Appl. Opt. 2023, 62, 5139–5150. [Google Scholar] [CrossRef]
  34. Datasheet: Sensonor STIM300. Available online: https://safran-navigation-timing.b-cdn.net/wp-content/uploads/2022/12/STIM300-Datasheet.pdf (accessed on 14 August 2024).
  35. Datasheet: GNSS Receivers, Neo-M8 and ZED-F9P. Available online: https://www.u-blox.com/en (accessed on 14 August 2024).
  36. Groves, P. Principles of GNSS, Inertial, and Multisensor Integrated Navigation Systems, 2nd ed.; Artech House: Norwood, MA, USA, 2013. [Google Scholar]
  37. Datasheet: Khadas Vim3. 2023. Available online: https://www.khadas.com/vim3 (accessed on 14 August 2024).
  38. LSTS-DUNE: Unified Navigation Environment [Software]. Available online: https://github.com/LSTS/dune.git (accessed on 14 August 2024).
  39. Albrektsen, S.M.; Johansen, T.A. User-Configurable Timing and Navigation for UAVs. Sensors 2018, 18, 2468. [Google Scholar] [CrossRef]
  40. Mini Cruiser. 2023. Available online: https://www.etair-norway.com/ (accessed on 14 August 2024).
  41. RTKLIB Demo5 [Software]. Available online: https://github.com/rtklibexplorer/RTKLIB.git (accessed on 1 May 2024).
  42. LSTS-NEPTUS: Unified Navigation Environment [Software]. Available online: https://www.lsts.pt/index.php/software/54/ (accessed on 14 August 2024).
  43. Open Drone Map [Software]. 2022. Available online: https://github.com/OpenDroneMap/ODM.git (accessed on 14 August 2024).
  44. Henriksen, M.B.; Prentice, E.F.; Johansen, T.A.; Sigernes, F. Pre-Launch Calibration of the HYPSO-1 Cubesat Hyperspectral Imager. In Proceedings of the 2022 IEEE Aerospace Conference (AERO), Big Sky, MT, USA, 5–12 March 2022; pp. 1–9. [Google Scholar] [CrossRef]
  45. Henriksen, M.B. On the Calibration and Optical Performance of a Hyperspectral Imager for Drones and Small Satellites. Ph.D. Thesis, NTNU, Trondheim, Norway, 2023. [Google Scholar]
  46. Polifke, W.; Jan, K. Wärmeübertragung, Grundlagen, Analytische und Numerische Methoden; Pearson: London, UK, 2009. [Google Scholar]
  47. Norsk Klima Service Senter. 2024. Available online: https://seklima.met.no/observations/ (accessed on 14 August 2024).
  48. Wallace, J.; Hobbs, P. Atmospheric Science: An Introductory Survey; International Geophysics Series; Elsevier Academic Press: Amsterdam, The Netherlands, 2006. [Google Scholar]
  49. Gregg, W.W.; Carder, K.L. A simple spectral solar irradiance model for cloudless maritime atmospheres. Limnol. Oceanogr. 1990, 35, 1657–1675. [Google Scholar] [CrossRef]
  50. Farrell, J. Aided Navigation: GPS with High Rate Sensors, 1st ed.; McGraw-Hill, Inc.: New York, NY, USA, 2008. [Google Scholar]
  51. Solà, J. Quaternion kinematics for the error-state Kalman filter. arXiv 2017, arXiv:1711.02508. [Google Scholar]
  52. Markley, F.L. Attitude Error Representations for Kalman Filtering. J. Guid. Control. Dyn. 2003, 26, 311–317. [Google Scholar] [CrossRef]
  53. Interface Description: U-Blox F9 High Precision GNSS Receiver. Available online: https://content.u-blox.com/sites/default/files/documents/u-blox-F9-HPG-1.32_InterfaceDescription_UBX-22008968.pdf (accessed on 14 August 2024).
  54. ESA Navipedia. 2023. Available online: https://gssc.esa.int/navipedia/index.php/Main_Page (accessed on 14 August 2024).
  55. International Earth Rotation and Reference Systems Service. Available online: https://www.iers.org/IERS/EN/Service/Glossary/leapSecond.html?nn=14894 (accessed on 14 August 2024).
  56. Pavlis, N.K.; Holmes, S.A.; Kenyon, S.C.; Factor, J.K. The development and evaluation of the Earth Gravitational Model 2008 (EGM2008). J. Geophys. Res. Solid Earth 2012, 117. [Google Scholar] [CrossRef]
  57. Vermeille, H. Computing geodetic coordinates from geocentric coordinates. J. Geod. 2004, 78, 94–95. [Google Scholar] [CrossRef]
  58. Datasheet: Barometer-MS5611-01BA03-AMSYS. 2017. Available online: https://www.amsys-sensor.com/ (accessed on 14 August 2024).
  59. Georeferencing for Hyperspectral Images. 2024. Available online: https://pypi.org/project/gref4hsi/ (accessed on 14 August 2024).
  60. Løvås, H.S.; Mogstad, A.A.; Sørensen, A.J.; Johnsen, G. A Methodology for Consistent Georegistration in Underwater Hyperspectral Imaging. IEEE J. Ocean. Eng. 2022, 47, 331–349. [Google Scholar] [CrossRef]
  61. Adam Chlus, Zhiwei Ye, P.T. EnSpec/Hytools. 2024. Available online: https://github.com/EnSpec/hytools.git (accessed on 14 August 2024).
  62. Hedley, J.; Harborne, A.; Mumby, P. Technical note: Simple and robust removal of sun glint for mapping shallow-water benthos. Int. J. Remote Sens. 2005, 26, 2107–2112. [Google Scholar] [CrossRef]
  63. Oshigami, S.; Yamaguchi, Y.; Mitsuishi, M.; Momose, A.; Yajima, T. An Advanced Method for Mineral Mapping Applicable to Hyperspectral Images: The Composite MSAM. Remote Sens. Lett. 2015, 6, 499–508. [Google Scholar] [CrossRef]
  64. The Spectral Python (SPy) Package: Version 0.21. 2024. Available online: www.spectralpython.net (accessed on 14 August 2024).
  65. EcoLight-S. 2024. Available online: https://www.sequoiasci.com/product/ecolight-s/ (accessed on 14 August 2024).
  66. Bricaud, A.; Claustre, H.; Ras, J.; Oubelkheir, K. Natural variability of phytoplanktonic absorption in oceanic waters: Influence of the size structure of algal populations. J. Geophys. Res. Ocean. 2004, 109. [Google Scholar] [CrossRef]
  67. Zhang, H.; Bai, X.; Wang, K. Response of the Arctic sea ice–ocean system to meltwater perturbations based on a one-dimensional model study. Ocean. Sci. 2023, 19, 1649–1668. [Google Scholar] [CrossRef]
  68. Berge, D.J.; Johnsen, D.G.; Cohen, D.J.H. Polar Night Marine Ecology; Springer: Cham, Switzerland, 2021. [Google Scholar] [CrossRef]
  69. Pandey, P.C.; Srivastava, P.K.; Balzter, H.; Bhattacharya, B.; Petropoulos, G.P. Hyperspectral Remote Sensing: Theory and Application; Earth Observation Series; Elsevier: Amsterdam, The Netherlands, 2020. [Google Scholar] [CrossRef]
  70. Feng, X.R.; Li, H.C.; Wang, R.; Du, Q.; Jia, X.; Plaza, A. Hyperspectral Unmixing Based on Nonnegative Matrix Factorization: A Comprehensive Review. arXiv 2022, arXiv:2205.09933. [Google Scholar] [CrossRef]
  71. Lupu, D.; Garrett, J.L.; Johansen, T.A.; Orlandic, M.; Necoara, I. Quick unsupervised hyperspectral dimensionality reduction for earth observation: A comparison. arXiv 2024, arXiv:2402.16566. [Google Scholar]
  72. Bakken, S.; Henriksen, M.B.; Birkeland, R.; Langer, D.D.; Oudijk, A.E.; Berg, S.; Johansen, T.A. HYPSO-1 CubeSat: First Images and In-Orbit Characterization. Remote Sens. 2023, 15, 755. [Google Scholar] [CrossRef]
  73. HYPSO Package, 2024. NTNU Smallsat Lab. Available online: https://github.com/NTNU-SmallSat-Lab/hypso-package (accessed on 14 August 2024).
  74. Vermote, E.; Tanre, D.; Deuze, J.; Herman, M.; Morcrette, J.J. Second Simulation of a Satellite Signal in the Solar Spectrum-Vector (6SV). 2006. Available online: https://ltdri.org/6spage.html (accessed on 14 August 2024).
  75. Marquardt, M.; Goraguer, L.; Assmy, P.; Bluhm, B.A.; Aaboe, S.; Down, E.; Patrohay, E.; Edvardsen, B.; Tatarek, A.; Smoła, Z.; et al. Seasonal dynamics of sea-ice protist and meiofauna in the northwestern Barents Sea. Prog. Oceanogr. 2023, 218, 103128. [Google Scholar] [CrossRef]
  76. Fragoso, G.M.; Johnsen, G.; Chauton, M.S.; Cottier, F.; Ellingsen, I. Phytoplankton community succession and dynamics using optical approaches. Cont. Shelf Res. 2021, 213, 104322. [Google Scholar] [CrossRef]
  77. Ornaf, R.M.; Dong, M.W. Key Concepts of HPLC in Pharmaceutical Analysis. In Handbook of Pharmaceutical Analysis by HPLC; Ahuja, S., Dong, M.W., Eds.; Academic Press: Cambridge, MA, USA, 2005; Volume 6, pp. 19–45. [Google Scholar] [CrossRef]
  78. O’Reilly, J.E.; Werdell, P.J. Chlorophyll algorithms for ocean color sensors—OC4, OC5 & OC6. Remote Sens. Environ. 2019, 229, 32–47. [Google Scholar] [CrossRef]
  79. Zhou, Y.; Rangarajan, A.; Gader, P.D. An Integrated Approach to Registration and Fusion of Hyperspectral and Multispectral Images. IEEE Trans. Geosci. Remote Sens. 2020, 58, 3020–3033. [Google Scholar] [CrossRef]
  80. Stamnes, K.; Thomas, E.G.; Stamnes, J.J. Radiative Transfer in the Atmosphere and Ocean; Cambridge University Press: Cambridge, UK, 2017. [Google Scholar]
Figure 1. System architecture for a holistic approach to drone-based imaging spectroscopy.
Remotesensing 16 03202 g001
Figure 2. Illustration (3D rendering) of miniaturized imaging spectroscopy payload.
Remotesensing 16 03202 g002
Figure 3. Hardware components layout of the payload.
Remotesensing 16 03202 g003
Figure 4. Mini Cruiser sensor placement. Here, c.g. stands for the UAV’s center of gravity.
Remotesensing 16 03202 g004
Figure 5. Payload integration into ET-Air/Mini Cruiser. The payload is in the front part (to the right) while the avionics, power, and propulsion control is in the rear part (to the left).
Remotesensing 16 03202 g005
Figure 6. Imaging spectrometer pinhole camera model, with along-track view to the left and cross-track view to the right.
Remotesensing 16 03202 g006
Figure 7. Relationship between velocity, altitude, and frame rate. Note that the figure is not to scale, for illustration purposes.
Remotesensing 16 03202 g007
Figure 8. Data Processing pipeline as implemented for the presented payload. Asterisks in this figure are a placeholder for filenames.
Remotesensing 16 03202 g008
Figure 9. RGB image processing, un-distorting processing step not shown.
Remotesensing 16 03202 g009
Figure 10. Orthophoto reconstructed with the image processing pipeline and ODM overlaid over a satellite image from SvalbardTopo.
Remotesensing 16 03202 g010
Figure 11. Calibration data generation using an Ulbricht sphere.
Remotesensing 16 03202 g011
Figure 12. Solar illumination.
Remotesensing 16 03202 g012
Figure 13. Atmospheric absorption comparison, before and after correction.
Remotesensing 16 03202 g013
Figure 14. Reflectance calculation with light observatory data.
Remotesensing 16 03202 g014
Figure 15. Coordinate systems.
Remotesensing 16 03202 g015
Figure 16. Coordinate systems, details.
Remotesensing 16 03202 g016
Figure 17. State Estimation.
Remotesensing 16 03202 g017
Figure 18. Accelerometer and gyroscope bias estimates for flight 8. The time axis unit is [ s ].
Remotesensing 16 03202 g018
Figure 19. Flight 8, RGB composite with the RGB wavelengths λ R = 586.25   n m , λ G = 527.82   n m , λ B = 456.46   n m overlaying over Svalbard topographical map (this map is rotated 40 ).
Remotesensing 16 03202 g019
Figure 20. Ny-Ålesund pier.
Remotesensing 16 03202 g020
Figure 21. Detail views of flight 8.
Remotesensing 16 03202 g021
Figure 22. Transect no. 50 (flight 8) with a “deep water, sun glint sample”.
Remotesensing 16 03202 g022
Figure 23. RGB composite showing extraction and recombination of relevant imaging spectroscopy data based on georeferenced data (overlaid over Svalbard satellite image, coordinate frame rotated −48°).
Remotesensing 16 03202 g023
Figure 24. SAM results: flight 8.
Remotesensing 16 03202 g024
Figure 25. Ecolight-S simulation resulting in the ρ RS λ for 5   m g m 3 Chl-A dissolved in pure water (no other contaminants).
Remotesensing 16 03202 g025
Figure 26. SAM results: flight 8 detail view.
Remotesensing 16 03202 g026
Figure 27. Spectra of flight 8 with maximal and minimal Chl-A content, as well as the mean ocean spectrum (see (80)).
Remotesensing 16 03202 g027
Figure 28. NMF, flight 8.
Remotesensing 16 03202 g028
Figure 29. Georeferenced HYPSO-I image overlaid over the Svalbard coastline, satellite pass: 28 May 2022 11:25 UTC+0, RGB colors λ R = 616   n m , λ G = 554   n m , λ B = 459   n m (credit: Cameron Louis Penne).
Remotesensing 16 03202 g029
Figure 30. SAM result: Chl-A distribution in the Ny-Ålesund area 28 May 2022 11:25 UTC+0.
Remotesensing 16 03202 g030
Figure 31. SAM result: θ S A variation in the Ny-Ålesund area 28 May 2022 11:25 UTC+0.
Remotesensing 16 03202 g031
Figure 32. NMF endmembers for the satellite pass 28 May 2022 11:25 UTC+0.
Remotesensing 16 03202 g032
Figure 33. Zoom out of the K3 sampling area (red box) of the HYPSO satellite image SAM data product. Satellite pass 28 May 2022 11:25 UTC+0.
Remotesensing 16 03202 g033
Figure 34. Comparison of the spectra with maximal Chl-A content according to SAM in the K3 sampling area.
Remotesensing 16 03202 g034
Figure 35. UAV ready to be launched at the Ny-Ålesund airport in front of the Ny-Ålesund airport (credit: Pål Kvåløy).
Remotesensing 16 03202 g035
Table 1. Spectral ranges and resolutions.
SensorUsed Spectral
Range [ n m ]
Spectral Resolution
(FWHM) [ n m ]
HSI-v4400.0–800.03.6
Hamamatsu C12880MA310.0–879.012.0
Light Observ. [33]378.9–943.73.29
Table 2. Optical properties.
UnitImg. Spec.
HSI-v4
RGB
Camera
Focal length f m m 163.47
Sensor pixel height sh p i x h 19363840
Sensor pixel width sw p i x w 12162160
Across track fov ζ ° 10.61160
Along track fov κ ° 0.18160
Slit dimensions S l × S w m m × μ m 3 × 50
Table 3. HSI and RGB settings for flights 1, 5, and 8.
HSIRGB
Exposure
Time e [ms]
fps
[s−1]
HSI Startup
Delay [s]
fps
[s−1]
Flight 125.018.2715.931.0
Flight 525.040.00.01.0
Flight 825.040.06.381.0
Table 4. Coefficients for spectral calibration.
Spectral
Coefficients
a 2
[ n m / b 2 ]
a 1
[ n m / b ]
a 0
[ n m ]
1.8147 · 10 5 1.8935 · 10 1 2.9097 · 10 2
Table 5. The sun’s angles ϵ Sun , ψ Sun and ground pressures p 0 .
Date/Time
DD:MM:YY hh:mm
Sun Elev.
ϵ Sun [°]
Sun Azim.
ψ Sun [°]
Pressure at Sea Level
p 0 [Pa]
22:05:22 12:0031.22193.98 1013.0 × 10 5
22:05:22 13:1129.87213.24 1013.1 × 10 5
26:05:22 10:1931.214166.270 1009.3 × 10 5
26:05:22 12:0032.125193.899 1009.4 × 10 5
27:05:22 12:0032.126193.899 1016.9 × 10 5
27:05:22 17:3019.94279.52 1019.9 × 10 5
Table 6. Constants used for atmospheric correction.
DescriptionSymbolValueUnit
Sun surf. Temp T Sun 5778 [ K ]
Light speed in vacuumc 2.99792458 · 10 8 [ m / s ]
Planks constanth 6.62606957 · 10 34 [ J s ]
Boltzmann constant k B 1.3806488 · 10 23 [ J / K ]
Sun diameter R Sun 6.957 · 10 8 [ m ]
Distance Sun Earth D Sun Earth 149.5978707 · 10 9 [ m ]
Table 7. Measurement uncertainties.
PPK-GNSS Barometer
σ μ [ m ]0.2
σ λ [ m ]0.2
σ h [ m ]0.91
Table 8. Process noise.
VariableUnitValue
q ACC [ m 2/ s ] 8.6044 · 10 6
q ARS [ rad 2/ s ] 6.8539 · 10 6
q ACC , bias [ m 2/ s 5] 2.1443 · 10 9
q ARS , bias [ rad 2/ s 3] 4.0500 · 10 9
Table 9. In situ measurements (credit: Glaucia Moreira Fragoso, Sanna Kristiina Majaneva, Janina Osanen, Nathalie Summers).
Date/Time
[dd Month yyyy HH:mm]
Chl-A Concentration
[μg/L]
Depth
[ m ]
Repetition
[-]
22 May 20221.525690.01
22 May 20221.917270.02
22 May 20221.819590.03
26 May 20220.096810.01
26 May 20220.111510.02
26 May 20220.088170.03
27 May 2022 18:450.579060.01
27 May 2022 18:450.603440.02
27 May 2022 18:450.694897.01
27 May 2022 18:450.700437.02
27 May 2022 18:450.490507.03
Table 10. List of all UAV flights (local time: UTC+1). The marked flight numbers are the ones relevant in this papers data analysis Section 8.
Flight
No.:
Date
[dd month yyyy]
Take-Off
Time [Local]
[HH:mm]
Flight
Duration
[min. ]
Altitude
(Harbour)
[m.a.s.l]
122 May 202213:1132.31300 (200)
223.05.202209:4461.06300 (150)
324 May 202218:0252.08300 (200)
424 May 202219:1932.40300 (200)
526 May 202210:1948.37300 (200)
626 May 202217:2258.96300 (200)
727 May 202210:5155.95300 (200)
827 May 202217:3159.71300 (200)
Disclaimer/Publisher’s Note: The statements, opinions and data contained in all publications are solely those of the individual author(s) and contributor(s) and not of MDPI and/or the editor(s). MDPI and/or the editor(s) disclaim responsibility for any injury to people or property resulting from any ideas, methods, instructions or products referred to in the content.