Article

A Cross-Modal Semantic Alignment and Feature Fusion Method for Bionic Drone and Bird Recognition

by
Hehao Liu
1,
Dong Li
1,*,
Ming Zhang
2,
Jun Wan
1,
Shuang Liu
1,
Hanying Zhu
1 and
Qinghua Liu
3
1
School of Microelectronics and Communication Engineering, Chongqing University, Chongqing 400044, China
2
South-West Institute of Electronics and Telecommunication Technology, Chengdu 610041, China
3
Guangxi Key Laboratory of Wireless Wideband Communication and Signal Processing, Guilin 541004, China
*
Author to whom correspondence should be addressed.
Remote Sens. 2024, 16(17), 3121; https://doi.org/10.3390/rs16173121
Submission received: 2 July 2024 / Revised: 18 August 2024 / Accepted: 21 August 2024 / Published: 23 August 2024

Abstract

:
With the continuous progress in drone and materials technology, numerous bionic drones have been developed and employed in various fields. These bionic drones are designed to mimic the shape of birds, seamlessly blending into the natural environment and reducing the likelihood of detection. However, such a high degree of similarity also poses significant challenges in accurately distinguishing between real birds and bionic drones. Existing methods attempt to recognize both using optical images, but the visual similarity often results in poor recognition accuracy. To alleviate this problem, in this paper, we propose a cross-modal semantic alignment and feature fusion (CSAFF) network to improve the recognition accuracy of bionic drones. CSAFF aims to introduce motion behavior information as an auxiliary cue to improve discriminability. Specifically, a semantic alignment module (SAM) was designed to explore the consistent semantic information between cross-modal data and provide more semantic cues for the recognition of bionic drones and birds. Then, a feature fusion module (FFM) was developed to fully integrate cross-modal information, which effectively enhances the representability of these features. Extensive experiments were performed on datasets containing bionic drones and birds, and the experimental results consistently show the effectiveness of the proposed CSAFF method in identifying bionic drones and birds.

1. Introduction

Drone warfare, an emerging combat mode, plays a significant role in intelligence gathering, reconnaissance, surveillance, and precision strikes, which are involved in multidimensional combat fields, including the air, land, and sea [1,2]. With the continuous advancements in drone technology and material processes, along with the demands of national defense and strategic security, bionic drones have emerged in large numbers. By simulating the flight and shape characteristics of birds, bionic drones can better merge into the natural environment, significantly reducing the probability of detection, as shown in Figure 1. However, the high similarity between bionic drones and birds also poses significant challenges for accurate identification. Therefore, considering the importance of accurately identifying bionic drones for national defense security, the problem of how to accurately distinguish bionic drones from birds has garnered widespread attention.
In response to the recognition problem of drones and birds, numerous research methods have been proposed, which can be broadly classified into traditional and deep learning-based recognition methods. These methods include acquiring data such as the radar echoes and scattering characteristics of targets and extracting features, thus constructing feature libraries for target recognition. Common methods are mostly based on Radar Cross-Section (RCS) characteristics [3,4,5], polarization characteristics [6,7], and high-resolution range profile (HRRP) features [8,9]. However, as these features are all related to the size of the target, the classification performance is significantly degraded when the sizes of the targets are similar [10]. In recent years, micro-motion characteristics have received widespread attention because they can be used to infer related features, such as the shape, structure, posture, stress state, and motion characteristics of the target [11,12]. This is due to the fact that the wing-flapping actions of bionic drones and birds during flight introduce additional modulation sidebands, and they would appear near the Doppler frequency shift in radar echo signals [13]. For instance, in [14], eigenvalues and eigenvectors are extracted from micro-motion features for the classification of small drones and birds. The amplitude and phase information of micro-Doppler features are extracted and amplified in [15] by using the Fourier Transform (FT), suppressing the noise in their spectrograms, and addressing the issues of existing feature representations. Ref. [16] proposes the use of micro-Doppler features observed by multi-base radar to improve the robustness of single-site radar signal identification. In general, the performance of traditional methods mainly depends on the accuracy of the target feature library, and their recognition process requires a significant amount of manual involvement. Additionally, the features, which are extracted by traditional methods, are mostly shallow features, which cannot fully represent the target characteristics, resulting in poor recognition ability.
With the rapid development of artificial intelligence, deep learning-based image classification methods have been widely used in the recognition tasks of drones and birds, which is due to their powerful feature representation and accurate recognition ability. The main idea is to automatically learn the features in the image by a convolutional neural network (CNN) [17,18,19,20,21,22] and then use these learned features to discriminate the targets. Some methods [23,24,25] directly use a CNN to extract micro-Doppler spectrogram features for drone classification, without the need to introduce any domain-specific background knowledge. Ref. [26] proposes adding an image-embedding layer to extract the spectral kurtosis of Doppler feature images for target classification. Ref. [27] introduces dual-tree complex wavelet transform (DT-CWT) pooling between convolutional layers, which better preserves the key structures of the feature maps. Ref. [28] extracts the multiscale deep semantic features of the images, which effectively distinguishes between the target and background regions, thus achieving effective recognition of the target. Similarly, Ref. [29] proposes a multilevel, multiresolution-aware image recognition strategy that combines multiscale pooling [30] and a feature pyramid network (FPN) [31] to improve the model’s representational capability. Additionally, some methods address the classification problem through mixed sample data augmentation [32] and transfer learning [33], significantly improving the model’s generalization ability. In summary, these methods have solved the issue of the time consumption associated with traditional methods to some extent and have achieved good recognition performance.
Unlike the general drone recognition problem, bionic drones pose a unique challenge due to their high visual similarity to birds. This makes it very difficult to find distinguishable features solely in the image domain, resulting in challenges in achieving high-accuracy and stable recognition. Therefore, it is necessary to utilize other distinguishable features of bionic drones and birds to aid in their recognition. According to the trajectory motion features, Ref. [34] proposes a recognition approach for drone and bird trajectories based on the motion pattern conversion frequency, which verifies the feasibility of target recognition based on these features. Similarly, Ref. [35] proposes a motion feature extraction method based on target trajectories, which extracts feature vectors for target recognition. Overall, the flight trajectories of bionic drones are relatively stable, while those of birds are more variable and agile. Therefore, leveraging the differences in their motion patterns, along with optical natural images, can enhance the discriminative representation for classification, addressing the challenge of distinguishing between bionic drones and birds due to their high visual similarity.
To achieve target recognition by integrating these cross-modal data, several methods have been proposed. Ref. [36] utilizes a dual-channel GoogLeNet to extract features from the time–frequency diagrams and cadence velocity diagrams (CVDs) of the targets, then stack the features, and finally classify the targets by softmax. Ref. [37] introduces the idea of adversarial learning, which reduces the discrepancy between cross-modal data by generating fake features and reconstructing a common representation. Refs. [38,39] use the multi-head attention mechanism in the Transformer [40] to achieve cross-modal data fusion, improving the accuracy of single-modal data recognition. Ref. [41] trains multiple classifiers and fuses information from different modalities at the decision stage. Ref. [42] proposes an association-based fusion approach, which extracts association and high-order information from the feature space and encodes them into a new feature space. The association information is utilized for fusion, enhancing the representational capability of the feature space. In addition, Ref. [43] uses Long Short-Term Memory (LSTM) networks [44] to integrate different modal features from multiple encoders, capturing temporal and contextual information in cross-modal features. Ref. [45] employs multiple residual attention modules for cross-modal feature interaction, achieving the completeness of complementary information. Ref. [46] introduces a gated fusion module, which calculates the weights of each corresponding modal’s features, achieving the weighted fusion of different modal features, while [47] performs a low-rank decomposition of the weight matrix during the feature fusion process to further reduce the number of parameters. Overall, although the above methods provide some ideas for solving the problem of the comprehensive use of cross-modal heterogeneous data, they introduce some problems at the same time due to the lack of comprehensive consideration. Firstly, most methods mainly focus on the complementarity of features between modalities while neglecting the semantic connections between features. Secondly, the introduction of multiple attention mechanisms and the simple stacking of features can lead to feature redundancy, increasing the computational burden.
Considering the above problems, we propose a cross-modal semantic alignment and feature fusion (CSAFF) method for the recognition of bionic drones and birds. Specifically, to solve the difficulties of distinguishing bionic drones from birds in the optical natural image domain, we introduce motion behavior information based on the differences in their motion characteristics. Secondly, to fully exploit the semantic information between the image and motion behavior feature sequence modalities, a semantic alignment module (SAM) is proposed. By optimizing the similarity measure between the image and sequence modalities in the feature space, consistent semantics across the modalities are obtained, providing more semantic clues for the recognition of bionic drones and birds. Finally, a feature fusion module (FFM) is designed to fully integrate cross-modal information, enhancing the representational capability of cross-modal features. By evaluating the effectiveness of features from different channels and modalities and fully integrating these features, the generalization of the model is enhanced. We have conducted extensive experiments on datasets containing bionic drones and birds. The results show that, compared to other methods, the proposed CSAFF method has significant advantages in the intelligent recognition of bionic drones and birds. Additionally, through ablation studies and visualization analysis, we validate the effectiveness of the proposed method and modules.
In summary, this method innovatively uses the characteristics of motion behavior to solve the recognition problem caused by the high visual similarity between bionic drones and birds. Through the designed CSAFF model, data from both modalities are fully utilized, effectively distinguishing between bionic drones and bird targets. Our contributions are described in detail as follows:
(1)
Aiming to address the high visual similarity between bionic drones and birds, a CSAFF-based intelligent recognition approach for bionic drones and birds is proposed, which innovatively introduces motion behavior feature information, thus achieving robust discrimination of such targets.
(2)
The SAM and FFM were developed. By exploring the consistent semantic information between cross-modal data, more semantic clues are provided for robust target recognition. Additionally, through the full fusion of cross-modal features, the representational capability of cross-modal features is enhanced, improving the performance of our model.
(3)
Extensive experiments were conducted on datasets of bionic drones and birds. The experimental results show that, compared to other methods, the proposed CSAFF method achieves the best performance across various metrics. Further experimental analysis demonstrates the effectiveness of each designed module.
The rest of this paper is organized as follows. In Section 2, the proposed CSAFF-based intelligent recognition method for bionic drones and birds is described in detail. The experimental results and model analysis are presented in Section 3. Finally, this paper is summarized in Section 4.

2. Proposed Method

2.1. Overall Architecture

The overall framework of the proposed method is shown in Figure 2. By combining the cross-modal feature information of bionic drones and birds, a CSAFF-based intelligent recognition algorithm for bionic drones and birds is designed. The proposed method utilizes data from both optical natural image and motion behavior feature sequence modalities and exploits the correlation property between multidimensional heterogeneous data to achieve more accurate bionic drone and bird target recognition. Specifically, cross-modal data containing the same labels are fed into the network, and features are initially extracted through two feature extractors. Then, the initially extracted features are fed into the SAM, which further explores the consistent semantics of the cross-modal data by reducing the distance between the two modal features. Next, the cross-modal information is fully fused through the FFM to enhance the representational ability of cross-modal features. Finally, the recognition of bionic drones and birds is achieved through the classifier. A detailed explanation of each module is provided in the following sections, and the complete algorithm flow is shown in Algorithm 1.
Algorithm 1 Cross-modal semantic alignment and feature fusion (CSAFF) algorithm.
Input:
  Image data I x , y , sequence data S p 1 , . . . , p 100 , and corresponding class labels {1 or 0}
Output:
  Class of unlabeled data {bionic drones or birds}
1:
Define the model and initialize it;
2:
Set the number of epochs: N u m _ e p o c h s ;
3:
for   i = 1 to N u m _ e p o c h s  do
4:
   Load and preprocess training data;
5:
   Extract initial features using Resnet2d and Resnet1d to obtain { z i m g i and z s e q i };
6:
   Calculate cosine similarity c o s simi z i m g i , z s e q i according to Equation (14);
7:
   Calculate cosine distance c o s dist z i m g i , z s e q i according to Equation (15);
8:
   Compute the loss L s a m based on the calculated cosine distance c o s dist z i m g i , z s e q i ;
9:
   Process the initial features { z i m g i and z s e q i } with CAModule1 and CAModule2 to obtain the next-level features { y i m g i and y s e q i };
10:
  Obtain the final output Z o u t p u t according to Equation (25);
11:
  Compute the loss { L f u s i o n and L s e q } using the cross-entropy loss function according to Equation (26) and obtain the total loss L t o t a l according to Equation (27);
12:
  Perform backpropagation to update the weights and biases;
13:
  Load and preprocess testing data;
14:
  Use the updated network structure to test the testing data, and determine the class of the data;
15:
  Calculate the results of testing data based on evaluation criteria in Section 3.1.2;
16:
   i = i + 1 ;
17:
end for
18:
Save the optimal weights.

2.2. Representation of Motion Behavior Information

Due to the visual similarity between bionic drones and birds, we leverage the differences in their motion behavior features to achieve accurate recognition. In terms of motion behavior characteristics, there are significant differences in the motion trajectories of bionic drones and birds. The motion trajectories of bionic drones are typically more stable and continuous, exhibiting gentle changes. In contrast, the motion trajectories of birds are more dynamic and unpredictable, with more abrupt and random changes in speed and direction. These motion behavior features, which can provide complementary information for distinguishing between bionic drones and birds, are incorporated to enhance the recognition accuracy of bionic drones. To this end, we constructed a database based on the motion model containing the motion behavior features of bionic drones and birds, described in detail below.
In this paper, the motion process of bionic drones and birds is described from the perspective of a cluster [48]. It is assumed that the position of each individual in the cluster is p i , and the velocity is v i . To ensure cohesion among individuals in the cluster and to prevent collisions between them, the coordination force and exclusion force that each individual receives are defined as follows:
F c i = j = 1 N c v j v i
F e i = j = 1 N e p i p j p i p j 2
where the number of neighboring individuals within the effective range of the coordination force is N c , and the effective radius of the coordination force is r c . Similarly, the number of neighboring individuals within the effective range of the exclusion force is N e , and the effective radius is r e .
Additionally, an origin-directed centripetal force F o i is added to each individual, which is defined as follows, to keep the individual from straying too far from the central region of the cluster:
F o i = p o p i
where p o indicates the location of the center of the cluster.
In order to ensure the boundedness and stability of the system, we introduce a friction parameter F f i , which is related to velocity. The greater the velocity, the greater the friction. It is defined as follows:
F f i = v i v i v m a x v m a x
where v m a x is the velocity threshold, used to limit changes in both velocity and force, and it is set to v m a x = 10 . Since there is resistance throughout the cluster system, if there is a lack of external input, then the system will be at rest after a period of time. Therefore, it is necessary to add a motivation force to the individuals to maintain continuous movement. Here, the effect of birds and their natural enemies is simulated, and the motivation force is defined as follows:
F m i = H r m p i p m p i p m p i p m 2
where the radius of the motivation force is r m , and p m represents the position of the predator. This means that beyond this range, the motivation force will be zero. It is expressed as follows:
H ( g ) = 0 , g < 0 0.5 , g = 0 1 , g > 0
In summary, the resultant forces on each individual in the cluster are as follows:
F i t = K c F c i + K e F e i + K o F o i + K f F f i + K m F m i
where t is the time variable, Equation (7) indicates that the resultant force changes over time, and K · represents the coefficient of the corresponding force acting on the individual. Additionally, the mapping relationship of the resultant force is defined as follows:
F i t μ tanh η   F i t
It indicates the transformation of the component forces in each direction. We set μ = 200 and η = 0.1 .
For birds, the corresponding parameters are set as follows:
K c = 1 , K e = 0.5 , K o = 1 , K f = 1 , K m = 10 , r c = 2 , r e = 1 , r m = 2
The following adjustments are made to the parameters of the bionic drones compared to the birds:
K c = 0.5 , K e = 0.5 , K o = 2 , K f = 2 , K m = 2 , r c = 4 , r e = 2 , r m = 4
Assuming the mass of each individual is constant, and setting the time increment, the parameters are updated as follows:
v i t + Δ t = v i t + F i t Δ t p i t + Δ t = p i t + v i t Δ t
The time increment is set to Δ t = 1 , and 100 consecutive time points are taken. By capturing the continuous motion trajectories of the targets, we can generate the motion behavior feature sequences for bionic drones and birds, denoted by S p 1 , . . . , p 100 , as shown in Figure 3. The x-axis of each image represents 100 consecutive time points, and the y-axis represents the height information of different target individuals at each time point. Although (a) and (b) in Figure 3 correspond to bionic drones, with (c) and (d) belonging to birds, there are still some differences within the same category. Due to the different initial speeds and positions of the individuals, the generated motion behavior feature sequences will be different. For different categories, the greater agility of birds results in more clear variations in their motion behavior feature sequences compared to bionic drones.
In this paper, the original one-dimensional sequence form is used as an additional distinguishable feature to enhance the optical natural images and is directly input into CSAFF.

2.3. Semantic Alignment Module (SAM)

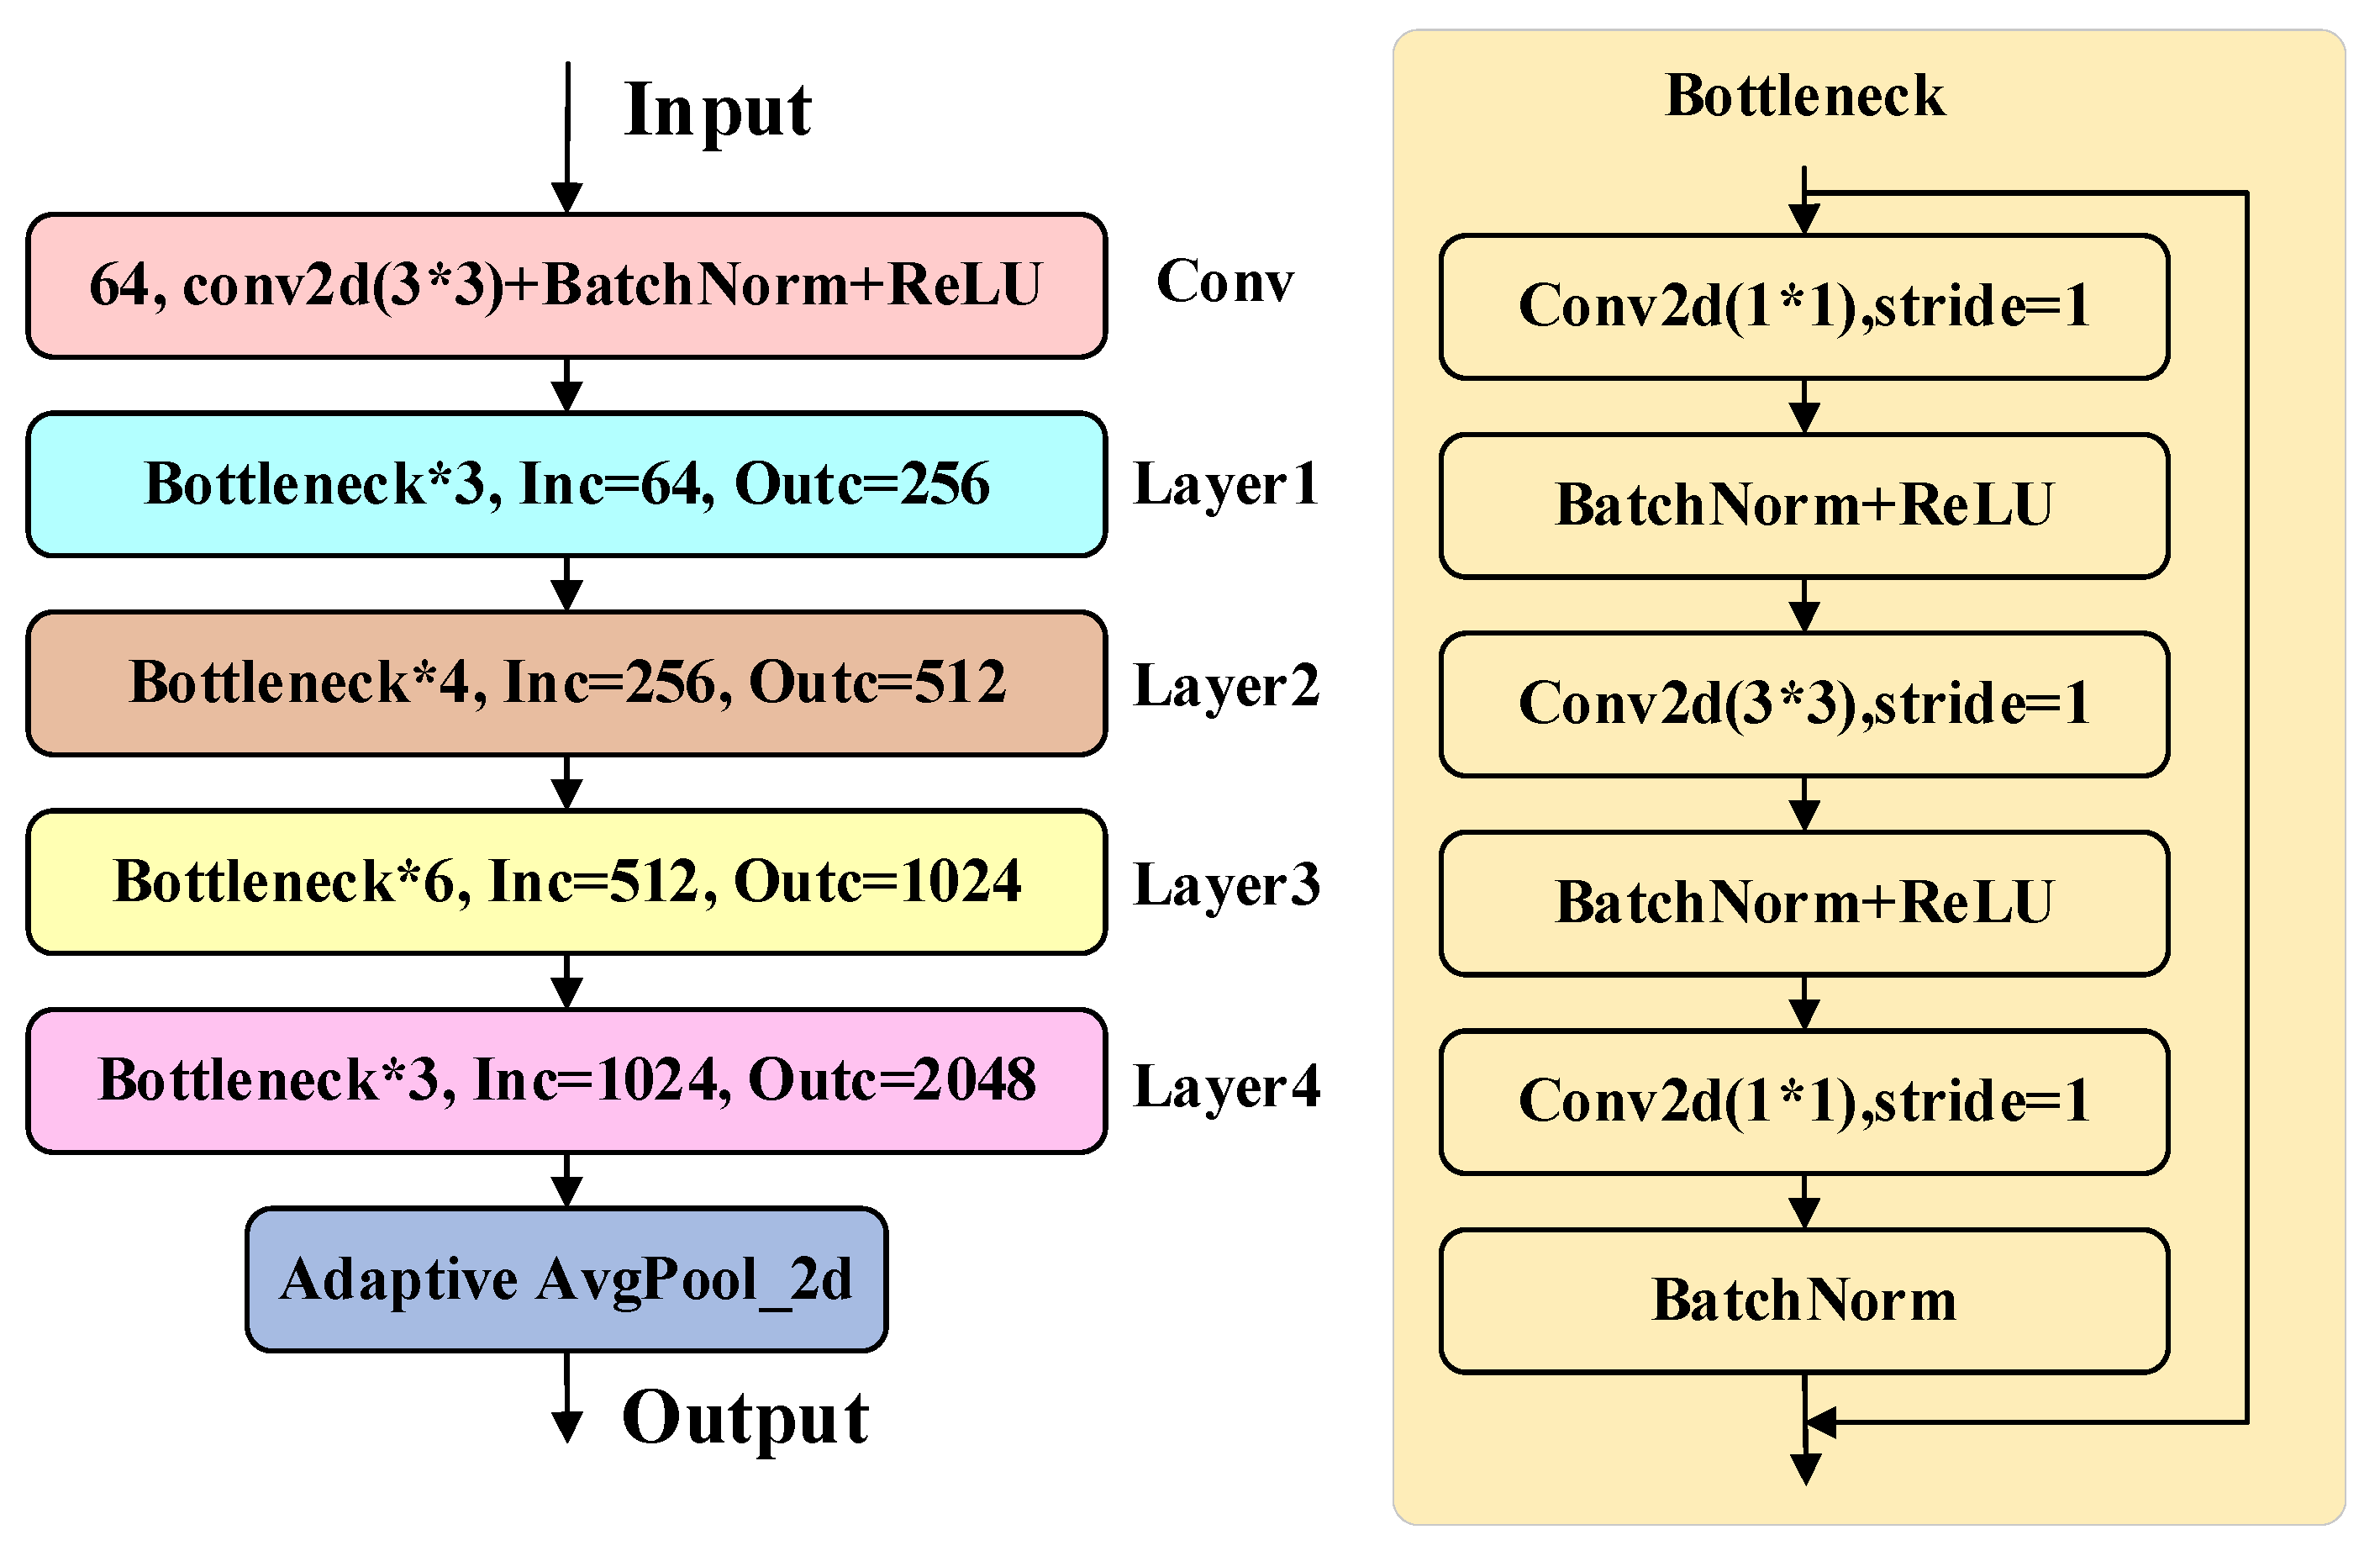
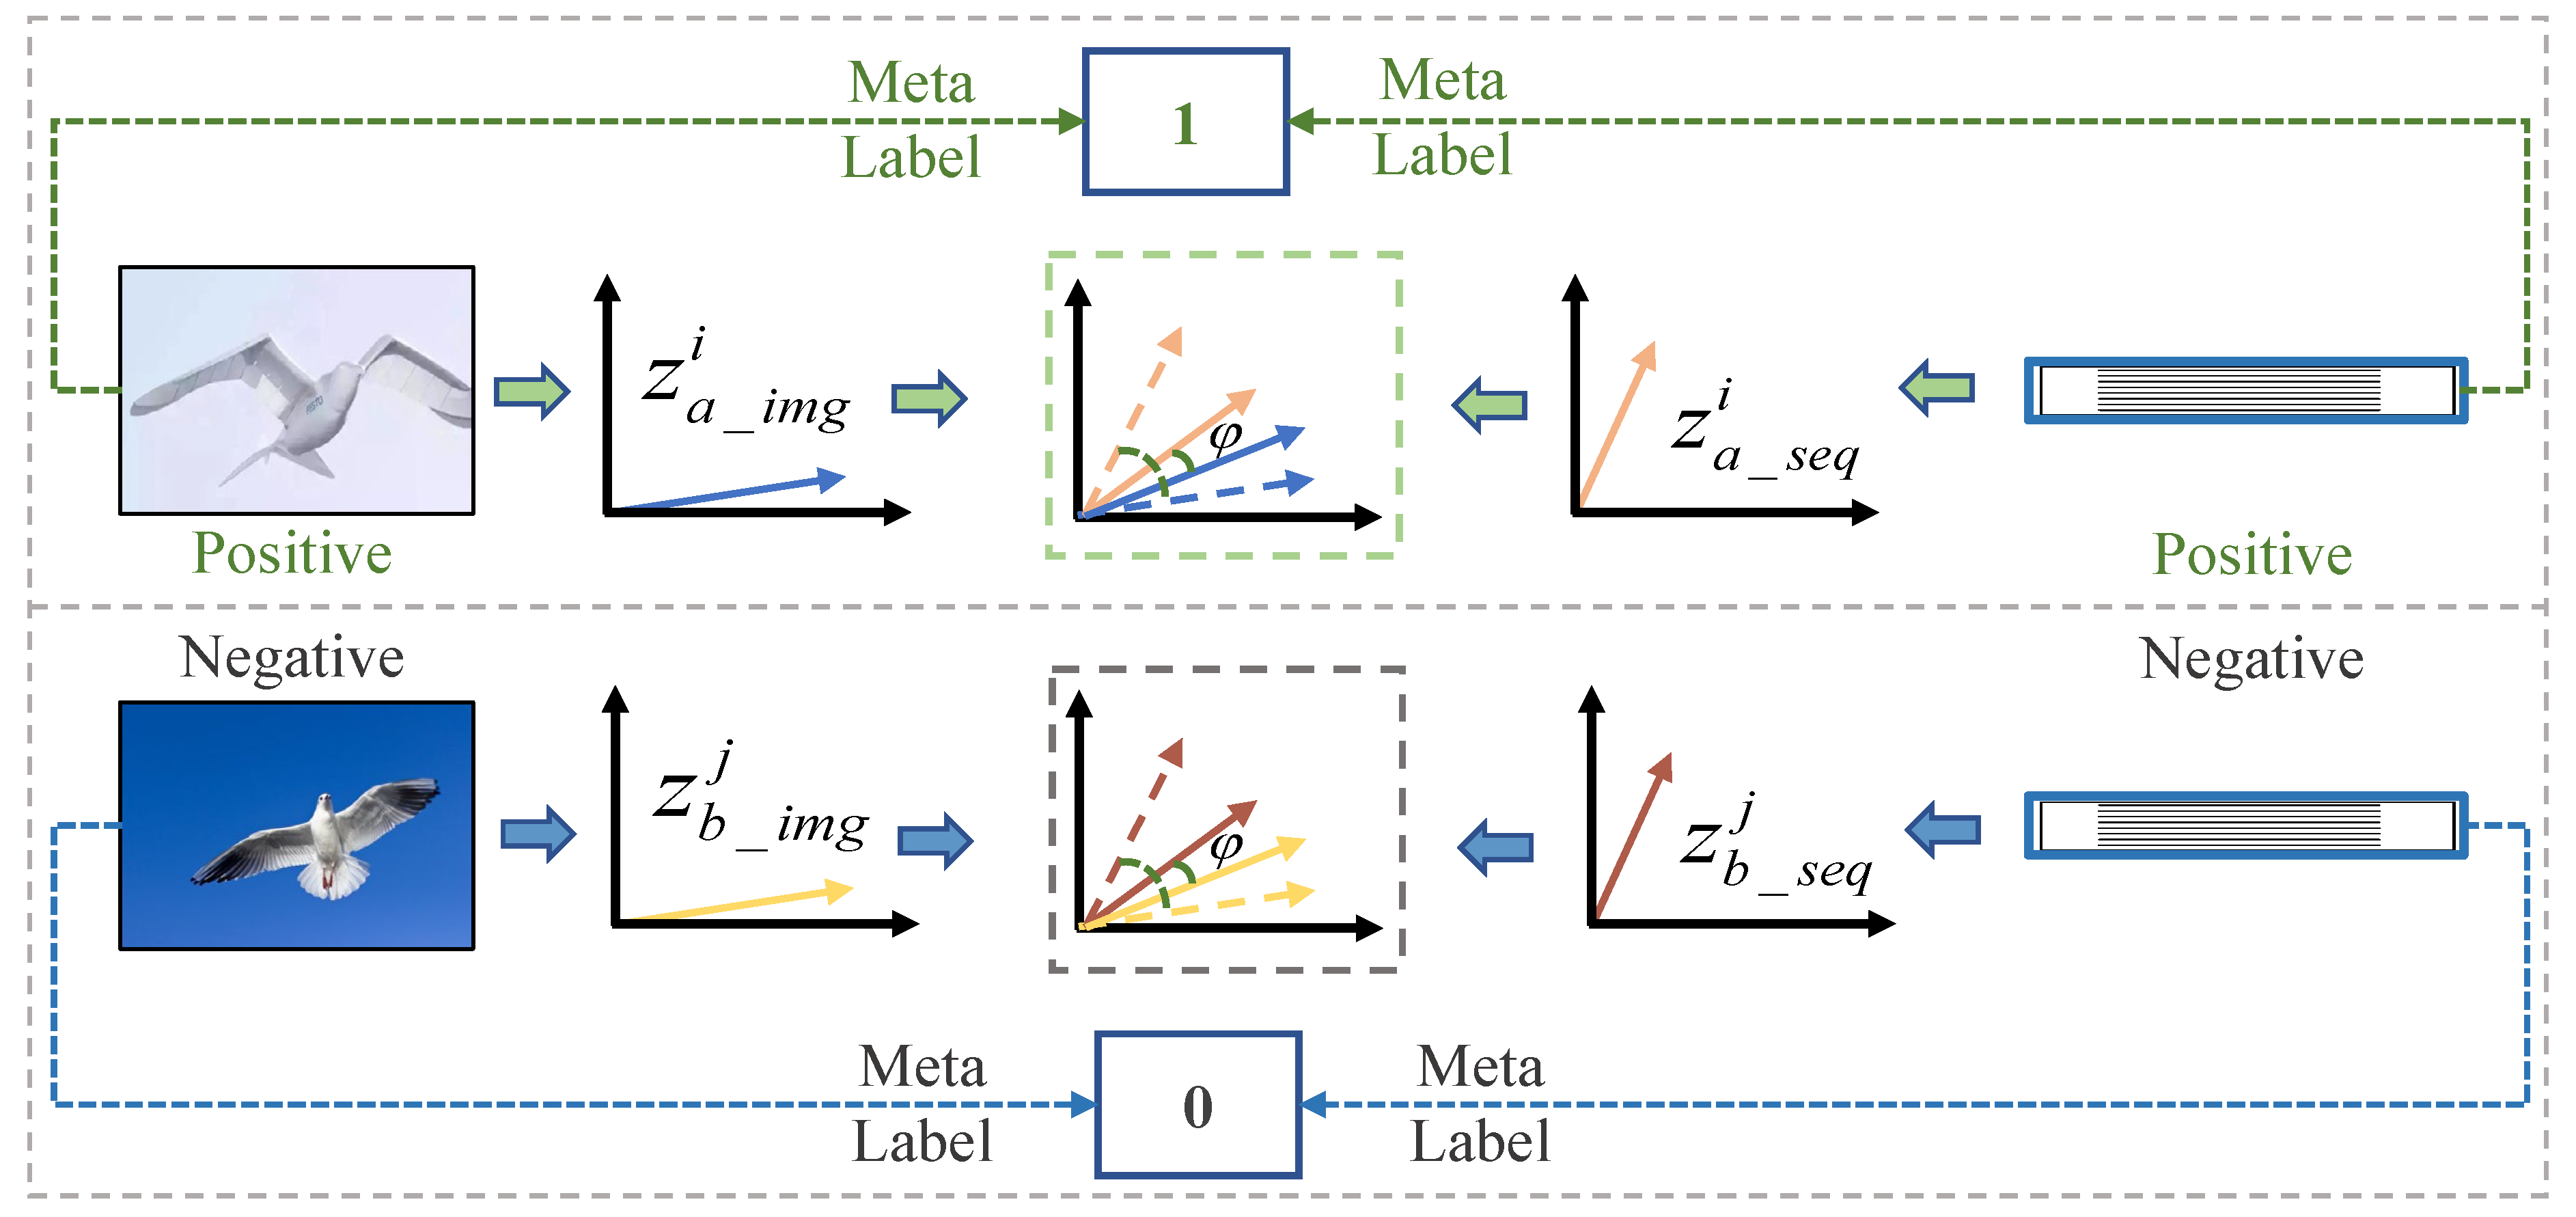
The SAM explores the consistent semantic information between cross-modal data by optimizing the similarity measures between image and sequence modalities in the feature space, providing more semantic clues for the robust recognition of bionic drones and birds. As shown in Figure 2, the orange blocks in the SAM indicate the correspondence between data with the same labels across the two modalities. In contrast, the blank blocks represent an absence of correspondence between data with different labels. Therefore, this correspondence is optimized, and adaptive semantic alignment of the two extracted features is achieved. Specifically, the features of the two modalities are initially extracted separately by the two feature extractors. Resnet2d uses the Resnet50 [17] structure for the extraction of image features and is denoted by R 2 d · . The detailed structure of Resnet2d is shown in Figure 4, and it is composed of five layers {Conv, Layer1, Layer2, Layer3, and Layer4}. These layers progressively extract features from shallow to deep, ultimately capturing high-level semantic features. Specifically, the inputs are the three-channel RGB images I x , y , and the feature vectors of the optical natural image are obtained after the feature extractor, which can be expressed as
z i m g i = R 2 d I x , y
where z i m g i denotes the initial features of the image extracted by R 2 d · .
Similarly, the sequence modality data are processed using Resnet1d, i.e., Resnet18 [17], which is denoted by R 1 d · . Given the input sequences S p 1 , . . . , p 100 , the corresponding feature vector can be expressed as
z s e q i = R 1 d S p 1 , . . . , p 100
where z s e q i represents the initial features of the sequence extracted by R 1 d · .
It is worth noting that each feature extractor is parameter-shared for inputs that are modality—specific but in different classes. Then, adaptive semantic alignment of the two modalities is achieved by calculating the cosine similarity between their feature vectors. Specifically, by comparing the cosine similarity of the feature vectors of the images and motion behavior feature sequences, their similarity in the feature space is quantified. Using this similarity measure, we can dynamically adjust and optimize the representations of the two modalities’ data to make them more semantically consistent. Finally, by minimizing the cosine distance between the feature vectors, it is then possible to continuously optimize the feature representation during training.
As shown in Figure 5, taking the bionic drones as an example, after feature extraction from the image and sequence modality data, two feature vectors, i.e., z a _ i m g i and z a _ s e q i , are obtained. The cosine similarity between them is calculated as follows:
c o s simi z a _ i m g i , z a _ s e q i = z a _ i m g i · z a _ s e q i z a _ i m g i · z a _ s e q i
where the range of c o s simi · is 1 , 1 . The cosine similarity of the two is quantified as the cosine of the angle φ , and the smaller this angle is, the more similar the two modalities are. The cosine distance between the feature vectors is calculated based on the cosine similarity, as shown in Equation (15):
c o s dist z a _ i m g i , z a _ s e q i = 1 c o s simi z a _ i m g i , z a _ s e q i
where the range of c o s dist · is 0 , 2 . It is negatively correlated with c o s s i m i · and positively correlated with c o s dist · . In the semantic alignment module (SAM), we aim to reduce the cosine distance between the image features and the motion sequence features for semantic alignment. The mean squared error (MSE) function is used to constrain this parameter, as shown in the following expression:
MSE = 1 N i = 1 N c o s dist z a _ i m g i , z a _ s e q i y i 2
where y i can be expressed as the objective of c o s dist · . Theoretically, the smaller the cosine distance between the two sets of features, the more similar they are in the feature space. Therefore, MSE is used to constrain this parameter toward 0, and the overall objective loss is as follows:
L s a m = MSE c o s dist z a _ i m g i , z a _ s e q i , 0
By continuously iterating and optimizing the above objective, the distance between the two modalities in the feature space can be narrowed, achieving semantic alignment.

2.4. Feature Fusion Module (FFM)

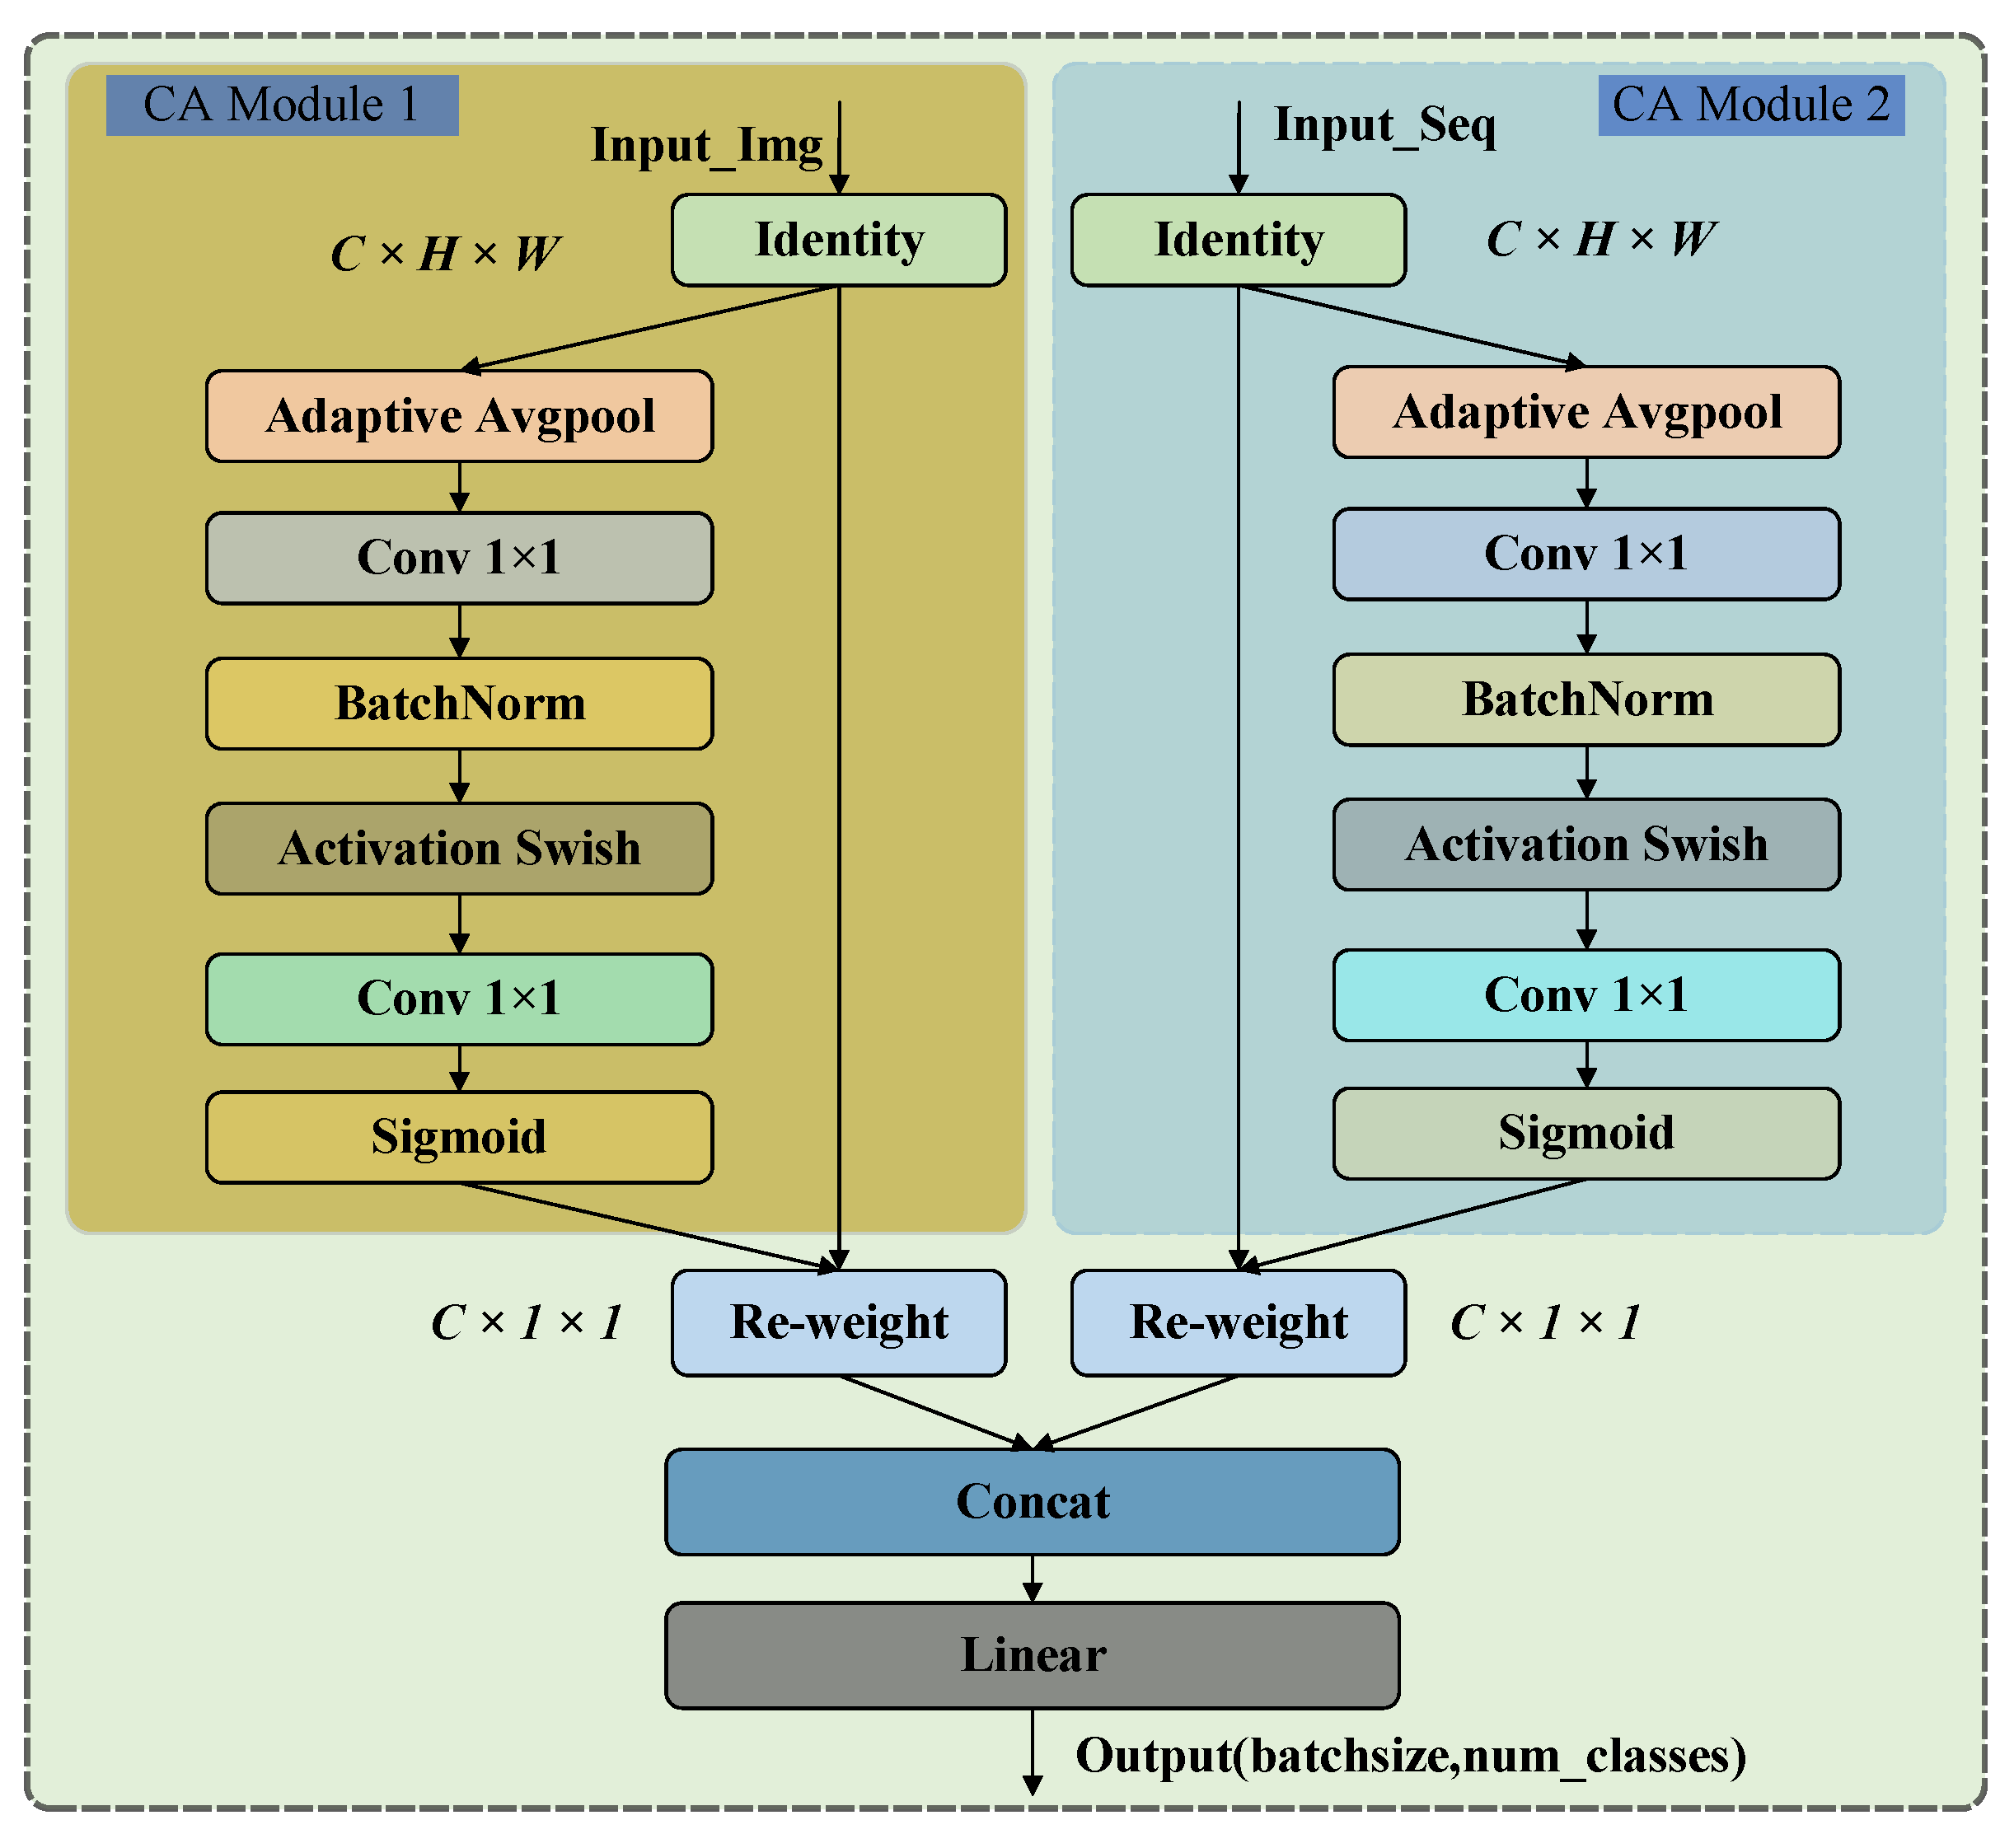
After semantic alignment, the FFM is also applied, as shown in Figure 6. This module aims to fully fuse cross-modal information, enhancing the model’s representational capability for cross-modal data. This approach addresses the high-similarity issues between the two types of targets in optical natural images. Consequently, it achieves robust discrimination between bionic drones and birds. Specifically, this module contains two channel attention sub-modules with non-shared parameters, named CA Module 1 and CA Module 2. Given the input tensor z a _ i m g i R C × H × W , due to the symmetric structure, it can be denoted by X R C × H × W for the convenience of uniform description. First, to extract the channel information, we perform global adaptive mean pooling on the input tensor:
X A A P = A A P X
where A A P · denotes the adaptive average pooling operation, and X A A P R C × 1 × 1 is retained only for channel information. Then, to ensure that the module is light enough, after pooling, the pooled feature maps are subjected to channel number compression. Batch normalization (BN) is also performed to accelerate the training process and improve the model’s recognition ability. Accordingly, the feature map is represented as follows:
X B R = B N R e C o n v 1 × 1 X A A P
where X B R R C R × 1 × 1 represents the feature dimension. R e C o n v 1 × 1 · represents the channel dimension reduction operation using 1 × 1 convolution. R denotes the channel number compression multiplier, which is set to R = 16 in this paper, and B N · represents the batch normalization operation. Next, the swish activation function [49] is applied to introduce non-linear transformations. Compared to the traditional ReLU activation function, swish is a smoother activation function, which better preserves gradient information and reduces the problem of gradient vanishing. It can be described as follows:
X s w i s h = S w i s h X B R
where the feature dimension is X s w i s h R C R × 1 × 1 , and S w i s h · is denoted as follows:
S w i s h x = x · m i n m a x 0 , x + 3 , 6 6
To generate the channel attention weights, the compressed feature map is restored to the original number of channels using a 1 × 1 convolution operation. Then, the sigmoid function is used to map the output to a range of 0 to 1, resulting in the attention weights. This process is expressed as follows:
X S I = σ I n C o n v 1 × 1 X s w i s h
where the feature dimension becomes X S I R C × 1 × 1 . I n C o n v 1 × 1 · denotes the channel number dimensioning operation using a 1 × 1 convolution operation, and σ · denotes the sigmoid function. Next, the generated channel attention weights are multiplied element-wise with the input features to produce the weighted features:
Y w e i g h t e d = X X S I
where the weighted output is Y w e i g h t e d R C × H × W , and ⊙ represents the multiplication of the corresponding elements of the matrix.
According to the above description, after the features of the two modalities are input and processed through the CA Module, the weighted features are obtained. Since the two CA Modules have symmetric structures, this process can be summarized as follows:
y a _ i m g i = C A M o d u l e 1 z a _ i m g i y a _ s e q i = C A M o d u l e 2 z a _ s e q i
where y a _ i m g i and y a _ s e q i are the features obtained after the image modality and sequence modality are processed by the CA Module, respectively. In order to integrate high-level information from different modalities, we concatenate them along the channel dimension and apply a fully connected layer for linear transformation, which is used for subsequent classification:
Z o u t p u t = L i n e a r C o n c a t y a _ i m g i , y a _ s e q i
where Z o u t p u t denotes the fused output, L i n e a r · stands for the fully connected layer, and C o n c a t · represents the concatenation of features along the channel dimension.
This module not only retains the global information of the input features but also effectively captures and enhances the relationships between features through the attention mechanism.

2.5. Objective Loss Function

In this paper, the objective loss function is the combination of several component losses, including the semantic alignment loss, and the classification losses for both the fused features and the sequence modality features. Among them, the semantic alignment loss, i.e., L s a m , is the loss attributed to the semantic alignment module, while the classification loss includes the binary cross-entropy loss for optimizing the classification performance of the fused features and individually optimizing the classification performance of the sequence modality. This aims to ensure consistency in the optimization of the fused features and the features between modalities, which are, respectively, denoted as follows:
L f u s i o n = 1 N i = 1 N c = 1 C l i , c log y ^ f u s i o n , i , c L s e q = 1 N i = 1 N c = 1 C l i , c log y ^ s e q , i , c
where L f u s i o n denotes the classification loss of the fused features, while L s e q denotes the classification loss of the sequence modality features. l i , c is the target category label (1 or 0). y ^ f u s i o n , i , c stands for the predicted probability of the fused model, and y ^ s e q , i , c refers to the predicted probability of the sequence modality. Additionally, N represents the total number of samples, and C indicates the number of classes.
The final objective loss function is the weighted sum of each of the above loss modules, defined as
L t o t a l = α L s a m + β L f u s i o n + γ L s e q
where α , β , and γ denote the weight hyperparameters of each loss component, which are used to control the contribution of each part.

3. Experiments

In this section, we show the detailed experimental evaluation of the proposed CSAFF approach. The datasets, evaluation criteria, and implementation details are presented in Section 3.1. The experimental results and analysis are described in Section 3.2. The model analysis and discussion are presented in Section 3.3. The above details are specifically provided below.

3.1. Experimental Setup

3.1.1. Datasets

The dataset consists of two parts, namely, optical natural images of bionic drones and birds (a total of two classes) and their corresponding motion behavior feature sequences. Specifically, for the optical natural images, we collected a large number of images of bionic drones and birds during flight, and their diversity and quantity were further expanded after random cropping and other data enhancement techniques. Ultimately, the dataset contains 4160 images of bionic drones and 5972 images of birds, totaling 10,132 images. The image resolutions range from 204 × 210 to 1600 × 1122 pixels, and after preprocessing, they were uniformly resized to 256 × 256 pixels. And, the motion behavior feature sequence was generated based on the motion models of bionic drones and birds in Section 2.2. Each sequence has a length of 100 and contains the positions of bionic drones or birds at 100 consecutive time points. By capturing the changes in their motions at consecutive moments, the sequential motion behavior sequences were generated. Eventually, 10,132 sequences were generated, including 4160 sequences for bionic drones and 5972 sequences for birds. During model training, we assigned the same label to each image and its corresponding motion sequence, and these data were jointly fed into the designed model. It is worth noting that one of the biggest differences between these two datasets lies in their storage formats: one consists of RGB images, while the other consists of sequences of sequential time points.
The datasets were randomly divided into training sets and test sets in a 7:3 ratio to ensure the fairness and objectivity of the model evaluation.

3.1.2. Evaluation Criteria

In order to comprehensively evaluate the performance of the model, we use the following commonly used classification evaluation criteria: Accuracy, Precision, Recall, F1_score, and Confusion_Matrix. Accuracy measures the ratio of correctly predicted bionic drone (positive class) and bird (negative class) samples to the total number of samples. The expression is as follows:
Accuracy = T P + T N T P + F P + T N + F N
where T P and F N represent the number of actual bionic drone samples predicted as bionic drones and birds, respectively. Similarly, F P and T N represent the number of actual bird samples predicted as bionic drones and birds. Precision measures the proportion of correctly predicted bionic drone samples to all samples predicted as bionic drones. It can be expressed as follows:
Precision = T P T P + F P
Recall measures the ratio of samples correctly predicted as bionic drones to all actual bionic drone samples, which can be described as follows:
Recall = T P T P + F N
In addition, the F1_score combines the effects of Precision and Recall and is expressed as follows:
F 1 _ score = 2 · Precision · Recall Precision + Recall
Then, the Confusion_Matrix records the number of correctly and incorrectly predicted samples during the classification process, providing a visual representation of the model’s performance across different classes. A typical Confusion_Matrix is shown in Table 1.
Additionally, inference time (Inf. Time) is a key criterion for evaluating model efficiency. It refers to the time required for the model to process a single input and make a prediction, as expressed by the following formula:
t Inf = t Total N
where t Inf refers to the time required to process a single input during the testing phase, t Total represents the total time taken by the model to process all inputs, and N denotes the total number of inputs processed.
Finally, Parameter (Param.) refers to the total number of learnable weights and biases in the model, which reflects its demand on memory and computational resources.
Among the above metrics, the ranges of Accuracy, Precision, Recall, and F1_score are all 0 , 1 . Using all of these metrics, the performance of the proposed method can be comprehensively evaluated in the classification and recognition tasks of bionic drones and birds.

3.1.3. Implementation Details

The proposed method is implemented based on the Pytorch framework [50]. Through the random initialization strategy, two feature extractors, Resnet2d and Resnet1d, are trained. The designed loss function is used to compute and update the model through backpropagation. We use the SGD optimizer with a momentum of 0.9 and a weight decay of 0.0001 for model optimization. To ensure the effective training and convergence of the model, the following learning rate adjustment strategy is adopted: the initial learning rate is set to 0.0025 and is decayed to 0.1 times its original value every 30 epochs. The entire model is trained end-to-end for 100 epochs on an NVIDIA GeForce RTX 4090 GPU, with a batch size of 64. At the beginning of each iteration, images, sequences, and labels of the same batch size are fed together into the network for training. The server used for the experiments is equipped with 128 GB of RAM and 48 GB of GPU memory, and each training session lasts approximately 1 h 40 min.

3.2. Comparisons with State-of-the-Art Methods

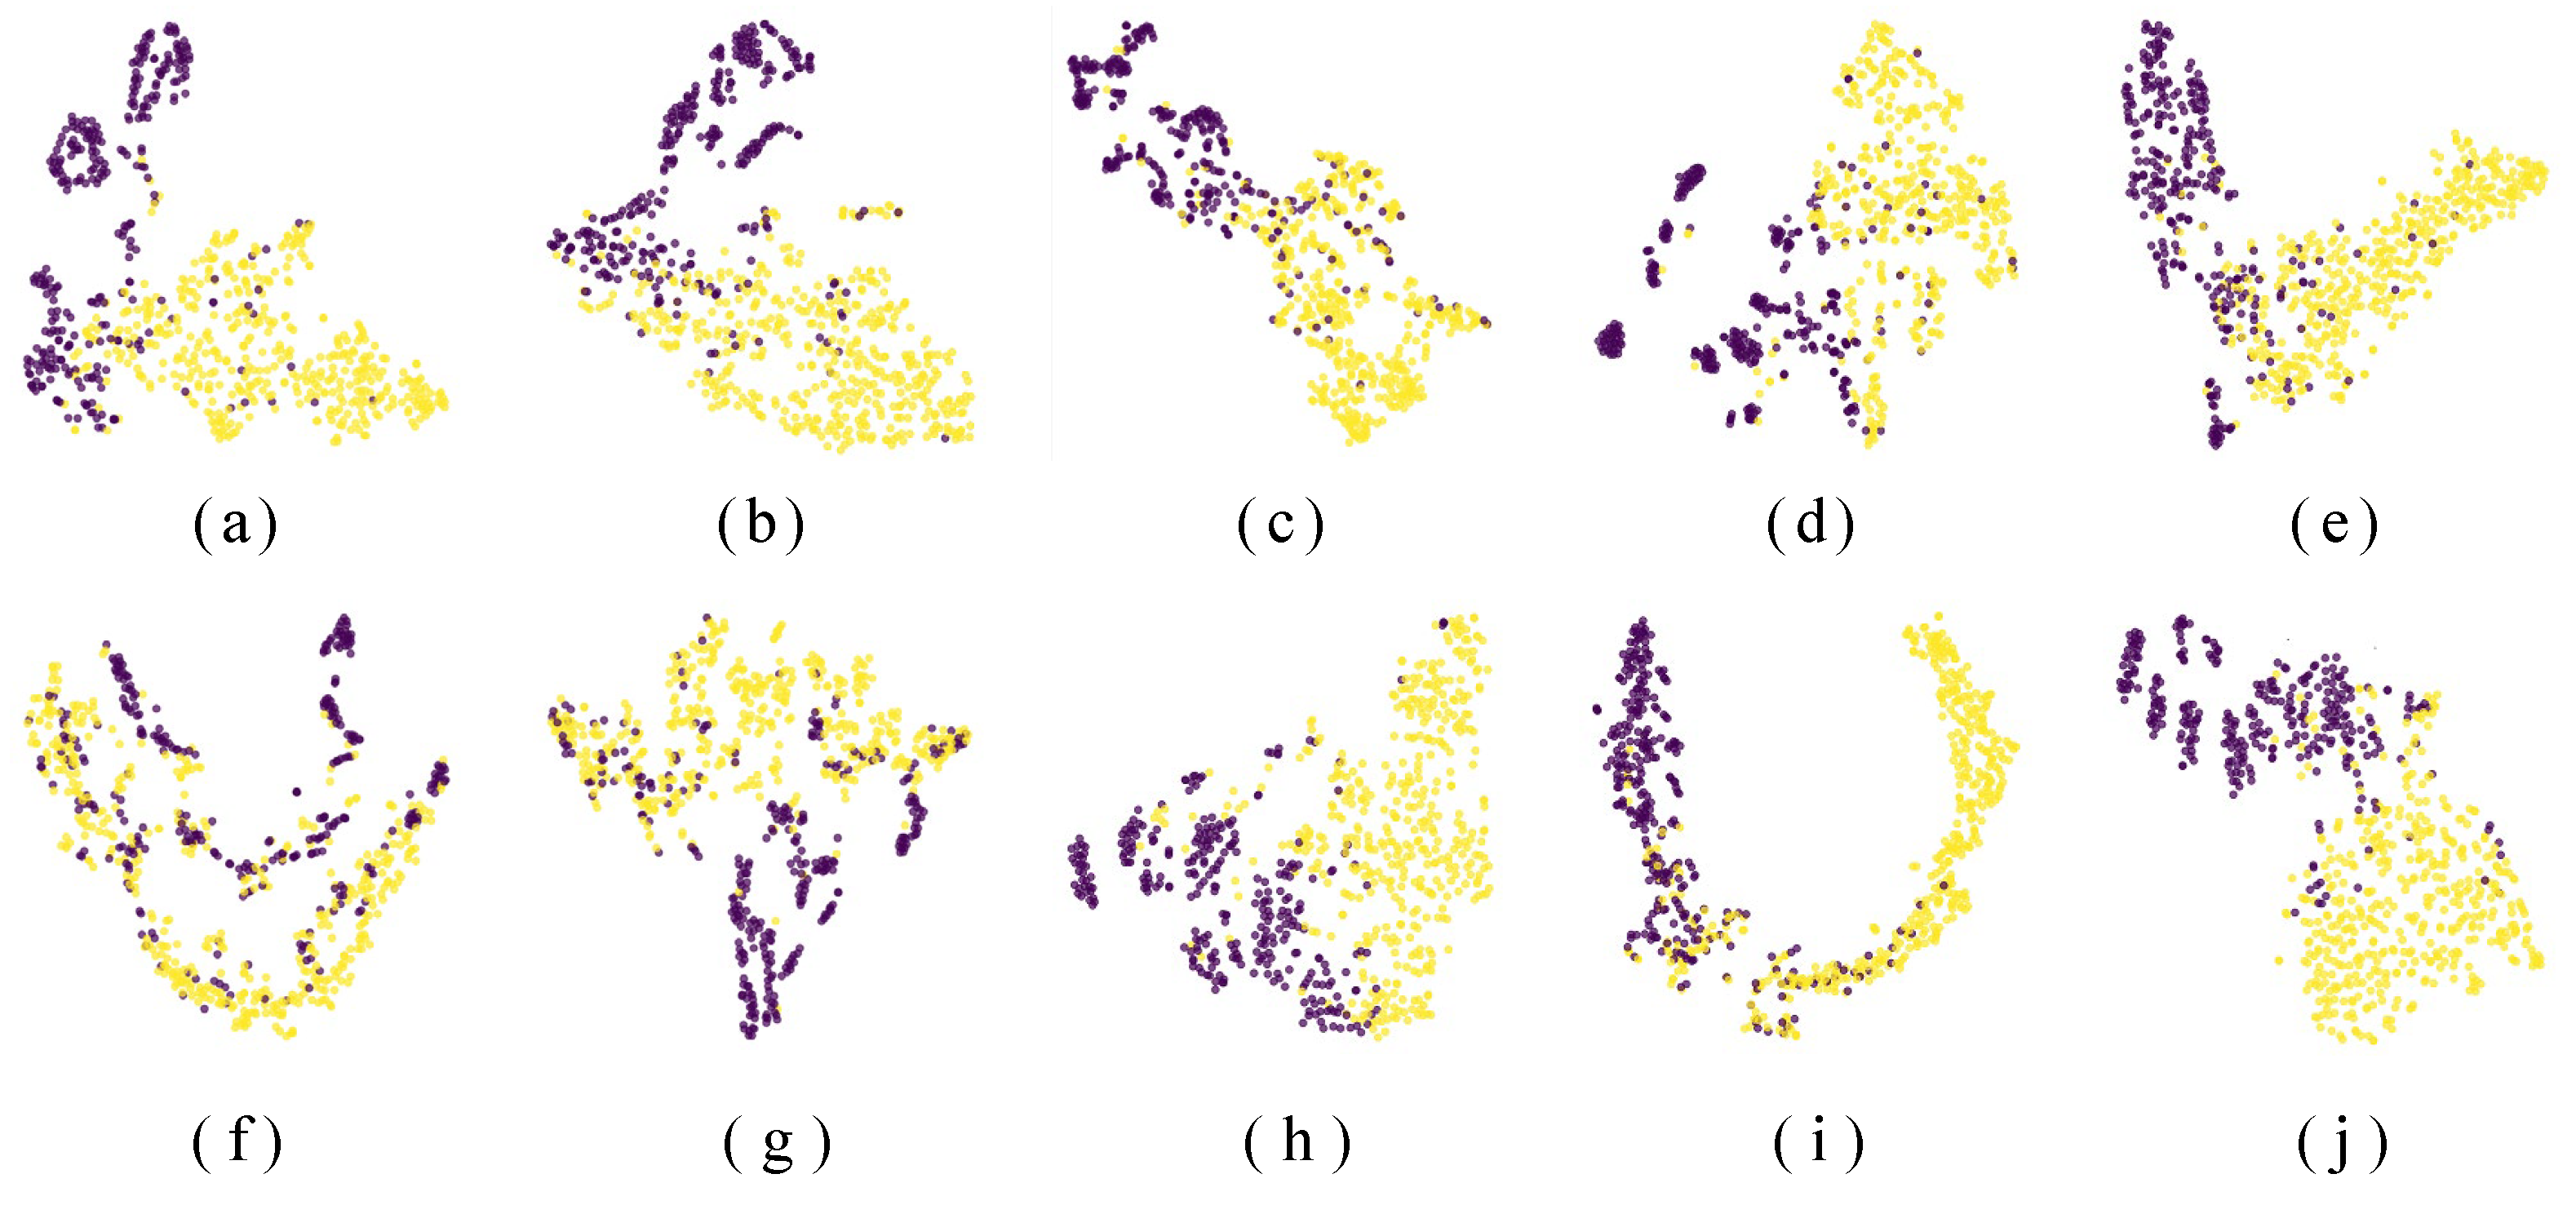
In order to validate the superiority of the proposed method, we compare it with nine state-of-the-art classification methods, covering both single-modal and cross-modal methods to ensure that the comparison is comprehensive and scientific. These include seven single-modal optical natural image classification methods: Resnet34 [17], Resnet50 [17], Resnet101 [17], Densenet-121 [51], Efficientnet-V2_m [52], ConvNeXt_s [53], and ConvNeXt-V2_s [54]. In addition, the comparison includes two cross-modal classification methods: DC-DSCNN [55] and GRU+ Alexnetatt [56]. The performance of the model is quantitatively evaluated by the evaluation criteria in Section 3.1.2, and the distribution of different categories in the feature space is qualitatively analyzed by T-Distributed Stochastic Neighbor Embedding (T-SNE) [57] visualization. Next, the experimental results are presented in detail.

3.2.1. Quantitative Evaluation

The first seven rows of Table 2 show the classification results of the seven single-modal optical natural image classification methods, which were evaluated on the optical natural image dataset. The results indicate that ConvNeXt-V2_s and Efficientnet-V2_m perform excellently across all evaluation metrics, with their Accuracy, Precision, Recall, and F1_score all surpassing those of the other five methods, demonstrating superior classification performance. Although ConvNeXt-V2_s and Efficientnet-V2_m outperform the other five methods in terms of classification performance, there is still room for improvement in their overall classification results. This limitation suggests that the performance of the model is restricted when relying only on single-modal image data for classification. Therefore, the cross-modal fusion method, which is proposed in this paper, is designed to further improve classification performance by fusing information from multiple modalities. In selecting the feature extractors, Efficientnet-V2_m and Resnet101 were not chosen due to their large number of parameters and slower inference speeds. The inference speeds of ConvNeXt_s and ConvNeXt-V2_s are also not ideal. Similarly, although Densenet-121 has fewer parameters, its convolution process is much larger than that of Resnet50, resulting in slower inference. As for ResNet34, although it boasts the fastest inference speed, its performance lags behind the other methods. Therefore, Resnet50, which has moderate parameters and a faster inference speed, was finally chosen as the feature extractor for image modality. For the motion sequence modality, we also adopted the Resnet18 structure with a smaller parameter number for feature extraction, which can effectively capture the key features in the motion behavior sequence and significantly reduce the time cost of training and inference. The last three rows of Table 2 show the recognition results of the proposed method with two other current state-of-the-art cross-modal methods in the task of classifying bionic drones and birds. In contrast, the proposed CSAFF method performs the best across all evaluation criteria, with an Accuracy of 95.25%, Precision of 95.30%, Recall of 95.26%, and F1_score of 95.27%, significantly surpassing the other methods. The Confusion_Matrix shows that the proposed method has false alarm rates of only 4.49% for bionic drones and 4.92% for birds, which are significantly lower than those of other methods. Although our proposed method has a parameter count of 29.03 M and a slightly slower inference speed, it performs much better in balancing the classification performance and computational resource requirements. In practical applications, the choice of an appropriate classification method depends on specific requirements and application scenarios. If high classification accuracy is required, our method will be the most suitable choice, providing more accurate recognition of bionic drones and birds, significantly reducing false positive and false negative rates, and ensuring the reliability and accuracy of the classification results. On the other hand, if real-time performance is crucial and the demand for classification accuracy is not as stringent, the lightweight DC-DSCNN method would be a more appropriate choice. The GRU + Alexnetatt method is not outstanding enough in terms of accuracy and real-time performance, and the reason is speculated to be that the Alexnet network layers are shallow and do not perform well when dealing with more complex images. For the motion sequence modality, we are more concerned with some of its local features, and in this case, the GRU network does not perform as well as Resnet18.

3.2.2. Qualitative Evaluation

In high-dimensional feature space, it is very difficult to directly observe the distribution and characteristics of the data. To visually display the distribution of different category data in the feature space, it is often necessary to reduce the high-dimensional data to two-dimensional or three-dimensional space. T-SNE [57] is a commonly used technique for dimensionality reduction, which can effectively map high-dimensional data into a low-dimensional space. By comparing the T-SNE visualization results of different models, it is possible to compare the effectiveness of each model in feature extraction and sample differentiation and select the optimal model. In Figure 7, the T-SNE visualization results of different methods are shown, with Figure 7a–j representing Resnet34, Resnet50, Resnet101, Densenet-121, Efficientnet-V2_m, ConvNeXt_s, ConvNeXt-V2_s, DC-DSCNN, GRU + Alexnetatt, and the proposed method, respectively, where the purple points represent the bionic drone samples and the yellow points represent the bird samples. It can be seen that the T-SNE visualization results of Resnet34, Resnet50, Densenet-121, ConvNeXt_s, and ConvNeXt-V2_s exhibit some degree of category mixing, with an insufficient distinction between samples and unclear boundaries between categories. The results of Resnet101 and Efficientnet-V2_m show slight improvement but still have a significant number of mixed points. While DC-DSCNN and GRU + Alexnetatt perform better in sample differentiation, there are a small number of misclassified points and still some overlapping regions. In contrast, the proposed method achieves a more distinct clustering effect in the feature space, with clear boundaries between categories. This indicates that the proposed method has higher recognition capability in feature extraction and category differentiation, effectively capturing and distinguishing the features of bionic drones and birds. Therefore, the above analyses further validate the superior performance of the proposed method in the classification task.
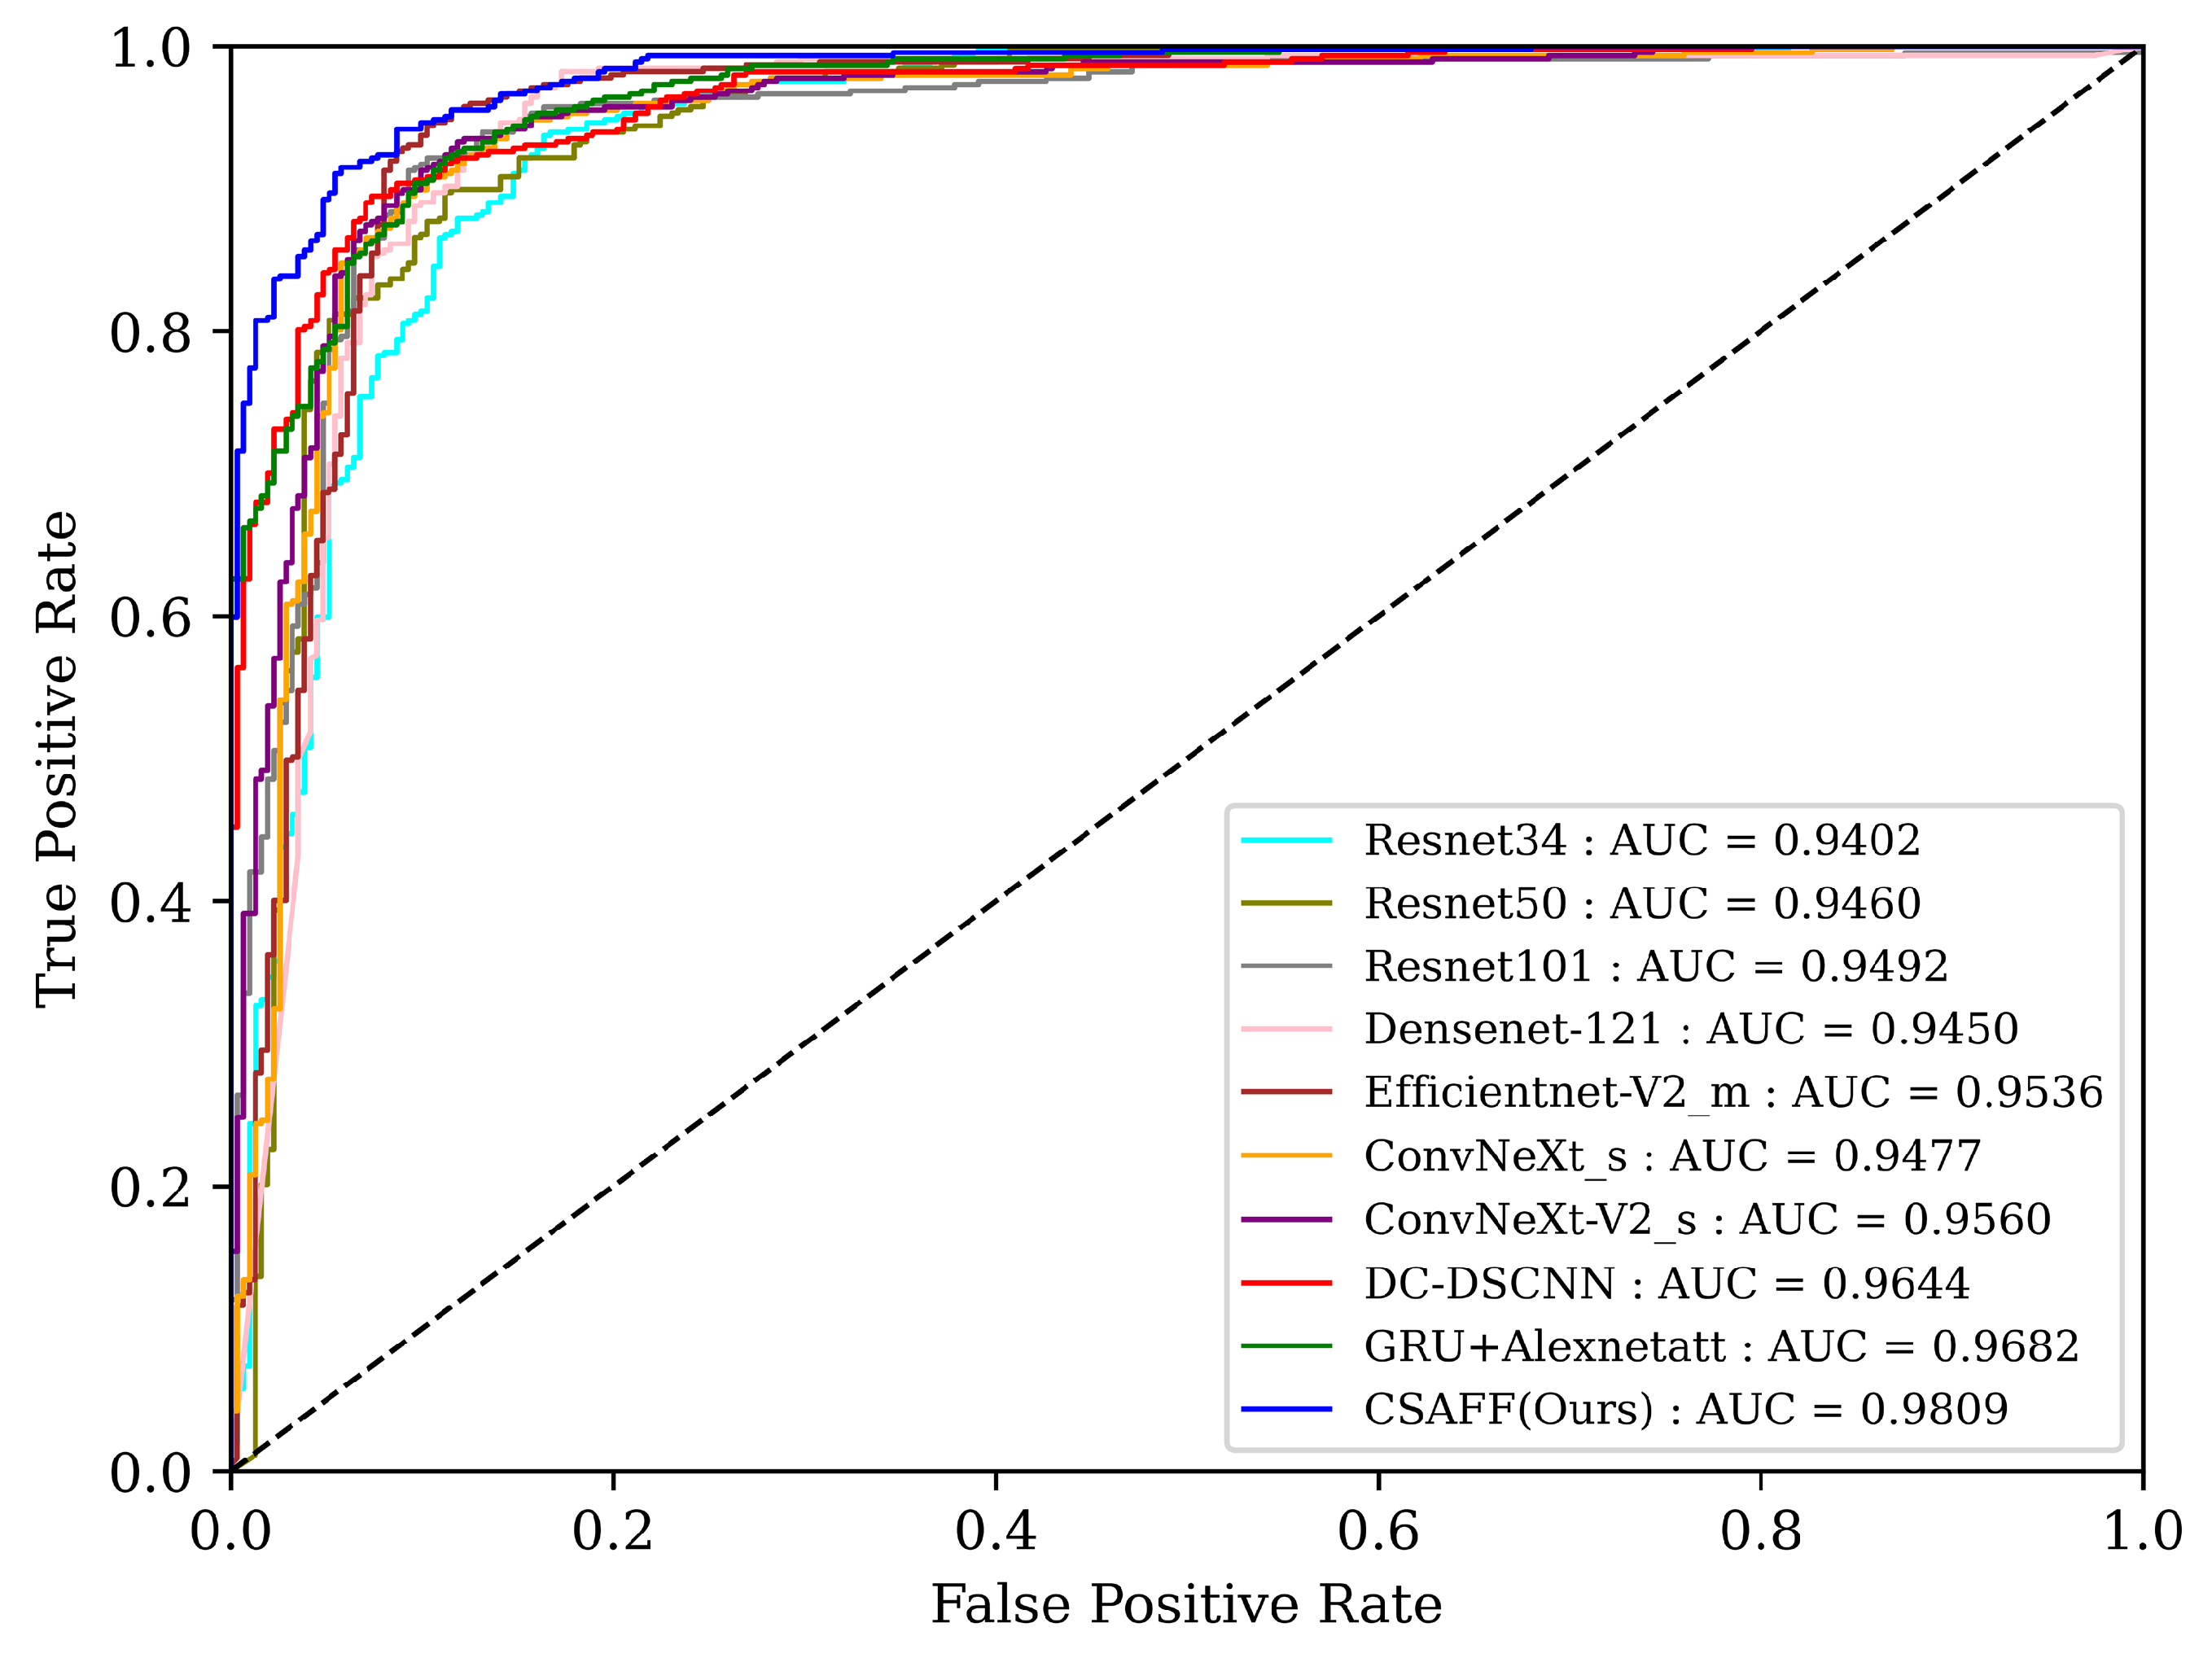
In order to evaluate the performance of the classifiers more comprehensively, we also provide the Receiver Operating Characteristic (ROC) curves of the different methods. The ROC curves demonstrate the relationship between the true positive rate (TPR) and the false positive rate (FPR) at different thresholds, providing us with a visual means of comparing the performance of the classifiers. It is important to note that the TPR is also known as the Recall, while the FPR represents the proportion of negative samples that are incorrectly predicted as positive. By analyzing the shape of the ROC curve and its area under the curve (AUC), we can obtain deeper insights into the discrimination ability of each method under different decision boundaries. Additionally, the AUC value is a crucial indicator of overall classifier performance; the closer to 1, the stronger the classifier’s ability to differentiate. Through these analyses, we can more accurately assess and compare the strengths and weaknesses of different methods, thus guiding further model optimization. As shown in Figure 8, we plot the ROC curves and calculate the AUC values of the ten methods. It can be clearly observed that our method is superior to the other nine methods and possesses the highest AUC value (0.9809), indicating that our model is able to effectively control the FPR while maintaining a high TPR, further proving the superiority of our proposed method.

3.3. Further Analysis of the Model

In this section, we further analyze the proposed method in detail by presenting ablation studies and a hyperparameter sensitivity analysis.

3.3.1. Ablation Studies

We explore the proposed methodology through ablation experiments, which are mainly divided into the modular analysis of the model and single-modal disassembly comparisons, in order to assess the effectiveness of the proposed methodology and its advantages over single-modal methods. Firstly, we removed each module of the model one by one and observed the effect of removing each module on the overall performance so as to assess the contribution and importance of each module in the model. Table 3 demonstrates the results of the ablation study on the effectiveness of different modules of the proposed method. “Baseline” is the model in which both SAM and FFM modules are deleted, and compared to the full model, the Accuracy, Precision, Recall, and F1_score decreased by 2.89%, 2.85%, 2.90%, and 2.89%, respectively. “Ours w/o FFM” indicates that only the FFM module is removed, and compared to the full model, the evaluation results decreased by 2.10%, 2.09%, 2.11%, and 2.11%, respectively. Similarly, “Ours w/o SAM” indicates that only the SAM module is removed, and the metrics decreased by 1.31%, 1.23%, 1.32%, and 1.31%, respectively. Additionally, as can be seen from the confusion matrix, the complete model performs the best in distinguishing between bionic drone and bird samples. Secondly, we decomposed the cross-modal method into single-modal methods by separately using optical natural images and motion feature sequences for training and testing, comparing the performance differences between single-modal and cross-modal methods, thus verifying the advantages of cross-modal data fusion. Table 4 shows the results of the ablation studies on the single-modal decomposition of the proposed method. “Single Img_Modal” denotes the method for a single image modality, and “Single Seq_Modal” represents the method for a single sequence modality. A comparative analysis reveals that the single-modal methods perform worse in classification compared to the cross-modal methods. Specifically, the Accuracy, Precision, Recall, and F1_score of the Resnet50 single-modal method on the optical natural image dataset are all around 88%, suggesting that there are some limitations of this method when dealing with single-modal data. The single-modal Resnet18 method performs slightly better than Resnet50 on the motion feature sequence dataset but still does not achieve the effectiveness of the cross-modal method. In contrast, all evaluation metrics of the cross-modal method are above 95%, significantly higher than those of the single-modal methods. Obviously, by fusing optical natural image and motion feature sequence data, the cross-modal method can fully utilize the advantages of multi-modal data, significantly improving classification performance. While the performance is improved, the number of parameters of the model and the inference time do not increase significantly; thus, the proposed method balances the performance and efficiency well.

3.3.2. Sensitivity of Hyperparameter

As shown in Equation (27), the hyperparameters α , β , and γ control the weights of the individual component losses L s a m , L f u s i o n , and L s e q , respectively, and are used to balance the effects among the components. In this section, we systematically evaluate the impact of varying hyperparameter values on model performance to determine the optimal hyperparameter combination. Specifically, while changing the value of one hyperparameter, the other hyperparameters are fixed to 1, thus observing the effect of a change in a single hyperparameter on the model performance. This approach can help us to understand the role of each loss term in the model training process and its contribution to the final classification performance. The results are shown in Figure 9, which demonstrates the variation in the model’s metrics, such as Accuracy, Precision, Recall, and F1_score, using different hyperparameter values. The value of α determines the contribution of the semantic alignment loss to the overall loss, affecting the consistency of image and sequence modality features in the semantic space. As shown in Figure 9a, all of the indexes change with the increase in α , and the overall performance shows an upward trend, thus reaching the best result when α is 1. The hyperparameter β controls the weight of the cross-entropy loss of the fused features in the total objective loss, ensuring that the model maintains high classification accuracy after fusing cross-modal features. As shown in Figure 9b, all of the criteria of the model improve with the increase in β . The performance of the model is relatively low when the value of β is small, indicating that the loss of cross-entropy of the fused features has a significant effect on the classification effect of the model. When β is set to 1, the overall performance of the model is optimal. Moreover, the hyperparameter γ controls the weight of the cross-entropy loss of the sequential modal features in the overall target loss while ensuring the consistency of the optimization of the fused features and inter-modal features. In Figure 9c, it can be seen that the model performs best when γ is 0.1. As γ increases, the overall performance of the model tends to decrease. This suggests that too large a value of γ causes the model to focus excessively on the sequence modal features, destroying the consistency of the fused features and inter-modal feature optimization, thus affecting the overall classification performance. Therefore, in all experiments, α , β , and γ were set to 1, 1, and 0.1, respectively, to achieve an optimal balance between different loss terms and, thus, optimal model performance.

4. Conclusions

In this paper, we propose an accurate recognition framework for bionic drones and birds based on cross-modal semantic alignment and feature fusion, which is used to address the difficulty of accurately recognizing bionic drones and birds due to their high visual similarity. Considering the significant differences in the motion behavior characteristics of bionic drones and birds, we introduce their motion behavior information to assist in target discrimination. Through the designed semantic alignment module (SAM), the similarity metric between image and sequence modalities in the feature space is optimized, and the consistent semantic information between cross-modal data is exploited to provide more semantic clues for the recognition of bionic drones and birds. Secondly, in order to fuse cross-modal data features, a feature fusion module (FFM) is designed, aiming to make full use of the cross-modal complementary information and effectively enhance the characterization ability of cross-modal features. Extensive experiments have been conducted on the datasets of optical natural images and motion behavior feature sequences of bionic drones and birds. The experimental results show that our method outperforms the existing cross-modal and single-modal methods based on various metrics, proving the effectiveness of the proposed method. In addition, after ablation studies and visualization analysis, we further validate the superiority of CSAFF in the recognition task of bionic drones with birds. It also provides an effective solution for cross-modal data fusion. Since CSAFF is designed to utilize data from both image and motion behavior sequence modalities, it imposes requirements on the data format. In future work, we plan to develop networks that are compatible with other types of data and expand the proposed method to various scenarios and target types.

Author Contributions

Conceptualization, H.L., D.L. and S.L.; data curation, H.L. and D.L.; formal analysis, H.L. and D.L.; funding acquisition, D.L., M.Z., J.W. and Q.L.; investigation, D.L.; methodology, H.L., D.L. and S.L.; project administration, D.L. and J.W.; supervision, D.L. and Q.L.; validation, H.L., D.L., J.W., S.L. and H.Z.; writing—original draft, H.L.; writing—review and editing, D.L., M.Z., J.W., S.L., H.Z. and Q.L. All authors have read and agreed to the published version of the manuscript.

Funding

This research was funded by the National Natural Science Foundation of China under Grants 62371079, 62201099, and 62171379; the Defense Industrial Technology Development Program under Grant JCKY2022110C171; the Key Laboratory of Cognitive Radio and Information Processing, Ministry of Education under Grant CRKL220202; the Opening Project of the Guangxi Wireless Broadband Communication and Signal Processing Key Laboratory under Grant GXKL06200214 and Grant GXKL06200205; the Sichuan Science and Technology Program under Grant 2022SZYZF02; the Engineering Research Center of Mobile Communications, Ministry of Education under Grant cqupt-mct-202103; and the Natural Science Foundation of Chongqing, China, under Grant cstc2021jcyj-bshX0085.

Data Availability Statement

The data presented in this study are available on request from the corresponding author due to because our datasets are relevant to scientific research projects, and we also plan to continue to deepen and expand datasets. In the future, we will consider making it publicly available.

Conflicts of Interest

The authors declare no conflicts of interest.

References

  1. Ross, P.E.; Romero, J.J.; Jones, W.D.; Bleicher, A.; Calamia, J.; Middleton, J.; Stevenson, R.; Moore, S.K.; Upson, S.; Schneider, D.; et al. Top 11 technologies of the decade. IEEE Spectr. 2010, 48, 27–63. [Google Scholar] [CrossRef]
  2. Avola, D.; Cannistraci, I.; Cascio, M.; Cinque, L.; Diko, A.; Fagioli, A.; Foresti, G.L.; Lanzino, R.; Mancini, M.; Mecca, A.; et al. A novel GAN-based anomaly detection and localization method for aerial video surveillance at low altitude. Remote Sens. 2022, 14, 4110. [Google Scholar] [CrossRef]
  3. Ritchie, M.; Fioranelli, F.; Griffiths, H.; Torvik, B. Micro-drone RCS analysis. In Proceedings of the IEEE Radar Conference, Johannesburg, South Africa, 27–30 October 2015; pp. 452–456. [Google Scholar]
  4. Rahman, S.; Robertson, D.A. In-flight RCS measurements of drones and birds at K-band and W-band. IET Radar Sonar Navig. 2019, 13, 300–309. [Google Scholar] [CrossRef]
  5. Rojhani, N.; Shaker, G. Comprehensive Review: Effectiveness of MIMO and Beamforming Technologies in Detecting Low RCS UAVs. Remote Sens. 2024, 16, 1016. [Google Scholar] [CrossRef]
  6. Torvik, B.; Olsen, K.E.; Griffiths, H. Classification of Birds and UAVs Based on Radar Polarimetry. IEEE Geosci. Remote Sens. Lett. 2016, 13, 1305–1309. [Google Scholar] [CrossRef]
  7. Wu, S.; Wang, W.; Deng, J.; Quan, S.; Ruan, F.; Guo, P.; Fan, H. Nearshore Ship Detection in PolSAR Images by Integrating Superpixel-Level GP-PNF and Refined Polarimetric Decomposition. Remote Sens. 2024, 16, 1095. [Google Scholar] [CrossRef]
  8. Du, L.; Wang, P.; Liu, H.; Pan, M.; Chen, F.; Bao, Z. Bayesian spatiotemporal multitask learning for radar HRRP target recognition. IEEE Trans. Signal Process. 2011, 59, 3182–3196. [Google Scholar] [CrossRef]
  9. Pan, M.; Du, L.; Wang, P.; Liu, H.; Bao, Z. Noise-robust modification method for Gaussian-based models with application to radar HRRP recognition. IEEE Geosci. Remote Sens. Lett. 2012, 10, 558–562. [Google Scholar] [CrossRef]
  10. Yoon, S.W.; Kim, S.B.; Jung, J.H.; Cha, S.B.; Baek, Y.S.; Koo, B.T.; Choi, I.O.; Park, S.H. Efficient classification of birds and drones considering real observation scenarios using FMCW radar. J. Electromagn. Eng. Sci. 2021, 21, 270–281. [Google Scholar] [CrossRef]
  11. Han, L.; Feng, C. High-Resolution Imaging and Micromotion Feature Extraction of Space Multiple Targets. IEEE Trans. Aerosp. Electron. Syst. 2023, 59, 6278–6291. [Google Scholar]
  12. Li, K.m.; Liang, X.j.; Zhang, Q.; Luo, Y.; Li, H.j. Micro-Doppler signature extraction and ISAR imaging for target with micromotion dynamics. IEEE Geosci. Remote Sens. Lett. 2010, 8, 411–415. [Google Scholar] [CrossRef]
  13. Luo, J.h.; Wang, Z.y. A review of development and application of UAV detection and counter technology. J. Control Decis. 2022, 37, 530–544. [Google Scholar]
  14. Molchanov, P.; Harmanny, R.I.; de Wit, J.J.; Egiazarian, K.; Astola, J. Classification of small UAVs and birds by micro-Doppler signatures. Int. J. Microw. Wirel. Technolog. 2014, 6, 435–444. [Google Scholar] [CrossRef]
  15. Ren, J.; Jiang, X. Regularized 2-D complex-log spectral analysis and subspace reliability analysis of micro-Doppler signature for UAV detection. Pattern Recognit. 2017, 69, 225–237. [Google Scholar] [CrossRef]
  16. Ritchie, M.; Fioranelli, F.; Borrion, H.; Griffiths, H. Multistatic micro-Doppler radar feature extraction for classification of unloaded/loaded micro-drones. IET Radar Sonar Navig. 2017, 11, 116–124. [Google Scholar] [CrossRef]
  17. He, K.; Zhang, X.; Ren, S.; Sun, J. Deep Residual Learning for Image Recognition. In Proceedings of the IEEE Conference on Computer Vision and Pattern Recognition, Las Vegas, Nevada, USA, 27–30 June 2016. [Google Scholar]
  18. Krizhevsky, A.; Sutskever, I.; Hinton, G.E. ImageNet classification with deep convolutional neural networks. Commun. ACM 2017, 60, 84–90. [Google Scholar] [CrossRef]
  19. Szegedy, C.; Liu, W.; Jia, Y.; Sermanet, P.; Reed, S.; Anguelov, D.; Erhan, D.; Vanhoucke, V.; Rabinovich, A. Going Deeper with Convolutions. In Proceedings of the IEEE Conference on Computer Vision and Pattern Recognition, Boston, MA, USA, 7–12 June 2015. [Google Scholar]
  20. Simonyan, K.; Zisserman, A. Very deep convolutional networks for large-scale image recognition. arXiv 2014, arXiv:1409.1556. [Google Scholar]
  21. Iandola, F.N.; Han, S.; Moskewicz, M.W.; Ashraf, K.; Dally, W.J.; Keutzer, K. SqueezeNet: AlexNet-level accuracy with 50x fewer parameters and <0.5 MB model size. arXiv 2016, arXiv:1602.07360. [Google Scholar]
  22. Oh, H.M.; Lee, H.; Kim, M.Y. Comparing Convolutional Neural Network(CNN) models for machine learning-based drone and bird classification of anti-drone system. In Proceedings of the 2019 19th International Conference on Control, Automation and Systems (ICCAS), Jeju, Republic of Korea, 15–18 October 2019; pp. 87–90. [Google Scholar]
  23. Liu, Y.; Liu, J. Recognition and classification of rotorcraft by micro-Doppler signatures using deep learning. In Lecture Notes in Computer Science; Springer: Cham, Switzerland, 2018; pp. 141–152. [Google Scholar]
  24. Hanif, A.; Muaz, M. Deep Learning Based Radar Target Classification Using Micro-Doppler Features. In Proceedings of the 2021 Seventh International Conference on Aerospace Science and Engineering (ICASE), Islamabad, Pakistan, 14–16 December 2021; pp. 1–6. [Google Scholar]
  25. Kim, B.K.; Kang, H.S.; Park, S.O. Drone Classification Using Convolutional Neural Networks With Merged Doppler Images. IEEE Geosci. Remote Sens. Lett. 2017, 14, 38–42. [Google Scholar] [CrossRef]
  26. Kim, J.H.; Kwon, S.Y.; Kim, H.N. Spectral-Kurtosis and Image-Embedding Approach for Target Classification in Micro-Doppler Signatures. Electronics 2024, 13, 376. [Google Scholar] [CrossRef]
  27. Liu, L.; Li, Y. PolSAR Image Classification with Active Complex-Valued Convolutional-Wavelet Neural Network and Markov Random Fields. Remote Sens. 2024, 16, 1094. [Google Scholar] [CrossRef]
  28. Takeki, A.; Trinh, T.T.; Yoshihashi, R.; Kawakami, R.; Iida, M.; Naemura, T. Combining deep features for object detection at various scales: Finding small birds in landscape images. IPSJ Trans. Comput. Vis. Appl. 2016, 8, 1–7. [Google Scholar] [CrossRef]
  29. Zhang, H.; Diao, S.; Yang, Y.; Zhong, J.; Yan, Y. Multi-scale image recognition strategy based on convolutional neural network. J. Comput. Electron. Inf. Manag. 2024, 12, 107–113. [Google Scholar] [CrossRef]
  30. Wang, R.; Ding, F.; Chen, J.W.; Liu, B.; Zhang, J.; Jiao, L. SAR Image Change Detection Method via a Pyramid Pooling Convolutional Neural Network. In Proceedings of the IEEE International Geoscience and Remote Sensing Symposium, Waikoloa, HI, USA, 26 September–2 October 2020; pp. 312–315. [Google Scholar]
  31. Lin, T.Y.; Dollar, P.; Girshick, R.; He, K.; Hariharan, B.; Belongie, S. Feature Pyramid Networks for Object Detection. In Proceedings of the IEEE Conference on Computer Vision and Pattern Recognition, Honolulu, HI, USA, 21–26 July 2017. [Google Scholar]
  32. Hong, M.; Choi, J.; Kim, G. StyleMix: Separating Content and Style for Enhanced Data Augmentation. In Proceedings of the IEEE Conference on Computer Vision and Pattern Recognition, Nashville, TN, USA, 20–25 June 2021; pp. 14862–14870. [Google Scholar]
  33. Seyfioğlu, M.S.; Gürbüz, S.Z. Deep Neural Network Initialization Methods for Micro-Doppler Classification with Low Training Sample Support. IEEE Geosci. Remote Sens. Lett. 2017, 14, 2462–2466. [Google Scholar] [CrossRef]
  34. Weishi, C.; Liu, J.; Chen, X.; Li, J. Non-cooperative UAV target recognition in low-altitude airspace based on motion model. J. B. Univ. Aeronaut. Astronaut. 2019, 45, 687–694. [Google Scholar]
  35. Liu, J.; Xu, Q.; Chen, W. Motion feature extraction and ensembled classification method based on radar tracks for drones. J. Syst. Eng. Electron. 2023, 45, 3122. [Google Scholar]
  36. Sun, Y.; Ren, G.; Qu, L.; Liu, Y. Classification of rotor UAVs based on dual-channel GoogLeNet network. Telecommun. Eng. 2022, 62, 1106. [Google Scholar]
  37. He, S.; Wang, W.; Wang, Z.; Xu, X.; Yang, Y.; Wang, X.; Shen, H.T. Category Alignment Adversarial Learning for Cross-Modal Retrieval. IEEE Trans. Knowl. Data Eng. 2023, 35, 4527–4538. [Google Scholar] [CrossRef]
  38. Tian, X.; Bai, X.; Zhou, F. Recognition of Micro-Motion Space Targets Based on Attention-Augmented Cross-Modal Feature Fusion Recognition Network. IEEE Trans. Geosci. Remote Sens. 2023, 61, 1–9. [Google Scholar] [CrossRef]
  39. Wang, M.; Sun, Y.; Xiang, J.; Sun, R.; Zhong, Y. Joint Classification of Hyperspectral and LiDAR Data Based on Adaptive Gating Mechanism and Learnable Transformer. Remote Sens. 2024, 16, 1080. [Google Scholar] [CrossRef]
  40. Vaswani, A.; Shazeer, N.; Parmar, N.; Uszkoreit, J.; Jones, L.; Gomez, A.N.; Kaiser, L.u.; Polosukhin, I. Attention is All you Need. In Proceedings of the Advances in Neural Information Processing Systems 30: Annual Conference on Neural Information Processing Systems 2017, Long Beach, CA, USA, 4–9 December 2017; Volume 30. [Google Scholar]
  41. Zhang, S.; Li, B.; Yin, C. Cross-modal sentiment sensing with visual-augmented representation and diverse decision fusion. Sensors 2021, 22, 74. [Google Scholar] [CrossRef] [PubMed]
  42. Liang, X.; Qian, Y.; Guo, Q.; Cheng, H.; Liang, J. AF: An Association-Based Fusion Method for Multi-Modal Classification. IEEE Trans. Pattern Anal. Mach. Intell. 2022, 44, 9236–9254. [Google Scholar] [CrossRef] [PubMed]
  43. Nguyen, D.; Nguyen, D.T.; Zeng, R.; Nguyen, T.T.; Tran, S.N.; Nguyen, T.; Sridharan, S.; Fookes, C. Deep Auto-Encoders with Sequential Learning for Multimodal Dimensional Emotion Recognition. IEEE Trans. Multimed. 2022, 24, 1313–1324. [Google Scholar] [CrossRef]
  44. Hochreiter, S.; Schmidhuber, J. Long Short-Term Memory. Neural Comput. 1997, 9, 1735–1780. [Google Scholar] [CrossRef]
  45. Li, F.; Luo, J.; Wang, L.; Liu, W.; Sang, X. GCF2-Net: Global-aware cross-modal feature fusion network for speech emotion recognition. Front. Neurosci. 2023, 17, 1183132. [Google Scholar] [CrossRef] [PubMed]
  46. Hosseinpour, H.; Samadzadegan, F.; Javan, F.D. CMGFNet: A deep cross-modal gated fusion network for building extraction from very high-resolution remote sensing images. ISPRS J. Photogramm. Remote Sens. 2022, 184, 96–115. [Google Scholar] [CrossRef]
  47. Shou, Y.; Cao, X.; Meng, D.; Dong, B.; Zheng, Q. A Low-rank Matching Attention based Cross-modal Feature Fusion Method for Conversational Emotion Recognition. arXiv 2023, arXiv:2306.17799. [Google Scholar]
  48. Lymburn, T.; Algar, S.D.; Small, M.; Jüngling, T. Reservoir computing with swarms. Chaos Interdiscip. J. Nonlinear Sci. 2021, 31, 033121. [Google Scholar] [CrossRef]
  49. Chieng, H.H.; Wahid, N.; Ong, P.; Perla, S.R.K. Flatten-T Swish: A thresholded ReLU-Swish-like activation function for deep learning. Int. J. Adv. Intell. Inform. 2018, 4, 76–86. [Google Scholar] [CrossRef]
  50. Paszke, A.; Gross, S.; Massa, F.; Lerer, A.; Bradbury, J.; Chanan, G.; Killeen, T.; Lin, Z.; Gimelshein, N.; Antiga, L.; et al. PyTorch: An Imperative Style, High-Performance Deep Learning Library. In Advances in Neural Information Processing Systems; Curran Associates, Inc.: Red Hook, NY, USA, 2019; Volume 32. [Google Scholar]
  51. Huang, G.; Liu, Z.; van der Maaten, L.; Weinberger, K.Q. Densely Connected Convolutional Networks. In Proceedings of the IEEE Conference on Computer Vision and Pattern Recognition, Honolulu, HI, USA, 21–26 July 2017. [Google Scholar]
  52. Tan, M.; Le, Q. Efficientnetv2: Smaller models and faster training. In Proceedings of the 38th International Conference on Machine Learning, PMLR, Virtual, 18–24 July 2021; pp. 10096–10106. [Google Scholar]
  53. Liu, Z.; Mao, H.; Wu, C.Y.; Feichtenhofer, C.; Darrell, T.; Xie, S. A convnet for the 2020s. In Proceedings of the IEEE Conference on Computer Vision and Pattern Recognition, New Orleans, LA, USA, 18–24 June 2022; pp. 11976–11986. [Google Scholar]
  54. Woo, S.; Debnath, S.; Hu, R.; Chen, X.; Liu, Z.; Kweon, I.S.; Xie, S. Convnext v2: Co-designing and scaling convnets with masked autoencoders. In Proceedings of the IEEE Conference on Computer Vision and Pattern Recognition, Vancouver, BC, Canada, 17–24 June 2023; pp. 16133–16142. [Google Scholar]
  55. Liu, X.; Chen, M.; Liang, T.; Lou, C.; Wang, H.; Liu, X. A lightweight double-channel depthwise separable convolutional neural network for multimodal fusion gait recognition. Math. Biosci. Eng. 2022, 19, 1195–1212. [Google Scholar] [CrossRef]
  56. Narotamo, H.; Dias, M.; Santos, R.; Carreiro, A.V.; Gamboa, H.; Silveira, M. Deep learning for ECG classification: A comparative study of 1D and 2D representations and multimodal fusion approaches. Biomed. Signal Process. Control 2024, 93, 106141. [Google Scholar] [CrossRef]
  57. Van der Maaten, L.; Hinton, G. Visualizing data using t-SNE. J. Mach. Learn. Res. 2008, 9, 2579–2605. [Google Scholar]
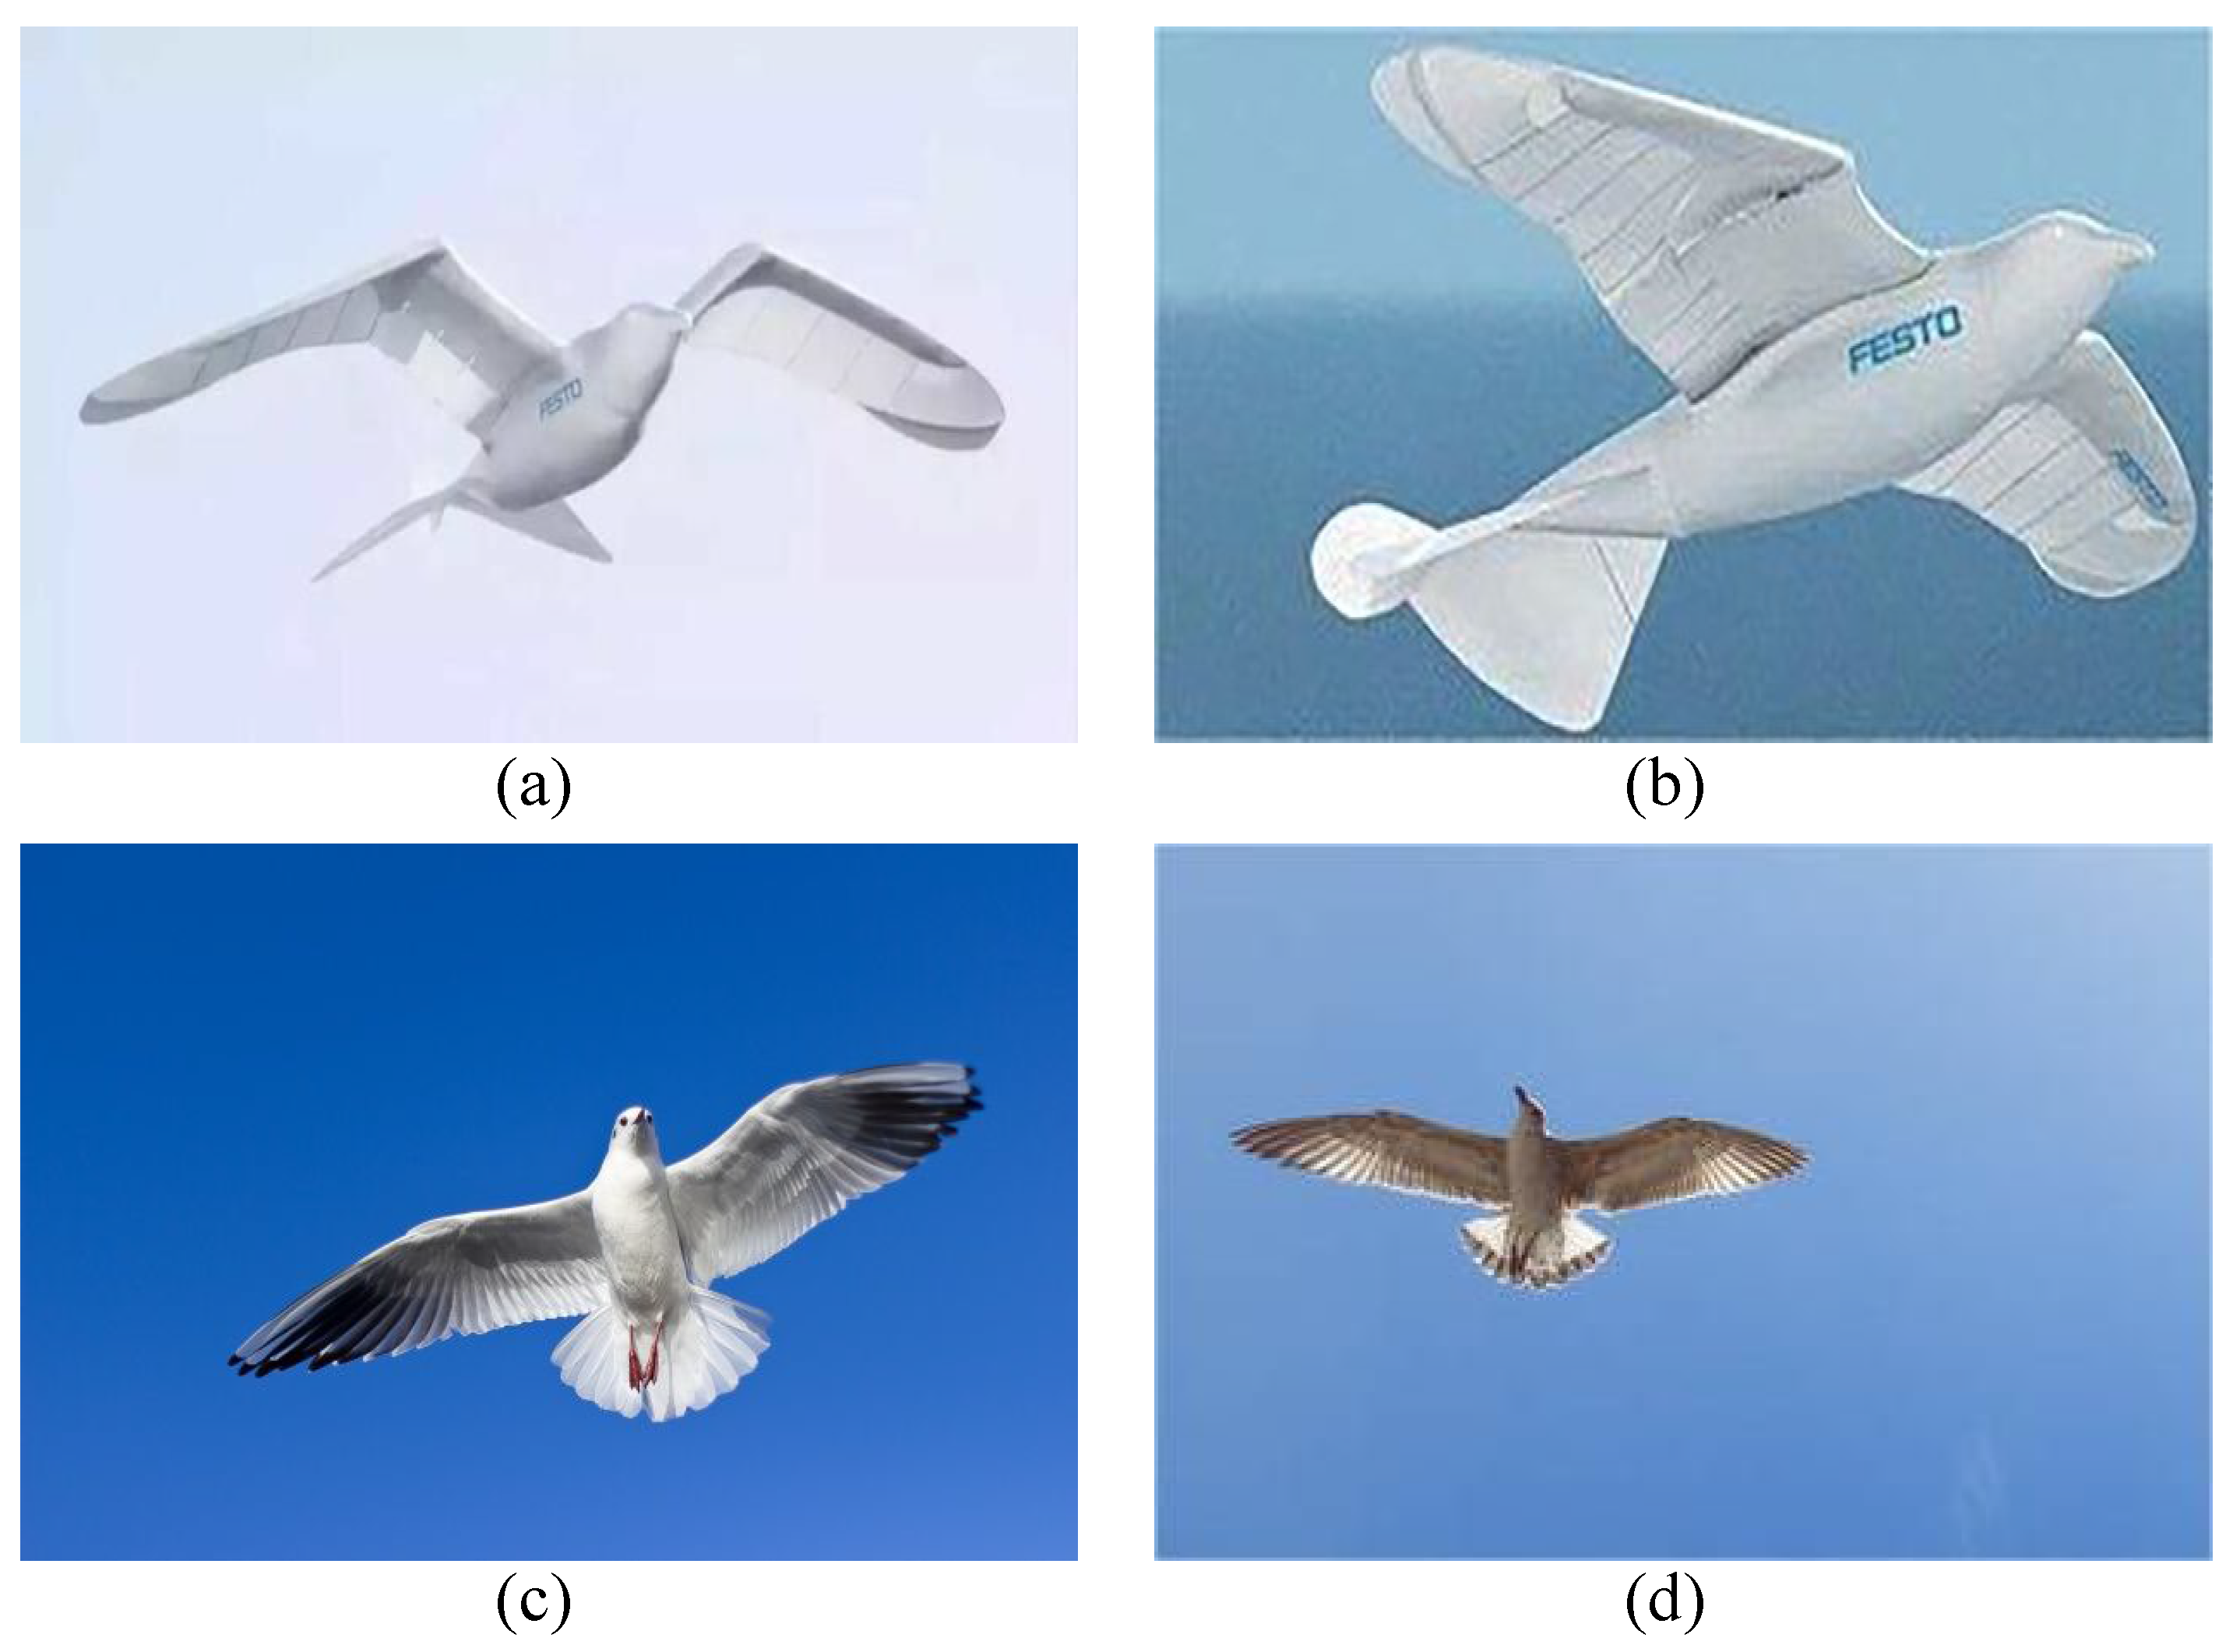
Figure 1. Optical natural image dataset samples of bionic drones and birds. Images in (a,b) are bionic drones, and those in (c,d) are birds.
Remotesensing 16 03121 g001
Figure 2. The general architecture of the proposed CSAFF method. It consists of feature extractors (Resnet2d and Resnet1d), the semantic alignment module (① SAM, which aims to explore the consistent semantics of cross-modal features), the feature fusion module (② FFM, which fully fuses cross-modal features to enhance the model’s recognition performance), and the classifier.
Remotesensing 16 03121 g002
Figure 3. Motion behavior feature images of bionic drones and birds. Graphs in (a,b) are for bionic drones, and those in (c,d) are for birds.
Remotesensing 16 03121 g003
Figure 4. The components of Resnet2d.
Remotesensing 16 03121 g004
Figure 5. Illustration of semantic alignment module (SAM).
Remotesensing 16 03121 g005
Figure 6. Illustration of feature fusion module (FFM).
Remotesensing 16 03121 g006
Figure 7. T-SNE visualization results of different methods, with purple and yellow markers representing bionic drone and bird samples, respectively. (a) Resnet34. (b) Resnet50. (c) Resnet101. (d) Densenet-121. (e) Efficientnet-V2_m. (f) ConvNeXt_s. (g) ConvNeXt-V2_s. (h) DC-DSCNN. (i) GRU + Alexnetatt. (j) CSAFF (Ours).
Remotesensing 16 03121 g007
Figure 8. ROC curves and AUC values of different methods.
Remotesensing 16 03121 g008
Figure 9. Effect of different hyperparameters α , β , and γ on model performance.
Remotesensing 16 03121 g009
Table 1. Sample of Confusion_Matrix.
PredictedPositiveNegative
Actual
Positive T P F N
Negative F P T N
Table 2. Comparison of recognition results for different algorithms.
MethodAccuracyPrecisionRecallF1_ScoreConfusion_MatrixParam. (M)Inf. Time (ms)
Resnet34 [17]87.75%87.90%87.75%87.79% 87.50 % 12.50 % 12.08 % 87.92 % 21.300.37
Resnet50 [17]88.41%88.39%88.41%88.36% 83.33 % 16.67 % 8.05 % 91.95 % 23.570.44
Resnet101 [17]88.93%89.01%88.93%88.96% 88.14 % 11.86 % 10.51 % 89.49 % 42.610.70
Densenet-121 [51]89.20%89.26%89.20%89.22% 88.14 % 11.86 % 10.07 % 89.93 % 7.040.51
Efficientnet-V2_m [52]89.72%89.72%89.72%89.68% 84.94 % 15.06 % 6.94 % 93.06 % 53.800.76
ConvNeXt_s [53]89.33%89.31%89.33%89.31% 85.90 % 14.10 % 8.28 % 91.72 % 27.840.56
ConvNeXt-V2_s [54]89.99%89.97%89.99%89.97% 86.54 % 13.46 % 7.61 % 92.39 % 27.850.60
DC-DSCNN [55]91.70%91.76%91.70%91.72% 91.35 % 8.65 % 8.05 % 91.95 % 2.060.13
GRU + Alexnetatt [56]92.49%92.49%92.49%92.49% 90.71 % 9.29 % 6.26 % 93.74 % 38.480.38
CSAFF (Ours)95.25%95.30%95.26%95.27% 95.51 % 4.49 % 4.92 % 95.08 % 29.030.46
Table 3. Ablation studies on efficacy of different components.
Method Accuracy Precision Recall F1_Score Confusion_Matrix
Baseline92.36%92.45%92.36%92.38% 92.63 % 7.37 % 7.83 % 92.17 %
Ours w/o FFM93.15%93.21%93.15%93.16% 93.27 % 6.73 % 6.94 % 93.06 %
Ours w/o SAM93.94%94.07%93.94%93.96% 95.19 % 4.81 % 6.94 % 93.06 %
Ours (Full)95.25%95.30%95.26%95.27% 95.51 % 4.49 % 4.92 % 95.08 %
Table 4. Ablation studies on the single-modality decomposition of the proposed method.
MethodAccuracyPrecisionRecallF1_ScoreConfusion_MatrixParam. (M)Inf. Time (ms)
Single Img_ModalResnet5088.41%88.39%88.41%88.36% 83.33 % 16.67 % 8.05 % 91.95 % 23.570.44
Single Seq_ModalResnet1888.93%89.18%88.93%88.98% 90.06 % 9.94 % 11.86 % 88.14 % 4.380.10
Full_ModalCSAFF (Ours)95.25%95.30%95.26%95.27% 95.51 % 4.49 % 4.92 % 95.08 % 29.030.46
Disclaimer/Publisher’s Note: The statements, opinions and data contained in all publications are solely those of the individual author(s) and contributor(s) and not of MDPI and/or the editor(s). MDPI and/or the editor(s) disclaim responsibility for any injury to people or property resulting from any ideas, methods, instructions or products referred to in the content.