Article

Semi-Automatic Detection of Ground Displacement from Multi-Temporal Sentinel-1 Synthetic Aperture Radar Interferometry Analysis and Density-Based Spatial Clustering of Applications with Noise in Xining City, China

1
School of Geography and Information Engineering, China University of Geosciences, Wuhan 430078, China
2
No. 1 Geological Team of Shandong Provincial Bureau of Geology and Mineral Resources, Jinan 250014, China
3
Key Laboratory of Cableways Intelligent Deformation Monitoring and Smart Airport Construction of Shandong Provincial Bureau of Geology & Mineral Resources, Jinan 250013, China
4
Shandong Provincial Geology Construction Ltd., Jining 272100, China
5
Key Laboratory of Geological Survey and Evaluation of Ministry of Education, China University of Geosciences, Wuhan 430074, China
*
Author to whom correspondence should be addressed.
Remote Sens. 2024, 16(16), 3066; https://doi.org/10.3390/rs16163066
Submission received: 27 June 2024 / Revised: 13 August 2024 / Accepted: 15 August 2024 / Published: 21 August 2024
(This article belongs to the Special Issue Advances in Remote Sensing for Land Subsidence Monitoring)

Abstract

:
The China Loess Plateau (CLP) is the world’s most extensive and thickest region of loess deposits. The inherently loose structure of loess makes the CLP particularly vulnerable to geohazards such as landslides, collapses, and subsidence, resulting in substantial geological and environmental challenges. Xining City, situated at the northwest edge of the CLP, is especially prone to frequent geological hazards due to intensified human activities and natural forces. Synthetic Aperture Radar Interferometry (InSAR) has become a widely used tool for identifying landslide hazards and displacement monitoring because of its high accuracy, low cost, and wide coverage. In this study, we utilized the small baseline subset (SBAS) InSAR technique to derive the line of sight (LOS) displacements of Xining City using Sentinel-1 datasets from ascending and descending orbits between October 2014 and September 2022. By integrating LOS displacements from the two datasets, we retrieved the eastward and vertical displacements to characterize the kinematics of active slopes. To identify the active areas semi-automatically, we applied the Density-Based Spatial Clustering of Applications with Noise (DBSCAN) algorithm to cluster InSAR measurement points (IMPs). Forty-eight active slopes with areas ranging from 0.0049 to 0.5496 km2 and twenty-five subsidence-dominant areas ranging from 0.023 to 3.123 km2 were identified across Xining City. Kinematics analysis of the Jiujiawan landslide indicated that acceleration started in August 2016, likely triggered by rainfall, and continued until the landslide. The extreme rainfall in August 2022 may have pushed the Jiujiawan landslide beyond its critical threshold, leading to instability. Additionally, the study identified nine active slopes that threaten the normal operation of the Lanzhou–Xinjiang High-Speed Railway, with kinematic analysis suggesting rainfall-related accelerations. The influence of anthropogenic activities on ground displacements in loess areas was also confirmed through time series displacement analysis. Our results can be leveraged for geohazard prevention and management in Xining City. As SAR image data continue to accumulate, InSAR can serve as a regular tool for maintaining up-to-date landslide inventories, thereby contributing to more sustainable geohazard management.

1. Introduction

The Chinese Loess Plateau (CLP), covering approximately 640,000 km2, is the world’s most concentrated area of loess deposits [1]. The extensive loess deposits in this region have profoundly influenced geological, ecological, and agricultural, shaping the landscape, supporting agriculture, and impacting environmental dynamics. However, the porous and permeable nature of loess makes the CLP highly susceptible to geohazards, such as landslides, earth flows, and subsidence, particularly when triggered by seasonal rainfall, irrigation, earthquakes, or engineering activities [2,3,4]. According to statistics, approximately one-third of geological disasters in China occur in the CLP, with 85% being landslides [5,6]. Recent years have seen an increased frequency and severity of landslides in the CLP, driven by a fragile ecological environment, extreme climate conditions, and intensified human activities [7,8,9,10]. For instance, on 1 September 2022, a massive loess landslide in Huzhu, Qinghai Province, following persistent precipitation, resulted in seven fatalities [11]. Another catastrophic event on 12 May 2019, in Qinghai Province, led to the Wulong River being blocked due to a landslide on its left bank [12].
Xinning City, situated at the northwest edge of the CLP, is particularly prone to geological disasters due to its sparse vegetation, fragmented topography, intense human activities, and extreme climate conditions [13,14]. From 2002 to 2019, 93 landslides were reported in Xining’s northern and southern mountain areas, causing significant casualties and economic losses [13]. Notable incidents include the 24 July 2016 landslide in Yuanbaozi Village [15], which resulted in four deaths and the destruction of three houses, and the 15 September 2022 Jiujiawan landslide that damaged two viaduct piers of the Lanzhou–Xinjiang High-Speed Railway (LXHR), leading to a partial suspension of the railway [16]. Land reclamation activities, including land leveling for construction or agriculture, significantly affect the stability of loess slopes, particularly with the rapid urban expansion in the CLP [17,18,19]. Therefore, detecting and monitoring the kinematics of loess slopes in Xining City is crucial.
Interferometric Synthetic Aperture Radar (InSAR), known for its all-weather capabilities, high spatial–temporal resolution, and extensive coverage, has been widely used in ground displacement monitoring [20,21,22,23]. Multi-temporal InSAR (MT-InSAR) analysis methods, e.g., permanent scatterers (PS) InSAR [24], small baseline subset (SBAS) InSAR [25], and SqueeSAR [26], allow for millimeter accuracy in ground displacement monitoring. As SAR images accumulate, MT-InSAR methods have been increasingly applied in mapping and analyzing the kinematics of loess landslides and land subsidence across the CLP [27,28,29,30]. For example, 11 large active slopes were identified in Xiji County, Ningxia Province, using PS InSAR and SBAS InSAR from 2018 to 2021 [31]. Additionally, Yao et al. [32] manually identified 3286 active geological hazards, including 1135 landslides, 1691 mining collapses, 368 subsidences and 92 landfills, using 40 Sentinel-1 image data covering the Loess Plateau from January 2019 to March 2020, providing a reference for disaster prevention and control. Moreover, over 100 active landslides were detected from the Longyang Gorge dam to the Lijia Gorge dam through MT-InSAR analysis [33], highlighting reservoir impoundment and rainfall as critical factors affecting slope stabilities. In Yan’an New District, MT-InSAR revealed large-scale land subsidence and uplift due to land reclamation, which was further explained using geophysical models [34,35].
Generally, expert knowledge has been relied upon to detect active slopes from millions of InSAR measurement points, often using predefined thresholds to manually identify potential landslides [36,37,38]. However, the results from these threshold-based methods can vary significantly depending on the empirical values applied. To address this, semi-automated or automated detection methods have been proposed, such as using hotspot and spatial clustering analysis on InSAR data to identify active slopes [39]. The Density-based spatial clustering of applications with noise (DBSCAN), an unsupervised clustering algorithm, has been effectively employed to automatically identify landslide displacements in vast areas without needing predefined cluster numbers [40,41]. Wide-area landslide recognition combining InSAR and deep learning networks has also emerged as a research focus, achieving promising results [36,42,43,44]. However, deep learning methods face challenges due to their high requirements for training sample sizes and network construction.
In this study, we applied the SBAS InSAR technique to derive the ground displacement in the line of sight (LOS) directions from the ascending and descending Sentinel-1 dataset acquired between October 2014 and September 2022. The DBSCAN algorithm was used to cluster InSAR displacement rate maps, enabling the detection of potential geohazards in Xining City, Qinghai Province. We then integrated the LOS displacements and converted them into two-dimensional (2D) time series displacements in the eastward and vertical directions. This approach allowed us to investigate the kinematics of active slopes, including the Jiujiawan landslide and other active slopes along the LXHR.

2. Study Area and Datasets

2.1. Geological Setting of Xining City

Our study area is situated on the northwest edge of the CLP, serving as a transitional zone between the CLP and the Qinghai–Tibet Plateau. It includes four districts, Chengdong, Chengzhong, Chengxi, and Chengbei, with an administrative area of 457.53 km2 (Figure 1). The region lies in the middle reaches of the Huangshui River valley basin, where the terrain slopes from northwest to southeast, forming a narrow and elongated shape oriented eastward. The Huangshui River, which predominantly flows eastward, divides the mountainous areas of Xining City into northern and southern regions. Beishan Mountain has been designated as a national-level area with a high geological disaster risk since 2006 [45]. The topography of the study area is shaped by tectonic movements, river erosion, and sedimentation, resulting in higher elevations along the periphery and lower elevations in the center. The central area consists of eroded and deposited river valley plains, surrounded by low hills and ridges formed by erosion [46].
The exposed strata in the study area vary from ancient to relatively recent, including the Mesozoic Cretaceous, Cenozoic Paleogene, Neogene, and Quaternary [47] (see Figure 1b). The lithological composition mainly comprises Cenozoic Paleogene mudstone, gypsum, sandstone interbeds, loose gravel, and overlying Quaternary loess, creating conditions favorable for geological disasters. Xining City is located within the Qilian fold–thrust belt of the Qilian uplift, an area characterized by complex geological structures and diverse topography, heavily influenced by the uplift of the Qinghai–Tibet Plateau and tectonic activities. The major fault zones surrounding the area include the Laji Shan fault zone, Daban Shan fault zone, Riyue Shan fault zone, and Menyuan fault zone, all of which are active and prone to frequent seismic events. For instance, Menyuan County, north of Xining City, experienced 15 earthquakes of magnitude 4.0 or higher between 2012 and 2024, including two strong earthquakes greater than magnitude 6.0.
Xining City experiences a semi-arid continental plateau climate, characterized by cold and dry winters and relatively warm summers with intense radiation. The region receives little rainfall and is subject to significant diurnal temperature variations and a long freezing period. According to the Qinghai Statistical Yearbooks [48], the average annual precipitation in Xining is only 442.1 mm, with rainfall concentrated between June and September. During this period, monthly average rainfall exceeds 60 mm, accounting for over 70% of the total annual rainfall with August receiving the highest average rainfall at 96.0 mm. This significant seasonal variation in rainfall, coupled with concentrated precipitation, makes the area prone to catastrophic landslide events.
Figure 1. (a) Location of our study area. (b) Geological map of Xining City [49].
Remotesensing 16 03066 g001

2.2. Datasets

We collected 197 Sentinel-1 images from the ascending orbit (path 128) and 177 images from the descending orbit (path 135), covering the period from October 2014 to September 2022. Both datasets were acquired using Terrain Observation with Progressive Scans SAR (TOPSAR) mode with 5 and 20 m resolutions in the range and azimuth directions. The basic information of the two datasets is listed in Table 1, and the coverages are shown in Figure 1a. A sequential network was employed, and each image was connected with two consecutive images to generate differential interferograms (Figure 2). Precise orbit ephemeris data from the European Space Agency (ESA) were used for interferometric processing. Additionally, the ALOS World 3D 30 m (AW3D30) Digital Surface Model (DSM) was used to correct for the topography phase in differential interferograms and geocoding.

3. Methodology

The workflow of this study is shown in Figure 3. We first derived the time series displacements of Xining City in the LOS directions of the ascending and descending Sentinel-1 datasets through the SBAS InSAR analysis method. We then used the unsupervised DBSCAN algorithm to spatially cluster the InSAR measurement points (IMPs) and eliminate outlier points. The clustering results were evaluated with geomorphological features to identify potential landslide areas. Subsequently, we combined the LOS displacements from both datasets to retrieve the eastward and vertical displacements using the multidimensional SBAS method. Thereafter, we analyzed the kinematics of typical active loess slopes to gain insights into their behavior.

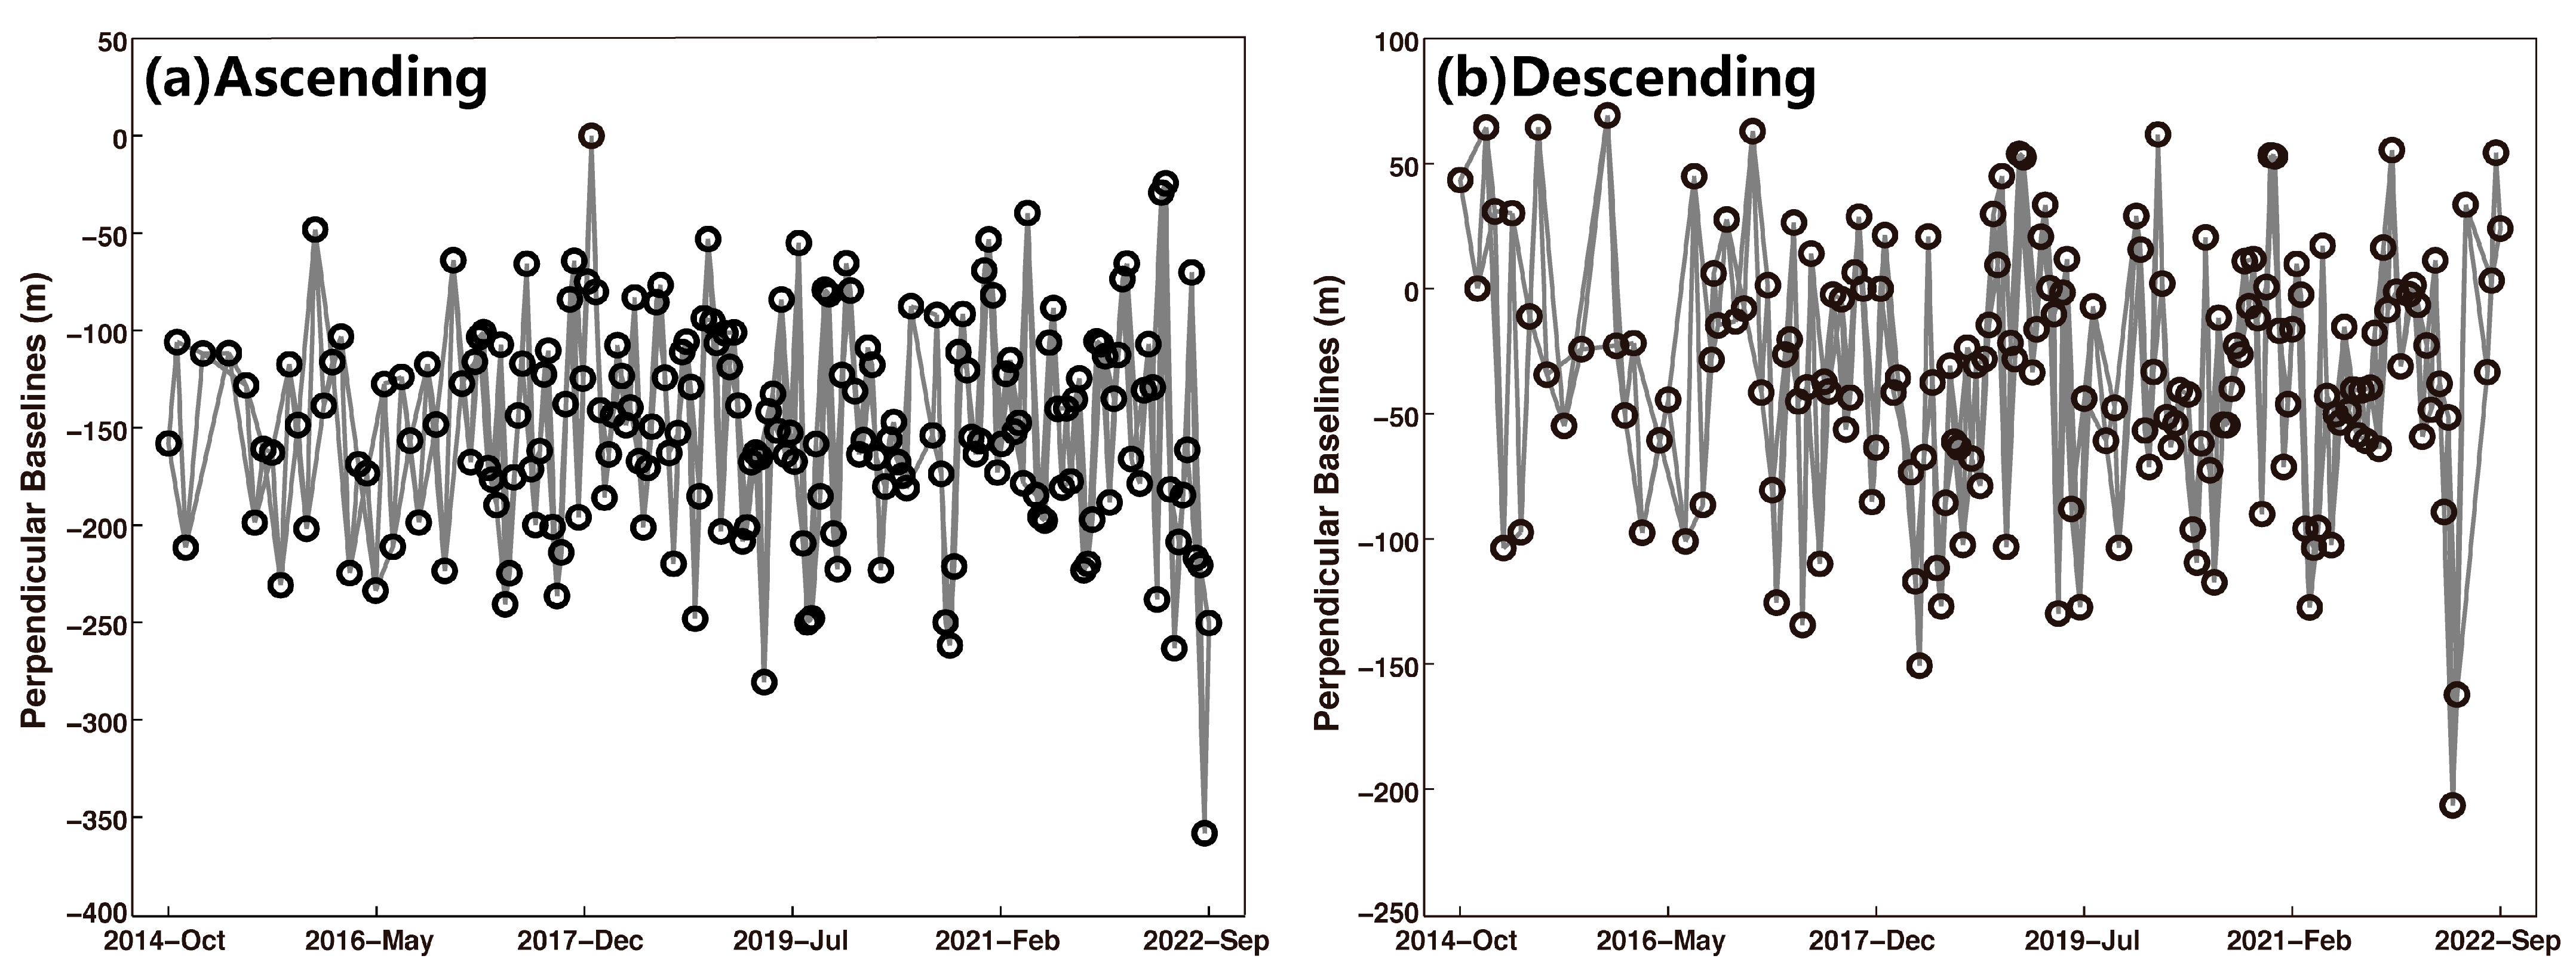
3.1. SBAS InSAR Analysis

We conducted the differential InSAR with GAMMA software [50] and the StaMPS [51] SBAS InSAR for the ascending and descending Sentinel-1 SAR datasets. Initially, images acquired from 2 January 2018, were selected as references for ascending and descending datasets (see Table 1). Secondary images for each dataset were co-registered to the corresponding reference image with an enhanced spectral diversity method aided by AW3D DSM and precise orbit information, achieving a precision of 0.001 pixels. Differential interferograms were then generated using multi-look factors of 4 in range and 1 in azimuth, resulting in a resolution of approximately 20 m. The time series analysis was then performed using StaMPS SBAS InSAR analysis. Amplitude dispersion values (<0.6) and temporal coherence (>0.3) were combined to select pixels for time series analysis [52]. We establish the initial unwrapping network using a triangulated irregular network, refined by removing low coherence through the all-pairs-shortest-path method [53]. The Minimum Cost Flow method was then employed to recover unwrapped phases. The phase unwrapping errors in the temporal dimension were corrected using closure phase information [21]. Finally, orbital trends, topography residuals, and atmospheric phase components were removed based on their spatial–temporal characteristics [54]. The time series displacements for each pixel were retrieved using the following equation:
A V los = Φ , V los = A 1 Φ , d los t i = d los t i 1 + v los t i Δ t i
where matrix A is constructed based on the time intervals Δ t i between successive SAR images; Φ is the unwrapped phase vector; Vlos denotes the vector consisting of unknown displacement rates v los t i ; and d los i is the cumulative displacement at time ti.

3.2. 2D Displacements Extraction

The measured displacement rate of a given pixel is the projection of vertical, northward, and eastward displacement rates onto the LOS direction [55].
V los = V U cos θ + V N sin θ cos φ V E sin θ sin φ = S V
where Vlos is the LOS displacement rate; VU, VN, and VE are the vertical, northward, and eastward ground displacement rates, respectively; and θ and φ are the incidence and azimuth angles. S = [cosθ, sin θ cos φ , − sin θ sin φ ] and V = [VU, VN, VE]T. A common practice is calculating the vertical and eastward displacement rates by neglecting the northward component when ascending and descending datasets are available using Equation (3) with the least-squares method.
[ V l o s 1 V l o s 2 ] = [ cos θ 1 sin θ 1 sin φ 1 cos θ 2 sin θ 2 sin φ 2 ] [ V U V E ]
The spatial positions and acquisition times of IMPs from ascending and descending orbits are different. First, a resampling procedure was performed to co-locate pixels from the two datasets. Pixels falling in a 30 diameter were averaged. We then applied the multidimensional SBAS methodology to retrieve the vertical and eastward displacement time series by combining the ascending and descending measurements [56].

3.3. DBSCAN Cluster for Landslide Detection

DBSCAN is a density-based clustering algorithm that identifies high-density regions within a dataset, classifying points in sparse areas as noise [57]. The algorithm works by automatically categorizing data points into three types: core points, boundary points, or noise points. The algorithm consists of several steps: selecting core points, expanding clusters, and handling noise. Initially, an unvisited data point is selected from the dataset and labeled as a core point if the number of data points in its neighborhood exceeds a specified minimum threshold. Then, starting from core points, the algorithm adds all reachable points within the density range to the same cluster through density-reachable connections. Points that cannot be linked to any cluster are classified as noise. Once complete, the algorithm outputs the final clustering results, identifying all clusters and noise points.
DBSCAN has the advantage of handling clusters of varying shapes and sizes without predefining the number of clusters. However, it is sensitive to the choice of parameters, which depend on the dataset and can influence each other [58]. The key parameters are the radius of the ε-neighborhood (eps) for density estimation and the minimum number of points (minPts) to identify core points. Adjusting these parameters has a direct impact on the clustering results. Larger eps or smaller minPts values tend to create larger clusters, while the opposite may lead to more points classified as outliers. Two strategies were employed to address this. Firstly, IMPs from ascending and descending datasets were divided into stable and displacement clusters using a threshold of ±15 mm/yr, thus reducing the dataset volume. Secondly, the OPTICS algorithm [59] was utilized to generate a decision graph to assist in selecting the appropriate eps value. OPTICS provides an augmented cluster ordering, allowing for a better understanding of the clustering structure for specific eps values. Determining the appropriate values for the two DBSCAN parameters, eps and minPts, is challenging due to their dependence on the dataset and application scenario, as well as their interaction with each other. We set the eps values within a small range based on the OPTICS algorithm. Subsequently, we tested eps and minPts in steps of 20 and 5, respectively. Larger eps values or smaller minPts values tend to produce larger clusters, making it difficult to distinguish specific landslide displacement areas, while smaller eps values or larger minPts values may lead to some landslides with fewer displacement points being overlooked. We observed that when eps and minPts approached 200 and 20, respectively; the differences in the results were minimal. The resulting clusters were then manually classified into active slopes and subsidence areas using optical remote sensing and geomorphology characteristics.

4. Results

4.1. Mean LOS and 2D Displacement Rate Maps

Figure 4a,b show the mean LOS displacement rate maps derived from the ascending and descending Sentinel-1 datasets. The positive (blue) values represent pixels moving toward the satellite, while the negative (red) values mean the opposite. The densities of IMPs are approximately 4504 points/km2 and 5132 points/km2 for the ascending and descending Sentinel-1 datasets, respectively. The LOS displacement rates range from −69.2~42.4 mm/yr for the ascending dataset, and the rates range from −63.5~46.7 mm/yr for the descending dataset. Over 96% of the displacement rates fall between −10 and 10 mm/yr from both datasets, reflecting similar normal distributions and indicating that the overall study area remains stable. The eastward and vertical displacement rate maps are given in Figure 4c,d. The maximum displacement rates in the eastward and vertical directions of Xining City are −56.5 mm/yr and −68.2 mm/yr, with corresponding standard deviations of 3.3 mm/yr and 4.0 mm/yr, respectively. Notably, the vertical displacement rates are generally more significant than the eastward displacement rates across most regions. However, distinct westward movement signals were detected at slopes along the LXHR.

4.2. Landslide and Subsidence Detection Results

After converting the LOS displacement to two-dimensional (2D) displacement, we observed a substantial decrease in IMP densities. To address this, we detected active slopes and subsidence spots using the LOS displacement rate maps from ascending and descending Sentinel-1 datasets. The results are depicted in Figure 5a,b. We combined the detected active slopes and subsidence-dominant areas using geomorphology characteristics and 2D displacement maps (Figure 5c). In total, we identified 48 potential landslides, including 14 from the ascending dataset, 32 from the descending dataset, and 2 identified in both datasets. Additionally, 25 subsidence-dominant areas were detected. The detected active slopes in Xining City have areas ranging from 0.0049 km² to 0.5496 km². Among them, nine active slopes were detected along the LXHR, posing a threat to railway operations (Figure 5d). The subsidence signals detected are primarily associated with anthropogenic activities.

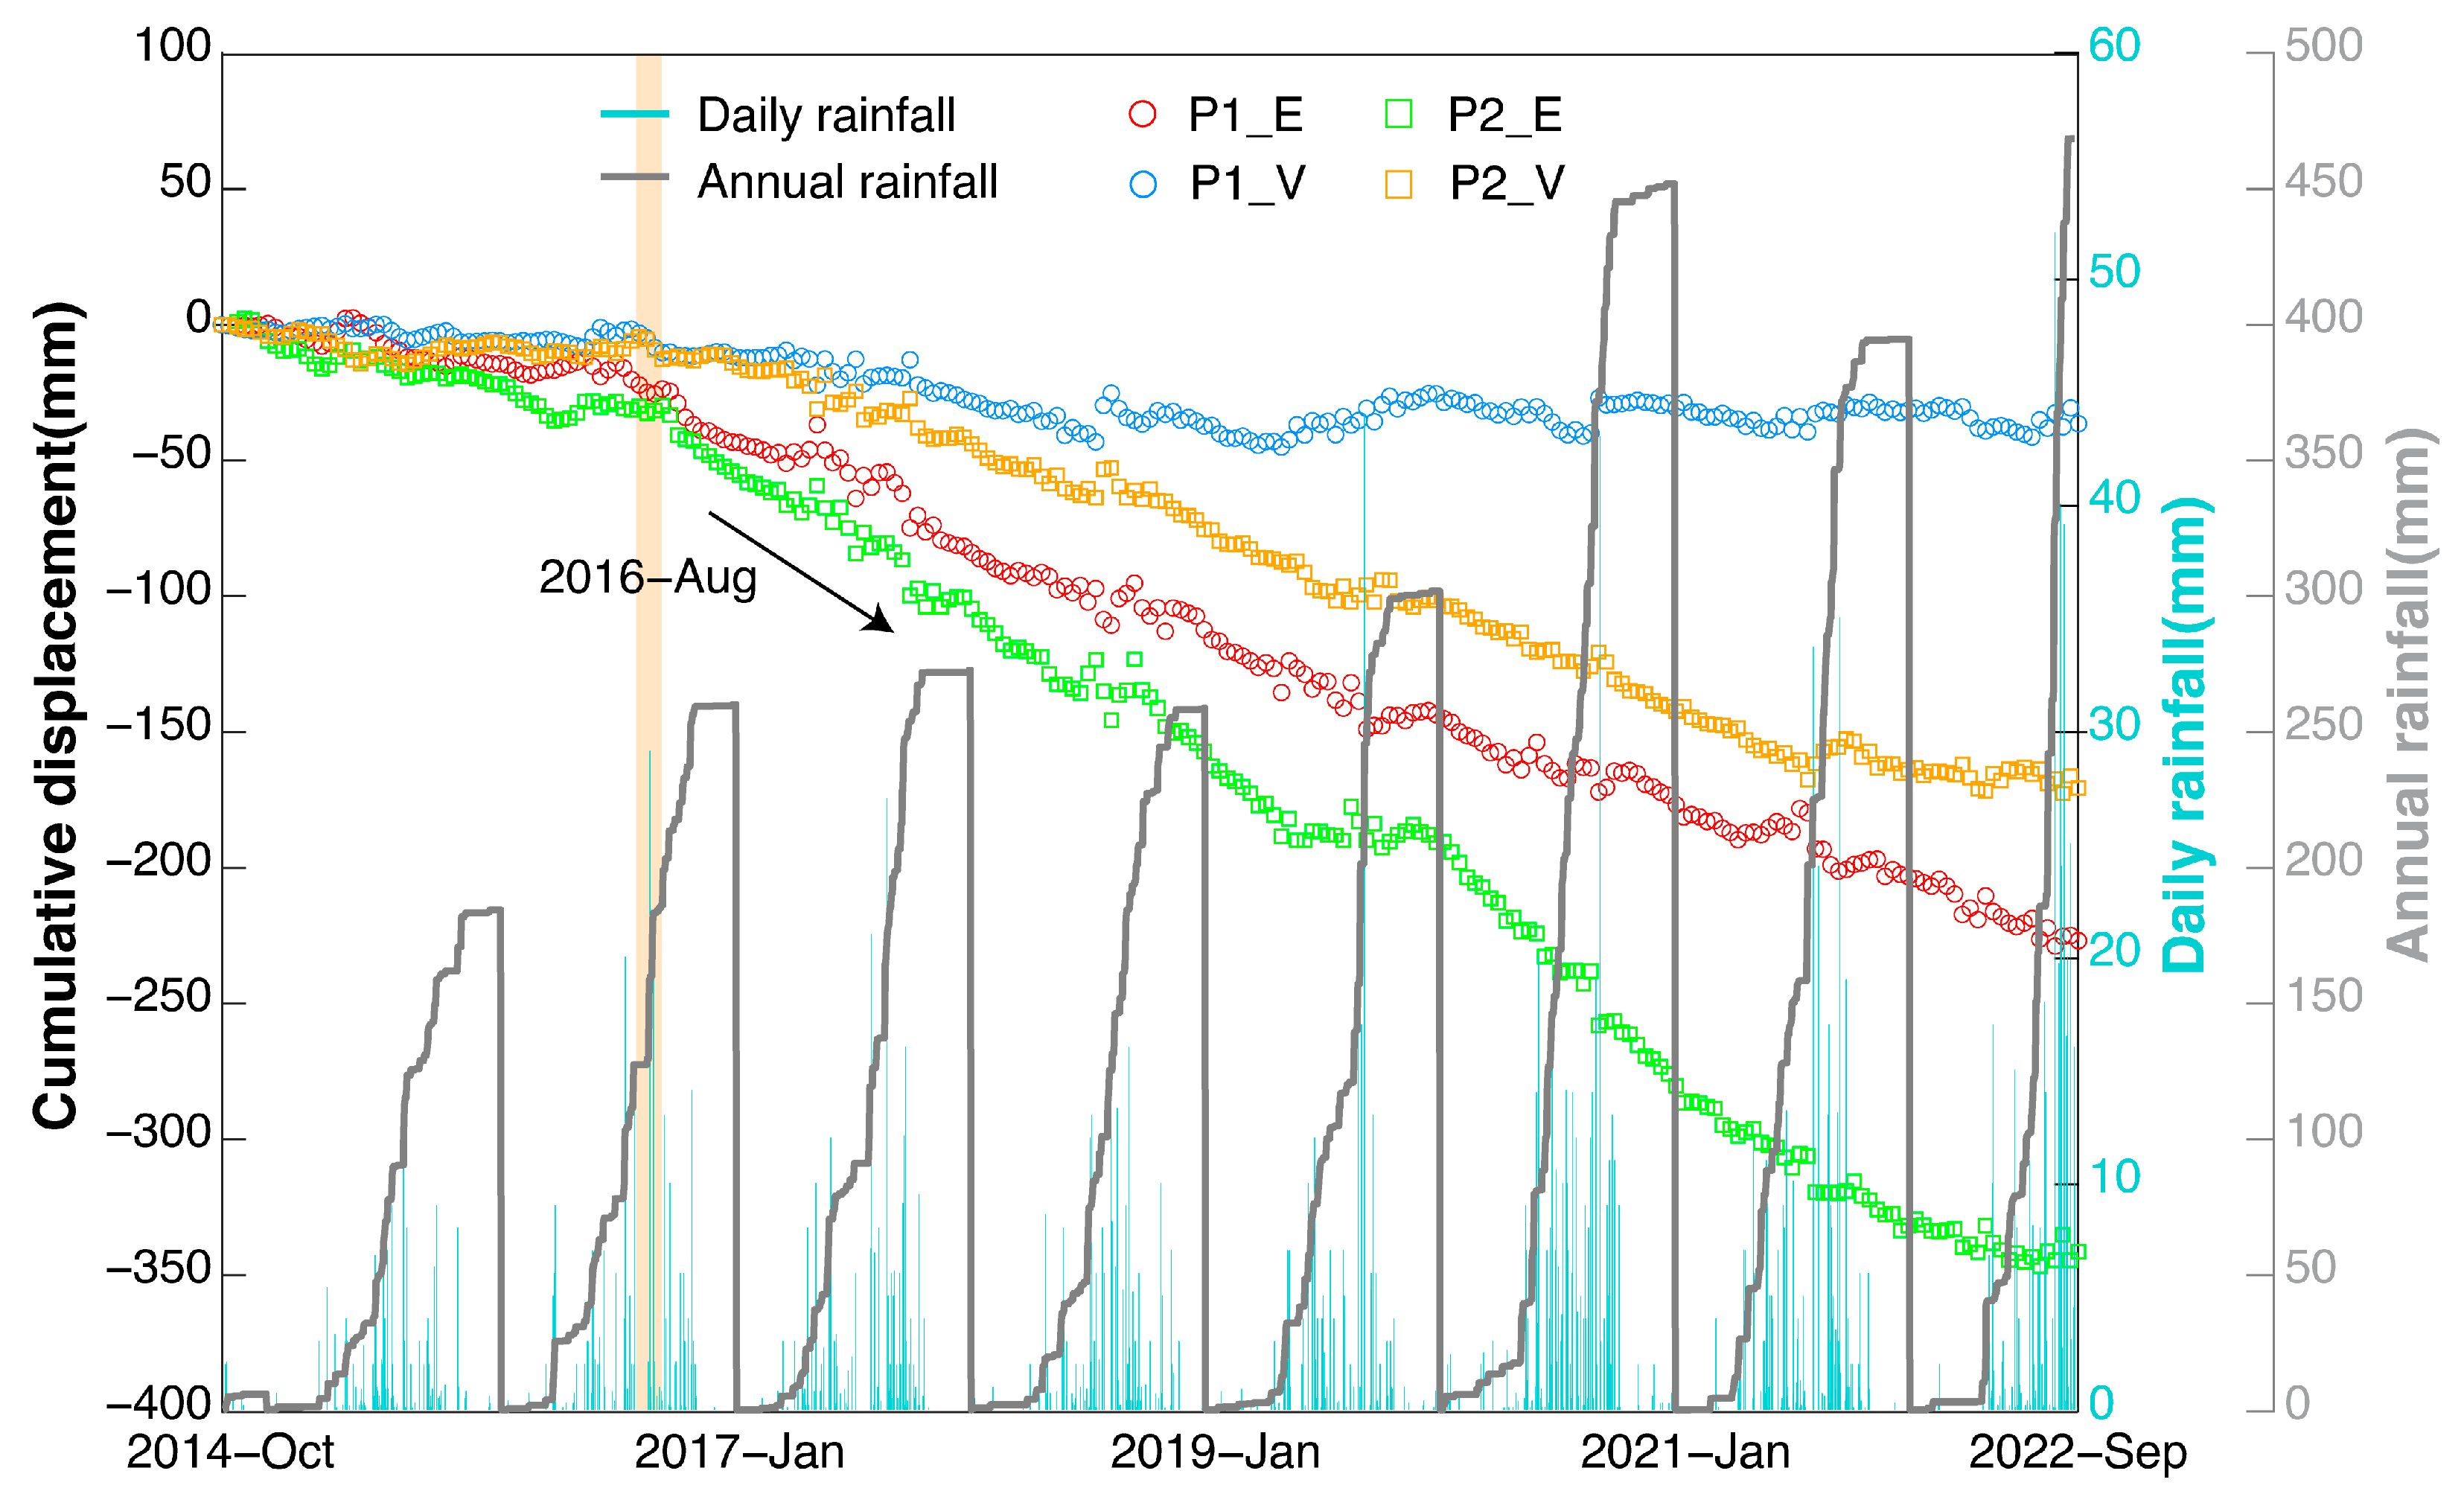
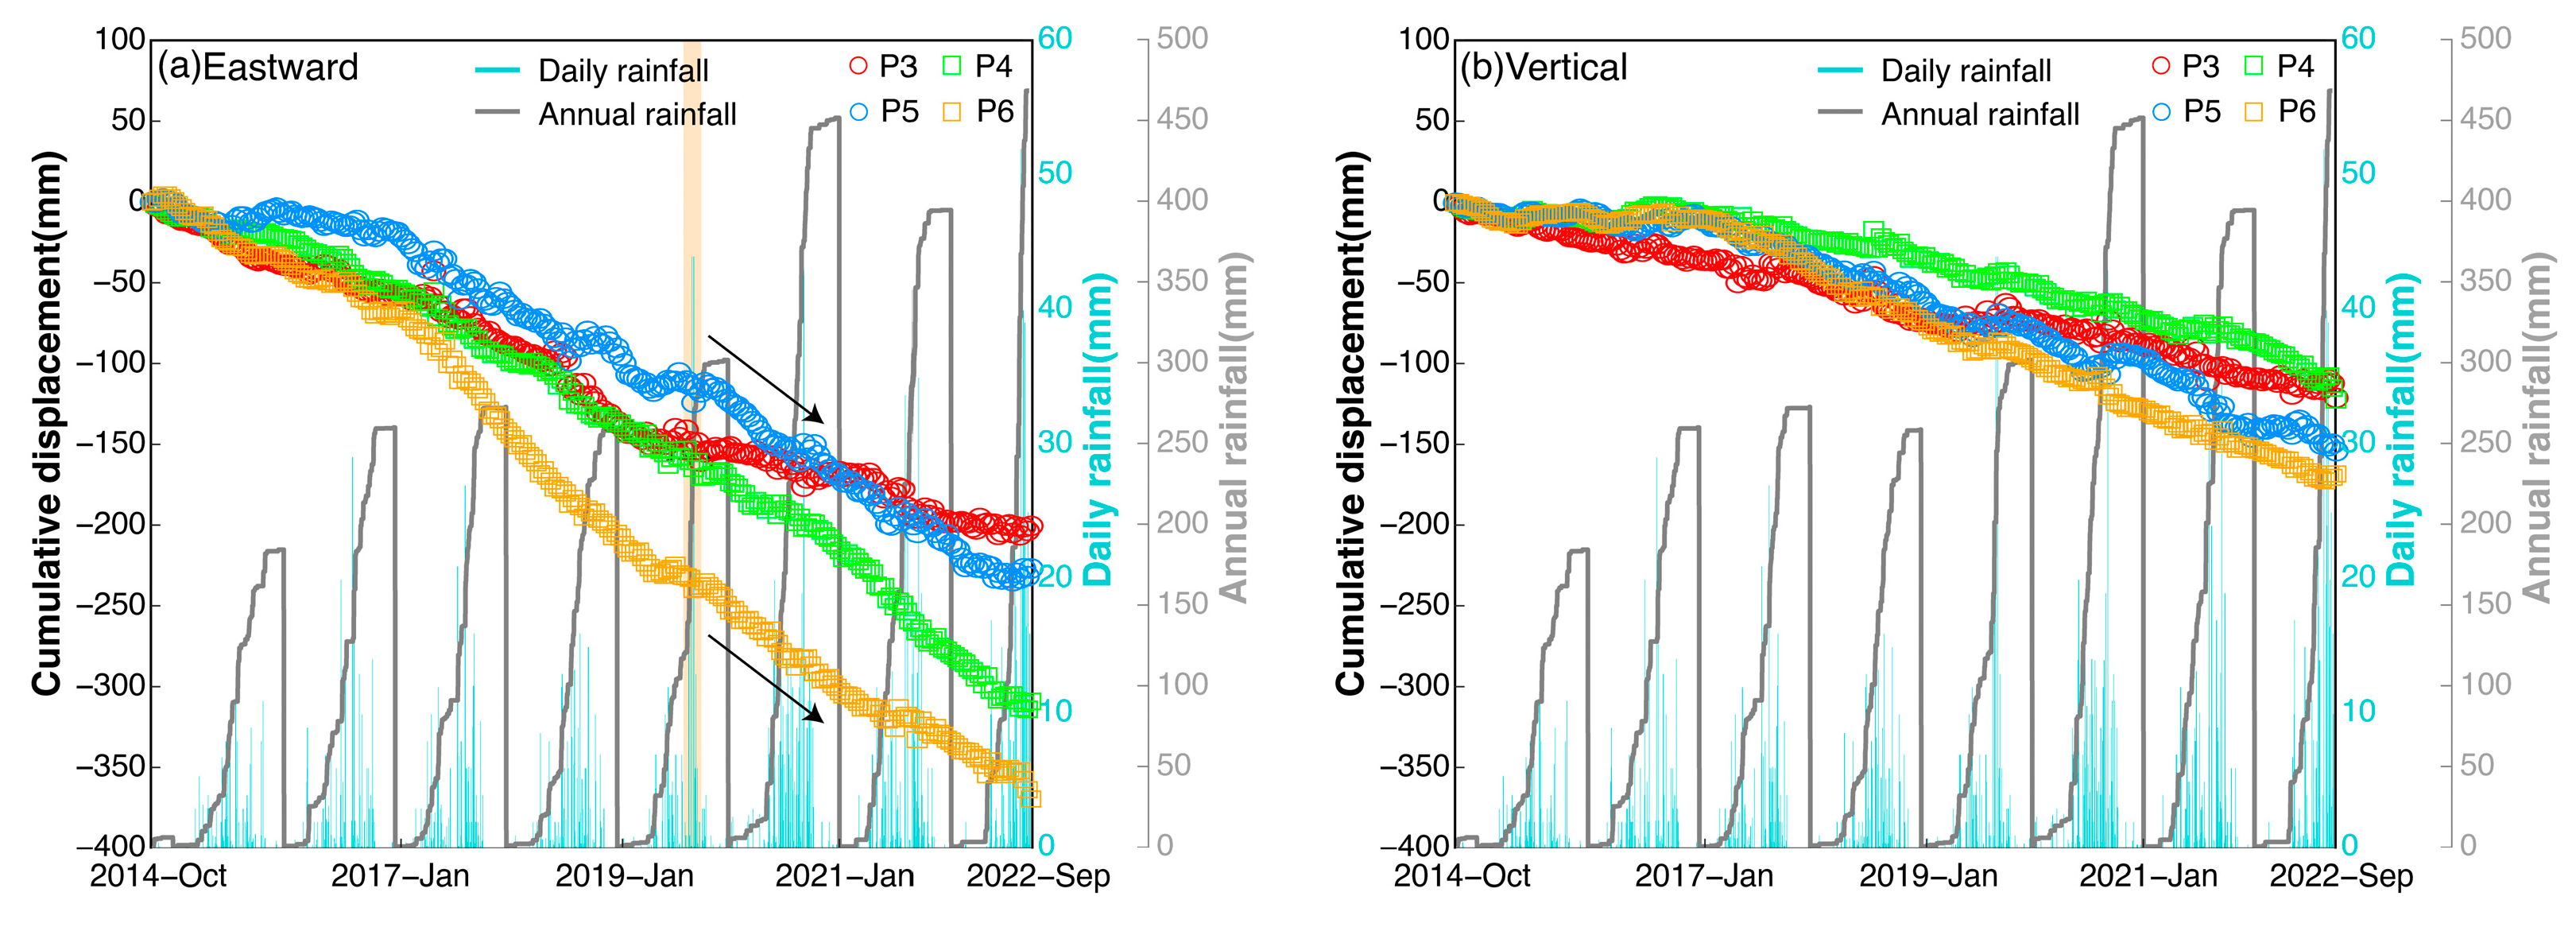
4.3. The Jiujiawan Landslide

The Jiujiawan landslide is on the eastern side of Jiujiawan Village, Chengbei District, Xining City. The landslide area primarily consists of Paleogene mudstone and gypsum-bearing sandstone, which rapidly absorb and soften when exposed to water infiltration [60]. The landslide spans a maximum width of 295 m and a height difference of 172 m, with the horizontal movement distance reaching 445 m. The total estimated volume of the landslide is approximately 2.5 × 10⁶ m3 [16,61]. The 2D and LOS displacement rate maps before the failure of the Jiujiawan landslide are depicted in Figure 6 and Figure S1, respectively. The maximum LOS displacement rates were 19.7 mm/yr and −65.5 mm/yr from the ascending and descending datasets. The opposite signs are related to the distinct observation geometries of both datasets. The eastward and vertical displacement rates were −56.5 mm/yr and −23.1 mm/yr, with displacement concentrated at the head of the slope. The displacement at P2 was most pronounced with cumulative eastward and vertical displacements of −347.1 mm and −192.8 mm. As shown in Figure 7, P1 and P2 remained relatively stable before August 2016. However, extreme rainfall in August 2016 altered the displacement trends of P1 and P2. Furthermore, the cumulative LOS displacements in Figure S3 can directly reflect the displacement history of the Jiujiawan landslide. According to reports [62], rainfall in Xining’s urban area from 1 to 21 August 2022 exceeded the historical average by 237% with multiple short but intense rainfall events (hourly rainfall exceeding 20 mm). On 18 August 2022, precipitation peaked at 39.1 mm, marking the most significant rainfall before the landslide event. Although no significant rainfall occurred on the day of the landslide or in the preceding ten days, studies suggest a delayed response between rainfall and landslide occurrences [16]. This indicates that the extreme weather conditions in August, coupled with years of cumulative displacements, pushed the slope beyond its critical state, ultimately leading to the Jiujiawan landslide.

4.4. Landslides along the LXHR

Figure 8 illustrates the eastward and vertical displacement rate maps of five typical landslides, while Figure S4 presents the corresponding LOS displacement rate maps. The observation geometry of the descending orbit proves favorable for landslide detection in this area, as it results in a high density of Measurement Points (MPs) and distinct displacement signals. Landslide L1 is approximately 1 km south of the Jiujiawan landslide, with the LXHR traversing through the lower portion of the slope. As seen in the optical image in Figure S6a, multiple arc-shaped cracks have formed in the middle of the slope. The maximum eastward and vertical displacement rates are −17.39 and −24.14 mm/yr. The time series 2D and LOS displacement of P3, located on L1, are given in Figure 9 and Figure S4, respectively. The eastward displacement of P3 is notably larger than the vertical displacement, with evident accelerations in the summer seasons, likely due to concentrated rainfall during these periods. Landslide L2 is a severely eroded slope adjacent to the LXHR. The failure of L2 could potentially lead to the loss of support of LXHR, posing a threat to the normal operation of the railway. The maximum displacement rates for L2 are −47.9 in the eastward and −19.5 mm/yr vertical directions, as depicted in Figure 8a,b. The maximum displacement rates were detected in the middle of the slope, likely related to the extensive anthropogenic activities in this area. Additionally, a road passes through the middle part of L2, as shown in Figure S6b. The cumulative displacement of P4, located on L2, reached −309.1 mm and −122.0 mm in the eastward and vertical directions between November 2014 and September 2022. The displacement trends of P4 are nearly linear, with minor fluctuations during the rainy seasons.
Landslides L3, L4, and L5 are located near the Linjiaya neighborhood in the Chengdong district, about 350 m from the Xining Railway Station. Red lines in Figure S6c highlight visible cracks in the upper sections of landslides L3 and L4. Landslide L4 displays distinct displacement signals, with maximum rates of −24.4 mm/yr in the eastward direction and −18.7 mm/yr in the vertical direction. These displacements are most pronounced in the middle of the slope. L5 is an old landslide that shows significant displacement from the middle to the lower part of the slope. The maximum displacement rates for L5 are approximately −50.6 mm/yr eastward and −29.2 mm/yr vertically. The notable westward displacement rates of L5 present a significant threat to the LXHR. As indicated by the arrows in Figure 9a and Figure S5b, accelerated displacement is observed during rainy seasons, particularly following extreme rainfall events.

4.5. Anthropogenic Activity-Related Subsidence

Urban expansion in the CLP has led to widespread subsidence in rapidly developing cities. As stated in Section 4.2, we detected twenty-five subsidence areas, including nine gully excavation and filling areas, five construction sites, nine land leveling areas, and two industrial zones. Figure 10 shows the subsidence rate maps and the corresponding Google Earth optical images of six typical subsidence zones. These areas include industrial zones, agriculture, excavation, and constructed areas. Significant uneven subsidence was observed, which may pose substantial threats to manmade structures. The maximum subsidence rate detected is 67.5 mm/yr, shown in Figure 10(a1) for the period between November 2014 and September 2022. The time series analysis for points P7 and P8 indicates that subsidence is primarily driven by anthropogenic activities. For example, accelerations are consistent with earthworks documented in Google Earth historical images, whereas the correlation between displacement and rainfall is minimal (Figure 11). Anthropogenic activities, e.g., dewatering, excavation, and irrigation, might alter the original state of the loess area, potentially leading to severe geohazards.

5. Discussion

5.1. Loess Slope Stability Impact Factors

Natural forces and anthropogenic activities jointly affect the stability of slopes [9,18,63,64]. Geological conditions provide the fundamental landslide development environment. Loess, characterized by high porosity and collapsibility, can lead to instability when rainwater infiltrates [65,66]. Mudstone, with its poor weathering resistance, becomes prone to softening and sliding when exposed to water. At the same time, sandy gravel soil, with its loose and fragmented structure, is susceptible to local instability and disintegration under similar conditions. The loess-mudstone mixture’s higher water retention capacity than pure loess adds another risk for landslide development and recurrence [67]. In our study, rainfall is a key trigger for landslide accelerations and the failure of the Jiujiawan landslide, as shown in Figure 7 and Figure 9. Rainwater infiltration decreases the shear strength of rock and soil masses, exacerbating slope displacement. Seasonal freezes and thaws also contribute to instability by affecting groundwater levels and soil strength [68].
Seismic activity further impacts slope stability. The study area has experienced significant earthquakes (Figure 1), often triggering landslides immediately or over time [69]. Earthquakes can cause surface damage and create cracks that lead to accelerated landslide displacement, especially when combined with intense rainfall in subsequent years [70,71].
Anthropogenic activities, e.g., construction, excavation, and irrigation, have a great effect on the stability of loess hill slopes. Figure 12 illustrates the LOS displacement rates of three active slopes. Figure 12(a1) shows a large multi-stage landslide in Zhangjiawan Village, characterized by a significant elevation difference and slope angle [72]. This landslide is active due to excavation of the front anti-slide section and rainfall [73]. The displacement is concentrated on the right side of H1, leading to extensive soil detachment and irregular crack formations. The maximum LOS displacement rates from the descending dataset are −36.9 mm/yr. Figure 12(b1,c1) show unstable slopes at the entrances to the LXHR Tunnel and Nanshan Tunnel. Despite reinforcement efforts, these slopes exhibit LOS displacement rates of −31.4 mm/yr and −27.4 mm/yr from the ascending and descending Sentinel-1 datasets, likely due to excavation or construction activities that have compromised slope stability. Irrigation also plays a critical role in affecting landslide stability. Increased groundwater levels in loess areas significantly decrease loess cohesion [20]. In cities such as Yan’an, extensive mountain excavation, and construction have led to consolidation and poroelastic rebound signals, posing further risks to engineering activities [19,35].

5.2. Limitations and Future Improvements

The side-looking geometry of SAR sensors introduces geometric distortions that impact the applicability of InSAR in mountainous regions. This distortion, combined with varying observation geometries, affects the sensitivity to ground displacement and can significantly influence landslide detection. In this study, we observed that many active slopes exhibit notable displacement signals in either ascending or descending orbit datasets. Therefore, combining the ascending and descending orbit measurements is helpful for regional landslide detection. To enhance our analysis, we decomposed the LOS displacements from the two Sentinel-1 datasets into eastward and vertical displacements, which enabled us to analyze the kinematics of loess landslides and subsidence. The DBSCAN algorithm, used for clustering displacement signals, improves the efficiency of geohazard identification. However, the DBSCAN algorithm is highly sensitive to parameter selection, which can affect its performance. We use decision diagrams generated by the OPTICS algorithm to assist in parameter selection, but future studies could explore other automatic parameter selection methods. We manually delineated the landslide boundaries through joint optical and geomorphic characteristics analysis. The identified landslides and subsidence can be regarded as samples for deep learning analysis, which could lead to automatic geohazard identification and susceptibility analysis. We also note that the kinematics of loess landslides vary significantly, while MT-InSAR measurements provide insights for landslide kinematics analysis. Deep learning methods could further classify these kinematics into different categories, potentially enhancing geohazard prevention and management strategies [74,75].

6. Conclusions

In this study, we utilized ascending and descending Sentinel-1 datasets from 2014 to 2022 to derive the time series displacements and rates of LOS directions in Xining City, Qinghai Province. Combined with the DBSCAN algorithm, optical satellite imagery, and geomorphology characteristics, we identified 48 active slopes and 25 subsidence-dominated regions. Notably, we detected nine slopes along the LXHR, which threaten the normal operation of the railway. We further decomposed the LOS displacements from the ascending and descending Sentinel-1 datasets into a time series of eastward and vertical displacements, facilitating a detailed study of landslide and subsidence kinematics. The maximum observed displacement rates were −56.5 mm/yr eastward and −68.2 mm/yr vertically. Time series analysis of typical slopes revealed that rainfall significantly impacts slope stability, with rainfall being a primary trigger for acceleration since August 2016 and contributing to the failure of the Jiujiawan landslide. Additionally, the rapid urban expansion in Xining City has led to anthropogenic activities, such as construction and excavation, which may cause significant compaction or consolidation of loess soils. Our study provides valuable insights into the kinematics of slopes and subsidence, offering important implications for the prevention and management of geological disasters in Xining City.

Supplementary Materials

The following supporting information can be downloaded at: https://www.mdpi.com/article/10.3390/rs16163066/s1. Figure S1: LOS displacement rate maps of the Jiujiawan landslide observed from the (a) ascending and (b) descending Sentinel-1 datasets; Figure S2: LOS cumulative displacements of P1 and P2 on the Jiujiawan landslide from the ascending and descending Sentinel-1 datasets.; Figure S3: Accumulative LOS displacements of the Jiujiawan landslide with respect to 20141026; Figure S4: LOS displacement rate maps of landslides L1–L5 along the LXHR measured from the (a) and (c) ascending and (b) and (d) descending Sentinel-1 datasets; Figure S5: Cumulative displacement of P3–P6 in the LOS directions of the ascending and descending Sentinel-1 datasets; Figure S6: Google Earth optical images of L1–L5 along the LXHR.

Author Contributions

Conceptualization, D.C. and Q.W.; methodology, D.C. and Z.S.; software, D.C.; validation, D.C., Q.W., S.Z. and Y.Z.; formal analysis, D.C.; investigation, D.C. and Y.W.; resources, D.C.; data curation, D.C.; writing—original draft preparation, D.C.; writing—review and editing, D.C., Q.W., X.S. and S.Z.; visualization, D.C.; supervision, Q.W.; funding acquisition, Y.W. and Y.Z. All authors have read and agreed to the published version of the manuscript.

Funding

This work was financially supported by the National Natural Science Foundation of China under Grant Nos. 42274111, 41931074, 42174043, and 42274113.

Data Availability Statement

The Sentinel-1 data have been made freely available by the European Space Agency and distributed and archived by the Alaska Satellite Facility, https://www.asf.alaska.edu/sentinel/ (accessed on 12 December 2023). The AW3D30 DSM are openly available for download from the Japan Aerospace Exploration Agency (JAXA), http://www.eorc.jaxa.jp/ALOS/en/aw3d30/data/index.htm (accessed on 12 May 2023).

Conflicts of Interest

Author Zhongjin Sun was employed by the company Shandong Provincial Geology Construction Ltd. The remaining authors declare that the research was conducted in the absence of any commercial or financial relationships that could be construed as a potential conflict of interest.

References

  1. Cui, Y.; Xu, C.; Xu, S.; Chai, S.; Fu, G.; Bao, P. Small-scale catastrophic landslides in loess areas of China: An example of the March 15, 2019, Zaoling landslide in Shanxi Province. Landslides 2020, 17, 669–676. [Google Scholar] [CrossRef]
  2. Zhang, D.; Wang, G. Study of the 1920 Haiyuan earthquake-induced landslides in loess (China). Eng. Geol. 2007, 94, 76–88. [Google Scholar] [CrossRef]
  3. Zhuang, J.-q.; Peng, J.-b. A coupled slope cutting—A prolonged rainfall-induced loess landslide: A 17 October 2011 case study. Bull. Eng. Geol. Environ. 2014, 73, 997–1011. [Google Scholar] [CrossRef]
  4. Guo, W.; Xu, X.; Wang, W.; Liu, Y.; Guo, M.; Cui, Z. Rainfall-triggered mass movements on steep loess slopes and their entrainment and distribution. CATENA 2019, 183, 104238. [Google Scholar] [CrossRef]
  5. Zhou, J.; Zhu, C.; Zheng, J.; Wang, X.; Liu, Z. Landslide disaster in the loess area of China. J. For. Res. 2002, 13, 157–161. [Google Scholar] [CrossRef]
  6. Guo, Z.; Tian, B.; Li, G.; Huang, D.; Zeng, T.; He, J.; Song, D. Landslide susceptibility mapping in the Loess Plateau of northwest China using three data-driven techniques-a case study from middle Yellow River catchment. Front. Earth Sci. 2023, 10, 1033085. [Google Scholar] [CrossRef]
  7. Li, Z.; Zheng, F.-l.; Liu, W.-z.; Flanagan, D.C. Spatial distribution and temporal trends of extreme temperature and precipitation events on the Loess Plateau of China during 1961–2007. Quat. Int. 2010, 226, 92–100. [Google Scholar] [CrossRef]
  8. Zhuang, J.; Peng, J.; Wang, G.; Javed, I.; Wang, Y.; Li, W. Distribution and characteristics of landslide in Loess Plateau: A case study in Shaanxi province. Eng. Geol. 2018, 236, 89–96. [Google Scholar] [CrossRef]
  9. Peng, J.; Wang, S.; Wang, Q.; Zhuang, J.; Huang, W.; Zhu, X.; Leng, Y.; Ma, P. Distribution and genetic types of loess landslides in China. J. Asian Earth Sci. 2019, 170, 329–350. [Google Scholar] [CrossRef]
  10. Xu, G.; Wu, Y.; Liu, S.; Cheng, S.; Zhang, Y.; Pan, Y.; Wang, L.; Yu. Dokuchits, E.; Nkwazema, O.C. How 2022 extreme drought influences the spatiotemporal variations of terrestrial water storage in the Yangtze River Catchment: Insights from GRACE-based drought severity index and in-situ measurements. J. Hydrol. 2023, 626, 130245. [Google Scholar] [CrossRef]
  11. Zhang, S.; Sun, P.; Li, R.; Wang, F.W. Preliminary investigation on a catastrophic loess landslide induced by heavy rainfall on 1 September 2022 in Qinghai, China. Landslides 2023, 20, 1553–1559. [Google Scholar] [CrossRef]
  12. Xia, M.; Ren, G.M.; Yang, X.L. Mechanism of a catastrophic landslide occurred on May 12, 2019, Qinghai Province, China. Landslides 2021, 18, 707–720. [Google Scholar] [CrossRef]
  13. Wei, Z.; Zhang, J.; Cao, X.; Wei, S.; Yan, H. Causes and influential factor analysis of landslides and rockfalls in north & south mountain areas of Xining City, Qinghai Province. Chin. J. Geol. Hazard Control 2021, 32, 47–55. [Google Scholar] [CrossRef]
  14. He, L.; Wu, X.T.; He, Z.W.; Xue, D.J.; Bai, W.Q.; Kang, G.C.; Chen, X.; Zhang, Y.X. Landslide Identification and Deformation Monitoring Analysis in Xining City Based on the Time Series InSAR of Sentinel-1A with Ascending and Descending Orbits. Bull. Eng. Geol. Environ. 2024, 83, 255. [Google Scholar] [CrossRef]
  15. Wei, Z.; Cao, X.; Zhang, J.; Ying, Z.; Yan, H.; Wei, S. Temporal and spatial characteristics of landslide, rockfall and debris flow disasters in Qinghai Province during the period. Chin. J. Geol. Hazard Control 2021, 32, 134–142. [Google Scholar]
  16. Wang, F.W.; Chen, Y.; Yan, K.M. A destructive mudstone landslide hit a high-speed railway on 15 September 2022 in Xining city, Qinghai province, China. Landslides 2023, 20, 871–874. [Google Scholar] [CrossRef]
  17. Zhang, M.; Liu, J. Controlling factors of loess landslides in western China. Environ. Earth Sci. 2010, 59, 1671–1680. [Google Scholar] [CrossRef]
  18. Meng, Z.J.; Ma, P.H.; Peng, J.B. Characteristics of loess landslides triggered by different factors in the Chinese Loess Plateau. J. Mt. Sci. 2021, 18, 3218–3229. [Google Scholar] [CrossRef]
  19. Hu, X.; Xue, L.; Yu, Y.T.; Guo, S.F.; Cui, Y.F.; Li, Y.; Qi, S.W. Remote Sensing Characterization of Mountain Excavation and City Construction in Loess Plateau. Geophys. Res. Lett. 2021, 48, e2021GL095230. [Google Scholar] [CrossRef]
  20. Shi, X.G.; Xu, Q.; Zhang, L.; Zhao, K.Y.; Dong, J.; Jiang, H.J.; Liao, M.S. Surface displacements of the Heifangtai terrace in Northwest China measured by X and C-band InSAR observations. Eng. Geol. 2019, 259, 105181. [Google Scholar] [CrossRef]
  21. Shi, X.G.; Wang, J.N.; Jiang, M.; Zhang, S.C.; Wu, Y.L.; Zhong, Y.L. Extreme rainfall-related accelerations in landslides in Danba County, Sichuan Province, as detected by InSAR. Int. J. Appl. Earth Obs. Geoinf. 2022, 115, 103109. [Google Scholar] [CrossRef]
  22. Zhang, Z.; Lin, H.; Wang, M.; Liu, X.; Chen, Q.; Wang, C.; Zhang, H. A Review of Satellite Synthetic Aperture Radar Interferometry Applications in Permafrost Regions: Current status, challenges, and trends. IEEE Geosci. Remote Sens. Mag. 2022, 10, 93–114. [Google Scholar] [CrossRef]
  23. Wang, L.; Zuo, B.; Le, Y.; Chen, Y.; Li, J. Penetrating remote sensing: Next-generation remote sensing for transparent earth. Innov. 2023, 4, 100519. [Google Scholar] [CrossRef]
  24. Ferretti, A.; Prati, C.; Rocca, F. Permanent scatterers in SAR interferometry. IEEE Trans. Geosci. Remote Sens. 2001, 39, 8–20. [Google Scholar] [CrossRef]
  25. Berardino, P.; Fornaro, G.; Lanari, R.; Sansosti, E. A new algorithm for surface deformation monitoring based on small baseline differential SAR interferograms. IEEE Trans. Geosci. Remote Sens. 2002, 40, 2375–2383. [Google Scholar] [CrossRef]
  26. Ferretti, A.; Fumagalli, A.; Novali, F.; Prati, C.; Rocca, F.; Rucci, A. A New Algorithm for Processing Interferometric Data-Stacks: SqueeSAR. IEEE Trans. Geosci. Remote Sens. 2011, 49, 3460–3470. [Google Scholar] [CrossRef]
  27. Zhao, C.Y.; Zhang, Q.; He, Y.; Peng, J.B.; Yang, C.S.; Kang, Y. Small-scale loess landslide monitoring with small baseline subsets interferometric synthetic aperture radar technique-case study of Xingyuan landslide, Shaanxi, China. J. Appl. Remote Sens. 2016, 10, 026030. [Google Scholar] [CrossRef]
  28. Jiang, Z.; Zhao, C.Y.; Yan, M.; Wang, B.H.; Liu, X.J. The Early Identification and Spatio-Temporal Characteristics of Loess Landslides with SENTINEL-1A Datasets: A Case of Dingbian County, China. Remote Sens. 2022, 14, 6009. [Google Scholar] [CrossRef]
  29. Zhu, Y.R.; Qiu, H.J.; Yang, D.D.; Liu, Z.J.; Ma, S.Y.; Pei, Y.Q.; He, J.Y.; Du, C.; Sun, H.S. Pre- and post-failure spatiotemporal evolution of loess landslides: A case study of the Jiangou landslide in Ledu, China. Landslides 2021, 18, 3475–3484. [Google Scholar] [CrossRef]
  30. Zhang, Y.; Wang, A.J.; Ma, K.Q.; Zhang, M.S.; Meng, X.M.; Zhu, K.; Qiao, D.D.; Liu, T.M.; Li, Y.X.; Liu, W.C. Geomorphic understanding of loess landslides activity on the loess tableland:A case study in the Bailu Tableland, China. Catena 2024, 234, 107641. [Google Scholar] [CrossRef]
  31. Zhang, J.; Gong, Y.F.; Huang, W.; Wang, X.; Ke, Z.Y.; Liu, Y.R.; Huo, A.D.; Adnan, A.; Abuarab, M.E. Identification of Potential Landslide Hazards Using Time-Series InSAR in Xiji County, Ningxia. Water 2023, 15, 300. [Google Scholar] [CrossRef]
  32. Yao, C.; Yao, X.; Gu, Z.; Ren, K.; Zhou, Z. Analysis on the development law of active geological hazards in the Loess Plateau based on InSAR identification. J. Geomech. 2022, 28, 257. [Google Scholar] [CrossRef]
  33. Shi, X.; Yang, C.; Zhang, L.; Jiang, H.; Liao, M.; Zhang, L.; Liu, X. Mapping and characterizing displacements of active loess slopes along the upstream Yellow River with multi-temporal InSAR datasets. Sci. Total Environ. 2019, 674, 200–210. [Google Scholar] [CrossRef]
  34. Pu, C.H.; Xu, Q.; Zhao, K.Y.; Chen, W.L.; Wang, X.C.; Li, H.J.; Liu, J.L.; Kou, P.L. Spatiotemporal evolution and surface response of land subsidence over a large-scale land creation area on the Chinese Loess Plateau. Int. J. Appl. Earth Obs. Geoinf. 2022, 111, 102835. [Google Scholar] [CrossRef]
  35. Zhou, C.D.; Lan, H.X.; Burgmann, R.; Warner, T.A.; Clague, J.J.; Li, L.P.; Wu, Y.M.; Zhao, X.X.; Zhang, Y.X.; Yao, J.M. Application of an improved multi-temporal InSAR method and forward geophysical model to document subsidence and rebound of the Chinese Loess Plateau following land reclamation in the Yan’an New District. Remote Sens. Environ. 2022, 279, 113102. [Google Scholar] [CrossRef]
  36. Wu, Q.; Ge, D.; Yu, J.; Zhang, L.; Ma, Y.; Chen, Y.; Wan, X.; Wang, Y.; Zhang, L. Active Deformation Areas of Potential Landslide Mapping with a Generalized Convolutional Neural Network. Remote Sens. 2024, 16, 1090. [Google Scholar] [CrossRef]
  37. Luo, S.R.; Feng, G.C.; Xiong, Z.Q.; Wang, H.Y.; Zhao, Y.G.; Li, K.F.; Deng, K.L.; Wang, Y.X. An Improved Method for Automatic Identification and Assessment of Potential Geohazards Based on MT-InSAR Measurements. Remote Sens. 2021, 13, 3490. [Google Scholar] [CrossRef]
  38. He, Y.; Wang, W.H.; Zhang, L.F.; Chen, Y.D.; Chen, Y.; Chen, B.S.; He, X.; Zhao, Z.A. An identification method of potential landslide zones using InSAR data and landslide susceptibility. Geomat. Nat. Hazards Risk 2023, 14, 2185120. [Google Scholar] [CrossRef]
  39. Zhang, J.; Zhu, W.; Cheng, Y.; Li, Z. Landslide Detection in the Linzhi–Ya’an Section along the Sichuan–Tibet Railway Based on InSAR and Hot Spot Analysis Methods. Remote Sens. 2021, 13, 3566. [Google Scholar] [CrossRef]
  40. Wang, Y.; Dong, J.; Zhang, L.; Deng, S.H.; Zhang, G.K.; Liao, M.S.; Gong, J.Y. Automatic detection and update of landslide inventory before and after impoundments at the Lianghekou reservoir using Sentinel-1 InSAR. Int. J. Appl. Earth Obs. Geoinf. 2023, 118, 103224. [Google Scholar] [CrossRef]
  41. Song, C.; Yu, C.; Li, Z.; Utili, S.; Frattini, P.; Crosta, G.; Peng, J. Triggering and recovery of earthquake accelerated landslides in Central Italy revealed by satellite radar observations. Nat. Commun. 2022, 13, 7278. [Google Scholar] [CrossRef] [PubMed]
  42. Fu, L.; Zhang, Q.; Wang, T.; Li, W.; Xu, Q.; Ge, D. Detecting slow-moving landslides using InSAR phase-gradient stacking and deep-learning network. Front. Environ. Sci. 2022, 10, 963322. [Google Scholar] [CrossRef]
  43. Cai, J.; Zhang, L.; Dong, J.; Guo, J.; Wang, Y.; Liao, M. Automatic identification of active landslides over wide areas from time-series InSAR measurements using Faster RCNN. Int. J. Appl. Earth Obs. Geoinf. 2023, 124, 103516. [Google Scholar] [CrossRef]
  44. Ju, Y.; Xu, Q.; Jin, S.; Li, W.; Dong, X.; Guo, Q. Automatic Object Detection of Loess Landslide Based on Deep Learning. Geomat. Inf. Sci. Wuhan Univ. 2020, 45, 1747–1755. [Google Scholar] [CrossRef]
  45. Survey, C.G. Xining City Pushes forward the Management of Geologic Hazards in Beishan Mountain. Available online: https://www.cgs.gov.cn/gzdt/dzhy/201603/t20160309_302410.html (accessed on 16 May 2024).
  46. He, L.; Wu, X.T.; He, Z.W.; Xue, D.J.; Luo, F.; Bai, W.Q.; Kang, G.C.; Chen, X.; Zhang, Y.X. Susceptibility Assessment of Landslides in the Loess Plateau Based on Machine Learning Models: A Case Study of Xining City. Sustainability 2023, 15, 14761. [Google Scholar] [CrossRef]
  47. Ling, Y.; Kaixiong, Q.; Qingli, D. Study on the distribution law of hidden dangers of major geological disasters in Xining City. J. Qinghai Environ. 2015, 25, 113–116. [Google Scholar]
  48. Qinghai Provincial Bureau of Statistics. Qinghai Statistical Yearbooks. Available online: http://tjj.qinghai.gov.cn/tjData/qhtjnj/ (accessed on 20 May 2024).
  49. Li, C.; Wang, X.; He, C.; Wu, X.; Kong, Z.; Li, X. China National Digital Geological Map (Public Version at 1:200 000 Scale) Spatial Database. Geol. China 2019, 46, 1–10. [Google Scholar]
  50. Wegnüller, U.; Werner, C.; Strozzi, T.; Wiesmann, A.; Frey, O.; Santoro, M. Sentinel-1 Support in the GAMMA Software. Procedia Comput. Sci. 2016, 100, 1305–1312. [Google Scholar] [CrossRef]
  51. Hooper, A.; Bekaert, D.; Spaans, K.; Arıkan, M. Recent advances in SAR interferometry time series analysis for measuring crustal deformation. Tectonophysics 2012, 514-517, 1–13. [Google Scholar] [CrossRef]
  52. Shi, X.; Chen, D.; Wang, J.; Wang, P.; Wu, Y.; Zhang, S.; Zhang, Y.; Yang, C.; Wang, L. Refined landslide inventory and susceptibility of Weining County, China, inferred from machine learning and Sentinel-1 InSAR analysis. Trans. GIS 2024, 00, 1–23. [Google Scholar] [CrossRef]
  53. Jiang, M. Sentinel-1 TOPS co-registration over low-coherence areas and its application to velocity estimation using the all pairs shortest path algorithm. J. Geod. 2020, 94, 95. [Google Scholar] [CrossRef]
  54. Shi, X.G.; Liao, M.S.; Li, M.H.; Zhang, L.; Cunningham, C. Wide-Area Landslide Deformation Mapping with Multi-Path ALOS PALSAR Data Stacks: A Case Study of Three Gorges Area, China. Remote Sens. 2016, 8, 136. [Google Scholar] [CrossRef]
  55. Shi, X.G.; Zhang, L.; Balz, T.; Liao, M.S. Landslide deformation monitoring using point-like target offset tracking with multi-mode high-resolution TerraSAR-X data. Isprs J. Photogramm. Remote Sens. 2015, 105, 128–140. [Google Scholar] [CrossRef]
  56. Samsonov, S.; Dille, A.; Dewitte, O.; Kervyn, F.; d‘Oreye, N. Satellite interferometry for mapping surface deformation time series in one, two and three dimensions: A new method illustrated on a slow-moving landslide. Eng. Geol. 2020, 266, 105471. [Google Scholar] [CrossRef]
  57. Duan, L.; Xu, L.; Guo, F.; Lee, J.; Yan, B.P. A local-density based spatial clustering algorithm with noise. Inf. Syst. 2007, 32, 978–986. [Google Scholar] [CrossRef]
  58. Hahsler, M.; Piekenbrock, M.; Doran, D. Dbscan: Fast Density-Based Clustering with R. J. Stat. Softw. 2019, 91, 1–30. [Google Scholar] [CrossRef]
  59. Kanagala, H.K.; Krishnaiah, V. A Comparative Study of K-Means, Dbscan and Optics. In Proceedings of the International Conference on Computer Communication and Informatics (ICCCI), Coimbatore, India, 7–9 January 2016. [Google Scholar]
  60. Zhu, C.; Xu, X.D.; Liu, W.R.; Xiong, F.; Lin, Y.; Cao, C.; Liu, X. Softening Damage Analysis of Gypsum Rock with Water Immersion Time Based on Laboratory Experiment. IEEE Access 2019, 7, 125575–125585. [Google Scholar] [CrossRef]
  61. Zhu, Y.R.; Qiu, H.J.; Cui, P.; Liu, Z.J.; Ye, B.F.; Yang, D.D.; Kamp, U. Early detection of potential landslides along high-speed railway lines: A pressing issue. Earth Surf. Process. Landf. 2023, 48, 3302–3314. [Google Scholar] [CrossRef]
  62. World Wide Web. Precipitation in Xining City, Qinghai Breaks Several Historical Records, Urban Precipitation is 237% More than the Same Period in Previous Years. Available online: https://baijiahao.baidu.com/s?id=1742012962818694306&wfr=spider&for=pc (accessed on 20 May 2024).
  63. Li, L.; Zhang, Y.; Hou, Y.; Han, B.; An, N.; Zhang, H.; Ma, Y. Identification and hazard analysis of landslides triggered by earthquakes and rainfall. Earthq. Res. Adv. 2023, 4, 100272. [Google Scholar] [CrossRef]
  64. Bai, S.; Lu, P.; Thiebes, B. Comparing characteristics of rainfall- and earthquake-triggered landslides in the Upper Minjiang catchment, China. Eng. Geol. 2020, 268, 105518. [Google Scholar] [CrossRef]
  65. Zhang, M.; Li, T. Triggering Factors and Forming Mechanism of Loess Landslides. J. Eng. Geol. 2011, 19, 530–540. [Google Scholar]
  66. Li, C.; Zhang, S.; Yu, P. Analysis on the cause of landslide in Beishan Temple, Xining City. Manag. Strategy Qinghai Land Resour. 2006, 30–32. [Google Scholar]
  67. Liu, W.; Lin, G.; Liu, Q.; Su, X. Hydraulic property variations with depth in a loess mudstone landslide. Sci. Rep. 2024, 14, 10965. [Google Scholar] [CrossRef] [PubMed]
  68. Cao, Z.; Wang, T. Water-temperature controlled deformation patterns in Heifangtai loess terraces revealed by wavelet analysis of InSAR time series and hydrological parameters. Front. Environ. Sci. 2022, 10, 957339. [Google Scholar] [CrossRef]
  69. Zhuang, J.; Peng, J.; Xu, C.; Li, Z.; Densmore, A.; Milledge, D.; Iqbal, J.; Cui, Y. Distribution and characteristics of loess landslides triggered by the 1920 Haiyuan Earthquake, Northwest of China. Geomorphology 2018, 314, 1–12. [Google Scholar] [CrossRef]
  70. Hu, W.; Scaringi, G.; Xu, Q.; Huang, R. Internal erosion controls failure and runout of loose granular deposits: Evidence from flume tests and implications for postseismic slope healing. Geophys. Res. Lett. 2018, 45, 5518–5527. [Google Scholar] [CrossRef]
  71. Lin, C.W.; Liu, S.H.; Lee, S.Y.; Liu, C.C. Impacts of the Chi-Chi earthquake on subsequent rainfall-induced landslides in central Taiwan. Eng. Geol. 2006, 86, 87–101. [Google Scholar] [CrossRef]
  72. Peng, L.; Du, W.; Tian, H. Demonstration of monitoring and early warning of mega landslides in Xining City. Sci. Technol. Eng. 2021, 21, 7806–7813. [Google Scholar]
  73. Bai, C.N.; Peng, L.; Y., S. Genetic mechanisms and a stability evaluation of large landslides in Zhangjiawan, Qinghai Province. Sci. Technol. Eng. 2021, 21, 927–934. [Google Scholar]
  74. Li, M.; Wu, H.; Yang, M.; Huang, C.; Tang, B. Trend Classification of InSAR Displacement Time Series Using SAE–CNN. Remote Sens. 2024, 16, 54. [Google Scholar] [CrossRef]
  75. Yang, M.; Li, M.; Huang, C.; Zhang, R.; Liu, R. Exploring the InSAR Deformation Series Using Unsupervised Learning in a Built Environment. Remote Sens. 2024, 16, 1375. [Google Scholar] [CrossRef]
Figure 2. Sentinel-1 InSAR image pairs of (a) ascending and (b) descending orbit datasets.
Remotesensing 16 03066 g002
Figure 3. Workflow of semi-automatic detection of ground displacement in this study.
Remotesensing 16 03066 g003
Figure 4. Displacement rate maps in the LOS directions of the (a) ascending and (b) descending Sentinel-1 datasets and in the (c) eastward and (d) vertical directions.
Remotesensing 16 03066 g004
Figure 5. DBSCAN maps generated from the (a) ascending and (b) descending displacement rate maps, (c) identifying the cluster results by combining (a,b), and (d) the enlarged map.
Remotesensing 16 03066 g005
Figure 6. (a) Eastward and (b) vertical displacement rate maps of the Jiujiawan landslide.
Remotesensing 16 03066 g006
Figure 7. Time series eastward (E) and vertical (V) cumulative displacements of P1 and P2 in the Jiujiawan landslide.
Remotesensing 16 03066 g007
Figure 8. (a,c) Eastward and (b,d) vertical displacement rate maps of five typical landslides along the LXHR.
Remotesensing 16 03066 g008
Figure 9. Time series (a) eastward and (b) vertical cumulative displacements of P3-P6 in Figure 8.
Remotesensing 16 03066 g009
Figure 10. Subsidence rate maps (a1f1) and corresponding Google Earth optical images (a2f2) of six typical subsidence zones.
Remotesensing 16 03066 g010
Figure 11. Cumulative vertical displacements of P7 and P8.
Remotesensing 16 03066 g011
Figure 12. Displacement rate maps (a1c1) and corresponding Google Earth optical images (a2c2) of typical active slopes affected by anthropogenic activities.
Remotesensing 16 03066 g012
Table 1. SAR data information.
SensorSentinel-1A/B
Path number128135
Orbit directionAscendingDescending
Heading angle (°)−13.19193.18
Look angle (°)36.8343.86
PeriodOctober 2014–September 2022October 2014–September 202
Reference image2 January 20182 January 2018
Number of scenes197177
Disclaimer/Publisher’s Note: The statements, opinions and data contained in all publications are solely those of the individual author(s) and contributor(s) and not of MDPI and/or the editor(s). MDPI and/or the editor(s) disclaim responsibility for any injury to people or property resulting from any ideas, methods, instructions or products referred to in the content.

