Article

Research on eLoran Weak Signal Extraction Based on Wavelet Hard Thresholding Processing

1
National Time Service Center, Chinese Academy of Sciences, Xi’an 710600, China
2
Fengkai Low-Frequency Time-Code Time Service Station, Zhaoqing 526500, China
3
University of Chinese Academy of Sciences, Beijing 100049, China
4
Key Laboratory of Time Reference and Applications Chinese Academy of Sciences, Xi’an 710600, China
*
Author to whom correspondence should be addressed.
Remote Sens. 2024, 16(16), 3012; https://doi.org/10.3390/rs16163012
Submission received: 17 July 2024 / Revised: 13 August 2024 / Accepted: 14 August 2024 / Published: 16 August 2024

Abstract

:
As the eLoran signal propagates, its strength gradually diminishes with increasing distance, making subsequent signal capture and terminal development challenging. To address this phenomenon, this paper proposes an improved method based on wavelet hard thresholding. This method applies hierarchical processing to the coefficients obtained after wavelet decomposition, based on the signal’s center frequency. It effectively addresses issues like the disappearance of trailing edges and the presence of the noise with large coefficients. Simulation results show that the improved method has the largest output signal-to-noise ratio and effectively improves the problem of tailing vanishing and eliminates the noise with large coefficients. In analog source signal testing, the results show that the method can extract signals of 30 dBμv/m and above well. In actual signal testing, the improved method can extract eLoran signals transmitted over a distance of approximately 1000 km. Based on the results, it can be deduced that the input signal-to-noise ratio is −28.8 dB. Therefore, this method is a suitable and effective solution for extracting weak eLoran signals, providing strong support for signal monitoring in areas at the coverage boundaries of eLoran signals.

1. Introduction

Currently, the Global Navigation Satellite System (GNSS) is rapidly developing and has taken a dominant position, playing a significant role in navigation, aerospace, and national life [1]. However, its vulnerability is becoming increasingly evident, such as the presence of serious security threats and the inability to guarantee the availability, continuity, and reliability of time-frequency applications. For this reason, many countries are vigorously developing the eLoran system as a reliable backup for GNSS systems. The Enhanced Long Range Navigation system was developed from the Loran-C system. As a completely independent land-based system, it has advantages such as high transmission power, high reliability, and strong anti-jamming performance [2]. China will continue to develop the existing BPL long-wave timing system and the Changhe-2 navigation system, and carry out the “high-precision ground-based timing system” project during the 13th Five-Year Plan period, with plans to build three additional enhanced Loran timing stations in the west of the country, namely, Dunhuang, Korla, and Naqu. These will be combined with China’s existing BPL long-wave timing system and the Changhe-2 navigation system to achieve nationwide coverage of the long-wave signals basically [3]. In order to determine the extent of signal coverage, signal monitoring of the signal coverage boundary areas is required. The eLoran signal strength is weak at this time. Therefore, the study of methods for weak signal extraction is an important guarantee for this process.
Currently, most of the methods for weak signal extraction are based on traditional digital filters, adaptive filters, Kalman filters, wavelet transforms, Empirical Mode Decomposition, Bayesian neural networks, and Stochastic resonance. Conventional filters cannot handle complex signals and in-band noise. An adaptive filter needs to acquire the desired signal to have good results. EMD has issues such as mode mixing and endpoint effects, and it faces bottlenecks in engineering applications [4]. Kalman filtering requires a highly accurate system model and a substantial amount of prior information [5]. Bayesian neural networks require a certain amount of a priori information about signal and noise to train the model [6], making engineering applications difficult. Stochastic resonance has the effect of transferring noise energy to signal energy, but is only good at low frequencies or when the signal is known to be high frequency [7]. In the existing research on eLoran weak signal extraction, Weili Tong uses adaptive filtering to process the signal, removing noise and single-frequency interference [8]. Yanwei Sun used a combination of interpolated FIR filter and NLMS adaptive filter to digitally filter the received signal, which reduces the amount of computation [9]. However, their methods face the challenge of difficulty in obtaining the desired signal. Ting Zeng proposed a method based on spectral subtraction to process eLoran signals, which can effectively extract effective signals at low signal-to-noise ratios, but the method requires an accurate estimation of the power spectra of noise and interference signals [10].
To address the above problems, this paper adopts an improved method based on wavelet hard thresholding to extract weak eLoran signals. This method removes noise by preprocessing and threshold filtering the coefficients beyond the signal’s center frequency. This method does not require much prior information or expected signals, nor does it rely on the accurate estimation of the power spectrum of the expected signal and noise. Additionally, it can suppress in-band noise, making it a more suitable extraction method.

2. Materials and Methods

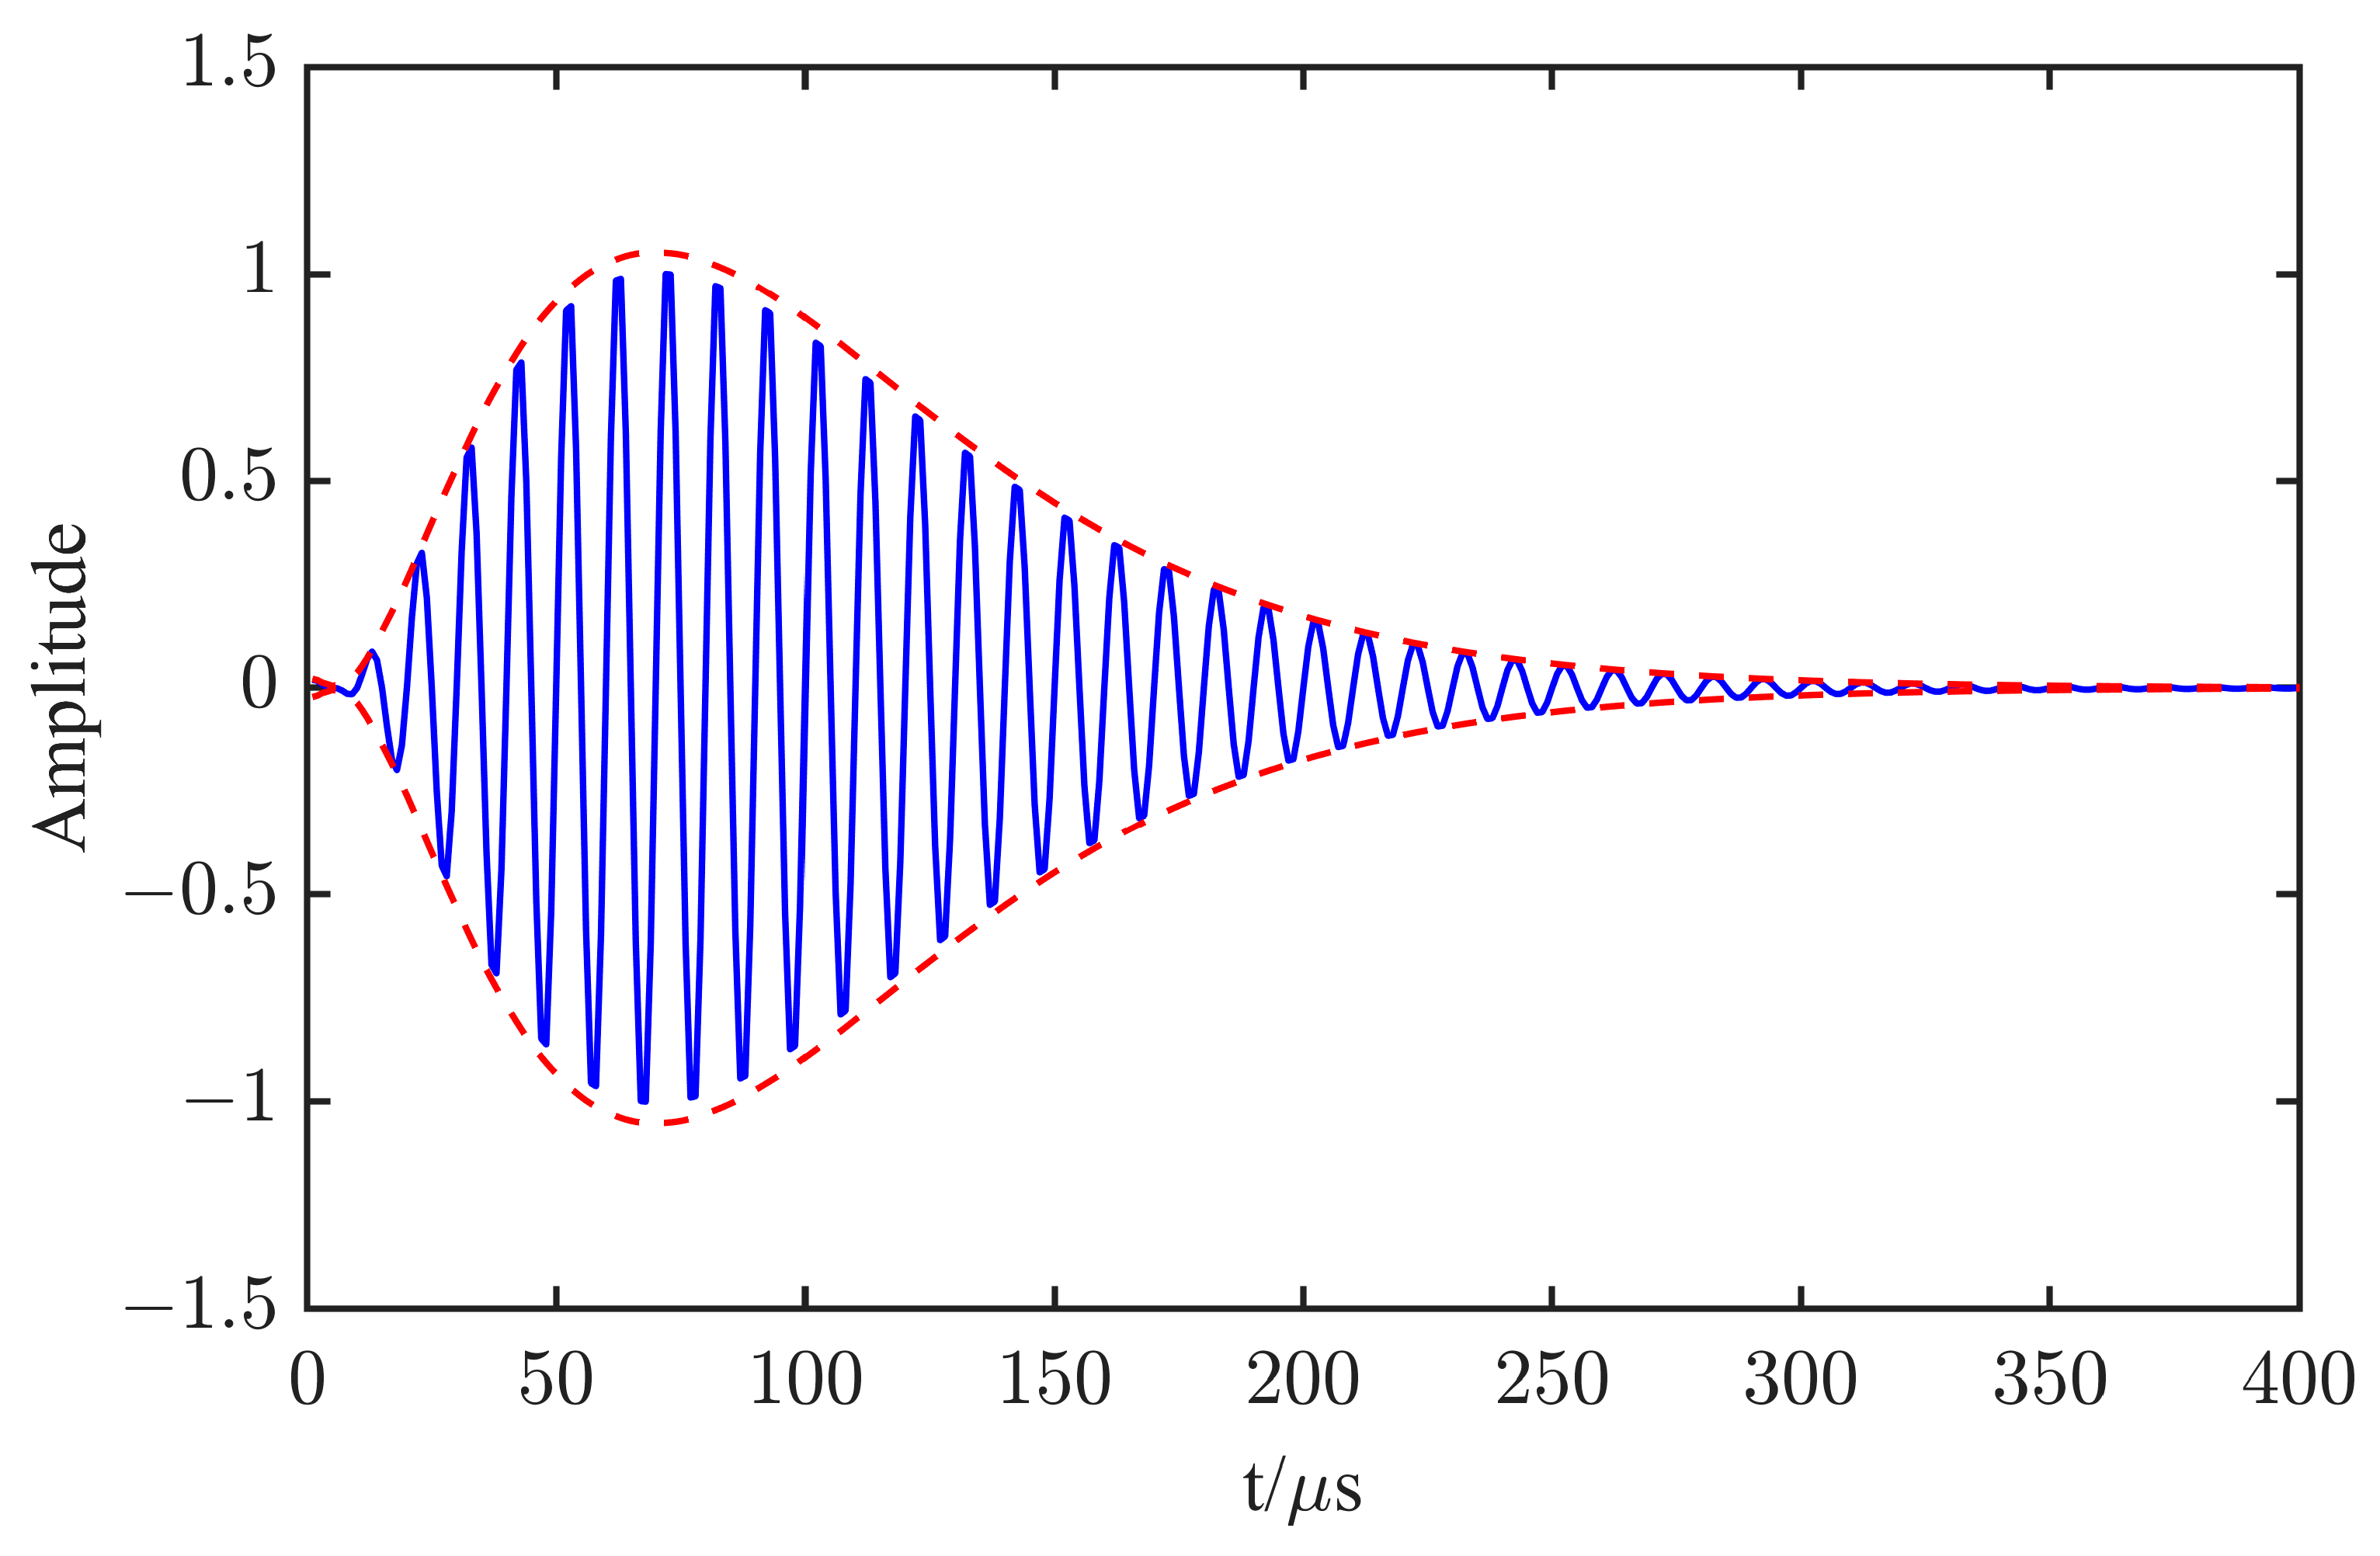
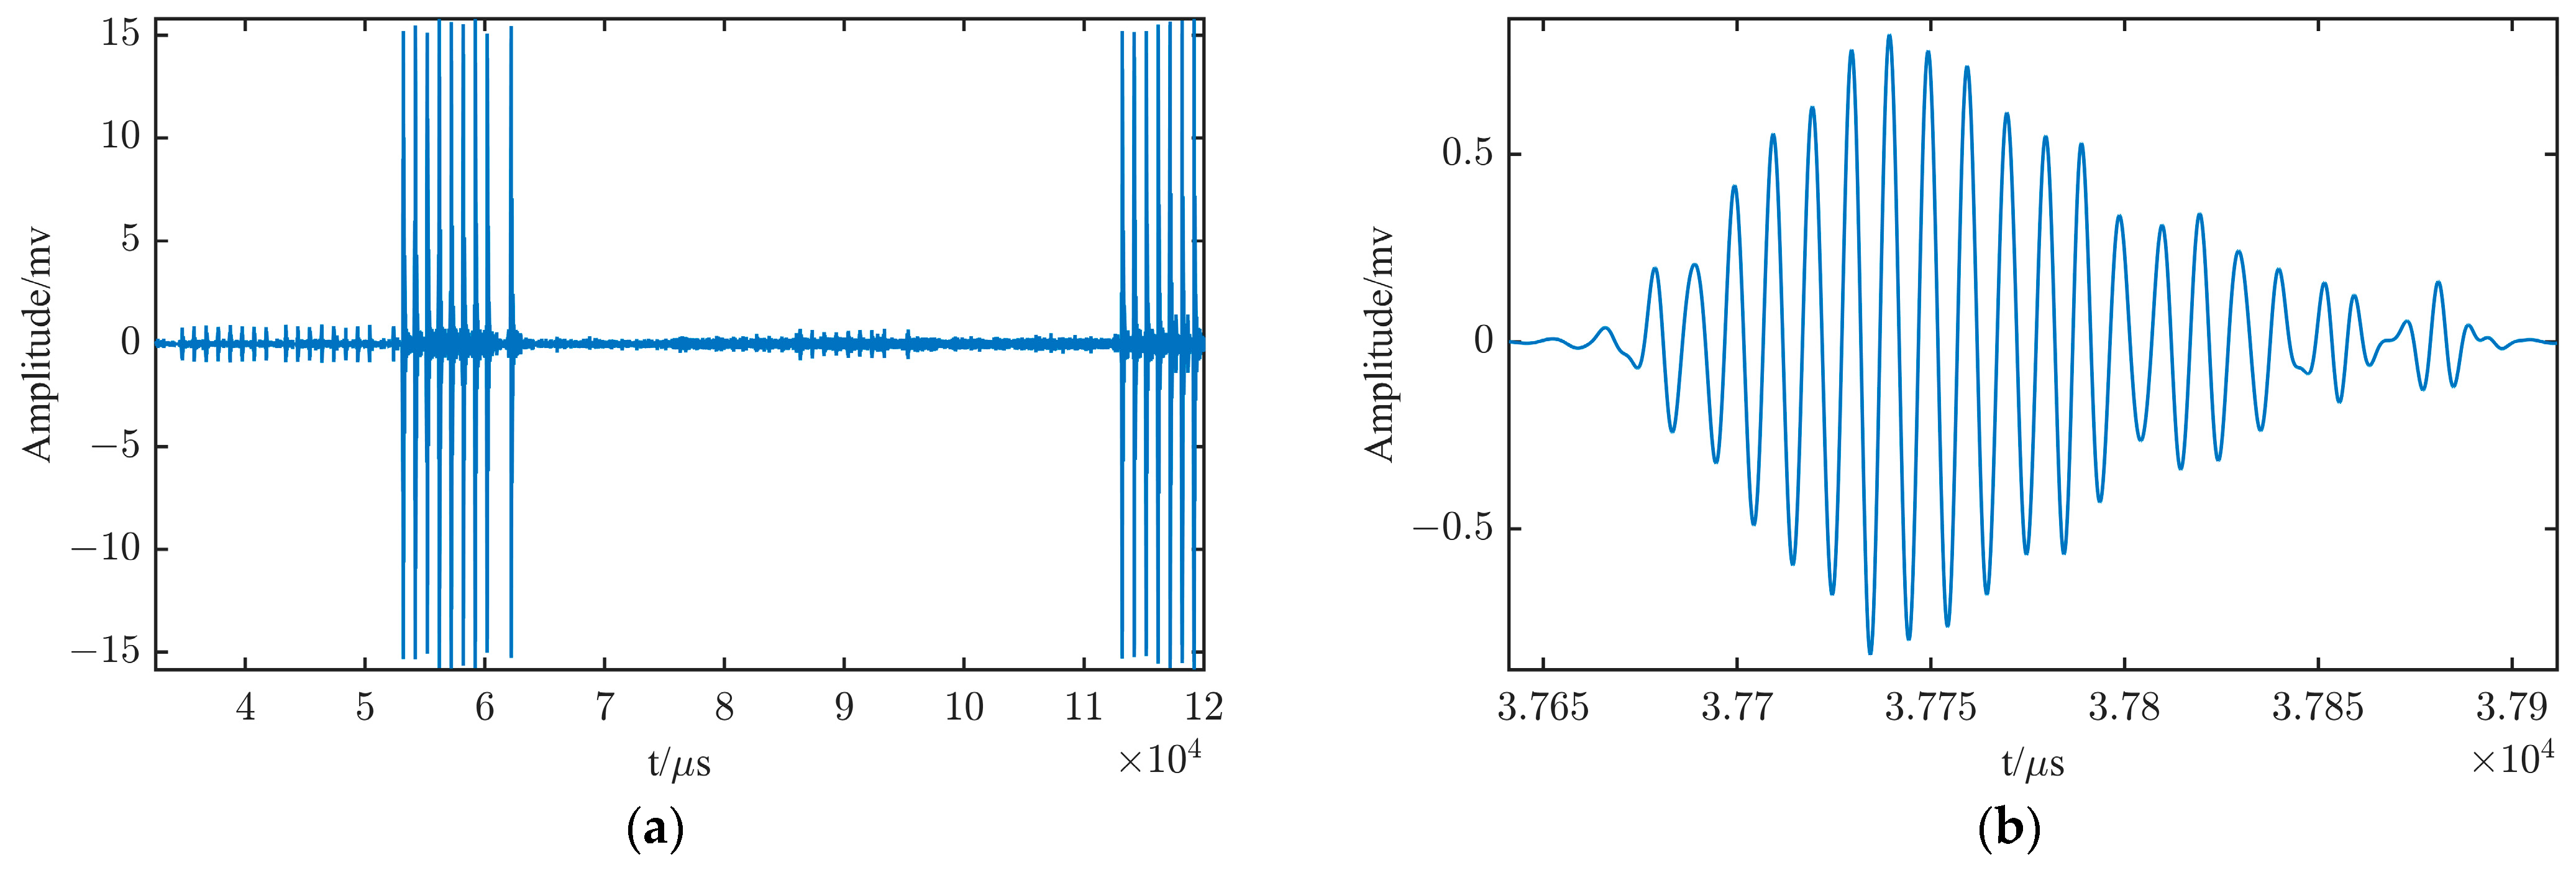
2.1. eLoran Signal Characteristics

eLoran Signal Format and Waveform

The eLoran system transmits a low-frequency radio long-wave signal with a center frequency of 100 kHz [11], and the shape of the eLoran signal is mathematically represented by the following equation:
A ( t τ ) 2 exp [ 2 ( t τ ) 65 ] sin ( 0.2 π t + p c )
where A is the peak pulse voltage, t is the time counted from the pulse starting point (its unit is microseconds), τ represents the Envelope to Cycle Difference (ECD), its unit is microseconds, p c is the phase code (0 or π).
When τ is taken to be 5 and the phase encode is taken to be 0, by applying Formula (1), we can derive the standard waveform of the eLoran signal, as illustrated in Figure 1. The frequency domain waveform of the eLoran signal is shown in Figure 2.
The energy of the eLoran signal is primarily concentrated in the 90~110 kHz range. Based on the above signal model, the following issues should be addressed when extracting this signal:
(1) Suppressing noise both inside and outside the 90~110 kHz frequency band;
(2) Ensuring that the amplitude, phase, and waveform of the eLoran signal remain unchanged.

2.2. Research on eLoran Weak Signal Extraction Method Based on IIR Filters

Since many eLoran receivers use IIR filters for signal processing, this paper uses IIR filters as a comparison to better demonstrate the performance improvements and extraction characteristics of the proposed improved method.

Introduction to IIR Filters and the Filter Used in This Article

Conventional digital filters are classified into FIR (Finite Impulse Response) filters and IIR (Infinite Impulse Response) filters. Their system functions are shown as follows:
H ( z ) = n = 0 N 1 h ( n ) z n ( F I R )
H ( z ) = m = 0 M b m z m 1 + n = 1 N a n z n ( I I R )
This paper selects the IIR filter, as it has good amplitude-frequency characteristics and requires fewer orders [12], which can save many resources. Since the energy of the eLoran signal is mainly concentrated in the 90–110 kHz range, a bandpass IIR filter needs to be constructed. The Butterworth filter is chosen as the prototype for this article due to its smooth response without passband ripple. The passband is set to 90–110 kHz, and the stopband is set to 85–115 kHz, ensuring a passband magnitude of 1 and rapid attenuation in the stopband. The filter coefficients are then calculated using the bilinear transformation method to obtain the IIR filter required for this article [13].

2.3. Research on an Improved Method Based on Wavelet Hard Thresholding Processing

2.3.1. Wavelet Transform and Wavelet Hard Thresholding

Wavelet transform is a method that uses time-frequency analysis to analyze signals. It decomposes the signal into different frequency coefficients using a set of wavelet basis functions [14]. These basis functions have locality, enabling compromise in the time and frequency domains. By changing the scale and position of the wavelet basis function, different parts of the signal can be analyzed. The scale determines the frequency, and the translation changes the window, enabling the wavelet transform to represent the local features of the signal in both the time and frequency domains.
Wavelet transform is categorized into CWT (continuous wavelet transform) and DWT (discrete wavelet transform). The properties of continuous wavelets make their wavelet transform coefficients have a large amount of redundancy and a large amount of computation in decomposition and reconstruction [15], so the discrete wavelet transform is usually used. The discrete wavelet transform discretizes the continuous scale and translation parameters, reducing the redundancy of wavelet transform coefficients. However, this discretization also leads to a certain amount of information loss. To ensure accurate reconstruction, the discretized parameters must be carefully constrained: the relevant parameters should be as small as possible. Discrete wavelets are mainly based on multiscale analysis. Among these, the most famous is the binary discrete wavelet transform [16]. Its formula is as follows:
φ ( 2 j , k ) ( x ) = 2 j 2 φ ( 2 j ( x k ) ) j , k Z
Then, the binary discrete wavelet transform of f ( x ) is,
W f j ( k ) = R f ( x )   φ ( 2 j , k ) ( x ) ¯ d x
Its inverse transformation is,
f ( x ) = j = + 2 j R W f j ( k ) × φ ( 2 j , k ) ( x ) d k
The method used in this paper is an improvement based on the wavelet hard thresholding processing. Based on the properties of wavelet transform, wavelet hard thresholding is a denoising method proposed. Wavelet transform can perform nonlinear filtering based on the characteristics of signal noise and has multi-resolution properties. It can distinguish between noisy signals and useful signals in a frequency range [17]. Mallat et al. found a relationship between the wavelet transform and the Li’s index by relating the scale j of the wavelet transform to the Li’s index α [18]. They clarified the relationship between the wavelet transform coefficients of a signal and the scale j. If α > 0, the coefficients increase as the scale increases; if α < 0, the coefficients decrease as the scale increases. Through this layer it is possible to respond to the characteristics of the signal-smoothness and mutation. This indicates that the wavelet transform coefficients of the signal and noise exhibit different variations at different scales. As the decomposition scale increases, the signal features are enhanced and the noise characteristics are attenuated [19]. Afterwards, the wavelet coefficients are processed by hard thresholding to achieve denoising. Typically, wavelet hard thresholding involves three steps, as shown in Figure 3.
The process of signal decomposition and reconstruction is shown in Figure 4. Where CA represents the approximate component, while CD represents the detail component.
When performing wavelet decomposition of a signal, selecting the appropriate wavelet basis is crucial. The wavelet basis usually requires the following considerations: vanishing moment, tight branching, symmetry, orthogonality, regularity. At the same time, the choice of the number of decomposition layers is also very important. The number of decomposition layers corresponds to different degrees of noise and signal separation [20].
Hard thresholding is a process that compares the absolute values of the wavelet coefficients with a threshold. If its absolute value is greater than or equal to the threshold, it remains unchanged; if it is less than the threshold, the coefficient becomes 0. The process is represented as follows [21]:
W ^ j , k = { W j , k | W j , k | λ 0 | W j , k | < λ
where W ^ j , k denotes the coefficients after processing, W j , k denotes the coefficients before processing, and λ denotes the threshold we set.

2.3.2. Improved Methods

Through the decomposition process and sampling rate, the frequency range of each layer can be calculated as follows.
f C D N m i n = f s 2 N + 1
where f s represents the sampling frequency and f C D N m i n represents the smallest frequency of CDN in the Nth layer. According to this minimum frequency, the frequency range of the CDN layer is [ f C D N m i n , 2 f C D N m i n ], and the frequency range of the CAN layer is [ 0 , f C D N m i n ]. The center frequency of the eLoran signal is at 100 kHz, so the coefficients can be preprocessed before hard thresholding. Determine the number of layers in which the coefficients corresponding to the frequency 100 kHz are located, and set the coefficients of the other layers to 0. The process is represented as follows.
W ^ C D N = { W C D N 100   KHz C D N 0 Other   conditions
W ^ C A N = { W C N 100   KHz C D N 0 Other   conditions
This serves as a pre-precise removal of the coefficients corresponding to the noise, and the coefficients corresponding to the signal are unaffected. Combining the above process with wavelet hard thresholding results in the improved method. The specific flow of the improvement method is shown in Figure 5. Decompose the input signal according to the wavelet basis and the number of decomposition levels. After determining the level at which the signal coefficients are located, set the coefficients of the other levels to zero. Then, apply thresholding to the coefficients at the level where the signal is located to remove in-band noise. Finally, reconstruct the signal using the processed coefficients, thereby extracting the eLoran signal.
Let the threshold used for the wavelet hard thresholding process be λ 1 and the threshold used for the improved method be λ 2 . Then they need to fulfill the following conditions.
λ 1 > C n o i s e 1
λ 2 > C n o i s e 2
where C n o i s e 1   needs to fulfill the condition of being greater than most of the noise coefficients, while C n o i s e 2 only needs to fulfill the condition of being greater than most of the noise coefficients in the layer where the signal is located. Therefore, the following conclusions can be obtained.
λ 1 λ 2
Then, subsequent threshold processes can be represented as,
W ^ 1 = { W 1     | W 1 | λ 1 0     | W 1 | < λ 1
W ^ 2 = { W 2 | W 2 | λ 2 0 | W 2 | < λ 2
where W 1 is the set of all decomposed coefficients, while W 2 is the set of coefficients in the layer where the signal is located. From the above equation, it can be found that since the improved method pre-processes the coefficients outside the layer where the corresponding coefficients of the signal are located, the threshold can be appropriately reduced. This preserves the smaller portion of the corresponding coefficients of the signal, while effectively removing noise with large coefficients outside the layer. The process effectively reduces the complexity of threshold comparison and the amount of computation involved in reconstructing the signal because most of the coefficients are set to zero directly through layer attribution rather than after threshold comparison.

3. Results and Discussion

This paper uses software simulation to generate standard waveforms based on eLoran signal characteristics. τ is taken to be 5 and the phase encoding is taken to be 0, while the power of this signal is guaranteed to be 1. Gaussian white noise with different power levels can be superimposed to produce mixed signals with different signal-to-noise ratios to generate input signal. The input signal-to-noise ratio sizes are 0 dB, −5 dB, −7 dB, and −10 dB. The IIR filter, wavelet hard thresholding, and the improved method are then used to extract the weak eLoran signals under these conditions. A comparison of the waveforms of the input signal and the standard signal with different input signal-to-noise ratios is shown in Figure 6. It can be seen that the eLoran signal is almost drowned by noise when the signal-to-noise ratio is below −5 dB. Finally, atmospheric noise caused by lightning is added as a control. According to the reference ITU-R P.372-16 (08/2022), the atmospheric noise caused by lightning is usually not Gaussian in nature [22], so modeling with only Gaussian white noise does not accurately reflect the characteristics of atmospheric noise at a frequency of 100 kHz. Therefore, adding this component is necessary to improve the noise modeling and to investigate the effectiveness of the three methods in suppressing this type of noise.

3.1. Analysis of IIR Filter Simulation Results

To study the impact of different conditions on the extraction of weak eLoran signals, this paper analyzes the performance of the IIR filter under various low signal-to-noise ratio conditions. And the output signal-to-noise ratio is used as a parameter to measure the performance of the method. The IIR filter simulation results are shown in Figure 7 and Figure 8. From the spectrum diagram, it can be observed that noise outside the 90 kHz to 110 kHz frequency band is almost entirely eliminated. However, as the input signal-to-noise ratio decreases, various noise peaks gradually appear within the frequency band. This indicates that the IIR filter is able to extract the eLoran signal from the frequency band it belongs to, but it cannot eliminate the noise within the band. It can also be seen from the signal waveform that the in-band noise is not eliminated and the waveform is partially distorted by the noise. As the input signal-to-noise ratio decreases, the accuracy of the tail phase becomes lower. In all four cases, the zero-crossing point at 30 μs is accurate. There is noise interference outside the time period in which the waveform is located. The lower the input signal-to-noise ratio, the greater the in-band noise and the more interference.

3.2. Simulation Results Analysis of Wavelet Hard Thresholding Processing and Improved Methods

3.2.1. Analysis of Simulation Results of Hard Thresholding under Different Conditions

Firstly, the parameters that are suitable for eLoran weak signal extraction are determined by simulation in different wavelet bases, different sampling rates, and different decomposition layers. Then, simulate the wavelet hard thresholding and the improved method using these optimal parameters to achieve the best results. The specific process is shown in Figure 9.
  • Analysis of simulation results of hard thresholding under different wavelet bases
The simulation results of hard thresholding under different wavelet bases are shown in Figure 10. In order to study the effect of different wavelet bases on eLoran weak signal extraction, five common and suitable wavelet bases for discrete wavelet transform, namely Daubechies, Biorthogonal, Coiflets, Symlets, and Dmeyer, are used for hard thresholding in this paper, respectively. The sampling rate is 20 MHz, and the input mixed signal signal-to-noise ratios are 0 dB, −5 dB, −7 dB, and −10 dB. The decomposition level is set to 8. The output signal-to-noise ratio is used as a parameter to measure the performance of the method. From Figure 10, it can be seen that the Dmeyer wavelet basis is the most effective in terms of output signal-to-noise ratio and its SNR is higher than the others; the bior wavelet basis has the lowest output signal-to-noise ratio and is the least effective; the remaining three wavelet bases, with different input signal-to-noise ratios, have their own performance advantages and disadvantages. Overall, the Dmeyer wavelet basis is more suitable for extracting weak eLoran signals compared to the other four wavelet bases.
  • Analysis of simulation results of wavelet hard thresholding under different sampling rates
The simulation results of wavelet hard thresholding with different sampling rates are shown in Figure 11. In order to study the effect of different sampling rates on wavelet hard thresholding, this paper uses 5 M, 10 M, 20 M, and 40 M sampling rates for simulation experiments, respectively. The Dmeyer wavelet was chosen as the wavelet basis with an input SNR of −5 dB and a decomposition level of 8. The output SNR is used as a parameter to measure the performance of the method. As can be seen in Figure 11, the output SNR increases as the sampling rate rises. However, after reaching 20 MHz, the rate of increase slows down. Considering both computational complexity and performance, the sampling rate should be set to 20 MHz.
  • Analysis of simulation results of wavelet hard thresholding under different decomposition layers
The simulation results of wavelet hard thresholding with different number of decomposition layers are shown in Figure 12. In order to study the effect of different decomposition levels on the wavelet hard thresholding results, this paper adopts decomposition levels from 5 to 11 to carry out wavelet hard thresholding simulation experiments, respectively. Dmeyer wavelet was chosen as the wavelet base, with an input SNR of −5 dB and a sampling rate of 20 MHz. The output SNR is used as a parameter to measure the performance of the method. As can be seen from Figure 12, when the decomposition level is less than 7, the output signal-to-noise ratio is gradually increasing as the decomposition level rises. When the decomposition level is greater than 7, the output signal-to-noise ratio appears to fluctuate up and down. When choosing the decomposition level, considering both computational load and performance, the decomposition level should be selected between 7 and 9.

3.2.2. Analysis of the Simulation Results of Wavelet Hard Thresholding and the Improved Method under Suitable Parameters

  • Analysis of simulation results of wavelet hard thresholding under suitable parameters
The simulation results of wavelet hard thresholding with suitable parameters are shown in Figure 13 and Figure 14. In order to study the extraction effect of the parameter combinations determined by previous simulations, eLoran mixed signals with different input signal-to-noise ratios are used in this paper for simulations, respectively. The Dmeyer wavelet is selected as the wavelet basis; the input SNR magnitudes are 0 dB, −5 dB, −7 dB, −10 dB; the number of decomposition layers is nine; and the sampling rate is 20 M. According to the output signal spectrum, it can be seen that the amplitude of the out-of-band noise is always at a low level, and its value is much smaller than the amplitude of the in-band signal. There is only one peak in the band, and the in-band noise is also well suppressed. From the four output signal waveforms, it can be seen that the main body of the eLoran signal is well reproduced, and the waveform closely matches the standard waveform. The phase accuracy is high, and in all four cases, the zero-crossing point at 30μs is accurate. However, the restored waveform exhibits issues such as tail disappearance and some noise with relatively high coefficients. And as the signal-to-noise ratio decreases, the proportion of the tailing vanishing part increases. In the case of −10 dB, the tailing starts to disappear at less than 200 μs. The following interpretation can be derived from the analysis of the principles of wavelet thresholding: As the input signal-to-noise ratio decreases, the threshold required to extract the signal becomes larger and larger. However, the amplitude of the tailing part of the eLoran signal is small, and the corresponding wavelet coefficients after the wavelet transform are also small. In low SNR conditions, the wavelet coefficients corresponding to the tail portion will be smaller than the threshold, leading to tail disappearance. Additionally, the higher the threshold, the more significant the portion that disappears.
  • Analysis of simulation results of the improved method with suitable parameters
The simulation results of wavelet hard thresholding with suitable parameters are shown in Figure 15 and Figure 16. All other conditions remain the same. This section will replace the method with the improved method. It can be seen that the main body of the eLoran signal is reproduced, and the noise with higher coefficients basically disappears. The waveform aligns more closely with the standard waveform, and the phase accuracy is high. In all four cases, the zero-crossing point at 30 μs is accurate. But there is the same problem of tailing vanishing. In the case of −10 dB, the tailing starts to disappear at near 200 μs. As can be seen from the spectrograms, the main peaks of the four spectra are relatively close to each other and the in-band noise is well suppressed.

3.2.3. Comparative Analysis of the Three Methods

A comparison of the output SNR of the simulation results of the three methods is shown in Figure 17. The output SNR statistics of the simulation results of the three methods are shown in Table 1. It can be found that the output signal-to-noise ratio of the improved method and the wavelet hard thresholding process on extracting the eLoran weak signal is much higher than that of the conventional IIR filter. The improved method has an average of 2 dB to 3 dB higher output signal-to-noise ratio than wavelet hard thresholding, and better performance in extracting weak eLoran signals. As can be seen from the comparative waveforms and spectrograms of the output signals of the three methods in the previous section, the output signal spectra of the improved method and the wavelet hard thresholding process also do not have more obvious in-band noise peaks as in the case of the IIR filter, and there is only a single main peak of the eLoran signal, whereas there are multiple noise peaks in the output signal spectra of the IIR filter. In terms of waveform, the signal output by the IIR filter exhibits distortion, and as the input signal-to-noise ratio decreases, the tail phase accuracy declines. In contrast, the signal waveforms output by the improved method and wavelet thresholding only show the issue of tailing disappearance, with better phase accuracy. Among these, the latter produces a superior waveform. In handling tail disappearance and noise with large coefficients, the improved method shows significant improvements. It essentially eliminates noise with higher coefficients and the onset of tail disappearance occurs much later compared to wavelet hard thresholding.

3.3. Final Simulation and Analysis of Three Methods

Based on the literature, this paper will use two types of atmospheric noise caused by lightning, with their respective field strengths being 20 dB and 30 dB higher than the field strength of the signal [23]. Additionally, Gaussian white noise will be superimposed to approximate atmospheric radio noise. The signal-to-noise ratio (SNR) of the signal and Gaussian white noise is −7 dB. Under these conditions, three methods will be used to extract the eLoran signal. The output waveform and the output spectrum are shown in Figure 18 and Figure 19.
It can be observed that after adding the noise caused by lightning, in two cases, both IIR output spectra are almost identical. The IIR output results did not undergo significant changes, with the output being mainly affected by Gaussian white noise. The wavelet hard thresholding method failed to restore the eLoran signal and was significantly affected by the noise caused by lightning. The improved method’s output showed minor changes, with a slight increase in out-of-band noise, indicating that this method has a good suppression effect on both Gaussian white noise and the noise caused by lightning.

3.4. Analogue Source Signal and Actual Signal Test Analysis

3.4.1. Analogue Source Signal Test Analysis

The acquisition of analogue source signals was carried out in the shielded room of the Xi’an Science Park. Signals are generated via eLoran signal analogue sources. The eLoran signals of different sizes were captured using the Jane Instruments acquisition card PXIE-9834. Subsequently, the methods were validated using collected data, processing a data volume of 120 ms. The collected signal levels were 70 dBμV/m, 60 dBμV/m, 50 dBμV/m, 40 dBμV/m, 30 dBμV/m, and 25 dBμV/m, with a sampling rate of 20 M. Additionally, when collecting signals at levels of 30 dBμV/m and 25 dBμV/m, an amplifier was used at the front end of the acquisition card.
A schematic diagram of the six sizes of signals collected is shown in Figure 20. A partial outline of the eLoran signal can be seen in Figure 20a,b. In Figure 20c–f, the eLoran signal is completely submerged.
Under different conditions, the waveform diagrams of the output signals processed by the three methods are shown in Figure 21. Starting from a signal size of 70 dBμV/m, the output waveform of IIR filter is distorted, and in-band noise has a large impact on the signal waveform. A significant delay in the maximum value occurs. Wavelet hard thresholding extracts the 70 dBμV/m and 60 dBμV/m signals well, and the extracted signal has a tailing disappearance. When the signal is less than 60 dBμV/m, there is a serious distortion of the output signal. When the signal size is 25 dBμV/m, the position of the signal cannot be found. The improved method extracts the eLoran signal well under signal sizes of 70 dBμV/m, 60 dBμV/m, 50 dBμV/m, 40 dBμV/m, and 30 dBμV/m. The tailing disappearance problem is better improved compared to the wavelet hard thresholding treatment. When the signal size is 25 dBμV/m, the improved method cannot completely suppress the in-band noise, and the output signal waveform exhibits severe distortion. In that test, the characteristics of the three methods are consistent with the simulation. The improved method can effectively extract eLoran signals with levels of 30 dBμV/m and above.

3.4.2. Actual Signal Test Analysis

The actual signal collection was conducted on 7 April 2024, in the shielded room of the Xi’an Science Park. An Osawa antenna (active loop antenna) was installed on the rooftop to receive signals in the 9 kHz to 150 kHz frequency range. The signal was transmitted via cable to the shielded room and was then collected using the Jane Instruments acquisition card PXIE-9834 with a sampling rate of 20 MHz. The acquired signal is shown in Figure 22, where the signal is almost completely drowned out by noise.
The results of the three methods after processing a data volume of 120 ms are shown in Figure 23, Figure 24 and Figure 25. The corresponding spectrum is shown in Figure 26. It can be seen that the input signal contains eLoran pulse sets of two amplitudes. Since the Xi’an Science Park is closer to Pucheng station and the Group Repetition Interval (GRI) of the pulse group with larger amplitude is about 60 ms, it can be judged that the pulse group is the signal transmitted by Pucheng station. The GRI of the pulse group with a smaller amplitude is about 83.9 ms, and there are nine pulses in the pulse group, so it can be judged that the pulse group is the signal transmitted by Xuancheng station. It is far from the Xi’an Science Park, about 1000 km away. According to the reference ITU-R P. 368, when the transmission power is 1 kW and the propagation distance is 1000 km, the ground wave propagation reception field strength is 44.77 dBμV/m [24]. However, the peak transmission power of the Xuancheng station exceeds 2 MW [25], which is 2000 times that of 1 kW. The corresponding ground wave propagation reception field strength should be much greater than 44.77 dBμV/m, within the simulation range discussed in Section 3.4.1, and it will not approach the limit of the method designed in this paper. As can be seen from Figure 23, although the IIR filter is able to extract the eLoran signal, the signal waveform is severely distorted with a time lag at the highest point. As can be seen from Figure 24, the wavelet hard thresholding process is unable to extract the eLoran signal out in this environment, and even the signal waveform of the Pucheng station, which has a higher signal strength, is severely distorted. According to the principle, it can be learnt that the large noise coefficient makes it necessary to set the threshold too large in order to filter out most of the noise, and the threshold at this time will also make a large amount of useful signal information lost, resulting in a poor extraction effect. As can be seen in Figure 25, the improved method is able to extract the eLoran signal without large distortion of the signal waveforms. The preprocessing effectively reduces the threshold value, allowing more useful information to be retained while filtering out noise. The extracted signal is treated as the useful signal for power calculation. The location of the signal is then used to determine the pure noise regions, which are used to calculate the noise power. Substituting this into the input SNR calculation formula, we obtain the following equation:
S N R = 10 × l g { k = m n x 2 ( k ) n m + 1 q = o p y 2 ( q ) p o + 1 }
where x ( k ) is the useful signal, y ( q ) is the pure noise, and n m + 1 and p o + 1 are the number of points corresponding to the two components.
Using the formula, the input signal-to-noise ratio can be calculated to be −28.8 dB. Based on testing with real signals, the improved method proves to be a suitable and effective approach for extracting weak eLoran signals. It provides strong support for signal monitoring in eLoran coverage boundary areas.

4. Conclusions

In this paper, we investigate the eLoran signal regime by using software simulations to generate input signals with different signal-to-noise ratios. Three methods are tested by simulation, analogue source signal, and actual signal. The following conclusions were obtained:
(1)
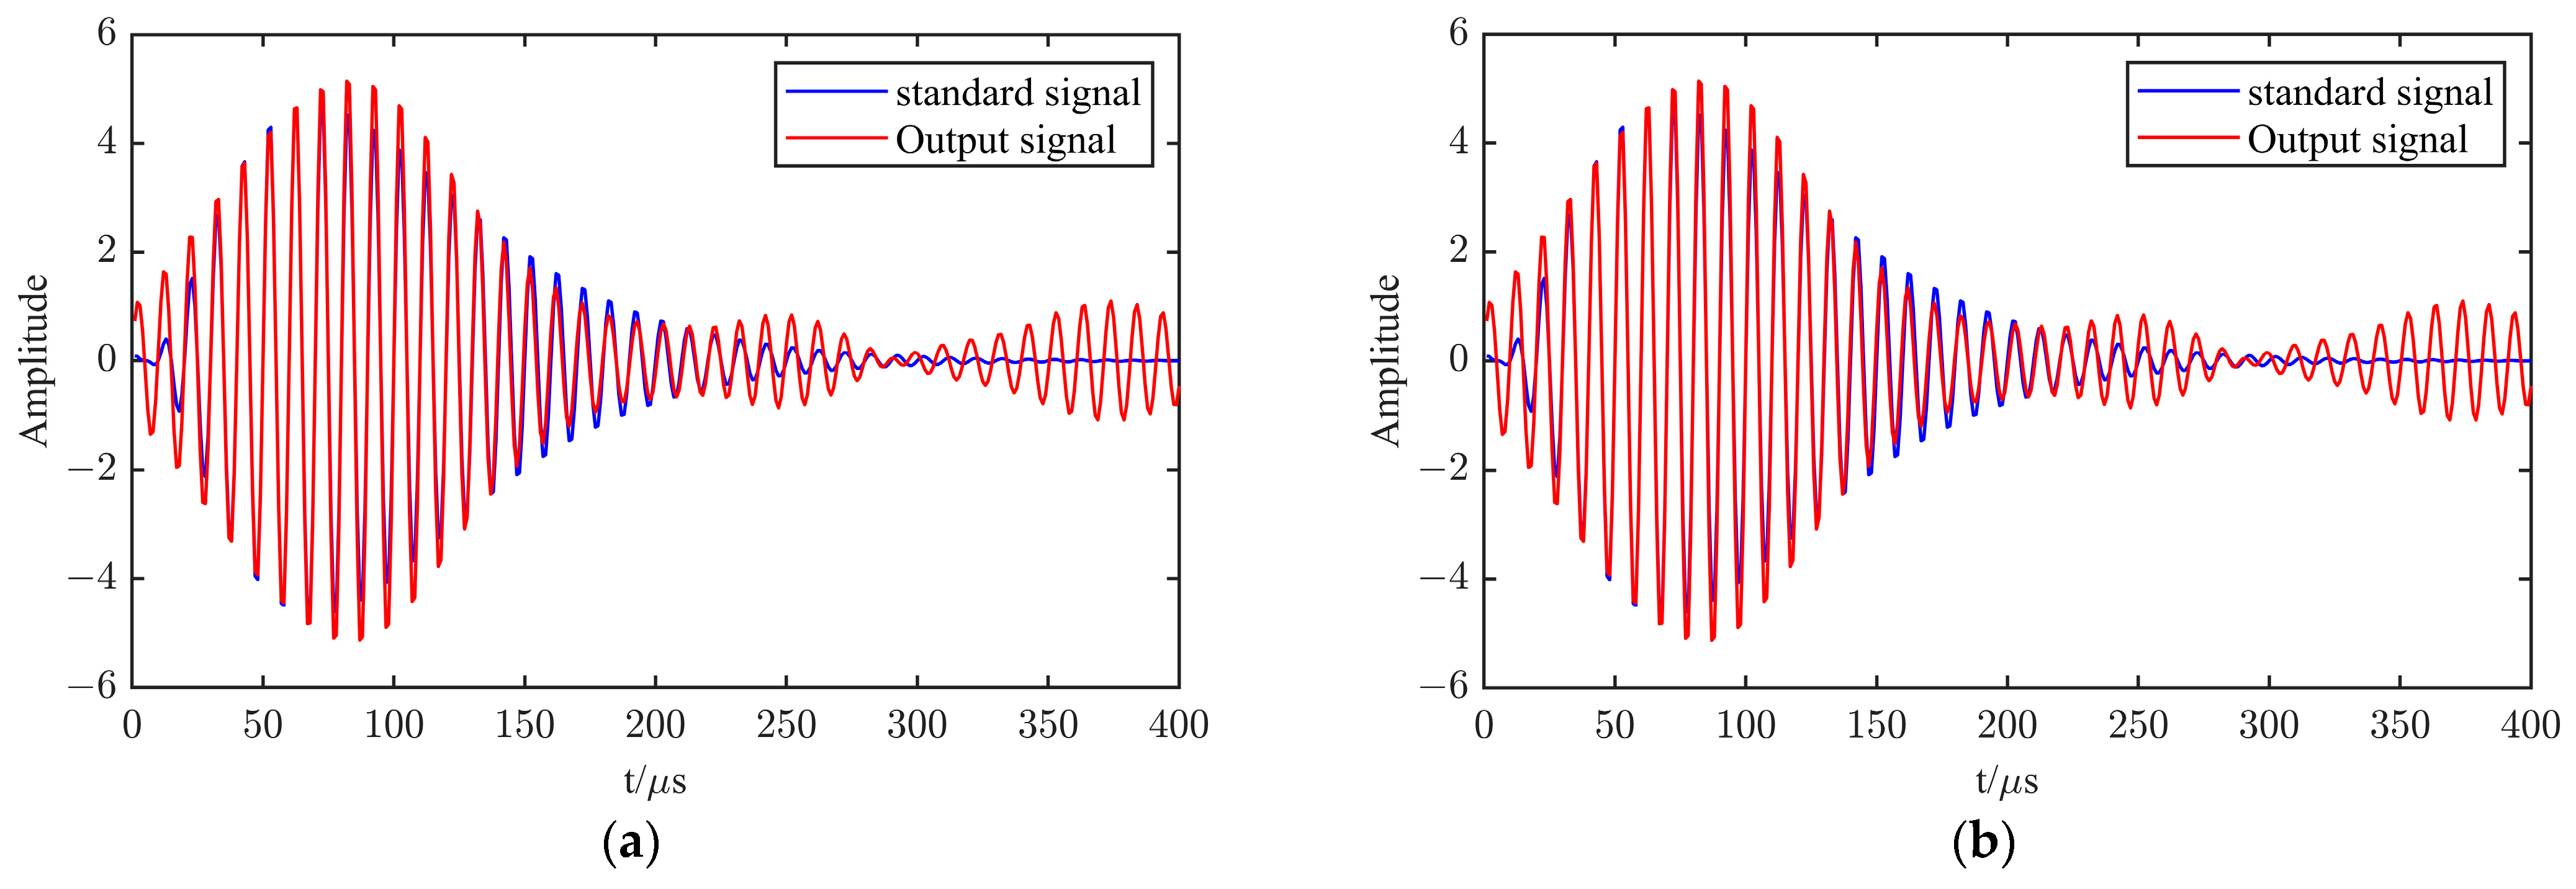
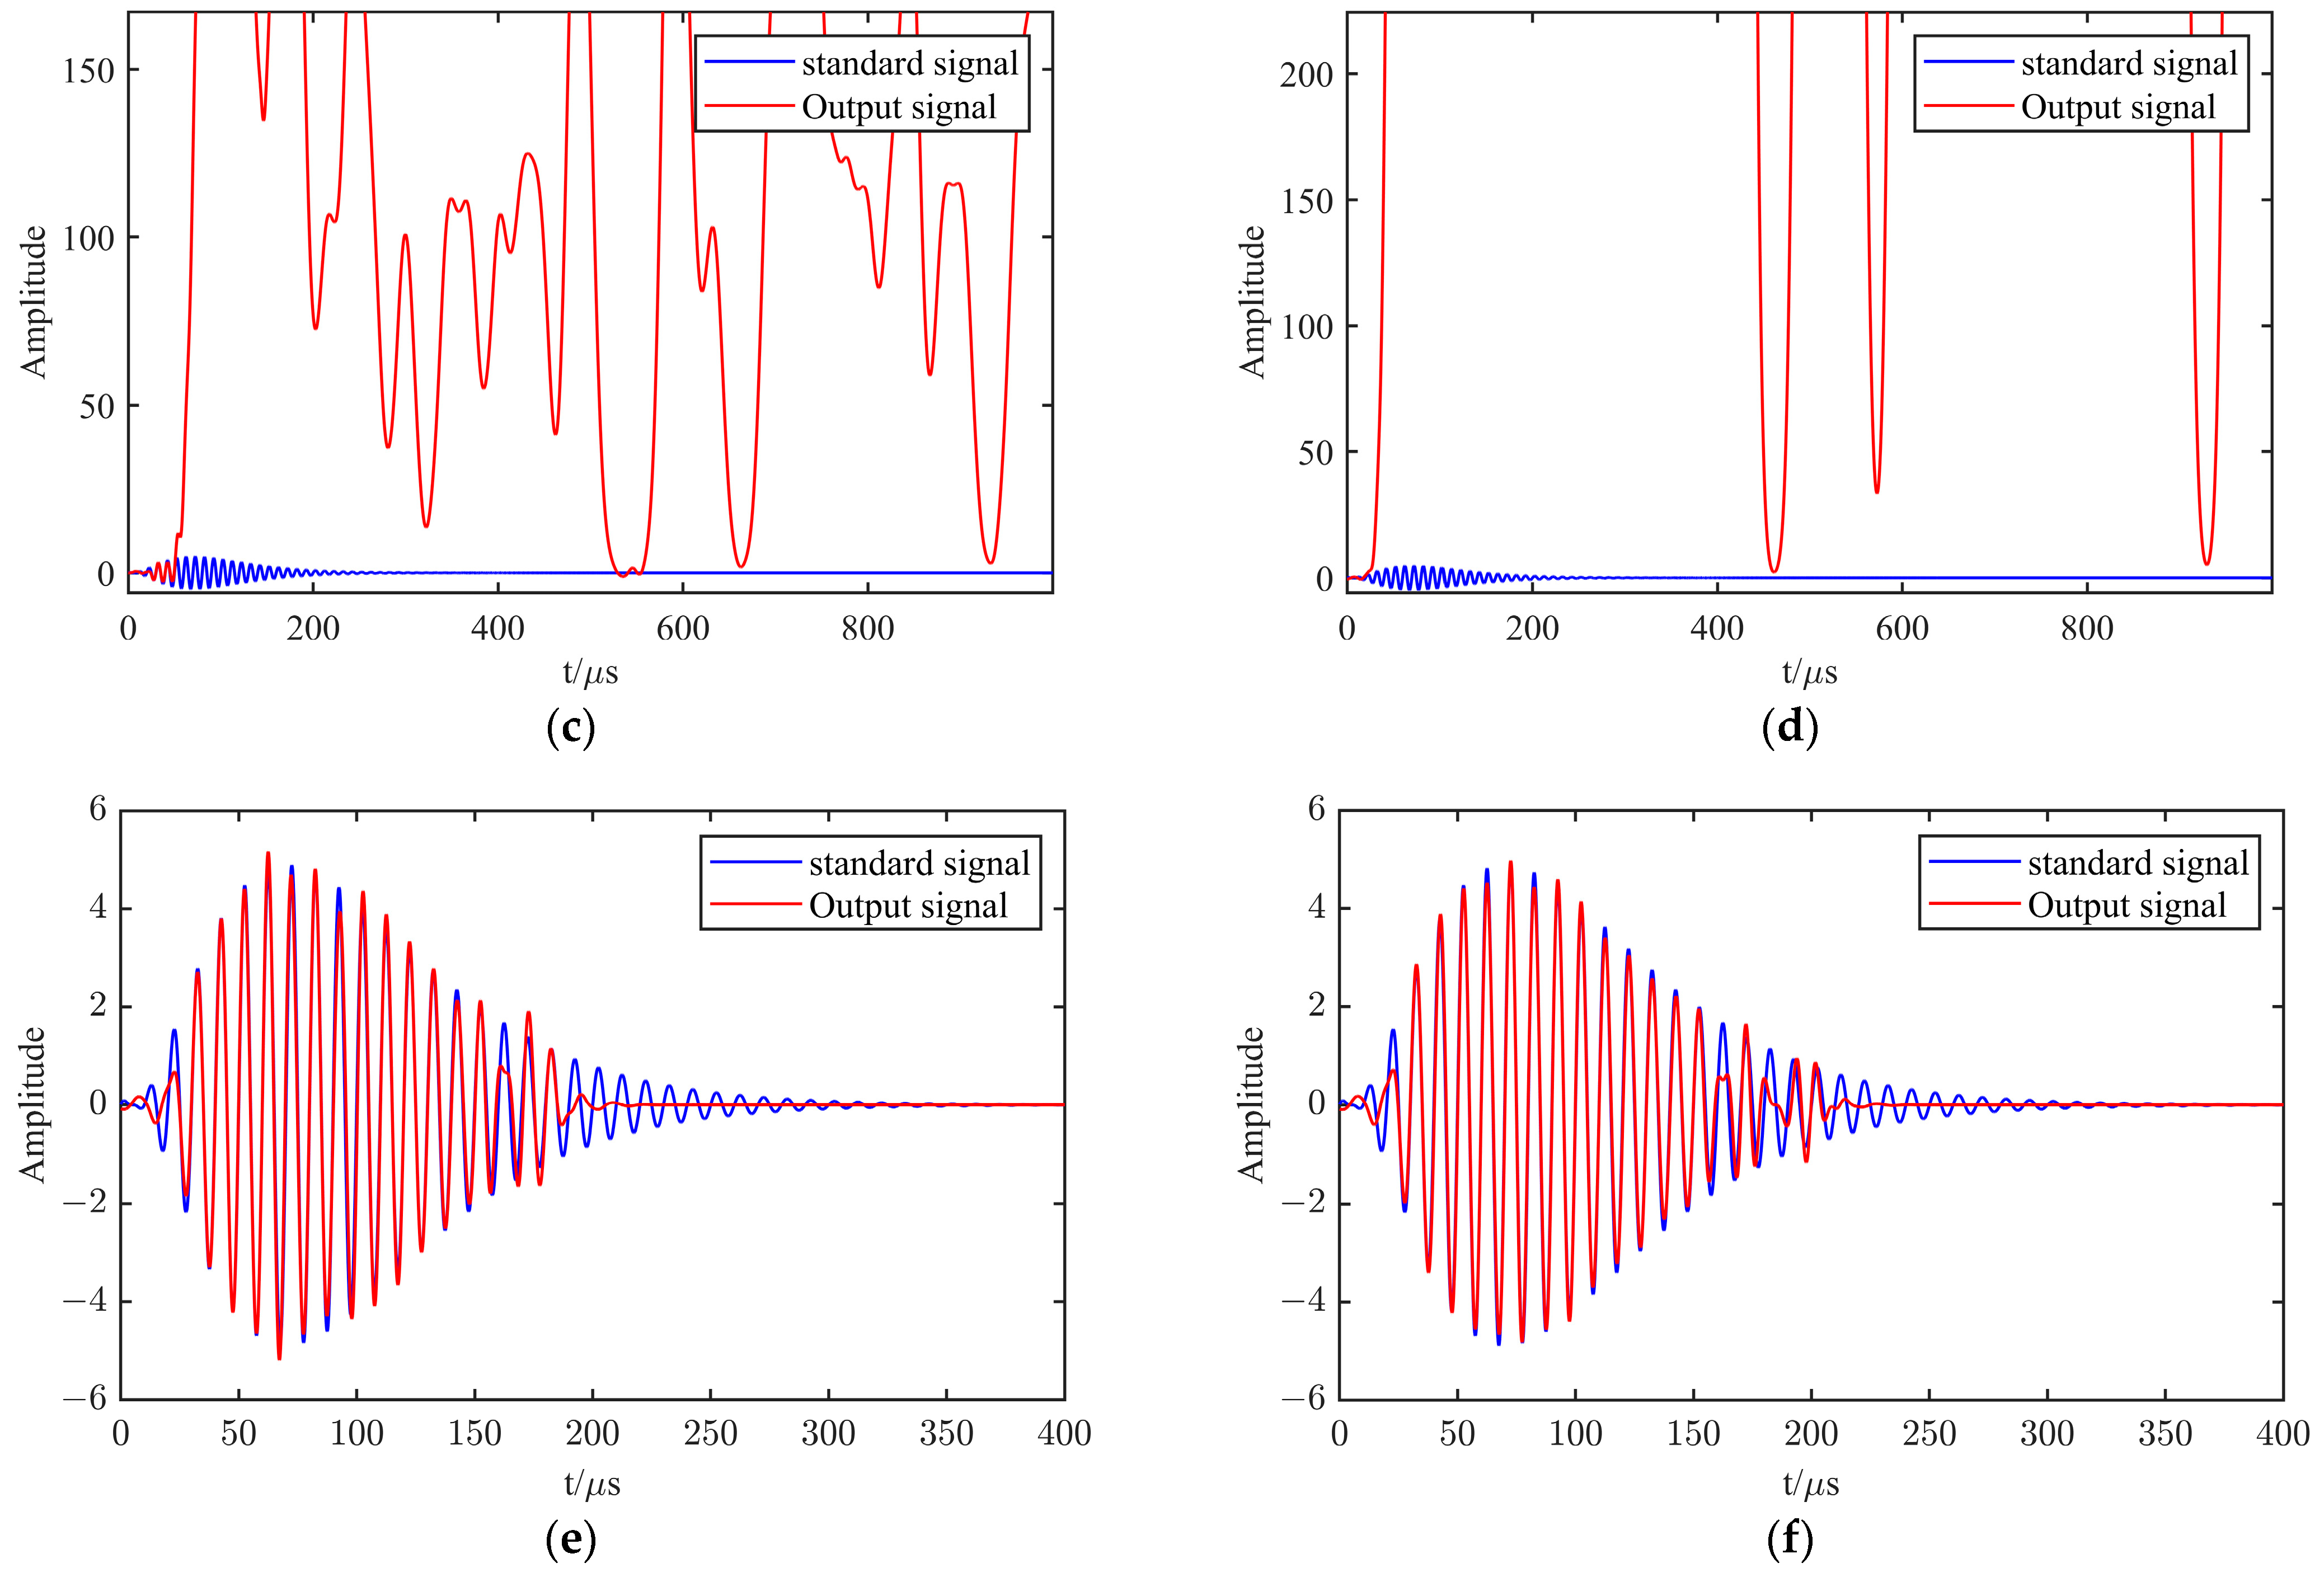
The IIR filter is not able to remove the noise present in the frequency band where the eLoran signal is located when extracting the weak eLoran signal. Noise peaks of various frequencies exist in the frequency band. As the input signal-to-noise ratio decreases, the effect of in-band noise intensifies. The extracted eLoran signal waveform will be distorted. The peak value shows a significant delay. Phase accuracy also decreases with the reduction of the signal-to-noise ratio. Although this method is significantly affected by white noise, it can effectively suppress atmospheric noise caused by lightning.
(2)
When wavelet hard thresholding is used to extract the weak eLoran signal, the sampling rate should be 20 MHz, the number of decomposition layers should be chosen from 7 to 9, and the Dmeyer wavelet basis should be chosen. In the simulation of this condition, the wavelet hard thresholding process removes the noise in the frequency band well. Only the main peak of the eLoran signal exists in the frequency band. The out-of-band noise amplitude is very small, much smaller than the in-band signal amplitude. This method obtains a high signal-to-noise ratio for eLoran signals, and suffers from the problems of tailing disappearance and the difficulty of removal of some noises with high coefficients. As the noise increases, more of the output signal’s tail disappears. In addition, this method cannot suppress the noise caused by lightning, making it unable to extract the eLoran signal under conditions of high lightning-induced noise.
(3)
The output signal-to-noise ratio of the improved method is much higher than the result of the conventional IIR filter, and is also better than the wavelet hard thresholding process overall. It can solve the problem of in-band noise while suppressing out-of-band noise, and the overall waveform is much better than the output of traditional IIR filters. At the same time, it basically eliminates some of the noise with large coefficients and retains more of the waveform tailing. The phase accuracy is high, and it can simultaneously suppress both Gaussian white noise and noise caused by lightning. It is a good eLoran weak signal extraction method.
(4)
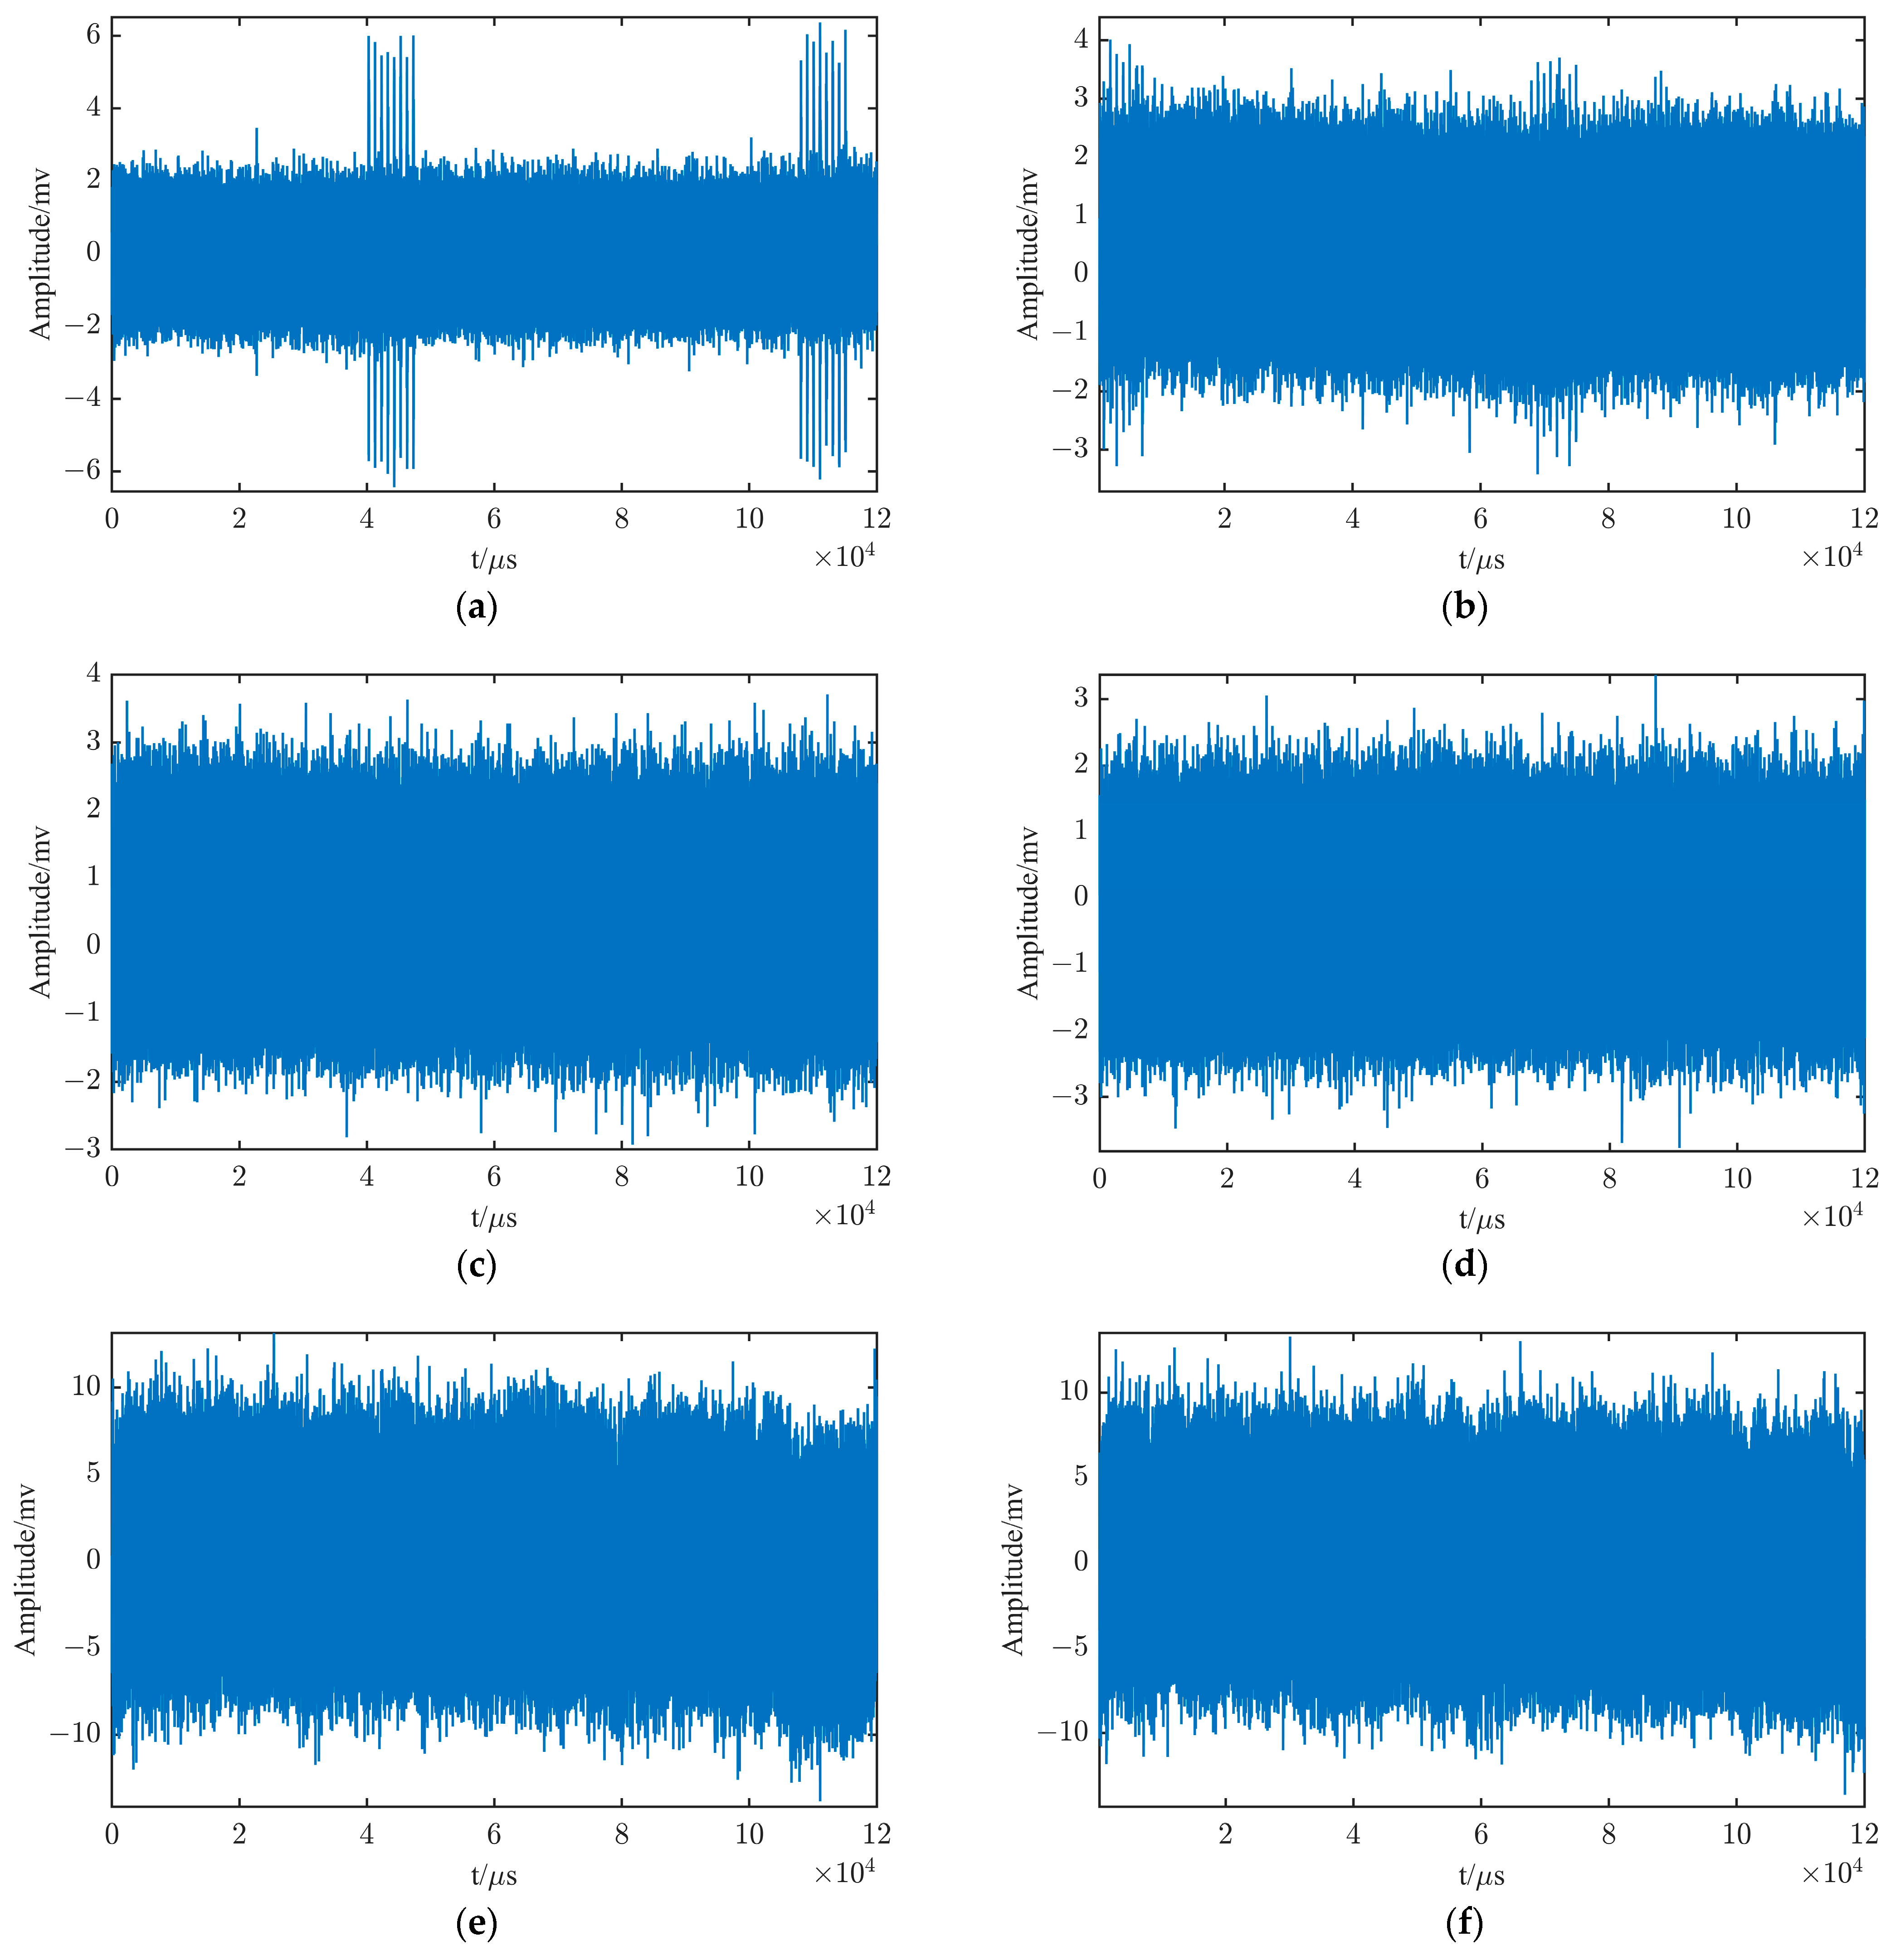
In the test of analogue source signals, the characteristics of the three methods agree with the simulation. Among them, the improved method has better results and can intactly extract eLoran signals with levels above 30 dBμV/m.
(5)
In real signal testing, wavelet hard thresholding cannot extract the eLoran signal. IIR filter can extract the eLoran signal, but the waveform is severely distorted. The improved method can extract the eLoran signal and the waveform is only partially distorted. Based on the results, the input signal-to-noise ratio can be estimated to be −28.8 dB, which is an extremely low signal-to-noise ratio. This shows that the method is a suitable and effective eLoran weak signal extraction method, which provides a strong guarantee for signal monitoring in the border area of eLoran signal coverage.

Author Contributions

L.C. proposed the algorithm and wrote the article; S.Z. performed review and editing; Z.Q., X.W. and Y.C. performed the experiments and completed the data processing; P.F. analyzed the test data. All authors have read and agreed to the published version of the manuscript.

Funding

This work was mainly supported by the Youth Innovation Promotion Association of the Chinese Academy of Sciences (No. 2021410) and the Guangdong Province Science and Technology Project (Grant No. 2019B090904006).

Data Availability Statement

All data were obtained by experiments.

Acknowledgments

The authors are thankful to their teachers and seniors for helping them in their research studies. We are also grateful to our reviewers, who provided insights and expertise that greatly assisted our research efforts.

Conflicts of Interest

The authors declare no conflicts of interest.

References

  1. Zhang, H.; Xu, B.; Li, H.; Liao, D.; Chen, H. Prospects for Development of LORAN-C Navigation System for Building up National Comprehensive PNT System. J. Astronaut. Metrol. Meas. 2020, 40, 6–11. [Google Scholar]
  2. Chen, Y. Research of eLoran Time Service Monitoring Evaluation Method and System Design. Ph.D. Thesis, University of Chinese Academy of Sciences, Beijing, China, 2022. [Google Scholar] [CrossRef]
  3. International Loran Association. Enhanced Loran (eLORAN) Definition Document; 2007; Available online: https://rntfnd.org/wp-content/uploads/eLoran-Definition-Document-0-1-Released.pdf (accessed on 16 July 2024).
  4. Xu, Z.; Wu, Y.; Zhang, L.; Li, Y. Adaptive Fourier Decomposition Based Signal Extraction on Weak Electromagnetic Field. In Proceedings of the ICASSP 2024—2024 IEEE International Conference on Acoustics, Speech and Signal Processing (ICASSP), Seoul, Republic of Korea, 14–19 April 2024; IEEE: Piscataway, NJ, USA, 2024; pp. 9446–9450. [Google Scholar]
  5. Kalman, R.E. A New Approach to Linear Filtering and Prediction Problems. J. Basic Eng. 1960, 82D, 35–45. [Google Scholar] [CrossRef]
  6. Zhao, X.; Wang, L.; Chen, Z.; Shao, P.; Chen, R. Weak Signal Detection Method Based on Bayesian Neural Network. In Proceedings of the 2023 IEEE 6th International Conference on Pattern Recognition and Artificial Intelligence (PRAI), Haikou, China, 18–20 August 2023; IEEE: Piscataway, NJ, USA, 2023; pp. 816–822. [Google Scholar]
  7. Wang, Y.; Huang, H. Research on Chemical Weak Signal Detection Based on Stochastic Resonance Algorithm. In Proceedings of the 2023 International Conference on Power, Electrical Engineering, Electronics and Control (PEEEC), Athens, Greece, 25–27 September 2023; IEEE: Piscataway, NJ, USA, 2023; pp. 754–759. [Google Scholar] [CrossRef]
  8. Weili, T. Research on Signal Process in the Front of Loran-C Receiver. Master’s Thesis, Xidian University, Xi’an, China, 2007. [Google Scholar]
  9. Yanwei, S. Study on Key Technologies of eLoran Signal Processing. Master’s Thesis, Harbin Engineering University, Harbin, China, 2019. [Google Scholar]
  10. Zeng, T.; Hua, Y.; Wang, X.; Yan, W. Research on Pretreatment Method of eLORAN Received Signal Based on Spectral Subtraction. In Proceedings of the 2019 IEEE 4th Advanced Information Technology, Electronic and Automation Control Conference (IAEAC), Chengdu, China, 20–22 December 2019; IEEE: Piscataway, NJ, USA, 2019; pp. 605–612. [Google Scholar]
  11. Jie, W.; Rui, L. Introduction to Long-Range Land-Based Radio Navigation Systems, 1st ed.; Science Press: Beijing, China, 2017; pp. 95–104. [Google Scholar]
  12. Ruikun, Z. FIR and IIR Digital Filter Designing Based on MATLAB. Master’s Thesis, Jilin University, Changchun, China, 2012. [Google Scholar]
  13. Proakis, J.G.; Manolakis, D.G. Digital Signal Processing Principles, Algorithms, and Applications, 4th ed.; Publishing House of Electronics Industry: Beijing, China, 2014; pp. 481–540. [Google Scholar]
  14. Gupta, V.; Mahle, R.; Shriwas, R.S. Image Denoising Using Wavelet Transform Method. In Proceedings of the 2013 Tenth International Conference on Wireless and Optical Communications Networks (WOCN), Bhopal, India, 26–28 July 2013; IEEE: Piscataway, NJ, USA, 2013; pp. 1–4. [Google Scholar]
  15. Dong, X. Extracting Characteristic Information of Weak Signal from Strong Noise Background by Wavelet Analysis. Master’s Thesis, Wuhan University, Wuhan, China, 2003. [Google Scholar]
  16. Yang, G.; Song, Y.; Du, J. Speech Signal Denoising Algorithm and Simulation Based on Wavelet Threshold. In Proceedings of the 2022 4th International Conference on Natural Language Processing (ICNLP), Xi’an, China, 25–27 March 2022; IEEE: Piscataway, NJ, USA, 2022; pp. 304–309. [Google Scholar]
  17. Xin, L. Research on Weak Signal Extraction in a Strong Noise Environment Based on Wavelet Analysis. Master’s Thesis, Nanjing University, Nanjing, China, 2012. [Google Scholar]
  18. Donoho, D.L. De-Noising by Soft-Thresholding. IEEE Trans. Inf. Theory 1995, 41, 613–627. [Google Scholar] [CrossRef]
  19. Nie, X. Research on Extraction and Application of Weak Signals Based on Wavelet Transform. Master’s Thesis, Beijing University of Civil Engineering and Architecture, Beijing, China, 2015. [Google Scholar]
  20. Gan, Z.; Xu, X.; Qiu, Y.; Xie, T.; Chang, Y.; Wu, X.; Zhao, R. Application of Improved Wavelet Threshold Denoising Method in Power Quality Signals with Noise. In Proceedings of the 2023 4th International Conference on Advanced Electrical and Energy Systems (AEES), Shanghai, China, 1–3 December 2023; IEEE: Piscataway, NJ, USA, 2023; pp. 156–160. [Google Scholar] [CrossRef]
  21. Fu, R.; Zhang, J.; Wang, R.; Xu, T. Improved Wavelet Thresholding Function and Adaptive Thresholding for Noise Reduction. In Proceedings of the 2023 11th International Conference on Intelligent Computing and Wireless Optical Communications (ICWOC), Chongqing, China, 16–18 June 2023; IEEE: Piscataway, NJ, USA, 2023; pp. 25–30. [Google Scholar]
  22. ITU-R P.372-16; Radio Noise. ITU: Geneva, Switzerland, 2022.
  23. Varlamov, V.O.; Waal, A.; Varlamov, O.V. Maximum Levels of Atmospheric Radio Noise Affecting Digital Radio Broadcasting in the LF and MF Bands in Various Regions. In Proceedings of the 2023 International Conference on Engineering Management of Communication and Technology (EMCTECH), Vienna, Austria, 16–18 October 2023; IEEE: Piscataway, NJ, USA, 2023; pp. 1–6. [Google Scholar] [CrossRef]
  24. ITU-R P.368-10; Ground-Wave Propagation Prediction Method for Frequencies between 10 kHz and 30 MHz. ITU: Geneva, Switzerland, 2022.
  25. Liu, X.; Hu, A. Research on Application Extension of Long Wave Navigation System. China Acad. J. Electron. Publ. House 2013, 4, 116–119. [Google Scholar]
Figure 1. eLoran Standard Signal Waveform.
Remotesensing 16 03012 g001
Figure 2. Spectrogram of eLoran standard signal.
Remotesensing 16 03012 g002
Figure 3. Flowchart of wavelet hard thresholding.
Remotesensing 16 03012 g003
Figure 4. Signal decomposition reconstruction process diagram.
Remotesensing 16 03012 g004
Figure 5. Specific flowchart of the improvement method.
Remotesensing 16 03012 g005
Figure 6. Comparison of input signal and standard signal waveforms under different conditions: (a) 0 dB; (b) −5 dB; (c) −7 dB; (d) −10 dB.
Remotesensing 16 03012 g006
Figure 7. Comparison of output signal waveforms of IIR filters under different conditions: (a) 0 dB; (b) −5 dB; (c) −7 dB; (d) −10 dB.
Remotesensing 16 03012 g007
Figure 8. Spectrogram of the output signal of IIR filter with different input signal-to-noise ratios.
Remotesensing 16 03012 g008
Figure 9. Simulation flowchart.
Remotesensing 16 03012 g009
Figure 10. Comparison of output signal-to-noise ratios after different wavelet bases hard thresholding treatments.
Remotesensing 16 03012 g010
Figure 11. Comparison of output SNR at different sampling rates.
Remotesensing 16 03012 g011
Figure 12. Comparison of output SNR at different decomposition levels.
Remotesensing 16 03012 g012
Figure 13. Comparison of wavelet hard thresholding output signal waveforms under different conditions: (a) 0 dB; (b) −5 dB; (c) −7 dB; (d) −10 dB.
Remotesensing 16 03012 g013
Figure 14. Spectrograms of wavelet hard thresholding output signals under different conditions.
Remotesensing 16 03012 g014
Figure 15. Comparison of the output signal waveforms of the improved method under different conditions: (a) 0 dB; (b) −5 dB; (c) −7 dB; (d) −10 dB.
Remotesensing 16 03012 g015
Figure 16. Spectra of the output signals of the improved method under different conditions.
Remotesensing 16 03012 g016
Figure 17. Comparison of the SNR of the output of the three methods.
Remotesensing 16 03012 g017
Figure 18. Output waveforms of the three methods under different conditions: (a) IIR filter: 20 dB; (b) IIR filter: 30 dB; (c) wavelet hard thresholding: 20 dB; (d) wavelet hard thresholding: 30 dB; (e) improved method: 20 dB; (f) improved method: 30 dB.
Remotesensing 16 03012 g018aRemotesensing 16 03012 g018b
Figure 19. Output spectrograms of the three methods under different conditions: (a) IIR filter; (b) wavelet hard thresholding; (c) improved method.
Remotesensing 16 03012 g019
Figure 20. Schematic diagram of input waveforms of different signal sizes: (a) 70 dBμV/m; (b) 60 dBμV/m; (c) 50 dBμV/m; (d) 40 dBμV/m; (e) 30 dBμV/m; (f) 25 dBμV/m.
Remotesensing 16 03012 g020
Figure 21. Schematic of the output signal waveform of three methods under different conditions: (a) 70 dBμV/m; (b) 60 dBμV/m; (c) 50 dBμV/m; (d) 40 dBμV/m; (e) 30 dBμV/m; (f) 25 dBμV/m.
Remotesensing 16 03012 g021
Figure 22. Input signal waveform.
Remotesensing 16 03012 g022
Figure 23. IIR filter output signal waveform: (a) output signal; (b) single pulse.
Remotesensing 16 03012 g023
Figure 24. Wavelet hard thresholding output signal waveform: (a) output signal; (b) single pulse.
Remotesensing 16 03012 g024
Figure 25. Output signal waveform of the improved method: (a) output signal; (b) single pulse.
Remotesensing 16 03012 g025
Figure 26. Output signal spectrum of three methods: (a) IIR filter and improved method; (b) wavelet hard thresholding.
Remotesensing 16 03012 g026
Table 1. Statistics of the output SNR of the simulation results of the three methods.
Input SNRIIR FilterWavelet Hard ThresholdingImproved Method
0 dB12.7 dB21.3 dB23.4 dB
−5 dB10.1 dB15.8 dB18.5 dB
−7 dB6.4 dB14.5 dB16.0 dB
−10 dB5.1 dB12.6 dB14.8 dB
Disclaimer/Publisher’s Note: The statements, opinions and data contained in all publications are solely those of the individual author(s) and contributor(s) and not of MDPI and/or the editor(s). MDPI and/or the editor(s) disclaim responsibility for any injury to people or property resulting from any ideas, methods, instructions or products referred to in the content.

