Article

Statistical Analysis of the Correlation between Geomagnetic Storm Intensity and Solar Wind Parameters from 1996 to 2023

1
National Institute of Natural Hazards, Ministry of Emergency Management of China, Beijing 100085, China
2
National Space Science Center, Chinese Academy of Sciences, Beijing 100190, China
3
School of Space and Environment, Beihang University, Beijing 100191, China
4
School of Emergency Management Science and Engineering, University of Chinese Academy of Sciences, Beijing 100049, China
*
Author to whom correspondence should be addressed.
Remote Sens. 2024, 16(16), 2952; https://doi.org/10.3390/rs16162952
Submission received: 26 June 2024 / Revised: 5 August 2024 / Accepted: 5 August 2024 / Published: 12 August 2024
(This article belongs to the Section Environmental Remote Sensing)

Abstract

:
The occurrence of space weather events, notably geomagnetic storms driven by various solar wind structures, can significantly alter Earth’s electromagnetic environment. In this study, we examined the interplanetary origins and statistical distribution of 384 geomagnetic storms ( D s t m i n   −50 nT) that occurred from September 1996 to December 2023. We statistically analyzed the correlations between storm intensity and solar wind parameters (SWPs) across different subsets. The results indicate that (1) the solar activity level, indicated by the sunspot number (SSN), and the number of geomagnetic storms during the first four years of the 25th solar cycle were intermediate, compared to the first four years of the 23rd and 24th solar cycles. Specifically, ICME-related structures caused 80% of the strong storms ( D s t m i n   −100 nT) and 34% of the moderate storms (−100 nT < D s t m i n   −50 nT) from 2020 to 2023. (2) The storm intensity correlated with the peak and/or time-integral values of the southward interplanetary magnetic field (IMF B s ), the dawn–dusk electric field ( E y ), the Akasofu’s function ( ε ), and dynamic pressure ( P s w ) to varying extents. Strong storms exhibited higher correlation levels than moderate ones and ICME-related storms showed larger correlation levels compared to those driven by other sources. (3) Compared with the storms from 1996-09 to 2000-08, the storms that occurred from 2020 to 2023 had lower correlations with the peak values of the IMF B s and E y but higher correlations with the peak value of ε and the time-integral values of the IMF B s , E y , P s w , and ε . (4) Among the 174 events that featured continuous southward IMF during the storm’s main phase, the duration of southward IMF during about 66.7% of moderate storms and 51.5% of strong storms were less than 13 h. Continuous southward IMF resulted in more direct and efficient energy coupling, enhancing the correlation between the peak values of SWPs and storm intensity but weakening the relationships with the time-integral values of SWPs. Notably, when the southward IMF persisted for a longer duration (e.g., ∆t > 13 h), the continuous energy input further enhanced correlations with both peak and integral values of SWPs, leading to stronger overall correlations with storm intensity. This analysis sheds light on the intricate relationships between geomagnetic storms and their solar wind drivers, emphasizing the significant influence of ICME-related structures and the duration of southward IMF on storm intensity.

1. Introduction

The eruption of solar activity releases immense energy in various forms such as coronal mass ejections (CMEs) and corotating interaction regions (CIRs). These eruptions involve the expulsion of plasma and magnetic flux at high velocities from the solar corona or coronal holes into the solar wind [1,2]. Under specific conditions, the energy carried by the solar wind (SW) can penetrate the Earth’s magnetosphere, precipitating space weather events, including geomagnetic storms and substorms. The occurrence of space weather events, particularly strong geomagnetic storms with D s t m i n   −100 nT, can severely disrupt the Earth’s magnetosphere and geomagnetic field. These disturbances alter the space electromagnetic environment, posing risks to the safety of spacecraft and astronauts, interrupting radio communications and endangering ground-based power grids [1,2,3]. Understanding the mechanisms of energy transfer from the sun to near-Earth space, as well as the development processes of magnetospheric disturbances, is crucial for advancing space weather forecasting. Such knowledge is essential for protecting human society from the adverse impacts of space weather events.
The southward interplanetary magnetic field (IMF) is a primary parameter driving magnetospheric disturbances and plays a crucial role in the development of geomagnetic storms. Eruptions of solar activity lead to variations in the solar wind, embedded with intervals of southward IMF (IMF B s , characterized by IMF B z < 0 nT), propagating outward from the Sun [4]. When these dynamic solar wind structures reach Earth, energy transfer occurs through complex interactions at the magnetopause. One of the main interactions is magnetic reconnection, which represents a simplified model of the magnetospheric response to interplanetary conditions. In reality, the magnetosheath region undergoes significant plasma and magnetic field fluctuations, causing rotations and variations in the magnetic field vector at the magnetopause [1,5,6,7,8]. The energy is eventually dissipated through the ring current, auroral precipitation, and Joule heating, leading to varying intensities of geomagnetic storms [9,10,11,12,13,14,15]. During a geomagnetic storm, the persistence of a southward IMF is a critical factor influencing the storm’s development and intensity. A sustained southward IMF promotes magnetic reconnection at the dayside magnetopause, enhancing energy and mass transfer from the solar wind into the Earth’s magnetosphere [5]. Long-duration southward IMF episodes provide continuous energy input into the magnetosphere, intensifying the storm’s impacts. Conversely, when the IMF turns northward, it inhibits magnetic reconnection at the dayside magnetopause, thus reducing the efficiency of energy transfer from the solar wind into the Earth’s magnetosphere. Frequent north–south directional changes in the IMF can further disrupt the efficient transfer of energy, causing inconsistent energy input and reducing the conversion efficiency of solar wind energy into magnetospheric energy, thereby affecting the intensity of geomagnetic storms. These fluctuations induce complex internal dynamics within the magnetosphere. Moreover, the ring current, which significantly affects storm intensity, may experience varying levels of enhancement and decay, further complicating the relationship between external solar wind conditions and observed storm intensity.
Different types of solar wind structures exhibit distinct IMF patterns. For interplanetary coronal mass ejections (ICMEs), characteristic features observed in situ include a smoothly enhanced magnetic field and gradual changes in field direction (IMF B y or B z rotations) [16,17]. Additional indicators of ICMEs include a declining profile of solar wind speed, a relatively low plasma beta β < 1 [18], and abnormally low proton and electron temperatures with T p < T e x p / 2 (if V s w < 500 k m / s compared to T e x p = 0.031 V s w 5.1 2 ; if V s w 500 k m / s , then T e x p = 0.51 V s w 142 ) [16,19]. ICMEs are also marked by an elevated helium-to-proton abundance ratio ( n H e + + / n H + > 0.06) [20]. The subset of ICMEs known as magnetic clouds (MCs) can be identified by an enhanced magnetic field rotating smoothly through a large angle, low plasma beta ( β < 1), and low proton temperature ( T p < T e x p / 2 ) [17,18,21,22,23]. CIRs, forming as the compression zones between fast and slow solar wind streams emanating from low-latitude coronal holes near the subsolar point, exhibit high solar wind density, elevated magnetic field pressure and strength, significant magnetic field variability, and boundaries inclined at a small angle to the radial direction [24,25,26,27,28]. Both ICMEs and CIRs are capable of driving interplanetary Shocks [29,30]. Such Shocks are characterized by abrupt simultaneous increases in solar wind speed, density, temperature, and IMF strength [28,31,32,33]. The region between the Shock and the ICME front, known as the Sheath region, features enhanced magnetic field strength, rapid variations in field direction, and increasing particle temperature, density, and speed [22,34]. Typically, ICMEs can induce prolonged and relatively stable southward IMF compared to CIRs and Sheath regions, with high density, temperature, and magnetic field variability [14,35].
Different types of solar wind structures can cause different types of geomagnetic storms. ICME-driven storms are predominant during solar maximum due to their higher occurrence rates and velocities during this period. Conversely, CIR-driven storms dominate the declining phase of the solar cycle, characterized by the 27-day recurrence of high-speed streams [36]. Compared to CIR-driven storms, ICME-driven storms tend to be brief but involve stronger ring currents [36,37]. Although ICME-driven storms have a higher average energy output, their efficiency is lower [15]. Research by Yermolaev et al. [38] revealed that approximately 55% of storms with D s t m i n   −50 nT between 1976 and 2000 were associated with MCs, 15% with Sheaths, and around 20% with CIRs. The average intensity of storms associated with ICMEs during 1996–2009 is −76 nT, in which 26% of ICME-driven storms are associated with strong storms ( D s t m i n   −100 nT) and 6% with big storms ( D s t m i n   −200 nT) [22]. Almost all of the strong storms were associated with shocks and ICMEs, while driver statistics for moderate storms (−100 nT < D s t m i n   −50 nT) were different in different phases of the solar cycle [33,39,40,41,42].
The IMF and solar wind plasma parameters (SWPs) play significant roles in influencing the development and intensity of geomagnetic storms. The southward component of the IMF is the primary parameter driving magnetospheric disturbances [5,9,43]. Therefore, empirical storm criteria are based on the values and duration of the IMF B s : intense storms are IMF B z   −10 nT and last for 3 h and moderate storms are IMF B z   −5 nT and last for 2 h [1,44]. Researchers have statistically analyzed the correlation of storm intensity with peak values [30,33,40,41,45,46], averaged values [47], and time-integral values [46,48] of SWPs over various periods. The results indicate that D s t m i n is well correlated with the IMF B s and the dawn–dusk component of the solar wind electric field E y . For instance, Wu and Lepping [30,45,46,47,48] identified the Pearson linear correlation coefficients (CCs) of D s t m i n with the peak values of the IMF B z , E y , and the solar wind–magnetosphere coupling function Akasofu’s epsilon parameter ε ( ~   V s w B t 2 s i n 4 ( θ 2 ) , details shown in Section 2) in MCs were 0.77, −0.79, and −0.72, respectively, all of which are stronger than the correlation of D s t m i n with the solar wind speed V s w m a x (~ −0.58). The CCs vary under different solar wind speeds and sources of IMF B z . The CCs of D s t m i n with B z m i n , E y m a x , and V s w m a x for moderate storms are 0.48, 0.55, and 0.08, respectively, which are lower than those for strong storms (0.8, 0.84, and 0.55) during the 23rd solar cycle [33,41]. Using averaged values, Wang et al. [47] statistically studied 105 storms with D s t m i n   −50 nT during the period 1998–2001. They found that the majority (63%) of events are concentrated in the region of 3 h   Δ t < 11 h and that 95% of events are concentrated in the region of 3 nT   B z ¯   < 16 nT. Moderate storms were scattered over a broader range from 1 h to 28 h, while strong storms were concentrated in a narrower range from 2 h to 14 h. They developed an empirical formula D s t m i n = 19.01 8.43 V B z ¯ 1.09 Δ t 0.30 , indicating that V B z is more critical than Δ t in the formation of storms. Le et al. [48], using 67 strong storms during 1998–2006, found that the CCs of S y m H m i n with the time-integral values of negative IMF B z and positive E y during the main phase are 0.33 and 0.57, respectively. Ontiveros et al. [49] found that the CCs differ for storms driven by various solar wind structures. For example, the CCs of D s t m i n with B z m i n for storms driven by Sheath, ICME, and Sheath-ICME are −0.50, −0.81, and −0.89, respectively. Under the same interplanetary origins, the CCs of D s t m i n with peak and time-integral values also differ; for instance, the CCs of D s t m i n with E y m a x and the time-integral value of positive E y are −0.88 and −0.62 for ICME-driven storms.
In addition, more than 20 solar wind–magnetosphere coupling functions have been developed to predict the impact of the solar wind on the space-weather environment [50]. For example, Newell et al. [51] introduced a near-universal coupling function: C f 2 ~ B x 2 + B y 2 + B z 2 2 / 3 m p N p 1 / 2 V s w 7 / 3 s i n 8 / 3 ( θ 2 ) by fitting it to the D s t index. Lockwood and McWilliams [50] provided several other coupling functions, such as C f 3 ~ B y 2 + B z 2 0.81 m p N p 0.36 V s w 2.58 s i n 3 ( θ 2 ) fitted empirically to interpolated a m geomagnetic indices and C f 4 ~ B y 2 + B z 2 0.64 m p N p 0.02 V s w 0.55 s i n 2.5 ( θ 2 ) fitted empirically to transpolar voltage Φ P C .
As the 25th solar cycle approaches its maximum phase, it is crucial to further study the characteristics of the years 2020–2023 to know how it is different from the previous two solar cycles. This study uniquely examines the effects of continuous long-duration southward IMF (∆t > 13 h), considering not only peak values but also time-integral values of critical SWPs across different subsets of storm events. Additionally, some solar wind–magnetosphere coupling functions are analyzed across storms that occurred from 1 September 1996 to 31 December 2023. By incorporating subsets from different phases of the solar cycles and focusing on long-duration southward IMF events, this study provides a detailed analysis of the varying influences of interplanetary conditions on geomagnetic storm dynamics. Section 2 presents the dataset and methods and Section 3 shows the results of statistical analysis. The discussion and conclusion are provided in Section 4 and Section 5, respectively.

2. Dataset and Methods

We selected 384 geomagnetic storms ( D s t m i n   −50 nT) with available solar wind plasma and interplanetary magnetic field data during their main phases, from 1 September 1996 to 31 December 2023 (abbreviated as all-384-storms hereafter). Among these, 174 storms featured continuous southward IMF during the main phase (abbreviated as cont.-174/384-storms hereafter) and 68 storms experienced long-duration ( Δ t > 13 h) southward IMF (abbreviated as long-68/384-storms hereafter). This study statistically analyzed the interplanetary origins of the all-384-storms and investigated the correlation between storm intensity and various SWPs across different subsets.
To assess the geomagnetic storm intensity, represented by the D s t index (1-h time resolution) and the S y m H index (1-min resolution), we identified the storms’ interplanetary origins based on SWP variations. We utilized 1-min averaged data from the OMNI website (https://omniweb.gsfc.nasa.gov/form/omni_min.html, accessed on 1 June 2024). The solar wind plasma and IMF data at the bow shock nose (BSN) were computed by shifting multi-source observations from satellites such as ACE, WIND, and Geotail. ACE and WIND spacecraft are located near the L1 Lagrange point, where the propagation time to Earth is typically less than 1 h [28,52]. Geotail orbits the Earth with a perigee of 9 R E and an apogee of 30 R E . The parameters used include the IMF ( B t , B x , B y , and B z ) in GSM coordinates and solar wind speed V s w , proton density N p , proton temperature T p , plasma beta β , dawn–dusk electric field E y = V s w B z , and dynamic pressure P s w ~ N p V s w 2 . For all correlation analyses, we employed the solar wind–magnetosphere coupling function ε, defined as ε = 4 π μ 0 V s w B t 2 s i n 4 ( θ 2 ) l 0 2 [9,53], where θ is the IMF clock angle defined by θ = arctan B y / B z and l 0 is an empirically determined scale length, set to 7 R E .
We determined the structure and interval of ICMEs primarily from ICME databases (https://izw1.caltech.edu/ACE/ASC/DATA/level3/icmetable2.html, accessed on 1 June 2024 and https://space.ustc.edu.cn/dreams/wind_icmes/, accessed on 1 June 2024), supplemented by additional analytical works [21,22,23,31] and the characteristics of SWPs from the OMNI dataset. Key indicators include the declining profile of solar wind speed, abnormally low proton temperature ( T p < T e x p / 2 ), relatively low plasma beta ( β < 1), and smoothly enhanced magnetic field. Based on the presence or absence of a storm’s sudden commencement (SSC, caused by an interplanetary Shock and characterized by a sudden increase in the S y m H index) and the timing of the ICME’s occurrence during the storms, we categorized the storms into five primary types: (1) ICME-driven storms: without SSC but the main phase driven solely by ICMEs. (2) Sheath-ICME-driven storms: with SSC with the main phase driven by both the Sheath region and the subsequent ICME. (3) Sheath-driven storms: with SSC but the main phase driven by the Sheath region, followed by the appearance of ICME signatures. (4) Shock-driven storms: with SSC but without subsequent ICME signatures. (5) Other-driven storms: without clear SSC or ICME signatures but with enhanced magnetic field magnitude and increased proton density.
In the statistical analysis of the interplanetary origins of the all-384-storms, we categorized the storms into five types based on interplanetary origins: ICME-driven storms, Sheath-ICME-driven storms, Sheath-driven storms, Shock-driven storms, and Other-driven storms. Moreover, the storms also were classified into three types based on the storm intensity: moderate storms (−100 nT < D s t m i n   −50 nT), intense storms (−200 nT < D s t m i n   −100 nT), and big storms ( D s t m i n −200 nT). But for the correlation analysis, according to the interplanetary origins with the ICMEs and the presence of rare big storms, storms were broadly categorized into two types: ICME-related storms (including ICME-driven, Sheath-ICME-driven, and Sheath-driven storms) and others-driven storms (such as those driven by Shocks or CIRs); storms were classified into two categories based on the storm intensity: moderate storms (−100 nT < D s t m i n   −50 nT) and strong storms ( D s t m i n −100 nT).
When geomagnetic storms are categorized based on solar cycle phases, intensity, or interplanetary origins, it becomes challenging to quantify the continuous southward IMF duration amid strong magnetic field fluctuations. To address this, we selected the interval between the start time ( t s t a r t ) and end time ( t e n d ) of the main phase, determined by variations in the D s t index, to calculate the peak and time integral values of SWPs during the all-384-storms. In our calculations, only negative IMF B z (IMF B s ) and positive E y values were considered [41]. However, for the cont.-174/384-storms, determining the start time ( t s t a r t ) of the disturbances (either continuous southward IMF or SSC characterized by a sudden increase in the quiet S y m H index) and the end time ( t e n d ) of the southward IMF was straightforward using a 1-min resolution. Consequently, we also examined the correlation between the duration Δ t of the southward IMF and the duration of the main phase Δ t for the cont.-174/384-storms, as well as for the long-68/384-storms.
In this study, the time-integral values I B s , I ( E y ) , I V s w , I P s w , I N p and I ε , I B s , I ( E y ) , I V s w , I P s w , I N p , and I ε were calculated as follows:
I B s = t s t a r t t e n d B s d t
I ( E y ) = t s t a r t t e n d E y d t
I V s w = t s t a r t t e n d V s w d t
I P s w = t s t a r t t e n d P s w d t
I N p = t s t a r t t e n d N p d t
I ε = t s t a r t t e n d ε d t
I B s = t s t a r t t e n d B s d t
I ( E y ) = t s t a r t t e n d E y d t
I V s w = t s t a r t t e n d V s w d t
I P s w = t s t a r t t e n d P s w d t
I N p = t s t a r t t e n d N p d t
I ε = t s t a r t t e n d ε d t
In this study, we employed Pearson linear correlation coefficients (CCs) first introduced by Pearson, K. in 1896 [54] to evaluate the relationships between various parameters. The degree of correlation was categorized as follows: high degree of correlation (CC 0.8), moderate degree of correlation (0.5 CC < 0.8), low degree of correlation (0.3 CC < 0.5), very weak degree of correlation (CC < 0.3), and no significant correlation shown (no CC values reported). Our correlation analysis focused on examining the associations between the peak and time-integral values of SWPs (including IMF B z , E y , V s w , N p , P s w , and ε ) and geomagnetic storm intensity. Furthermore, we conducted a direct comparison of the correlations between the peak values of four coupling functions ( ε , C f 2 , C f 3 , and C f 4 ) and storm intensity.

3. Results

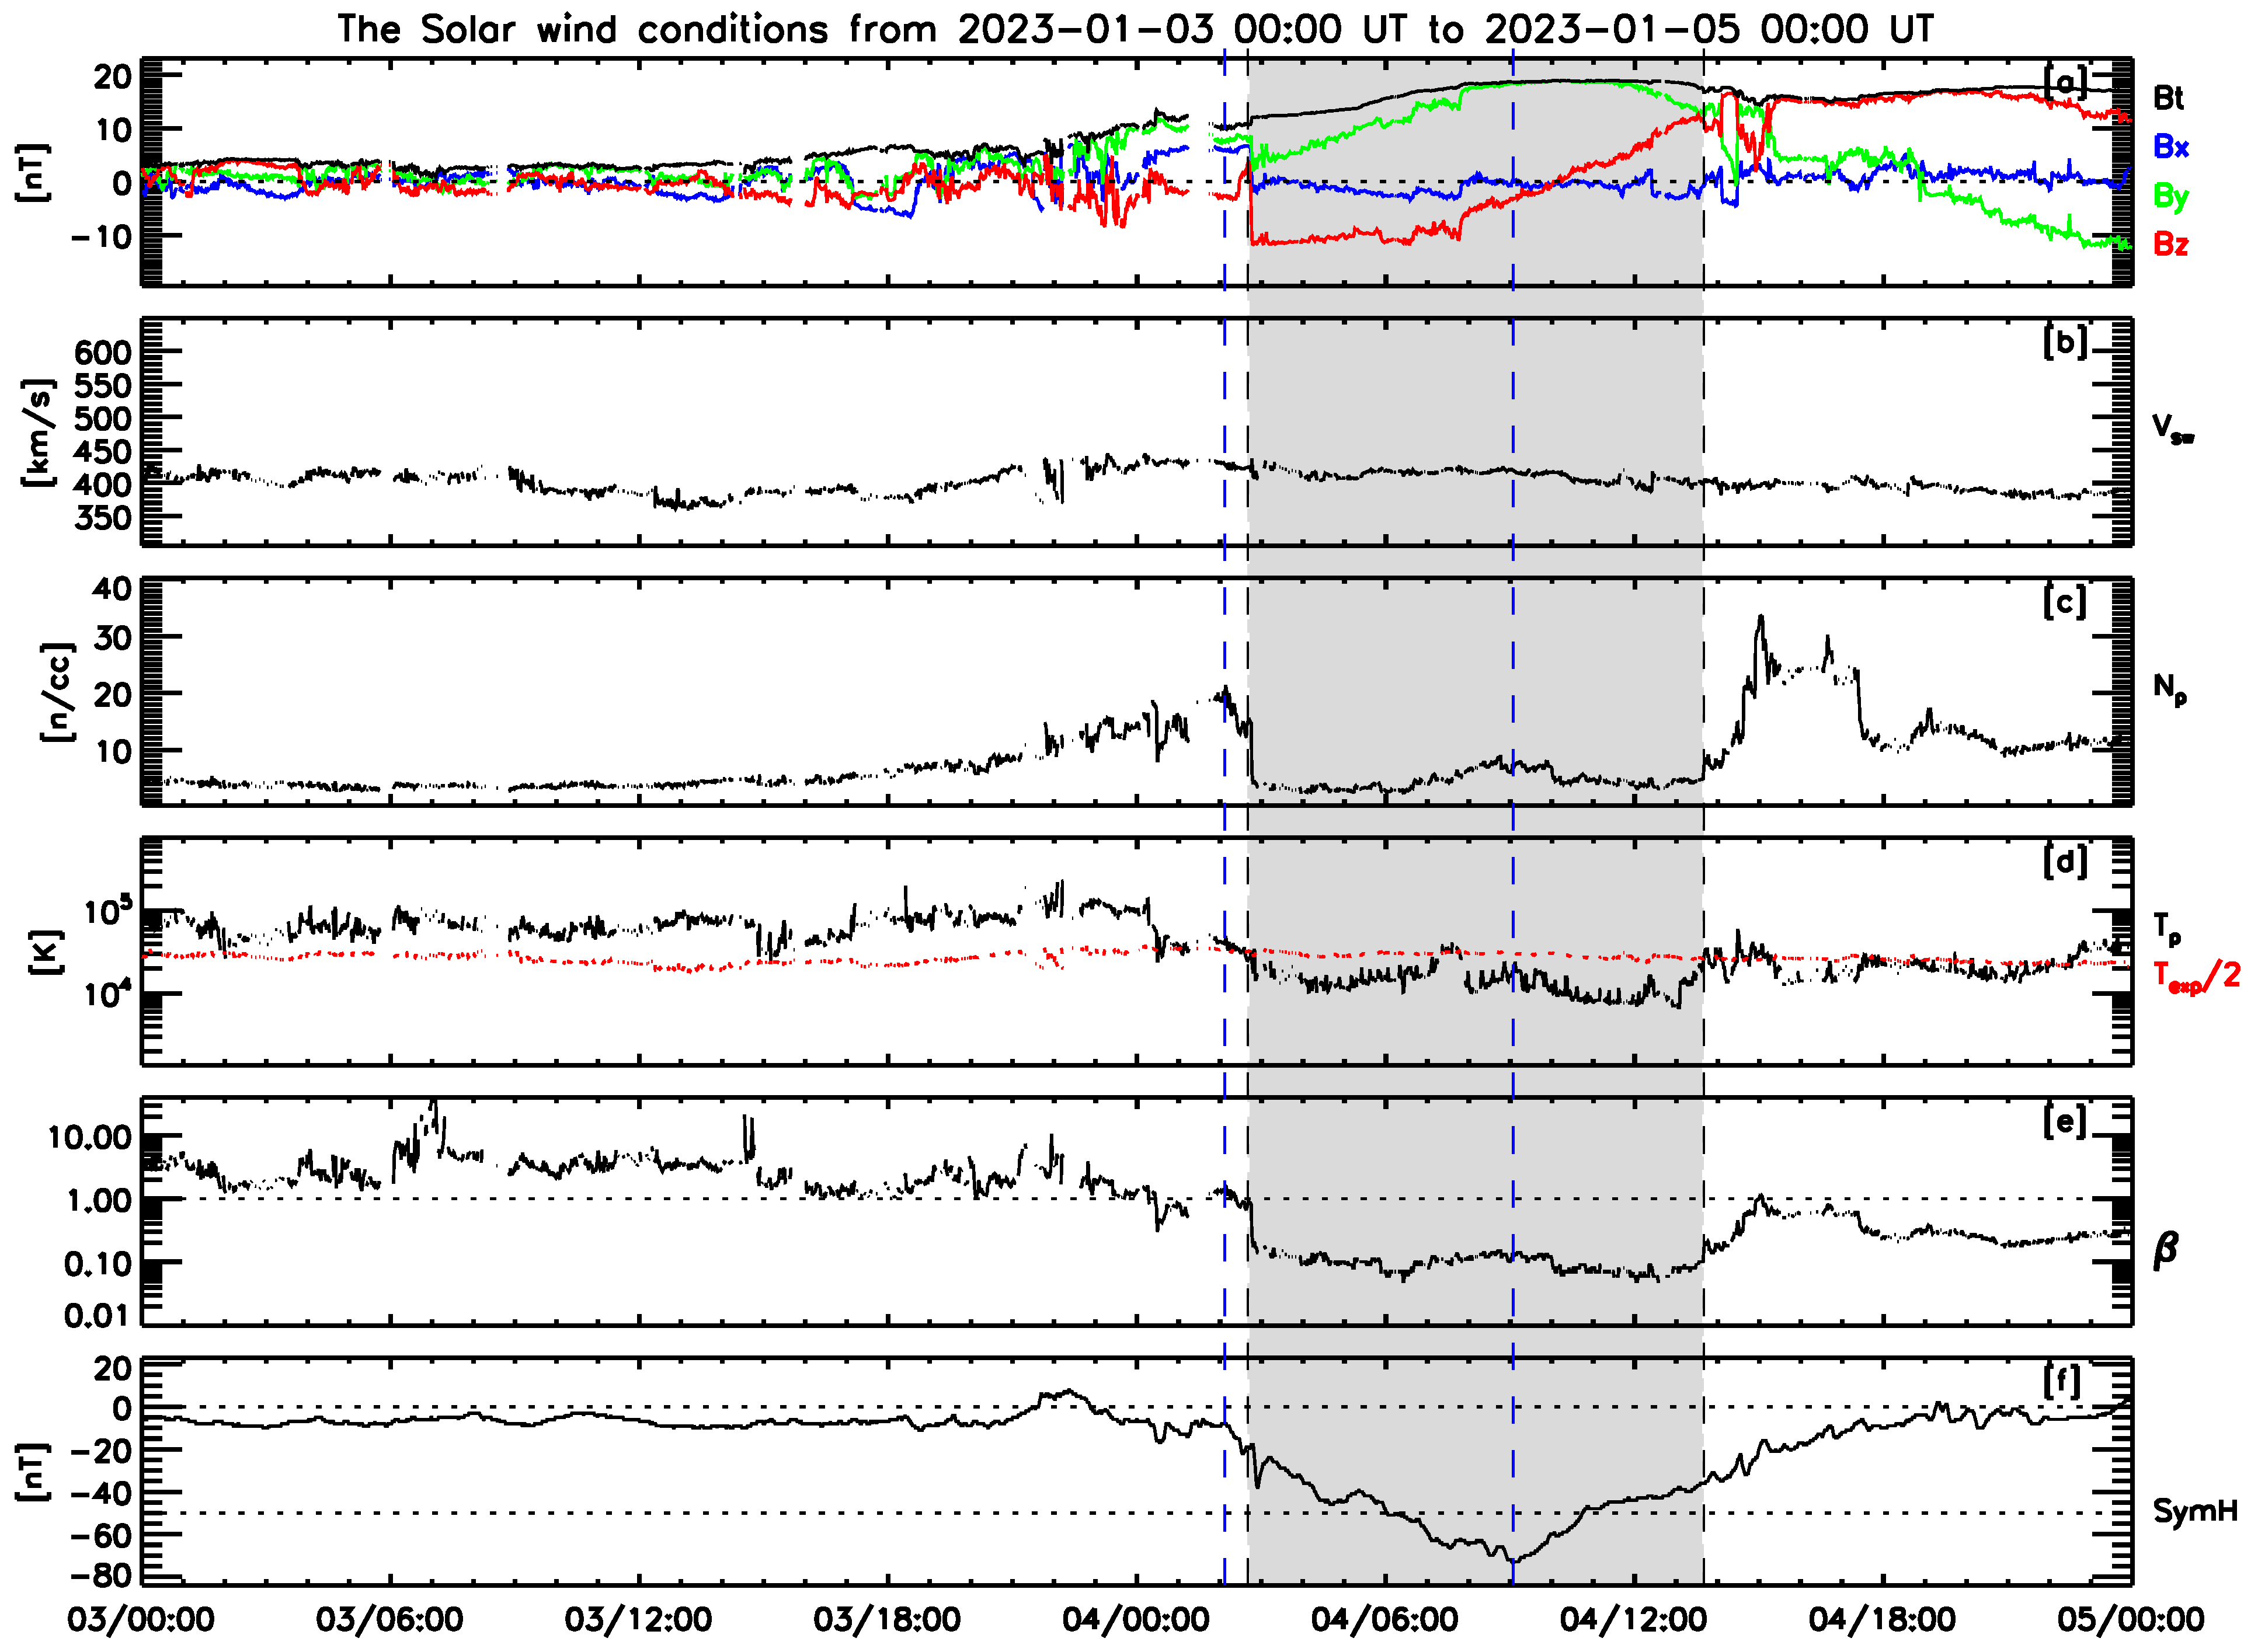
3.1. Examples of the Geomagnetic Storms

Figure 1, Figure 2, Figure 3 and Figure 4 show the four examples of storms driven by different interplanetary origins. From top to bottom, the panels display the IMF components ( B t , B x , B y , and B z ), the solar wind parameters are V s w , N p , T p and T p e x p / 2 , β , and the S y m H index. In each figure, the red vertical dashed line denotes the start time of SSC, the blue dotted lines mark the start and end times of the main phase, and the shadow region represents the interval of an ICME.
Figure 1 shows a moderate storm ( D s t m i n ~−61 nT) that occurred on 3–4 January 2023. The main phase took place from 02:07 UT to 09:04 UT ( S y m H m i n ~−74 nT) on January 4, with the ICME interval spanning from 02:44 UT to 13:40 UT on January 4. The lack of an SSC indicates that no shock arrived at Earth, confirming that this moderate storm on 4 January 2023 was ICME-driven.
Figure 2 depicts an SSC observed at approximately 19:42 UT on 2 November 2021, preceding an intense storm ( D s t m i n ~−105 nT) on 4 November 2021. The main phase occurred from 21:00 UT on November 3 to 12:44 UT on November 4 ( S y m H m i n ~−118 nT) and the ICME interval was from 11:40 UT on November 4 to 04:50 UT on November 5. These observations indicate that the intense storm on 4 November 2021 was Sheath-ICME-driven.
Figure 3 illustrates an intense storm ( D s t m i n ~−105 nT) on 1 December 2023. The SSC appeared at about 00:10 UT on December 1; the main phase began around 02:48 UT and ended at approximately 13:30 UT ( S y m H m i n ~−136 nT). The ICME, arriving during the recovery phase from 21:00 UT on December 1 to 00:10 UT on December 3, implies that this storm was driven by the Sheath, thus classifying the intense storm on December 1 2023 as Sheath-driven.
Figure 4 presents a moderate storm ( D s t m i n ~−91 nT) on 14 January 2022, with its main phase occurring from 15:50 UT to 22:17 UT. The absence of SSC and ICME signatures indicates that this storm belonged to the category of other-driven storms.

3.2. Statistics of the Geomagnetic Storms

Figure 5 shows the | D s t m i n | distribution of the all-384-storms, the cont.-174/384-storms, and the long-68/384-storms from 1 Sepetember 1996 to 31 December 2023. In panels a–c, solar activity is characterized by the smoothed average monthly sunspot number (SSN, red line), The black plus signs (+) represent ICME-driven storms, purple asterisks (*) mark Sheath-ICME-driven storms, blue diamonds (◊) indicate Sheath-driven storms, green diamonds (◊) denote Shock-driven storms, and azure forks (×) signify other-driven storms. Table 1 lists the number and percentage of different intensity types of storms driven by these various solar wind structures. The details of the all-384-storms, including storm intensity, peak time and interplanetary origins, are provided in the Supplementary Materials.
As shown in Figure 5a,b and Table 1, the distribution of different types of storms does not exhibit a conspicuous disparity when considering the cont.-174/384-storms versus the all-384-storms during different phases of the 23rd–25th solar cycles. The numbers of the all-384-storms driven by ICMEs, Sheath-ICMEs, Sheaths, Shocks, and others were 112, 55, 37, 10, and 170, while those of the cont.-174/384-storms were 79, 32, 12, 1, and 50. Thus, compared to the all-384-storms, the proportion of the ICME-related storms increased among the cont.-174/384-storms.
Furthermore, the solar activity level of the 23rd solar cycle (1996-09 to 2008-12) was greater than that of the 24th solar cycle (2009-01-01 to 2019-12-31). When comparing the solar activity levels of the first four years of the 23rd (1996-09 to 2000-08), 24th (2009-01 to 2012-12), and 25th solar cycles (2020-01 to 2023-12), it is observed that the 25th solar cycle’s activity was higher than that of the 24th solar cycle and lower than that of the 23rd solar cycle. Specifically, in the 23rd solar cycle, there are 59, 36, 23, 7, and 85 storms driven by ICMEs, Sheath-ICMEs, Sheaths, Shocks, and other solar wind structures, respectively. In the 24th solar cycle, these numbers were 38, 15, 9, 3, and 49, respectively. The number of storms driven by ICME-related structures in the first four years of the 23rd, 24th, and 25th solar cycles were 45, 26, and 22, while the storms by other solar wind structures during these same phases were 26, 12, and 36, respectively.
Figure 6 illustrates the distribution of 66 strong (blue bars) and 108 moderate (red bars) storms from the cont.-174/384-storms (gray bars) under different IMF B s durations, with their corresponding polynomial fitting curves. The southward IMF lasted from 1 to 34 h, in which, about 66.7% of moderate storms and 51.5% of strong storms were concentrated within the region of Δ t ≤ 13 h. The peak occurrence of moderate storms was approximately around Δ t ~7–8 h, whereas for strong storms, it was around Δ t ~10–11 h. To the cont.-174/384-storms, the peak distribution occurred at Δ t ~7–8 h and the mean duration of the IMF B s was about 12.4 h. Among long-68/384-storms, as shown in Figure 5c, the numbers of the storms driven by ICMEs, Sheath-ICMEs, Sheaths, Shocks, and other solar wind structures were about 48, 13, 2, 0, and 5, respectively. Thus, the ICME-related storms accounted for about 92.6%, including 31 moderate storms, 29 intense storms, and 3 big storms.

3.3. Correlation Analysis

Table 2 presents the CC values for the all-384-storms and their subsets—including 210 events during the 23rd solar cycle, 116 events in the 24th solar cycle, 58 events from 1996-09 to 2000-08, 38 events from 2009-01 to 2012-12, and 58 events from 2020-01 to 2023-12. Table 3 provides the CC values of the all-384-storms and their subsets: the 58 storms from 2020 to 2023 and the 71 storms from 1996-09 to 2000-08, with divisions based on storm intensity and the presence of ICME-related origins. Table 4 shows similar CC values for the cont.-174/384-storms and the long-68/384-storms, including the correlation between the duration ( Δ t ) of IMF B s and the duration ( Δ t ) of the main phase of these storms. In Table 2, Table 3 and Table 4, the CC values were mainly calculated within a 99% confidence interval (p-value < 0.01); some were obtained within a 95% confidence interval (p-value < 0.05), indicated by an asterisk (*), and no CC value (-) indicates no significant correlation.
As shown in Table 2 and Table 3, the intensity values of the all-384-storms were moderately or highly correlated with the peak values and time-integral values of the IMF B z , E y , and ε . For example, the CC values of D s t m i n with B z m i n , E y m a x , ε m a x , I B s , I ( E y ) , and I ε were 0.773, −0.77, −0.751, 0.512, −0.677, and −0.827, respectively. The storm intensity showed moderate or low correlations with P s w m a x and I P s w (−0.542 and −0.377) and low or even very weak correlations with the peak values and time-integral values of V s w and N p .
When comparing correlation results for the five subsets of the all-384-storms across different solar cycles (23rd–25th), it is found that (1) most CCs for storm intensity with SWPs during the 24th solar cycle were weaker than those during the 23rd solar cycle. (2) The degree of correlation between storm intensity and SWPs for the 71 events in the first four years of the 23rd solar cycle was similar to the 210 events during the entire 23rd solar cycle and higher than the 116 events during the 24th solar cycle.
The average intensity of the all-384-storms was −90.3 nT and the average values of the solar wind parameters data were B s m i n ¯ = −15.7 nT, E y m a x ¯ = 8.0 mV/m, V s w m a x ¯ = 549.9 km/s, P s w m a x ¯ = 12.4 nPa, N p m a x ¯ = 26.5 cm−3, and I ε ¯ =5.44 × 10¹⁶ J. For the 204/384 ICME-related storms, the average intensity D s t m i n ¯ of the storms was −107.9 nT, with B z m i n ¯ ~−17.7 nT, E y m a x ¯ ~9.4 mV/m, V s w m a x ¯ ~547.4 km/s, P s w m a x ¯ ~14.9 nPa, and N p m a x ¯ ~27.9 cm−3, comprising 113 moderate storms and 91 strong storms. For the remaining 180/384 other-driven storms, the values were −70.4 nT, −13.6 nT, 6.5 mV/m, 552.7 km/s, 9.6 nPa, and 24.8 cm−3, with moderate storms accounting for about 93.3%.
Table 3 shows that, for the all-384-storms, most CCs of storm intensity with SWPs for the 103 strong storms were higher than those for the 281 moderate storms and the most CCs for the 204 ICME-related storms were also higher than those for the 180 other-driven storms. ICME-related structures had higher values of B z m i n , E y m a x , and P s w m a x compared to other-driven storms. The CC values of storm intensity with SWPs among the 281/384 moderate storms and subsets—113 moderate ICME-related storms and 168 moderate others-driven storms were low or very weak. However, for the 103/384 strong storms, the CC values of D s t m i n with B z m i n , E y m a x , V s w m a x , P s w m a x , ε m a x I B s , I ( E y ) , I P s w , and I ε were significantly higher.
For the 58 storms from 2020 to 2023, there are 53 moderate storms and 5 strong storms according to intensity; there are 22 ICME-related (including 18 moderate storms and 4 strong ones) and 36 others-driven storms (35 moderate and 1 strong) according to interplanetary drivers. Due to the small number of strong storms, correlation analysis between these and SWPs was not performed. In addition, 1. CC values for the 53 moderate storms (from the 58 events) were lower than those of the all-384-storms but higher than those of the 281/384 moderate storms. 2. Correlations of 22/58 ICME-related storms with B z m i n and E y m a x were weaker than those of the 204/384 ICME-related storms but correlations of the 22/58 storms’ intensity with ε m a x , I B s , I ( E y ) , I P s w , and I ε were stronger, with CC( D s t m i n   I ε ) reaching −0.899. 3. The storm intensity of the 36/58 other-driven storms was moderately correlated with the peak and integral values of P s w , with stronger correlations compared to the all-384-storms and their subset.
The average peak values for the cont.-174/384-storms were −101.9 nT, −16.5 nT, 8.0 mV/m, 498.3 km/s, 12.9 nPa, 30.3 cm−3 , and 7.92 × 10¹⁶ J. Among the cont.-174/384-storms, there were only 8 strong storms driven by other solar wind structures unrelated to ICMEs; the number was so small that we temporarily ignored the results of the correlation analysis of the storm intensity with the 8 strong others-driven storms. Compared to the correlation analysis results with those of the all-384-storms, Table 4 shows that (1) among the cont.-174/384-storms, the degrees of correlation of the storm intensity D s t m i n with the peak values of the IMF B z , E y , V s w , P s w , N p , and ε increased to a different extent. (2) The degrees of correlation with time-integral values of these SWPs varied, with some increasing and others decreasing. (3) Most correlations of storm intensity with SWPs for the 108 strong storms were higher than those for the 66 moderate storms and higher for the 124 ICME-related storms compared to the 52 other-driven storms. (4) The duration of the storm’s main phase ( Δ t ) was moderately correlated with the southward IMF duration Δ t (CC = 0.668 for 58 strong ICME-related storms).
Furthermore, we compared the correlation analysis results of the long-68/384-storms with those of the cont.-174/384-storms in Table 4. It is found that the most degrees of correlation of the storm intensity with the peak and time-integral values of the SWPs were further enhanced while the C C Δ t Δ t decreased. The ICME-related storms accounted for about 92.6% out of the 68 storms and the degrees of correlation of the ICME-related storm intensity with the integral value of ε and the peak values of the IMF B z , E y and ε were quite high (−0.872, 0.917, −0.923, and −0.915).
Table 5 shows the CC values of D s t m i n with the peak values of the solar wind–magnetosphere coupling functions ε , C f 2 , C f 3 , and C f 4 . Compared to ε , the Lockwood and McWilliams function C f 4 yielded slightly higher or lower CC values for different types of storms, while the Lockwood and McWilliams function C f 3 and the Newell function C f 2 mostly yielded lower CC values. Notably, for moderate other-driven storms, the differences in correlation results are the most evident, indicating that storms classified by intensity or interplanetary origins may be differently affected by various SWPs.

4. Discussion

The solar cycle, typically spanning 11 years, is characterized by the quasi-periodic change in SSNs. Each solar cycle maintains a consistent polarity in the sunspot magnetic field but this polarity reverses in the subsequent cycle, resulting in a 22-year activity period. Solar activity levels significantly influence the occurrence and velocities of CMEs and ICMEs, with peaks and troughs aligning with solar maximum and minimum phases, respectively [55]. Conversely, CIRs, originating from solar coronal holes, exhibit a 27-day recurring pattern [36].
Examining the solar activity levels and the occurrence of geomagnetic storms ( D s t m i n   −50 nT) from 1996-09 to 2023-12 reveals that the 23rd solar cycle witnessed the highest activity levels. The first four years of the 25th solar cycle displayed intermediate activity levels compared to the initial four years of the 23rd and 24th cycles (Figure 5). This trend is mirrored in the number of geomagnetic storms recorded during these periods. Notably, 384 geomagnetic storms were analyzed in this study, revealing that ICME-related structures accounted for approximately 88% of strong storms and 37.6% of moderate storms during the 23rd solar cycle. This finding aligns closely but not exactly with previous studies by Echer et al. [33,40,41,42], which reported that ICME-related drivers caused around 80% of strong storms, while CIRs were responsible for only 13%, with most moderate storms associated with CIRs and pure high-speed streams (47.9%), followed by ICMEs (20.6%), Sheaths (10.8%), and Sheath-ICMEs (9.9%).
From September 1996 to December 2023, ICME-related storms were responsible for 88.3% of strong storms and 40.2% of moderate storms. In the first four years of the 23rd solar cycle, these storms accounted for 88.5% of strong storms and 48.9% of moderate storms. For the same period in the 25th solar cycle, ICME-related storms accounted for 80% of strong storms and 34% of moderate storms. In contrast, during the first four years of the 24th solar cycle, ICME-related storms were implicated in all strong storms and 68% of moderate storms. These observations suggest that storms driven by ICME-related structures occur randomly and predominate during solar maximum phases, whereas storms driven by other solar wind structures are distributed across all phases of solar cycles 23–25 and dominate during the declining phase [36]. This indicates that both solar activity levels and sunspot magnetic field polarity influence the occurrence rate and intensity of geomagnetic storm drivers, ultimately affecting the number and intensity of geomagnetic storms.
Analyzing the correlation between the intensity of 384 storms and various SWPs reveals several key relationships. Storm intensity shows a strong negative correlation with coupling energy (CC~−0.827), higher than its correlation with ε m a x (~−0.751). It exhibits a moderate positive correlation with IMF B z m i n (~0.773), higher than that with I B s (~0.512). Moderate negative correlations are also observed with the peak and integral values of E y (e.g., CC D s t m i n E y m a x ~−0.77) and P s w (~−0.542), with a lower correlation for I P s w   (~−0.377). Weak negative correlations exist with the peak values of V s w (~−0.327) and N p (~−0.266).
In the initial four years of the 25th solar cycle (2020–2023), 58 storms ( D s t m i n   −50 nT) were recorded, of which 22 were ICME-related ( D s t m i n ¯ ~−84.3 nT) and 36 were driven by other structures ( D s t m i n ¯ ~−67.1 nT), predominantly moderate storms. This suggests that ICMEs transmitted less energy into the Earth’s magnetosphere, which might be influenced by factors such as IMF orientation and strength, ICME speed, and whether the ICME crosses Earth’s orbit at its edge, core, or with any other geometry of crossing. Comparing correlation outcomes for storm intensity and various SWPs between the initial four years of the 25th and 23rd solar cycles, several shifts in CCs are observed. CCs of storm intensity with IMF B s m i n and E y m a x decreased to 0.701 and −0.716, respectively, while those with ε m a x , I B s , I ( E y ) , I P s w , and I ε increased, notably C C D s t m i n I ε , approximating −0.867. This indicates an evolution in the mechanisms linking geomagnetic storm intensity to SWPs, with a reduced immediate impact of southward IMF and dawn–dusk electric field, and a greater influence of cumulative effects during the early phase of the 25th cycle.
The cont.-174/384-storms exhibited increased average storm intensity and average peak values of SWPs, with strengthened correlations between storm intensity and peak values of SWPs and weakened correlations with time-integral values of SWPs involving IMF parameters. This suggests that continuous southward IMF enhances the coupling between the solar wind and Earth’s magnetosphere, leading to stronger geomagnetic storms. The peak values of SWPs have a more immediate and substantial effect on storm intensity during periods of sustained southward IMF than during the conditions of multiple or even frequent north–south directional changes in the IMF during the storm’s main phase. Under the latter condition, the energy transfer from the solar wind to the Earth’s magnetosphere becomes less consistent and less efficient, diminishing the overall intensity of storms and weakening the dependence of storm intensity on the SWPs over time.
Among the cont.-174/384-storms, 66.7% of moderate storms and 51.5% of strong storms occurred within Δ t   13 h. Approximately 92.6% of long-duration ( Δ t > 13 h) southward IMF storms were driven by ICME-related structures, which caused prolonged periods of relatively consistent IMF and higher correlations between storm intensity and SWPs. Long-duration southward IMF results in efficient energy transfer, with both peak and time-integral values of SWPs significantly contributing to storm intensity. As the duration of the southward IMF increases, the loss effect on the ring current intensifies until solar wind energy can no longer sustain the storm’s main phase, weakening the correlation between main phase duration and southward IMF duration.
The differences in CC values for storm intensity with various coupling functions highlight the complexity of interplanetary conditions and their non-linear impact on geomagnetic activity, suggesting that certain coupling functions may be more suited for specific storm types.

5. Conclusions

Based on Solar Wind Parameters (SWPs) data from the OMNI dataset, we investigated the interplanetary origins and distribution of 384 geomagnetic storms with D s t m i n   −50 nT from September 1996 to December 2023. We analyzed the correlation of storm intensity with the peak and time-integral values of SWPs (southward component of IMF, dawn–dusk electric field E y , solar wind speed V s w , dynamic pressure P s w , proton density N p , and solar wind–magnetosphere coupling functions) during these storms in different subsets and 174 events with continuous southward IMF during the storm’s main phase; including 68 events with long-duration southward IMF ( Δ t > 13 h). The results are summarized as follows:
(1)
The solar activity level in the 23rd solar cycle was the highest, while the 25th cycle’s first four years showed intermediate activity, compared to the initial four years of the 23rd and 24th cycles, a trend similar to geomagnetic storm occurrences;
(2)
ICME-related structures were the primary drivers of strong storms, causing approximately 88% of strong storms over the study period. This dominance was consistent but varied across different solar cycle phases, accounting for 88.5%, 100%, and 80% of strong storms in the first four years of the 23rd, 24th, and 25th solar cycles, respectively. The influence on moderate storms was more variable: over the entire period, they contributed to 40.2% of moderate storms overall, with 48.9%, 68%, and 34% in the initial four years of the 23rd, 24th, and 25th cycles, respectively;
(3)
For the all-384-storms, strong storm intensities showed higher CCs compared to moderate storms. ICME-related storms had a high negative correlation with ε m a x (−0.827), a moderate positive correlation with IMF B z m i n (~0.788), moderate negative correlations with E y m a x (−0.776) and I ( E y ) (−0.669), a moderate negative correlation with P s w m a x (~−0.512), a low negative correlation with V s w m a x (~−0.485), and a very low negative correlation with N p m a x (~−0.274);
(4)
Compared to the 71 storms that occurred from the initial four years of the 23rd solar cycle and the all-384-storms from 1996-09 to 2023-12, there are 58 storms that occurred during the same phase of the 25th solar cycle that had lower correlations with the IMF B z m i n and E y m a x but higher correlations with ε m a x , I B s , I ( E y ) , I P s w , and I ε ;
(5)
During approximately 66.7% of moderate storms and 51.5% of strong storms among the cont.-174/384-storms, the southward IMF lasted for a duration of Δ t ≤ 13 h. Continuous southward IMF enhanced solar wind–magnetosphere coupling, resulting in more effective energy transfer and stronger storms. This direct and efficient energy coupling strengthened the correlation between peak values of SWPs and storm intensity but weakened the influence of cumulative effects. Notably, the longer-duration of southward IMF (e.g., Δ t   > 13 h) further enhanced the correlations of storm intensity with both peak and integral values of SWPs. Contrarily, multiple or even frequent north–south directional changes in the IMF during the storm’s main phase weakened the reliance of storm intensity on the IMF B z . The results illustrated the complex interplay between immediate and cumulative influences on geomagnetic storm dynamics.
This comprehensive analysis of geomagnetic storms from 1996 to 2023 provides valuable insights into the varying influences of interplanetary origins, solar wind parameters, and temporal factors on storm intensity, enhancing our understanding of space weather dynamics.

Supplementary Materials

The following supporting information can be downloaded at: https://www.mdpi.com/article/10.3390/rs16162952/s1.

Author Contributions

Conceptualization, X.S., Z.Z. and S.D.; methodology, X.S., Z.Z. and S.D.; software, X.S., Y.H., C.L. and Z.R.; validation, X.S.; formal analysis, X.S., Z.Z. and S.D.; investigation, X.S.; data curation, X.S., Y.H., C.L. and Z.R.; writing—original draft preparation, X.S.; writing—review and editing, X.S., Z.Z. and S.D.; visualization, X.S.; project administration, Z.Z. All authors have read and agreed to the published version of the manuscript.

Funding

This work is supported by the National Key Research and Development Program of China 2023YFE0117300, the NSFC Grant 41874174, the APSCO Earthquake Research Project Phase II, and the Dragon 5 cooperation 2020–2024 (ID. 59236).

Data Availability Statement

The solar wind parameters come from the OMNIWeb (https://omniweb.gsfc.nasa.gov/form/omni_min.html, accessed on 1 June 2024) and geomagnetic D s t indices are provided by the World Data Center for Geomagnetism, Kyoto (http://wdc.kugi.kyoto-u.ac.jp/, accessed on 1 June 2024). The lists of ICMEs are publicly available online (https://izw1.caltech.edu/ACE/ASC/DATA/level3/icmetable2.html, accessed on 1 June 2024, and https://space.ustc.edu.cn/dreams/wind_icmes/, accessed on 1 June 2024).

Conflicts of Interest

The authors declare no conflicts of interest.

References

  1. Gonzalez, W.D.; Joselyn, J.A.C.; Kamide, Y.; Kroehl, H.W.; Rostoker, G.; Tsurutani, B.T.; Vasyliūnas, V.M. What is a geomagnetic storm? J. Geophys. Res. 1994, 99, 5771–5792. [Google Scholar] [CrossRef]
  2. Kamide, Y.; Maltsev, Y.-P. Geomagnetic Storms. In Handbook of the Solar-Terrestrial Environment; Kamide, Y., Chian, A., Eds.; Springer: Berlin/Heidelberg, Germany, 2007; pp. 355–374. [Google Scholar]
  3. Koskinen, H.E.J. Magnetospheric Storms and Substorms. In Physics of Space Storms: From the Solar Surface to the Earth; Koskinen, H.E.J., Ed.; Springer: Berlin/Heidelberg, Germany, 2011; Volume 56, pp. 323–370. [Google Scholar]
  4. Zhang, X. Source, Evolution, and Properties of Non-Parker-spiral IMF and Its Role on Geomagnetic Activity. Ph.D. Dissertation, The University of Michigan, Ann Arbor, MI, USA, 2015. [Google Scholar]
  5. Dungey, J.W. Interplanetary Magnetic Field and the Auroral Zones. Phys. Rev. Lett. 1961, 6, 47–48. [Google Scholar] [CrossRef]
  6. Antonova, E.E.; Pulinets, M.S.; Riazantseva, M.O.; Znatkova, S.S.; Kirpichev, I.P.; Stepanova, M.V. Turbulence in the magnetosheath and the problem of plasma penetration inside the magnetosphere. In Exploring the Solar Wind; Lazar, M., Ed.; IntechOpen: London, UK, 2012. [Google Scholar] [CrossRef]
  7. Safránková, J.; Hayosh, M.; Gutynska, O.; Němeek, Z.; Pech, L. Reliability of prediction of the magnetosheath BZ component from interplanetary magnetic field observations. J. Geophys. Res. 2009, 114, A12213. [Google Scholar] [CrossRef]
  8. Turc, L.; Fontaine, D.; Savoini, P.; Kilpua, E.K.J. Magnetic clouds’ structure in the magnetosheath as observed by Cluster and Geotail: Four case studies. Ann. Geophys. 2014, 32, 1247–1261. [Google Scholar] [CrossRef]
  9. Akasofu, S.-I. Energy coupling between the solar wind and the magnetosphere. Space Sci. Rev. 1981, 28, 121–190. [Google Scholar] [CrossRef]
  10. Akasofu, S.-I. A Review of the Current Understanding in the Study of Geomagnetic Storms. Int. J. Earth Sci. Geophys. 2018, 4, 18. [Google Scholar] [CrossRef]
  11. Axford, W.I.; Hines, C.O. A unifying theory of high latitude geophysical phenomena and geomagnetic storms. Can. J. Phys. 1961, 39, 936–967. [Google Scholar] [CrossRef]
  12. Chapman, S.; Ferraro, V.C.A. A new theory of magnetic storms. J. Geophys. Res. 1931, 36, 171–186. [Google Scholar] [CrossRef]
  13. Guo, J.; Feng, X.; Emery, B.A.; Zhang, J.; Xiang, C.; Shen, F.; Song, W. Energy transfer during intense geomagnetic storms driven by interplanetary coronal mass ejections and their sheath regions. J. Geophys. Res. Space Phys. 2011, 116, A05106. [Google Scholar] [CrossRef]
  14. Turner, N.E.; Cramer, W.D.; Earles, S.K.; Emery, B.A. Geoefficiency and energy partitioning in CIR-driven and CME-driven storms. J. Atmos. Sol.-Terr. Phys. 2009, 71, 1023–1031. [Google Scholar] [CrossRef]
  15. Zong, Q.G.; Yue, C.; Fu, S.Y. Shock Induced Strong Substorms and Super Substorms: Preconditions and Associated Oxygen Ion Dynamics. Space Sci. Rev. 2021, 217, 33. [Google Scholar] [CrossRef]
  16. Richardson, I.G.; Cane, H.V. Regions of abnormally low proton temperature in the solar wind (1965–1991) and their association with ejecta. J. Geophys. Res. 1995, 100, 23397–23412. [Google Scholar] [CrossRef]
  17. Wu, C.-C.; Lepping, R.P. Statistical Comparison of Magnetic Clouds with Interplanetary Coronal Mass Ejections for Solar Cycle 23. Sol. Phys. 2011, 269, 141–153. [Google Scholar] [CrossRef]
  18. Burlaga, L.F. Magnetic clouds and force-free fields with constant alpha. J. Geophys. Res. 1988, 93, 7217–7224. [Google Scholar] [CrossRef]
  19. Lopez, R.E. Solar cycle invariance in solar wind proton temperature relationships. J. Geophys. Res. 1987, 92, 11189–11194. [Google Scholar] [CrossRef]
  20. Richardson, I.G.; Cane, H.V. Identification of interplanetary coronal mass ejections at 1 AU using multiple solar wind plasma composition anomalies. J. Geophys. Res. 2004, 109, A09104. [Google Scholar] [CrossRef]
  21. Jian, L.K.; Russell, C.T.; Luhmann, J.G. Comparing Solar Minimum 23/24 with Historical Solar Wind Records at 1 AU. Sol. Phys. 2011, 274, 321–344. [Google Scholar] [CrossRef]
  22. Richardson, I.G.; Cane, H.V. Near-Earth Interplanetary Coronal Mass Ejections During Solar Cycle 23 (1996 – 2009): Catalog and Summary of Properties. Sol. Phys. 2010, 264, 189–237. [Google Scholar] [CrossRef]
  23. Shen, C.; Chi, Y.; Wang, Y.; Xu, M.; Wang, S. Statistical comparison of the ICME’s geoeffectiveness of different types and different solar phases from 1995 to 2014. J. Geophys. Res. Space Phys. 2017, 122, 5931–5948. [Google Scholar] [CrossRef]
  24. Alves, M.V.; Echer, E.; Gonzalez, W.D. Geoeffectiveness of corotating interaction regions as measured by Dst index. J. Geophys. Res. 2006, 111, A07S05. [Google Scholar] [CrossRef]
  25. Despirak, I.V.; Lyubchich, A.A.; Kleimenova, N.G. Solar Wind Streams of Different Types and High-Latitude Substorms. Geomagn. Aeron. 2019, 59, 1–6. [Google Scholar] [CrossRef]
  26. Tsurutani, B.T.; Gonzalez, W.D.; Gonzalez, A.L.C.; Guarnieri, F.L.; Gopalswamy, N.; Grande, M.; Kamide, Y.; Kasahara, Y.; Lu, G.; Mann, I.; et al. Corotating solar wind streams and recurrent geomagnetic activity: A review. J. Geophys. Res. 2006, 111, A07S01. [Google Scholar] [CrossRef]
  27. Tsurutani, B.T.; Lakhina, G.S.; Verkhoglyadova, O.P.; Gonzalez, W.D.; Echer, E.; Guarnieri, F.L. A review of interplanetary discontinuities and their geomagnetic effects. J. Atmos. Sol. -Terr. Phys. 2011, 73, 5–19. [Google Scholar] [CrossRef]
  28. Zhang, J.; Richardson, I.G.; Webb, D.F.; Gopalswamy, N.; Huttunen, E.; Kasper, J.; Nitta, N.V.; Poomvises, W.; Thompson, B.J.; Wu, C.C.; et al. Correction to “Solar and interplanetary sources of major geomagnetic storms (Dst ≤ −100 nT) during 1996–2005”. J. Geophys. Res. Space Phys. 2007, 112, A12103. [Google Scholar] [CrossRef]
  29. Gosling, J.; Mccomas, D.J.; Phillips, J.L.; Bame, S.J. Geomagnetic activity associated with earth passage of interplanetary shock disturbances and coronal mass ejections. J. Geophys. Res. 1991, 96, 7831–7839. [Google Scholar] [CrossRef]
  30. Wu, C.-C.; Lepping, R.P. Relationships Among Geomagnetic Storms, Interplanetary Shocks, Magnetic Clouds, and Sunspot Number During 1995–2012. Sol. Phys. 2016, 291, 265–284. [Google Scholar] [CrossRef]
  31. Chi, Y.; Shen, C.; Wang, Y.; Xu, M.; Ye, P.; Wang, S. Statistical Study of the Interplanetary Coronal Mass Ejections from 1995 to 2015. Sol. Phys. 2016, 291, 2419–2439. [Google Scholar] [CrossRef]
  32. Echer, E.; Gonzalez, W.D. Geoeffectiveness of interplanetary shocks, magnetic clouds, sector boundary crossings and their combined occurrence. Geophys. Res. Lett. 2004, 31, L09808. [Google Scholar] [CrossRef]
  33. Echer, E.; Tsurutani, B.T.; Gonzalez, W.D. Interplanetary origins of moderate (−100 nT < Dst ≤ −50 nT) geomagnetic storms during solar cycle 23 (1996–2008). J. Geophys. Res. Space Phys. 2013, 118, 385–392. [Google Scholar] [CrossRef]
  34. Tsurutani, B.T.; Gonzalez, W.D.; Tang, F.M.; Akasofu, S.-I.; Smith, E.J. Origin of interplanetary southward magnetic fields responsible for major magnetic storms near solar maximum (1978–1979). J. Geophys. Res. 1988, 93, 8519–8531. [Google Scholar] [CrossRef]
  35. Yermolaev, Y.I.; Nikolaeva, N.S.; Lodkina, I.G.; Yermolaev, M.Y. Catalog of large-scale solar wind phenomena during 1976–2000. Cosm. Res. 2009, 47, 81–94. [Google Scholar] [CrossRef]
  36. Borovsky, J.E.; Denton, M.H. Differences between CME-driven storms and CIR-driven storms. J. Geophys. Res. 2006, 111, A07S08. [Google Scholar] [CrossRef]
  37. Cramer, W.D.; Turner, N.E.; Fok, M.C.; Buzulukova, N.Y. Effects of different geomagnetic storm drivers on the ring current: CRCM results. J. Geophys. Res. Space Phys. 2013, 118, 1062–1073. [Google Scholar] [CrossRef]
  38. Yermolaev, Y.I.; Nikolaeva, N.S.; Lodkina, I.G.; Yermolaev, M.Y. Geoeffectiveness and efficiency of CIR, sheath, and ICME in generation of magnetic storms. J. Geophys. Res. Space Phys. 2012, 117, A00L07. [Google Scholar] [CrossRef]
  39. Huttunen, K.E.J. Variability of magnetospheric storms driven by different solar wind perturbations. J. Geophys. Res. 2002, 107, SMP-20. [Google Scholar] [CrossRef]
  40. Echer, E.; Gonzalez, W.D.; Tsurutani, B.T. Interplanetary conditions leading to superintense geomagnetic storms (Dst ≤ −250 nT) during solar cycle 23. Geophys. Res. Lett. 2008, 35, L06S03. [Google Scholar] [CrossRef]
  41. Echer, E.; Gonzalez, W.D.; Tsurutani, B.T.; Gonzalez, A.L.C. Interplanetary conditions causing intense geomagnetic storms (Dst ≤ −100 nT) during solar cycle 23 (1996–2006). J. Geophys. Res. Space Phys. 2008, 113, A05221. [Google Scholar] [CrossRef]
  42. Echer, E.; Gonzalez, W.D.; Tsurutani, B.T. Statistical studies of geomagnetic storms with peak Dst ≤ −50 nT from 1957 to 2008. J. Atmos. Sol.-Terr. Phys. 2011, 73, 1454–1459. [Google Scholar] [CrossRef]
  43. Burton, R.K.; McPherron, R.L.; Russell, C.T. An empirical relationship between interplanetary conditions and Dst. J. Geophys. Res. 1975, 80, 4204–4214. [Google Scholar] [CrossRef]
  44. Russell, C.T.; McPherron, R.L.; Burton, R.K. On the cause of geomagnetic storms. J. Geophys. Res. 1974, 79, 1105–1109. [Google Scholar] [CrossRef]
  45. Wu, C.-C. Effect of solar wind velocity on magnetic cloud-associated magnetic storm intensity. J. Geophys. Res. 2002, 107, SSH 3-1–SSH 3-4. [Google Scholar] [CrossRef]
  46. Wu, C.-C. Effects of magnetic clouds on the occurrence of geomagnetic storms: The first 4 years of Wind. J. Geophys. Res. 2002, 107, SMP 19-1–SMP 19-8. [Google Scholar] [CrossRef]
  47. Wang, Y.; Shen, C.L.; Wang, S.; Ye, P.Z. An empirical formula relating the geomagnetic storm’s intensity to the interplanetary parameters: −VBz and Δt. Geophys. Res. Lett. 2003, 30, SSC2.1–SSC2.4. [Google Scholar] [CrossRef]
  48. Le, G.-M.; Liu, G.-A.; Zhao, M.-X. Dependence of Major Geomagnetic Storm Intensity (Dst≤−100nT) on Associated Solar Wind Parameters. Sol. Phys. 2020, 295, 108. [Google Scholar] [CrossRef]
  49. Ontiveros, V.; Gonzalez-Esparza, J.A. Geomagnetic storms caused by shocks and ICMEs. J. Geophys. Res. Space Phys. 2010, 115, A10244. [Google Scholar] [CrossRef]
  50. Lockwood, M.; Mcwilliams, K.A. On optimum solar wind–magnetosphere coupling functions for transpolar voltage and planetary geomagnetic activity. J. Geophys. Res. Space Phys. 2021, 126, e2021JA029946. [Google Scholar] [CrossRef]
  51. Newell, P.T.; Sotirelis, T.; Liou, K.; Meng, C.-I.; Rich, F.J. A nearly universal solar wind-magnetosphere coupling function inferred from 10 magnetospheric state variables. J. Geophys. Res. 2007, 112, A01206. [Google Scholar] [CrossRef]
  52. Gonzalez, W.D.; Echer, E. A study on the peak Dst and peak negative Bz relationship during intense geomagnetic storms. Geophys. Res. Lett. 2005, 32, L18103. [Google Scholar] [CrossRef]
  53. Perreault, P.D.; Akasofu, S.-I. A study of geomagnetic storms. Geophys. J. Int. 1978, 54, 547–573. [Google Scholar] [CrossRef]
  54. Pearson, K. Mathematical Contributions to the Theory of Evolution. III. Regression, Heredity, and Panmixia. Philos. Mag. Ser. 5 1896, 42, 343–414. [Google Scholar]
  55. Cremades, H.; Cyr, O.C.S. Coronal mass ejections: Solar cycle aspects. Adv. Space Res. 2007, 40, 1042–1048. [Google Scholar] [CrossRef]
Figure 1. The SWPs and geomagnetic indices from January 3 to 4, 2023. From top to bottom: the IMF ( B t and B x , B y , and B z ) in GSM coordinate (a), the solar wind speed V s w (b), the proton density N p (c), the proton temperature T p (solid line) and T p e x p / 2 (dotted line) (d), the plasma beta β (solid line) and β = 1 (horizontal dotted line) (e), and the S y m H index (solid line) and S y m H = 0 nT and −50 nT (horizontal dotted line) (f). The blue dotted lines mark the start and end times of the main phase, namely 02:07 UT and 09:04 UT on January 4, and the shadow region represents the interval (02:40 UT to 13:40 UT on January 4) of ICME.
Remotesensing 16 02952 g001
Figure 2. Similar to Figure 1 but for the observations from 3–5 November 2021. The red vertical dashed line displays the start time of SSC at 19:42 UT on November 3. The blue dotted lines mark the start and end time of the main phase, 21:00 UT on November 3 and 12:44 UT on November 4, and the shadow region represents the interval (11:40 UT on November 4 to 04:50 UT on November 5) of ICME.
Remotesensing 16 02952 g002
Figure 3. Similar to Figure 1 but for the observations from 30 November–3 December 2023. The red vertical dashed line displays the start time of SSC at 00:10 UT on December 1. The blue dotted lines mark the start and end time of the main phase: 02:48 UT and 13:30 UT on December 1 and the shadow region represents the interval (21:00 UT on December 1 to 00:10 UT on December 3) of ICME.
Remotesensing 16 02952 g003
Figure 4. Similar to Figure 1 but for the observations from 14–15 January 2022. The blue dotted lines mark the start and end time of the main phase, 15:50 UT and 22:17 UT, on January 14.
Remotesensing 16 02952 g004
Figure 5. The sunspot number (SSN) and the | D s t m i n | values of the all-384-storms (a), the cont.-174/384-storms (b), and the long-68/384-storms (c), from 1 September 1996 to 31 December 2023. The red curve shows the smoothed average monthly sunspot number, the black plus signs (+) mark the ICME-driven storms, the purple asterisks (*) mark the Sheath-ICME- driven storms, the blue diamonds (◊) mark the Sheath-driven storms, the green diamonds (◊) mark the Shock-driven storms, and azure forks (×) mark the others-driven storms. The horizontal dotted lines in panels (ac) represent the absolute values of the different thresholds for storms based on their intensity: 50 nT, 100 nT, and 200 nT. And the black dotted lines mark the end dates of the 23rd and 24th solar cycles: 31 December 2008 and 31 December 2019, respectively.
Remotesensing 16 02952 g005
Figure 6. The distribution of 66 strong (blue bars) and 108 moderate (red bars) storms from the cont.-174/384-storms (gray bars) under different IMF B s durations. The gray, blue, and red lines are the corresponding polynomial fitting curves.
Remotesensing 16 02952 g006
Table 1. The number of different types and intensities of geomagnetic storms during the whole 23rd, the entire 24th solar cycle, and the first four years of the 23rd, 24th, and 25th solar cycle.
23rd Solar Cycle
(210 Events)
24th Solar Cycle
(116 Events)
September 1996–August 2000
(71 Events)
January 2009–December 2012
(38 Events)
January 2020–December 2023
(58 Events)
ICMEModerate32 (15.24%)30 (25.86%)15 (21.13%)10 (26.32%)14 (24.14%)
Intense25 (11.90%)8 (6.90%)10 (14.08%)2 (5.26%)1 (1.72%)
Big2 (0.95%)0 (0.00%)2 (2.82%)0 (0.00%)0 (0.00%)
Sheath-ICMEModerate13 (6.19%)7 (6.03%)6 (8.45%)2 (5.26%)2 (3.45%)
Intense16 (7.62%)7 (6.03%)5 (7.04%)5 (13.16%)1 (1.2%)
Big7 (3.32%)1 (0.86%)2 (2.82%)0 (0.00%)1 (1.72%)
SheathModerate5 (2.38%)9 (7.76%)1 (1.41%)5 (13.16%)2 (3.45%)
Intense15 (7.14%)2 (1.72%)3 (4.23%)2 (5.26%)1 (1.72%)
Big3 (1.43%)0 (0.00%)1 (1.41%)0 (0.00%)0 (0.00%)
ShockModerate7 (3.33%)1 (0.86%)4 (5.63%)1 (2.63%)0 (0.00%)
Intense0 (0.00%)2 (1.72%)0 (0.00%)0 (0.00%)0 (0.00%)
Big0 (0.00%)0 (0.00%)0 (0.00%)0 (0.00%)0 (0.00%)
OthersModerate76 (36.19%)48 (41.38%)19 (26.76%)11 (28.95%)35 (60.34%)
Intense9 (4.29%)1 (0.86%)3 (4.23%)0 (0.00%)1 (1.72%)
Big0 (0.00%)0 (0.00%)0 (0.00%)0 (0.00%)0 (0.0%)
Table 2. The Pearson correlation coefficient (CC) values of D s t m i n with the peak values and time-integrals of SWPs (i.e., IMF B z , E y , V s w , P s w , N p and ε ) for the storms ( D s t m i n   −50 nT) during different phases of solar cycles 23–25 are summarized. Here, the asterisk (*) indicates that p-value < 0.05 and the ‘-’ indicates no significant correlation.
D s t m i n   −50 nT IMF   B z m i n E y m a x V s w m a x P s w m a x N p m a x ε m a x I B s I ( E y ) I V s w I P s w I N p I ε
September 1996–December 2023 (384 events)0.773−0.770−0.327−0.542−0.266−0.7510.512−0.677−0.120 *−0.377−0.162−0.827
23rd solar cycle (210 events)0.801−0.788−0.373−0.525−0.244−0.7560.553−0.700−0.334−0.835
24th solar cycle (116 events)0.636−0.614−0.499−0.312−0.6120.397−0.539−0.389−0.269 *−0.735
September 1996–August 2000 (71 events)0.799−0.807−0.403−0.589−0.7710.523−0.677−0.335 *−0.790
January 2009–December 2012 (38 events)0.705−0.698−0.630−0.626
January 2020–December 2023 (58 events)0.701−0.716−0.591−0.8230.662−0.707−0.616−0.484−0.867
Table 3. Similar to Table 2, but only for the all-384-storms, the 58 storms from 2020 to 2023 and the 71 storms during the same phase of the 23rd solar cycle were classified by the storm intensity or/and the interplanetary origins. Here, the asterisk (*) indicates that p-value < 0.05 and the ‘-’ indicates no significant correlation.
IMF   B z m i n E y m a x V s w m a x P s w m a x N p m a x ε m a x I B s I ( E y ) I V s w I P s w I N p I ε
384 storms D s t m i n   −50 nT0.773−0.770−0.327−0.542−0.266−0.7510.512−0.677−0.120 *−0.377−0.162−0.827
Moderate (281)0.312−0.333-−0.205-−0.3130.254−0.287-−0.179 *-−0.402
Strong (103)0.710−0.691−0.420−0.394-−0.6910.357−0.576--−0.051−0.808
ICME-related (204)0.788−0.776−0.485−0.512−0.274−0.7490.470−0.669-−0.378-−0.827
Others (180)0.537−0.498-−0.433−0.275−0.5350.272−0.286-−0.307−0.302−0.532
Moderate-ICME (113)0.276 *−0.386---−0.384-−0.288 *---−0.417
Moderate-Others (168)0.355−0.334-−0.259-−0.285-----−0.315
Strong-ICME (91)0.706−0.686−0.431−0.374-−0.6820.347−0.571---−0.804
Strong-Others (12)---−0.798 *-−0.775 *---−0.749 *--
January 2020–December 2023
(58 storms)
D s t m i n   −50 nT0.701−0.716-−0.591-−0.8230.662−0.707-−0.616−0.484−0.867
Moderate (53)0.482−0.435---−0.539-----−0.465
Strong (5)------------
ICME-related (22)0.668−0.731---−0.8110.764−0.829-−0.624 *-−0.899
Others (36)0.674−0.613-−0.624-−0.8520.474 *--−0.663−0.661−0.784
Moderate-ICME (18)------------
Moderate-Others (35)0.507 *----−0.577------
September 1996–August 2000
(71 storms)
D s t m i n   −50 nT0.799−0.807−0.403−0.589-−0.7710.523−0.677-−0.335 *-−0.790
ICME-related (45)0.792−0.807−0.565−0.537-−0.7640.461−0.649---−0.776
Others (26)0.780−0.802-−0.766-−0.746-----−0.602
Table 4. Similar to Table 2 but for the CC values of D s t m i n with the peak values and time-integrals of SWPs during the cont.-174/384-storms and during the long-68/384-storms. The CC values of the duration ( Δ t ) of IMF B s and the duration ( Δ t ) of the main phase. Here, the asterisk (*) indicates that p-value < 0.05 and the ‘-’ indicates no significant correlation.
IMF   B z m i n E y m a x V s w m a x P s w m a x N p m a x ε m a x I B s I ( E y ) I V s w I P s w I N p I ε Δ t Δ t
174 storms D s t m i n   −50 nT0.836−0.822−0.533−0.665−0.294−0.7880.438−0.617−0.224 *−0.445-−0.8040.639
Moderate (108)0.395−0.393-−0.298 *−0.196 *−0.4020.331−0.419−0.244 *−0.308-−0.5110.618
Strong (66)0.798−0.778−0.532−0.639−0.250 *−0.7700.203 *−0.439-−0.244 *-−0.7530.678
ICME-related (123)0.837−0.821−0.545−0.659−0.284−0.7870.370−0.577-−0.367-−0.7950.652
Others (51)0.687−0.605-−0.408 *-−0.6050.314 *−0.398 *-−0.389 *-−0.6610.447
Moderate-ICME (65)0.35 *−0.421---−0.402-----−0.4390.642
Moderate-Others (43)0.477-----0.524−0.550---−0.6520.455
Strong-ICME (58)0.801−0.776−0.515−0.635-−0.764-−0.411---−0.7450.668
Strong-Others (8)-------------
68 storms D s t m i n   −50 nT0.914−0.922−0.605−0.696-−0.9140.578−0.743-−0.407-−0.8750.362 *
Moderate (36) −0.488 * −0.503 * −0.478 * −0.5980.395 *
Strong (32)0.921−0.929−0.618−0.655-−0.940-−0.616---−0.845-
ICME-related (63)0.917−0.923−0.600−0.697-−0.9150.565−0.734-−0.389 *-−0.8720.342
Others (5)-------------
Moderate-ICME (31)0.493 *−0.545 *---−0.548-----−0.6030.371 *
Moderate-Others (5)-------------
Strong-ICME (32)0.921−0.929−0.618−0.655-−0.940-−0.616---−0.845-
Strong-Others (0)-------------
Table 5. The CCs of D s t m i n with the peak values of the solar wind–magnetosphere coupling functions ε , C f 2 , C f 3 and C f 4 . Here, the asterisk (*) indicates that p-value < 0.05 and the ‘-’ indicates no significant correlation.
ε m a x C f 2 m a x C f 3 m a x C f 4 m a x
384 storms D s t m i n   −50 nT−0.751−0.657−0.646−0.726
Moderate (281)−0.313−0.282−0.303−0.330
Strong (103)−0.691−0.563−0.529−0.632
ICME-related (204)−0.749−0.656−0.637−0.727
Others (180)−0.535−0.418−0.471−0.506
Moderate-ICME (113)−0.384−0.360−0.346−0.388
Moderate-Others (168)−0.285−0.273−0.315−0.329
Strong-ICME (91)−0.682−0.553−0.516−0.624
Strong-Others (12)−0.775 *---
Disclaimer/Publisher’s Note: The statements, opinions and data contained in all publications are solely those of the individual author(s) and contributor(s) and not of MDPI and/or the editor(s). MDPI and/or the editor(s) disclaim responsibility for any injury to people or property resulting from any ideas, methods, instructions or products referred to in the content.

