Article

A Method for Extracting Acoustic Water Surface Waves Based on Phase Compensation

1
National Key Laboratory of Microwave Imaging Technology, Aerospace Information Research Institute, Chinese Academy of Sciences, Beijing 100190, China
2
School of Electronic, Electrical and Communication Engineering, University of Chinese Academy of Sciences, Beijing 100049, China
*
Author to whom correspondence should be addressed.
Remote Sens. 2024, 16(16), 2911; https://doi.org/10.3390/rs16162911
Submission received: 19 June 2024 / Revised: 1 August 2024 / Accepted: 8 August 2024 / Published: 9 August 2024

Abstract

:
With the increasing demand for marine biosensing and water–air collaborative rescue in national production and life, establishing a robust cross-medium communication link has become one of the hotspots. Among them, microwave acoustic cross-medium uplink communication technology has been widely studied for its advantages of being able to be used all day and in all weather, there being no need for relay, and having high concealment. The principle is to extract the frequency of the acoustic water surface waves from the phase history of the radar echoes. However, wave interference can cause discontinuity of the phase history, resulting in difficulty in extracting the acoustic water surface waves and an increase in bit error rate (BER). This article analyses the reasons for the discontinuity of phase history and innovatively proposes a method for extracting acoustic water surface waves based on phase compensation. The discontinuity points of the phase history are compensated based on whether the range bin changes. Then, low-frequency water surface fluctuations and discontinuity points are filtered out through second-order differential joint outlier removal, which can effectively reduce the influence of phase history discontinuity on time–frequency analysis and communication decoding. The effectiveness of the proposed method was verified through simulations and experiments. The experimental results indicate that the BER of the proposed method is 25% of that of the Wavelet–Kalman Filtering method. The proposed method provides a new approach for microwave acoustic cross-medium uplink communication.

Graphical Abstract

1. Introduction

With the development of the marine economy and the proposal of a marine power strategy, people pay more attention to the exploration, development, and utilization of marine resources. In fields such as marine biological sensing [1,2] and water–air cooperative rescue [3,4,5], it is necessary to establish a reliable and robust uplink information transmission path from underwater to air. The microwave acoustic cross-medium uplink communication technology was first proposed by the MIT Laboratory in 2018 [6]. The main principle is that due to the mismatch in acoustic impedance between water and air, the sound wave excites the water surface to produce a micro-amplitude wave, which can be used to transmit information. The radar uses the microwave to detect the water surface, demodulates the frequency information of sound waves through the phase information of the echo, and can realize the information transmission from underwater to air. Microwave acoustic cross-medium uplink communication technology does not require a relay, avoiding the problem of underwater target location exposure. Compared with laser communication methods, the detection range of microwaves is larger and less susceptible to the influence of light, weather, etc. Therefore, it has been widely discussed by many scholars. In 2022, the team led by Fengzhong Qu from Zhejiang University established a misalignment theory model and proposed a MISO system that can improve communication quality through multiple underwater transmitters [7,8,9]. In 2023, Yu Gai et al. from Tianjin University proposed a signal-to-noise ratio (SNR) channel model for evaluating the performance metrics of an uplink communication system for the first time [10]. In 2023, Yuming Zeng et al. from Zhejiang University successfully detected acoustic water surface waves using wavelet transform [11]. But, neither of them considered the influence of waves on uplink communication. In the same year, Hongqiang Wang et al. from the National University of Defense Technology proposed the Wavelet–Kalman Filtering algorithm to filter out water surface interference and radar phase noise and conducted sea experiments for the first time to verify the effectiveness of the proposed algorithm in first-level sea conditions. Through semi-physical simulation experiments, its effectiveness in second-level sea conditions was verified [12]. In 2023, Jianping Luo et al. from the National Key Laboratory of Microwave Imaging Technology proposed a method of Complete Ensemble Empirical Mode Decomposition with Adaptive Noise (CEEMDAN) and wavelet transform based on the mechanism of an acoustic water surface wave [13], which realized effective communication under the laboratory conditions with wave interference, providing a relatively rich theoretical support for microwave acoustic cross-medium uplink communication technology. In 2023, Xiaolei Fu et al. from Nanjing University of Aeronautics and Astronautics discovered the phenomenon of random phase jumps [14] and proposed a method with multi-angle coherent accumulation and phase compensation based on a threshold to suppress random phase jumps. However, this method relies on threshold selection and is not robust enough in engineering applications. To sum up, how to effectively extract acoustic water surface waves from water surface fluctuations is one of the key problems in microwave acoustic cross-medium uplink communication.
When the sea surface fluctuates greatly, the extraction of acoustic water surface waves becomes more difficult. First, the sea surface will span multiple range bins, making it difficult to calculate the phase changes in different range bins uniformly. Second, when the dip angle of the sea surface is large, the reflected echo is beyond the antenna receiving range, causing the interruption of the received signal. Third, the fluctuation of the sea surface results in multiple reflections of radar echoes, resulting in the incorrect selection of the target range bin and destroying the continuity and effectiveness of the phase history. To solve this problem, the authors of reference [12] pointed out that the frequency of sea surface fluctuations is lower than the communication frequency. They proposed the Wavelet–Kalman Filtering Method. Wavelet transform is used to separate the acoustic water surface waves that are mixed in the sea surface fluctuations, and the radar additive phase noise is filtered out through the Kalman filter. By reducing the value of the low-frequency coefficient, the acoustic water surface waves can be reconstructed. However, the wavelet coefficients at a point may be affected by the signal values far away from the point. The Kalman filter cannot effectively eliminate the wavelet denoising results at the discontinuous points, which leads to an increase in the bit error rate (BER) and it being unable to achieve effective communication. In [14], the authors proposed a phase compensation algorithm based on a threshold. The principle is to compensate for discontinuous points where the phase difference is greater than the threshold to suppress random phase jumps. This method depends on the threshold. If the threshold is too large, random phase jumps cannot be compensated for effectively. If the threshold is too small, it is easy to overcompensate and lose the vibration information of acoustic water surface waves, making it difficult to accurately extract acoustic water surface waves. Therefore, it has poor robustness in engineering applications.
Aiming at the problem of traditional methods finding it difficult to accurately extract acoustic water surface waves when the phase is discontinuous, this article innovatively proposes a method for extracting acoustic water surface waves based on phase compensation, which compensates the discontinuity points of the phase history according to the change in range bins. Then, the low-frequency water surface fluctuations and discontinuous points are filtered by second-order differential joint outlier removal. Simulations and experiments verify the effectiveness of the proposed method and its superiority in communication quality.

2. Models

2.1. The Model of an Acoustic Water Surface Wave

Underwater transmitters emit sound waves that are transmitted to the water–air interface. Due to the mismatch of acoustic impedance at the water–air interface, the sound waves can excite the water surface to produce slight vibrations, namely acoustic water surface waves [15]. The mathematical model of acoustic water surface waves is given by Equation (1). The vibration frequency is equal to the frequency of the sound waves [16]. The amplitude of acoustic water surface waves decays exponentially with spatial distribution.
η = 2 p i ω ρ c e α x 2 + y 2 c o s k x 2 + y 2 ω t
Among them, ω is the angular frequency of sound waves, ρ is the water density, and k is the wavenumber. A = 2 p i / ω ρ c is the center amplitude and p i is the sound pressure level (SPL). The sound pressure level is defined as 20 times the logarithmic value of the ratio of the measured sound pressure to the reference sound pressure, and the reference sound pressure is taken as 2 × 10⁻⁵ Pa.
p i = S P L = 20 l o g P P r e f
α is the attenuation coefficient of acoustic water surface waves on the water surface.
α = 4 μ k 2 k g + σ k 3 / ρ ρ g + 3 σ k 2 / ρ
Among them, μ is the viscosity of the water medium, g is the gravitational acceleration, and σ is the surface tension coefficient. According to Equation (1), the amplitude of acoustic water surface waves is inversely proportional to the frequency of the sound source. The higher the frequency, the smaller the amplitude, and the amplitude decreases from the center outwards. Based on the data in Table 1, a three-dimensional model of acoustic water surface waves was simulated, as shown in Figure 1.

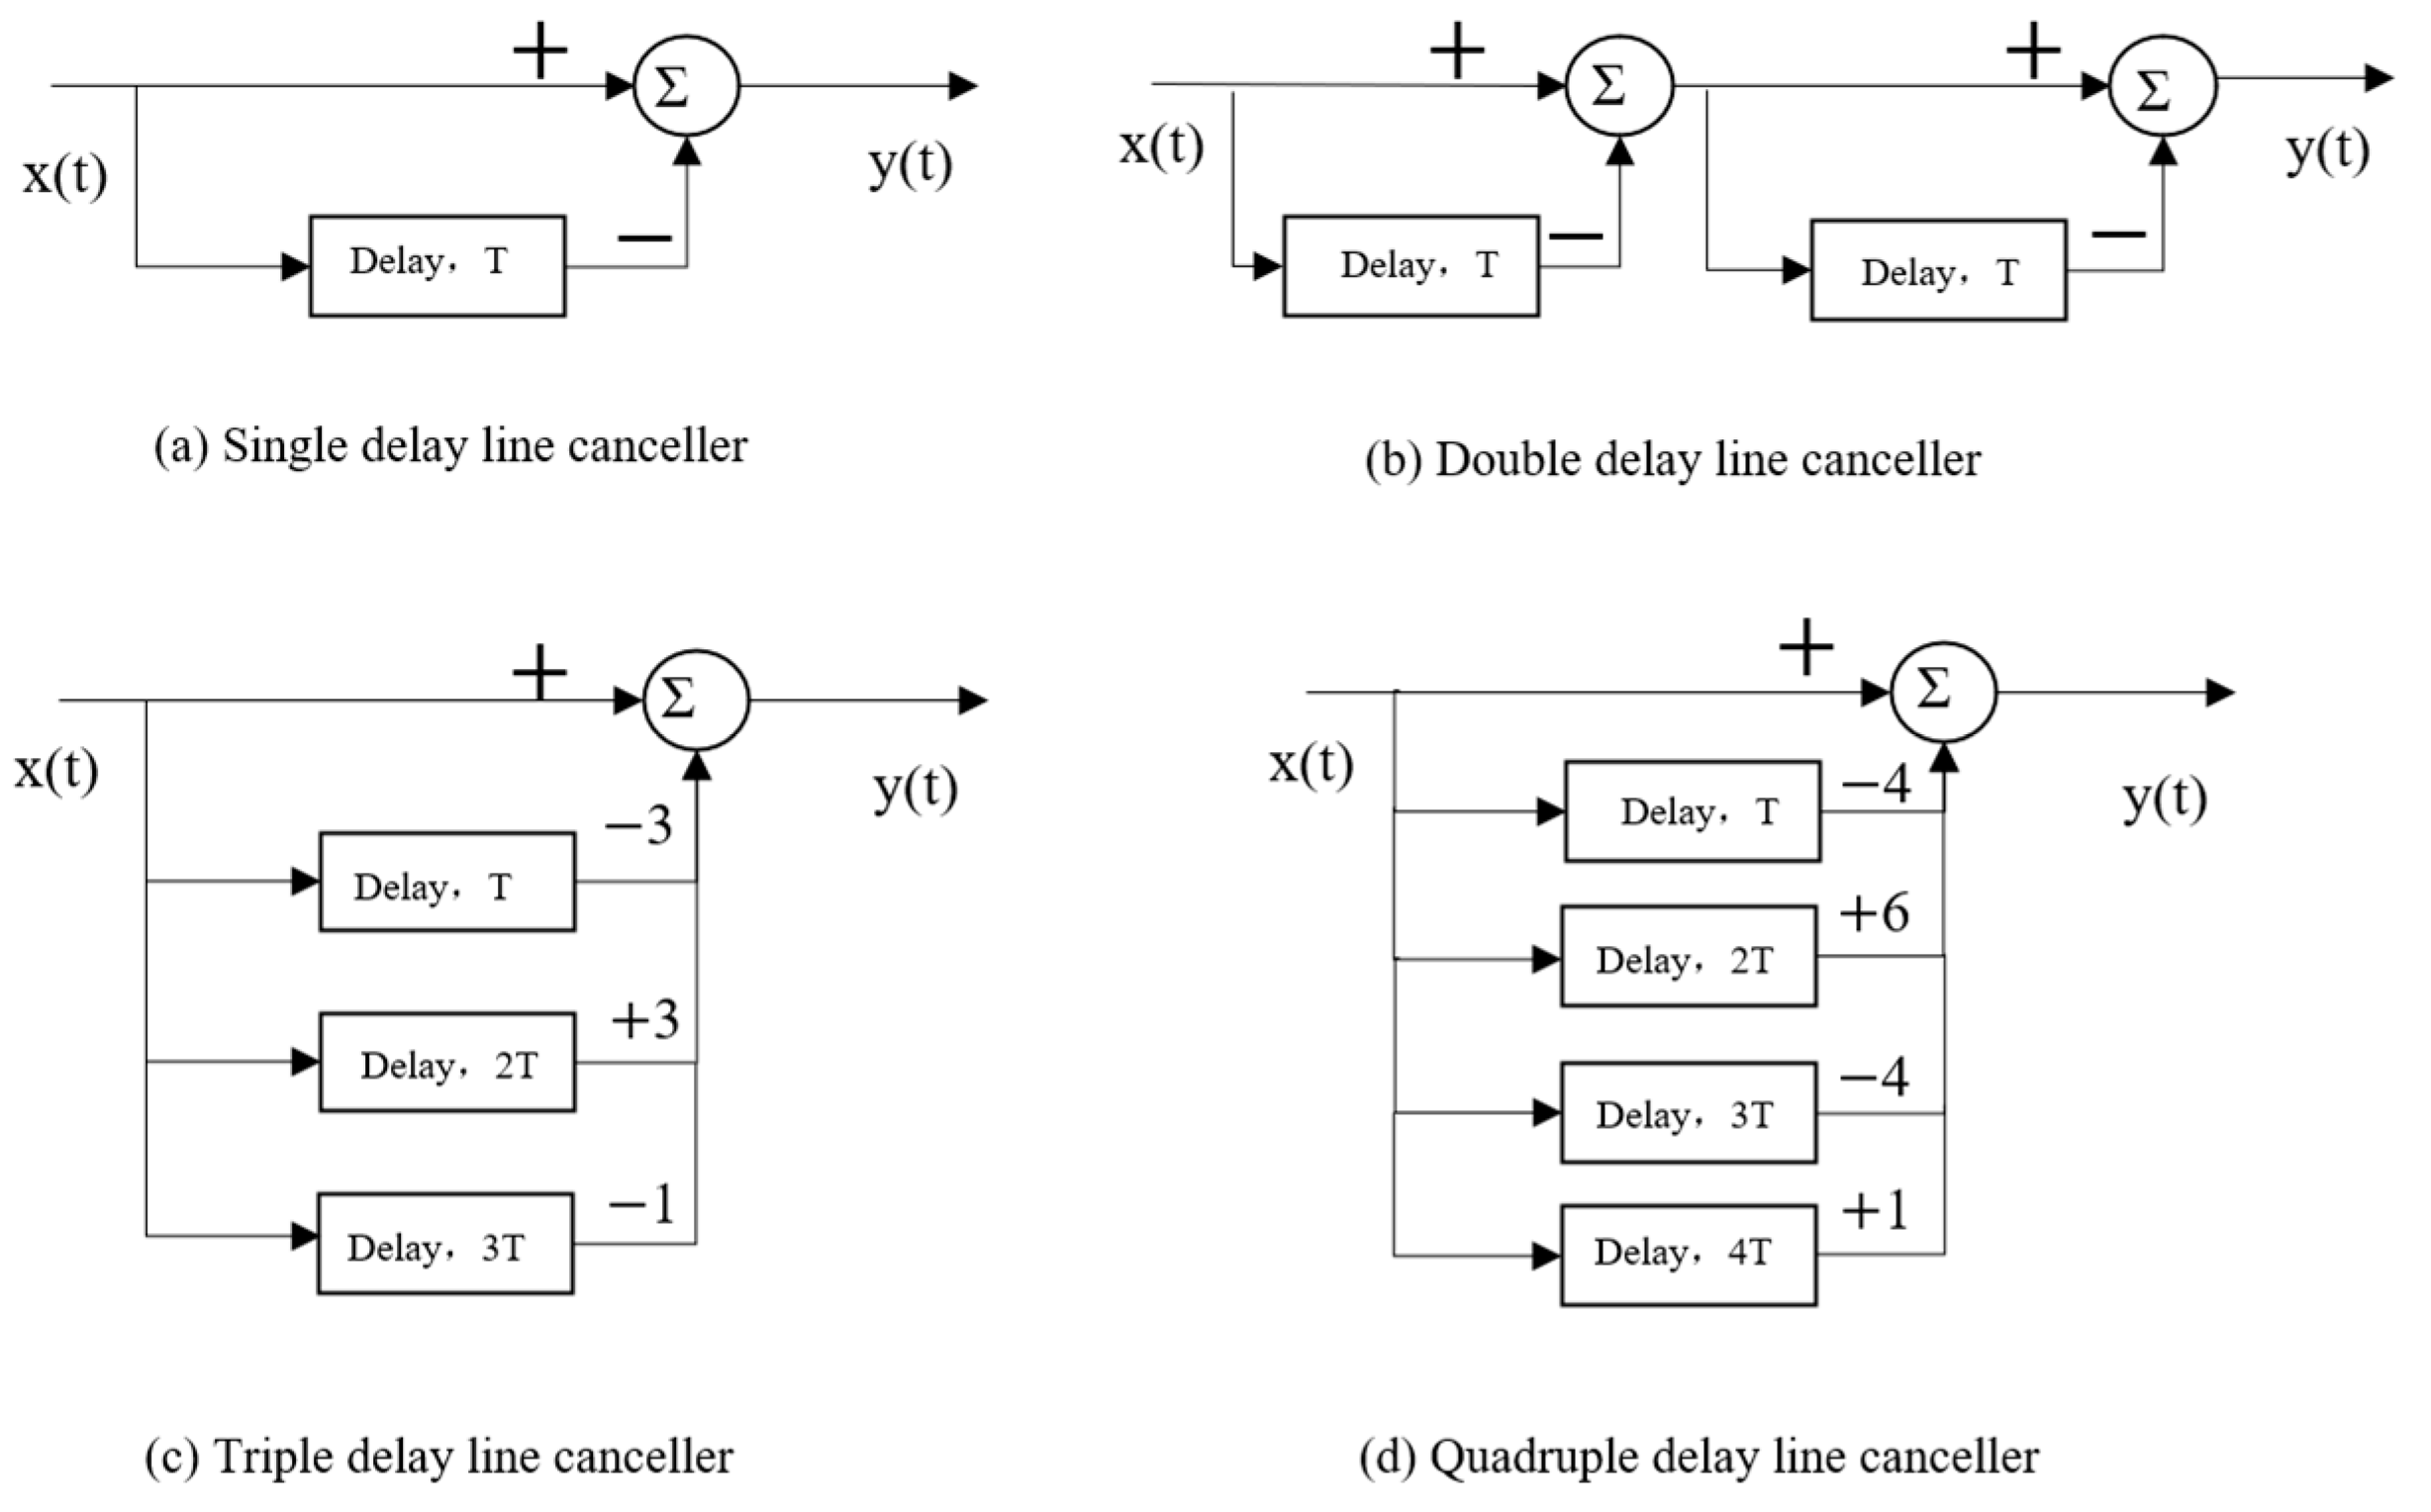
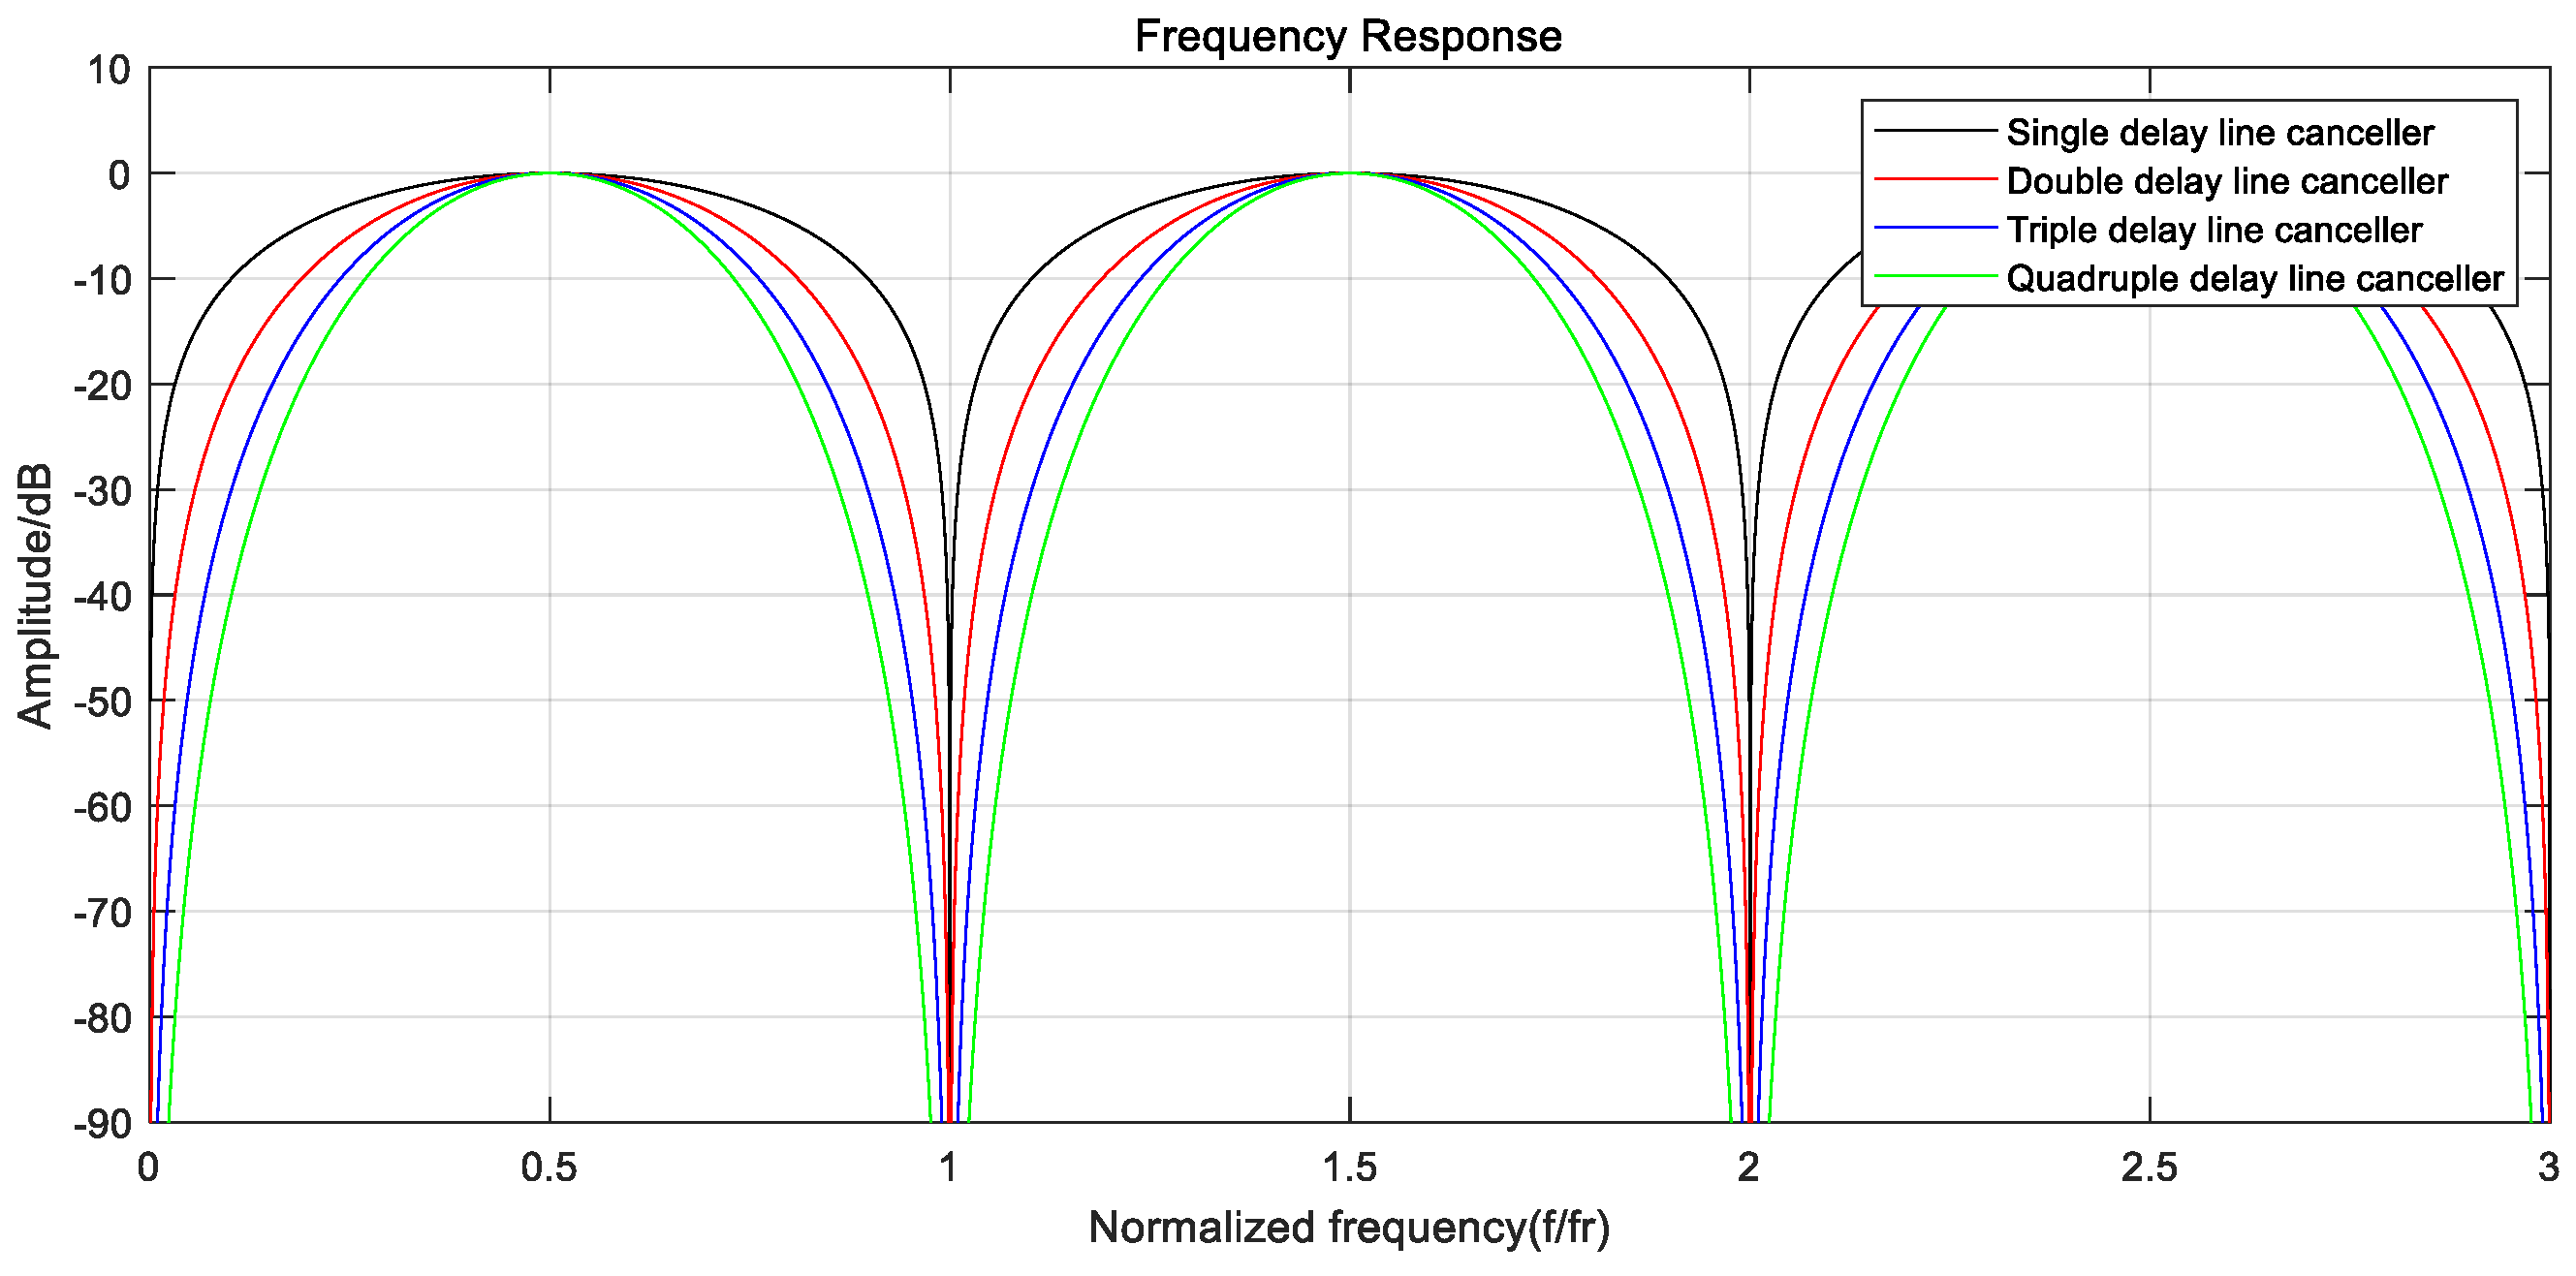
2.2. Phase Discontinuity Model

The frequency-modulated continuous-wave (FMCW) radar emits linear frequency-modulated (LFM) continuous waves and detects the displacement changes in the water surface from the phase difference in the echo, which contains the time–frequency information of underwater acoustic signals. In the experiments, it is assumed that the radar is located directly above the water surface with a height of h and shines vertically on the water surface. The start frequency of the LFM signal is f c . The signal bandwidth is B . The frequency modulation rate is K r . The pulse duration is T p . The pulse repetition period is T . The transmitted signal is represented as follows:
s t x t ^ , η = r e c t t ^ T p exp j 2 π f c t + π K r t ^ 2
Among them, η is the slow time, t ^ is the fast time, and t = t ^ + n T is the full time. Supposing the distance from the point target of water surface to the radar is R t , the radar echo is represented as follows:
s r x t ^ , η = A r e c t t ^ 2 R t / c T p · exp j 2 π f c t 2 R t / c + π K r t ^ 2 R t / c 2
Mixing the received signal with the transmitted signal, the expression for the intermediate frequency signal is as follows:
s I F t ^ , η = s t x t ^ , η · s r x * t ^ , η = A r e c t t ^ 2 R t / c T p · exp j 2 π 2 K r R t c t ^ 2 R t λ + 2 K r R t 2 c 2
The exponential term 2 K r R t 2 c 2 is very small and can be ignored. Performing a Fourier transform on Equation (6) in the fast time domain gives the following:
S I F f , η = A T p s i n c T p f + 2 K r R t c · exp j 4 π R t λ
Among them, the distance from the point target of the water surface to the radar R t includes the distance H from the radar to the initial water surface and the amplitude of acoustic water surface waves y t . The phase of the range bin where the target is located is extracted, that is, f = 2 K r R t c . The phase is given as follows:
ϕ t = 4 π R t λ = 4 π y t λ + 4 π H λ
The water surface vibration caused by underwater sound waves is of the order of micrometers, while the radar wavelength is of the order of millimeters. Therefore, the change in ϕ t does not exceed π and the phase entanglement phenomenon will not occur.
In actual communication scenarios, the sea surface fluctuates randomly, and the significant wave height is related to the sea surface wind speed. It is assumed that the fluctuation of the sea surface, denoted as h t , is linearly superimposed with acoustic water surface waves, denoted as y t . In anticipated application scenarios, drones will operate close to the water surface, resulting in a limited illumination range. Consequently, the fluctuation of the sea surface h t focuses solely on temporal variations, disregarding the spatial variations in the model. Therefore, the phase history can be expressed as follows:
ϕ t = 4 π y t λ + 4 π h t λ + 4 π H λ
When the sea surface fluctuates, the phase change in the target’s range bin may exceed π , π and phase entanglement occurs. At this time, the phase change will be added or subtracted by an integer multiple of 2 π to ensure that the phase is within π , π . To obtain the true sea surface changes, phase unwrapping is required.
When the sea surface fluctuation is greater than the range resolution of the radar, the echo spans multiple range bins. In this case, there may be a jumping phenomenon in the phase history, as shown in Figure 2. Figure 2a shows the range–time graph after dechirp processing. In Figure 2b, the change in the range bin is shown in green, and the phase history before compensation is in black. It can be observed that when the distance increases or decreases, a phase jump occurs, and a phase compensation is necessary. The specific steps for phase compensation will be provided in the third section.
When the sea surface fluctuates greatly, the microwave may be received by the radar-receiving antennas after multiple reflections on the sea surface. In this case, the target’s range bin selected according to the peak point is not the real range where the real water surface is located, and the phases of different range bins cannot be uniformly calculated. As is shown at Point b in Figure 3b, the range bin of targets jumps from the 5th range bin to the 9th range bin, and there is discontinuity in the phase history. The change in range bins may be due to the generation of abnormal waves caused by the reflection of pool walls [17,18]. Moreover, when the sea surface dip angle is large, the echoes may exceed the range of the receiving antenna, resulting in data loss. However, the millimeter wave radar board of the TI company in experiments has the phenomenon of data loss, resulting in phase discontinuity, as shown in Box a in Figure 3a. The black curve and the red curve in Figure 3b show the difference in the phase history before and after phase compensation, respectively. It can be seen that there are still phase discontinuous points where the range bin does not change.
In summary, the factors that cause phase discontinuity can be divided into two categories: (1) the fluctuation of the sea surface causes the change in range bins, resulting in discontinuous phase history; (2) factors such as frame loss, abnormal waves, a large incident angle leading to missed echoes, or multipath effects can cause a phase jump in the phase history. Based on experimental data, two types of additive phase noise, namely Δ ϕ 1 and Δ ϕ 2 , are added to the radar echo Equation (5) to characterize the phase history discontinuity caused by the two types of factors.
s r x t ^ , η = A r e c t t ^ 2 R t c T p · exp j 2 π f c t 2 R t c + π K r t ^ 2 R t c 2 Δ ϕ 1 Δ ϕ 2
Therefore, similar to the derivation process of Equation (8), an expression for discontinuous phase history can be derived:
ϕ t = 4 π y t λ + Δ ϕ 1 + Δ ϕ 2 + 4 π H λ
Equation (11) indicates that the phase of the radar echo contains vibration information of acoustic water surface waves and the phase history is discontinuous, caused by two factors.

3. Method

Radar uses the microwave to detect the sea surface. Then, the phase of the range bin where the peak point is located for each pulse is extracted. According to the analysis in the second section, the extracted phase history may be discontinuous under wave interference. The Wavelet–Kalman Filtering filters out low-frequency sea surface waves through wavelet transform, and then the Kalman Filter filters out the phase noise to extract acoustic water surface waves. Wavelet decomposition convolves signals with a set of wavelet basis functions of different scales to obtain wavelet coefficients of different scales. Therefore, the wavelet coefficients at a point may be affected by the discontinuous values of the signal away from that point. The advantage of a second-order difference over wavelet transform is that the second-order difference operation is only related to the values of adjacent points, and discontinuous points have less influence on other points in the time series. This section introduces the method for extracting acoustic water surface waves based on phase compensation. The phase history is compensated based on whether the range bin changes. Then, the phase jump is amplified into up- and down-oscillation data through a second-order difference. Subsequently, outlier detection and removal can reduce the impact of phase discontinuity on time–frequency analysis and communication bit error rate. The algorithm flowchart is shown in Figure 4.

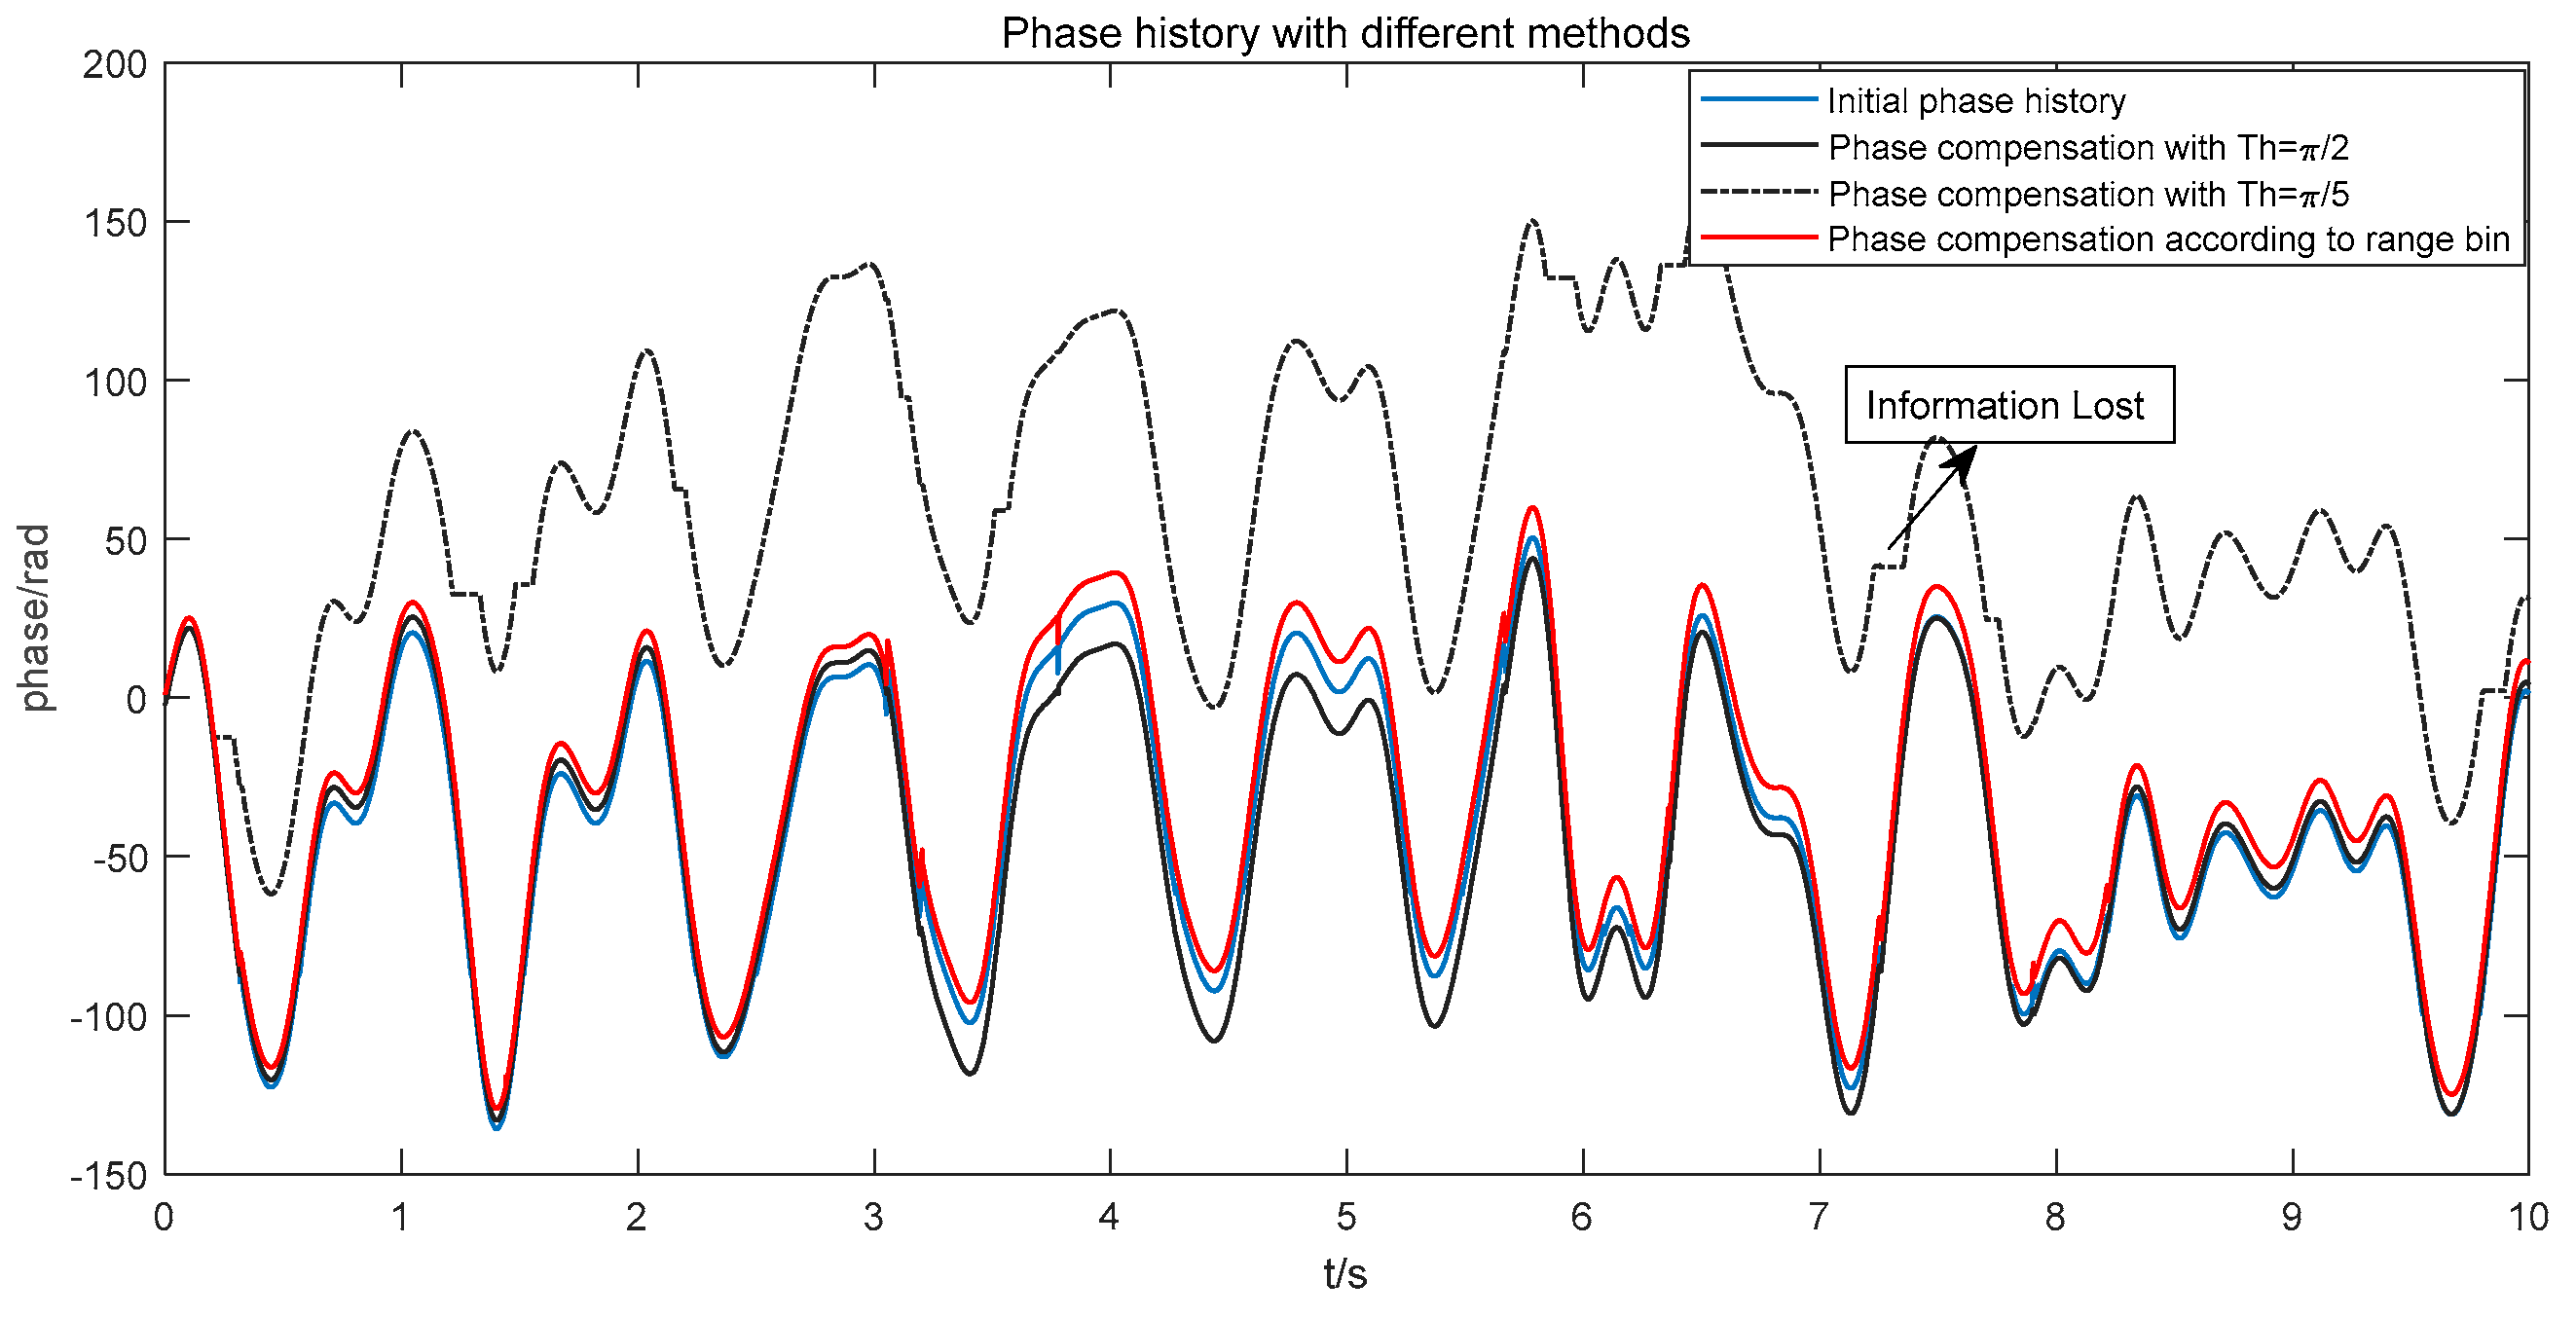
3.1. Phase Compensation

Assuming that the number of sampling points for each pulse is M, and N pulses are collected in the experiment, after pulse compression on radar echoes, a range–time graph is obtained. The range bin of the peak point within each pulse is recorded as I n d n . And, the phase of these range bins is extracted, denoted as φ n . The peak point within pulse n is located at range bin I n d n . And, the peak point within pulse n + 1 is located at range bin I n d n + 1 . If range bins change, that is, I n d n I n d n + 1 , the phase difference between these two pulses is calculated:
Δ φ = φ n + 1 φ n
And, all subsequent phases are compensated:
φ n + 1 : N = φ n + 1 : N Δ φ
Then, phase unwrapping is performed to obtain the phase history φ n . The phase compensation step is used to filter out Δ ϕ 1 in Equation (11).

3.2. Second-Order Differential Joint Outlier Removal

In the fields of vital sign monitoring, fault detection, etc., differential processing is performed on the time series to achieve static clutter filtering [19]. The first-order difference is the simplest moving target indicator (MTI) filter. Its principle is to subtract two adjacent echo signals, namely a single delay line canceller, and its impulse response is as follows:
h ( t ) = δ t δ t T
The frequency response is as follows:
H 1 ω = 1 e j ω T
When the clutter is not stable, the double delay line canceller has a better filtering effect on the clutter. Its impulse response is as follows:
h ( n ) = δ n 2 δ n 1 + δ n 2
Its power gain is the product of the power gains of two single delay cancellers.
H 2 ω 2 = H 1 ω 2 H 1 ω 2 = 16 sin ω T / 2 4
Figure 5 and Figure 6 show the structure and frequency response diagrams of single, double, triple, and quadruple delay cancellers.
In Figure 6, it can be seen that the differential operation filters out the low-frequency components corresponding to clutter, and the double delay line canceller has a wider stopband depression compared to the single-delay line canceller, which has a better effect on clutter filtering. The higher the order of the delay line canceller, the narrower the passband and the wider the stopband, which limits the communication bandwidth. Figure 7 gives the comparation using different delay line cancellers on the phase history. It can be seen that for better communication, at least a double delay line canceller is necessary after phase compensation. In this paper, a double delay line canceller is chosen.
After performing the second-order differential step on the phase history, oscillation points with up and down jumps are separated at discontinuous points. Points that are larger than ten times the temporal mean square deviation are identified as outliers. Removing outliers can reduce the impact of phase discontinuity on the time–frequency analysis and reduce communication bit error rates. Second-order differential joint outlier removal is used to filter out low-frequency sea surface waves and phase discontinuity terms Δ ϕ 2 .

4. Simulation and Experiment

4.1. Simulation

The water surface is detected by a radar. Pulse compression is applied to the radar echoes and extract the phase history. Under the interference of waves, the phase history may be discontinuous. It is difficult to accurately extract acoustic water surface waves, causing an increase in BER. In this section, the parameters and procedures of simulations are introduced, and then the effects of three methods on communication performance are analyzed and discussed. The three methods mentioned above are Wavelet–Kalman Filtering, phase compensation based on a threshold combined High-pass Filtering, and the proposed method.
Firstly, according to the measurement and analysis of the “North Sea Wave Joint Plan”, the Jonswap wave spectrum is used to generate the wave time series [20]. The Jonswap wave spectral density is defined by peak period T p and significant wave height H s . It is expressed as follows:
S ω = α g 2 ω 5 exp 1.25 ω p ω 4 γ exp ω ω p 2 σ ω p 2
Among them, ω p is the angular frequency at the spectral peak. The Phillips constant α and the parameter γ , σ are defined as follows:
α = 5 16 H s 2 ω p 4 g 2 1 0.287 ln γ σ = 0.07 ω < ω p 0.09 ω > ω p γ = 5 T p H s < 3.6 exp 5.75 1.15 T p H s 3.6 T p H s 5 1 T p H s > 5
The wave timing and the acoustic water surface wave are linearly superimposed, and the echoes of the FMCW radar are simulated. Random phase interference is added to the echoes to simulate phase discontinuity caused by the wave interference. The simulation parameters are given in Table 2. The simulation parameters are consistent with the actual experimental parameters. The reason for choosing 100 Hz and 200 Hz is that the noise energy predominantly resides in the low-frequency range from 0 Hz to 45 Hz. To minimize the impact of noise, a carrier frequency of at least 100 Hz is necessary [10]. However, Equation (1) shows that the maximum amplitude of acoustic water surface waves is inversely proportional to the frequency. And, signal-to-noise ratio (SNR) is related to the amplitude of acoustic water surface waves. The larger the amplitude, the higher the SNR of the radar echoes. Therefore, the frequencies of the underwater transmitters are set as 100 Hz and 200 Hz.
If the significant wave height is higher, the change in range bins is greater. If the bandwidth increases, the range resolution decreases. The water surface crosses more range bins accordingly. In these cases, the proposed method is still effective as long as the range bin changes. However, when the significant wave height is extremely high, it is possible that acoustic water surface waves cannot be detected at all because the mathematical model of acoustic water surface waves is incorrect.
If the radar height increases, the signal-to-noise ratio (SNR) of the echo decreases. If the depth of the underwater transmitter increases, the sound pressure level decreases because of the propagation attenuation [9]. The amplitude of acoustic water surface waves decreases, which can be considered as the radar cross section (RCS) of the target reduction. Therefore, if the depth of the underwater transmitter increases, the SNR of the echo also decreases.
Range FFT is performed on the echoes to generate a range–time graph, as shown in Figure 8a. In Figure 8b, the range bins are shown in green, the black curve represents the phase history before phase compensation, and the red curve represents the phase history after phase compensation; In Figure 8c, the black curve represents the phase difference before compensation, and the red curve represents the phase difference after compensation. It can be seen that after compensation, there may still exist phase discontinuity when the range bin remains unchanged.
The initial phase history is illustrated in blue in Figure 9. We applied two methods—phase compensation based on a threshold and phase compensation based on range bins—to the initial phase history, as shown in Figure 9. The black solid and dashed lines represent the phase history after phase compensation with T h = π / 2 and T h = π / 5 . The red line indicates the phase history following phase compensation based on whether the range bin changes. The principle of phase compensation based on a threshold is to identify points with adjacent phase differences greater than a given threshold as discontinuous points and apply phase difference compensation at these points to ensure continuity. It is worth noting that this threshold is manually selected and not fixed [14]. It can be seen that the results of phase compensation based on a threshold are related to the threshold, which has poor robustness in engineering applications. If the threshold is too small, it is easy to overcompensate and lose the vibration information of acoustic water surface waves. The result (red curve in Figure 9) of the range-bin-based phase compensation method is similar to that of the phase compensation method with an appropriate threshold (black solid curve in Figure 9).
The phase compensation step above reduced discontinuous points in the phase history. After phase compensation, acoustic water surface waves are extracted using three methods: Wavelet–Kalman Filtering, phase compensation based on a threshold and High-pass Filtering, and the proposed method. In Figure 10, it can be seen clearly that if discontinuous points are not removed, the extracted acoustic water surface waves will feature numerous spikes, as shown by the blue line. The spikes will lead to an out-of-band energy increase and reduced clarity in time–frequency graphs. In contrast, the curve extracted by the proposed method, shown in red, shows few spikes and is more focused. We calculated the variances of acoustic water surface wave curves, as shown in Table 3. The proposed method has the smallest variance. Figure 10 indicates that the proposed method can effectively reduce the influence of phase discontinuous points on extracting acoustic water surface waves. Meanwhile, it is beneficial for subsequent communication decoding, which will be explained later.
A short-time Fourier transform (STFT) was performed on the extracted acoustic water surface waves, as shown in Figure 11. The frequency amplitudes corresponding to 100 Hz and 200 Hz at the bit center were calculated. When the frequency amplitude at 200 Hz is greater than 100 Hz, it is judged as encoding 1; when the amplitude of the 100 Hz frequency is greater than 200 Hz, it is judged as encoding 0. We transmitted a 2FSK signal with the bit information “01010101010101”. The green box in the time–frequency graph shows the received bit results, while the red box marks the bits that are incorrect. The results show that phase compensation can reduce the number of discontinuous points, which is manifested as a decrease in vertical stripes in the time–frequency plot. The second-order differential joint outlier removal can reduce the spike phenomenon caused by discontinuous points, improve the clarity to obtain clearer time–frequency graphs, and be more conducive to extracting communication coding information and reducing communication bit error rates.
To evaluate the effectiveness of the proposed method under different parameters, the simulations with different significant wave heights are conducted, as shown in Figure 12. When the significant wave height increases to 0.1 m with all other parameters held constant, the target crosses more radar range bins, as shown in Figure 12a. And, Figure 12b illustrates that in the phase history, phase jumps exist at the transitions of range bins. Most importantly, the proposed method is still effective.
It is worth noting that when the wave height on the sea surface is high, the model of micro-amplitude waves excited by sound waves on the water surface (Section 2.1) may no longer be applicable, and more research on sound wave propagation is needed. If the depth of the underwater transmitters increases, the propagation attenuation of sound waves in the medium increases. Under the same emission power, the sound pressure level reaching the water surface will decrease, causing the amplitude of the acoustic water surface waves to decrease. To ensure the reliability of communication, it is possibly advisable to increase the transmission power while increasing the depth of the underwater transmitters.

4.2. Experiment

To verify the effectiveness of the proposed method, we built a microwave acoustic cross-medium uplink communication platform in the laboratory, as shown in Figure 13: (a) is a schematic diagram of the experiment and (b) is the experiment scene.
The underwater transmitter converts the 2FSK signal, which is transmitted into sound waves by the computer. The sound waves excite the water surface to generate acoustic water surface waves, simultaneously using wave makers to simulate natural ocean waves by generating water surface waves. The radar AWR1843 emits microwaves. The echoes are transmitted to the computer through the ADC1000EDM acquisition board. The data are then processed on the MATLAB platform. The experimental parameters are listed in Table 4.
Range FFT is performed to obtain a range–time graph, as shown in Figure 14a. Then, the phase history is extracted. It can be found that sea surface interference causes discontinuity in the phase history. In Figure 14b, the green dot represents the range bin where the water surface is located within a certain pulse. For example, at t = 1.1 s, the water surface is located at the 13th range bin of the radar. The black curve in Figure 14b represents the phase history without phase compensation and the red curve represents the phase history after phase compensation. In Figure 14c, the black curve represents the phase difference without phase compensation, and the red curve represents the phase difference after phase compensation. Experimental data show that phase jump occurs when the range bin changes, and even when the range bin remains unchanged, there is also a phase history discontinuity, which may be caused by factors such as data loss, abnormal waves, and multipath effects.
Figure 15 illustrates the advantages of phase compensation based on range bins compared to thresholds. If the absolute value of the phase difference is greater than a certain threshold, the subsequent phase history will uniformly increase or decrease the phase difference. This is the principle of phase compensation based on a threshold. A limitation of this method is that the threshold is manually selected and not a fixed value. If the threshold is particularly small, some of the original phase history will be reduced to 0, as shown by the black dashed line in Figure 15. The blue line in Figure 15 represents the initial phase history. The red line represents the compensation result based on the range bin’s change. This method can reduce the discontinuous points in the initial phase history.
The blue line in Figure 16 represents the result of Wavelet–Kalman Filtering without phase compensation, the red line represents the result of High-pass Filtering after phase compensation, and the orange line represents the result of the proposed method. Clearly, phase compensation reduces the number of discontinuous points, and second-order differential joint outlier removal reduces the spike phenomenon caused by uncompensated discontinuous points. The acoustic water surface waves using the proposed method is more concentrated and its variance is the smallest, as shown in Table 5. It is conducive to the extraction of coding information in subsequent time–frequency analysis. However, removing outliers can lead to a shorter length of data. If the sea surface situation is complex, it may cause symbol misalignment.
We transmitted a 2FSK signal with the bit information “01010101010101” as shown in the orange boxes in Figure 17. STFT was performed on the extracted acoustic water surface waves using Wavelet–Kalman Filtering, compensation with a threshold and the proposed method as shown in Figure 17. The frequency amplitudes corresponding to 100 Hz and 200 Hz at the bit center were calculated. The green box indicates the received bit results, and the red box marks the incorrect bits. The results show that phase compensation based on whether the range bin changes can reduce the number of discontinuous points, which represents a decrease in vertical stripes in the time–frequency graphs. The second-order differential joint outlier removal can reduce the spike phenomenon caused by discontinuous points. The proposed method can improve the clarity of the time–frequency graphs. It is more conducive to extracting communication coding information and reducing communication bit error rates.
To assess the effects of the proposed method on communication quality, we conducted 20 repeated experiments under laboratory conditions, with each symbol lasting 0.5 s. A total of 580 significant bits of data were collected. The code ‘1’ corresponds to a communication frequency of 200 Hz, the code ‘0’ corresponds to a communication frequency of 100 Hz. The communication coding information corresponding to the time–frequency graphs is extracted, the number of error bits are counted, and the bit error rate of different methods are calculated. In Table 6, three methods mentioned above are compared. They are Wavelet–Kalman Filtering, phase compensation based on a threshold and High-pass Filtering, and the proposed method. From Table 6, it can be seen that the bit error rate of the proposed method is one-fourth of that of the Wavelet–Kalman Filtering method and one-third of that of the phase compensation based on a threshold. The statistical results of multiple repeated experiments indicate that the proposed method can reduce the influences of phase jumps caused by the water fluctuation and decrease the communication BER.

5. Conclusions

This article analyses the possible reasons for the discontinuity of phase history under sea surface fluctuations and innovatively proposes a method for extracting acoustic water surface waves based on phase compensation. This method addresses the challenge of effectively extracting acoustic water surface waves using Wavelet–Kalman Filtering when phase history is disrupted by sea surface interference. The effectiveness of the proposed method is verified through simulation and experiments. The results show that the phase compensation method proposed in this article can effectively reduce the impact of phase discontinuity and obtain clearer time–frequency information of underwater sound sources, which is beneficial for subsequent communication decoding, improving communication quality, and reducing communication bit error rate. Repeated experimental statistics have shown that the communication bit error rate of the proposed method is one-fourth of that of Wavelet–Kalman Filtering methods. The method for extracting acoustic water surface waves based on phase compensation provides more possibilities for the widespread application of microwave acoustic cross-medium uplink communication. In the future, it is still necessary to theoretically study the models of acoustic water surface waves under higher sea states and the influence of ocean turbulence on sound wave propagation.

Author Contributions

Conceptualization, M.L., X.L. and X.B.; methodology, M.L., X.L. and X.B.; software, M.L. and N.J.; validation, M.L., J.X., N.J. and Q.G.; formal analysis, M.L.; investigation, M.L.; resources, M.W., J.W. and X.B.; data curation, M.L., N.J. and X.B.; writing—original draft preparation, M.L.; writing—review and editing, M.L., Y.Z., X.L. and X.B.; visualization, M.L.; project administration, X.L. and X.B.; funding acquisition, X.B. All authors have read and agreed to the published version of the manuscript.

Funding

This research received no external funding.

Data Availability Statement

Data are contained within the article.

Conflicts of Interest

The authors declare no conflicts of interest.

References

  1. Menon, K.A.U.; Shibina, J.S.; Menon, V.N. Intelligent system for remote health monitoring of divers using underwater acoustic communication. In Proceedings of the Fifth International Conference on Computing, Communications and Networking Technologies (ICCCNT), Hefei, China, 11–13 July 2014; pp. 1–7. [Google Scholar] [CrossRef]
  2. Prabha, K.R.; Nataraj, B.; Pandithurai, S.; Raj, A.R.C.; Prassath, A. Deep-Sea Survival Assistance and Health Monitoring System. In Proceedings of the 2023 Third International Conference on Smart Technologies, Communication and Robotics (STCR), Sathyamangalam, India, 9–10 December 2023; pp. 1–5. [Google Scholar] [CrossRef]
  3. Manik, H.M. Underwater acoustic signal processing for detection and quantification of fish. In Proceedings of the 2011 International Conference on Electrical Engineering and Informatics, Bandung, Indonesia, 17–19 July 2011; pp. 1–3. [Google Scholar] [CrossRef]
  4. Thomas, G.L.; Hahn, T.; Thorne, R.E. Combining passive and active underwater acoustics with video and laser optics to assess fish stocks. In Proceedings of the OCEANS 2006, Boston, MA, USA, 18–21 September 2006; pp. 1–4. [Google Scholar] [CrossRef]
  5. Parton, S.; Dalgleish, F.; Beaujean, P.P.; Ouyang, B.; Caimi, F. Acquisition and registration of bathymetric acoustic data and MOFSLI (multiple overlapping field of view serial laser imager). In Proceedings of the 2013 MTS/IEEE OCEANS, Bergen, Norway, 10–14 June 2013; pp. 1–8. [Google Scholar] [CrossRef]
  6. Tonolini, F.; Adlib, F. Networking across Boundaries Enabling Wireless Communication through the Water-Air Interface. In Proceedings of the SIGCOMM 18th, Budapest, Hungary, 20–25 August 2018. [Google Scholar] [CrossRef]
  7. Qian, J.; Qu, F.; Su, J.; Wei, Y.; Cheng, M.; Guo, H.; Zhu, J.; Wang, J. Theoretical Model and Experiments of Focused Phased Array for Cross-Medium Communication in Misaligned Transmitter/Receiver Scenarios. IEEE J. Ocean. Eng. 2023, 48, 1348–1361. [Google Scholar] [CrossRef]
  8. Qian, J.; Lu, X.; Zhang, M.; Qu, F.; Wei, Y. Cross-Medium Communication Combining Acoustic Wave and Millimeter Wave: Anechoic Pool, Lake, Swimming Pool Experiments. In Proceedings of the OCEANS 2023, Limerick, Ireland, 5–8 June 2023; pp. 1–7. [Google Scholar] [CrossRef]
  9. Qu, F.; Qian, J.; Wang, J.; Lu, X.; Zhang, M.; Bai, X.; Ran, Z.; Tu, X.; Liu, Z.; Wei, Y. Cross-Medium Communication Combining Acoustic Wave and Millimeter Wave: Theoretical Channel Model and Experiments. IEEE J. Ocean. Eng. 2022, 47, 483–492. [Google Scholar] [CrossRef]
  10. Gai, Y.; Tan, Q.; Zhang, Y.; Zhao, Z.; Yang, Y.; Liu, Y.; Zhang, R. A corss-medium uplink communication model merging acoustic and millimeter waves. J. Mar. Sci. Eng. 2023, 11, 2102. [Google Scholar] [CrossRef]
  11. Zeng, Y.; Shen, S.; Xu, Z. Water Surface Acoustic Wave Detection by a Millimeter Wave Radar. Remote Sens. 2023, 15, 4022. [Google Scholar] [CrossRef]
  12. Deng, B.; Li, T.; Tang, B.; Yi, J.; Wang, H.; Yang, Q. Detection of acoustic sea surface micro-amplitude waves based on terahertz radar. J. Radar 2023, 12, 817–831. [Google Scholar] [CrossRef]
  13. Luo, J.; Liang, X.; Guo, Q.; Zhang, L.; Bu, X. Combined Improved CEEMDAN and Wavelet Transform Sea Wave Interference Suppression. Remote Sens. 2023, 15, 2007. [Google Scholar] [CrossRef]
  14. Fu, X.; Xia, W.; Dong, S. Radar water surface acoustic wave extraction for cross water and air medium communication. Acoust. Technol. 2023, 42, 452–461. [Google Scholar] [CrossRef]
  15. Zhang, X.; Mao, H.; Li, K.; Tang, W. Amplitude detection of low frequency water surface acoustic wave based on phase demodulation. Infrared Laser Eng. 2019, 48, 0506001. [Google Scholar] [CrossRef]
  16. Dai, Z.; Sun, J.; Sui, P. Theoretical study on one-dimensional model of transverse microwave on water surface. J. Yantai Univ. 2003, 16, 23–28. [Google Scholar] [CrossRef]
  17. Ducrozet, G.; Bonnefoy, F.; Le Touzé, D.; Ferrant, P. A modified High-Order Spectral method for wavemaker modeling in a numerical wave tank. Eur. J. Mech. —B/Fluids 2012, 34, 19–34. [Google Scholar] [CrossRef]
  18. Bonnefoy, F.; Ducrozet, G.; Le Touzé, D.; Ferrant, P. Time domain simulation of nonlinear water waves using spectral methods. In Advances in Numerical Simulation of Nonlinear Water Waves; World Scientific: Singapore, 2010; pp. 129–164. [Google Scholar] [CrossRef]
  19. Singh, A.; Rehman, S.U.; Yongchareon, S.; Chong, P.H.J. Multi-Resident Non-Contact Vital Sign Monitoring Using Radar: A Review. IEEE Sens. J. 2021, 21, 4061–4084. [Google Scholar] [CrossRef]
  20. Hasselmann, K.; Barnett, T.; Bouws, E.; Carlson, H.; Cartwright, D.; Enke, K.; Ewing, J.; Gienapp, H.; Hasselmann, D.; Kruseman, P.; et al. Measurements of wind-wave growth and swell decay during the Joint North Sea Wave Project (JONSWAP). Deut. Hydrogr. Z. 1973, 8, 1–95. [Google Scholar]
Figure 1. Three-dimensional model of acoustic water surface waves.
Remotesensing 16 02911 g001
Figure 2. Phase jumping example I: (a) range–time graph, (b) range bin and the phase history.
Remotesensing 16 02911 g002
Figure 3. Phase jumping example II: (a) range–time graph, (b) range bin and the phase history.
Remotesensing 16 02911 g003
Figure 4. The flowchart of the proposed algorithm.
Remotesensing 16 02911 g004
Figure 5. The structure of delay cancellers.
Remotesensing 16 02911 g005
Figure 6. The frequency response of delay cancellers.
Remotesensing 16 02911 g006
Figure 7. The comparation of different delay line cancellers.
Remotesensing 16 02911 g007
Figure 8. Simulation: (a) range–time graph, (b) range bin and the phase history before/after compensation, (c) the difference in phase history before/after compensation.
Remotesensing 16 02911 g008
Figure 9. Simulations: phase history using different methods.
Remotesensing 16 02911 g009
Figure 10. Simulations: acoustic water surface waves using different methods.
Remotesensing 16 02911 g010
Figure 11. Simulations: STFT results using different methods for extracting acoustic water surface waves: (a) Wavelet–Kalman Filtering; (b) compensation with a threshold; (c) the proposed method.
Remotesensing 16 02911 g011
Figure 12. Results when significant wave height is 0.1 m: (a) range–time graph, (b) range bin and the phase history before/after compensation, (c) acoustic water surface waves using different methods. (d) STFT: Wavelet–Kalman Filtering; (e) STFT: compensation with a threshold; (f) STFT: the proposed method.
Remotesensing 16 02911 g012
Figure 13. (a) Experimental schematic diagram; (b) experimental scene.
Remotesensing 16 02911 g013
Figure 14. Experiment: (a) range–time graph, (b) range bin and the phase history before/after compensation, (c) the difference in phase history before/after compensation.
Remotesensing 16 02911 g014
Figure 15. Experiment: phase history using different methods.
Remotesensing 16 02911 g015
Figure 16. Experiments: acoustic water surface waves using different methods.
Remotesensing 16 02911 g016
Figure 17. Experiments: STFT results using different methods for extracting acoustic water surface waves: (a) Wavelet–Kalman Filtering; (b) compensation with a threshold; (c) the proposed method.
Remotesensing 16 02911 g017
Table 1. Simulation parameters of acoustic water surface waves.
ParametersQuantityValue
p i Sound pressure level170 dB
f Frequency of the underwater source100 Hz
cSound speed in the water 1450 m/s
ρ Water density1000 K g · m 3
g Gravitational acceleration9.8 N · K g 1
σ Surface tension coefficient0.07275 N · m 1
Table 2. Simulation Parameters.
ParametersValue
Start Frequency77 GHz
Bandwidth4 GHz
Samples256
PRF1000 Hz
Sound pressure level170 dB
Significant wave height0.03 m
Spectral peak period1 s
Height of the radar1 m
Depth of the underwater transmitter0.3 m
Frequency of the underwater transmitter100 Hz, 200 Hz
Table 3. Variance of acoustic water surface waves using different methods in the simulation.
MethodsWavelet–Kalman FilteringCompensation with a ThresholdThe Proposed Method
Variance/m28.18 × 10−142.24 × 10−141.55 × 10⁻¹⁶
Table 4. Experimental Parameters.
ParametersValue
Start frequency77 GHz
Bandwidth4 GHz
Samples256
PRF1000 Hz
Sound pressure level170 dB
Significant wave height0.03 m
Spectral peak period1 m
Height of the radar0.5 m
Depth of the underwater transmitter0.3 m
Frequency of the underwater transmitter100 Hz, 200 Hz
Table 5. Variance of acoustic water surface waves using different methods.
MethodsWavelet–Kalman FilteringCompensation with a ThresholdThe Proposed Method
Variance/m21.0310 × 10−111.9238 × 10−121.3156 × 10⁻¹²
Table 6. Bit Error Rate.
MethodNumber of Erroneous BitsBit Error Rate
Wavelet–Kalman Filtering376.5%
Phase compensation based on a threshold and High-pass Filtering305.2%
The Proposed Method101.7%
Disclaimer/Publisher’s Note: The statements, opinions and data contained in all publications are solely those of the individual author(s) and contributor(s) and not of MDPI and/or the editor(s). MDPI and/or the editor(s) disclaim responsibility for any injury to people or property resulting from any ideas, methods, instructions or products referred to in the content.

